Embed Size (px)
Citation preview
RISK ANALYSIS : Shoppers Stop
INDEX• India : Retail Industry Overview 2011 • Shoppers Stop: An Overview• Store Formats• Strategic Alliance • Type Of Retail Outlets• Approach• Vision• International Brands• Loyalty Program• Customer Satisfaction Index• Adverse Financial Analysis• SWOT Analysis• Risk Points raised by the Auditors• Competitor Common Stock Comparison
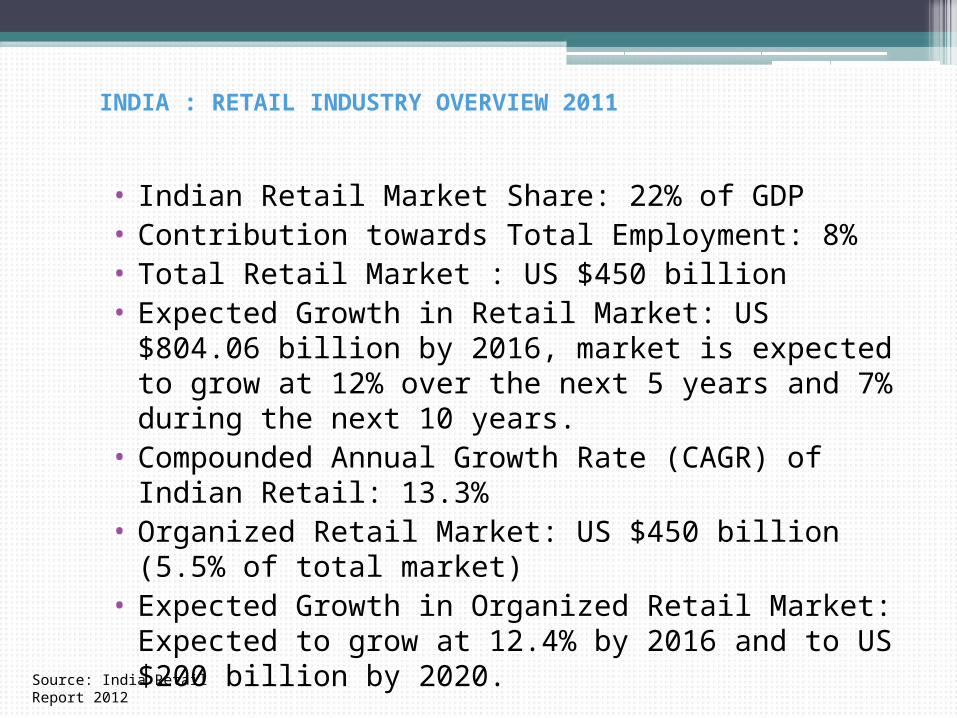
INDIA : RETAIL INDUSTRY OVERVIEW 2011
• Indian Retail Market Share: 22% of GDP• Contribution towards Total Employment: 8%• Total Retail Market : US $450 billion• Expected Growth in Retail Market: US $804.06 billion by 2016,
market is expected to grow at 12% over the next 5 years and 7% during the next 10 years.
• Compounded Annual Growth Rate (CAGR) of Indian Retail: 13.3%
• Organized Retail Market: US $450 billion (5.5% of total market) • Expected Growth in Organized Retail Market: Expected to grow
at 12.4% by 2016 and to US $200 billion by 2020.
Source: India Retail Report 2012
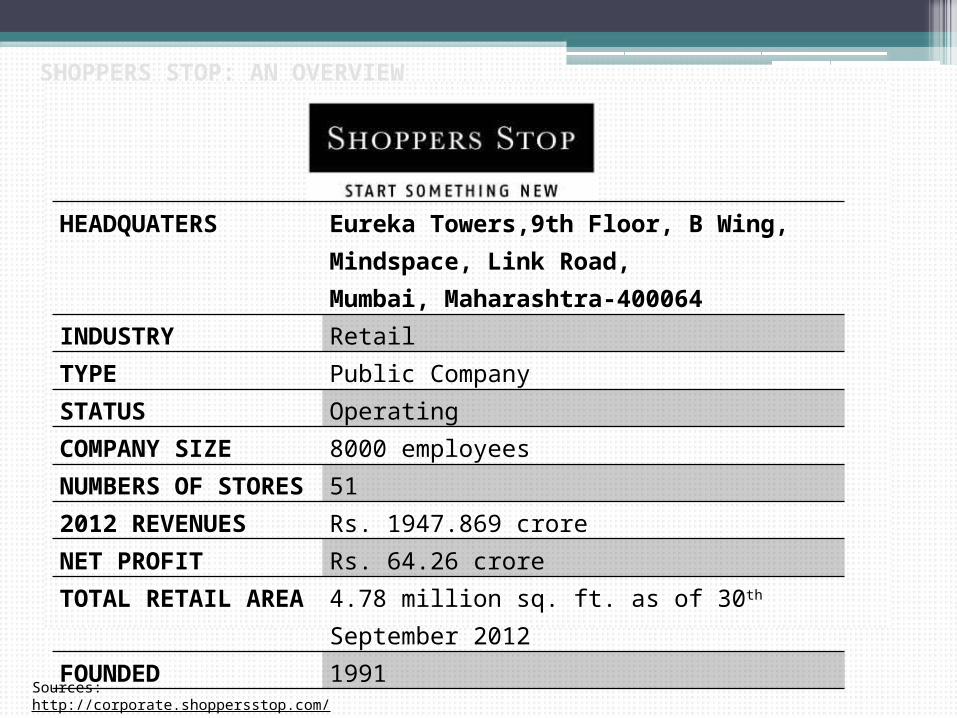
SHOPPERS STOP: AN OVERVIEW
HEADQUATERS Eureka Towers,9th Floor, B Wing, Mindspace, Link Road,Mumbai, Maharashtra-400064
INDUSTRY RetailTYPE Public CompanySTATUS OperatingCOMPANY SIZE 8000 employeesNUMBERS OF STORES 512012 REVENUES Rs. 1947.869 crore NET PROFIT Rs. 64.26 crore
TOTAL RETAIL AREA
4.78 million sq. ft. as of 30th September 2012
FOUNDED 1991
Sources: http://corporate.shoppersstop.com/
SHOPPERS STOP: AN OVERVIEW
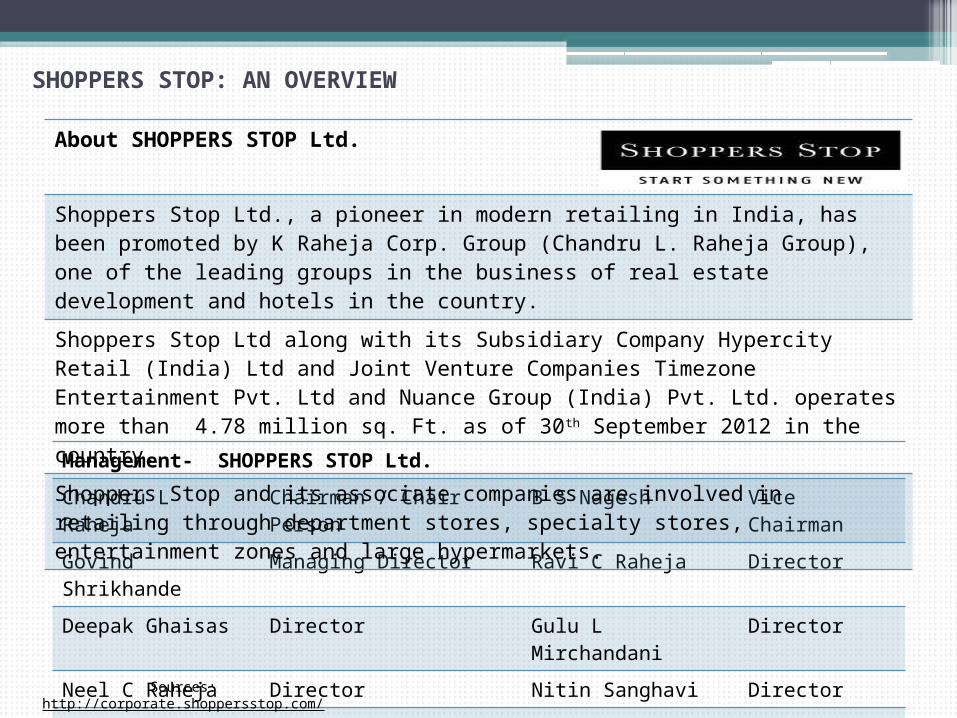
Management- SHOPPERS STOP Ltd.
Chandru L Raheja Chairman / Chair Person B S Nagesh Vice Chairman
Govind Shrikhande Managing Director Ravi C Raheja Director
Deepak Ghaisas Director Gulu L Mirchandani Director
Neel C Raheja Director Nitin Sanghavi Director
Shahzaad S Dalal Director Nirvik Singh Director
About SHOPPERS STOP Ltd.
Shoppers Stop Ltd., a pioneer in modern retailing in India, has been promoted by K Raheja Corp. Group (Chandru L. Raheja Group), one of the leading groups in the business of real estate development and hotels in the country. Shoppers Stop Ltd along with its Subsidiary Company Hypercity Retail (India) Ltd and Joint Venture Companies Timezone Entertainment Pvt. Ltd and Nuance Group (India) Pvt. Ltd. operates more than 4.78 million sq. Ft. as of 30th September 2012 in the country.Shoppers Stop and its associate companies are involved in retailing through department stores, specialty stores, entertainment zones and large hypermarkets.
Sources: http://corporate.shoppersstop.com/
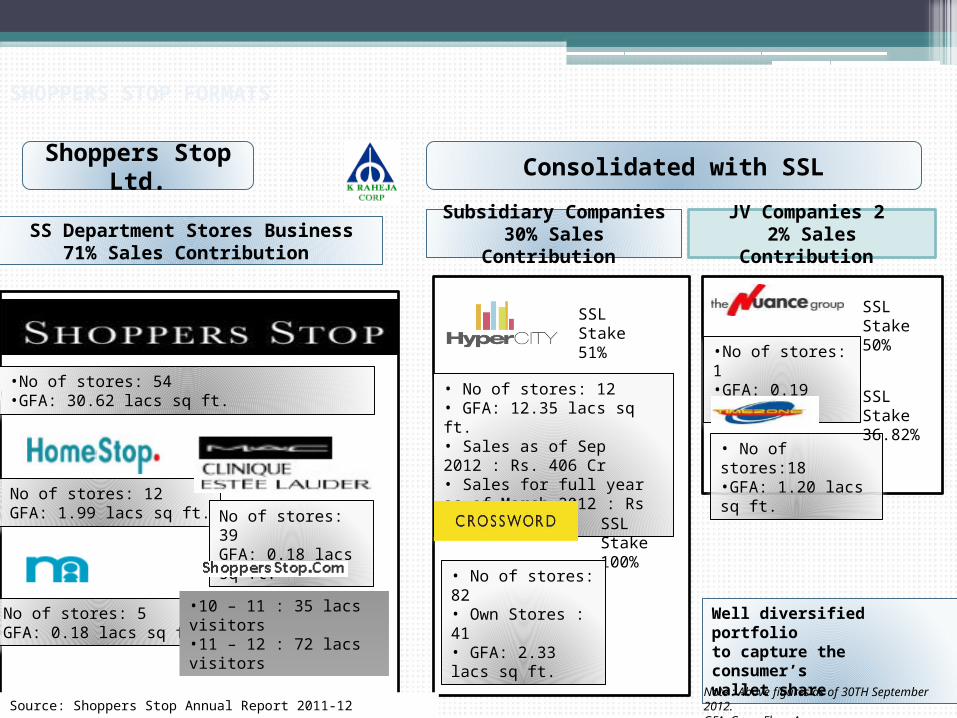
SHOPPERS STOP FORMATS
Shoppers Stop Ltd. Consolidated with SSL
SS Department Stores Business71% Sales Contribution
•No of stores: 54•GFA: 30.62 lacs sq ft.
• No of stores: 12 • GFA: 1.99 lacs sq ft. No of stores: 39
GFA: 0.18 lacs sq ft.
•No of stores: 5•GFA: 0.18 lacs sq ft.
•10 – 11 : 35 lacs visitors •11 – 12 : 72 lacs visitors
Subsidiary Companies 30% Sales Contribution
JV Companies 2 2% Sales Contribution
SSL Stake51%
• No of stores: 12 • GFA: 12.35 lacs sq ft. • Sales as of Sep 2012 : Rs. 406 Cr • Sales for full year as of March 2012 : Rs 761 Cr
SSL Stake100%
• No of stores: 82• Own Stores : 41 • GFA: 2.33 lacs sq ft.
•No of stores: 1 •GFA: 0.19 lacs sq ft
• No of stores:18•GFA: 1.20 lacs sq ft.
SSL Stake50%
SSL Stake36.82%
Well diversified portfolio to capture the consumer’s wallet share
Note : Above figures as of 30TH September 2012. GFA: Gross Floor AreaSource: Shoppers Stop Annual Report 2011-12
STRATEGIC ALLIANCE• Shopper's Stop Ltd. has entered into a non exclusive retail agreement with
world-renowned cosmetics major Estee Lauder to open M.A.0 Cosmetics stores in India.
• Shopper's Stop Ltd. has a 51% stake in Hypercity Retail (India) Ltd. • Mothercare PLC of UK, the largest specialist retailer for infant and toddler
care, is now in India. • Shopper's Stop Ltd.'s entry into airport retailing is marked by a joint
venture with The Nuance Group AG of Switzerland, the world's leading airport retailer.
• Shopper's Slop Ltd has forayed into the Entertainment sector by acquiring a 36.82% stake in Timezone Entertainment Private Limited which is in the business of setting up & operating Family Entertainment Centres (FECs).
Source: Shoppers Stop Annual Report 2011-12
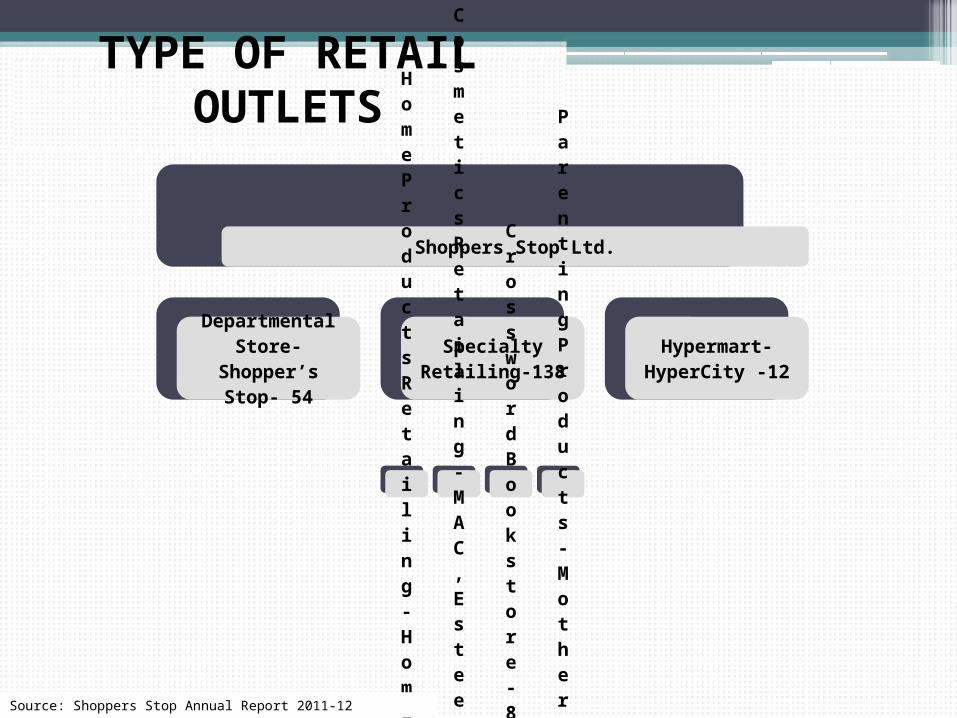
TYPE OF RETAIL OUTLETS
Shoppers Stop Ltd.
Departmental Store-
Shopper’s Stop- 54Specialty Retailing-
138
Home Products Retailing- HomeStop- 12
Beauty, Cosmetics Retailing- MAC,
Estee Lauder Clinique- 39
Crossword
Book store- 82
Parenting Products- Mothercare- 5
Hypermart- HyperCity -12
Source: Shoppers Stop Annual Report 2011-12
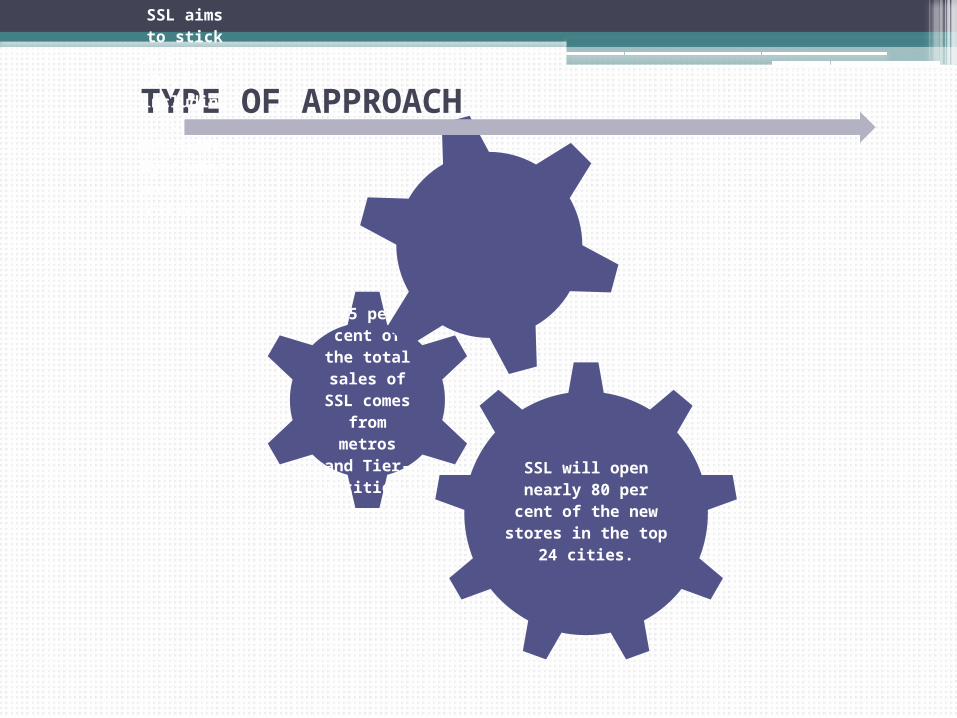
TYPE OF APPROACH
SSL will open nearly 80 per cent of the new stores in the top 24
cities.
75 per cent of the total sales of SSL comes from metros and Tier-1 cities.
SSL aims to stick to the top
10 cities including Pune,
Bangalore, Hyderabad and metro cities.
VISION
To be a Global Retailer in India and Maintain No.1 position in the Indian Market in the Department Store Category.
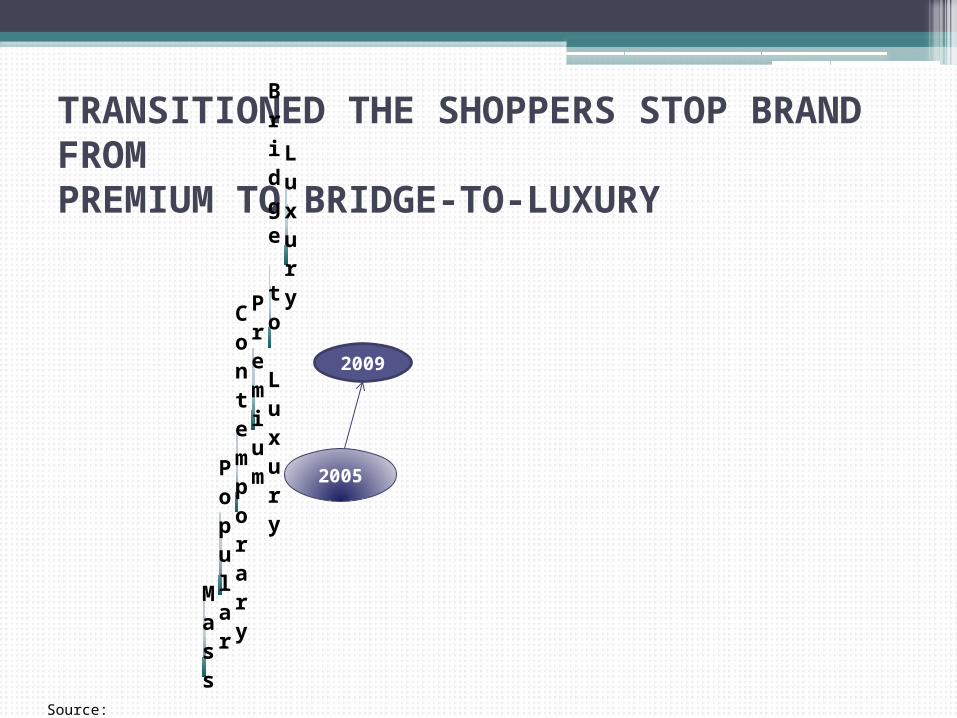
TRANSITIONED THE SHOPPERS STOP BRAND FROM PREMIUM TO BRIDGE-TO-LUXURYL
uxury
Bridge to Luxury
Premium
Contemporary
Popular
Mass
2005
2009
Source: http://corporate.shoppersstop.com/investors/presentation-analyst.aspx
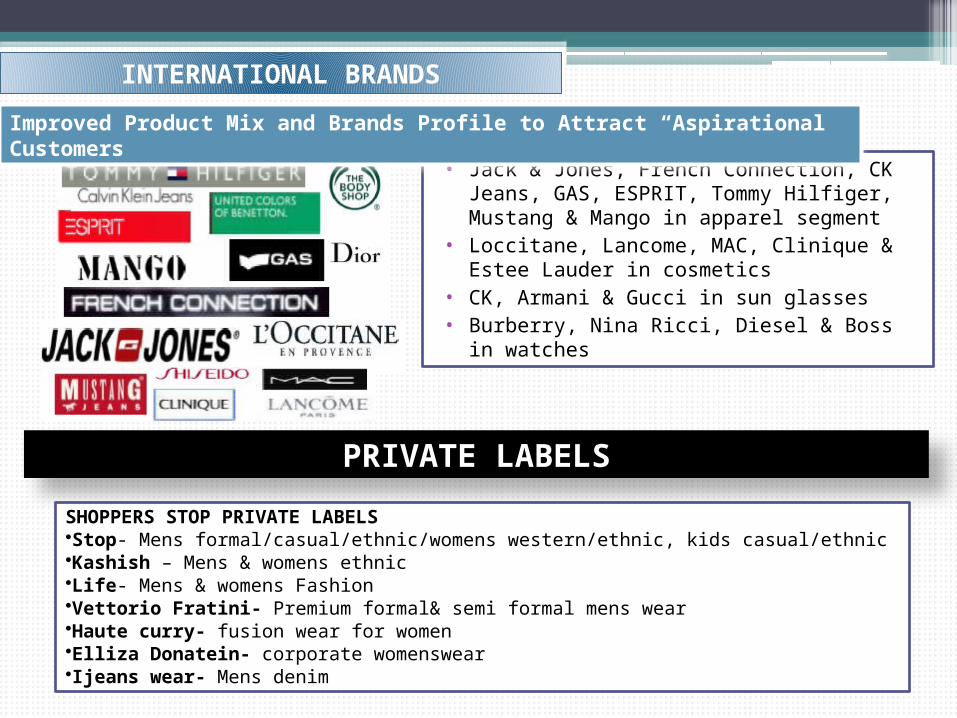
• Jack & Jones, French Connection, CK Jeans, GAS, ESPRIT, Tommy Hilfiger, Mustang & Mango in apparel segment
• Loccitane, Lancome, MAC, Clinique & Estee Lauder in cosmetics
• CK, Armani & Gucci in sun glasses • Burberry, Nina Ricci, Diesel & Boss in
watches
Improved Product Mix and Brands Profile to Attract “Aspirational” Customers
INTERNATIONAL BRANDS
PRIVATE LABELS
SHOPPERS STOP PRIVATE LABELS•Stop- Mens formal/casual/ethnic/womens western/ethnic, kids casual/ethnic•Kashish – Mens & womens ethnic•Life- Mens & womens Fashion•Vettorio Fratini- Premium formal& semi formal mens wear•Haute curry- fusion wear for women•Elliza Donatein- corporate womenswear•Ijeans wear- Mens denim
LOYALTY PROGRAM
• The First CitizenShoppers’ Stop’s customer loyalty program is called The First Citizen. The program offers its members an opportunity to collect points and avail of innumerable special benefits. Currently, Shoppers’ Stop has a database of over 25.03 lakh members who contribute to nearly 72% of the total sales of Shoppers’ Stop.
Source: Shoppers Stop Annual Report 2011-12
CUSTOMER SATISFICATION INDEX (CSI)
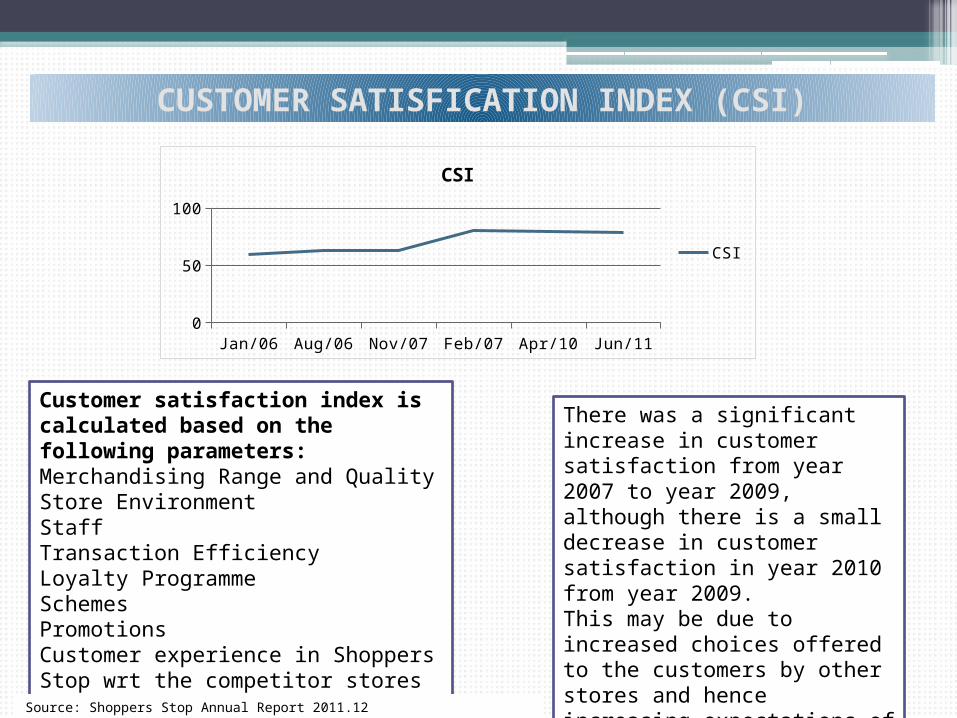
Customer satisfaction index is calculated based on the following parameters:Merchandising Range and QualityStore EnvironmentStaffTransaction EfficiencyLoyalty ProgrammeSchemesPromotionsCustomer experience in Shoppers Stop wrt the competitor stores
There was a significant increase in customer satisfaction from year 2007 to year 2009, although there is a small decrease in customer satisfaction in year 2010 from year 2009. This may be due to increased choices offered to the customers by other stores and hence increasing expectations of the customer
Source: Shoppers Stop Annual Report 2011.12
Jan/06
May/0
6
Sep/0
6
Jan/07
May/0
7
Sep/0
7
Jan/08
May/0
8
Sep/0
8
Jan/09
May/0
9
Sep/0
9
Jan/10
May/1
0
Sep/1
0
Jan/11
May/1
10
20406080
100
CSI
CSI
ADVERSE FINANCIAL ANALYSISPARAMETERS USE ADVERSITIES
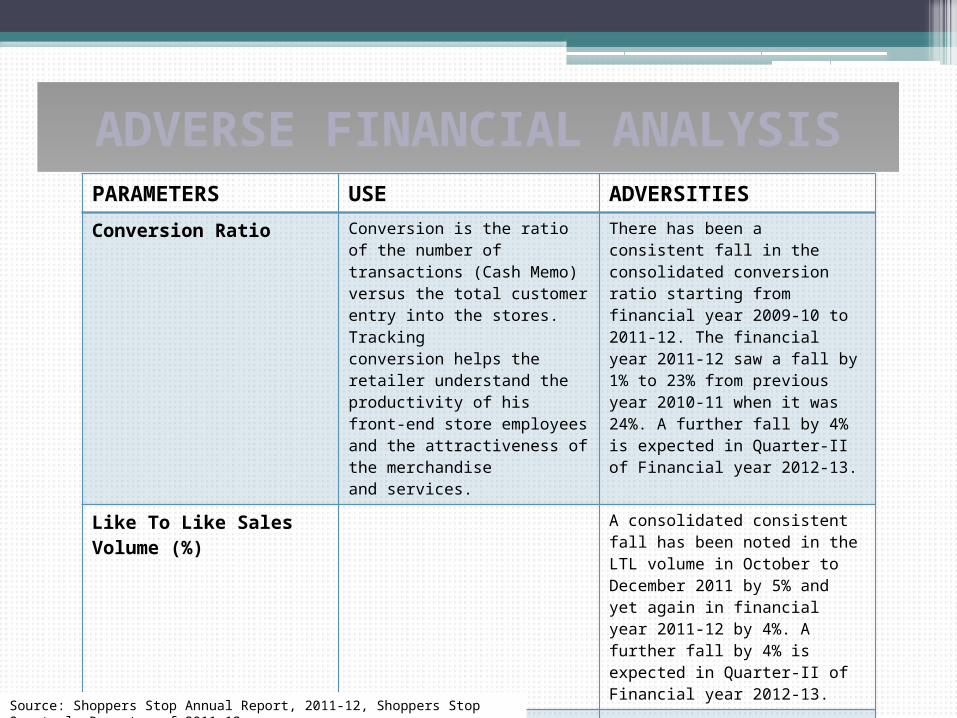
Conversion Ratio Conversion is the ratio of the number of transactions (Cash Memo) versus the total customer entry into the stores. Trackingconversion helps the retailer understand the productivity of his front-end store employees and the attractiveness of the merchandiseand services.
There has been a consistent fall in the consolidated conversion ratio starting from financial year 2009-10 to 2011-12. The financial year 2011-12 saw a fall by 1% to 23% from previous year 2010-11 when it was 24%. A further fall by 4% is expected in Quarter-II of Financial year 2012-13.
Like To Like Sales Volume (%) A consolidated consistent fall has been noted in the LTL volume in October to December 2011 by 5% and yet again in financial year 2011-12 by 4%. A further fall by 4% is expected in Quarter-II of Financial year 2012-13.
Private Level Sales (%) Company aims to provide a differentiated and unique offering to the customer through its own private labels as well as throughexclusive private brands.
Although there has been a growth in Consolidated Private Label Mix up to 6.4% during financial year 2011-12 but Consolidated Private Label Sales Growth has fallen by 2.4% during the same period. A further fall by 13% is expected in Quarter-II of Financial year 2012-13.
Source: Shoppers Stop Annual Report, 2011-12, Shoppers Stop Quarterly Report s of 2011-12
ADVERSE FINANCIAL ANALYSIS
PARAMETERS DEFINATION AND ITS USE ADVERSITIES
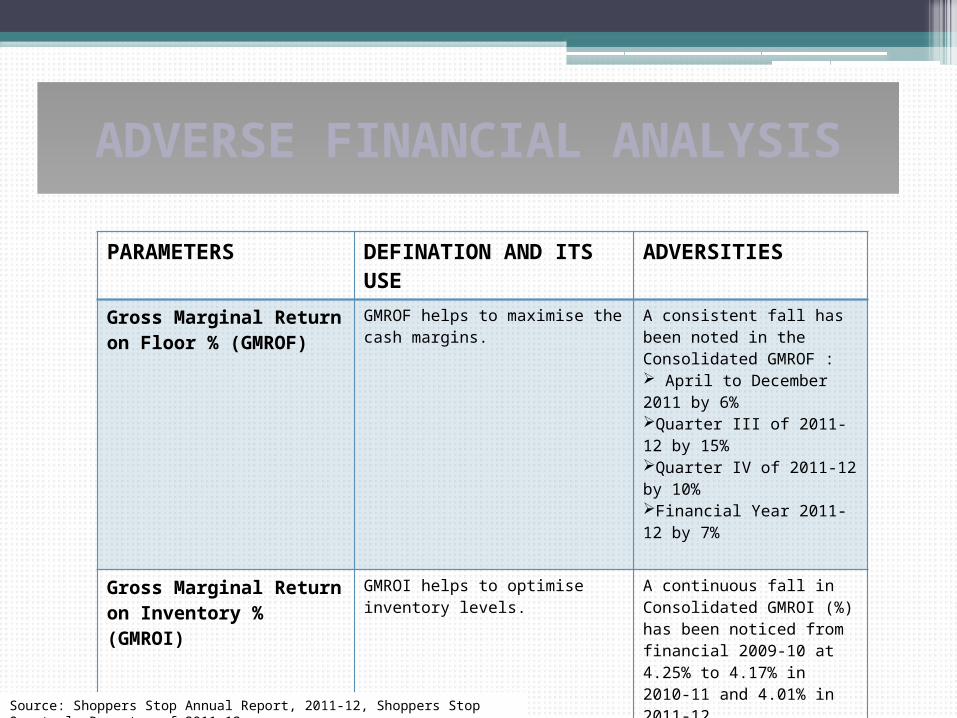
Gross Marginal Return on Floor % (GMROF)
GMROF helps to maximise the cash margins.
A consistent fall has been noted in the Consolidated GMROF : April to December 2011 by 6%Quarter III of 2011-12 by 15%Quarter IV of 2011-12 by 10%Financial Year 2011-12 by 7%
Gross Marginal Return on Inventory % (GMROI)
GMROI helps to optimise inventory levels.
A continuous fall in Consolidated GMROI (%) has been noticed from financial 2009-10 at 4.25% to 4.17% in 2010-11 and 4.01% in 2011-12.
Gross Marginal Return on Labour % (GMROL)
GMROL helps to increase labourproductivity.
A consistent fall has been noted in the Consolidated GMROF : April to December 2011 by 2%Quarter III of 2011-12 by 15%Quarter IV of 2011-12 by 6%Financial Year 2011-12 by 6%
Source: Shoppers Stop Annual Report, 2011-12, Shoppers Stop Quarterly Report s of 2011-12
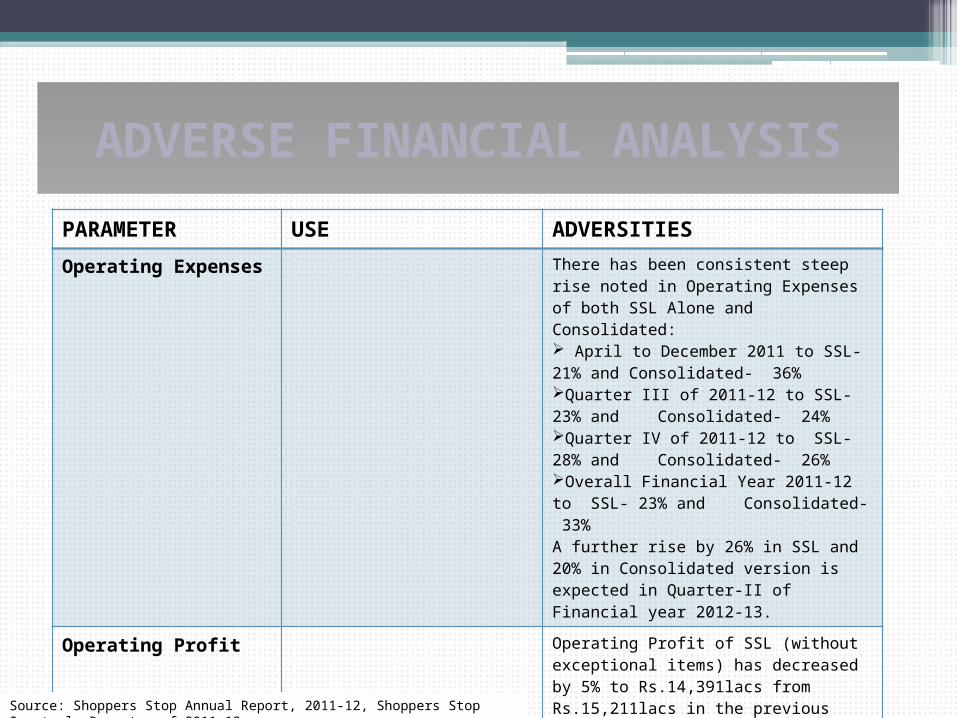
ADVERSE FINANCIAL ANALYSISPARAMETER USE ADVERSITIES
Operating Expenses There has been consistent steep rise noted in Operating Expenses of both SSL Alone and Consolidated: April to December 2011 to SSL- 21% and Consolidated- 36%Quarter III of 2011-12 to SSL- 23% and Consolidated- 24%Quarter IV of 2011-12 to SSL- 28% and Consolidated- 26%Overall Financial Year 2011-12 to SSL- 23% and Consolidated- 33%A further rise by 26% in SSL and 20% in Consolidated version is expected in Quarter-II of Financial year 2012-13.
Operating Profit Operating Profit of SSL (without exceptional items) has decreased by 5% to Rs.14,391lacs from Rs.15,211lacs in the previous year whereas Consolidated have fallen by 18% in 2011-12 from its previous years. A further fall by 27% in SSL and 37% in Consolidated version is expected in Quarter-II of Financial year 2012-13.
Source: Shoppers Stop Annual Report, 2011-12, Shoppers Stop Quarterly Report s of 2011-12
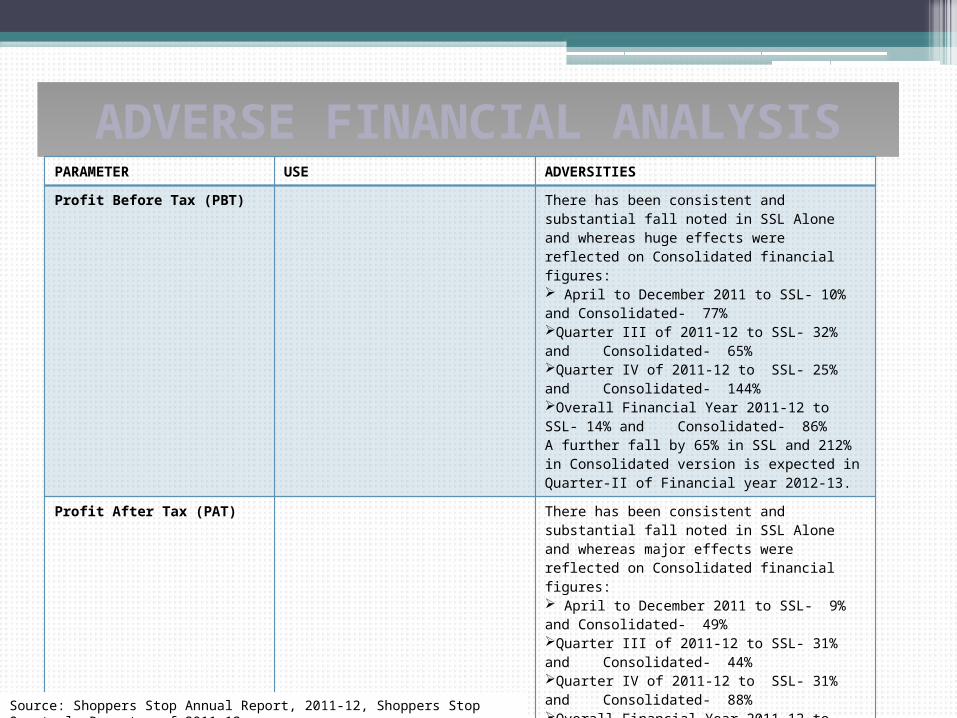
ADVERSE FINANCIAL ANALYSISPARAMETER USE ADVERSITIES
Profit Before Tax (PBT) There has been consistent and substantial fall noted in SSL Alone and whereas huge effects were reflected on Consolidated financial figures: April to December 2011 to SSL- 10% and Consolidated- 77%Quarter III of 2011-12 to SSL- 32% and Consolidated- 65%Quarter IV of 2011-12 to SSL- 25% and Consolidated- 144%Overall Financial Year 2011-12 to SSL- 14% and Consolidated- 86%A further fall by 65% in SSL and 212% in Consolidated version is expected in Quarter-II of Financial year 2012-13.
Profit After Tax (PAT) There has been consistent and substantial fall noted in SSL Alone and whereas major effects were reflected on Consolidated financial figures: April to December 2011 to SSL- 9% and Consolidated- 49%Quarter III of 2011-12 to SSL- 31% and Consolidated- 44%Quarter IV of 2011-12 to SSL- 31% and Consolidated- 88%Overall Financial Year 2011-12 to SSL- 15% and Consolidated- 56%A further fall by 67% in SSL and 155% in Consolidated version is expected in Quarter-II of Financial year 2012-13.
Source: Shoppers Stop Annual Report, 2011-12, Shoppers Stop Quarterly Report s of 2011-12
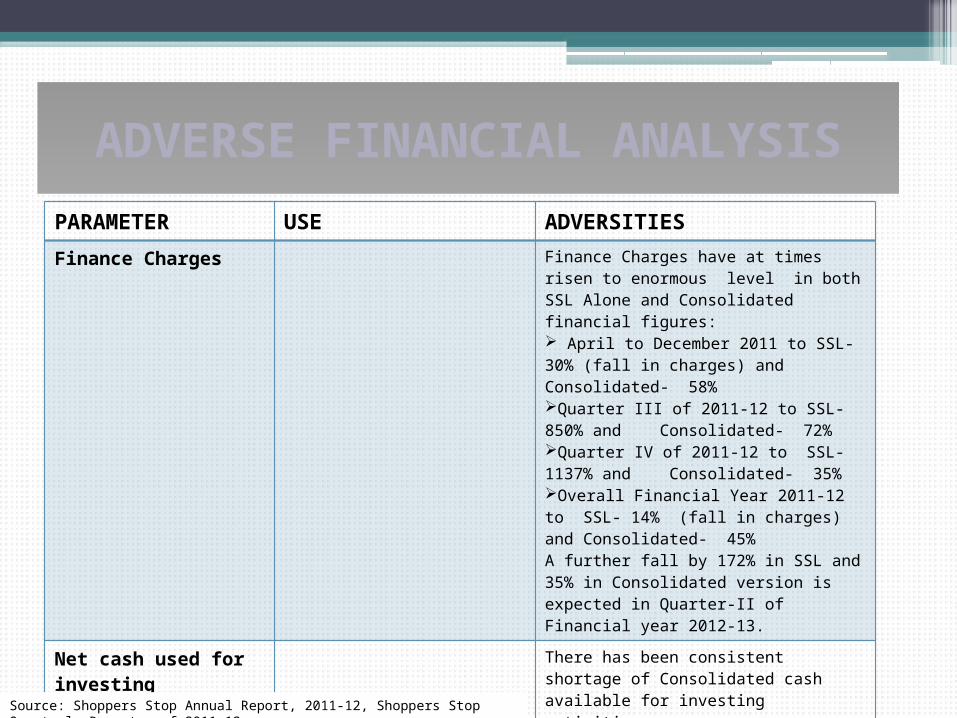
ADVERSE FINANCIAL ANALYSISPARAMETER USE ADVERSITIESFinance Charges Finance Charges have at times risen to
enormous level in both SSL Alone and Consolidated financial figures: April to December 2011 to SSL- 30% (fall in charges) and Consolidated- 58%Quarter III of 2011-12 to SSL- 850% and Consolidated- 72%Quarter IV of 2011-12 to SSL- 1137% and Consolidated- 35%Overall Financial Year 2011-12 to SSL- 14% (fall in charges) and Consolidated- 45%A further fall by 172% in SSL and 35% in Consolidated version is expected in Quarter-II of Financial year 2012-13.
Net cash used for investing activities
There has been consistent shortage of Consolidated cash available for investing activities: April to December 2011 – Rs.16,0 66Overall Financial Year 2011-12 – Rs.16, 584A further fall by Rs.5, 858 is expected during April to September 2012.
Source: Shoppers Stop Annual Report, 2011-12, Shoppers Stop Quarterly Report s of 2011-12
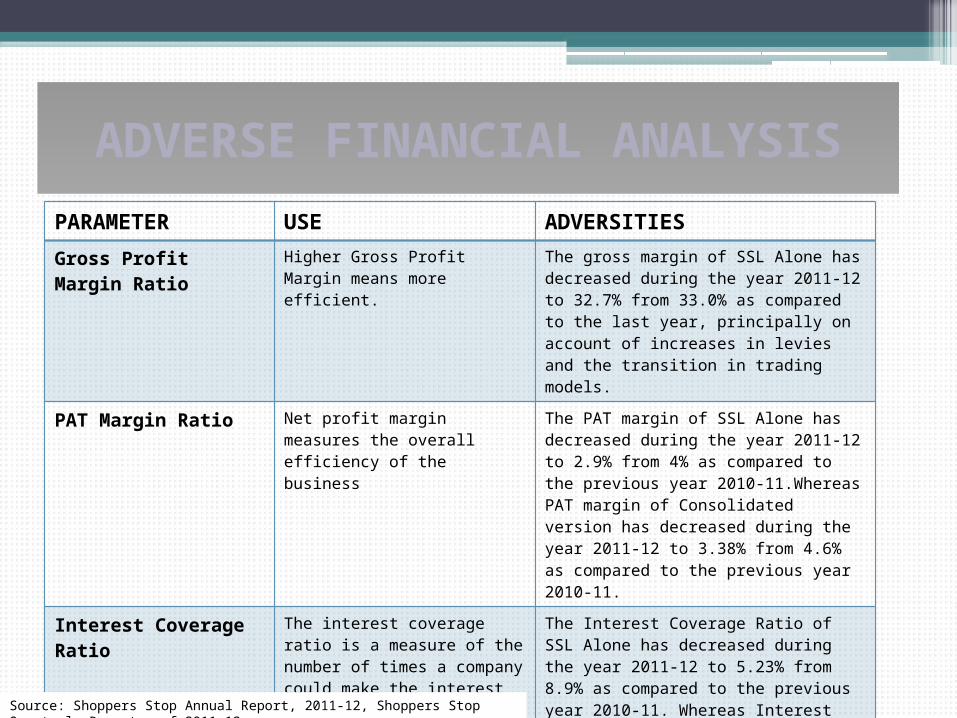
ADVERSE FINANCIAL ANALYSISPARAMETER USE ADVERSITIESGross Profit Margin Ratio Higher Gross Profit Margin means
more efficient.The gross margin of SSL Alone has decreased during the year 2011-12 to 32.7% from 33.0% as compared to the last year, principally on account of increases in levies and the transition in trading models.
PAT Margin Ratio Net profit margin measures the overall efficiency of the business
The PAT margin of SSL Alone has decreased during the year 2011-12 to 2.9% from 4% as compared to the previous year 2010-11.Whereas PAT margin of Consolidated version has decreased during the year 2011-12 to 3.38% from 4.6% as compared to the previous year 2010-11.
Interest Coverage Ratio The interest coverage ratio is a measure of the number of times a company could make the interest payments on its debt with its EBIT. The lower the interest coverage ratio, the higher the company's debt burden and the greater the possibility of bankruptcy or default.
The Interest Coverage Ratio of SSL Alone has decreased during the year 2011-12 to 5.23% from 8.9% as compared to the previous year 2010-11. Whereas Interest Coverage Ratio of Consolidated version has decreased during the year 2011-12 to 4.91% from 8.83% as compared to the previous year 2010-11. Although it still remains within the ideal ratio limits.
Source: Shoppers Stop Annual Report, 2011-12, Shoppers Stop Quarterly Report s of 2011-12
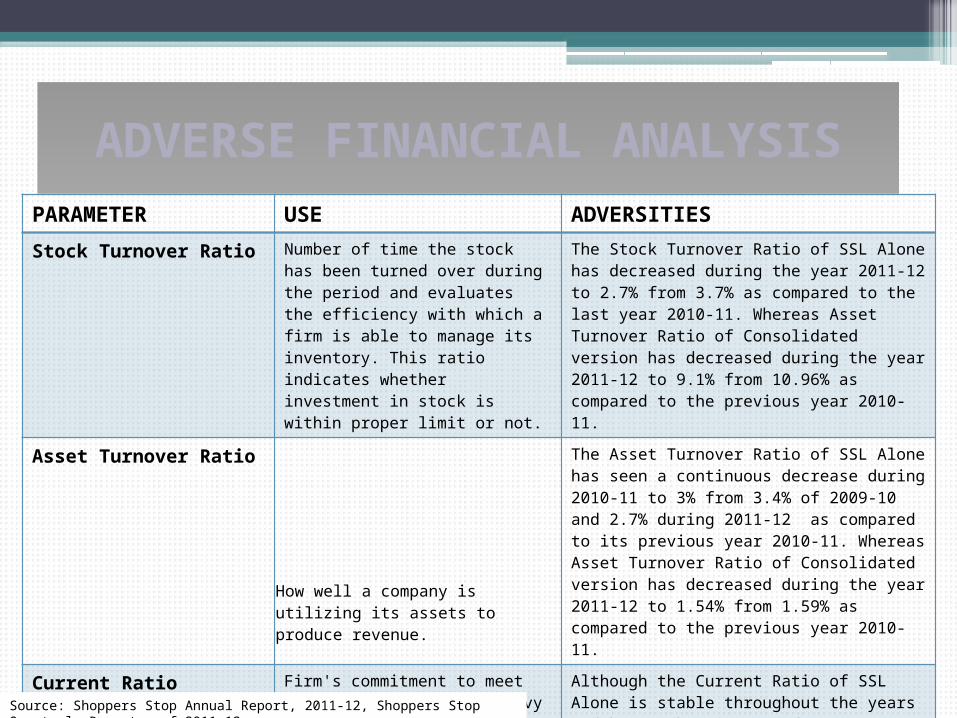
ADVERSE FINANCIAL ANALYSISPARAMETER USE ADVERSITIES
Stock Turnover Ratio Number of time the stock has been turned over during the period and evaluates the efficiency with which a firm is able to manage its inventory. This ratio indicates whether investment in stock is within proper limit or not.
The Stock Turnover Ratio of SSL Alone has decreased during the year 2011-12 to 2.7% from 3.7% as compared to the last year 2010-11. Whereas Asset Turnover Ratio of Consolidated version has decreased during the year 2011-12 to 9.1% from 10.96% as compared to the previous year 2010-11.
Asset Turnover Ratio
How well a company is utilizing its assets to produce revenue.
The Asset Turnover Ratio of SSL Alone has seen a continuous decrease during 2010-11 to 3% from 3.4% of 2009-10 and 2.7% during 2011-12 as compared to its previous year 2010-11. Whereas Asset Turnover Ratio of Consolidated version has decreased during the year 2011-12 to 1.54% from 1.59% as compared to the previous year 2010-11.
Current Ratio Firm's commitment to meet financial obligation. Heavy ratio is undesirable as it indicates less efficient use of funds.
Although the Current Ratio of SSL Alone is stable throughout the years and has rather increased to 1.5 during 2011-12 as compared to 1.4 of previous year 2010-11, similarly Current Ratio of Consolidated version resides 0.5 in 2011-12 and 0.47 in 2010-11 but does not lie in the ideal range and hence evident to the fact that company is not using its funds efficiently and needs improvement in it.
Source: Shoppers Stop Annual Report, 2011-12, Shoppers Stop Quarterly Report s of 2011-12
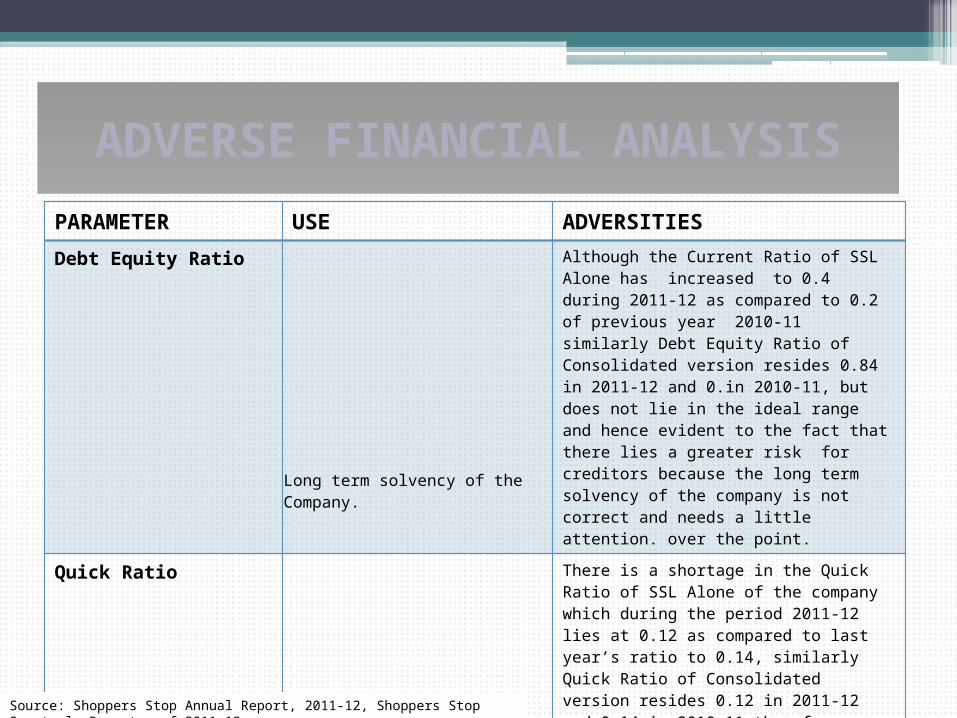
ADVERSE FINANCIAL ANALYSISPARAMETER USE ADVERSITIES
Debt Equity Ratio
Long term solvency of the Company.
Although the Current Ratio of SSL Alone has increased to 0.4 during 2011-12 as compared to 0.2 of previous year 2010-11 similarly Debt Equity Ratio of Consolidated version resides 0.84 in 2011-12 and 0.in 2010-11, but does not lie in the ideal range and hence evident to the fact that there lies a greater risk for creditors because the long term solvency of the company is not correct and needs a little attention. over the point.
Quick Ratio
Short term solvency of the Company.
There is a shortage in the Quick Ratio of SSL Alone of the company which during the period 2011-12 lies at 0.12 as compared to last year’s ratio to 0.14, similarly Quick Ratio of Consolidated version resides 0.12 in 2011-12 and 0.14 in 2010-11 therefore as far as the ideal ratio is concerned i.e. 0.5 it lacks way behind and hence is suffice to states that the company’s short term solvency needs immediate attention and improvement.
Return on Capital Employed (ROCE)
The company has experienced a decrease in ROCE of SSL Alone from 19.3% during 2010-11 to 12.8% during 2011-12.
Source: Shoppers Stop Annual Report, 2011-12, Shoppers Stop Quarterly Report s of 2011-12

ADVERSE FINANCIAL ANALYSISPARAMETER USE ADVERSITIESReturn on Net Worth (RONW)
Company has experienced a substantial decrease in RONW of SSL Alone from 26.7% during 2010-11 to 16.9% during 2011-12.
Short Term Loans and Advances
There has been a rise in the Short Term Loans and Advances provided by the company to Rs.4,012.47lacs during 2011-12 from Rs.3,894.82lacs during previous year 2010-11. Further it is expected to rise to Rs.5,861.1lacs from April to September 2012.
Long Term Loans and Advances
There has been a rise in the Long Term Loans and Advances provided by the company to Rs.25,028.65lacs during 2011-12 from Rs. 24,978 .29lacs during previous year 2010-11. Further it is expected to rise to Rs.27,881.7lacs from April to September 2012.
Source: Shoppers Stop Annual Report, 2011-12, Shoppers Stop Quarterly Report s of 2011-12

ADVERSE FINANCIAL ANALYSISPARAMETER USE ADVERSITIESStock in Trade There has been a rise in the Stock in Trade of the
company to Rs.21,204.01lacs during 2011-12 from Rs.15,113.66lacs during previous year 2010-11. Further it is expected to rise to Rs.21,239lacs from April to September 2012.
Other Current Liabilities Some of the Other Current Liabilities during 2011-12 have substantially risen from the previous year 2010-11:Current maturities of long term borrowings (secured): Rs.4,000lacs whereas in P.Y it was Rs.2,000lacs.Interest accrued and not due on borrowings: Rs.94.7lacs whereas in P.Y it was Rs.28.21lacs.Creditors for capital expenditure: Rs.739.2lacs whereas in P.Y it was Rs.536.10lacs.Liability for gift vouchers/point award redemptions: Rs.6,642.21lacs whereas in P.Y it was Rs.5,758.23lacs.Further Other Current Liabilities are expected to rise to Rs.14,652.8lacs from April to September 2012.
Source: Shoppers Stop Annual Report, 2011-12, Shoppers Stop Quarterly Report s of 2011-12

ADVERSE FINANCIAL ANALYSISPARAMETER USE ADVERSITIES
Trade Payables There has been a rise in the Trade Payables from other than MSME’s to Rs.21,656.71lacs during 2011-12 from Rs.24,622.74lacs during previous year 2010-11. Further it is expected to rise to Rs.29,586.1lacs from April to September 2012.
Short Term Borrowings Short Term Borrowings during 2011-12 have increased from the previous year 2010-11:Loans from banks (secured): Rs.14,406.87lacs whereas in P.Y it was Rs.10,548.95lacs.Commercial papers (unsecured): Rs.4,000lacs whereas in P.Y it was Rs.2,000lacs.Further it is expected to rise to Rs.21,710.5lacs from April to September 2012.
Partnership Satisfaction Index (PSI)
The performance of any company depends on the association and relationship it builds with various vendors/ partners over a periodof time. To evaluate this satisfaction and expectation, company has appointed CSMM (Customer Satisfaction Measurement andManagement), a part of IMRB (Indian Marketing and Research Bureau) to do an impartial evaluation of our relationship with variousstakeholders. This helps your organisation understand the expectations of various business partners, current strengths and concernareas thereby help set a clear roadmap for improvement and better performance.
PSI score haven fallen to 3.85 during the year 2011-12 as compared to 4.14 during the previous year 2010-11.
Source: Shoppers Stop Annual Report, 2011-12, Shoppers Stop Quarterly Report s of 2011-12

SWOT ANALYSIS
Opportunities
STRENGHTS
First Citizens Club has continued to be one of the main strengths of our business. In the year gone by the programme has exceeded the 2.5 million mark in memberships, making it one of the largest loyalty membership programs in the country across sectors.The company continues to invest in our front and back end processes and systems. The company created a strong distribution and logistics network, with our four Distribution Centres covering more than 400,000 square feet handling over 400,000 SKUs per year, and working 24x7. The Company believes that the “hub – and-spoke” model followed by it for its distribution network, will stand it in good stead for the expansion.Company endeavors to make Shopping experience the differentiator.The company assesses Customer Care Associates (CCAs) across all levels through assessment centres for promotion decisions, career planning and succession planning. Company also conducts associate satisfaction survey every year and derive ASI scores, which helps it in identifying the trust index scores of respect, credibility, fairness, pride with the organisation.Company benefits from its Promoters’ association with the real estate business and their relationships with developers, which have helped the company, acquire preferred properties at competitive rates.The Company imparts special training to its employees to ensure that service is not compromised on. The company’s store positioning in the “bridge to luxury” segment clearly sets apart its stores from those of the rest of the industry players.Among the big players in the organized retail space in India, Shopper's Stop has always understood the criticality of scale, availability and experience, and has been an eager adopter of advanced, cutting edge technology. To help drive its growth strategy, Shopper's Stop is employing its reporting and analytics capabilities in the areas of merchandising, loyalty management, distribution and logistics, sales performance, loss prevention, and financial analysis. SAS provided the retailer with a business analytics framework for reporting and analytics using SAS Enterprise BI Server and SAS Enterprise Miner.Access to standardized, timely and accurate data from its DRISHTI (Insight) data warehouse project, along with flexible reporting functionality.
Source: Shoppers Stop Annual Report, 2011-12, www.mbaskool.com, www.cio.in, www.sas.com,

SWOT ANALYSIS
WEAKNESSThe company will be in expansion phase over next 36 months which will be a critical time as far as execution risk is concerned.Rent is one of the largest components in a retail business fixed costs and the case is no different for the Company. Rentals are expected to harden once again in the near term.Slowing expansion due to dependence on real estate developer for completing projects during slowdown. Certain levies / cascading effect of taxes on the business which are proving to be a very large burden as there are no modes for the industry to recover or pass on these levies. Delay in the roll out of the GST regime is also a matter of concern.The Company has invested in other entities and lower than expected returns from these entities will have an impact on the cash flows and consolidated results of the CompanyIt has lesser promotional strategies on both Above the Line and Below the Line level compared to global leaders.Operating expenses of the company have substantially risen throughout the years which had its adverse effects on the profits of the financials of the company.Severe consistent heavy hikes in Finance Charges have been proved to be a big matter of concern for the company. The needs an immediate attention over the issue before it could consolidate its adverse effects on profits of the company. The funds available by the company are not being utilized by it in an efficient manner which reflects in its Current Ratio.Company has both provided and obtained heavy financing and borrowings for itself as well as for its Associate companies which until the current stage has failed to show its purpose and worth which takes a heavy toll out of the profit as a part of interest charges.The Net worth of Joint Venture Companies of SSL, i.e. Nuance Group (India) Private Limited and Timezone Entertainment Private Limited has substantially been eroded as at 31st March, 2012. Based on the business plans of these companies and the business valuation by an independent valuer, no provision for any loss is currently considered necessary in these financial statements.Subsidiary of SSL, Hypercity Retail (India) Limited continues to make losses and the accumulated losses of Rs. 36,402.66lacs as at 31st March, 2012 have substantially eroded its Net worth as at the year end. Based on the Business plans, opportunities and business valuation by an independent valuer, the Company considers that there is no loss for which a provision is currently necessary in these financial statements.
Source: Shoppers Stop Annual Report, 2011-12, www.mbaskool.com, www.cio.in, www.sas.com,

SWOT ANALYSIS
OPPORTUNITIES
The company is expecting to launch into its next expansion phase in the next 36 months. The Company’s strategy to increase the number of departmental stores, and therefore improve city wise penetration in new cities, increase market share in existing cities through additional new stores in those cities, and new stores in Tier-II cities, remains unchanged.Hypercity which is a 51% subsidiary of the Company has shown encouraging performance, with an overall sales growth of 27.5% and like to like sales growth of 9% for the year.Company has diversified into multiple formats viz, HomeStop which retails hard and soft furnishing, M.A.C. and Estee Lauder which retails high end cosmetic products, Clinique which retails skin care products, Mothercare which retails infant and kids merchandise and airport retailing, by tying up with The Nuance Group AG of Switzerland. The Company has also made a successful foray into internet retailing through its e-retailing portal. The Company looks to focus and expand these formats.Company believes that by it’s presence across all lifestyle categories in the departmental format, it’s strong brand value and it’s presence in the books and music segment, it is best placed to bring in international brands into the country, thereby enriching the product bouquet for it’s customers and in turn increasing opportunities for product diversification and profit enhancement.After the clearance of FDI from the Rajya Sabha , Shopper Stop because of having an early presence in some International brands may be have an upper hand in competing with the Global multibrand retail companies than its local rivals.Preferred partner for international brands in various categories due to diversified presence.
Source: Shoppers Stop Annual Report, 2011-12, www.mbaskool.com, www.cio.in, www.sas.com,

SWOT ANALYSIS
THREATS
Economic slowdowns have a direct impact on consumption. Retail, being the end service provider of consumption in the supply/value chain, is bound to face difficulties in an environment of economic slowdown.With India continuing to be an attractive retail market, the Company expects many new entrants into the sector, thus increasing competition, also among existing rivals there is intense rivalry for new locations and quality real estate, therefore it sets up the foundations for increased intensity of competition among existing rivals.With the clearance of FDI from the Government of India, Shopper Stop together with the local multibrand retailers like Wills Big Bazaar, Spencers, etc. Will also have to face severe competition from the global behemoths like Wallmarts.Faced with increasing competitive pressure for customer wallet share, Shopper's Stop will have to improve customer satisfaction and loyalty, increase its breadth of merchandise and expand store operations into new markets, while maintaining profitability.
Source: Shoppers Stop Annual Report, 2011-12, www.mbaskool.com, www.cio.in, www.sas.com,

RISK POINTS RAISED BY THE AUDITORS
Following risk points were raised by the Auditors for the financial year 2011-2012:• According to the Auditor’s opinion, a substantial part of fixed assets has not been disposed off by the Company during
the year.• The Company has granted unsecured loans to one party during the year. At the year-end, the outstanding balance of such
loans aggregated Rs.8,730.68lacs (including interest) and the maximum amount involved during the year was Rs.16,500.00lacs. The rate of interest and other terms and conditions of such loans are, in the Auditor’s opinion, prima facie not prejudicial to the interests of the Company.
• According to the Auditor’s opinion the terms and conditions of the guarantees given by the company for loans taken by its joint venture companies from banks are not prima facie prejudicial to the interests of the Company.
• Auditor’s attention is invited to Note 31 to the Consolidated Financial Statements regarding non-provision of service tax for the period 1 June 2007 to 31 March 2010, on renting of immoveable properties given for commercial use, aggregating Rs. 2,010.90lacs, pending final disposal of the appeal filed before the Honourable Supreme Court, inter-alia, challenging the retrospective levy of the service tax. The matter is contingent upon the final outcome of the litigation.
• Pursuant to levy of service tax on renting of immovable properties given for commercial use, retrospectively with effect from 1 June 2007 by the Finance Act, 2010, the Company has, based on a legal advice, and challenged the said levy and, inter-alia, its retrospective application. The Honourable Supreme Court has passed an interim order dated 14th October, 2011, with regard to the levy of service tax on immovable properties rented out for commercial use including its retrospective applicability from 1st June, 2007 in compliance of which, the Company has made an aggregate deposit of Rs.1,824.88lacs in respect of the liability for such service tax up to 30th September, 2011. From October 2011, the Company is accounting and paying for such service tax regularly as per directives of the Supreme Court. Pending the final disposal of the matter, the Company continues not to provide for the retrospective levy aggregating Rs.1,659.56lacs for the period 1st June, 2007 to 31st March, 2010.
Source: Shoppers Stop Annual Report 2011-12

COMMON STOCK COMPARISON (RS. In Crs.)
S no. Company Name Financials as on… Share Price
Shares Outstanding as on March 2012
Market Cap(Rs.)
Net Debt 2012(Rs.)
Expected Value(Rs.)
1 Tata Industries (Consolidated)
31st March 2012 228.6 88.8 20,299.68 (961.2) 19,338.48
2 Pantalone Retail (Standalone)*
30th June 2011 306.65 20.75 6,362.69 2,334.7 8.697.39
3 Bata (Consolidated)* 31st December 2011 530.45 6.43 3,408.87 (190.00) 3,218.87
4 Shopper's Stop (Consolidated)
31st March 2012 389.15 8.26 3,212.91 367.69 3,580.59
5 Gitanjali Gems (Consolidated)
31st March 2012 325.00 9.11 2,960.75 3,291.08 6,251.83
6 Trent (Standalone) 31st March 2012 949.20 2.72 2,586.52 (29.61) 2,556.91
7 Jubiliant Foodworks (consolidated)
31st March 2012 1,168.15 6.51 7,602.08 (12.94) 7,589.14
8 Provogue India(Standalone)
31st March 2012 14.55 11.44 166.39 273.27 439.65
Source: Danodia Capital Advisors Report July 2012Source: As per research reports available by leading brokers like Goldman Sachs, Citi Group etc.

COMMON STOCK COMPARISON (RS. In Crs.)S no. Company Name Sales 2012
(Rs.)Sales 2013 (Expected) (Rs.)
EBITDA 2012 (Rs.)
EBITDA 2013 (Expected) (Rs.)
Net Income 2012 (Rs.)
Net Income 2013 (Expected) (Rs.)
1 Tata Industries (Consolidated)
8,848.43 10,295.5 834.02 906 600.15 675.8
2 Pantalone Retail (Standalone)*
4,778.9 5,504.4 505.3 572.90 55.80 75.40
3 Bata (Consolidated)*
1,812.00 2,132.70 300.20 390.60 185.40 246.60
4 Shopper's Stop (Consolidated)
2,737.41 3,444.00 104.80 178.40 19.01 65.00
5 Gitanjali Gems (Consolidated)
12,498.27 14,050.50 807.59 970.80 487.25 531.00
6 Trent (Standalone) 821.79 923.27 NA 99.34 47.26 55.06
7 Jubiliant Foodworks (consolidated)
1,018.64 1,430.20 187.69 270.40 103.29 155.50
8 Provogue India(Standalone)
609.59 696.55 59.69 103.03 25.03 47.85
Source: As per research reports available by leading brokers like Goldman Sachs, Citi Group etc.

COMMON STOCK COMPARISONS no. Company Name EBITDA
Margin (%)
PATMargin (%)
(EV/Sales) 2012 (Rs.)
(EV/Sales) 2013E (Rs.)
(EV/EBITDA) 2012 (Rs.)
(EV/EBITDA) 2013E (Rs.)
(P/E) 2012 (Rs.)
(P/E) 2013E (Rs.)
1 Tata Industries (Consolidated)
9.43 6.78 2.19 1.88 23.19x 21.34 33.82 30.04
2 Pantalone Retail (Standalone)
10.57 1.17 1.82 1.58 17.21 15.18 114.03 84.39
3 Bata (Consolidated)
16.57 10.23 1.78 1.51 10.72 8.24 18.39 13.82
4 Shopper's Stop (Consolidated)
3.83 0.69 1.31 1.04 34.17 20.07 169.01 49.43
5 Gitanjali Gems (Consolidated)
6.46 3.90 0.50 0.44 7.74 6.44 6.08 5.58
6 Trent (Standalone)
0 5.75 3.11 2.77 0 25.74 54.73 46.98
7 Jubiliant Foodworks (consolidated)
18.43 10.14 7.45 5.31 40.43 28.07 73.6 48.89
8 Provogue India(Standalone)
9.79 4.11 0.72 0.63 7.37 4.27 6.65 3.48
Source: As per research reports available by leading brokers like Goldman Sachs, Citi Group etc.

THANK YOU
BY:AKSHAT KAPOORCHARTERED FINANCIAL ANALYST