Embed Size (px)
Citation preview

INDIA TOURISM STATISTICS 2009
Government of IndiaMinistry of Tourism
Market Research Division
OFFICERS OF MARKET RESEARCH DIVISIONASSOCIATED WITH THE PREPARATION OF
INDIA TOURISM STATISTICS 2009
Dr. R.N. PandeyAdditional Director General
Shri K.K. Nath Deputy Director
Shri S.V. Singh Programmer
Miss. Neha Srivastava Assistant Director
Smt. V. Meera Assistant Director
Shri Ram Rattan Banga Assistant Director
Shri S.K. Mohanta DPA Grade “B”
Shri Rajender Prasad DPA Grade “B”
Shri Banke Ram DPA Grade “B”
Smt. Charu Arora DEO Grade “A”
CHAPTER PAGE
Chapter- 1 Important Statistics on Tourism 1-5
Chapter-2 Inbound Tourism- Foreign Tourist Arrivals in India 7-53
2.1 Foreign Tourist Arrivals in India 9
Table 2.1.1 Foreign Tourist Arrivals (FTAs) in India , 1981-2009 9
Table 2.1.2 Nationality-wise (FTAs) in India, 2007-2009 10-12
2.2 FTAs in India from Different Regions 13
Table 2.2.1 FTAs in India from different Regions of the 14World, 2007-2009
2.3 Seasonality in FTAs in India 14
Table 2.3.1 Month-wise FTAs in India during 2009 and 15comparative figures of 2008 & 2007
Table 2.3.2 Lean and Peak Months of FTAs in India from top 1615 Countries during 2009
Table 2.3.3 Nationality-wise and Quarter-wise FTAs 17-19in India, 2009
2.4 Mode of Travel of FTAs in India 19
Table 2.4.1 FTAs in India according to Mode of Travel, 1996-2009 20
Table 2.4.2 Nationality-wise FTAs in India during 2009 21-23according to Mode of Travel
2.5 Port of Entry of FTAs in India 24
Table 2.5.1 FTAs in India through Major Ports, 1996-2009 24
Table 2.5.2 Nationality-wise FTAs in India according to 25-27Major Port of Disembarkation, 2009
2.6 Gender Distribution of FTAs in India 27
Table 2.6.1 FTAs in India according to Gender, 1996-2009 28
Table 2.6.2 Nationality-wise FTAs in India according to 29-31Gender, 2009
2.7 Age Distribution of FTAs in India 31
Table 2.7.1 FTAs in India according to Age-Group, 1996-2009 32
CONTENTS
Table 2.7.2 Nationality-wise FTAs in India according to 32-34Age-Group, 2009
2.8 Purpose of Visit of FTAs in India 35
Table 2.8.1 Classification of FTAs in India according to 35-37Purpose of Visit, 2009
2.9 Top 15 Source Countries for FTAs in India 37
Table 2.9.1 Top 15 Source Countries for FTAs in India during 382008 & 2009
Table 2.9.2 FTAs in India during 1981 to 2009 from Top 38-4015 Source Countries of 2009
Details of FTAs from the top 15 source countries for 2009 40-51
2.10 Foreign Exchange Earnings from Tourism in India 52
Table 2.10.1 FEE from from Tourism in India during 1991-2009 52
Table 2.10.2 Month-wise FEE from Tourism (in Rs. Crore) 53in India during 2007 - 2009
Table 2.10.3 Month-wise FEE from Tourism (in Million US$) in 53India during 2007 - 2009
Chapter-3 World Tourism Scenario and India’s Position in World 55-64
3.1 World Tourism Traffic 57
Table 3.1.1 International Tourist Arrivals Worldwide and By 58Regions, 2002 and 2005-2009
Table 3.1.2 International Tourist Arrivals in World and India , 581996-2009
Table 3.1.3 Countries which are above India in terms of Tourist 60Arrivals, 2007-2009
3.1.2 Outbound Tourism 60
Table 3.2.1 No. of Outbound Tourists of Some Selected Countries 60-61of the World and their Percentage Share of IndianDuring 2006 and 2007
3.3 International Tourism Receipts 61
Table 3.3.1 International Tourism Receipts Worldwide and by 62Regions, 2005 and 2007-2009
Table 3.3.2 International Tourism Receipts and India’ s Share 63and Rank, 1996-2009
Table 3.3.3 Countries which are above India in terms of 64Tourism Receipts, 2007-2009
Chapter-4 Outbound Tourism-Indian Nationals Departures from India 65-71
Table 4.1 Number of Indian Nationals Departures from India, 671991 to 2009
Table 4. 2 Port-wise Departures of Indian Nationals 68from India, 2002-2009
Table 4. 3 Destination-wise Number of Indian Nationals 69-71Departures from India, 2001-2008
Chapter-5 Domestic Tourism 73-88
5.1 Domestic & Foreign Tourist Visits during 1991-2009 75
Table 5.1.1 Domestic & Foreign Tourist Visits to States/ UTs, 75-761991-2009
Table 5.1.2 State/UT wise Domestic and Foreign Tourists 77-78Visits, 2008-2009
Table 5.1.3 Percentage Share and Rank of different States/UTs 78-80in Domestic and Foreign Tourist Visits during 2009
5.2 Visitors to Centrally Protected Ticketed Monuments 81
Table 5.2.1 Visitors to Centrally Protected Ticketed 81-82Monuments, 1996-2009
Table 5.2.2 Domestic and Foreign Visitors at 10 Most Popular 83Centrally Protected Ticketed ASI Monuments during 2009
Table 5.2.3 Number of Visitors to Centrally Protected Ticketed 84-88Monuments, 2007-2009
Chapter-6 Approved Hotels 89-113
6.1 Approved Hotels. 91
Table 6.1.1 Number of Approved Hotels and Availability of 91Hotel Rooms during 2007 & 2008
6.2 Distribution of Hotels in different Cities of India 91
Table 6.2.1: Distribution of Hotels and Hotel Rooms in India, 2008 92-109
6.3 Indian Hotel Industry Survey 2008-09 110
Table 6.3.1 Typical Room Profile of an Average Hotel, 2008-09 111by Category of Hotels
Table 6.3.2 Average Number of Employees per Hotel 111(Permanent/Contract/Full Time/Part Time),2008-09 by Category of Hotels
Table 6.3.3 Average Percentage of Trained Employees per Hotel, 1122008-09 by Category of Hotels
Table 6.3.4 Distribution of Hotel Guests by Country 112-113of Origin, 2008-09
Table 6.3.5 Analysis of Hotel Guests, 2008-09 by Category of Hotels 113
Chapter-7 Travel Trade 115-118
7.1 Tour Operators, Travel Agents, Tourist Transport 117Operators, Adventure Tour Operators andDomestic Tour Operators
Table 7.1.1 State-wise Number of Recognized Tour Operators, 117-118Travel Agencies, Tourist Transport Operators,Adventure Tour Operators & Domestic Tour Operators
Chapter-8 Human Resource Development 119-123
8.1 Indian Institutes of Tourism & Travel Management 121
Table 8.1.1 Number of Students Enrolled and Passed out from 121Indian Institutes of Tourism and Travel Management(IITTM) from its three Centres
8.2 Hotel Management and Catering Institutes 122
Table 8.2.1 Details of Courses Offered by Institutes of Hotel 122-123Managements /Food Craft Institutes
Chapter-9 Plan Outlays 125-130
9.1 Annual Plan Outlays and Financial Assistance Provided to States 127
Table 9.1.1 Scheme-wise Annual Plan Outlays of Ministry of 128Tourism for 2010-11
Table 9.1.2 Scheme-wise Plan Outlay of Ministry of Tourism for the 129Eleventh Five Year Plan (2007-2012)
Table 9.1.3 State-wise Number of Projects* and Amount 130Sanctioned* during 2007-08, 2008-09 and 2009-10 of11th Five Year Plan
Chapter-10 Surveys & Studies 131-151
Summary of the Study Report on “ Infrastructure Gaps in 133-143Tourism Sector at Five Tourist Destinations in India based onPerception of Tourists”
Summary of the Study Report on “ Problems and Prospects of 144-151Accessible Tourism in India”
Chapter-11 Financial Assistance Provided by Tourism Finance 153-156Corporation of India ( TFCI)
11.1. Financial Assistance Provided by Tourism Finance 155Corporation of India
Table 11.1.1 Assistance Sanctioned and Disbursed by TFCI 155during 2007-08, 2008-09 and 2009-10
Table 11.1.2 Project-wise and Purpose-wise Classification of 156Financial Assistance Provided by TFCI during 2009-10
Appendices 157-282
(i) Guidelines for Project Approval & Classification of 159-167Time Share Resorts (Appendix-I)
(ii) Guidelines for Classification of Heritage Hotels (Appendix-II) 169-171
(iii) Guidelines for approval of Convention Centers (Appendix-III) 173-183
(iv) Guidelines for approval & Classification/Re-classification of 185-203Apartment Hotels (Appendix-IV)
(v) Guidelines for Approval and Registration of Incredible India 205-214Bed & Breakfast Establishments (Appendix-V)
(vi) Guidelines for Recognition as an Approved Travel Agent 215-222(Appendix-VI)
(vii) Guidelines for Recognition as an Approved Inbound Tour 223-230Operator (Appendix-VII)
(viii) Guidelines for Recognition as an Approved Tourist Transport 231-238Operator (Appendix-VIII)
(ix) Guidelines for Recognition as an Approved Adventure Tour 239-253Operator (Appendix-IX)
(x) Guidelines for Recognition as an Approved Domestic Tour 254-262Operator (Appendix-X)
(xi) List of Functional Central Institutes of Hotel Management 263-264and Food Craft Institutes (Appendix-XI)
(xii) Guidelines of Scheme for IHMs/FCIs/IITTM/ITIs/Polytechnic 265-273Institutes/Universities/Govt. Colleges/Govt. VocationalSchools/PSUs (Appendix-XII)
(xiii) Revised Guidelines of Scheme for Product/Infrastructure 274-279Development for Destinations and Circuits (Appendix-XIII)
(xiv) Revised Scheme of Assistance for Large Revenue 280-282Generating Projects(Appendix-XIV)
Definitions 283-289
1. Definitions followed in India 285-288
2. International Definitions 288-289
3INDIA TOURISM STATISTICS 2009
IMPORTANT STATISTICS ON TOURISM, 2009
(I) INDIA
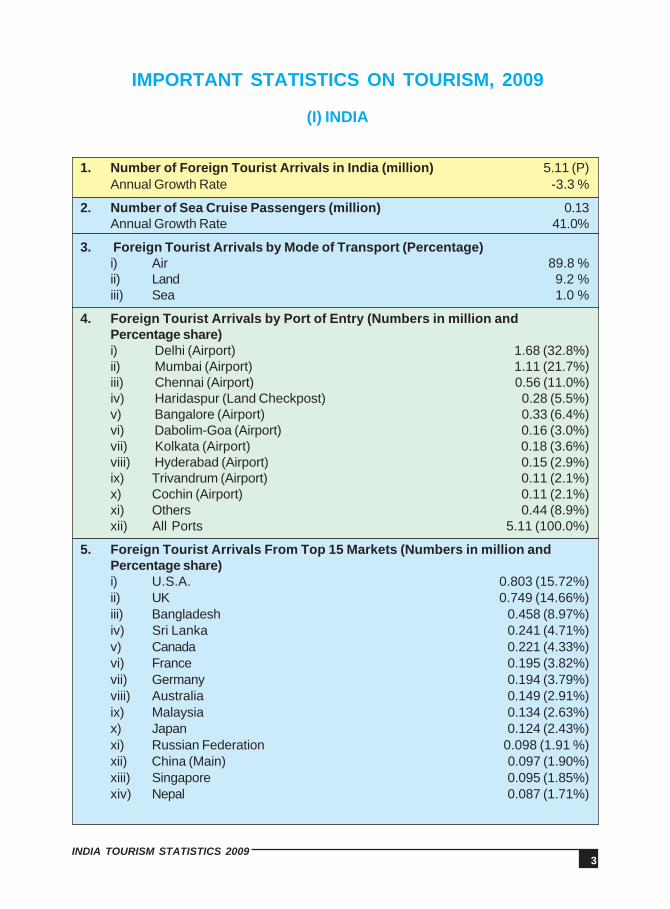
1. Number of Foreign Tourist Arrivals in India (million) 5.11 (P)Annual Growth Rate -3.3 %
2. Number of Sea Cruise Passengers (million) 0.13Annual Growth Rate 41.0%
3. Foreign Tourist Arrivals by Mode of Transport (Percentage)i) Air 89.8 %ii) Land 9.2 %iii) Sea 1.0 %
4. Foreign Tourist Arrivals by Port of Entry (Numbers in million andPercentage share)i) Delhi (Airport) 1.68 (32.8%)ii) Mumbai (Airport) 1.11 (21.7%)iii) Chennai (Airport) 0.56 (11.0%)iv) Haridaspur (Land Checkpost) 0.28 (5.5%)v) Bangalore (Airport) 0.33 (6.4%)vi) Dabolim-Goa (Airport) 0.16 (3.0%)vii) Kolkata (Airport) 0.18 (3.6%)viii) Hyderabad (Airport) 0.15 (2.9%)ix) Trivandrum (Airport) 0.11 (2.1%)x) Cochin (Airport) 0.11 (2.1%)xi) Others 0.44 (8.9%)xii) All Ports 5.11 (100.0%)
5. Foreign Tourist Arrivals From Top 15 Markets (Numbers in million andPercentage share)i) U.S.A. 0.803 (15.72%)ii) UK 0.749 (14.66%)iii) Bangladesh 0.458 (8.97%)iv) Sri Lanka 0.241 (4.71%)v) Canada 0.221 (4.33%)vi) France 0.195 (3.82%)vii) Germany 0.194 (3.79%)viii) Australia 0.149 (2.91%)ix) Malaysia 0.134 (2.63%)x) Japan 0.124 (2.43%)xi) Russian Federation 0.098 (1.91 %)xii) China (Main) 0.097 (1.90%)xiii) Singapore 0.095 (1.85%)xiv) Nepal 0.087 (1.71%)
4INDIA TOURISM STATISTICS 2009
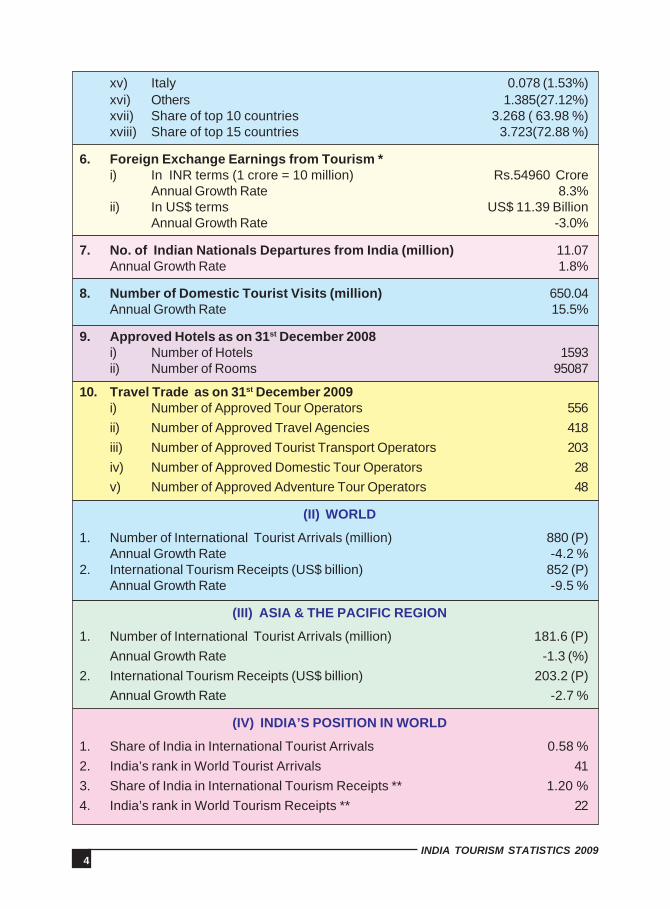
xv) Italy 0.078 (1.53%)xvi) Others 1.385(27.12%)xvii) Share of top 10 countries 3.268 ( 63.98 %)xviii) Share of top 15 countries 3.723(72.88 %)
6. Foreign Exchange Earnings from Tourism *i) In INR terms (1 crore = 10 million) Rs.54960 Crore
Annual Growth Rate 8.3%ii) In US$ terms US$ 11.39 Billion
Annual Growth Rate -3.0%
7. No. of Indian Nationals Departures from India (million) 11.07Annual Growth Rate 1.8%
8. Number of Domestic Tourist Visits (million) 650.04Annual Growth Rate 15.5%
9. Approved Hotels as on 31st December 2008i) Number of Hotels 1593ii) Number of Rooms 95087
10. Travel Trade as on 31st December 2009i) Number of Approved Tour Operators 556ii) Number of Approved Travel Agencies 418iii) Number of Approved Tourist Transport Operators 203iv) Number of Approved Domestic Tour Operators 28v) Number of Approved Adventure Tour Operators 48
(II) WORLD
1. Number of International Tourist Arrivals (million) 880 (P)Annual Growth Rate -4.2 %
2. International Tourism Receipts (US$ billion) 852 (P)Annual Growth Rate -9.5 %
(III) ASIA & THE PACIFIC REGION
1. Number of International Tourist Arrivals (million) 181.6 (P)Annual Growth Rate -1.3 (%)
2. International Tourism Receipts (US$ billion) 203.2 (P)Annual Growth Rate -2.7 %
(IV) INDIA’S POSITION IN WORLD
1. Share of India in International Tourist Arrivals 0.58 %2. India’s rank in World Tourist Arrivals 413. Share of India in International Tourism Receipts ** 1.20 %4. India’s rank in World Tourism Receipts ** 22
5INDIA TOURISM STATISTICS 2009
(V) INDIA’S POSITION IN ASIA & THE PACIFIC REGION
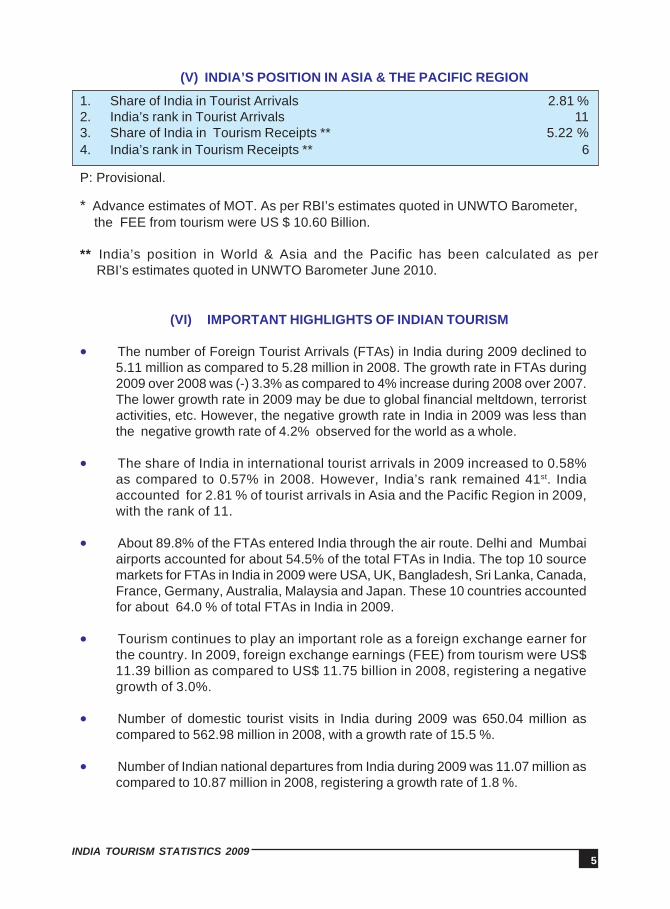
1. Share of India in Tourist Arrivals 2.81 %2. India’s rank in Tourist Arrivals 113. Share of India in Tourism Receipts ** 5.22 %4. India’s rank in Tourism Receipts ** 6
P: Provisional.
* Advance estimates of MOT. As per RBI’s estimates quoted in UNWTO Barometer, the FEE from tourism were US $ 10.60 Billion.
** India’s position in World & Asia and the Pacific has been calculated as per RBI’s estimates quoted in UNWTO Barometer June 2010.
(VI) IMPORTANT HIGHLIGHTS OF INDIAN TOURISM
• The number of Foreign Tourist Arrivals (FTAs) in India during 2009 declined to5.11 million as compared to 5.28 million in 2008. The growth rate in FTAs during2009 over 2008 was (-) 3.3% as compared to 4% increase during 2008 over 2007.The lower growth rate in 2009 may be due to global financial meltdown, terroristactivities, etc. However, the negative growth rate in India in 2009 was less thanthe negative growth rate of 4.2% observed for the world as a whole.
• The share of India in international tourist arrivals in 2009 increased to 0.58%as compared to 0.57% in 2008. However, India’s rank remained 41st. Indiaaccounted for 2.81 % of tourist arrivals in Asia and the Pacific Region in 2009,with the rank of 11.
• About 89.8% of the FTAs entered India through the air route. Delhi and Mumbaiairports accounted for about 54.5% of the total FTAs in India. The top 10 sourcemarkets for FTAs in India in 2009 were USA, UK, Bangladesh, Sri Lanka, Canada,France, Germany, Australia, Malaysia and Japan. These 10 countries accountedfor about 64.0 % of total FTAs in India in 2009.
• Tourism continues to play an important role as a foreign exchange earner forthe country. In 2009, foreign exchange earnings (FEE) from tourism were US$11.39 billion as compared to US$ 11.75 billion in 2008, registering a negativegrowth of 3.0%.
• Number of domestic tourist visits in India during 2009 was 650.04 million ascompared to 562.98 million in 2008, with a growth rate of 15.5 %.
• Number of Indian national departures from India during 2009 was 11.07 million ascompared to 10.87 million in 2008, registering a growth rate of 1.8 %.
9INDIA TOURISM STATISTICS 2009
Year FTAs in India Annual Growth (%)
1981 1279210 2.01982 1288162 0.71983 1304976 1.31984 1193752 -8.51985 1259384 5.51986 1451076 15.21987 1484290 2.31988 1590661 7.21989 1736093 9.11990 1707158 -1.71991 1677508 -1.71992 1867651 11.31993 1764830 -5.51994 1886433 6.91995 2123683 12..61996 2287860 7.71997 2374094 3.81998 2358629 -0.71999 2481928 5.22000 2649378 6.72001 2537282 -4.22002 2384364 -6.02003 2726214 14.32004 3457477 26.82005 3918610 13.32006 4447167 13.52007 5081504 14.32008 5282603 4.0
2009(P) 5108579 -3.3
INBOUND TOURISM- FOREIGN TOURISTARRIVALS IN INDIA
2.1 FOREIGN TOURIST ARRIVALS IN INDIA
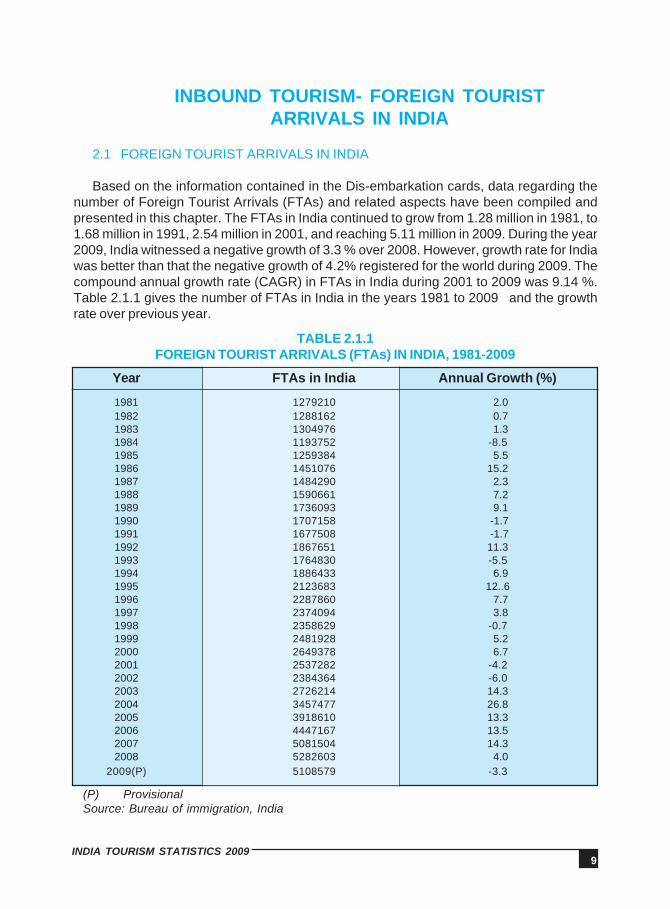
Based on the information contained in the Dis-embarkation cards, data regarding thenumber of Foreign Tourist Arrivals (FTAs) and related aspects have been compiled andpresented in this chapter. The FTAs in India continued to grow from 1.28 million in 1981, to1.68 million in 1991, 2.54 million in 2001, and reaching 5.11 million in 2009. During the year2009, India witnessed a negative growth of 3.3 % over 2008. However, growth rate for Indiawas better than that the negative growth of 4.2% registered for the world during 2009. Thecompound annual growth rate (CAGR) in FTAs in India during 2001 to 2009 was 9.14 %.Table 2.1.1 gives the number of FTAs in India in the years 1981 to 2009 and the growthrate over previous year.
(P) ProvisionalSource: Bureau of immigration, India
TABLE 2.1.1FOREIGN TOURIST ARRIVALS (FTAs) IN INDIA, 1981-2009
10INDIA TOURISM STATISTICS 2009
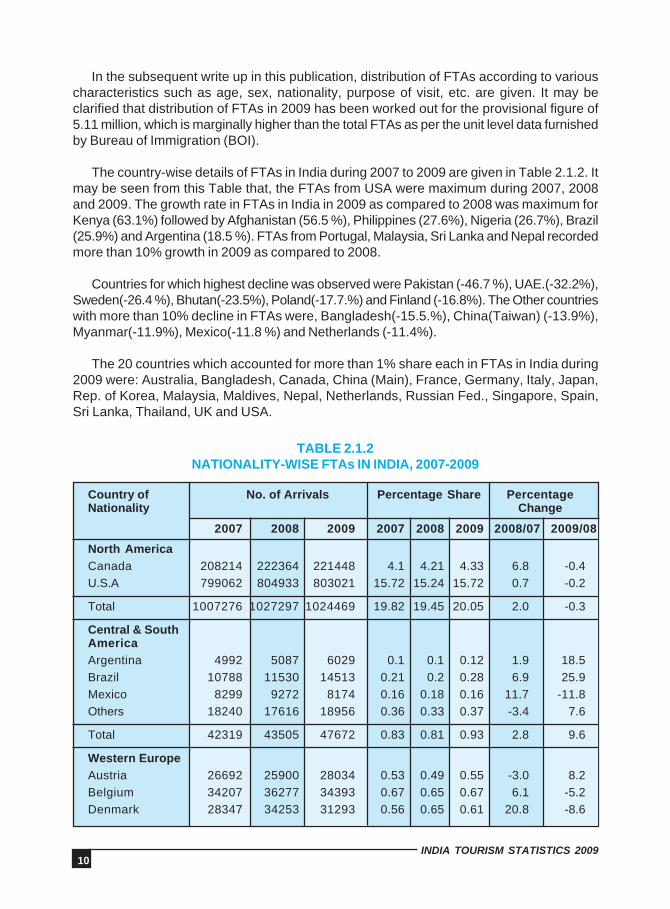
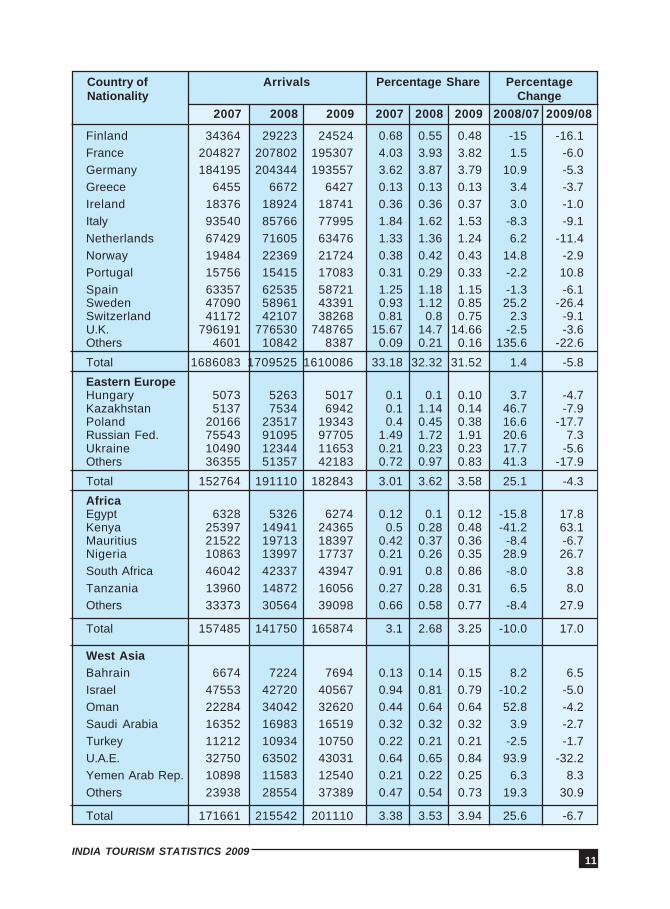
In the subsequent write up in this publication, distribution of FTAs according to variouscharacteristics such as age, sex, nationality, purpose of visit, etc. are given. It may beclarified that distribution of FTAs in 2009 has been worked out for the provisional figure of5.11 million, which is marginally higher than the total FTAs as per the unit level data furnishedby Bureau of Immigration (BOI).
The country-wise details of FTAs in India during 2007 to 2009 are given in Table 2.1.2. Itmay be seen from this Table that, the FTAs from USA were maximum during 2007, 2008and 2009. The growth rate in FTAs in India in 2009 as compared to 2008 was maximum forKenya (63.1%) followed by Afghanistan (56.5 %), Philippines (27.6%), Nigeria (26.7%), Brazil(25.9%) and Argentina (18.5 %). FTAs from Portugal, Malaysia, Sri Lanka and Nepal recordedmore than 10% growth in 2009 as compared to 2008.
Countries for which highest decline was observed were Pakistan (-46.7 %), UAE.(-32.2%),Sweden(-26.4 %), Bhutan(-23.5%), Poland(-17.7.%) and Finland (-16.8%). The Other countrieswith more than 10% decline in FTAs were, Bangladesh(-15.5.%), China(Taiwan) (-13.9%),Myanmar(-11.9%), Mexico(-11.8 %) and Netherlands (-11.4%).
The 20 countries which accounted for more than 1% share each in FTAs in India during2009 were: Australia, Bangladesh, Canada, China (Main), France, Germany, Italy, Japan,Rep. of Korea, Malaysia, Maldives, Nepal, Netherlands, Russian Fed., Singapore, Spain,Sri Lanka, Thailand, UK and USA.
TABLE 2.1.2NATIONALITY-WISE FTAs IN INDIA, 2007-2009
Country of No. of Arrivals Percentage Share PercentageNationality Change
2007 2008 2009 2007 2008 2009 2008/07 2009/08
North AmericaCanada 208214 222364 221448 4.1 4.21 4.33 6.8 -0.4U.S.A 799062 804933 803021 15.72 15.24 15.72 0.7 -0.2
Total 1007276 1027297 1024469 19.82 19.45 20.05 2.0 -0.3
Central & SouthAmericaArgentina 4992 5087 6029 0.1 0.1 0.12 1.9 18.5Brazil 10788 11530 14513 0.21 0.2 0.28 6.9 25.9Mexico 8299 9272 8174 0.16 0.18 0.16 11.7 -11.8Others 18240 17616 18956 0.36 0.33 0.37 -3.4 7.6
Total 42319 43505 47672 0.83 0.81 0.93 2.8 9.6
Western EuropeAustria 26692 25900 28034 0.53 0.49 0.55 -3.0 8.2Belgium 34207 36277 34393 0.67 0.65 0.67 6.1 -5.2Denmark 28347 34253 31293 0.56 0.65 0.61 20.8 -8.6
11INDIA TOURISM STATISTICS 2009
Country of Arrivals Percentage Share PercentageNationality Change
2007 2008 2009 2007 2008 2009 2008/07 2009/08
Finland 34364 29223 24524 0.68 0.55 0.48 -15 -16.1France 204827 207802 195307 4.03 3.93 3.82 1.5 -6.0Germany 184195 204344 193557 3.62 3.87 3.79 10.9 -5.3Greece 6455 6672 6427 0.13 0.13 0.13 3.4 -3.7Ireland 18376 18924 18741 0.36 0.36 0.37 3.0 -1.0Italy 93540 85766 77995 1.84 1.62 1.53 -8.3 -9.1Netherlands 67429 71605 63476 1.33 1.36 1.24 6.2 -11.4Norway 19484 22369 21724 0.38 0.42 0.43 14.8 -2.9Portugal 15756 15415 17083 0.31 0.29 0.33 -2.2 10.8Spain 63357 62535 58721 1.25 1.18 1.15 -1.3 -6.1Sweden 47090 58961 43391 0.93 1.12 0.85 25.2 -26.4Switzerland 41172 42107 38268 0.81 0.8 0.75 2.3 -9.1U.K. 796191 776530 748765 15.67 14.7 14.66 -2.5 -3.6Others 4601 10842 8387 0.09 0.21 0.16 135.6 -22.6
Total 1686083 1709525 1610086 33.18 32.32 31.52 1.4 -5.8
Eastern EuropeHungary 5073 5263 5017 0.1 0.1 0.10 3.7 -4.7Kazakhstan 5137 7534 6942 0.1 1.14 0.14 46.7 -7.9Poland 20166 23517 19343 0.4 0.45 0.38 16.6 -17.7Russian Fed. 75543 91095 97705 1.49 1.72 1.91 20.6 7.3Ukraine 10490 12344 11653 0.21 0.23 0.23 17.7 -5.6Others 36355 51357 42183 0.72 0.97 0.83 41.3 -17.9
Total 152764 191110 182843 3.01 3.62 3.58 25.1 -4.3
AfricaEgypt 6328 5326 6274 0.12 0.1 0.12 -15.8 17.8Kenya 25397 14941 24365 0.5 0.28 0.48 -41.2 63.1Mauritius 21522 19713 18397 0.42 0.37 0.36 -8.4 -6.7Nigeria 10863 13997 17737 0.21 0.26 0.35 28.9 26.7South Africa 46042 42337 43947 0.91 0.8 0.86 -8.0 3.8Tanzania 13960 14872 16056 0.27 0.28 0.31 6.5 8.0Others 33373 30564 39098 0.66 0.58 0.77 -8.4 27.9
Total 157485 141750 165874 3.1 2.68 3.25 -10.0 17.0
West AsiaBahrain 6674 7224 7694 0.13 0.14 0.15 8.2 6.5Israel 47553 42720 40567 0.94 0.81 0.79 -10.2 -5.0Oman 22284 34042 32620 0.44 0.64 0.64 52.8 -4.2Saudi Arabia 16352 16983 16519 0.32 0.32 0.32 3.9 -2.7Turkey 11212 10934 10750 0.22 0.21 0.21 -2.5 -1.7U.A.E. 32750 63502 43031 0.64 0.65 0.84 93.9 -32.2Yemen Arab Rep. 10898 11583 12540 0.21 0.22 0.25 6.3 8.3Others 23938 28554 37389 0.47 0.54 0.73 19.3 30.9
Total 171661 215542 201110 3.38 3.53 3.94 25.6 -6.7

12INDIA TOURISM STATISTICS 2009
Country of Arrivals Percentage Share PercentageNationality Change
2007 2008 2009 2007 2008 2009 2008/07 2009/08
South Asia
Afghanistan 23045 32438 50762 0.45 0.61 0.99 40.8 56.5Iran 33223 30149 35379 0.65 0.57 0.69 -9.3 17.3Maldives 45787 54956 56863 0.9 1.04 1.11 20.0 3.5Nepal 83037 78133 87487 1.63 1.48 1.71 -5.9 12.0Pakistan 106283 85529 45628 2.09 1.62 0.89 -19.5 -46.7Bangladesh 480240 541884 458063 9.45 10.26 8.97 12.8 -15.5Sri Lanka 204084 218805 240836 4.02 4.14 4.71 7.2 10.1Bhutan 6729 9952 7615 0.13 0.19 0.15 47.9 -23.5
Total 982428 1051846 982633 19.33 19.91 19.23 7.1 -6.6
South East Asia
Indonesia 17818 19609 18791 0.35 0.37 0.37 10.1 -4.2Malaysia 112741 115794 134340 2.22 2.19 2.63 2.7 16.0Myanmar 7977 12147 10698 0.16 0.23 0.21 52.3 -11.9Philippines 15567 17222 20173 0.31 0.3 0.39 10.6 17.1Singapore 92908 97851 94754 1.83 1.85 1.85 5.3 -3.2Thailand 50037 58065 62593 0.98 1.1 1.23 16.0 7.8Others 6427 12237 7146 0.13 0.23 0.14 90.4 -41.6
Total 303475 332925 348495 5.97 6.28 6.82 9.7 4.7
East Asia
China (Main) 88103 98093 96997 1.73 1.86 1.90 11.3 -1.1China (Taiwan) 30024 28939 24915 0.59 0.55 0.49 -3.6 -13.9Japan 145538 145352 124219 2.86 2.75 2.43 -0.1 -14.5Rep. of Korea 84583 79802 69316 1.66 1.51 1.36 -5.7 -13.1Others 3789 3044 2845 0.07 0.06 0.06 -19.7 -6.5
Total 352037 355230 318292 6.93 6.72 6.23 0.9 -10.4
Australasia
Australia 135925 146209 148846 2.67 2.77 2.91 7.6 1.8New Zealand 27498 29261 30305 0.54 0.55 0.59 6.4 3.6Others 3640 2838 2698 0.07 0.05 0.05 -22.0 -4.9
Total 167063 178308 181849 3.29 3.38 3.56 6.7 2.0
Others 32676 34540 44963 0.64 0.65 0.88 5.7 30.2
Stateless 26237 1025 293 0.52 0.02 0.01 -96.1 -71.4
Grand Total 5081504 5282603 5108579 100 100 100 4.0 -3.3
Source: Bureau of Immigration, India
13INDIA TOURISM STATISTICS 2009
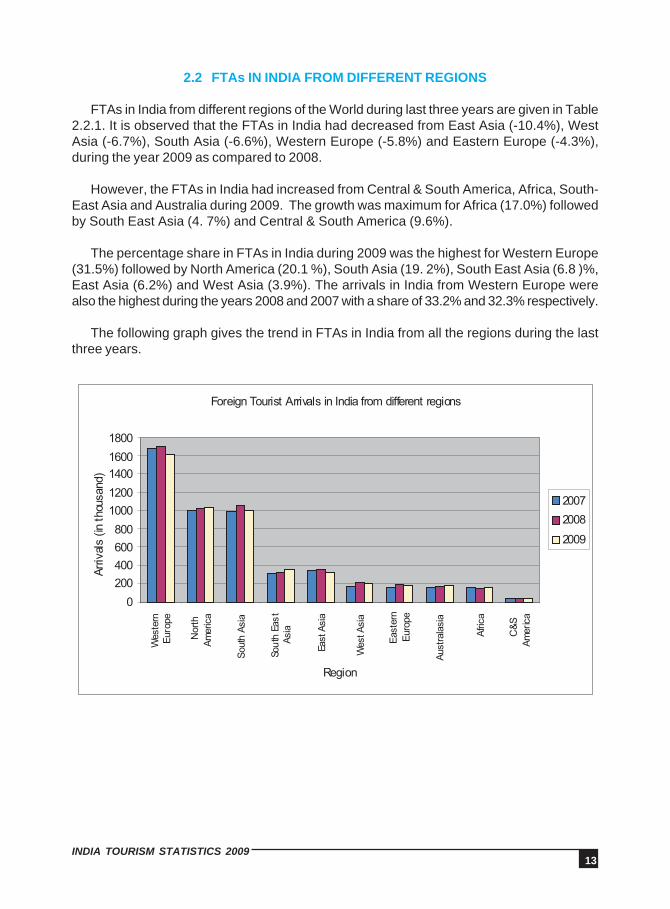
2.2 FTAs IN INDIA FROM DIFFERENT REGIONS
FTAs in India from different regions of the World during last three years are given in Table2.2.1. It is observed that the FTAs in India had decreased from East Asia (-10.4%), WestAsia (-6.7%), South Asia (-6.6%), Western Europe (-5.8%) and Eastern Europe (-4.3%),during the year 2009 as compared to 2008.
However, the FTAs in India had increased from Central & South America, Africa, South-East Asia and Australia during 2009. The growth was maximum for Africa (17.0%) followedby South East Asia (4. 7%) and Central & South America (9.6%).
The percentage share in FTAs in India during 2009 was the highest for Western Europe(31.5%) followed by North America (20.1 %), South Asia (19. 2%), South East Asia (6.8 )%,East Asia (6.2%) and West Asia (3.9%). The arrivals in India from Western Europe werealso the highest during the years 2008 and 2007 with a share of 33.2% and 32.3% respectively.
The following graph gives the trend in FTAs in India from all the regions during the lastthree years.
14INDIA TOURISM STATISTICS 2009
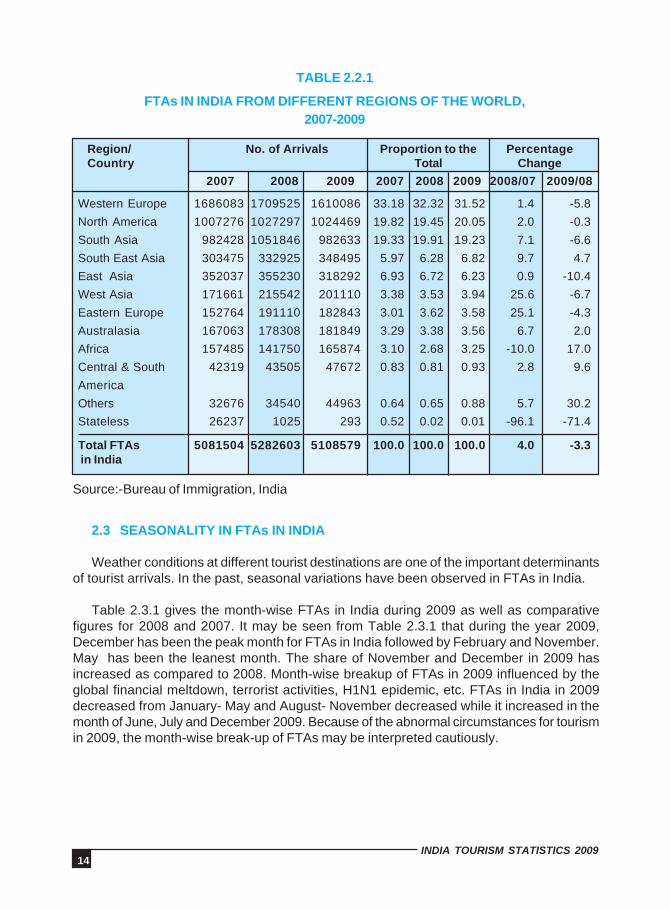
TABLE 2.2.1
FTAs IN INDIA FROM DIFFERENT REGIONS OF THE WORLD,2007-2009
Region/ No. of Arrivals Proportion to the PercentageCountry Total Change
2007 2008 2009 2007 2008 2009 2008/07 2009/08
Western Europe 1686083 1709525 1610086 33.18 32.32 31.52 1.4 -5.8North America 1007276 1027297 1024469 19.82 19.45 20.05 2.0 -0.3South Asia 982428 1051846 982633 19.33 19.91 19.23 7.1 -6.6South East Asia 303475 332925 348495 5.97 6.28 6.82 9.7 4.7East Asia 352037 355230 318292 6.93 6.72 6.23 0.9 -10.4West Asia 171661 215542 201110 3.38 3.53 3.94 25.6 -6.7Eastern Europe 152764 191110 182843 3.01 3.62 3.58 25.1 -4.3Australasia 167063 178308 181849 3.29 3.38 3.56 6.7 2.0Africa 157485 141750 165874 3.10 2.68 3.25 -10.0 17.0Central & South 42319 43505 47672 0.83 0.81 0.93 2.8 9.6AmericaOthers 32676 34540 44963 0.64 0.65 0.88 5.7 30.2Stateless 26237 1025 293 0.52 0.02 0.01 -96.1 -71.4
Total FTAs 5081504 5282603 5108579 100.0 100.0 100.0 4.0 -3.3 in India
Source:-Bureau of Immigration, India
2.3 SEASONALITY IN FTAs IN INDIA
Weather conditions at different tourist destinations are one of the important determinantsof tourist arrivals. In the past, seasonal variations have been observed in FTAs in India.
Table 2.3.1 gives the month-wise FTAs in India during 2009 as well as comparativefigures for 2008 and 2007. It may be seen from Table 2.3.1 that during the year 2009,December has been the peak month for FTAs in India followed by February and November.May has been the leanest month. The share of November and December in 2009 hasincreased as compared to 2008. Month-wise breakup of FTAs in 2009 influenced by theglobal financial meltdown, terrorist activities, H1N1 epidemic, etc. FTAs in India in 2009decreased from January- May and August- November decreased while it increased in themonth of June, July and December 2009. Because of the abnormal circumstances for tourismin 2009, the month-wise break-up of FTAs may be interpreted cautiously.

15INDIA TOURISM STATISTICS 2009
TABLE 2.3.1
MONTH-WISE FTAs IN INDIA DURING 2009 AND COMPARATIVEFIGURES OF 2008 & 2007
Month Foreign Tourist Growth rate in PercentageArrivals (Nos.) FTAs Share
2007 2008 2009 2008/ 2009/ 2007 2008 20092007 2008
January 535631 511781 421708 -4.5 -17.6 10.5 9.7 8.3
February 501692 611493 546675 21.9 -10.6 9.9 11.6 10.7
March 472494 479765 417875 1.5 -12.9 9.3 9.1 8.2
April 350550 361101 348462 3.0 -3.5 6.9 6.8 6.8
May 277017 304361 298578 9.9 -1.9 5.5 5.8 5.8
June 310364 341539 342222 10.0 0.2 6.1 6.5 6.7
July 399866 431933 434525 8.0 0.6 7.9 8.2 8.5
August 358446 383337 350370 6.9 -8.6 7.1 7.3 6.9
September 301892 341693 327684 13.2 -4.1 5.9 6.5 6.4
October 444564 450013 445963 1.2 -0.9 8.7 8.5 8.7
November 532428 531683 528493 -0.1 -0.6 10.5 10.1 10.3
December 596560 533904 646024 -10.5 21.0 11.7 10.1 12.7
Total 5081504 5282603 5108579 4.0 -3.3 100.0 100.0 100.0
Source: Bureau of Immigration, India
In 2009, the maximum number of FTAs in India were during December (12.7%) andminimum during the month of May (5.8%). The following graph clearly shows that the maximumFTAs in India were in January-March and October-December during 2009. This is generallyconsistent with the pattern in 2007 and 2008.
16INDIA TOURISM STATISTICS 2009
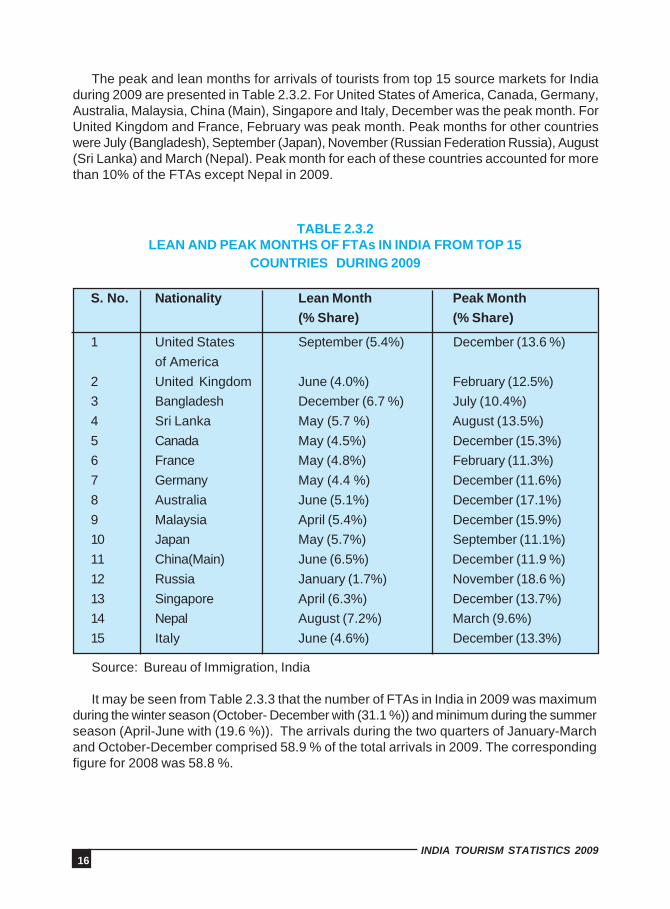
The peak and lean months for arrivals of tourists from top 15 source markets for Indiaduring 2009 are presented in Table 2.3.2. For United States of America, Canada, Germany,Australia, Malaysia, China (Main), Singapore and Italy, December was the peak month. ForUnited Kingdom and France, February was peak month. Peak months for other countrieswere July (Bangladesh), September (Japan), November (Russian Federation Russia), August(Sri Lanka) and March (Nepal). Peak month for each of these countries accounted for morethan 10% of the FTAs except Nepal in 2009.
TABLE 2.3.2LEAN AND PEAK MONTHS OF FTAs IN INDIA FROM TOP 15
COUNTRIES DURING 2009
S. No. Nationality Lean Month Peak Month(% Share) (% Share)
1 United States September (5.4%) December (13.6 %)of America
2 United Kingdom June (4.0%) February (12.5%)3 Bangladesh December (6.7 %) July (10.4%)4 Sri Lanka May (5.7 %) August (13.5%)5 Canada May (4.5%) December (15.3%)6 France May (4.8%) February (11.3%)7 Germany May (4.4 %) December (11.6%)8 Australia June (5.1%) December (17.1%)9 Malaysia April (5.4%) December (15.9%)10 Japan May (5.7%) September (11.1%)11 China(Main) June (6.5%) December (11.9 %)12 Russia January (1.7%) November (18.6 %)13 Singapore April (6.3%) December (13.7%)14 Nepal August (7.2%) March (9.6%)15 Italy June (4.6%) December (13.3%)
Source: Bureau of Immigration, India
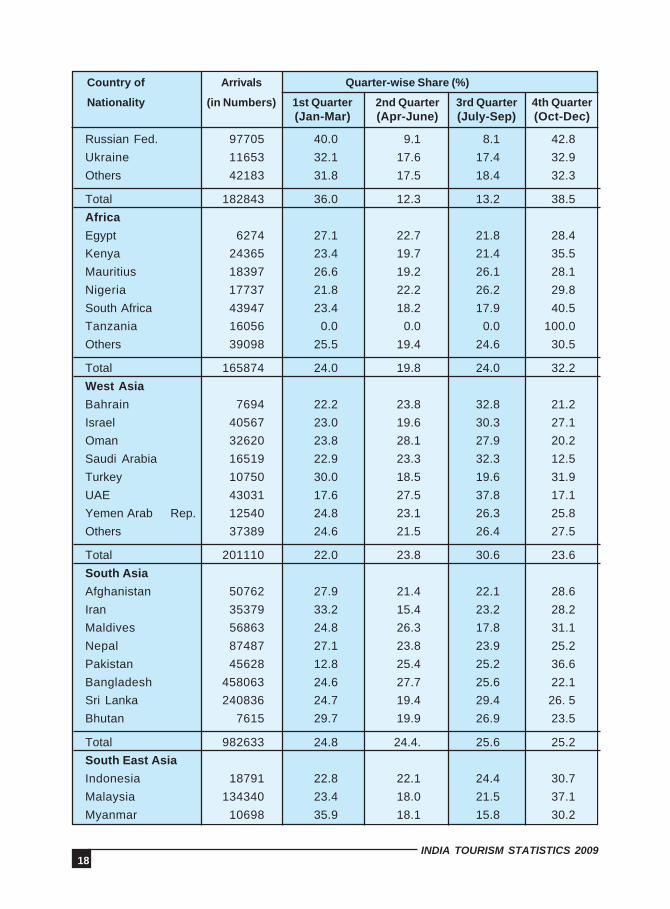
It may be seen from Table 2.3.3 that the number of FTAs in India in 2009 was maximumduring the winter season (October- December with (31.1 %)) and minimum during the summerseason (April-June with (19.6 %)). The arrivals during the two quarters of January-Marchand October-December comprised 58.9 % of the total arrivals in 2009. The correspondingfigure for 2008 was 58.8 %.
17INDIA TOURISM STATISTICS 2009
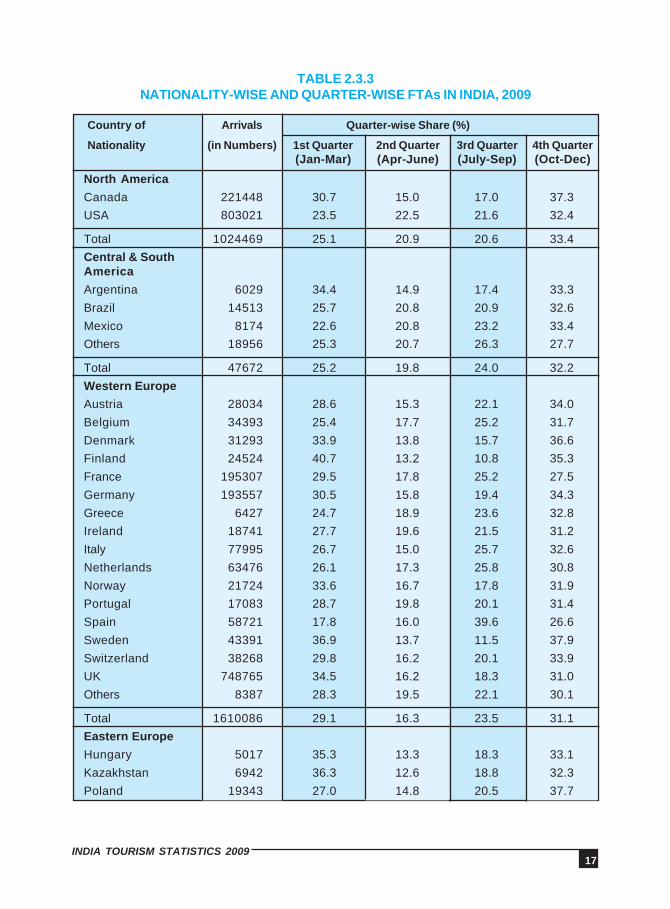
North America
Canada 221448 30.7 15.0 17.0 37.3USA 803021 23.5 22.5 21.6 32.4
Total 1024469 25.1 20.9 20.6 33.4Central & SouthAmerica
Argentina 6029 34.4 14.9 17.4 33.3Brazil 14513 25.7 20.8 20.9 32.6Mexico 8174 22.6 20.8 23.2 33.4Others 18956 25.3 20.7 26.3 27.7
Total 47672 25.2 19.8 24.0 32.2Western Europe
Austria 28034 28.6 15.3 22.1 34.0Belgium 34393 25.4 17.7 25.2 31.7Denmark 31293 33.9 13.8 15.7 36.6Finland 24524 40.7 13.2 10.8 35.3France 195307 29.5 17.8 25.2 27.5Germany 193557 30.5 15.8 19.4 34.3Greece 6427 24.7 18.9 23.6 32.8Ireland 18741 27.7 19.6 21.5 31.2Italy 77995 26.7 15.0 25.7 32.6Netherlands 63476 26.1 17.3 25.8 30.8Norway 21724 33.6 16.7 17.8 31.9Portugal 17083 28.7 19.8 20.1 31.4Spain 58721 17.8 16.0 39.6 26.6Sweden 43391 36.9 13.7 11.5 37.9Switzerland 38268 29.8 16.2 20.1 33.9UK 748765 34.5 16.2 18.3 31.0Others 8387 28.3 19.5 22.1 30.1
Total 1610086 29.1 16.3 23.5 31.1Eastern Europe
Hungary 5017 35.3 13.3 18.3 33.1Kazakhstan 6942 36.3 12.6 18.8 32.3Poland 19343 27.0 14.8 20.5 37.7
Country of Arrivals Quarter-wise Share (%)
Nationality (in Numbers) 1st Quarter 2nd Quarter 3rd Quarter 4th Quarter(Jan-Mar) (Apr-June) (July-Sep) (Oct-Dec)
TABLE 2.3.3NATIONALITY-WISE AND QUARTER-WISE FTAs IN INDIA, 2009
18INDIA TOURISM STATISTICS 2009
Country of Arrivals Quarter-wise Share (%)
Nationality (in Numbers) 1st Quarter 2nd Quarter 3rd Quarter 4th Quarter(Jan-Mar) (Apr-June) (July-Sep) (Oct-Dec)
Russian Fed. 97705 40.0 9.1 8.1 42.8Ukraine 11653 32.1 17.6 17.4 32.9Others 42183 31.8 17.5 18.4 32.3
Total 182843 36.0 12.3 13.2 38.5Africa
Egypt 6274 27.1 22.7 21.8 28.4Kenya 24365 23.4 19.7 21.4 35.5Mauritius 18397 26.6 19.2 26.1 28.1Nigeria 17737 21.8 22.2 26.2 29.8South Africa 43947 23.4 18.2 17.9 40.5Tanzania 16056 0.0 0.0 0.0 100.0Others 39098 25.5 19.4 24.6 30.5
Total 165874 24.0 19.8 24.0 32.2West Asia
Bahrain 7694 22.2 23.8 32.8 21.2Israel 40567 23.0 19.6 30.3 27.1Oman 32620 23.8 28.1 27.9 20.2Saudi Arabia 16519 22.9 23.3 32.3 12.5Turkey 10750 30.0 18.5 19.6 31.9UAE 43031 17.6 27.5 37.8 17.1Yemen Arab Rep. 12540 24.8 23.1 26.3 25.8Others 37389 24.6 21.5 26.4 27.5
Total 201110 22.0 23.8 30.6 23.6South Asia
Afghanistan 50762 27.9 21.4 22.1 28.6Iran 35379 33.2 15.4 23.2 28.2Maldives 56863 24.8 26.3 17.8 31.1Nepal 87487 27.1 23.8 23.9 25.2Pakistan 45628 12.8 25.4 25.2 36.6Bangladesh 458063 24.6 27.7 25.6 22.1Sri Lanka 240836 24.7 19.4 29.4 26. 5Bhutan 7615 29.7 19.9 26.9 23.5
Total 982633 24.8 24.4. 25.6 25.2South East Asia
Indonesia 18791 22.8 22.1 24.4 30.7Malaysia 134340 23.4 18.0 21.5 37.1Myanmar 10698 35.9 18.1 15.8 30.2
19INDIA TOURISM STATISTICS 2009
Country of Arrivals Quarter-wise Share (%)
Nationality (in Numbers) 1st Quarter 2nd Quarter 3rd Quarter 4th Quarter(Jan-Mar) (Apr-June) (July-Sep) (Oct-Dec)
Philippines 20173 25.6 24.6 24.3 25.5Singapore 94754 21.5 22.6 20.7 35. 2Thailand 62593 35.5 17.6 17.2 29.7Others 7146 24.7 17.6 21.0 36.7
Total 348495 25.6 19.7 20.7 34.0East Asia
China (Main) 96997 24.2 23.2 23.4 29.2China (Taiwan) 24915 24.7 20.9 25.9 28.5Japan 124219 23.1 19.3 28.1 29.5Rep. of Korea 69316 24.3 19.3 28.7 27.7Others 2845 21.8 13.9 27.2 37.1
Total 318292 36.0 12.3 13.2 38.5Australasia
Australia 148846 23.4 17.4 19.8 39.4New Zealand 30305 23.1 17.6 19.0 40.3Others 2698 26.3 20.3 21.0 32.4
Total 181849 24.2 18.1 20.2 37.5
Others 44963 14.3 13.5 15.7 56.5
Stateless 293 28.4 23.5 20.3 27.8
Grand Total 5108579 27.2 19.3 21.8 31.7
Source:-Bureau of Immigration, India
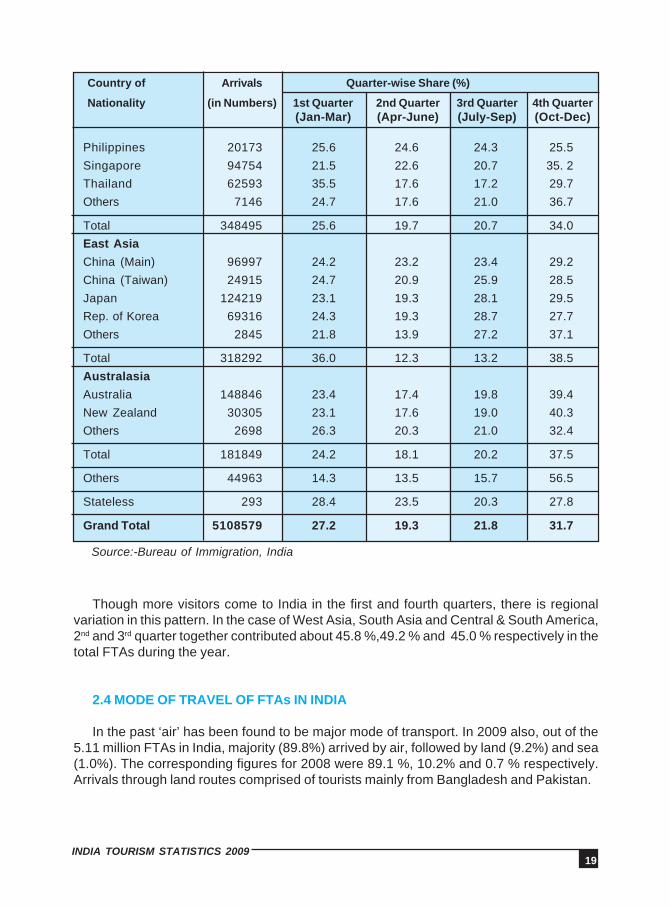
Though more visitors come to India in the first and fourth quarters, there is regionalvariation in this pattern. In the case of West Asia, South Asia and Central & South America,2nd and 3rd quarter together contributed about 45.8 %,49.2 % and 45.0 % respectively in thetotal FTAs during the year.
2.4 MODE OF TRAVEL OF FTAs IN INDIA
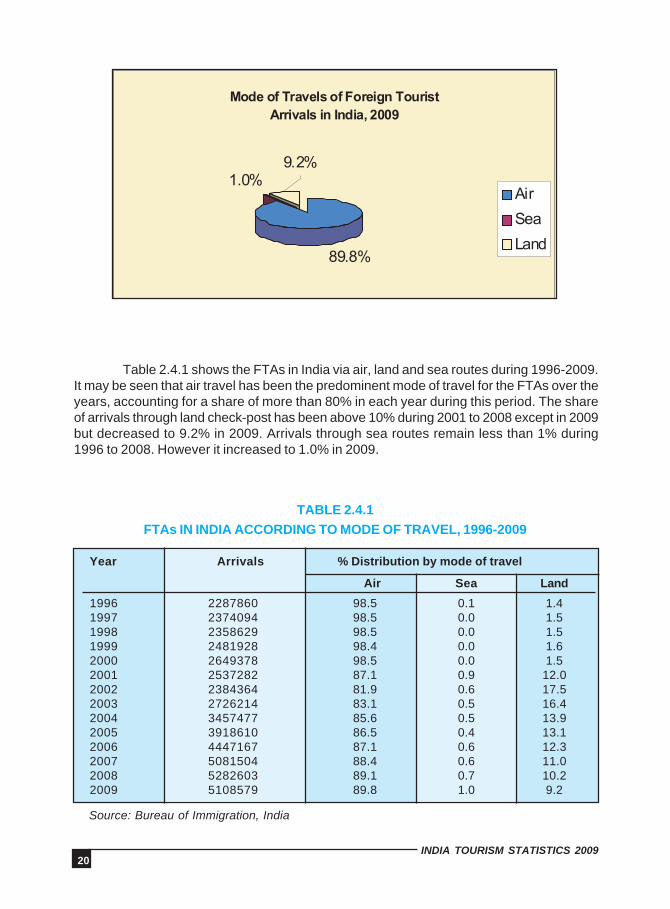
In the past ‘air’ has been found to be major mode of transport. In 2009 also, out of the5.11 million FTAs in India, majority (89.8%) arrived by air, followed by land (9.2%) and sea(1.0%). The corresponding figures for 2008 were 89.1 %, 10.2% and 0.7 % respectively.Arrivals through land routes comprised of tourists mainly from Bangladesh and Pakistan.
20INDIA TOURISM STATISTICS 2009
TABLE 2.4.1FTAs IN INDIA ACCORDING TO MODE OF TRAVEL, 1996-2009
Year Arrivals % Distribution by mode of travel
Air Sea Land
1996 2287860 98.5 0.1 1.41997 2374094 98.5 0.0 1.51998 2358629 98.5 0.0 1.51999 2481928 98.4 0.0 1.62000 2649378 98.5 0.0 1.52001 2537282 87.1 0.9 12.02002 2384364 81.9 0.6 17.52003 2726214 83.1 0.5 16.42004 3457477 85.6 0.5 13.92005 3918610 86.5 0.4 13.12006 4447167 87.1 0.6 12.32007 5081504 88.4 0.6 11.02008 5282603 89.1 0.7 10.22009 5108579 89.8 1.0 9.2
Source: Bureau of Immigration, India
Table 2.4.1 shows the FTAs in India via air, land and sea routes during 1996-2009.It may be seen that air travel has been the predominent mode of travel for the FTAs over theyears, accounting for a share of more than 80% in each year during this period. The shareof arrivals through land check-post has been above 10% during 2001 to 2008 except in 2009but decreased to 9.2% in 2009. Arrivals through sea routes remain less than 1% during1996 to 2008. However it increased to 1.0% in 2009.
21INDIA TOURISM STATISTICS 2009
Share in total arrivals fromCountry of Nationality Arrivals the country (%)
(in Numbers) Air Sea Land
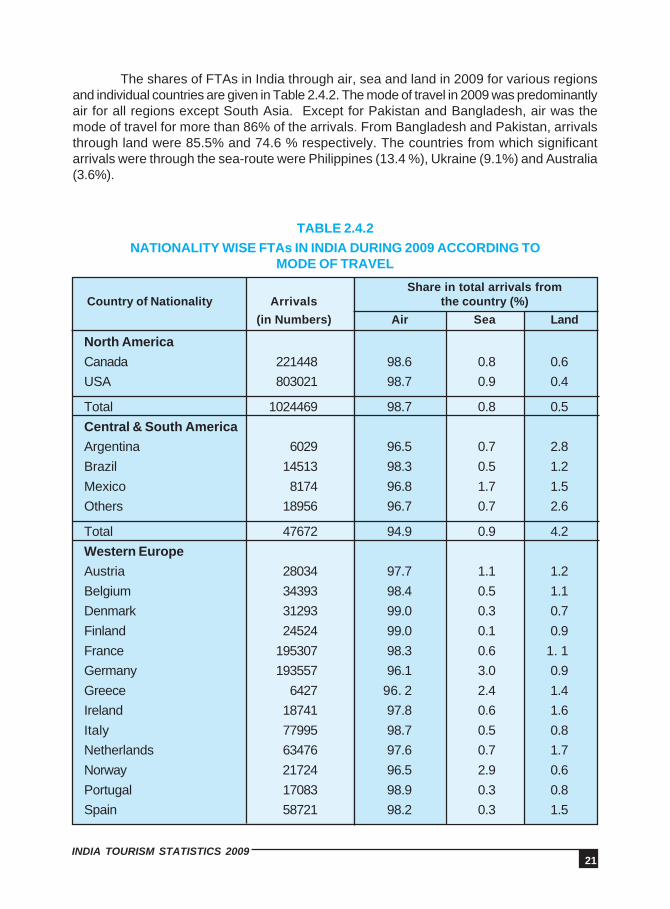
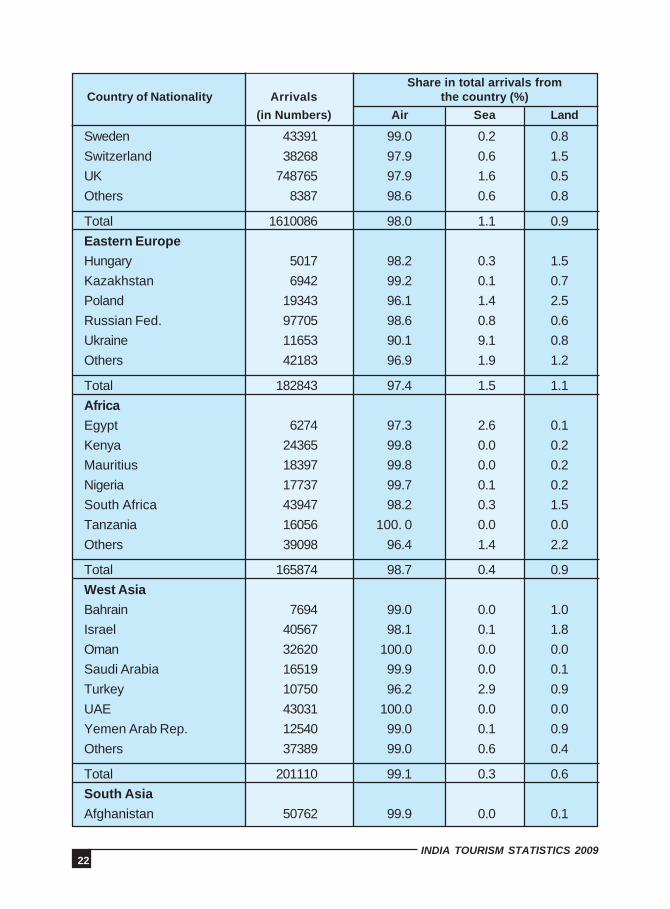
The shares of FTAs in India through air, sea and land in 2009 for various regionsand individual countries are given in Table 2.4.2. The mode of travel in 2009 was predominantlyair for all regions except South Asia. Except for Pakistan and Bangladesh, air was themode of travel for more than 86% of the arrivals. From Bangladesh and Pakistan, arrivalsthrough land were 85.5% and 74.6 % respectively. The countries from which significantarrivals were through the sea-route were Philippines (13.4 %), Ukraine (9.1%) and Australia(3.6%).
TABLE 2.4.2NATIONALITY WISE FTAs IN INDIA DURING 2009 ACCORDING TO
MODE OF TRAVEL
North America
Canada 221448 98.6 0.8 0.6USA 803021 98.7 0.9 0.4
Total 1024469 98.7 0.8 0.5Central & South America
Argentina 6029 96.5 0.7 2.8Brazil 14513 98.3 0.5 1.2Mexico 8174 96.8 1.7 1.5Others 18956 96.7 0.7 2.6
Total 47672 94.9 0.9 4.2Western Europe
Austria 28034 97.7 1.1 1.2Belgium 34393 98.4 0.5 1.1Denmark 31293 99.0 0.3 0.7Finland 24524 99.0 0.1 0.9France 195307 98.3 0.6 1. 1Germany 193557 96.1 3.0 0.9Greece 6427 96. 2 2.4 1.4Ireland 18741 97.8 0.6 1.6Italy 77995 98.7 0.5 0.8Netherlands 63476 97.6 0.7 1.7Norway 21724 96.5 2.9 0.6Portugal 17083 98.9 0.3 0.8Spain 58721 98.2 0.3 1.5
22INDIA TOURISM STATISTICS 2009
Share in total arrivals fromCountry of Nationality Arrivals the country (%)
(in Numbers) Air Sea Land
Sweden 43391 99.0 0.2 0.8Switzerland 38268 97.9 0.6 1.5UK 748765 97.9 1.6 0.5Others 8387 98.6 0.6 0.8
Total 1610086 98.0 1.1 0.9Eastern Europe
Hungary 5017 98.2 0.3 1.5Kazakhstan 6942 99.2 0.1 0.7Poland 19343 96.1 1.4 2.5Russian Fed. 97705 98.6 0.8 0.6Ukraine 11653 90.1 9.1 0.8Others 42183 96.9 1.9 1.2
Total 182843 97.4 1.5 1.1Africa
Egypt 6274 97.3 2.6 0.1Kenya 24365 99.8 0.0 0.2Mauritius 18397 99.8 0.0 0.2Nigeria 17737 99.7 0.1 0.2South Africa 43947 98.2 0.3 1.5Tanzania 16056 100. 0 0.0 0.0Others 39098 96.4 1.4 2.2
Total 165874 98.7 0.4 0.9West Asia
Bahrain 7694 99.0 0.0 1.0Israel 40567 98.1 0.1 1.8Oman 32620 100.0 0.0 0.0Saudi Arabia 16519 99.9 0.0 0.1Turkey 10750 96.2 2.9 0.9UAE 43031 100.0 0.0 0.0Yemen Arab Rep. 12540 99.0 0.1 0.9Others 37389 99.0 0.6 0.4
Total 201110 99.1 0.3 0.6South Asia
Afghanistan 50762 99.9 0.0 0.1

23INDIA TOURISM STATISTICS 2009
Share in total arrivals fromCountry of Nationality Arrivals the country (%)
(in Numbers) Air Sea Land
Iran 35379 99.2 0.5 0.3Maldives 56863 99.9 0.1 0.0Nepal 87487 98.9 0.0 1.1Pakistan 45628 25.2 0.2 74.6Bangladesh 458063 14.5 0.0 85.5Sri Lanka 240836 99.7 0.1 0.2Bhutan 7615 99.8 0.0 0.2
Total 982633 56.4 0.1 43.5South East Asia
Indonesia 18791 96.6 3.2 0.2Malaysia 134340 99.6 0. 2 0.2Myanmar 10698 95.0 2.6 2.4Philippines 20173 86.2 13.4 0.4Singapore 94754 99.6 0.2 0.2Thailand 62593 98.0 0.3 1.7Others 7146 97.6 0.3 2.1
Total 348495 98.2 1.2 0.6East Asia
China (Main) 96997 98.8 0.4 0.8China (Taiwan) 24915 98.6 0.0 1.4Japan 124219 97.7 0.6 1.7Rep. of Korea 69316 96.6 0.2 3.2Others 2845 97.3 0.7 2.0
Total 318292 97.9 0.4 1.7
Australasia
Australia 148846 95.4 3.6 1.0New Zealand 30305 97.0 2.1 0.9Others 2698 99.1 0.1 0.8
Total 181849 97.6 1.7 0.7Others 44963 54.3 19.9 25.8
Stateless 293 100.00 0.0 0.0
Grand Total 5108579 89.8. 1.0 9.2
Source: Bureau of Immigration, India
24INDIA TOURISM STATISTICS 2009
2.5 PORT OF ENTRY OF FTAs IN INDIA
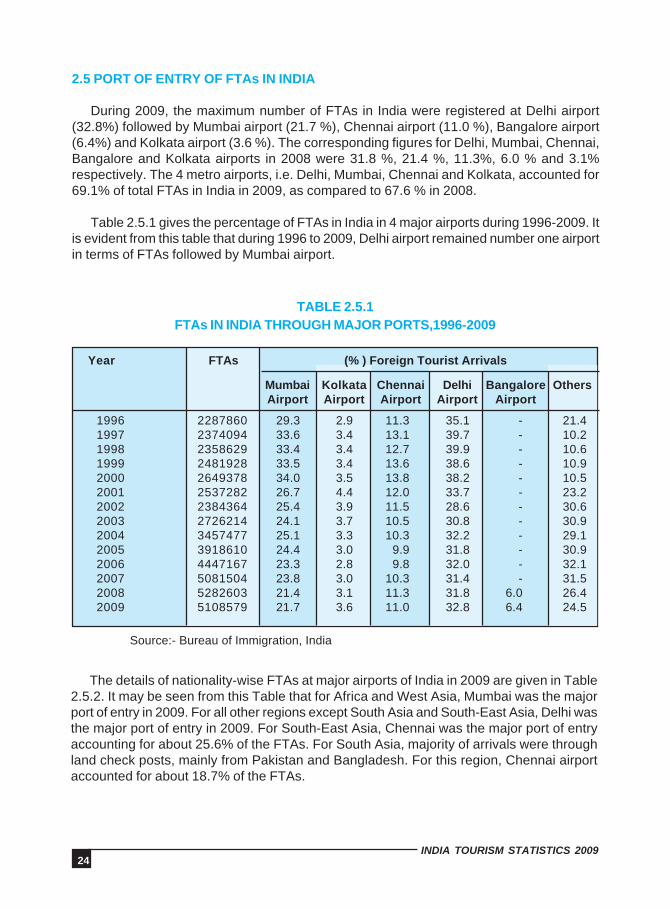
During 2009, the maximum number of FTAs in India were registered at Delhi airport(32.8%) followed by Mumbai airport (21.7 %), Chennai airport (11.0 %), Bangalore airport(6.4%) and Kolkata airport (3.6 %). The corresponding figures for Delhi, Mumbai, Chennai,Bangalore and Kolkata airports in 2008 were 31.8 %, 21.4 %, 11.3%, 6.0 % and 3.1%respectively. The 4 metro airports, i.e. Delhi, Mumbai, Chennai and Kolkata, accounted for69.1% of total FTAs in India in 2009, as compared to 67.6 % in 2008.
Table 2.5.1 gives the percentage of FTAs in India in 4 major airports during 1996-2009. Itis evident from this table that during 1996 to 2009, Delhi airport remained number one airportin terms of FTAs followed by Mumbai airport.
TABLE 2.5.1FTAs IN INDIA THROUGH MAJOR PORTS,1996-2009
Year FTAs (% ) Foreign Tourist Arrivals
Mumbai Kolkata Chennai Delhi Bangalore OthersAirport Airport Airport Airport Airport
1996 2287860 29.3 2.9 11.3 35.1 - 21.41997 2374094 33.6 3.4 13.1 39.7 - 10.21998 2358629 33.4 3.4 12.7 39.9 - 10.61999 2481928 33.5 3.4 13.6 38.6 - 10.92000 2649378 34.0 3.5 13.8 38.2 - 10.52001 2537282 26.7 4.4 12.0 33.7 - 23.22002 2384364 25.4 3.9 11.5 28.6 - 30.62003 2726214 24.1 3.7 10.5 30.8 - 30.92004 3457477 25.1 3.3 10.3 32.2 - 29.12005 3918610 24.4 3.0 9.9 31.8 - 30.92006 4447167 23.3 2.8 9.8 32.0 - 32.12007 5081504 23.8 3.0 10.3 31.4 - 31.52008 5282603 21.4 3.1 11.3 31.8 6.0 26.42009 5108579 21.7 3.6 11.0 32.8 6.4 24.5
Source:- Bureau of Immigration, India
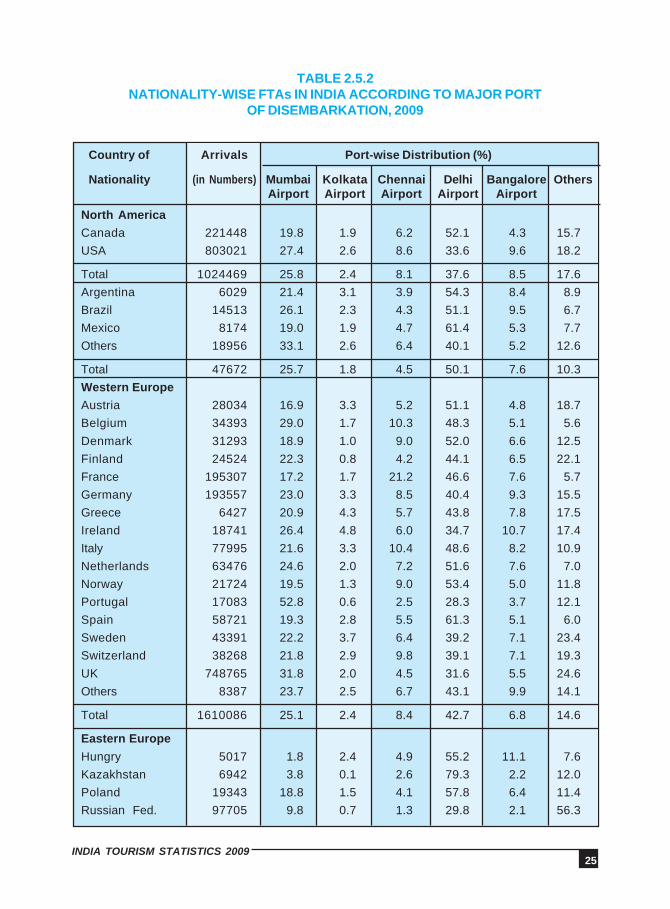
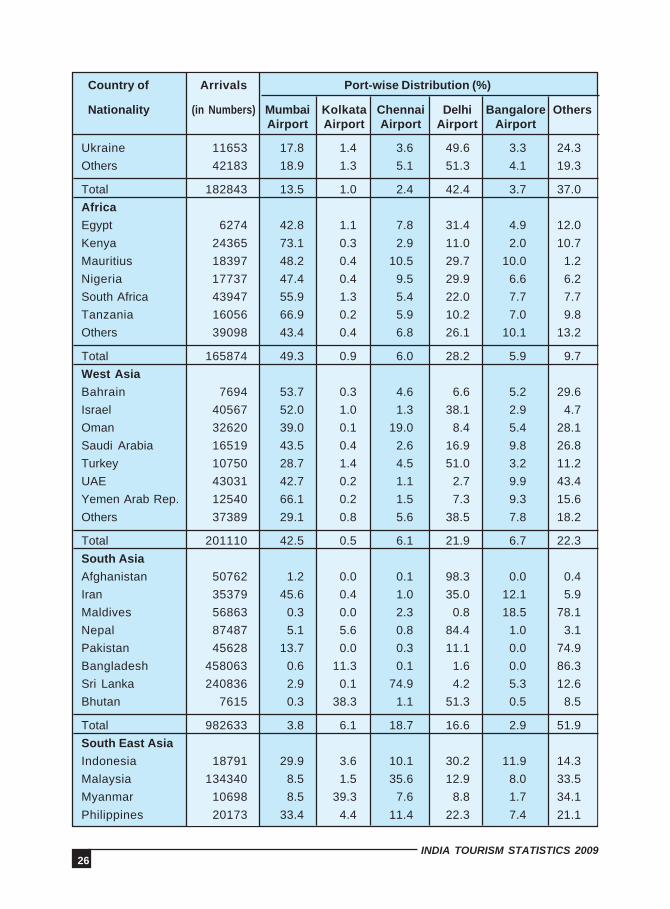
The details of nationality-wise FTAs at major airports of India in 2009 are given in Table2.5.2. It may be seen from this Table that for Africa and West Asia, Mumbai was the majorport of entry in 2009. For all other regions except South Asia and South-East Asia, Delhi wasthe major port of entry in 2009. For South-East Asia, Chennai was the major port of entryaccounting for about 25.6% of the FTAs. For South Asia, majority of arrivals were throughland check posts, mainly from Pakistan and Bangladesh. For this region, Chennai airportaccounted for about 18.7% of the FTAs.
25INDIA TOURISM STATISTICS 2009
Country of Arrivals Port-wise Distribution (%)
Nationality (in Numbers) Mumbai Kolkata Chennai Delhi Bangalore OthersAirport Airport Airport Airport Airport
TABLE 2.5.2NATIONALITY-WISE FTAs IN INDIA ACCORDING TO MAJOR PORT
OF DISEMBARKATION, 2009
North America
Canada 221448 19.8 1.9 6.2 52.1 4.3 15.7USA 803021 27.4 2.6 8.6 33.6 9.6 18.2
Total 1024469 25.8 2.4 8.1 37.6 8.5 17.6Argentina 6029 21.4 3.1 3.9 54.3 8.4 8.9Brazil 14513 26.1 2.3 4.3 51.1 9.5 6.7Mexico 8174 19.0 1.9 4.7 61.4 5.3 7.7Others 18956 33.1 2.6 6.4 40.1 5.2 12.6
Total 47672 25.7 1.8 4.5 50.1 7.6 10.3Western Europe
Austria 28034 16.9 3.3 5.2 51.1 4.8 18.7Belgium 34393 29.0 1.7 10.3 48.3 5.1 5.6Denmark 31293 18.9 1.0 9.0 52.0 6.6 12.5Finland 24524 22.3 0.8 4.2 44.1 6.5 22.1France 195307 17.2 1.7 21.2 46.6 7.6 5.7Germany 193557 23.0 3.3 8.5 40.4 9.3 15.5Greece 6427 20.9 4.3 5.7 43.8 7.8 17.5Ireland 18741 26.4 4.8 6.0 34.7 10.7 17.4Italy 77995 21.6 3.3 10.4 48.6 8.2 10.9Netherlands 63476 24.6 2.0 7.2 51.6 7.6 7.0Norway 21724 19.5 1.3 9.0 53.4 5.0 11.8Portugal 17083 52.8 0.6 2.5 28.3 3.7 12.1Spain 58721 19.3 2.8 5.5 61.3 5.1 6.0Sweden 43391 22.2 3.7 6.4 39.2 7.1 23.4Switzerland 38268 21.8 2.9 9.8 39.1 7.1 19.3UK 748765 31.8 2.0 4.5 31.6 5.5 24.6Others 8387 23.7 2.5 6.7 43.1 9.9 14.1
Total 1610086 25.1 2.4 8.4 42.7 6.8 14.6
Eastern Europe
Hungry 5017 1.8 2.4 4.9 55.2 11.1 7.6Kazakhstan 6942 3.8 0.1 2.6 79.3 2.2 12.0Poland 19343 18.8 1.5 4.1 57.8 6.4 11.4Russian Fed. 97705 9.8 0.7 1.3 29.8 2.1 56.3
26INDIA TOURISM STATISTICS 2009
Country of Arrivals Port-wise Distribution (%)
Nationality (in Numbers) Mumbai Kolkata Chennai Delhi Bangalore OthersAirport Airport Airport Airport Airport
Ukraine 11653 17.8 1.4 3.6 49.6 3.3 24.3Others 42183 18.9 1.3 5.1 51.3 4.1 19.3
Total 182843 13.5 1.0 2.4 42.4 3.7 37.0Africa
Egypt 6274 42.8 1.1 7.8 31.4 4.9 12.0Kenya 24365 73.1 0.3 2.9 11.0 2.0 10.7Mauritius 18397 48.2 0.4 10.5 29.7 10.0 1.2Nigeria 17737 47.4 0.4 9.5 29.9 6.6 6.2South Africa 43947 55.9 1.3 5.4 22.0 7.7 7.7Tanzania 16056 66.9 0.2 5.9 10.2 7.0 9.8Others 39098 43.4 0.4 6.8 26.1 10.1 13.2
Total 165874 49.3 0.9 6.0 28.2 5.9 9.7West Asia
Bahrain 7694 53.7 0.3 4.6 6.6 5.2 29.6Israel 40567 52.0 1.0 1.3 38.1 2.9 4.7Oman 32620 39.0 0.1 19.0 8.4 5.4 28.1Saudi Arabia 16519 43.5 0.4 2.6 16.9 9.8 26.8Turkey 10750 28.7 1.4 4.5 51.0 3.2 11.2UAE 43031 42.7 0.2 1.1 2.7 9.9 43.4Yemen Arab Rep. 12540 66.1 0.2 1.5 7.3 9.3 15.6Others 37389 29.1 0.8 5.6 38.5 7.8 18.2
Total 201110 42.5 0.5 6.1 21.9 6.7 22.3South Asia
Afghanistan 50762 1.2 0.0 0.1 98.3 0.0 0.4Iran 35379 45.6 0.4 1.0 35.0 12.1 5.9Maldives 56863 0.3 0.0 2.3 0.8 18.5 78.1Nepal 87487 5.1 5.6 0.8 84.4 1.0 3.1Pakistan 45628 13.7 0.0 0.3 11.1 0.0 74.9Bangladesh 458063 0.6 11.3 0.1 1.6 0.0 86.3Sri Lanka 240836 2.9 0.1 74.9 4.2 5.3 12.6Bhutan 7615 0.3 38.3 1.1 51.3 0.5 8.5
Total 982633 3.8 6.1 18.7 16.6 2.9 51.9South East Asia
Indonesia 18791 29.9 3.6 10.1 30.2 11.9 14.3Malaysia 134340 8.5 1.5 35.6 12.9 8.0 33.5Myanmar 10698 8.5 39.3 7.6 8.8 1.7 34.1Philippines 20173 33.4 4.4 11.4 22.3 7.4 21.1
27INDIA TOURISM STATISTICS 2009
Country of Arrivals Port-wise Distribution (%)
Nationality (in Numbers) Mumbai Kolkata Chennai Delhi Bangalore OthersAirport Airport Airport Airport Airport
Source: Bureau of Immigration, India
Singapore 94754 18.3 2.7 34.6 19.6 10.7 14.1Thailand 62593 11.9 20.9 4.7 34.5 7.9 20.1Others 7146 12.1 7.9 17.8 35.3 17.9 9.0
Total 348495 14.5 7.0 25.6 20.6 8.6 23.7East Asia
China (Main) 96997 27.4 14.4 6.0 40.8 7.0 4.4China (Taiwan) 24915 12.1 4.5 8.1 60.6 9.1 5.6Japan 124219 13.9 4.9 7.9 59.9 8.1 5.3Rep. of Korea 69316 19.7 4.4 17.0 44.5 8.1 6.3Others 2845 35.6 5.6 19.1 27.8 4.4 7.5
Total 318292 19.2 7.6 9.3 50.9 7.8 5.2Australasia
Australia 148846 25.2 4.1 11.2 35.7 9.4 14.4New Zealand 30305 32.4 3.6 7.8 34.6 6.7 14.9Others 2698 35.8 0.5 8.9 33.7 5.9 15.2
Total 181849 37.5 2.4 7.4 33.9 5.8 13.0Others 44963 16.6 0.1 3.3 33.0 1.0 46.0
Stateless 293 2.1 0.0 6.4 83.6 0.4 7.5
Grand Total 5108579 21.7 3.6 11.0 32.8 6.4 24.5
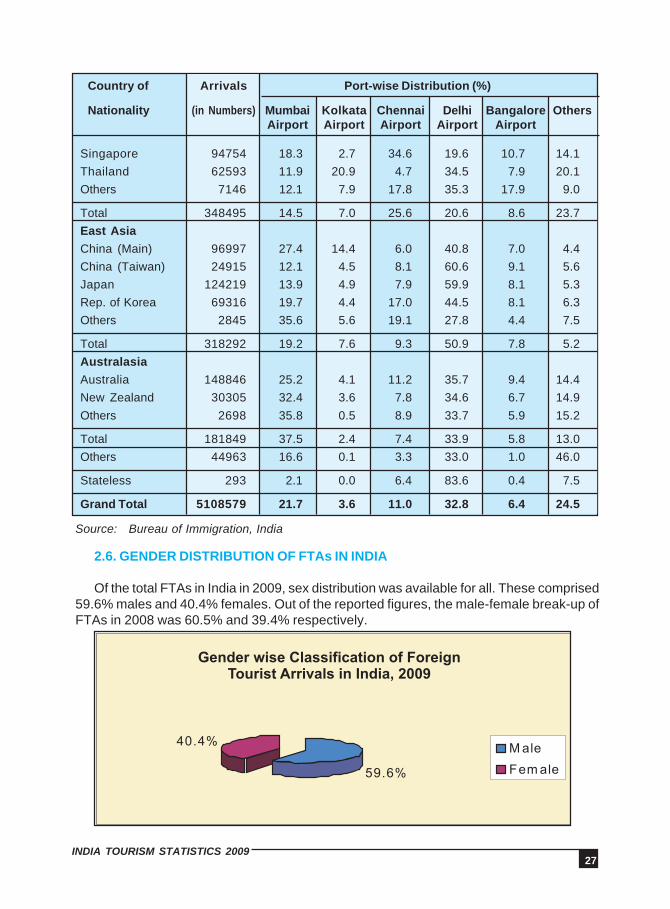
2.6. GENDER DISTRIBUTION OF FTAs IN INDIA
Of the total FTAs in India in 2009, sex distribution was available for all. These comprised59.6% males and 40.4% females. Out of the reported figures, the male-female break-up ofFTAs in 2008 was 60.5% and 39.4% respectively.
28INDIA TOURISM STATISTICS 2009
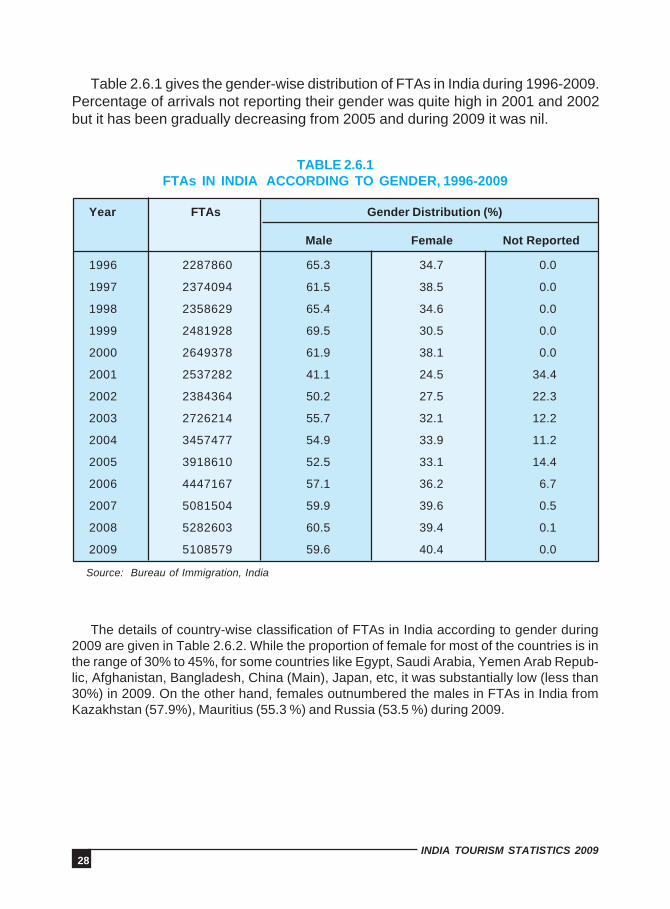
Table 2.6.1 gives the gender-wise distribution of FTAs in India during 1996-2009.Percentage of arrivals not reporting their gender was quite high in 2001 and 2002but it has been gradually decreasing from 2005 and during 2009 it was nil.
TABLE 2.6.1FTAs IN INDIA ACCORDING TO GENDER, 1996-2009
Year FTAs Gender Distribution (%)
Male Female Not Reported
1996 2287860 65.3 34.7 0.0
1997 2374094 61.5 38.5 0.0
1998 2358629 65.4 34.6 0.0
1999 2481928 69.5 30.5 0.0
2000 2649378 61.9 38.1 0.0
2001 2537282 41.1 24.5 34.4
2002 2384364 50.2 27.5 22.3
2003 2726214 55.7 32.1 12.2
2004 3457477 54.9 33.9 11.2
2005 3918610 52.5 33.1 14.4
2006 4447167 57.1 36.2 6.7
2007 5081504 59.9 39.6 0.5
2008 5282603 60.5 39.4 0.1
2009 5108579 59.6 40.4 0.0
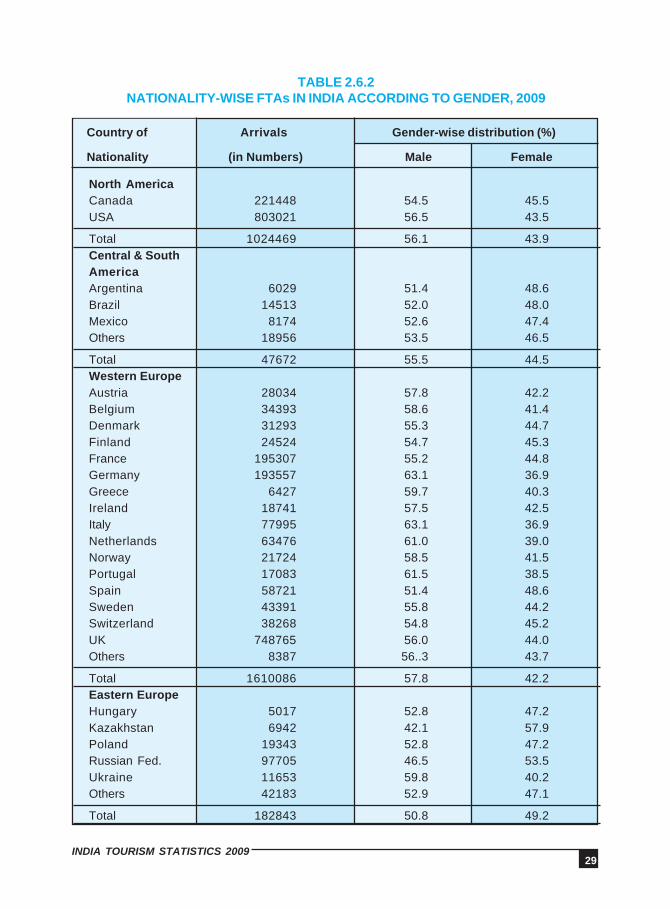
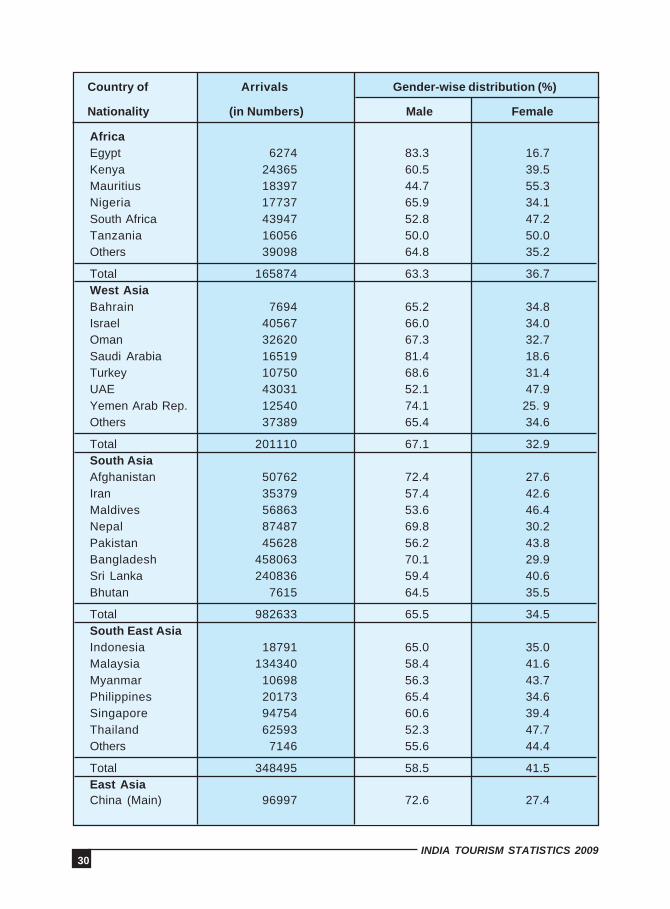
The details of country-wise classification of FTAs in India according to gender during2009 are given in Table 2.6.2. While the proportion of female for most of the countries is inthe range of 30% to 45%, for some countries like Egypt, Saudi Arabia, Yemen Arab Repub-lic, Afghanistan, Bangladesh, China (Main), Japan, etc, it was substantially low (less than30%) in 2009. On the other hand, females outnumbered the males in FTAs in India fromKazakhstan (57.9%), Mauritius (55.3 %) and Russia (53.5 %) during 2009.
Source: Bureau of Immigration, India
29INDIA TOURISM STATISTICS 2009
TABLE 2.6.2NATIONALITY-WISE FTAs IN INDIA ACCORDING TO GENDER, 2009
North AmericaCanada 221448 54.5 45.5USA 803021 56.5 43.5
Total 1024469 56.1 43.9Central & SouthAmericaArgentina 6029 51.4 48.6Brazil 14513 52.0 48.0Mexico 8174 52.6 47.4Others 18956 53.5 46.5
Total 47672 55.5 44.5Western EuropeAustria 28034 57.8 42.2Belgium 34393 58.6 41.4Denmark 31293 55.3 44.7Finland 24524 54.7 45.3France 195307 55.2 44.8Germany 193557 63.1 36.9Greece 6427 59.7 40.3Ireland 18741 57.5 42.5Italy 77995 63.1 36.9Netherlands 63476 61.0 39.0Norway 21724 58.5 41.5Portugal 17083 61.5 38.5Spain 58721 51.4 48.6Sweden 43391 55.8 44.2Switzerland 38268 54.8 45.2UK 748765 56.0 44.0Others 8387 56..3 43.7
Total 1610086 57.8 42.2Eastern EuropeHungary 5017 52.8 47.2Kazakhstan 6942 42.1 57.9Poland 19343 52.8 47.2Russian Fed. 97705 46.5 53.5Ukraine 11653 59.8 40.2Others 42183 52.9 47.1
Total 182843 50.8 49.2
Country of Arrivals Gender-wise distribution (%)
Nationality (in Numbers) Male Female
30INDIA TOURISM STATISTICS 2009
Country of Arrivals Gender-wise distribution (%)
Nationality (in Numbers) Male Female
AfricaEgypt 6274 83.3 16.7Kenya 24365 60.5 39.5Mauritius 18397 44.7 55.3Nigeria 17737 65.9 34.1South Africa 43947 52.8 47.2Tanzania 16056 50.0 50.0Others 39098 64.8 35.2
Total 165874 63.3 36.7West AsiaBahrain 7694 65.2 34.8Israel 40567 66.0 34.0Oman 32620 67.3 32.7Saudi Arabia 16519 81.4 18.6Turkey 10750 68.6 31.4UAE 43031 52.1 47.9Yemen Arab Rep. 12540 74.1 25. 9Others 37389 65.4 34.6
Total 201110 67.1 32.9South AsiaAfghanistan 50762 72.4 27.6Iran 35379 57.4 42.6Maldives 56863 53.6 46.4Nepal 87487 69.8 30.2Pakistan 45628 56.2 43.8Bangladesh 458063 70.1 29.9Sri Lanka 240836 59.4 40.6Bhutan 7615 64.5 35.5
Total 982633 65.5 34.5South East AsiaIndonesia 18791 65.0 35.0Malaysia 134340 58.4 41.6Myanmar 10698 56.3 43.7Philippines 20173 65.4 34.6Singapore 94754 60.6 39.4Thailand 62593 52.3 47.7Others 7146 55.6 44.4
Total 348495 58.5 41.5East AsiaChina (Main) 96997 72.6 27.4
31INDIA TOURISM STATISTICS 2009
Country of FTAs Gender-wise distribution (%)
Nationality (in Numbers) Male Female
2.7 AGE DISTRIBUTION OF FTAs IN INDIA
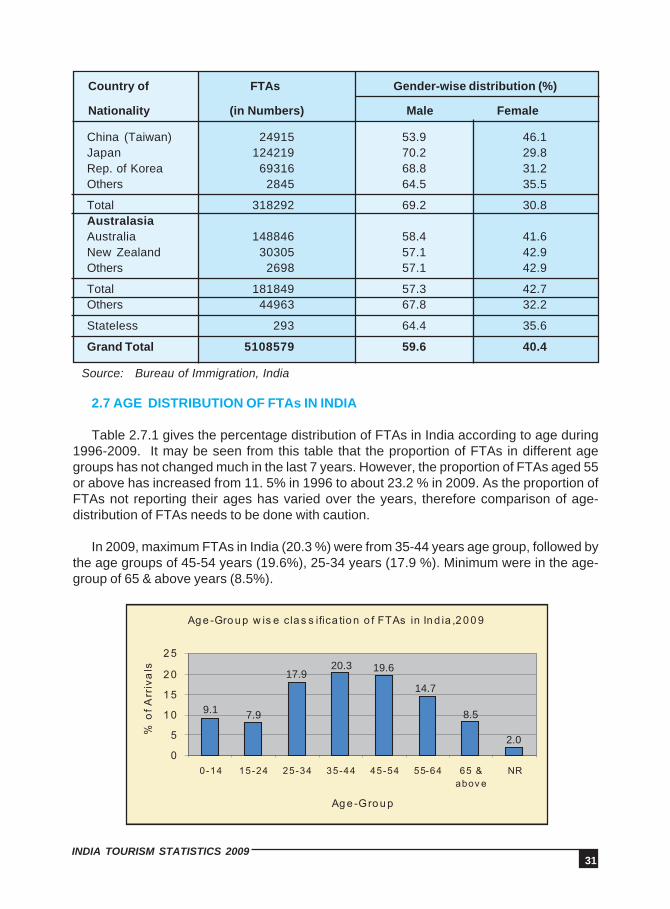
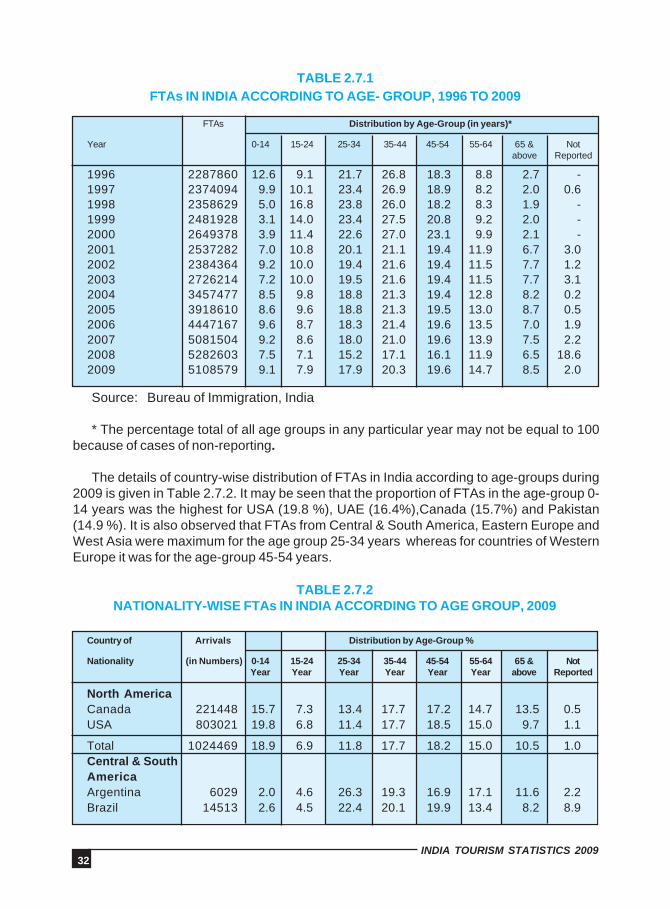
Table 2.7.1 gives the percentage distribution of FTAs in India according to age during1996-2009. It may be seen from this table that the proportion of FTAs in different agegroups has not changed much in the last 7 years. However, the proportion of FTAs aged 55or above has increased from 11. 5% in 1996 to about 23.2 % in 2009. As the proportion ofFTAs not reporting their ages has varied over the years, therefore comparison of age-distribution of FTAs needs to be done with caution.
In 2009, maximum FTAs in India (20.3 %) were from 35-44 years age group, followed bythe age groups of 45-54 years (19.6%), 25-34 years (17.9 %). Minimum were in the age-group of 65 & above years (8.5%).
Source: Bureau of Immigration, India
China (Taiwan) 24915 53.9 46.1Japan 124219 70.2 29.8Rep. of Korea 69316 68.8 31.2Others 2845 64.5 35.5
Total 318292 69.2 30.8AustralasiaAustralia 148846 58.4 41.6New Zealand 30305 57.1 42.9Others 2698 57.1 42.9
Total 181849 57.3 42.7Others 44963 67.8 32.2
Stateless 293 64.4 35.6
Grand Total 5108579 59.6 40.4
9.1 7.9
17.920.3 19.6
14.7
8.5
2.0
32INDIA TOURISM STATISTICS 2009
TABLE 2.7.1FTAs IN INDIA ACCORDING TO AGE- GROUP, 1996 TO 2009
FTAs Distribution by Age-Group (in years)*
Year 0-14 15-24 25-34 35-44 45-54 55-64 65 & Notabove Reported
1996 2287860 12.6 9.1 21.7 26.8 18.3 8.8 2.7 -1997 2374094 9.9 10.1 23.4 26.9 18.9 8.2 2.0 0.61998 2358629 5.0 16.8 23.8 26.0 18.2 8.3 1.9 -1999 2481928 3.1 14.0 23.4 27.5 20.8 9.2 2.0 -2000 2649378 3.9 11.4 22.6 27.0 23.1 9.9 2.1 -2001 2537282 7.0 10.8 20.1 21.1 19.4 11.9 6.7 3.02002 2384364 9.2 10.0 19.4 21.6 19.4 11.5 7.7 1.22003 2726214 7.2 10.0 19.5 21.6 19.4 11.5 7.7 3.12004 3457477 8.5 9.8 18.8 21.3 19.4 12.8 8.2 0.22005 3918610 8.6 9.6 18.8 21.3 19.5 13.0 8.7 0.52006 4447167 9.6 8.7 18.3 21.4 19.6 13.5 7.0 1.92007 5081504 9.2 8.6 18.0 21.0 19.6 13.9 7.5 2.22008 5282603 7.5 7.1 15.2 17.1 16.1 11.9 6.5 18.62009 5108579 9.1 7.9 17.9 20.3 19.6 14.7 8.5 2.0
Source: Bureau of Immigration, India
* The percentage total of all age groups in any particular year may not be equal to 100because of cases of non-reporting.
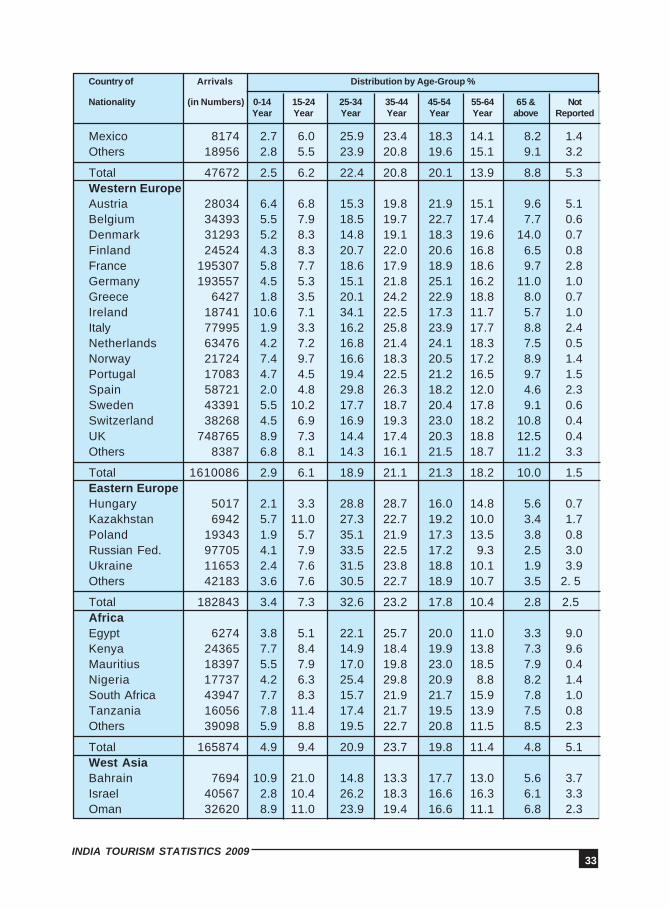
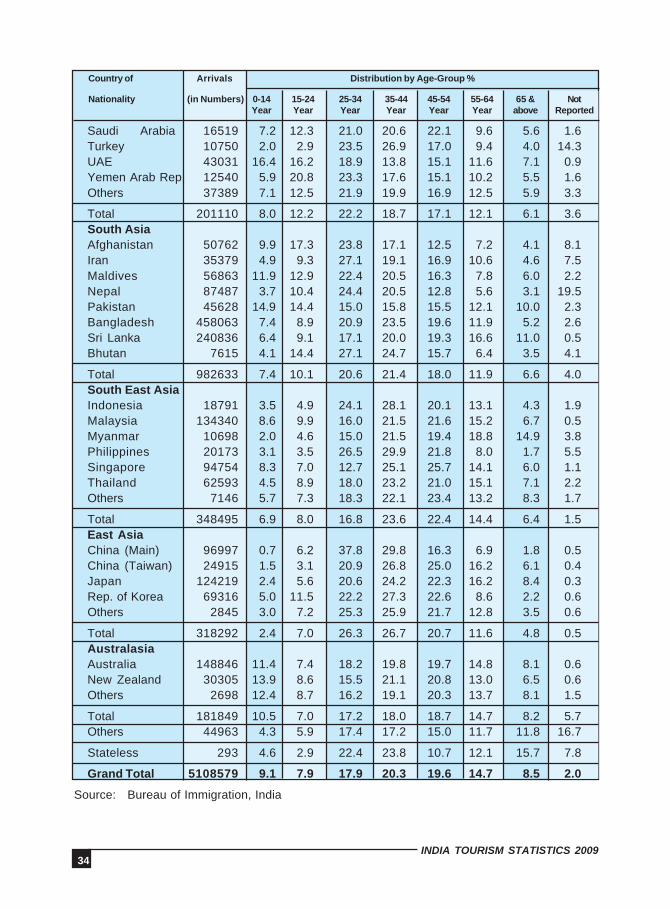
The details of country-wise distribution of FTAs in India according to age-groups during2009 is given in Table 2.7.2. It may be seen that the proportion of FTAs in the age-group 0-14 years was the highest for USA (19.8 %), UAE (16.4%),Canada (15.7%) and Pakistan(14.9 %). It is also observed that FTAs from Central & South America, Eastern Europe andWest Asia were maximum for the age group 25-34 years whereas for countries of WesternEurope it was for the age-group 45-54 years.
TABLE 2.7.2NATIONALITY-WISE FTAs IN INDIA ACCORDING TO AGE GROUP, 2009
Country of Arrivals Distribution by Age-Group %
Nationality (in Numbers) 0-14 15-24 25-34 35-44 45-54 55-64 65 & NotYear Year Year Year Year Year above Reported
North AmericaCanada 221448 15.7 7.3 13.4 17.7 17.2 14.7 13.5 0.5USA 803021 19.8 6.8 11.4 17.7 18.5 15.0 9.7 1.1
Total 1024469 18.9 6.9 11.8 17.7 18.2 15.0 10.5 1.0Central & SouthAmericaArgentina 6029 2.0 4.6 26.3 19.3 16.9 17.1 11.6 2.2Brazil 14513 2.6 4.5 22.4 20.1 19.9 13.4 8.2 8.9
33INDIA TOURISM STATISTICS 2009
Country of Arrivals Distribution by Age-Group %
Nationality (in Numbers) 0-14 15-24 25-34 35-44 45-54 55-64 65 & NotYear Year Year Year Year Year above Reported
Mexico 8174 2.7 6.0 25.9 23.4 18.3 14.1 8.2 1.4Others 18956 2.8 5.5 23.9 20.8 19.6 15.1 9.1 3.2
Total 47672 2.5 6.2 22.4 20.8 20.1 13.9 8.8 5.3Western EuropeAustria 28034 6.4 6.8 15.3 19.8 21.9 15.1 9.6 5.1Belgium 34393 5.5 7.9 18.5 19.7 22.7 17.4 7.7 0.6Denmark 31293 5.2 8.3 14.8 19.1 18.3 19.6 14.0 0.7Finland 24524 4.3 8.3 20.7 22.0 20.6 16.8 6.5 0.8France 195307 5.8 7.7 18.6 17.9 18.9 18.6 9.7 2.8Germany 193557 4.5 5.3 15.1 21.8 25.1 16.2 11.0 1.0Greece 6427 1.8 3.5 20.1 24.2 22.9 18.8 8.0 0.7Ireland 18741 10.6 7.1 34.1 22.5 17.3 11.7 5.7 1.0Italy 77995 1.9 3.3 16.2 25.8 23.9 17.7 8.8 2.4Netherlands 63476 4.2 7.2 16.8 21.4 24.1 18.3 7.5 0.5Norway 21724 7.4 9.7 16.6 18.3 20.5 17.2 8.9 1.4Portugal 17083 4.7 4.5 19.4 22.5 21.2 16.5 9.7 1.5Spain 58721 2.0 4.8 29.8 26.3 18.2 12.0 4.6 2.3Sweden 43391 5.5 10.2 17.7 18.7 20.4 17.8 9.1 0.6Switzerland 38268 4.5 6.9 16.9 19.3 23.0 18.2 10.8 0.4UK 748765 8.9 7.3 14.4 17.4 20.3 18.8 12.5 0.4Others 8387 6.8 8.1 14.3 16.1 21.5 18.7 11.2 3.3
Total 1610086 2.9 6.1 18.9 21.1 21.3 18.2 10.0 1.5Eastern EuropeHungary 5017 2.1 3.3 28.8 28.7 16.0 14.8 5.6 0.7Kazakhstan 6942 5.7 11.0 27.3 22.7 19.2 10.0 3.4 1.7Poland 19343 1.9 5.7 35.1 21.9 17.3 13.5 3.8 0.8Russian Fed. 97705 4.1 7.9 33.5 22.5 17.2 9.3 2.5 3.0Ukraine 11653 2.4 7.6 31.5 23.8 18.8 10.1 1.9 3.9Others 42183 3.6 7.6 30.5 22.7 18.9 10.7 3.5 2. 5
Total 182843 3.4 7.3 32.6 23.2 17.8 10.4 2.8 2.5AfricaEgypt 6274 3.8 5.1 22.1 25.7 20.0 11.0 3.3 9.0Kenya 24365 7.7 8.4 14.9 18.4 19.9 13.8 7.3 9.6Mauritius 18397 5.5 7.9 17.0 19.8 23.0 18.5 7.9 0.4Nigeria 17737 4.2 6.3 25.4 29.8 20.9 8.8 8.2 1.4South Africa 43947 7.7 8.3 15.7 21.9 21.7 15.9 7.8 1.0Tanzania 16056 7.8 11.4 17.4 21.7 19.5 13.9 7.5 0.8Others 39098 5.9 8.8 19.5 22.7 20.8 11.5 8.5 2.3
Total 165874 4.9 9.4 20.9 23.7 19.8 11.4 4.8 5.1West AsiaBahrain 7694 10.9 21.0 14.8 13.3 17.7 13.0 5.6 3.7Israel 40567 2.8 10.4 26.2 18.3 16.6 16.3 6.1 3.3Oman 32620 8.9 11.0 23.9 19.4 16.6 11.1 6.8 2.3
34INDIA TOURISM STATISTICS 2009
Country of Arrivals Distribution by Age-Group %
Nationality (in Numbers) 0-14 15-24 25-34 35-44 45-54 55-64 65 & NotYear Year Year Year Year Year above Reported
Saudi Arabia 16519 7.2 12.3 21.0 20.6 22.1 9.6 5.6 1.6Turkey 10750 2.0 2.9 23.5 26.9 17.0 9.4 4.0 14.3UAE 43031 16.4 16.2 18.9 13.8 15.1 11.6 7.1 0.9Yemen Arab Rep. 12540 5.9 20.8 23.3 17.6 15.1 10.2 5.5 1.6Others 37389 7.1 12.5 21.9 19.9 16.9 12.5 5.9 3.3
Total 201110 8.0 12.2 22.2 18.7 17.1 12.1 6.1 3.6South AsiaAfghanistan 50762 9.9 17.3 23.8 17.1 12.5 7.2 4.1 8.1Iran 35379 4.9 9.3 27.1 19.1 16.9 10.6 4.6 7.5Maldives 56863 11.9 12.9 22.4 20.5 16.3 7.8 6.0 2.2Nepal 87487 3.7 10.4 24.4 20.5 12.8 5.6 3.1 19.5Pakistan 45628 14.9 14.4 15.0 15.8 15.5 12.1 10.0 2.3Bangladesh 458063 7.4 8.9 20.9 23.5 19.6 11.9 5.2 2.6Sri Lanka 240836 6.4 9.1 17.1 20.0 19.3 16.6 11.0 0.5Bhutan 7615 4.1 14.4 27.1 24.7 15.7 6.4 3.5 4.1
Total 982633 7.4 10.1 20.6 21.4 18.0 11.9 6.6 4.0South East AsiaIndonesia 18791 3.5 4.9 24.1 28.1 20.1 13.1 4.3 1.9Malaysia 134340 8.6 9.9 16.0 21.5 21.6 15.2 6.7 0.5Myanmar 10698 2.0 4.6 15.0 21.5 19.4 18.8 14.9 3.8Philippines 20173 3.1 3.5 26.5 29.9 21.8 8.0 1.7 5.5Singapore 94754 8.3 7.0 12.7 25.1 25.7 14.1 6.0 1.1Thailand 62593 4.5 8.9 18.0 23.2 21.0 15.1 7.1 2.2Others 7146 5.7 7.3 18.3 22.1 23.4 13.2 8.3 1.7
Total 348495 6.9 8.0 16.8 23.6 22.4 14.4 6.4 1.5East AsiaChina (Main) 96997 0.7 6.2 37.8 29.8 16.3 6.9 1.8 0.5China (Taiwan) 24915 1.5 3.1 20.9 26.8 25.0 16.2 6.1 0.4Japan 124219 2.4 5.6 20.6 24.2 22.3 16.2 8.4 0.3Rep. of Korea 69316 5.0 11.5 22.2 27.3 22.6 8.6 2.2 0.6Others 2845 3.0 7.2 25.3 25.9 21.7 12.8 3.5 0.6
Total 318292 2.4 7.0 26.3 26.7 20.7 11.6 4.8 0.5AustralasiaAustralia 148846 11.4 7.4 18.2 19.8 19.7 14.8 8.1 0.6New Zealand 30305 13.9 8.6 15.5 21.1 20.8 13.0 6.5 0.6Others 2698 12.4 8.7 16.2 19.1 20.3 13.7 8.1 1.5
Total 181849 10.5 7.0 17.2 18.0 18.7 14.7 8.2 5.7Others 44963 4.3 5.9 17.4 17.2 15.0 11.7 11.8 16.7
Stateless 293 4.6 2.9 22.4 23.8 10.7 12.1 15.7 7.8
Grand Total 5108579 9.1 7.9 17.9 20.3 19.6 14.7 8.5 2.0
Source: Bureau of Immigration, India
35INDIA TOURISM STATISTICS 2009
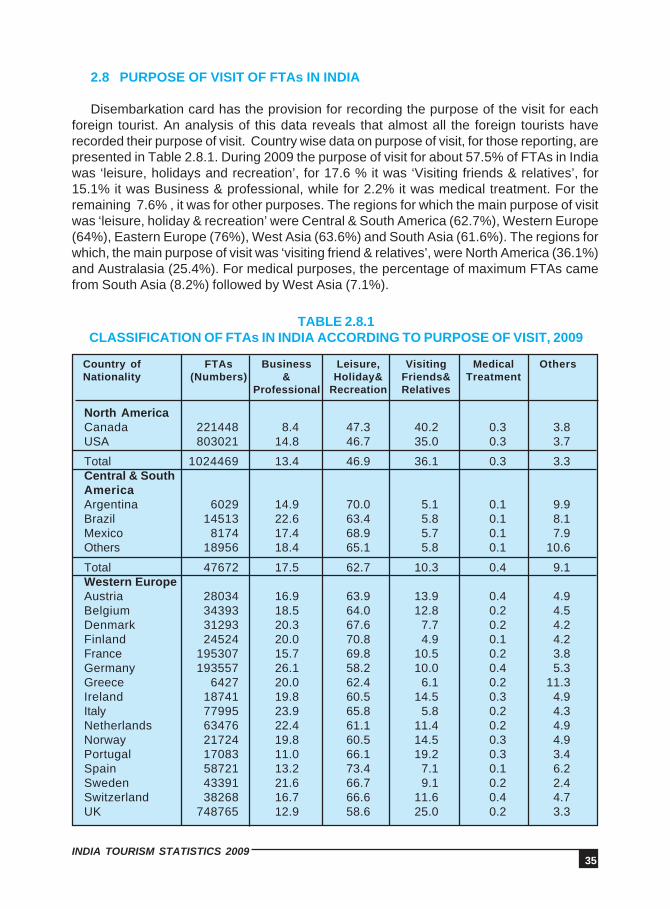
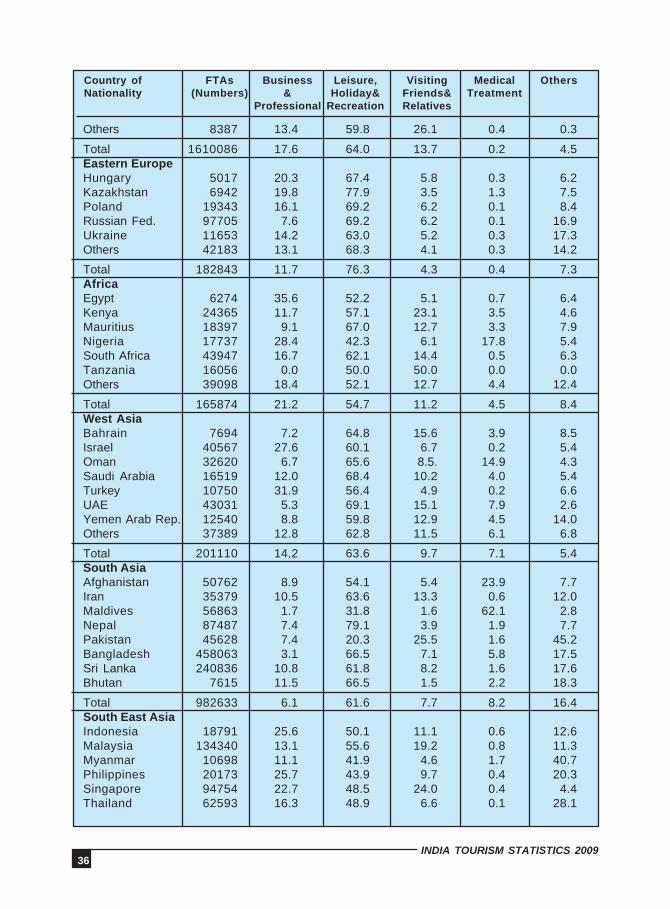
2.8 PURPOSE OF VISIT OF FTAs IN INDIA
Disembarkation card has the provision for recording the purpose of the visit for eachforeign tourist. An analysis of this data reveals that almost all the foreign tourists haverecorded their purpose of visit. Country wise data on purpose of visit, for those reporting, arepresented in Table 2.8.1. During 2009 the purpose of visit for about 57.5% of FTAs in Indiawas ‘leisure, holidays and recreation’, for 17.6 % it was ‘Visiting friends & relatives’, for15.1% it was Business & professional, while for 2.2% it was medical treatment. For theremaining 7.6% , it was for other purposes. The regions for which the main purpose of visitwas ‘leisure, holiday & recreation’ were Central & South America (62.7%), Western Europe(64%), Eastern Europe (76%), West Asia (63.6%) and South Asia (61.6%). The regions forwhich, the main purpose of visit was ‘visiting friend & relatives’, were North America (36.1%)and Australasia (25.4%). For medical purposes, the percentage of maximum FTAs camefrom South Asia (8.2%) followed by West Asia (7.1%).
TABLE 2.8.1CLASSIFICATION OF FTAs IN INDIA ACCORDING TO PURPOSE OF VISIT, 2009
Country of FTAs Business Leisure, Visiting Medical OthersNationality (Numbers) & Holiday& Friends& Treatment
Professional Recreation Relatives
North AmericaCanada 221448 8.4 47.3 40.2 0.3 3.8USA 803021 14.8 46.7 35.0 0.3 3.7
Total 1024469 13.4 46.9 36.1 0.3 3.3Central & SouthAmericaArgentina 6029 14.9 70.0 5.1 0.1 9.9Brazil 14513 22.6 63.4 5.8 0.1 8.1Mexico 8174 17.4 68.9 5.7 0.1 7.9Others 18956 18.4 65.1 5.8 0.1 10.6
Total 47672 17.5 62.7 10.3 0.4 9.1Western EuropeAustria 28034 16.9 63.9 13.9 0.4 4.9Belgium 34393 18.5 64.0 12.8 0.2 4.5Denmark 31293 20.3 67.6 7.7 0.2 4.2Finland 24524 20.0 70.8 4.9 0.1 4.2France 195307 15.7 69.8 10.5 0.2 3.8Germany 193557 26.1 58.2 10.0 0.4 5.3Greece 6427 20.0 62.4 6.1 0.2 11.3Ireland 18741 19.8 60.5 14.5 0.3 4.9Italy 77995 23.9 65.8 5.8 0.2 4.3Netherlands 63476 22.4 61.1 11.4 0.2 4.9Norway 21724 19.8 60.5 14.5 0.3 4.9Portugal 17083 11.0 66.1 19.2 0.3 3.4Spain 58721 13.2 73.4 7.1 0.1 6.2Sweden 43391 21.6 66.7 9.1 0.2 2.4Switzerland 38268 16.7 66.6 11.6 0.4 4.7UK 748765 12.9 58.6 25.0 0.2 3.3
36INDIA TOURISM STATISTICS 2009
Country of FTAs Business Leisure, Visiting Medical OthersNationality (Numbers) & Holiday& Friends& Treatment
Professional Recreation Relatives
Others 8387 13.4 59.8 26.1 0.4 0.3
Total 1610086 17.6 64.0 13.7 0.2 4.5Eastern EuropeHungary 5017 20.3 67.4 5.8 0.3 6.2Kazakhstan 6942 19.8 77.9 3.5 1.3 7.5Poland 19343 16.1 69.2 6.2 0.1 8.4Russian Fed. 97705 7.6 69.2 6.2 0.1 16.9Ukraine 11653 14.2 63.0 5.2 0.3 17.3Others 42183 13.1 68.3 4.1 0.3 14.2
Total 182843 11.7 76.3 4.3 0.4 7.3AfricaEgypt 6274 35.6 52.2 5.1 0.7 6.4Kenya 24365 11.7 57.1 23.1 3.5 4.6Mauritius 18397 9.1 67.0 12.7 3.3 7.9Nigeria 17737 28.4 42.3 6.1 17.8 5.4South Africa 43947 16.7 62.1 14.4 0.5 6.3Tanzania 16056 0.0 50.0 50.0 0.0 0.0Others 39098 18.4 52.1 12.7 4.4 12.4
Total 165874 21.2 54.7 11.2 4.5 8.4West AsiaBahrain 7694 7.2 64.8 15.6 3.9 8.5Israel 40567 27.6 60.1 6.7 0.2 5.4Oman 32620 6.7 65.6 8.5. 14.9 4.3Saudi Arabia 16519 12.0 68.4 10.2 4.0 5.4Turkey 10750 31.9 56.4 4.9 0.2 6.6UAE 43031 5.3 69.1 15.1 7.9 2.6Yemen Arab Rep. 12540 8.8 59.8 12.9 4.5 14.0Others 37389 12.8 62.8 11.5 6.1 6.8
Total 201110 14.2 63.6 9.7 7.1 5.4South AsiaAfghanistan 50762 8.9 54.1 5.4 23.9 7.7Iran 35379 10.5 63.6 13.3 0.6 12.0Maldives 56863 1.7 31.8 1.6 62.1 2.8Nepal 87487 7.4 79.1 3.9 1.9 7.7Pakistan 45628 7.4 20.3 25.5 1.6 45.2Bangladesh 458063 3.1 66.5 7.1 5.8 17.5Sri Lanka 240836 10.8 61.8 8.2 1.6 17.6Bhutan 7615 11.5 66.5 1.5 2.2 18.3
Total 982633 6.1 61.6 7.7 8.2 16.4South East AsiaIndonesia 18791 25.6 50.1 11.1 0.6 12.6Malaysia 134340 13.1 55.6 19.2 0.8 11.3Myanmar 10698 11.1 41.9 4.6 1.7 40.7Philippines 20173 25.7 43.9 9.7 0.4 20.3Singapore 94754 22.7 48.5 24.0 0.4 4.4Thailand 62593 16.3 48.9 6.6 0.1 28.1
37INDIA TOURISM STATISTICS 2009
Country of FTAs Business Leisure, Visiting Medical OthersNationality (Numbers) & Holiday& Friends& Treatment
Professional Recreation Relatives
Others 7146 18.8 52.1 11.8 0.7 16.6
Total 348495 17.9 51.0 16.5 0.5 14.1East AsiaChina (Main) 96997 50.4 41.5 4.1 0.1 3.9China(Taiwan) 24915 25.7 62.2 5.8 0.3 6.0Japan 124219 36.4 55.8 3.4 0.1 4.3Korea(South) 69316 30.2 55.3 6.3 0.1 8.1Others 2845 33.8 54.5 5.8 0.1 5.8
Total 318292 38.3 51.9 4.5 0.1 5.2AustralasiaAustralia 148846 16.8 49.8 26.8 0.2 6.4New Zealand 30305 14.0 48.1 32.5 0.2 5.2Others 2698 15.3 48.9 29.3 0.2 6.3
Total 181849 14.5 52.3 25.4 2.4 5.4
Others 44963 11.1 64.9 12.4 1.7 9.9
Stateless 293 6.7 69.0 22.1 1.4 0.8
Grand Total 5108579 15.1 57.5 17.6 2.2 7.6
Source: Bureau of Immigration, India
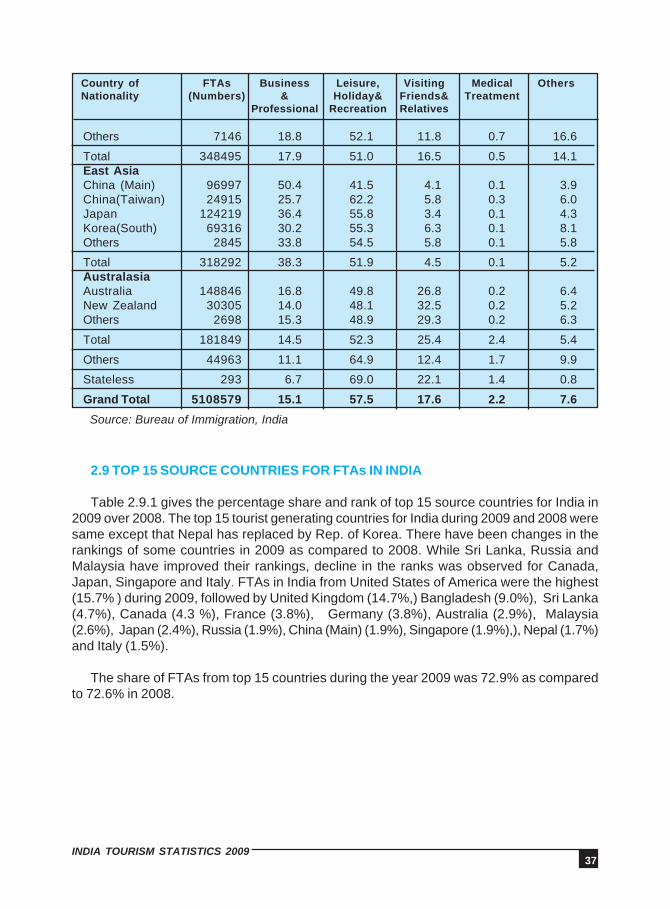
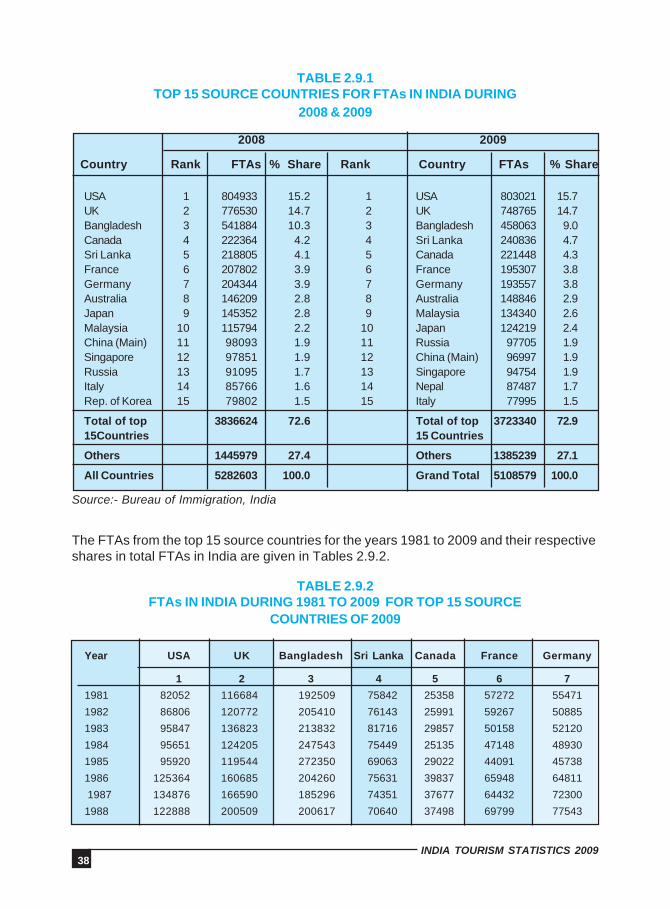
2.9 TOP 15 SOURCE COUNTRIES FOR FTAs IN INDIA
Table 2.9.1 gives the percentage share and rank of top 15 source countries for India in2009 over 2008. The top 15 tourist generating countries for India during 2009 and 2008 weresame except that Nepal has replaced by Rep. of Korea. There have been changes in therankings of some countries in 2009 as compared to 2008. While Sri Lanka, Russia andMalaysia have improved their rankings, decline in the ranks was observed for Canada,Japan, Singapore and Italy. FTAs in India from United States of America were the highest(15.7% ) during 2009, followed by United Kingdom (14.7%,) Bangladesh (9.0%), Sri Lanka(4.7%), Canada (4.3 %), France (3.8%), Germany (3.8%), Australia (2.9%), Malaysia(2.6%), Japan (2.4%), Russia (1.9%), China (Main) (1.9%), Singapore (1.9%),), Nepal (1.7%)and Italy (1.5%).
The share of FTAs from top 15 countries during the year 2009 was 72.9% as comparedto 72.6% in 2008.
38INDIA TOURISM STATISTICS 2009
TABLE 2.9.1TOP 15 SOURCE COUNTRIES FOR FTAs IN INDIA DURING
2008 & 2009
2008 2009
Country Rank FTAs % Share Rank Country FTAs % Share
USA 1 804933 15.2 1 USA 803021 15.7UK 2 776530 14.7 2 UK 748765 14.7Bangladesh 3 541884 10.3 3 Bangladesh 458063 9.0Canada 4 222364 4.2 4 Sri Lanka 240836 4.7Sri Lanka 5 218805 4.1 5 Canada 221448 4.3France 6 207802 3.9 6 France 195307 3.8Germany 7 204344 3.9 7 Germany 193557 3.8Australia 8 146209 2.8 8 Australia 148846 2.9Japan 9 145352 2.8 9 Malaysia 134340 2.6Malaysia 10 115794 2.2 10 Japan 124219 2.4China (Main) 11 98093 1.9 11 Russia 97705 1.9Singapore 12 97851 1.9 12 China (Main) 96997 1.9Russia 13 91095 1.7 13 Singapore 94754 1.9Italy 14 85766 1.6 14 Nepal 87487 1.7Rep. of Korea 15 79802 1.5 15 Italy 77995 1.5
Total of top 3836624 72.6 Total of top 3723340 72.915Countries 15 Countries
Others 1445979 27.4 Others 1385239 27.1
All Countries 5282603 100.0 Grand Total 5108579 100.0
Source:- Bureau of Immigration, India
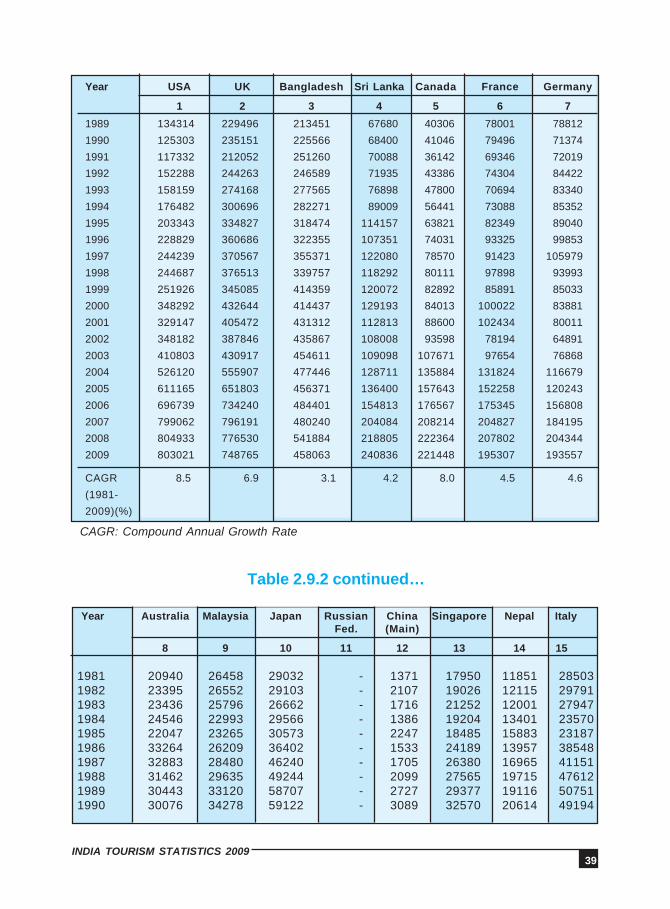
The FTAs from the top 15 source countries for the years 1981 to 2009 and their respectiveshares in total FTAs in India are given in Tables 2.9.2.
TABLE 2.9.2FTAs IN INDIA DURING 1981 TO 2009 FOR TOP 15 SOURCE
COUNTRIES OF 2009
Year USA UK Bangladesh Sri Lanka Canada France Germany
1 2 3 4 5 6 7
1981 82052 116684 192509 75842 25358 57272 55471
1982 86806 120772 205410 76143 25991 59267 50885
1983 95847 136823 213832 81716 29857 50158 52120
1984 95651 124205 247543 75449 25135 47148 48930
1985 95920 119544 272350 69063 29022 44091 45738
1986 125364 160685 204260 75631 39837 65948 64811
1987 134876 166590 185296 74351 37677 64432 72300
1988 122888 200509 200617 70640 37498 69799 77543
39INDIA TOURISM STATISTICS 2009
Year USA UK Bangladesh Sri Lanka Canada France Germany
1 2 3 4 5 6 7
1989 134314 229496 213451 67680 40306 78001 78812
1990 125303 235151 225566 68400 41046 79496 71374
1991 117332 212052 251260 70088 36142 69346 72019
1992 152288 244263 246589 71935 43386 74304 84422
1993 158159 274168 277565 76898 47800 70694 83340
1994 176482 300696 282271 89009 56441 73088 85352
1995 203343 334827 318474 114157 63821 82349 89040
1996 228829 360686 322355 107351 74031 93325 99853
1997 244239 370567 355371 122080 78570 91423 105979
1998 244687 376513 339757 118292 80111 97898 93993
1999 251926 345085 414359 120072 82892 85891 85033
2000 348292 432644 414437 129193 84013 100022 83881
2001 329147 405472 431312 112813 88600 102434 80011
2002 348182 387846 435867 108008 93598 78194 64891
2003 410803 430917 454611 109098 107671 97654 76868
2004 526120 555907 477446 128711 135884 131824 116679
2005 611165 651803 456371 136400 157643 152258 120243
2006 696739 734240 484401 154813 176567 175345 156808
2007 799062 796191 480240 204084 208214 204827 184195
2008 804933 776530 541884 218805 222364 207802 204344
2009 803021 748765 458063 240836 221448 195307 193557
CAGR 8.5 6.9 3.1 4.2 8.0 4.5 4.6
(1981-
2009)(%)
CAGR: Compound Annual Growth Rate
Table 2.9.2 continued…
Year Australia Malaysia Japan Russian China Singapore Nepal ItalyFed. (Main)
8 9 10 11 12 13 14 15
1981 20940 26458 29032 - 1371 17950 11851 285031982 23395 26552 29103 - 2107 19026 12115 297911983 23436 25796 26662 - 1716 21252 12001 279471984 24546 22993 29566 - 1386 19204 13401 235701985 22047 23265 30573 - 2247 18485 15883 231871986 33264 26209 36402 - 1533 24189 13957 385481987 32883 28480 46240 - 1705 26380 16965 411511988 31462 29635 49244 - 2099 27565 19715 476121989 30443 33120 58707 - 2727 29377 19116 507511990 30076 34278 59122 - 3089 32570 20614 49194
40INDIA TOURISM STATISTICS 2009
Year Australia Malaysia Japan Russian China Singapore Nepal ItalyFed. (Main)
8 9 10 11 12 13 14 15
1991 22700 30617 46655 32432 3476 28363 21834 411291992 26646 35201 60137 39409 4778 35039 25244 511381993 28795 35334 49616 48644 5157 40223 28048 403151994 33142 40762 63398 49684 5833 44157 34732 435101995 36150 50039 76042 27145 5111 48632 34562 530151996 48755 53370 99018 22037 5613 47136 43426 499101997 50647 60401 99729 18243 7369 52004 43155 538541998 57807 47496 89565 29493 4312 54328 38199 540581999 73041 52613 73373 34620 6487 53310 25859 506772000 53995 60513 98159 34814 14420 46612 38801 504192001 52691 57869 80634 15154 13901 42824 41135 413512002 50743 63748 59709 18643 15422 44306 37136 371362003 58730 70750 77996 26948 21152 48368 42771 469082004 81608 84390 96851 47077 34100 60710 51534 655612005 96258 96276 103082 56446 44897 68666 77024 676422006 109867 107286 119292 62203 62330 82574 91552 799782007 135925 112741 145538 75543 88103 92908 83037 935402008 146209 115794 145352 91095 98093 97851 78133 857662009 148864 134340 124219 97705 96997 94754 87487 77995
CAGR 7.0 6.0 5.3 6.3* 16.4 6.1 7.4 3.7(1981-2009)(%)
CAGR: Compound Annual Growth Rate* For Russian Fed. the CAGR is for the period from1991 to 2009Source: Bureau of Immigration, India
The details of FTAs from the top 15 source countries for 2009 are discussed in thefollowing paragraphs.
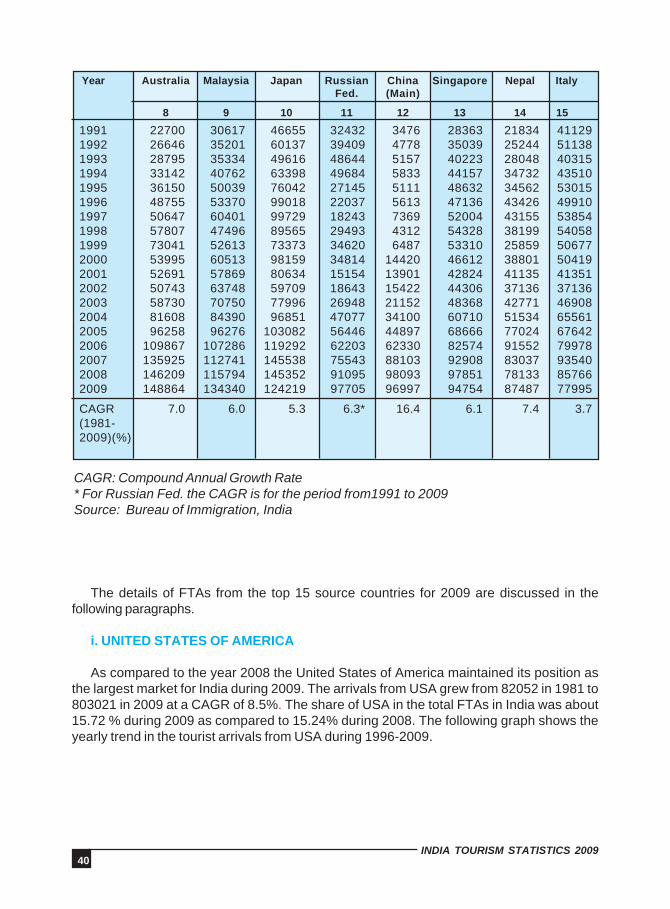
i. UNITED STATES OF AMERICA
As compared to the year 2008 the United States of America maintained its position asthe largest market for India during 2009. The arrivals from USA grew from 82052 in 1981 to803021 in 2009 at a CAGR of 8.5%. The share of USA in the total FTAs in India was about15.72 % during 2009 as compared to 15.24% during 2008. The following graph shows theyearly trend in the tourist arrivals from USA during 1996-2009.
41INDIA TOURISM STATISTICS 2009
During 2009, 98.7%of the tourists from USA came by air, 0.4 % by land and 0.9% bysea. So far as port of disembarkation is concerned, 33.6% disembarked at Delhi airportfollowed by Mumbai airport (27.4%), Bangalore (9.6%), Chennai (8.6%), Kolkata (2.6%) andrest (18.2%) by other ports. From the arrivals from USA to India, while 56.5% were male and43.5% were female. The dominant age-groups was 0-14 years (19.8%) followed by the age-group 45-54 years (18.5%) and 35-44 years (17.7%). The maximum tourists arrived in thequarter October to December (32.4%), followed by January-March (23.5%). The maximumtourist from USA during 2009 came to India for ‘leisure, holidays & recreation’ (46.7%)followed by ‘visiting friends & relatives’ (35.0%) and ‘business & professionals’ (14.8%).
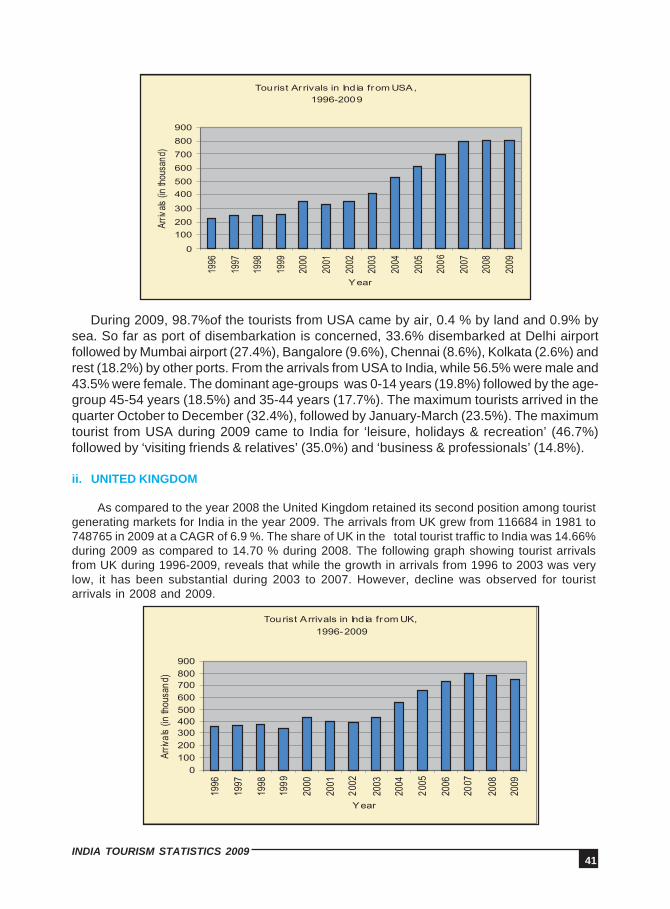
ii. UNITED KINGDOM
As compared to the year 2008 the United Kingdom retained its second position among touristgenerating markets for India in the year 2009. The arrivals from UK grew from 116684 in 1981 to748765 in 2009 at a CAGR of 6.9 %. The share of UK in the total tourist traffic to India was 14.66%during 2009 as compared to 14.70 % during 2008. The following graph showing tourist arrivalsfrom UK during 1996-2009, reveals that while the growth in arrivals from 1996 to 2003 was verylow, it has been substantial during 2003 to 2007. However, decline was observed for touristarrivals in 2008 and 2009.
42INDIA TOURISM STATISTICS 2009
During 2009, majority of UK nationals came by air (97.9 %) followed by sea route (1.6%)and 0.5 % through land route. So far as port of disembarkation is concerned, maximumnumber (31.8%) disembarked at Mumbai airport followed by Delhi airport (31.6%), Bangaloreairport (5.5%), Chennai airport (4.5 %) and Kolkata airport (2.0 %).
Of the total U.K. nationals who arrived in India, 56% were male and 44% were female.The most predominant age group was 45-54 years with 20.3 % of the tourists, followed bythe age groups 55-64 years and 25-34 years with 18.8 % and 14.4 % tourists respectively.The maximum number of arrivals was recorded during the quarter January to March (34.5%),followed by October to December (31.0%) and these two quarters contributed 65.5 % of totaltourist arrivals. The maximum tourists from UK during 2009 came to India for ‘leisure, holidays& recreation’ (58.6%) followed by ‘visiting friends & relatives’ (25%) and ‘business &professionals’ (12.9%).
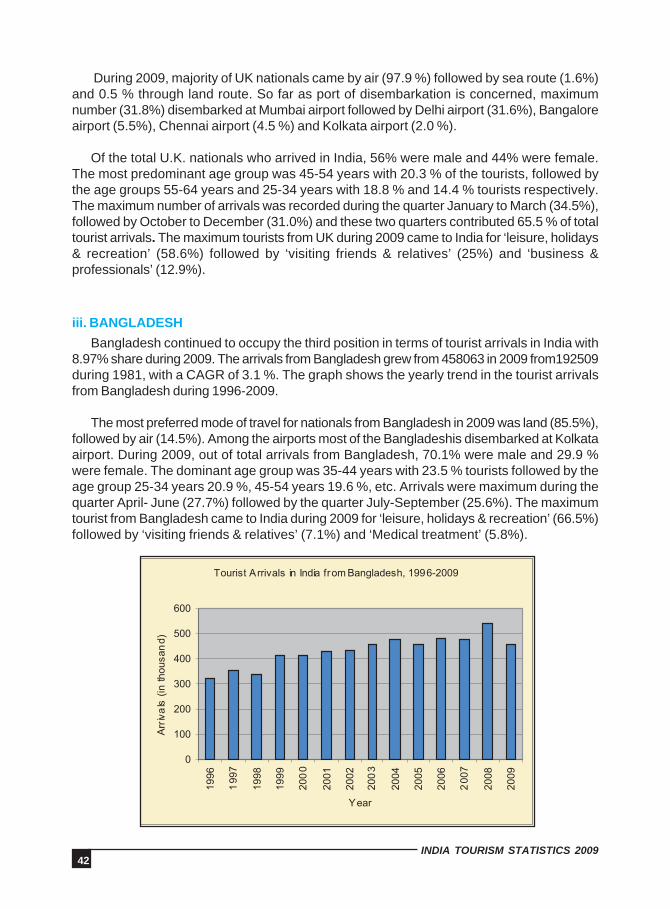
iii. BANGLADESH
Bangladesh continued to occupy the third position in terms of tourist arrivals in India with8.97% share during 2009. The arrivals from Bangladesh grew from 458063 in 2009 from192509during 1981, with a CAGR of 3.1 %. The graph shows the yearly trend in the tourist arrivalsfrom Bangladesh during 1996-2009.
The most preferred mode of travel for nationals from Bangladesh in 2009 was land (85.5%),followed by air (14.5%). Among the airports most of the Bangladeshis disembarked at Kolkataairport. During 2009, out of total arrivals from Bangladesh, 70.1% were male and 29.9 %were female. The dominant age group was 35-44 years with 23.5 % tourists followed by theage group 25-34 years 20.9 %, 45-54 years 19.6 %, etc. Arrivals were maximum during thequarter April- June (27.7%) followed by the quarter July-September (25.6%). The maximumtourist from Bangladesh came to India during 2009 for ‘leisure, holidays & recreation’ (66.5%)followed by ‘visiting friends & relatives’ (7.1%) and ‘Medical treatment’ (5.8%).
43INDIA TOURISM STATISTICS 2009
iv. SRI LANKA
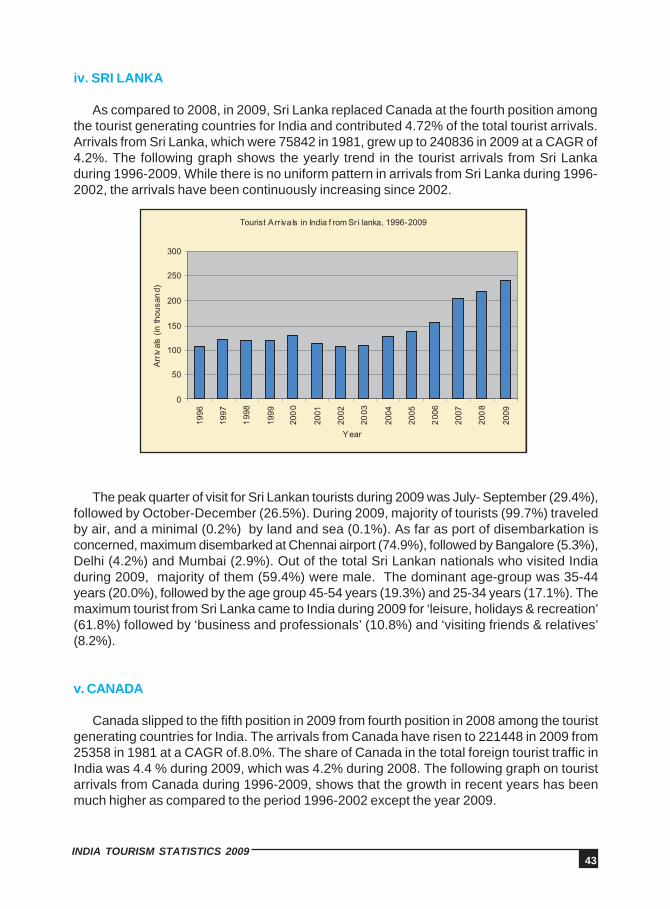
As compared to 2008, in 2009, Sri Lanka replaced Canada at the fourth position amongthe tourist generating countries for India and contributed 4.72% of the total tourist arrivals.Arrivals from Sri Lanka, which were 75842 in 1981, grew up to 240836 in 2009 at a CAGR of4.2%. The following graph shows the yearly trend in the tourist arrivals from Sri Lankaduring 1996-2009. While there is no uniform pattern in arrivals from Sri Lanka during 1996-2002, the arrivals have been continuously increasing since 2002.
The peak quarter of visit for Sri Lankan tourists during 2009 was July- September (29.4%),followed by October-December (26.5%). During 2009, majority of tourists (99.7%) traveledby air, and a minimal (0.2%) by land and sea (0.1%). As far as port of disembarkation isconcerned, maximum disembarked at Chennai airport (74.9%), followed by Bangalore (5.3%),Delhi (4.2%) and Mumbai (2.9%). Out of the total Sri Lankan nationals who visited Indiaduring 2009, majority of them (59.4%) were male. The dominant age-group was 35-44years (20.0%), followed by the age group 45-54 years (19.3%) and 25-34 years (17.1%). Themaximum tourist from Sri Lanka came to India during 2009 for ‘leisure, holidays & recreation’(61.8%) followed by ‘business and professionals’ (10.8%) and ‘visiting friends & relatives’(8.2%).
v. CANADA
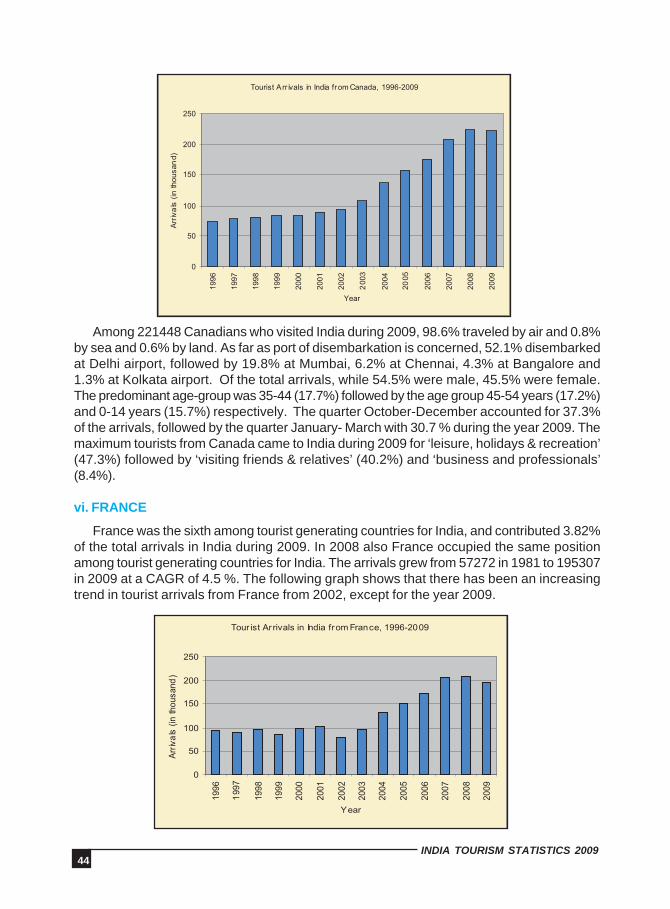
Canada slipped to the fifth position in 2009 from fourth position in 2008 among the touristgenerating countries for India. The arrivals from Canada have risen to 221448 in 2009 from25358 in 1981 at a CAGR of.8.0%. The share of Canada in the total foreign tourist traffic inIndia was 4.4 % during 2009, which was 4.2% during 2008. The following graph on touristarrivals from Canada during 1996-2009, shows that the growth in recent years has beenmuch higher as compared to the period 1996-2002 except the year 2009.
44INDIA TOURISM STATISTICS 2009
Among 221448 Canadians who visited India during 2009, 98.6% traveled by air and 0.8%by sea and 0.6% by land. As far as port of disembarkation is concerned, 52.1% disembarkedat Delhi airport, followed by 19.8% at Mumbai, 6.2% at Chennai, 4.3% at Bangalore and1.3% at Kolkata airport. Of the total arrivals, while 54.5% were male, 45.5% were female.The predominant age-group was 35-44 (17.7%) followed by the age group 45-54 years (17.2%)and 0-14 years (15.7%) respectively. The quarter October-December accounted for 37.3%of the arrivals, followed by the quarter January- March with 30.7 % during the year 2009. Themaximum tourists from Canada came to India during 2009 for ‘leisure, holidays & recreation’(47.3%) followed by ‘visiting friends & relatives’ (40.2%) and ‘business and professionals’(8.4%).
vi. FRANCE
France was the sixth among tourist generating countries for India, and contributed 3.82%of the total arrivals in India during 2009. In 2008 also France occupied the same positionamong tourist generating countries for India. The arrivals grew from 57272 in 1981 to 195307in 2009 at a CAGR of 4.5 %. The following graph shows that there has been an increasingtrend in tourist arrivals from France from 2002, except for the year 2009.
45INDIA TOURISM STATISTICS 2009
During 2009, majority (98.3%) of the arrivals from France came to India by air, 1.1% byland route and rest by sea route. As far as port of disembarkation is concerned,disembarkations at Delhi airport (46.6%) were the highest, followed by Chennai (21.2%), andMumbai (17.2%). Of the total French arrivals, 55.2% were male and 44.8% were female. Theage group 45-54 years accounted for maximum arrivals (18.9%) followed by age group 55-64years (18.6%), and age groups 25-34 years (18.6%). During 2009, the quarters January-March and October- December were the most popular for the French tourists, accounting for29.5% and 27.5% tourists respectively. The maximum tourists from France came to Indiaduring 2009 for ‘leisure, holidays & recreation’ (69.8%) followed by ‘business and professionals’(15.7%) and ‘visiting friends & relatives’ (10.5%).
vii. GERMANY
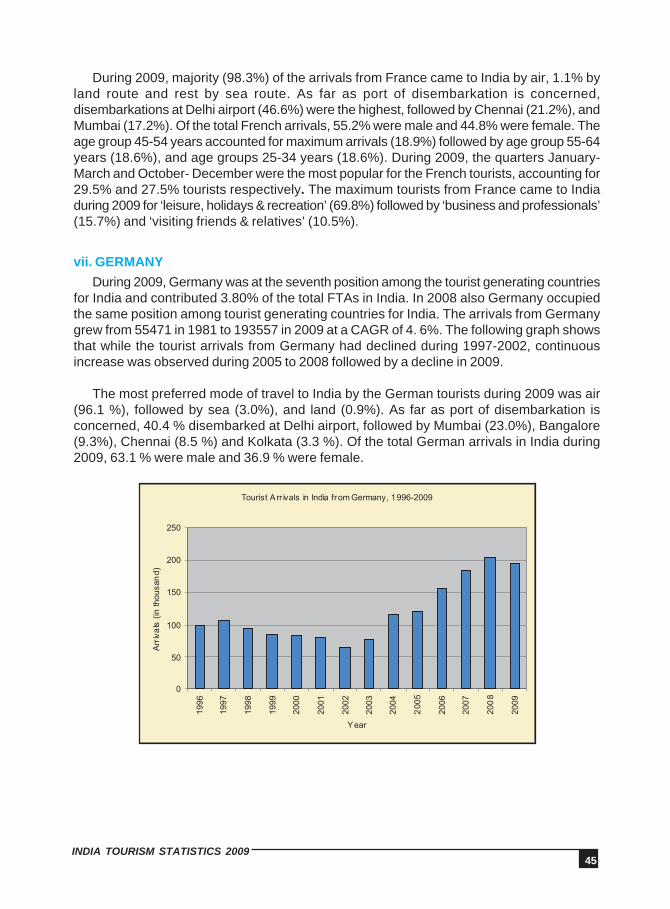
During 2009, Germany was at the seventh position among the tourist generating countriesfor India and contributed 3.80% of the total FTAs in India. In 2008 also Germany occupiedthe same position among tourist generating countries for India. The arrivals from Germanygrew from 55471 in 1981 to 193557 in 2009 at a CAGR of 4. 6%. The following graph showsthat while the tourist arrivals from Germany had declined during 1997-2002, continuousincrease was observed during 2005 to 2008 followed by a decline in 2009.
The most preferred mode of travel to India by the German tourists during 2009 was air(96.1 %), followed by sea (3.0%), and land (0.9%). As far as port of disembarkation isconcerned, 40.4 % disembarked at Delhi airport, followed by Mumbai (23.0%), Bangalore(9.3%), Chennai (8.5 %) and Kolkata (3.3 %). Of the total German arrivals in India during2009, 63.1 % were male and 36.9 % were female.

46INDIA TOURISM STATISTICS 2009
The age group 45-54 years dominated the arrivals (25.1%), followed by 35-44 years(21.8%). The peak quarter of arrivals of German during 2009 was October-December (34.3%)followed by January-March (30.5%). During 2009, the maximum tourist from Germany cameto India for ‘leisure, holidays & recreation’ (58.2%) followed by ‘business and professionals’(26.1%) and ‘visiting friends & relatives’ (10%).
viii. AUSTRALIA
During 2009, Australia occupied the eighth position, among tourist generating marketsfor India, with a share of 2.92% of arrivals. The tourist traffic from Australia during 1981 was20940 which increased to 148846 in 2009, showing a CAGR of 7.3%. The following graphshows that the tourist arrivals from Australia had increased from 1996 to 1999, followed bya declining trend upto 2002, and increasing trend again thereafter.
Air was the predominant mode of travel for Australian tourists accounting for 95.4% ofthe total arrivals followed by sea (3.6%) and land (1%) during 2009. As far as port ofdisembarkation is concerned, the maximum tourists disembarked at Delhi airport (35.7%)followed by Mumbai (25.2%), Chennai (11.2%) and Bangalore (9.4%). During 2009, majorityof the tourists (58.4%) from Australia were male. The age group 35-44 years with 19.8% oftourists dominated the arrivals, followed by 45-54 years (19.7%). The peak quarter of visitfor Australians during 2009 was October- December (39.4%) followed by the quarter January-March (23.4%). During 2009, the maximum tourist from Australia came to India for ‘leisure,holidays & recreation’ (49.8%) followed by ‘visiting friends & relatives’ (26.8%) and ‘businessand professionals’ (16.8 %).
47INDIA TOURISM STATISTICS 2009
ix. MALAYSIA
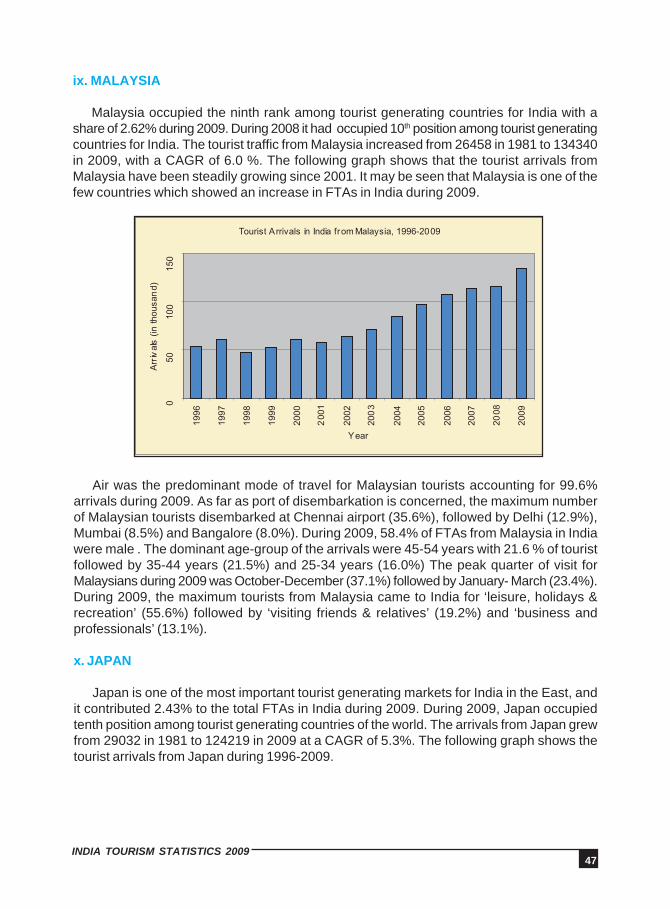
Malaysia occupied the ninth rank among tourist generating countries for India with ashare of 2.62% during 2009. During 2008 it had occupied 10th position among tourist generatingcountries for India. The tourist traffic from Malaysia increased from 26458 in 1981 to 134340in 2009, with a CAGR of 6.0 %. The following graph shows that the tourist arrivals fromMalaysia have been steadily growing since 2001. It may be seen that Malaysia is one of thefew countries which showed an increase in FTAs in India during 2009.
Air was the predominant mode of travel for Malaysian tourists accounting for 99.6%arrivals during 2009. As far as port of disembarkation is concerned, the maximum numberof Malaysian tourists disembarked at Chennai airport (35.6%), followed by Delhi (12.9%),Mumbai (8.5%) and Bangalore (8.0%). During 2009, 58.4% of FTAs from Malaysia in Indiawere male . The dominant age-group of the arrivals were 45-54 years with 21.6 % of touristfollowed by 35-44 years (21.5%) and 25-34 years (16.0%) The peak quarter of visit forMalaysians during 2009 was October-December (37.1%) followed by January- March (23.4%).During 2009, the maximum tourists from Malaysia came to India for ‘leisure, holidays &recreation’ (55.6%) followed by ‘visiting friends & relatives’ (19.2%) and ‘business andprofessionals’ (13.1%).
x. JAPAN
Japan is one of the most important tourist generating markets for India in the East, andit contributed 2.43% to the total FTAs in India during 2009. During 2009, Japan occupiedtenth position among tourist generating countries of the world. The arrivals from Japan grewfrom 29032 in 1981 to 124219 in 2009 at a CAGR of 5.3%. The following graph shows thetourist arrivals from Japan during 1996-2009.
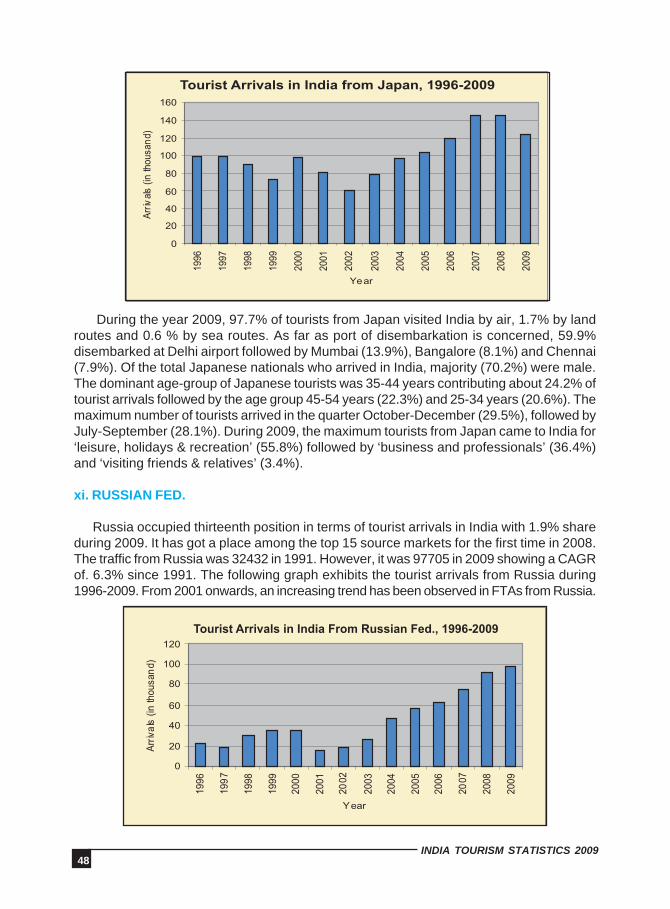
48INDIA TOURISM STATISTICS 2009
During the year 2009, 97.7% of tourists from Japan visited India by air, 1.7% by landroutes and 0.6 % by sea routes. As far as port of disembarkation is concerned, 59.9%disembarked at Delhi airport followed by Mumbai (13.9%), Bangalore (8.1%) and Chennai(7.9%). Of the total Japanese nationals who arrived in India, majority (70.2%) were male.The dominant age-group of Japanese tourists was 35-44 years contributing about 24.2% oftourist arrivals followed by the age group 45-54 years (22.3%) and 25-34 years (20.6%). Themaximum number of tourists arrived in the quarter October-December (29.5%), followed byJuly-September (28.1%). During 2009, the maximum tourists from Japan came to India for‘leisure, holidays & recreation’ (55.8%) followed by ‘business and professionals’ (36.4%)and ‘visiting friends & relatives’ (3.4%).
xi. RUSSIAN FED.
Russia occupied thirteenth position in terms of tourist arrivals in India with 1.9% shareduring 2009. It has got a place among the top 15 source markets for the first time in 2008.The traffic from Russia was 32432 in 1991. However, it was 97705 in 2009 showing a CAGRof. 6.3% since 1991. The following graph exhibits the tourist arrivals from Russia during1996-2009. From 2001 onwards, an increasing trend has been observed in FTAs from Russia.

49INDIA TOURISM STATISTICS 2009
The predominant mode of travel for Russians was air accounting for 98.6% of tourists,followed by sea (0.8%) and land (0.6%). Of the total arrivals from Russia during 2009,majority (53.5%) were female. The dominant age group was 25-34 years, accounting for33.5% of tourists followed by 35-44 years age-group (22.5%). The peak quarter for touristfrom Russia during 2009 was October-December (42.8%) followed by January-March (40.0%).During 2009, the maximum tourists from Russia came to India for ‘leisure, holidays &recreation’ (69.2%) followed by ‘business and professionals’ (7.6%) and ‘visiting friends &relatives’ (6.2%).
xii. CHINA (MAIN)
In 2009, China (Main) was at the twelfth position among the tourist generating marketsfor India, with 1.90% share in total arrivals. The arrivals from China (Main) were merely 1371in 1981 but have grown to 96997 in 2009 at a CAGR of 16.4 %. The graph shows the trendin the tourist arrivals from China (Main) from 1996 to 2009. It can be seen that till 2000 therewas no pattern in arrivals from China (Main), however henceforth it was showing an increasingtrend, except in 2009.
Air was the predominant mode of travel from China (Main) during 2009 (98.8%), followedby land route (0.8%) and sea route (0.4%). Maximum tourists disembarked at Delhi airport(40.8%), followed by Mumbai (27.4%), Kolkata (14.4%) and Bangalore (7.0%). The peakquarter for arrivals from China (Main) in 2009 was October-December (29.2%), followed byJanuary- March (24.2%). Of the total arrivals from China (Main) during 2009, majority weremale (72.6%). The dominant age group in 2009 was 25-34 years contributing about 37.8% oftourists followed by the age-group 35-44 years (29.8%). During 2009, the maximum touristfrom China (Main) came to India for ‘business and professionals’ (50.4%) followed by ‘leisure,holidays & recreation’ (41.5%) and ‘visiting friends & relatives’ (4.1%).
xiii. SINGAPORE
Singapore occupied the thirteenth position in terms of tourist arrivals in India during 2009with a share of 1. 85%. The arrivals from Singapore grew from 17950 in 1981 to 94754 in2009 at a CAGR of 6.1 %. The graph shows tourist arrival trend from Singapore from 1996 to
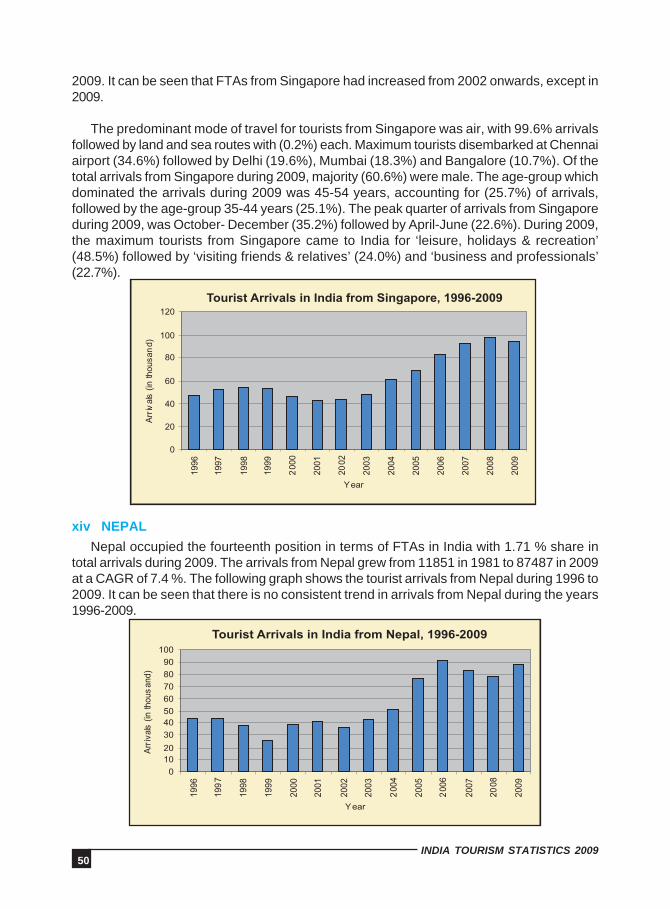
50INDIA TOURISM STATISTICS 2009
xiv NEPAL
Nepal occupied the fourteenth position in terms of FTAs in India with 1.71 % share intotal arrivals during 2009. The arrivals from Nepal grew from 11851 in 1981 to 87487 in 2009at a CAGR of 7.4 %. The following graph shows the tourist arrivals from Nepal during 1996 to2009. It can be seen that there is no consistent trend in arrivals from Nepal during the years1996-2009.
2009. It can be seen that FTAs from Singapore had increased from 2002 onwards, except in2009.
The predominant mode of travel for tourists from Singapore was air, with 99.6% arrivalsfollowed by land and sea routes with (0.2%) each. Maximum tourists disembarked at Chennaiairport (34.6%) followed by Delhi (19.6%), Mumbai (18.3%) and Bangalore (10.7%). Of thetotal arrivals from Singapore during 2009, majority (60.6%) were male. The age-group whichdominated the arrivals during 2009 was 45-54 years, accounting for (25.7%) of arrivals,followed by the age-group 35-44 years (25.1%). The peak quarter of arrivals from Singaporeduring 2009, was October- December (35.2%) followed by April-June (22.6%). During 2009,the maximum tourists from Singapore came to India for ‘leisure, holidays & recreation’(48.5%) followed by ‘visiting friends & relatives’ (24.0%) and ‘business and professionals’(22.7%).
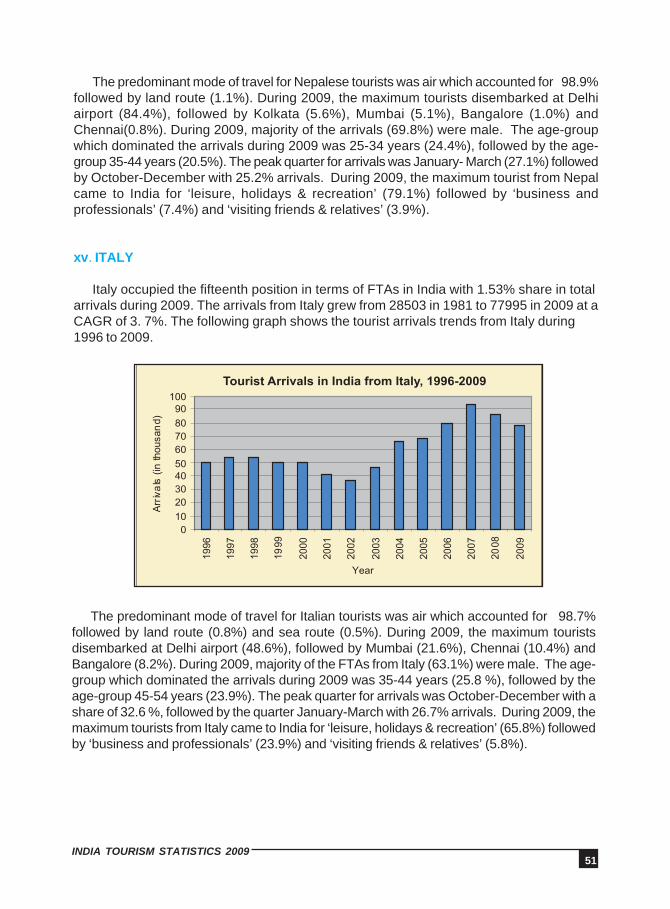
51INDIA TOURISM STATISTICS 2009
The predominant mode of travel for Nepalese tourists was air which accounted for 98.9%followed by land route (1.1%). During 2009, the maximum tourists disembarked at Delhiairport (84.4%), followed by Kolkata (5.6%), Mumbai (5.1%), Bangalore (1.0%) andChennai(0.8%). During 2009, majority of the arrivals (69.8%) were male. The age-groupwhich dominated the arrivals during 2009 was 25-34 years (24.4%), followed by the age-group 35-44 years (20.5%). The peak quarter for arrivals was January- March (27.1%) followedby October-December with 25.2% arrivals. During 2009, the maximum tourist from Nepalcame to India for ‘leisure, holidays & recreation’ (79.1%) followed by ‘business andprofessionals’ (7.4%) and ‘visiting friends & relatives’ (3.9%).
xv. ITALY
Italy occupied the fifteenth position in terms of FTAs in India with 1.53% share in totalarrivals during 2009. The arrivals from Italy grew from 28503 in 1981 to 77995 in 2009 at aCAGR of 3. 7%. The following graph shows the tourist arrivals trends from Italy during1996 to 2009.
The predominant mode of travel for Italian tourists was air which accounted for 98.7%followed by land route (0.8%) and sea route (0.5%). During 2009, the maximum touristsdisembarked at Delhi airport (48.6%), followed by Mumbai (21.6%), Chennai (10.4%) andBangalore (8.2%). During 2009, majority of the FTAs from Italy (63.1%) were male. The age-group which dominated the arrivals during 2009 was 35-44 years (25.8 %), followed by theage-group 45-54 years (23.9%). The peak quarter for arrivals was October-December with ashare of 32.6 %, followed by the quarter January-March with 26.7% arrivals. During 2009, themaximum tourists from Italy came to India for ‘leisure, holidays & recreation’ (65.8%) followedby ‘business and professionals’ (23.9%) and ‘visiting friends & relatives’ (5.8%).

52INDIA TOURISM STATISTICS 2009
TABLE 2.10.1FEE FROM TOURISM IN INDIA DURING 1991-2009
The month-wise FEE from tourism in India and corresponding percentage change overprevious years during 2007-2009 in INR terms and US$ terms are given in Tables 2.10.2and 2.10.3.
2.10 FOREIGN EXCHANGE EARNINGS FROM TOURISM IN INDIA
Tourism is one of the important sectors in India for foreign exchange earnings (FEE). Asper the monthly estimates prepared by Ministry of Tourism, FEE from tourism in India in2009 were Rs.54960 crore as compared to Rs.50730 in 2008 registering a growth of 8.3 % in2009 over 2008. In US $ term, FEE from tourism in 2009 were US $ 11.39 billion as comparedto US$ 11.75 billion in 2008 with a negative growth rate of 3.0 %. The decline in growth ratein FEE from tourism in 2009 over 2008 is mainly due to decline in FTAs due to globalfinancial crisis, terrorist activities, etc. The FEE from tourism in India, in INR terms and US$terms, during 1991-2009 are given in Table 2.10.1.
Year FEE in INR terms FEE in US$ terms
Rs. % change US $ % changeCrores over previous Million over previous
year year
1991 4318 - 1861 -1992 5951 37.8 2126 14.21993 6611 11.1 2124 -0.11994 7129 7.8 2272 7.01995 8430 18.2 2583 13.71996 10046 19.2 2832 9.61997 10511 4.6 2889 2.01998 12150 15.6 2948 2.01999 12951 6.6 3009 2.12000 15626 20.6 3460 15.02001 15083 -3.5 3198 -7.62002 15064 -0.1 3103 -3.02003 20729 37.6 4463 43.82004 27944 34.8 6170 38.22005 33123 18.5 7493 21.42006 39025 17.8 8634 15.22007 44360 13.7 10729 24.32008# 50730 14.4 11747 9.52009# 54960 8.3 11394 -3.0
# Advance Estimates
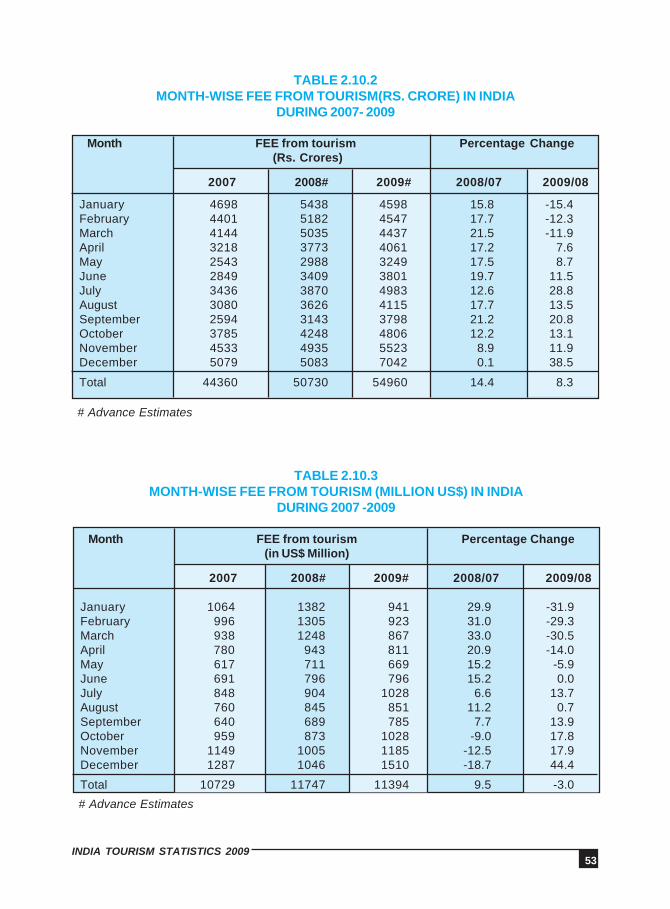
53INDIA TOURISM STATISTICS 2009
Month FEE from tourism Percentage Change(in US$ Million)
2007 2008# 2009# 2008/07 2009/08
Month FEE from tourism Percentage Change (Rs. Crores)
2007 2008# 2009# 2008/07 2009/08
TABLE 2.10.2MONTH-WISE FEE FROM TOURISM(RS. CRORE) IN INDIA
DURING 2007- 2009
January 4698 5438 4598 15.8 -15.4February 4401 5182 4547 17.7 -12.3March 4144 5035 4437 21.5 -11.9April 3218 3773 4061 17.2 7.6May 2543 2988 3249 17.5 8.7June 2849 3409 3801 19.7 11.5July 3436 3870 4983 12.6 28.8August 3080 3626 4115 17.7 13.5September 2594 3143 3798 21.2 20.8October 3785 4248 4806 12.2 13.1November 4533 4935 5523 8.9 11.9December 5079 5083 7042 0.1 38.5
Total 44360 50730 54960 14.4 8.3
January 1064 1382 941 29.9 -31.9February 996 1305 923 31.0 -29.3March 938 1248 867 33.0 -30.5April 780 943 811 20.9 -14.0May 617 711 669 15.2 -5.9June 691 796 796 15.2 0.0July 848 904 1028 6.6 13.7August 760 845 851 11.2 0.7September 640 689 785 7.7 13.9October 959 873 1028 -9.0 17.8November 1149 1005 1185 -12.5 17.9December 1287 1046 1510 -18.7 44.4
Total 10729 11747 11394 9.5 -3.0
# Advance Estimates
TABLE 2.10.3MONTH-WISE FEE FROM TOURISM (MILLION US$) IN INDIA
DURING 2007 -2009
# Advance Estimates
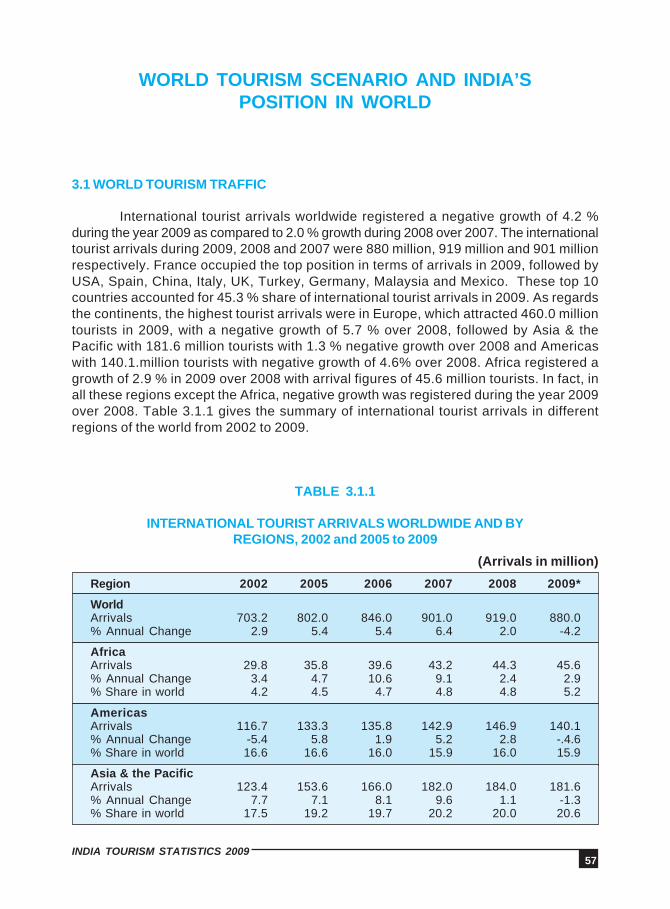
57INDIA TOURISM STATISTICS 2009
WORLD TOURISM SCENARIO AND INDIA’SPOSITION IN WORLD
3.1 WORLD TOURISM TRAFFIC
International tourist arrivals worldwide registered a negative growth of 4.2 %during the year 2009 as compared to 2.0 % growth during 2008 over 2007. The internationaltourist arrivals during 2009, 2008 and 2007 were 880 million, 919 million and 901 millionrespectively. France occupied the top position in terms of arrivals in 2009, followed byUSA, Spain, China, Italy, UK, Turkey, Germany, Malaysia and Mexico. These top 10countries accounted for 45.3 % share of international tourist arrivals in 2009. As regardsthe continents, the highest tourist arrivals were in Europe, which attracted 460.0 milliontourists in 2009, with a negative growth of 5.7 % over 2008, followed by Asia & thePacific with 181.6 million tourists with 1.3 % negative growth over 2008 and Americaswith 140.1.million tourists with negative growth of 4.6% over 2008. Africa registered agrowth of 2.9 % in 2009 over 2008 with arrival figures of 45.6 million tourists. In fact, inall these regions except the Africa, negative growth was registered during the year 2009over 2008. Table 3.1.1 gives the summary of international tourist arrivals in differentregions of the world from 2002 to 2009.
TABLE 3.1.1
INTERNATIONAL TOURIST ARRIVALS WORLDWIDE AND BYREGIONS, 2002 and 2005 to 2009
(Arrivals in million)
Region 2002 2005 2006 2007 2008 2009*
WorldArrivals 703.2 802.0 846.0 901.0 919.0 880.0% Annual Change 2.9 5.4 5.4 6.4 2.0 -4.2
AfricaArrivals 29.8 35.8 39.6 43.2 44.3 45.6% Annual Change 3.4 4.7 10.6 9.1 2.4 2.9% Share in world 4.2 4.5 4.7 4.8 4.8 5.2
AmericasArrivals 116.7 133.3 135.8 142.9 146.9 140.1% Annual Change -5.4 5.8 1.9 5.2 2.8 -.4.6% Share in world 16.6 16.6 16.0 15.9 16.0 15.9
Asia & the PacificArrivals 123.4 153.6 166.0 182.0 184.0 181.6% Annual Change 7.7 7.1 8.1 9.6 1.1 -1.3% Share in world 17.5 19.2 19.7 20.2 20.0 20.6
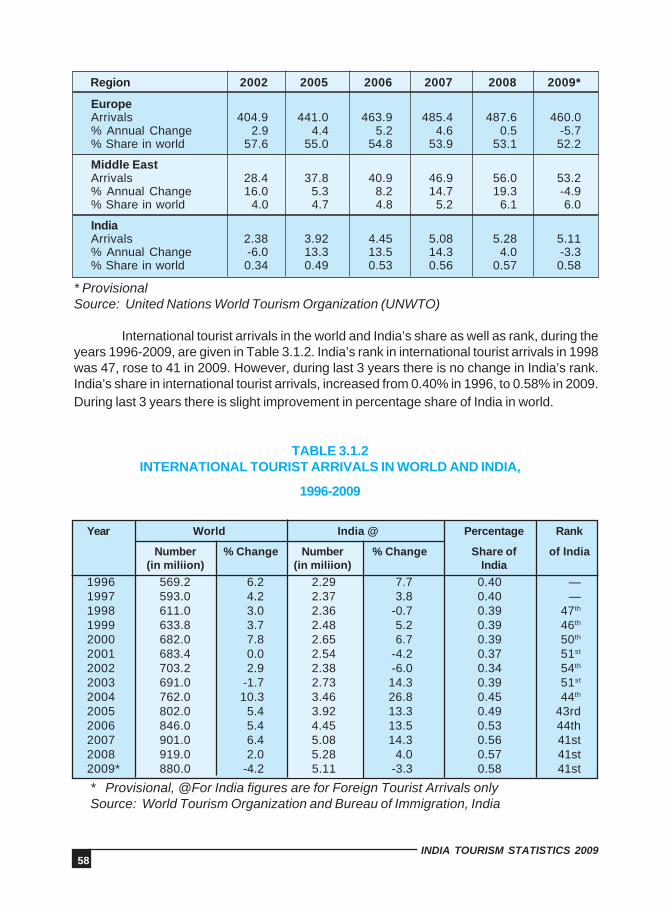
58INDIA TOURISM STATISTICS 2009
Region 2002 2005 2006 2007 2008 2009*
EuropeArrivals 404.9 441.0 463.9 485.4 487.6 460.0% Annual Change 2.9 4.4 5.2 4.6 0.5 -5.7% Share in world 57.6 55.0 54.8 53.9 53.1 52.2
Middle EastArrivals 28.4 37.8 40.9 46.9 56.0 53.2% Annual Change 16.0 5.3 8.2 14.7 19.3 -4.9% Share in world 4.0 4.7 4.8 5.2 6.1 6.0
IndiaArrivals 2.38 3.92 4.45 5.08 5.28 5.11% Annual Change -6.0 13.3 13.5 14.3 4.0 -3.3% Share in world 0.34 0.49 0.53 0.56 0.57 0.58
* ProvisionalSource: United Nations World Tourism Organization (UNWTO)
International tourist arrivals in the world and India’s share as well as rank, during theyears 1996-2009, are given in Table 3.1.2. India’s rank in international tourist arrivals in 1998was 47, rose to 41 in 2009. However, during last 3 years there is no change in India’s rank.India’s share in international tourist arrivals, increased from 0.40% in 1996, to 0.58% in 2009.During last 3 years there is slight improvement in percentage share of India in world.
TABLE 3.1.2INTERNATIONAL TOURIST ARRIVALS IN WORLD AND INDIA,
1996-2009
Year World India @ Percentage Rank
Number % Change Number % Change Share of of India(in miliion) (in miliion) India
1996 569.2 6.2 2.29 7.7 0.40 —1997 593.0 4.2 2.37 3.8 0.40 —1998 611.0 3.0 2.36 -0.7 0.39 47th
1999 633.8 3.7 2.48 5.2 0.39 46th
2000 682.0 7.8 2.65 6.7 0.39 50th
2001 683.4 0.0 2.54 -4.2 0.37 51st
2002 703.2 2.9 2.38 -6.0 0.34 54th
2003 691.0 -1.7 2.73 14.3 0.39 51st
2004 762.0 10.3 3.46 26.8 0.45 44th
2005 802.0 5.4 3.92 13.3 0.49 43rd2006 846.0 5.4 4.45 13.5 0.53 44th2007 901.0 6.4 5.08 14.3 0.56 41st2008 919.0 2.0 5.28 4.0 0.57 41st2009* 880.0 -4.2 5.11 -3.3 0.58 41st
* Provisional, @For India figures are for Foreign Tourist Arrivals onlySource: World Tourism Organization and Bureau of Immigration, India
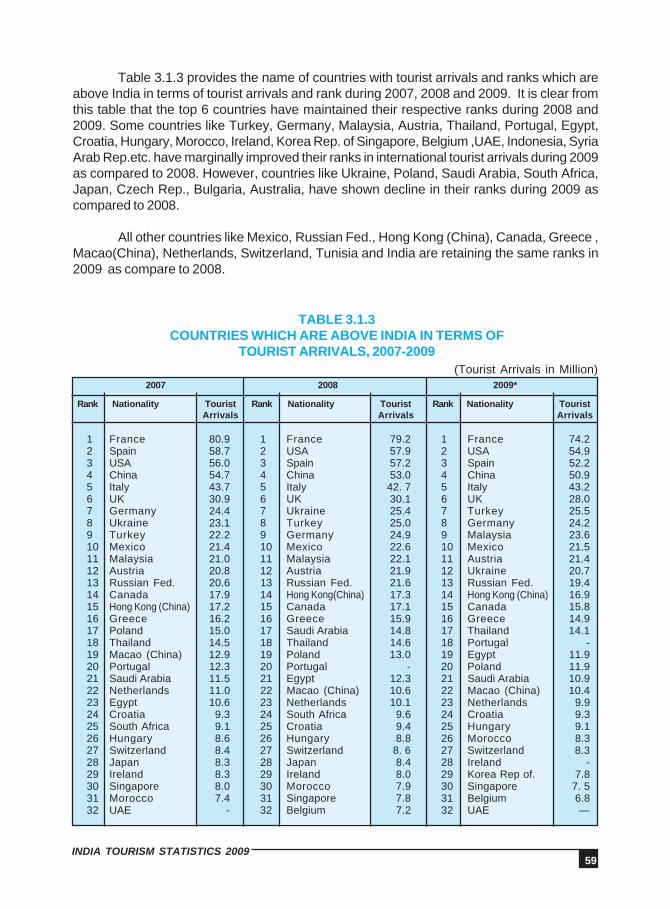
59INDIA TOURISM STATISTICS 2009
Table 3.1.3 provides the name of countries with tourist arrivals and ranks which areabove India in terms of tourist arrivals and rank during 2007, 2008 and 2009. It is clear fromthis table that the top 6 countries have maintained their respective ranks during 2008 and2009. Some countries like Turkey, Germany, Malaysia, Austria, Thailand, Portugal, Egypt,Croatia, Hungary, Morocco, Ireland, Korea Rep. of Singapore, Belgium ,UAE, Indonesia, SyriaArab Rep.etc. have marginally improved their ranks in international tourist arrivals during 2009as compared to 2008. However, countries like Ukraine, Poland, Saudi Arabia, South Africa,Japan, Czech Rep., Bulgaria, Australia, have shown decline in their ranks during 2009 ascompared to 2008.
All other countries like Mexico, Russian Fed., Hong Kong (China), Canada, Greece ,Macao(China), Netherlands, Switzerland, Tunisia and India are retaining the same ranks in2009 as compare to 2008.
TABLE 3.1.3COUNTRIES WHICH ARE ABOVE INDIA IN TERMS OF
TOURIST ARRIVALS, 2007-2009(Tourist Arrivals in Million)
2007 2008 2009*
Rank Nationality Tourist Rank Nationality Tourist Rank Nationality TouristArrivals Arrivals Arrivals
1 France 80.9 1 France 79.2 1 France 74.22 Spain 58.7 2 USA 57.9 2 USA 54.93 USA 56.0 3 Spain 57.2 3 Spain 52.24 China 54.7 4 China 53.0 4 China 50.95 Italy 43.7 5 Italy 42. 7 5 Italy 43.26 UK 30.9 6 UK 30.1 6 UK 28.07 Germany 24.4 7 Ukraine 25.4 7 Turkey 25.58 Ukraine 23.1 8 Turkey 25.0 8 Germany 24.29 Turkey 22.2 9 Germany 24.9 9 Malaysia 23.610 Mexico 21.4 10 Mexico 22.6 10 Mexico 21.511 Malaysia 21.0 11 Malaysia 22.1 11 Austria 21.412 Austria 20.8 12 Austria 21.9 12 Ukraine 20.713 Russian Fed. 20.6 13 Russian Fed. 21.6 13 Russian Fed. 19.414 Canada 17.9 14 Hong Kong(China) 17.3 14 Hong Kong (China) 16.915 Hong Kong (China) 17.2 15 Canada 17.1 15 Canada 15.816 Greece 16.2 16 Greece 15.9 16 Greece 14.917 Poland 15.0 17 Saudi Arabia 14.8 17 Thailand 14.118 Thailand 14.5 18 Thailand 14.6 18 Portugal -19 Macao (China) 12.9 19 Poland 13.0 19 Egypt 11.920 Portugal 12.3 20 Portugal - 20 Poland 11.921 Saudi Arabia 11.5 21 Egypt 12.3 21 Saudi Arabia 10.922 Netherlands 11.0 22 Macao (China) 10.6 22 Macao (China) 10.423 Egypt 10.6 23 Netherlands 10.1 23 Netherlands 9.924 Croatia 9.3 24 South Africa 9.6 24 Croatia 9.325 South Africa 9.1 25 Croatia 9.4 25 Hungary 9.126 Hungary 8.6 26 Hungary 8.8 26 Morocco 8.327 Switzerland 8.4 27 Switzerland 8. 6 27 Switzerland 8.328 Japan 8.3 28 Japan 8.4 28 Ireland -29 Ireland 8.3 29 Ireland 8.0 29 Korea Rep of. 7.830 Singapore 8.0 30 Morocco 7.9 30 Singapore 7. 531 Morocco 7.4 31 Singapore 7.8 31 Belgium 6.832 UAE - 32 Belgium 7.2 32 UAE —
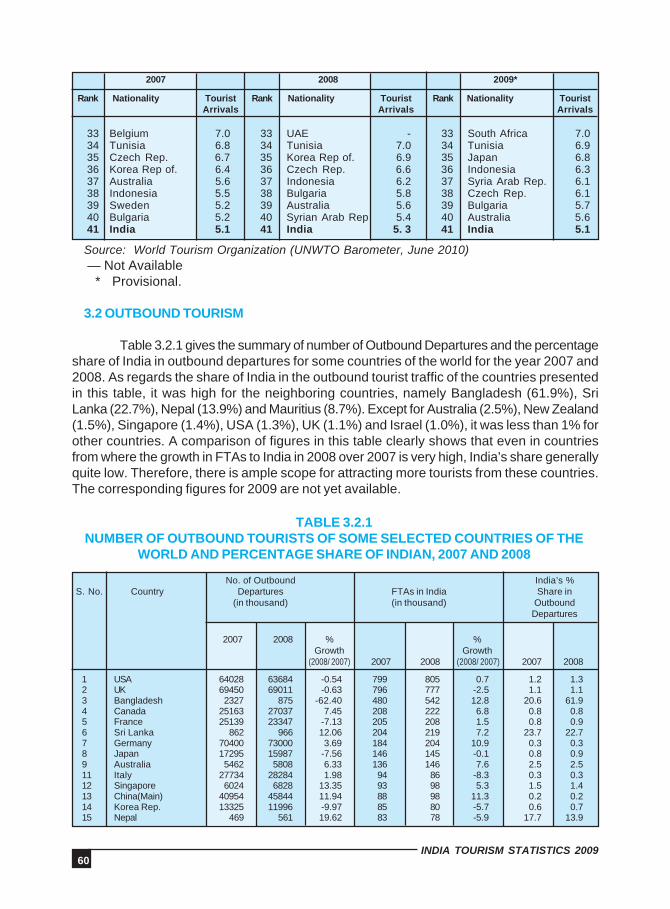
60INDIA TOURISM STATISTICS 2009
2007 2008 2009*
Rank Nationality Tourist Rank Nationality Tourist Rank Nationality TouristArrivals Arrivals Arrivals
33 Belgium 7.0 33 UAE - 33 South Africa 7.034 Tunisia 6.8 34 Tunisia 7.0 34 Tunisia 6.935 Czech Rep. 6.7 35 Korea Rep of. 6.9 35 Japan 6.836 Korea Rep of. 6.4 36 Czech Rep. 6.6 36 Indonesia 6.337 Australia 5.6 37 Indonesia 6.2 37 Syria Arab Rep. 6.138 Indonesia 5.5 38 Bulgaria 5.8 38 Czech Rep. 6.139 Sweden 5.2 39 Australia 5.6 39 Bulgaria 5.740 Bulgaria 5.2 40 Syrian Arab Rep 5.4 40 Australia 5.641 India 5.1 41 India 5. 3 41 India 5.1
Source: World Tourism Organization (UNWTO Barometer, June 2010) — Not Available
* Provisional.
3.2 OUTBOUND TOURISM
Table 3.2.1 gives the summary of number of Outbound Departures and the percentageshare of India in outbound departures for some countries of the world for the year 2007 and2008. As regards the share of India in the outbound tourist traffic of the countries presentedin this table, it was high for the neighboring countries, namely Bangladesh (61.9%), SriLanka (22.7%), Nepal (13.9%) and Mauritius (8.7%). Except for Australia (2.5%), New Zealand(1.5%), Singapore (1.4%), USA (1.3%), UK (1.1%) and Israel (1.0%), it was less than 1% forother countries. A comparison of figures in this table clearly shows that even in countriesfrom where the growth in FTAs to India in 2008 over 2007 is very high, India’s share generallyquite low. Therefore, there is ample scope for attracting more tourists from these countries.The corresponding figures for 2009 are not yet available.
TABLE 3.2.1NUMBER OF OUTBOUND TOURISTS OF SOME SELECTED COUNTRIES OF THE
WORLD AND PERCENTAGE SHARE OF INDIAN, 2007 AND 2008
1 USA 64028 63684 -0.54 799 805 0.7 1.2 1.32 UK 69450 69011 -0.63 796 777 -2.5 1.1 1.13 Bangladesh 2327 875 -62.40 480 542 12.8 20.6 61.94 Canada 25163 27037 7.45 208 222 6.8 0.8 0.85 France 25139 23347 -7.13 205 208 1.5 0.8 0.96 Sri Lanka 862 966 12.06 204 219 7.2 23.7 22.77 Germany 70400 73000 3.69 184 204 10.9 0.3 0.38 Japan 17295 15987 -7.56 146 145 -0.1 0.8 0.99 Australia 5462 5808 6.33 136 146 7.6 2.5 2.511 Italy 27734 28284 1.98 94 86 -8.3 0.3 0.312 Singapore 6024 6828 13.35 93 98 5.3 1.5 1.413 China(Main) 40954 45844 11.94 88 98 11.3 0.2 0.214 Korea Rep. 13325 11996 -9.97 85 80 -5.7 0.6 0.715 Nepal 469 561 19.62 83 78 -5.9 17.7 13.9
No. of Outbound India’s %S. No. Country Departures FTAs in India Share in
(in thousand) (in thousand) OutboundDepartures
2007 2008 % %Growth Growth
(2008/ 2007) 2007 2008 (2008/ 2007) 2007 2008

61INDIA TOURISM STATISTICS 2009
No. of Outbound India’s %S. No. Country Departures FTAs in India Share in
(in thousand) (in thousand) OutboundDepartures
16 Russian Fed. 34285 36538 6.57 76 91 20.6 0.2 0.217 Netherlands 17556 18458 5.14 67 72 6.2 0.4 0.418 Spain 11276 11229 -0.42 63 63 -1.3 0.6 0.619 Thailand 4018 4038 0.50 50 58 16.0 1.2 1.420 Israel 4147 4207 1.45 48 43 -10.2 1.1 1.021 Sweden 12692 13290 4.71 47 59 25.2 0.4 0.422 South Africa 4433 4429 -0.09 46 42 -8.0 1.0 1.023 Finland 5749 5854 1.83 34 29 -15.0 0.6 0.524 Belgium 8371 8887 6.16 34 36 6.1 0.4 0.425 Denmark 6564 6347 -3.31 28 34 20.8 0.4 0.526 New Zealand 1978 1965 -0.66 27 29 6.4 1.4 1.527 Austria 9876 9677 -2.01 27 26 -3.0 0.3 0.328 Mauritius 213 226 6.10 22 20 -8.4 10.1 8.729 Poland 47561 50243 5.64 20 24 16.6 neg neg30 Norway 3395 NA NA 19 22 14.8 0.6 NA31 Ireland 7713 NA NA 18 19 3.0 0.2 NA32 Indonesia 5158 5486 6.36 18 20 10.1 0.3 0.433 Saudi Arabia 4126 4087 -0.95 16 17 3.9 0.4 0.434 Portugal 20989 NA NA 16 15 -2.2 0.1 NA35 Philippines 3066 NA NA 16 17 10.6 0.5 NA36 Turkey 8938 9873 10.46 11 11 -2.5 0.1 0.137 Brazil 4823 4936 2.34 11 12 6.9 0.2 0.238 Mexico 15083 14450 -4.20 8 9 11.7 0.1 0.139 Egypt NA NA NA 6 5 -15.8 NA NA40 Kazakhstan 4544 5243 15.38 5 8 46.7 0.1 0.141 Argentina 4167 4611 10.66 5 5 1.9 0.1 0.142 Jordan 2094 2288 9.26 5 4 -8.4 0.2 0.243 Kuwait 2649 NA NA 4 5 28.4 0.2 NA44 Syria Arab Republic 4196 5253 25.19 3 3 -1.5 0.1 0.145 Colombia 2041 2042 0.05 3 3 -4.5 0.1 0.146 Uzbekistan 1248 1150 -7.85 3 3 7.6 0.2 0.247 Chile 3234 3061 -5.35 2 3 16.7 0.1 0.148 Uganda 272 337 23.90 2 2 9.7 0.8 0.749 Venezuela 1410 1745 23.76 2 2 9.1 0.1 0.150 Malta 280 299 6.79 1 1 -55.3 0.5 0.251 Cambodia 996 786 -21.08 1 2 11.4 0.1 0.252 Morocco 2669 3058 14.57 1 1 -11.2 0.1 0.053 Peru 1966 1971 0.25 1 1 17.5 0.1 0.154 Tunisia 2743 3118 13.67 1 1 9.6 0.0 0.055 Swaziland 1130 1177 4.16 1 0 -60.8 0.1 0.056 El Salvador 1012 NA NA 0 0 -1.9 neg 0.0
2007 2008 % %Growth Growth
(2008/ 2007) 2007 2008 (2008/ 2007) 2007 2008
Source: For Cols 3 and 4, UNWTO’s Compendium of Tourism Statistics 2010 Edition For Cols 6 and 7, Bureau of Immigration, India
3.3 INTERNATIONAL TOURISM RECEIPTS
As per UNWTO estimates, worldwide receipts from international tourism were US$ 852billion in 2009 down from US$ 942 billion in 2008. All regions suffered a drop in receipts in realterms (and also in arrivals, with the exception of Africa), albeit with varying rates of decline.The brunt of the losses were born by the Americas (-10%), with US $22 billion less than in theprevious year, and Europe (-7%), where receipts declined by around US $ 60 billion (26 billioneuro). Asia and the pacific (-1%), the Middle East and Africa (both -4%) did comparatively
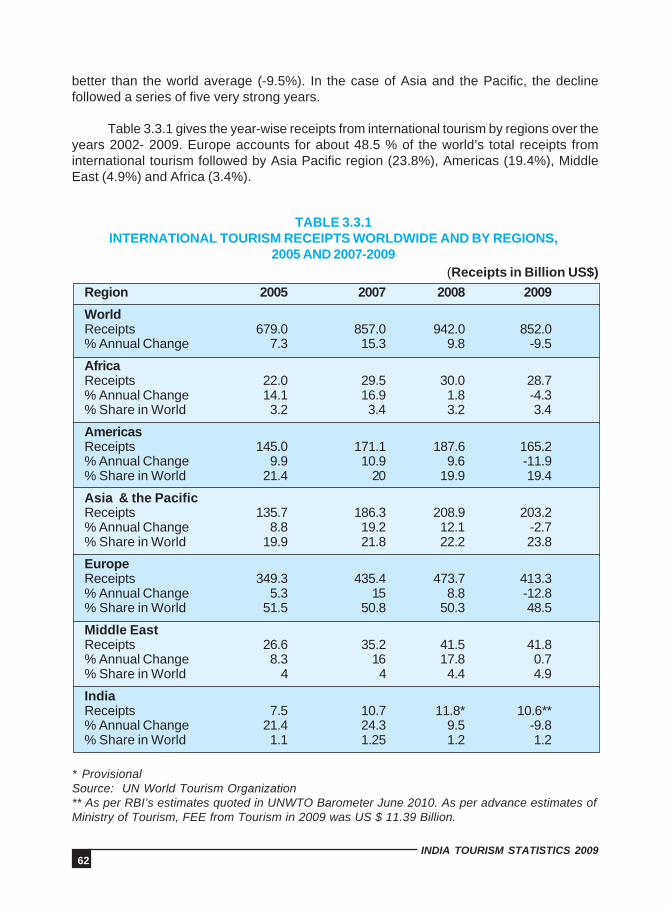
62INDIA TOURISM STATISTICS 2009
better than the world average (-9.5%). In the case of Asia and the Pacific, the declinefollowed a series of five very strong years.
Table 3.3.1 gives the year-wise receipts from international tourism by regions over theyears 2002- 2009. Europe accounts for about 48.5 % of the world’s total receipts frominternational tourism followed by Asia Pacific region (23.8%), Americas (19.4%), MiddleEast (4.9%) and Africa (3.4%).
TABLE 3.3.1INTERNATIONAL TOURISM RECEIPTS WORLDWIDE AND BY REGIONS,
2005 AND 2007-2009(Receipts in Billion US$)
Region 2005 2007 2008 2009
WorldReceipts 679.0 857.0 942.0 852.0% Annual Change 7.3 15.3 9.8 -9.5
AfricaReceipts 22.0 29.5 30.0 28.7% Annual Change 14.1 16.9 1.8 -4.3% Share in World 3.2 3.4 3.2 3.4
AmericasReceipts 145.0 171.1 187.6 165.2% Annual Change 9.9 10.9 9.6 -11.9% Share in World 21.4 20 19.9 19.4
Asia & the PacificReceipts 135.7 186.3 208.9 203.2% Annual Change 8.8 19.2 12.1 -2.7% Share in World 19.9 21.8 22.2 23.8
EuropeReceipts 349.3 435.4 473.7 413.3% Annual Change 5.3 15 8.8 -12.8% Share in World 51.5 50.8 50.3 48.5
Middle EastReceipts 26.6 35.2 41.5 41.8% Annual Change 8.3 16 17.8 0.7% Share in World 4 4 4.4 4.9
IndiaReceipts 7.5 10.7 11.8* 10.6**% Annual Change 21.4 24.3 9.5 -9.8% Share in World 1.1 1.25 1.2 1.2
* ProvisionalSource: UN World Tourism Organization** As per RBI’s estimates quoted in UNWTO Barometer June 2010. As per advance estimates ofMinistry of Tourism, FEE from Tourism in 2009 was US $ 11.39 Billion.
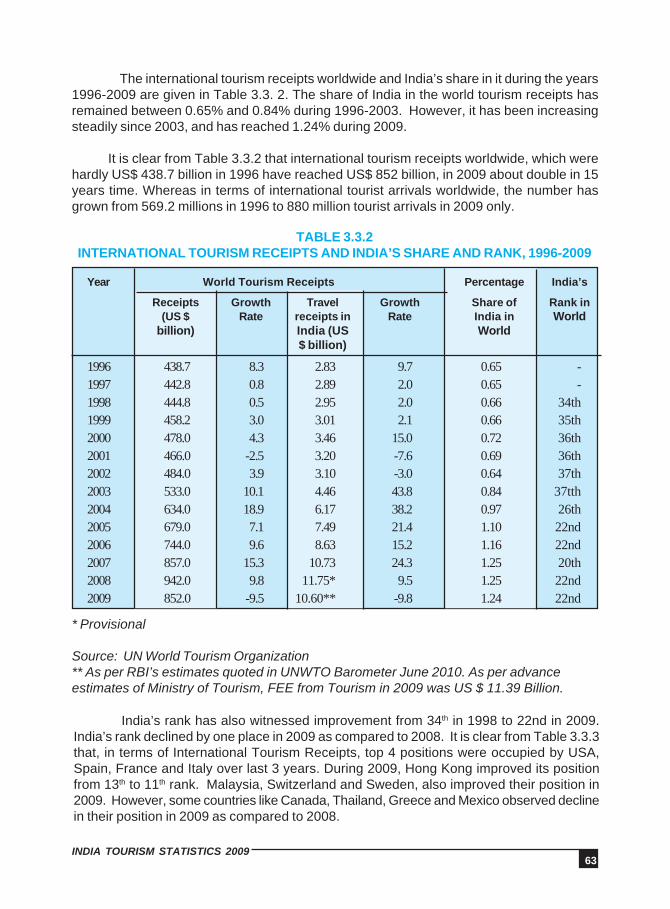
63INDIA TOURISM STATISTICS 2009
The international tourism receipts worldwide and India’s share in it during the years1996-2009 are given in Table 3.3. 2. The share of India in the world tourism receipts hasremained between 0.65% and 0.84% during 1996-2003. However, it has been increasingsteadily since 2003, and has reached 1.24% during 2009.
It is clear from Table 3.3.2 that international tourism receipts worldwide, which werehardly US$ 438.7 billion in 1996 have reached US$ 852 billion, in 2009 about double in 15years time. Whereas in terms of international tourist arrivals worldwide, the number hasgrown from 569.2 millions in 1996 to 880 million tourist arrivals in 2009 only.
TABLE 3.3.2INTERNATIONAL TOURISM RECEIPTS AND INDIA’S SHARE AND RANK, 1996-2009
Year World Tourism Receipts Percentage India’s
Receipts Growth Travel Growth Share of Rank in(US $ Rate receipts in Rate India in World
billion) India (US World$ billion)
1996 438.7 8.3 2.83 9.7 0.65 -1997 442.8 0.8 2.89 2.0 0.65 -1998 444.8 0.5 2.95 2.0 0.66 34th1999 458.2 3.0 3.01 2.1 0.66 35th2000 478.0 4.3 3.46 15.0 0.72 36th2001 466.0 -2.5 3.20 -7.6 0.69 36th2002 484.0 3.9 3.10 -3.0 0.64 37th2003 533.0 10.1 4.46 43.8 0.84 37tth2004 634.0 18.9 6.17 38.2 0.97 26th2005 679.0 7.1 7.49 21.4 1.10 22nd2006 744.0 9.6 8.63 15.2 1.16 22nd2007 857.0 15.3 10.73 24.3 1.25 20th2008 942.0 9.8 11.75* 9.5 1.25 22nd2009 852.0 -9.5 10.60** -9.8 1.24 22nd
* Provisional
Source: UN World Tourism Organization** As per RBI’s estimates quoted in UNWTO Barometer June 2010. As per advanceestimates of Ministry of Tourism, FEE from Tourism in 2009 was US $ 11.39 Billion.
India’s rank has also witnessed improvement from 34th in 1998 to 22nd in 2009.India’s rank declined by one place in 2009 as compared to 2008. It is clear from Table 3.3.3that, in terms of International Tourism Receipts, top 4 positions were occupied by USA,Spain, France and Italy over last 3 years. During 2009, Hong Kong improved its positionfrom 13th to 11th rank. Malaysia, Switzerland and Sweden, also improved their position in2009. However, some countries like Canada, Thailand, Greece and Mexico observed declinein their position in 2009 as compared to 2008.
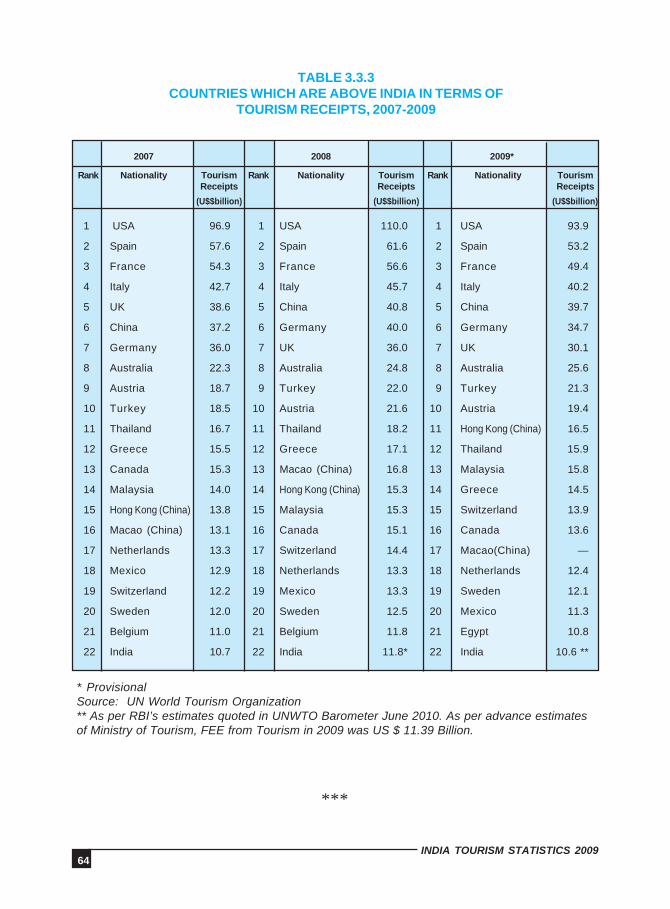
64INDIA TOURISM STATISTICS 2009
2007 2008 2009*
Rank Nationality Tourism Rank Nationality Tourism Rank Nationality TourismReceipts Receipts Receipts
(U$$billion) (U$$billion) (U$$billion)
1 USA 96.9 1 USA 110.0 1 USA 93.9
2 Spain 57.6 2 Spain 61.6 2 Spain 53.2
3 France 54.3 3 France 56.6 3 France 49.4
4 Italy 42.7 4 Italy 45.7 4 Italy 40.2
5 UK 38.6 5 China 40.8 5 China 39.7
6 China 37.2 6 Germany 40.0 6 Germany 34.7
7 Germany 36.0 7 UK 36.0 7 UK 30.1
8 Australia 22.3 8 Australia 24.8 8 Australia 25.6
9 Austria 18.7 9 Turkey 22.0 9 Turkey 21.3
10 Turkey 18.5 10 Austria 21.6 10 Austria 19.4
11 Thailand 16.7 11 Thailand 18.2 11 Hong Kong (China) 16.5
12 Greece 15.5 12 Greece 17.1 12 Thailand 15.9
13 Canada 15.3 13 Macao (China) 16.8 13 Malaysia 15.8
14 Malaysia 14.0 14 Hong Kong (China) 15.3 14 Greece 14.5
15 Hong Kong (China) 13.8 15 Malaysia 15.3 15 Switzerland 13.9
16 Macao (China) 13.1 16 Canada 15.1 16 Canada 13.6
17 Netherlands 13.3 17 Switzerland 14.4 17 Macao(China) —
18 Mexico 12.9 18 Netherlands 13.3 18 Netherlands 12.4
19 Switzerland 12.2 19 Mexico 13.3 19 Sweden 12.1
20 Sweden 12.0 20 Sweden 12.5 20 Mexico 11.3
21 Belgium 11.0 21 Belgium 11.8 21 Egypt 10.8
22 India 10.7 22 India 11.8* 22 India 10.6 **
* ProvisionalSource: UN World Tourism Organization** As per RBI’s estimates quoted in UNWTO Barometer June 2010. As per advance estimatesof Ministry of Tourism, FEE from Tourism in 2009 was US $ 11.39 Billion.
TABLE 3.3.3COUNTRIES WHICH ARE ABOVE INDIA IN TERMS OF
TOURISM RECEIPTS, 2007-2009
***
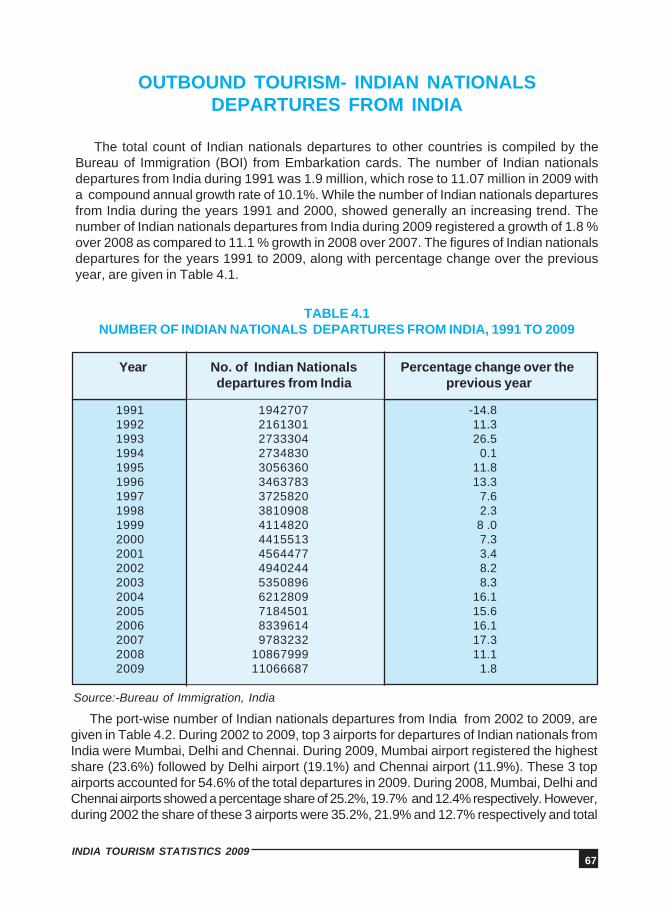
67INDIA TOURISM STATISTICS 2009
OUTBOUND TOURISM- INDIAN NATIONALSDEPARTURES FROM INDIA
The total count of Indian nationals departures to other countries is compiled by theBureau of Immigration (BOI) from Embarkation cards. The number of Indian nationalsdepartures from India during 1991 was 1.9 million, which rose to 11.07 million in 2009 witha compound annual growth rate of 10.1%. While the number of Indian nationals departuresfrom India during the years 1991 and 2000, showed generally an increasing trend. Thenumber of Indian nationals departures from India during 2009 registered a growth of 1.8 %over 2008 as compared to 11.1 % growth in 2008 over 2007. The figures of Indian nationalsdepartures for the years 1991 to 2009, along with percentage change over the previousyear, are given in Table 4.1.
TABLE 4.1NUMBER OF INDIAN NATIONALS DEPARTURES FROM INDIA, 1991 TO 2009
Year No. of Indian Nationals Percentage change over thedepartures from India previous year
Source:-Bureau of Immigration, India
1991 1942707 -14.81992 2161301 11.31993 2733304 26.51994 2734830 0.11995 3056360 11.81996 3463783 13.31997 3725820 7.61998 3810908 2.31999 4114820 8 .02000 4415513 7.32001 4564477 3.42002 4940244 8.22003 5350896 8.32004 6212809 16.12005 7184501 15.62006 8339614 16.12007 9783232 17.32008 10867999 11.12009 11066687 1.8
The port-wise number of Indian nationals departures from India from 2002 to 2009, aregiven in Table 4.2. During 2002 to 2009, top 3 airports for departures of Indian nationals fromIndia were Mumbai, Delhi and Chennai. During 2009, Mumbai airport registered the highestshare (23.6%) followed by Delhi airport (19.1%) and Chennai airport (11.9%). These 3 topairports accounted for 54.6% of the total departures in 2009. During 2008, Mumbai, Delhi andChennai airports showed a percentage share of 25.2%, 19.7% and 12.4% respectively. However,during 2002 the share of these 3 airports were 35.2%, 21.9% and 12.7% respectively and total
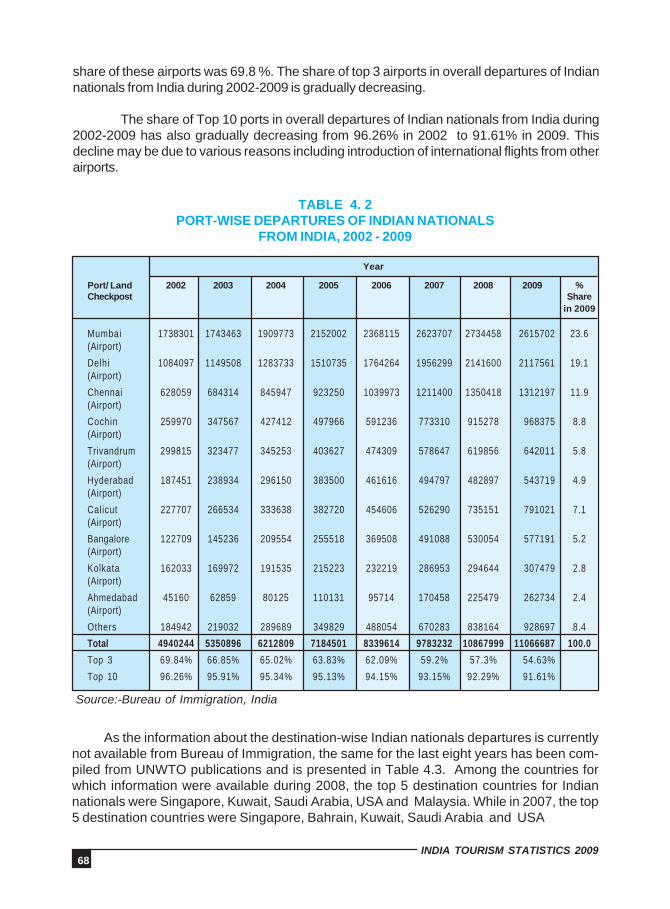
68INDIA TOURISM STATISTICS 2009
TABLE 4. 2PORT-WISE DEPARTURES OF INDIAN NATIONALS
FROM INDIA, 2002 - 2009
Year
Port/ Land 2002 2003 2004 2005 2006 2007 2008 2009 %Checkpost Share
in 2009
Mumbai 1738301 1743463 1909773 2152002 2368115 2623707 2734458 2615702 23.6(Airport)
Delhi 1084097 1149508 1283733 1510735 1764264 1956299 2141600 2117561 19.1(Airport)
Chennai 628059 684314 845947 923250 1039973 1211400 1350418 1312197 11.9(Airport)
Cochin 259970 347567 427412 497966 591236 773310 915278 968375 8.8(Airport)
Trivandrum 299815 323477 345253 403627 474309 578647 619856 642011 5.8(Airport)
Hyderabad 187451 238934 296150 383500 461616 494797 482897 543719 4.9(Airport)
Calicut 227707 266534 333638 382720 454606 526290 735151 791021 7.1(Airport)
Bangalore 122709 145236 209554 255518 369508 491088 530054 577191 5.2(Airport)
Kolkata 162033 169972 191535 215223 232219 286953 294644 307479 2.8(Airport)
Ahmedabad 45160 62859 80125 110131 95714 170458 225479 262734 2.4(Airport)
Others 184942 219032 289689 349829 488054 670283 838164 928697 8.4
Total 4940244 5350896 6212809 7184501 8339614 9783232 10867999 11066687 100.0
Top 3 69.84% 66.85% 65.02% 63.83% 62.09% 59.2% 57.3% 54.63%
Top 10 96.26% 95.91% 95.34% 95.13% 94.15% 93.15% 92.29% 91.61%
Source:-Bureau of Immigration, India
As the information about the destination-wise Indian nationals departures is currentlynot available from Bureau of Immigration, the same for the last eight years has been com-piled from UNWTO publications and is presented in Table 4.3. Among the countries forwhich information were available during 2008, the top 5 destination countries for Indiannationals were Singapore, Kuwait, Saudi Arabia, USA and Malaysia. While in 2007, the top5 destination countries were Singapore, Bahrain, Kuwait, Saudi Arabia and USA
share of these airports was 69.8 %. The share of top 3 airports in overall departures of Indiannationals from India during 2002-2009 is gradually decreasing.
The share of Top 10 ports in overall departures of Indian nationals from India during2002-2009 has also gradually decreasing from 96.26% in 2002 to 91.61% in 2009. Thisdecline may be due to various reasons including introduction of international flights from otherairports.
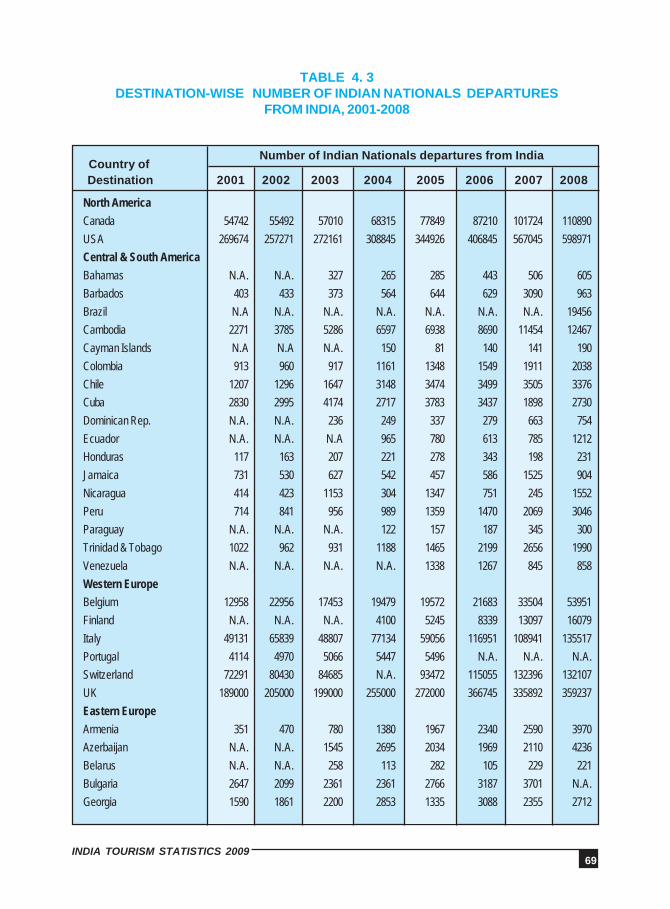
69INDIA TOURISM STATISTICS 2009
Number of Indian Nationals departures from India
Destination 2001 2002 2003 2004 2005 2006 2007 2008
TABLE 4. 3DESTINATION-WISE NUMBER OF INDIAN NATIONALS DEPARTURES
FROM INDIA, 2001-2008
North AmericaCanada 54742 55492 57010 68315 77849 87210 101724 110890
USA 269674 257271 272161 308845 344926 406845 567045 598971
Central & South AmericaBahamas N.A. N.A. 327 265 285 443 506 605
Barbados 403 433 373 564 644 629 3090 963
Brazil N.A N.A. N.A. N.A. N.A. N.A. N.A. 19456
Cambodia 2271 3785 5286 6597 6938 8690 11454 12467
Cayman Islands N.A N.A N.A. 150 81 140 141 190
Colombia 913 960 917 1161 1348 1549 1911 2038
Chile 1207 1296 1647 3148 3474 3499 3505 3376
Cuba 2830 2995 4174 2717 3783 3437 1898 2730
Dominican Rep. N.A. N.A. 236 249 337 279 663 754
Ecuador N.A. N.A. N.A 965 780 613 785 1212
Honduras 117 163 207 221 278 343 198 231
Jamaica 731 530 627 542 457 586 1525 904
Nicaragua 414 423 1153 304 1347 751 245 1552
Peru 714 841 956 989 1359 1470 2069 3046
Paraguay N.A. N.A. N.A. 122 157 187 345 300
Trinidad & Tobago 1022 962 931 1188 1465 2199 2656 1990
Venezuela N.A. N.A. N.A. N.A. 1338 1267 845 858
Western EuropeBelgium 12958 22956 17453 19479 19572 21683 33504 53951
Finland N.A. N.A. N.A. 4100 5245 8339 13097 16079
Italy 49131 65839 48807 77134 59056 116951 108941 135517
Portugal 4114 4970 5066 5447 5496 N.A. N.A. N.A.
Switzerland 72291 80430 84685 N.A. 93472 115055 132396 132107
UK 189000 205000 199000 255000 272000 366745 335892 359237
Eastern EuropeArmenia 351 470 780 1380 1967 2340 2590 3970
Azerbaijan N.A. N.A. 1545 2695 2034 1969 2110 4236
Belarus N.A. N.A. 258 113 282 105 229 221
Bulgaria 2647 2099 2361 2361 2766 3187 3701 N.A.
Georgia 1590 1861 2200 2853 1335 3088 2355 2712
Country of
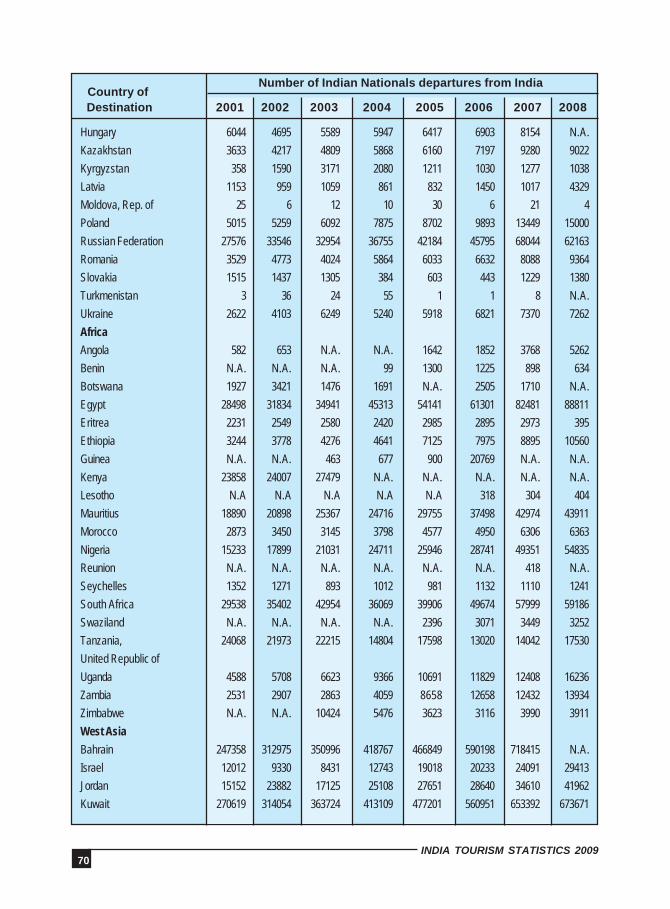
70INDIA TOURISM STATISTICS 2009
Hungary 6044 4695 5589 5947 6417 6903 8154 N.A.
Kazakhstan 3633 4217 4809 5868 6160 7197 9280 9022
Kyrgyzstan 358 1590 3171 2080 1211 1030 1277 1038
Latvia 1153 959 1059 861 832 1450 1017 4329
Moldova, Rep. of 25 6 12 10 30 6 21 4
Poland 5015 5259 6092 7875 8702 9893 13449 15000
Russian Federation 27576 33546 32954 36755 42184 45795 68044 62163
Romania 3529 4773 4024 5864 6033 6632 8088 9364
Slovakia 1515 1437 1305 384 603 443 1229 1380
Turkmenistan 3 36 24 55 1 1 8 N.A.
Ukraine 2622 4103 6249 5240 5918 6821 7370 7262
Africa
Angola 582 653 N.A. N.A. 1642 1852 3768 5262
Benin N.A. N.A. N.A. 99 1300 1225 898 634
Botswana 1927 3421 1476 1691 N.A. 2505 1710 N.A.
Egypt 28498 31834 34941 45313 54141 61301 82481 88811
Eritrea 2231 2549 2580 2420 2985 2895 2973 395
Ethiopia 3244 3778 4276 4641 7125 7975 8895 10560
Guinea N.A. N.A. 463 677 900 20769 N.A. N.A.
Kenya 23858 24007 27479 N.A. N.A. N.A. N.A. N.A.
Lesotho N.A N.A N.A N.A N.A 318 304 404
Mauritius 18890 20898 25367 24716 29755 37498 42974 43911
Morocco 2873 3450 3145 3798 4577 4950 6306 6363
Nigeria 15233 17899 21031 24711 25946 28741 49351 54835
Reunion N.A. N.A. N.A. N.A. N.A. N.A. 418 N.A.
Seychelles 1352 1271 893 1012 981 1132 1110 1241
South Africa 29538 35402 42954 36069 39906 49674 57999 59186
Swaziland N.A. N.A. N.A. N.A. 2396 3071 3449 3252
Tanzania, 24068 21973 22215 14804 17598 13020 14042 17530
United Republic of
Uganda 4588 5708 6623 9366 10691 11829 12408 16236
Zambia 2531 2907 2863 4059 8658 12658 12432 13934
Zimbabwe N.A. N.A. 10424 5476 3623 3116 3990 3911
West AsiaBahrain 247358 312975 350996 418767 466849 590198 718415 N.A.
Israel 12012 9330 8431 12743 19018 20233 24091 29413
Jordan 15152 23882 17125 25108 27651 28640 34610 41962
Kuwait 270619 314054 363724 413109 477201 560951 653392 673671
Number of Indian Nationals departures from India
Destination 2001 2002 2003 2004 2005 2006 2007 2008Country of
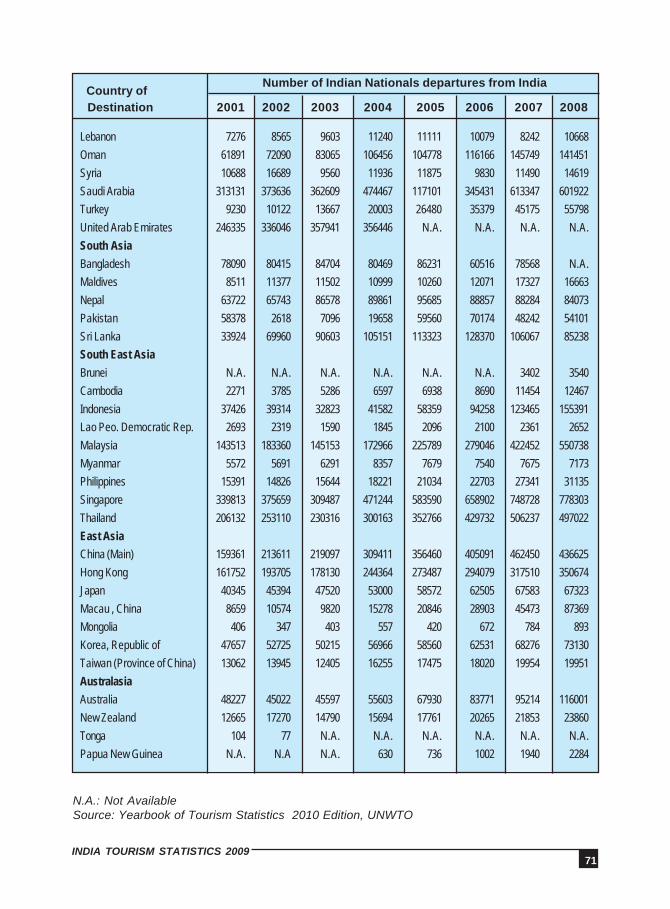
71INDIA TOURISM STATISTICS 2009
Number of Indian Nationals departures from India
Destination 2001 2002 2003 2004 2005 2006 2007 2008
Lebanon 7276 8565 9603 11240 11111 10079 8242 10668
Oman 61891 72090 83065 106456 104778 116166 145749 141451
Syria 10688 16689 9560 11936 11875 9830 11490 14619
Saudi Arabia 313131 373636 362609 474467 117101 345431 613347 601922
Turkey 9230 10122 13667 20003 26480 35379 45175 55798
United Arab Emirates 246335 336046 357941 356446 N.A. N.A. N.A. N.A.
South AsiaBangladesh 78090 80415 84704 80469 86231 60516 78568 N.A.
Maldives 8511 11377 11502 10999 10260 12071 17327 16663
Nepal 63722 65743 86578 89861 95685 88857 88284 84073
Pakistan 58378 2618 7096 19658 59560 70174 48242 54101
Sri Lanka 33924 69960 90603 105151 113323 128370 106067 85238
South East AsiaBrunei N.A. N.A. N.A. N.A. N.A. N.A. 3402 3540
Cambodia 2271 3785 5286 6597 6938 8690 11454 12467
Indonesia 37426 39314 32823 41582 58359 94258 123465 155391
Lao Peo. Democratic Rep. 2693 2319 1590 1845 2096 2100 2361 2652
Malaysia 143513 183360 145153 172966 225789 279046 422452 550738
Myanmar 5572 5691 6291 8357 7679 7540 7675 7173
Philippines 15391 14826 15644 18221 21034 22703 27341 31135
Singapore 339813 375659 309487 471244 583590 658902 748728 778303
Thailand 206132 253110 230316 300163 352766 429732 506237 497022
East AsiaChina (Main) 159361 213611 219097 309411 356460 405091 462450 436625
Hong Kong 161752 193705 178130 244364 273487 294079 317510 350674
Japan 40345 45394 47520 53000 58572 62505 67583 67323
Macau , China 8659 10574 9820 15278 20846 28903 45473 87369
Mongolia 406 347 403 557 420 672 784 893
Korea, Republic of 47657 52725 50215 56966 58560 62531 68276 73130
Taiwan (Province of China) 13062 13945 12405 16255 17475 18020 19954 19951
AustralasiaAustralia 48227 45022 45597 55603 67930 83771 95214 116001
New Zealand 12665 17270 14790 15694 17761 20265 21853 23860
Tonga 104 77 N.A. N.A. N.A. N.A. N.A. N.A.
Papua New Guinea N.A. N.A N.A. 630 736 1002 1940 2284
N.A.: Not AvailableSource: Yearbook of Tourism Statistics 2010 Edition, UNWTO
Country of

75INDIA TOURISM STATISTICS 2009
DOMESTIC TOURISM
The compilation of domestic tourism statistics is undertaken by the Statistical Cellsin the Departments of Tourism of State/UT Governments. These statistics are based on themonthly returns collected from hotels and other accommodation establishments. Theinformation is collected by using specific formats, and aggregate centre-wise statistics aresent to the Market Research Division of the Union Ministry of Tourism. Most of the States/UTs have been furnishing information on domestic and foreign tourist visits to the States, asalso number of nights spent by them. However, there are certain data-gaps as some of theStates have not been furnishing complete information required to tabulate data on All-Indiabasis. In such cases, relevant figures have been estimated.
5.1. DOMESTIC AND FOREIGN TOURIST VISITS DURING 1991 TO 2009
Table 5.1.1 presents the statistics on domestic and foreign tourist visits to variousStates and Union Territories during the years 1991 to 2009. As may be seen from this Table,there has been a continuous increase in domestic tourist visits, with the compound annualgrowth rate (CAGR) of domestic tourist visits to all States/UTs from 1991 to 2009 being 13.5 %.The foreign tourist visits too have been increasing over the years, though there was a negativegrowth in the years 1992 and 2002. The foreign tourist visits to all States/UTs during 1991 to2009 witnessed a CAGR of 8.6 %. The year 2009 witnessed a growth of 15.5 % in domestictourist visits over the year 2008, which is higher than the growth of 6.9 % in the year 2008 over2007. During 2009, the visits by foreign tourists have shown a negative growth of 2.8 % over2008, as compared to an increase of 6.4 % in 2008 over 2007.
TABLE 5.1.1DOMESTIC & FOREIGN TOURIST VISITS TO STATES/UTs, 1991-2009
1991 66670303 3146652 - -1992 81455861 3095160 22.2% -1.6%1993 105811696 3541727 29.9% 14.4%1994 127118655 4030216 20.1% 13.8%1995 136643600 4641279 7.5% 15.2%1996 140119672 5030342 2.5% 8.4%1997 159877208 5500419 14.1% 9.3%1998 168196000 5539704 5.2% 3.7%1999 190671034 5832015 13.4% 5.3%2000 220106911 5893542 15.4% 1.1%2001 236469599 5436261 7.4% 7.8%2002 269598028 5157518 14.0% -5.1%2003 309038335 6708479 14.6% 30.1%
Year Tourist Visits Annual Growth Rate
Domestic Foreign Domestic Foreign

76INDIA TOURISM STATISTICS 2009
Year Tourist Visits Annual Growth Rate
Domestic Foreign Domestic Foreign
2004 366267522 8360278 18.5% 24.6%2005 391948589 9949676 7.0% 19.0%2006 462310177 11747914 18.0% 18.1%2007 526564364 13267273 13.9% 12.1%2008 562982298 14112590 6.9% 6.4%2009 650038673 13717522 15.5% -2.8%
From the following graphs, it is apparent that numbers of domestic and foreign tourist visitsto States/UTs during last 9 years have been consistently registering an increasing trend,except for a decline in foreign tourist visits in the years 2001 and 2002.
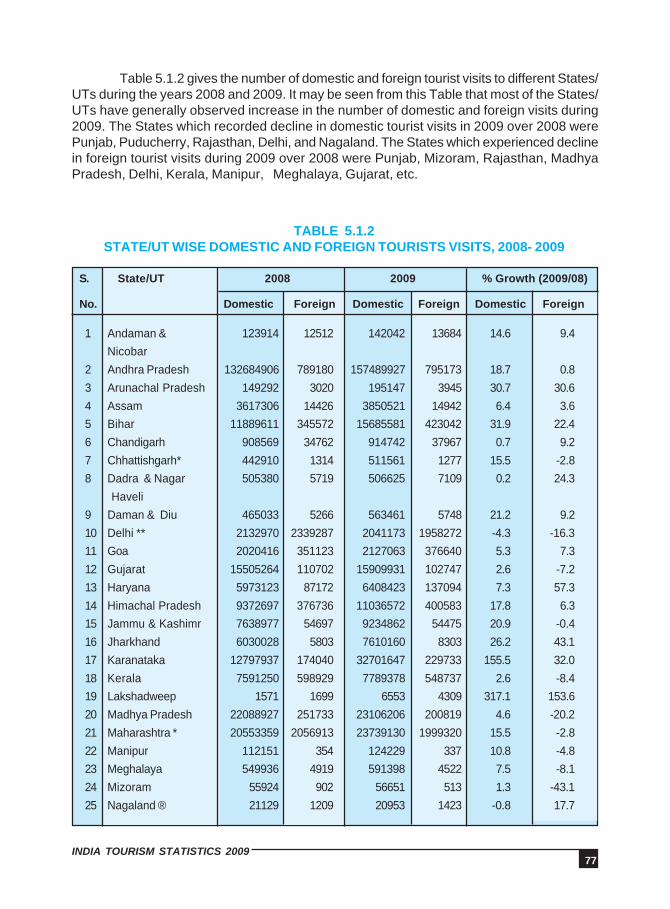
77INDIA TOURISM STATISTICS 2009
Table 5.1.2 gives the number of domestic and foreign tourist visits to different States/UTs during the years 2008 and 2009. It may be seen from this Table that most of the States/UTs have generally observed increase in the number of domestic and foreign visits during2009. The States which recorded decline in domestic tourist visits in 2009 over 2008 werePunjab, Puducherry, Rajasthan, Delhi, and Nagaland. The States which experienced declinein foreign tourist visits during 2009 over 2008 were Punjab, Mizoram, Rajasthan, MadhyaPradesh, Delhi, Kerala, Manipur, Meghalaya, Gujarat, etc.
TABLE 5.1.2STATE/UT WISE DOMESTIC AND FOREIGN TOURISTS VISITS, 2008- 2009
S. State/UT
2008 2009 % Growth (2009/08)
No. Domestic Foreign Domestic Foreign Domestic Foreign
1 Andaman & 123914 12512 142042 13684 14.6 9.4Nicobar
2 Andhra Pradesh 132684906 789180 157489927 795173 18.7 0.83 Arunachal Pradesh 149292 3020 195147 3945 30.7 30.64 Assam 3617306 14426 3850521 14942 6.4 3.65 Bihar 11889611 345572 15685581 423042 31.9 22.46 Chandigarh 908569 34762 914742 37967 0.7 9.27 Chhattishgarh* 442910 1314 511561 1277 15.5 -2.88 Dadra & Nagar 505380 5719 506625 7109 0.2 24.3
Haveli9 Daman & Diu 465033 5266 563461 5748 21.2 9.210 Delhi ** 2132970 2339287 2041173 1958272 -4.3 -16.311 Goa 2020416 351123 2127063 376640 5.3 7.312 Gujarat 15505264 110702 15909931 102747 2.6 -7.213 Haryana 5973123 87172 6408423 137094 7.3 57.314 Himachal Pradesh 9372697 376736 11036572 400583 17.8 6.315 Jammu & Kashimr 7638977 54697 9234862 54475 20.9 -0.416 Jharkhand 6030028 5803 7610160 8303 26.2 43.117 Karanataka 12797937 174040 32701647 229733 155.5 32.018 Kerala 7591250 598929 7789378 548737 2.6 -8.419 Lakshadweep 1571 1699 6553 4309 317.1 153.620 Madhya Pradesh 22088927 251733 23106206 200819 4.6 -20.221 Maharashtra * 20553359 2056913 23739130 1999320 15.5 -2.822 Manipur 112151 354 124229 337 10.8 -4.823 Meghalaya 549936 4919 591398 4522 7.5 -8.124 Mizoram 55924 902 56651 513 1.3 -43.125 Nagaland ® 21129 1209 20953 1423 -0.8 17.7

78INDIA TOURISM STATISTICS 2009
S. State/UT
2008 2009 % Growth (2009/08
No. Domestic Foreign Domestic Foreign Domestic Foreign
26 Orissa 6358445 43966 6891510 45684 8.4 3.927 Punjab 509428 6869 457240 3184 -10.2 -53.628 Puducherry 827799 60309 851192 54039 2.8 -10.429 Rajasthan 28358918 1477646 25558691 1073414 -9.9 -27.430 Sikkim ® 460564 19154 547810 17730 18.9 -7.431 Tamil Nadu 98285121 2029410 115755800 2369050 17.8 16.732 Tripura 245438 3577 317541 4246 29.4 18.733 Uttar Pradesh 124843242 1610089 134831852 1532573 8.0 -4.834 Uttarakhand 20546323 99910 21934567 106470 6.8 6.635 West Bengal 19314440 1133671 20528534 1180418 6.3 4.1 Total 562982298 14112590 650038673 13717522 15.5 -2.8
* Estimated using all India growth rate ® Revised domestic tourist visits for 2008**Estimated using tourist visits figures of sample hotels furnished by Delhi Govt.
Table 5.1.3 provides the percentage shares and ranks of various States/UTs in domesticand foreign tourist visits during 2009. The top 5 States in domestic tourist visits in 2009 wereAndhra Pradesh (157.48 million), Uttar Pradesh (134.83 million), Tamil Nadu (115.76 million),Karnataka (32.70) and Rajasthan (25.56 million) with their respective shares being 24.2%,20.7%, 17.8%, 5.0% and 3.9%. These 5 States accounted for about 71.6% of the totaldomestic tourist visits in the country. In respect of foreign tourist visits in 2009, the top 5States/UTs were Tamil Nadu (2.37 million), Maharashtra (2.0 million), Delhi (1.96 million),Uttar Pradesh (1.53 million) and West Bengal (1.18 million) with their respective sharesbeing 17.3%, 14.6%, 14.3%, 11.2% and 8.6%. These 5 States/UTs accounted for about66.0% of the total foreign tourist visits to the States/UTs in the country.
S. State/UT Tourist Visits Percentage Share Rank
No. (Numbers)
Domestic Foreign Domestic Foreign Domestic Foreign
TABLE 5.1.3PERCENTAGE SHARE AND RANK OF DIFFERENENT STATES/UTs
IN DOMESTIC AND FOREIGN TOURIST VISITS, DURING 2009
1 Andaman & Nicobar 142042 13684 0.0 0.1 31 232 Andhra Pradesh 157489927 795173 24.2 5.8 1 73 Arunachal Pradesh 195147 3945 0.0 0.0 30 304 Assam 3850521 14942 0.6 0.1 18 225 Bihar 15685581 423042 2.4 3.1 11 96 Chandigarh 914742 37967 0.1 0.3 21 207 Chhattisgarh * 511561 1277 0.1 0.0 26 33
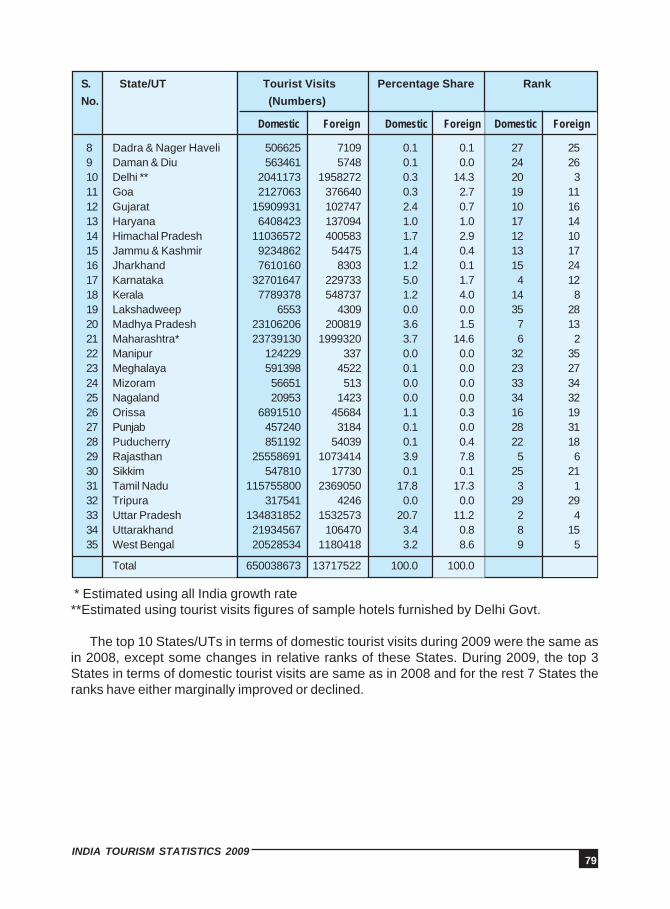
79INDIA TOURISM STATISTICS 2009
S. State/UT Tourist Visits Percentage Share Rank
No. (Numbers)
Domestic Foreign Domestic Foreign Domestic Foreign
8 Dadra & Nager Haveli 506625 7109 0.1 0.1 27 259 Daman & Diu 563461 5748 0.1 0.0 24 2610 Delhi ** 2041173 1958272 0.3 14.3 20 311 Goa 2127063 376640 0.3 2.7 19 1112 Gujarat 15909931 102747 2.4 0.7 10 1613 Haryana 6408423 137094 1.0 1.0 17 1414 Himachal Pradesh 11036572 400583 1.7 2.9 12 1015 Jammu & Kashmir 9234862 54475 1.4 0.4 13 1716 Jharkhand 7610160 8303 1.2 0.1 15 2417 Karnataka 32701647 229733 5.0 1.7 4 1218 Kerala 7789378 548737 1.2 4.0 14 819 Lakshadweep 6553 4309 0.0 0.0 35 2820 Madhya Pradesh 23106206 200819 3.6 1.5 7 1321 Maharashtra* 23739130 1999320 3.7 14.6 6 222 Manipur 124229 337 0.0 0.0 32 3523 Meghalaya 591398 4522 0.1 0.0 23 2724 Mizoram 56651 513 0.0 0.0 33 3425 Nagaland 20953 1423 0.0 0.0 34 3226 Orissa 6891510 45684 1.1 0.3 16 1927 Punjab 457240 3184 0.1 0.0 28 3128 Puducherry 851192 54039 0.1 0.4 22 1829 Rajasthan 25558691 1073414 3.9 7.8 5 630 Sikkim 547810 17730 0.1 0.1 25 2131 Tamil Nadu 115755800 2369050 17.8 17.3 3 132 Tripura 317541 4246 0.0 0.0 29 2933 Uttar Pradesh 134831852 1532573 20.7 11.2 2 434 Uttarakhand 21934567 106470 3.4 0.8 8 1535 West Bengal 20528534 1180418 3.2 8.6 9 5
Total 650038673 13717522 100.0 100.0
* Estimated using all India growth rate**Estimated using tourist visits figures of sample hotels furnished by Delhi Govt.
The top 10 States/UTs in terms of domestic tourist visits during 2009 were the same asin 2008, except some changes in relative ranks of these States. During 2009, the top 3States in terms of domestic tourist visits are same as in 2008 and for the rest 7 States theranks have either marginally improved or declined.
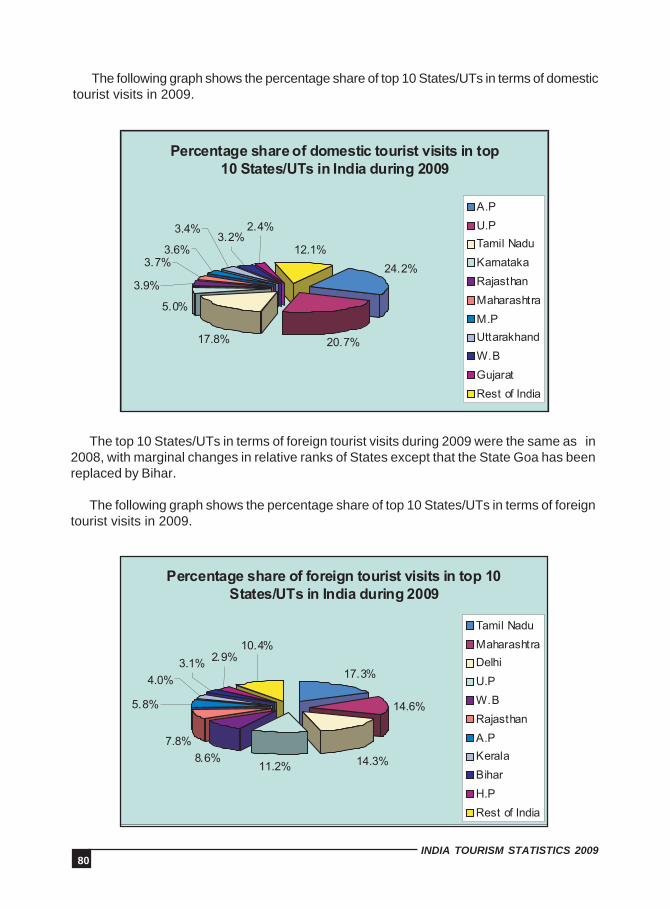
80INDIA TOURISM STATISTICS 2009
The top 10 States/UTs in terms of foreign tourist visits during 2009 were the same as in2008, with marginal changes in relative ranks of States except that the State Goa has beenreplaced by Bihar.
The following graph shows the percentage share of top 10 States/UTs in terms of foreigntourist visits in 2009.
The following graph shows the percentage share of top 10 States/UTs in terms of domestictourist visits in 2009.
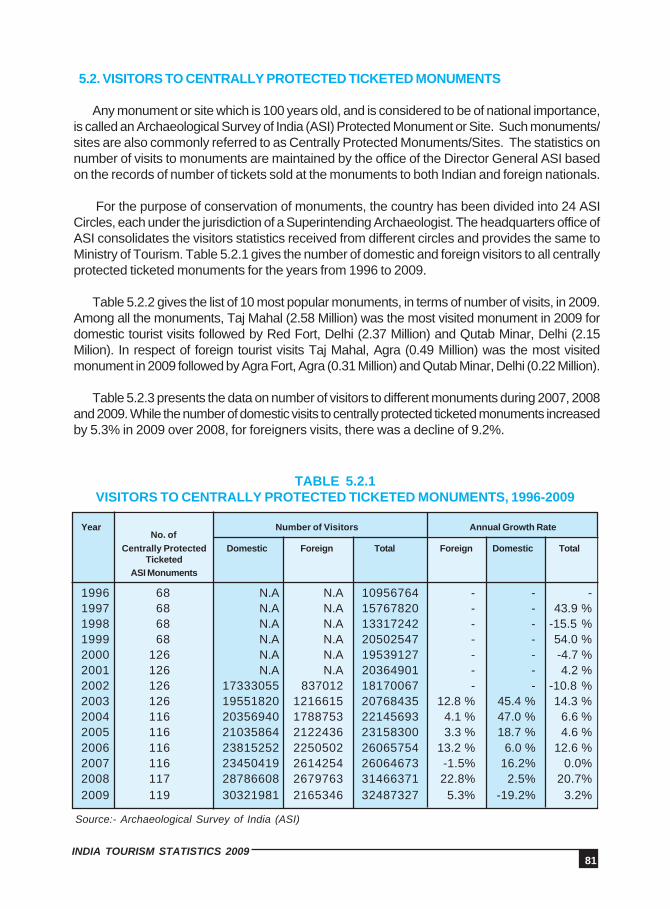
81INDIA TOURISM STATISTICS 2009
5.2. VISITORS TO CENTRALLY PROTECTED TICKETED MONUMENTS
Any monument or site which is 100 years old, and is considered to be of national importance,is called an Archaeological Survey of India (ASI) Protected Monument or Site. Such monuments/sites are also commonly referred to as Centrally Protected Monuments/Sites. The statistics onnumber of visits to monuments are maintained by the office of the Director General ASI basedon the records of number of tickets sold at the monuments to both Indian and foreign nationals.
For the purpose of conservation of monuments, the country has been divided into 24 ASICircles, each under the jurisdiction of a Superintending Archaeologist. The headquarters office ofASI consolidates the visitors statistics received from different circles and provides the same toMinistry of Tourism. Table 5.2.1 gives the number of domestic and foreign visitors to all centrallyprotected ticketed monuments for the years from 1996 to 2009.
Table 5.2.2 gives the list of 10 most popular monuments, in terms of number of visits, in 2009.Among all the monuments, Taj Mahal (2.58 Million) was the most visited monument in 2009 fordomestic tourist visits followed by Red Fort, Delhi (2.37 Million) and Qutab Minar, Delhi (2.15Milion). In respect of foreign tourist visits Taj Mahal, Agra (0.49 Million) was the most visitedmonument in 2009 followed by Agra Fort, Agra (0.31 Million) and Qutab Minar, Delhi (0.22 Million).
Table 5.2.3 presents the data on number of visitors to different monuments during 2007, 2008and 2009. While the number of domestic visits to centrally protected ticketed monuments increasedby 5.3% in 2009 over 2008, for foreigners visits, there was a decline of 9.2%.
TABLE 5.2.1VISITORS TO CENTRALLY PROTECTED TICKETED MONUMENTS, 1996-2009
Year Number of Visitors Annual Growth Rate
Centrally Protected Domestic Foreign Total Foreign Domestic TotalTicketed
ASI Monuments
1996 68 N.A N.A 10956764 - - -1997 68 N.A N.A 15767820 - - 43.9 %1998 68 N.A N.A 13317242 - - -15.5 %1999 68 N.A N.A 20502547 - - 54.0 %2000 126 N.A N.A 19539127 - - -4.7 %2001 126 N.A N.A 20364901 - - 4.2 %2002 126 17333055 837012 18170067 - - -10.8 %2003 126 19551820 1216615 20768435 12.8 % 45.4 % 14.3 %2004 116 20356940 1788753 22145693 4.1 % 47.0 % 6.6 %2005 116 21035864 2122436 23158300 3.3 % 18.7 % 4.6 %2006 116 23815252 2250502 26065754 13.2 % 6.0 % 12.6 %2007 116 23450419 2614254 26064673 -1.5% 16.2% 0.0%2008 117 28786608 2679763 31466371 22.8% 2.5% 20.7%2009 119 30321981 2165346 32487327 5.3% -19.2% 3.2%
Source:- Archaeological Survey of India (ASI)
No. of

82INDIA TOURISM STATISTICS 2009
The following graphs indicate that the number of domestic and foreign tourist visits tocentrally protected ticketed monuments during last 7 years has been consistently increasingexcept for a decline in domestic and foreign tourist visits in 2007 and 2009 respectively.

83INDIA TOURISM STATISTICS 2009
TABLE 5.2.2DOMESTIC AND FOREIGN VISITORS AT 10 MOST POPULAR CENTRALLY
PROTECTED TICKETED ASI MONUMENTS DURING 2009
10 Most popular Centrally ProtectedMonuments for Domestic Visitors
in 2009
Rank Name of Monuments No of Rank Name of Monuments No ofDomestic ForeignVisitors Visitors
1 Taj Mahal, Agra 25855602 Red Fort, Delhi 23711123 Qutab Minar, Delhi 21516774 Sun Temple, Konark 17386965 Agra Fort, Agra 13988906 Charminar Hyderabad 13177377 Golconda Fort, 1222409
Hyderabad8 Bibi-ka-Maqbara, 1020559
Aurangabad9 Gol-Gumbaz, Bijapur 95559810 Group of monuments, 951015
Mamallapuram
1 Taj Mahal, Agra 4915542 Agra Fort, Agra 3141163 Qutab Minar, Delhi 2216234 Humayun’s Tomb, Delhi 1830425 Fatehpur Sikri, Agra, 1596726 Red Fort, Delhi 1269467 Western Group of 65860
Temples, Khajuraho8 Group of monuments, 62874
Mamallapuram9 Sarnath Excavated Site 5107910 Daria Daulat Bagh, 35892
Srirangapatnam
Source: Archaeological Survey of India (ASI)
10 Most popular Centrally ProtectedMonuments for Foreign Visitors
in 2009
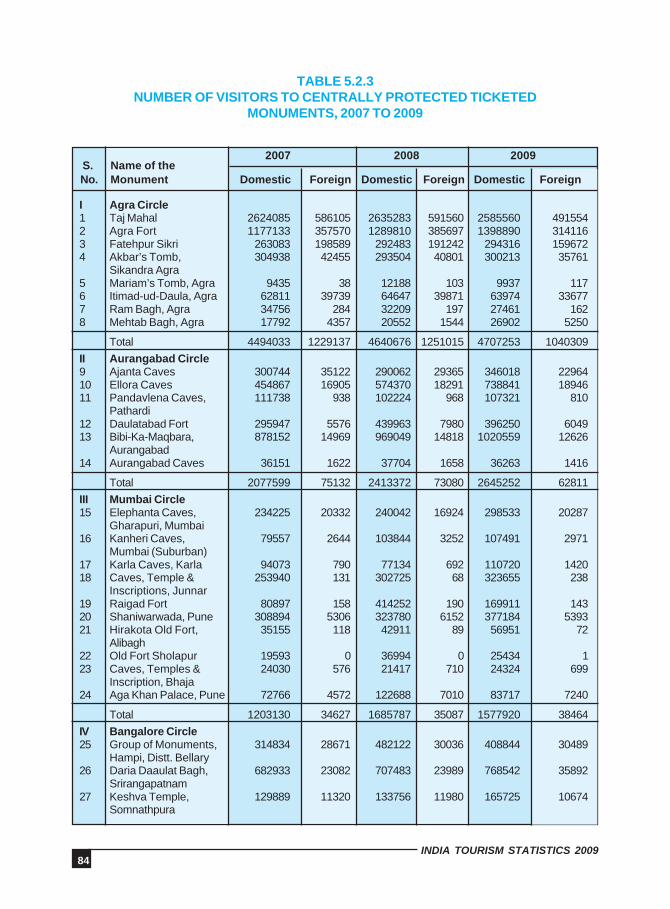
84INDIA TOURISM STATISTICS 2009
TABLE 5.2.3NUMBER OF VISITORS TO CENTRALLY PROTECTED TICKETED
MONUMENTS, 2007 TO 2009
I Agra Circle 1 Taj Mahal 2624085 586105 2635283 591560 2585560 4915542 Agra Fort 1177133 357570 1289810 385697 1398890 3141163 Fatehpur Sikri 263083 198589 292483 191242 294316 1596724 Akbar’s Tomb, 304938 42455 293504 40801 300213 35761
Sikandra Agra5 Mariam’s Tomb, Agra 9435 38 12188 103 9937 1176 Itimad-ud-Daula, Agra 62811 39739 64647 39871 63974 336777 Ram Bagh, Agra 34756 284 32209 197 27461 1628 Mehtab Bagh, Agra 17792 4357 20552 1544 26902 5250
Total 4494033 1229137 4640676 1251015 4707253 1040309II Aurangabad Circle9 Ajanta Caves 300744 35122 290062 29365 346018 2296410 Ellora Caves 454867 16905 574370 18291 738841 1894611 Pandavlena Caves, 111738 938 102224 968 107321 810
Pathardi12 Daulatabad Fort 295947 5576 439963 7980 396250 604913 Bibi-Ka-Maqbara, 878152 14969 969049 14818 1020559 12626
Aurangabad14 Aurangabad Caves 36151 1622 37704 1658 36263 1416
Total 2077599 75132 2413372 73080 2645252 62811III Mumbai Circle15 Elephanta Caves, 234225 20332 240042 16924 298533 20287
Gharapuri, Mumbai16 Kanheri Caves, 79557 2644 103844 3252 107491 2971
Mumbai (Suburban)17 Karla Caves, Karla 94073 790 77134 692 110720 142018 Caves, Temple & 253940 131 302725 68 323655 238
Inscriptions, Junnar19 Raigad Fort 80897 158 414252 190 169911 14320 Shaniwarwada, Pune 308894 5306 323780 6152 377184 539321 Hirakota Old Fort, 35155 118 42911 89 56951 72
Alibagh22 Old Fort Sholapur 19593 0 36994 0 25434 123 Caves, Temples & 24030 576 21417 710 24324 699
Inscription, Bhaja24 Aga Khan Palace, Pune 72766 4572 122688 7010 83717 7240
Total 1203130 34627 1685787 35087 1577920 38464IV Bangalore Circle25 Group of Monuments, 314834 28671 482122 30036 408844 30489
Hampi, Distt. Bellary26 Daria Daaulat Bagh, 682933 23082 707483 23989 768542 35892
Srirangapatnam27 Keshva Temple, 129889 11320 133756 11980 165725 10674
Somnathpura
2007 2008 2009
No. Monument Domestic Foreign Domestic Foreign Domestic ForeignName of the S.
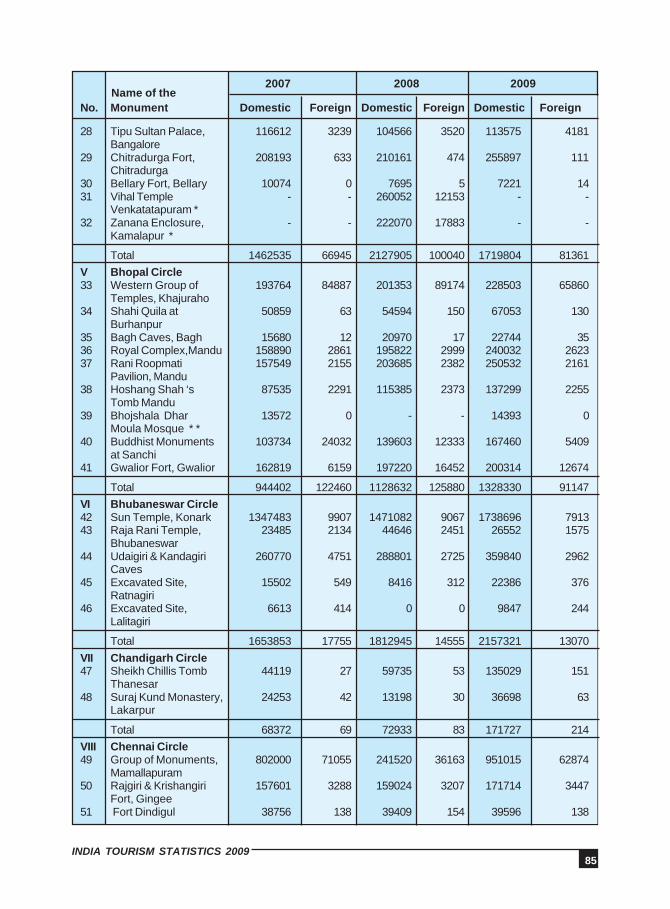
85INDIA TOURISM STATISTICS 2009
2007 2008 2009
No. Monument Domestic Foreign Domestic Foreign Domestic Foreign
28 Tipu Sultan Palace, 116612 3239 104566 3520 113575 4181Bangalore
29 Chitradurga Fort, 208193 633 210161 474 255897 111Chitradurga
30 Bellary Fort, Bellary 10074 0 7695 5 7221 1431 Vihal Temple - - 260052 12153 - -
Venkatatapuram *32 Zanana Enclosure, - - 222070 17883 - -
Kamalapur *
Total 1462535 66945 2127905 100040 1719804 81361V Bhopal Circle33 Western Group of 193764 84887 201353 89174 228503 65860
Temples, Khajuraho34 Shahi Quila at 50859 63 54594 150 67053 130
Burhanpur35 Bagh Caves, Bagh 15680 12 20970 17 22744 3536 Royal Complex,Mandu 158890 2861 195822 2999 240032 262337 Rani Roopmati 157549 2155 203685 2382 250532 2161
Pavilion, Mandu38 Hoshang Shah ‘s 87535 2291 115385 2373 137299 2255
Tomb Mandu39 Bhojshala Dhar 13572 0 - - 14393 0
Moula Mosque * *40 Buddhist Monuments 103734 24032 139603 12333 167460 5409
at Sanchi41 Gwalior Fort, Gwalior 162819 6159 197220 16452 200314 12674
Total 944402 122460 1128632 125880 1328330 91147VI Bhubaneswar Circle42 Sun Temple, Konark 1347483 9907 1471082 9067 1738696 791343 Raja Rani Temple, 23485 2134 44646 2451 26552 1575
Bhubaneswar44 Udaigiri & Kandagiri 260770 4751 288801 2725 359840 2962
Caves45 Excavated Site, 15502 549 8416 312 22386 376
Ratnagiri46 Excavated Site, 6613 414 0 0 9847 244
Lalitagiri
Total 1653853 17755 1812945 14555 2157321 13070VII Chandigarh Circle47 Sheikh Chillis Tomb 44119 27 59735 53 135029 151
Thanesar48 Suraj Kund Monastery, 24253 42 13198 30 36698 63
Lakarpur
Total 68372 69 72933 83 171727 214VIII Chennai Circle49 Group of Monuments, 802000 71055 241520 36163 951015 62874
Mamallapuram50 Rajgiri & Krishangiri 157601 3288 159024 3207 171714 3447
Fort, Gingee51 Fort Dindigul 38756 138 39409 154 39596 138
Name of the
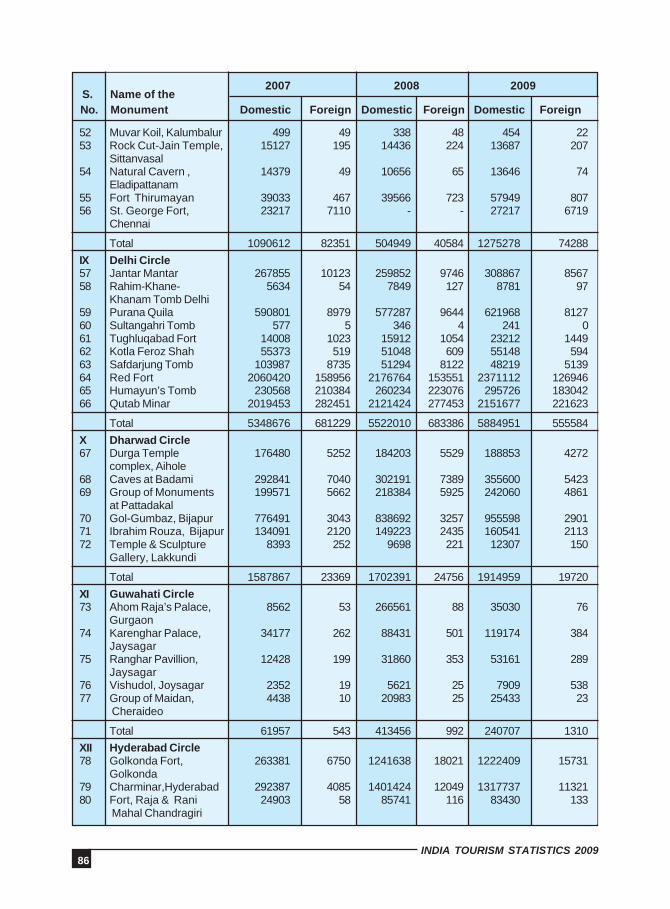
86INDIA TOURISM STATISTICS 2009
2007 2008 2009
No. Monument Domestic Foreign Domestic Foreign Domestic Foreign
52 Muvar Koil, Kalumbalur 499 49 338 48 454 2253 Rock Cut-Jain Temple, 15127 195 14436 224 13687 207
Sittanvasal54 Natural Cavern , 14379 49 10656 65 13646 74
Eladipattanam55 Fort Thirumayan 39033 467 39566 723 57949 80756 St. George Fort, 23217 7110 - - 27217 6719 Chennai
Total 1090612 82351 504949 40584 1275278 74288IX Delhi Circle57 Jantar Mantar 267855 10123 259852 9746 308867 856758 Rahim-Khane- 5634 54 7849 127 8781 97
Khanam Tomb Delhi59 Purana Quila 590801 8979 577287 9644 621968 812760 Sultangahri Tomb 577 5 346 4 241 061 Tughluqabad Fort 14008 1023 15912 1054 23212 144962 Kotla Feroz Shah 55373 519 51048 609 55148 59463 Safdarjung Tomb 103987 8735 51294 8122 48219 513964 Red Fort 2060420 158956 2176764 153551 2371112 12694665 Humayun’s Tomb 230568 210384 260234 223076 295726 18304266 Qutab Minar 2019453 282451 2121424 277453 2151677 221623
Total 5348676 681229 5522010 683386 5884951 555584X Dharwad Circle67 Durga Temple 176480 5252 184203 5529 188853 4272
complex, Aihole68 Caves at Badami 292841 7040 302191 7389 355600 542369 Group of Monuments 199571 5662 218384 5925 242060 4861
at Pattadakal70 Gol-Gumbaz, Bijapur 776491 3043 838692 3257 955598 290171 Ibrahim Rouza, Bijapur 134091 2120 149223 2435 160541 211372 Temple & Sculpture 8393 252 9698 221 12307 150 Gallery, Lakkundi
Total 1587867 23369 1702391 24756 1914959 19720XI Guwahati Circle73 Ahom Raja’s Palace, 8562 53 266561 88 35030 76
Gurgaon74 Karenghar Palace, 34177 262 88431 501 119174 384
Jaysagar75 Ranghar Pavillion, 12428 199 31860 353 53161 289
Jaysagar76 Vishudol, Joysagar 2352 19 5621 25 7909 53877 Group of Maidan, 4438 10 20983 25 25433 23 Cheraideo
Total 61957 543 413456 992 240707 1310XII Hyderabad Circle78 Golkonda Fort, 263381 6750 1241638 18021 1222409 15731
Golkonda79 Charminar,Hyderabad 292387 4085 1401424 12049 1317737 1132180 Fort, Raja & Rani 24903 58 85741 116 83430 133
Mahal Chandragiri
Name of the S.
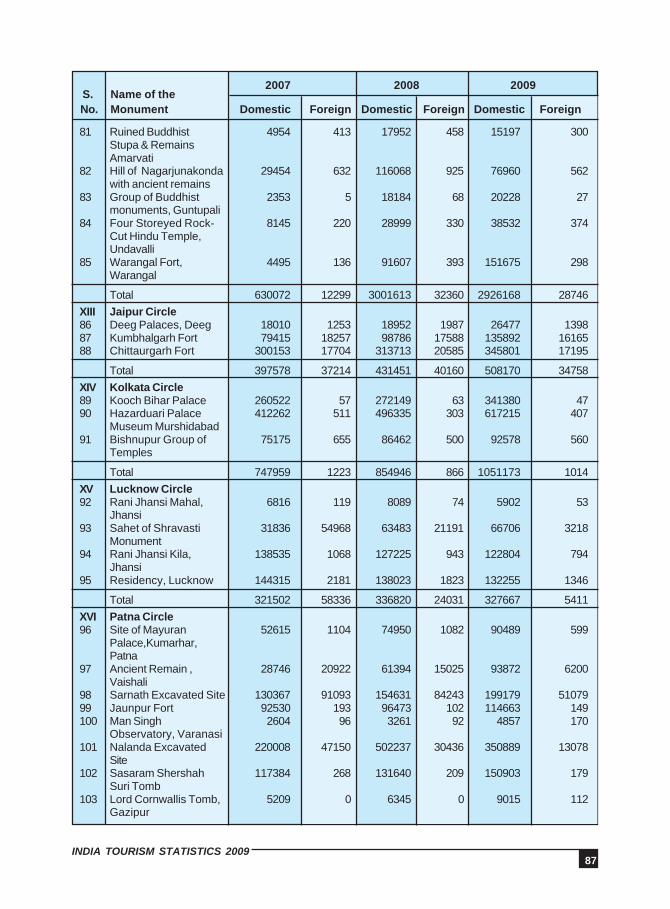
87INDIA TOURISM STATISTICS 2009
2007 2008 2009
No. Monument Domestic Foreign Domestic Foreign Domestic Foreign
81 Ruined Buddhist 4954 413 17952 458 15197 300Stupa & RemainsAmarvati
82 Hill of Nagarjunakonda 29454 632 116068 925 76960 562with ancient remains
83 Group of Buddhist 2353 5 18184 68 20228 27monuments, Guntupali
84 Four Storeyed Rock- 8145 220 28999 330 38532 374Cut Hindu Temple,Undavalli
85 Warangal Fort, 4495 136 91607 393 151675 298Warangal
Total 630072 12299 3001613 32360 2926168 28746XIII Jaipur Circle86 Deeg Palaces, Deeg 18010 1253 18952 1987 26477 139887 Kumbhalgarh Fort 79415 18257 98786 17588 135892 1616588 Chittaurgarh Fort 300153 17704 313713 20585 345801 17195
Total 397578 37214 431451 40160 508170 34758XIV Kolkata Circle89 Kooch Bihar Palace 260522 57 272149 63 341380 4790 Hazarduari Palace 412262 511 496335 303 617215 407
Museum Murshidabad91 Bishnupur Group of 75175 655 86462 500 92578 560
Temples
Total 747959 1223 854946 866 1051173 1014XV Lucknow Circle92 Rani Jhansi Mahal, 6816 119 8089 74 5902 53
Jhansi93 Sahet of Shravasti 31836 54968 63483 21191 66706 3218
Monument94 Rani Jhansi Kila, 138535 1068 127225 943 122804 794
Jhansi95 Residency, Lucknow 144315 2181 138023 1823 132255 1346
Total 321502 58336 336820 24031 327667 5411XVI Patna Circle96 Site of Mayuran 52615 1104 74950 1082 90489 599
Palace,Kumarhar,Patna
97 Ancient Remain , 28746 20922 61394 15025 93872 6200Vaishali
98 Sarnath Excavated Site 130367 91093 154631 84243 199179 5107999 Jaunpur Fort 92530 193 96473 102 114663 149100 Man Singh 2604 96 3261 92 4857 170
Observatory, Varanasi101 Nalanda Excavated 220008 47150 502237 30436 350889 13078
Site102 Sasaram Shershah 117384 268 131640 209 150903 179
Suri Tomb103 Lord Cornwallis Tomb, 5209 0 6345 0 9015 112
Gazipur
Name of the S.

88INDIA TOURISM STATISTICS 2009
2007 2008 2009
No. Monument Domestic Foreign Domestic Foreign Domestic Foreign
104 Excavated Site 19740 90 18316 7 31710 131Vikramshila, Antichak
Total 669203 160916 1049247 131196 1045577 71697XVII Raipur Circle105 Laxman Temple,Sirpur 33294 95 32867 52 35966 51
Total 33294 95 32867 52 35966 51XVIII Thrissur Circle106 Bekal Fort Pallikkare 146353 214 173553 341 59408 120107 Mattancherry Palace - - 229062 90201 58517 33598 Museum Kochi *
Total 146353 214 402615 90542 117925 33718XIX Vadodra Circle108 Sun Temple Modhera 117242 2388 183517 2452 192709 2136109 Rani-ki-Vav, Patan 150821 1841 211078 2152 213480 1938110 Monuments at 81551 1278 88125 1272 99965 1185
Champaner111 Buddhist Caves, 47021 615 56670 629 50467 658
Junagadh112 Ashokan Rock Edict, 44914 420 43710 396 45129 440
Junagadh113 Baba Pyare and 157 62 119 8 233 3
Khapra KodiyaCaves, Junagarh
Total 441706 6604 583219 6909 601983 6360XX Srinagar Circle114 Ram Nagar Palace, 1940 0 2000 0 2579 1
Ramnagar115 Group of Temple, 854 0 793 0 1424 0
Kiramchi116 Avanti Swami Temple, 7280 42 6130 23 7786 31
Avantipura117 Leh Palace, leh 1470 1817 2286 2410 4810 3950
Total 11544 1859 11209 2433 16599 3982XXI Simla Mini Circle118 Kangra Fort, Kangra 46928 1416 46343 1275 53036 968119 Rock Cut Caves, 11244 461 11222 481 14215 363
Masoor
Total 58172 1877 57565 1756 67251 1331 Grand Total 23450419 2614254 28786608 2679763 30321981 2165346
Source: Archaeological Survey of India (ASI)
Name of the S.
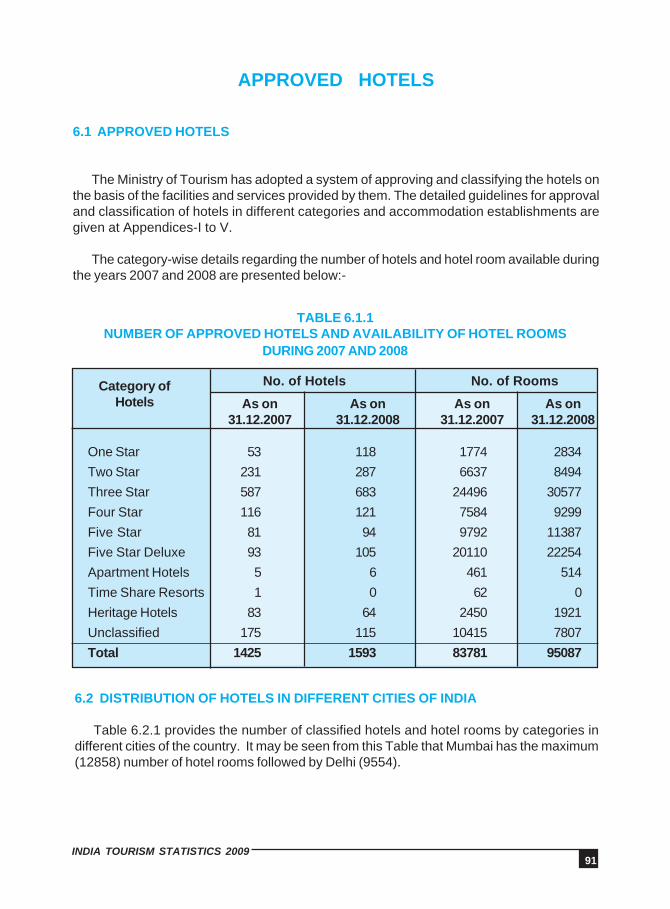
91INDIA TOURISM STATISTICS 2009
Category ofHotels As on
31.12.2007As on
31.12.2008As on
31.12.2007As on
31.12.2008
One Star 53 118 1774 2834Two Star 231 287 6637 8494Three Star 587 683 24496 30577Four Star 116 121 7584 9299Five Star 81 94 9792 11387Five Star Deluxe 93 105 20110 22254Apartment Hotels 5 6 461 514Time Share Resorts 1 0 62 0Heritage Hotels 83 64 2450 1921Unclassified 175 115 10415 7807Total 1425 1593 83781 95087
No. of Hotels No. of Rooms
TABLE 6.1.1NUMBER OF APPROVED HOTELS AND AVAILABILITY OF HOTEL ROOMS
DURING 2007 AND 2008
APPROVED HOTELS
6.1 APPROVED HOTELS
The Ministry of Tourism has adopted a system of approving and classifying the hotels onthe basis of the facilities and services provided by them. The detailed guidelines for approvaland classification of hotels in different categories and accommodation establishments aregiven at Appendices-I to V.
The category-wise details regarding the number of hotels and hotel room available duringthe years 2007 and 2008 are presented below:-
6.2 DISTRIBUTION OF HOTELS IN DIFFERENT CITIES OF INDIA
Table 6.2.1 provides the number of classified hotels and hotel rooms by categories indifferent cities of the country. It may be seen from this Table that Mumbai has the maximum(12858) number of hotel rooms followed by Delhi (9554).

92INDIA TOURISM STATISTICS 2009
S. State/Place 5 5 4 3 2 1 Apart- Time Herit- Unclass- TotalNo. Star Star Star Star Star Star ment Share age ified
Deluxe Hotel Resort
TABLE 6.2.1DISTRIBUTION OF HOTELS AND HOTEL ROOMS IN INDIA,2008
(AS ON 31.12.2008)
1 Andhra PradeshAdilabad 1 - - - - - - - - - 1
188 - - - - - - - - - 188Chittoor - - - 1 - - - - - - 1
- - - 42 - - - - - - 42Cuddapah - - - 1 - - - - - - 1
- - - 42 - - - - - - 42Guntur - - - 2 1 - - - - - 3
- - - 65 45 - - - - - 110Hyderabad 3 6 3 17 1 - - - - 1 31
740 991 358 1196 43 - - - - 135 3463Kakinada - - - 1 - - - - - - 1
- - - 52 - - - - - - 52Kurnool - - - 1 - - - - - - 1
- - - 64 - - - - - - 64Medak - - - 1 - - - - - - 1
- - - 59 - - - - - - 59Medchal - - - - 1 - - - - 1
- - - - 23 - - - - 23Mehaboob Nagar - - - 2 - - - - - - 2
- - - 39 - - - - - - 39Nandyal - - - 1 - - - - - - 1
- - - 36 - - - - - - 36Nellore - - - 2 - - - - - - 2
- - - 82 - - - - - - 82Nirmal - - - 1 - - - - - 1
- - - 41 - - - - - 41Paritala - - - 1 - - - - - - 1
- - - 39 - - - - - - 39Proddatur - - - - 1 - - - - 1
- - - - 26 - - - - 26Rajamundry - - - 2 - - - - - - 2
- - - 138 - - - - - - 138RR District - - - 5 - - - - - - 5
- - - 422 - - - - - - 422Tirupati - - - 6 - - - - - - 6
- - - 378 - - - - - - 378Vijaywada - - 1 10 1 - - - - - 12
- - 115 607 31 - - - - - 753Visakhapatinam 1 - 2 8 1 - - - - - 12
93 - 61 522 39 - - - - - 715Warangal - - - 2 1 - - - - - 3
- - - 75 19 - - - - - 94Eluru - - - - 1 - - - - - 1
- - - - 32 - - - - - 32Secunderabad - - 1 7 - - - - - 8
- 46 387 - - - - - - 433Srikakulam - - 2 - - - - - - 2
- - 83 - - - - - - 83
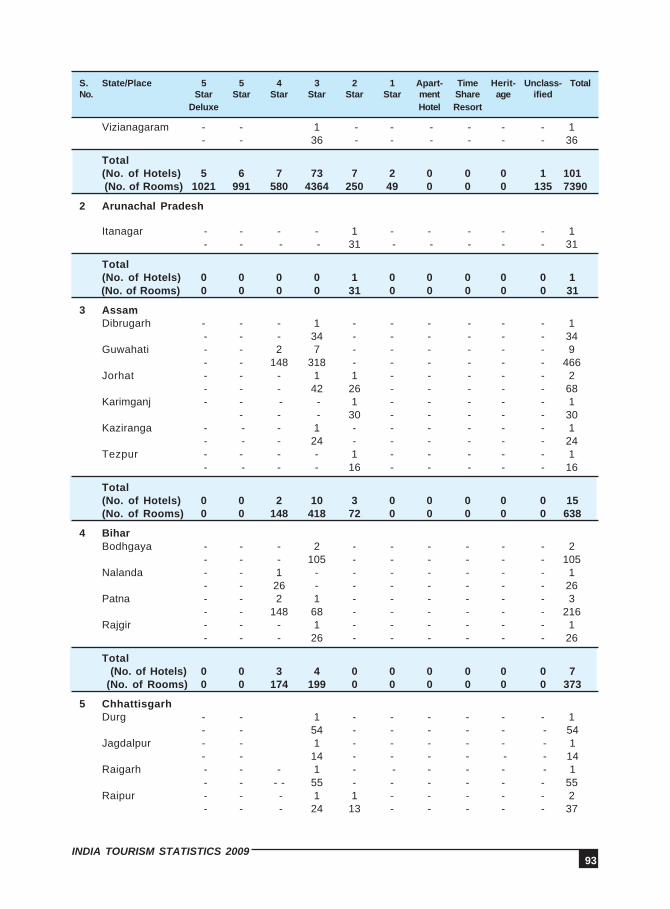
93INDIA TOURISM STATISTICS 2009
S. State/Place 5 5 4 3 2 1 Apart- Time Herit- Unclass- TotalNo. Star Star Star Star Star Star ment Share age ified
Deluxe Hotel Resort
Vizianagaram - - 1 - - - - - - 1- - 36 - - - - - - 36
Total(No. of Hotels) 5 6 7 73 7 2 0 0 0 1 101
(No. of Rooms) 1021 991 580 4364 250 49 0 0 0 135 7390
2 Arunachal Pradesh
Itanagar - - - - 1 - - - - - 1 - - - - 31 - - - - - 31
Total(No. of Hotels) 0 0 0 0 1 0 0 0 0 0 1
(No. of Rooms) 0 0 0 0 31 0 0 0 0 0 31
3 AssamDibrugarh - - - 1 - - - - - - 1
- - - 34 - - - - - - 34Guwahati - - 2 7 - - - - - - 9
- - 148 318 - - - - - - 466Jorhat - - - 1 1 - - - - - 2
- - - 42 26 - - - - - 68Karimganj - - - - 1 - - - - - 1
- - - 30 - - - - - 30Kaziranga - - - 1 - - - - - - 1
- - - 24 - - - - - - 24Tezpur - - - - 1 - - - - - 1
- - - - 16 - - - - - 16
Total(No. of Hotels) 0 0 2 10 3 0 0 0 0 0 15(No. of Rooms) 0 0 148 418 72 0 0 0 0 0 638
4 BiharBodhgaya - - - 2 - - - - - - 2
- - - 105 - - - - - - 105Nalanda - - 1 - - - - - - - 1
- - 26 - - - - - - - 26Patna - - 2 1 - - - - - - 3
- - 148 68 - - - - - - 216Rajgir - - - 1 - - - - - - 1
- - - 26 - - - - - - 26
Total (No. of Hotels) 0 0 3 4 0 0 0 0 0 0 7 (No. of Rooms) 0 0 174 199 0 0 0 0 0 0 373
5 ChhattisgarhDurg - - 1 - - - - - - 1
- - 54 - - - - - - 54Jagdalpur - - 1 - - - - - - 1
- - 14 - - - - - - 14Raigarh - - - 1 - - - - - - 1
- - - - 55 - - - - - - 55Raipur - - - 1 1 - - - - - 2
- - - 24 13 - - - - - 37
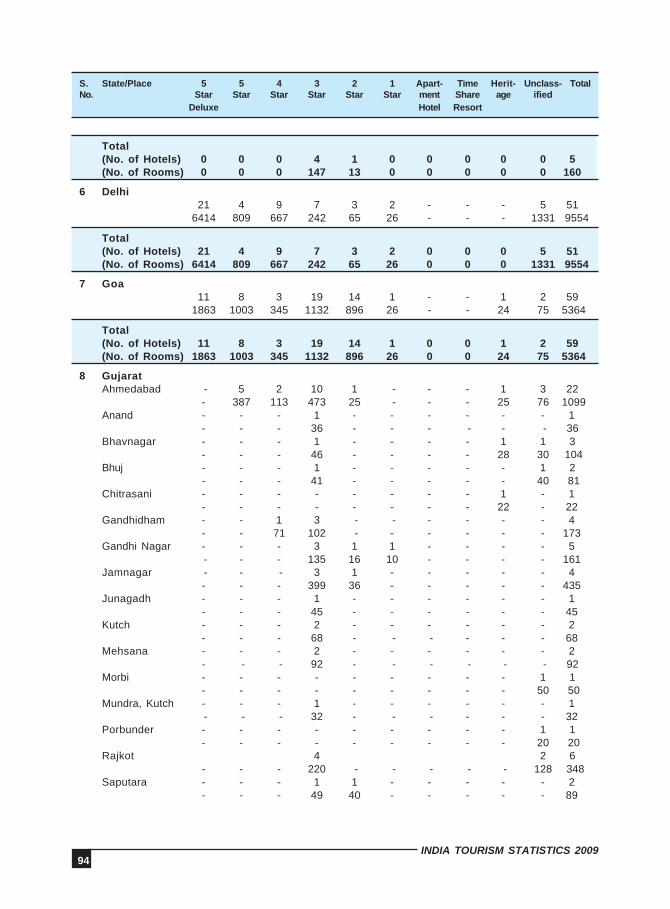
94INDIA TOURISM STATISTICS 2009
Total(No. of Hotels) 0 0 0 4 1 0 0 0 0 0 5(No. of Rooms) 0 0 0 147 13 0 0 0 0 0 160
6 Delhi21 4 9 7 3 2 - - - 5 51
6414 809 667 242 65 26 - - - 1331 9554
Total(No. of Hotels) 21 4 9 7 3 2 0 0 0 5 51(No. of Rooms) 6414 809 667 242 65 26 0 0 0 1331 9554
7 Goa11 8 3 19 14 1 - - 1 2 59
1863 1003 345 1132 896 26 - - 24 75 5364
Total(No. of Hotels) 11 8 3 19 14 1 0 0 1 2 59(No. of Rooms) 1863 1003 345 1132 896 26 0 0 24 75 5364
8 GujaratAhmedabad - 5 2 10 1 - - - 1 3 22
- 387 113 473 25 - - - 25 76 1099Anand - - - 1 - - - - - - 1
- - - 36 - - - - - - 36Bhavnagar - - - 1 - - - - 1 1 3
- - - 46 - - - - 28 30 104Bhuj - - - 1 - - - - - 1 2
- - - 41 - - - - - 40 81Chitrasani - - - - - - - - 1 - 1
- - - - - - - - 22 - 22Gandhidham - - 1 3 - - - - - - 4
- - 71 102 - - - - - - 173Gandhi Nagar - - - 3 1 1 - - - - 5
- - - 135 16 10 - - - - 161Jamnagar - - - 3 1 - - - - - 4
- - - 399 36 - - - - - 435Junagadh - - - 1 - - - - - - 1
- - - 45 - - - - - - 45Kutch - - - 2 - - - - - - 2
- - - 68 - - - - - - 68Mehsana - - - 2 - - - - - - 2
- - - 92 - - - - - - 92Morbi - - - - - - - - - 1 1
- - - - - - - - - 50 50Mundra, Kutch - - - 1 - - - - - - 1
- - - 32 - - - - - - 32Porbunder - - - - - - - - - 1 1
- - - - - - - - - 20 20Rajkot 4 2 6
- - - 220 - - - - - 128 348Saputara - - - 1 1 - - - - - 2
- - - 49 40 - - - - - 89
S. State/Place 5 5 4 3 2 1 Apart- Time Herit- Unclass- TotalNo. Star Star Star Star Star Star ment Share age ified
Deluxe Hotel Resort
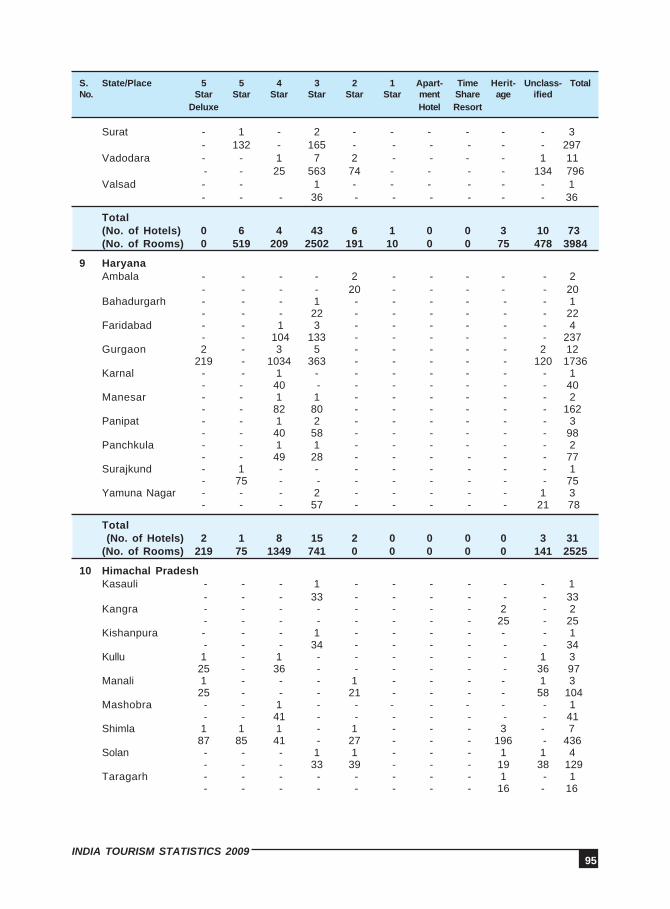
95INDIA TOURISM STATISTICS 2009
Surat - 1 - 2 - - - - - - 3- 132 - 165 - - - - - - 297
Vadodara - - 1 7 2 - - - - 1 11 - - 25 563 74 - - - - 134 796
Valsad - - 1 - - - - - - 1- - - 36 - - - - - - 36
Total(No. of Hotels) 0 6 4 43 6 1 0 0 3 10 73(No. of Rooms) 0 519 209 2502 191 10 0 0 75 478 3984
9 HaryanaAmbala - - - - 2 - - - - - 2
- - - - 20 - - - - - 20Bahadurgarh - - - 1 - - - - - - 1
- - - 22 - - - - - - 22Faridabad - - 1 3 - - - - - - 4
- - 104 133 - - - - - - 237Gurgaon 2 - 3 5 - - - - - 2 12
219 - 1034 363 - - - - - 120 1736Karnal - - 1 - - - - - - - 1
- - 40 - - - - - - - 40Manesar - - 1 1 - - - - - - 2
- - 82 80 - - - - - - 162Panipat - - 1 2 - - - - - - 3
- - 40 58 - - - - - - 98Panchkula - - 1 1 - - - - - - 2
- - 49 28 - - - - - - 77Surajkund - 1 - - - - - - - - 1
- 75 - - - - - - - - 75Yamuna Nagar - - - 2 - - - - - 1 3
- - - 57 - - - - - 21 78
Total (No. of Hotels) 2 1 8 15 2 0 0 0 0 3 31(No. of Rooms) 219 75 1349 741 0 0 0 0 0 141 2525
10 Himachal PradeshKasauli - - - 1 - - - - - - 1
- - - 33 - - - - - - 33Kangra - - - - - - - - 2 - 2
- - - - - - - - 25 - 25Kishanpura - - - 1 - - - - - - 1
- - - 34 - - - - - - 34Kullu 1 - 1 - - - - - - 1 3
25 - 36 - - - - - - 36 97Manali 1 - - - 1 - - - - 1 3
25 - - - 21 - - - - 58 104Mashobra - - 1 - - - - - - - 1
- - 41 - - - - - - - 41Shimla 1 1 1 - 1 - - - 3 - 7
87 85 41 - 27 - - - 196 - 436Solan - - - 1 1 - - - 1 1 4
- - - 33 39 - - - 19 38 129Taragarh - - - - - - - - 1 - 1
- - - - - - - - 16 - 16
S. State/Place 5 5 4 3 2 1 Apart- Time Herit- Unclass- TotalNo. Star Star Star Star Star Star ment Share age ified
Deluxe Hotel Resort
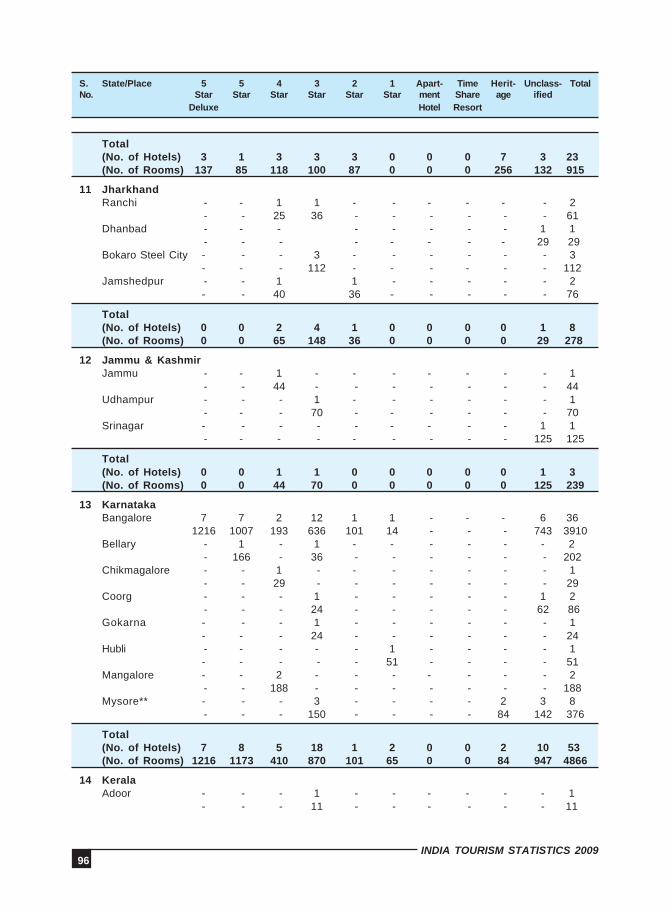
96INDIA TOURISM STATISTICS 2009
Total(No. of Hotels) 3 1 3 3 3 0 0 0 7 3 23(No. of Rooms) 137 85 118 100 87 0 0 0 256 132 915
11 JharkhandRanchi - - 1 1 - - - - - - 2
- - 25 36 - - - - - - 61Dhanbad - - - - - - - - 1 1
- - - - - - - - 29 29Bokaro Steel City - - - 3 - - - - - - 3
- - - 112 - - - - - - 112Jamshedpur - - 1 1 - - - - - 2
- - 40 36 - - - - - 76
Total(No. of Hotels) 0 0 2 4 1 0 0 0 0 1 8(No. of Rooms) 0 0 65 148 36 0 0 0 0 29 278
12 Jammu & KashmirJammu - - 1 - - - - - - - 1
- - 44 - - - - - - - 44Udhampur - - - 1 - - - - - - 1
- - - 70 - - - - - - 70Srinagar - - - - - - - - - 1 1
- - - - - - - - - 125 125
Total(No. of Hotels) 0 0 1 1 0 0 0 0 0 1 3(No. of Rooms) 0 0 44 70 0 0 0 0 0 125 239
13 KarnatakaBangalore 7 7 2 12 1 1 - - - 6 36
1216 1007 193 636 101 14 - - - 743 3910Bellary - 1 - 1 - - - - - - 2
- 166 - 36 - - - - - - 202Chikmagalore - - 1 - - - - - - - 1
- - 29 - - - - - - - 29Coorg - - - 1 - - - - - 1 2
- - - 24 - - - - - 62 86Gokarna - - - 1 - - - - - - 1
- - - 24 - - - - - - 24Hubli - - - - - 1 - - - - 1
- - - - - 51 - - - - 51Mangalore - - 2 - - - - - - - 2
- - 188 - - - - - - - 188Mysore** - - - 3 - - - - 2 3 8
- - - 150 - - - - 84 142 376
Total(No. of Hotels) 7 8 5 18 1 2 0 0 2 10 53(No. of Rooms) 1216 1173 410 870 101 65 0 0 84 947 4866
14 KeralaAdoor - - - 1 - - - - - - 1
- - - 11 - - - - - - 11
S. State/Place 5 5 4 3 2 1 Apart- Time Herit- Unclass- TotalNo. Star Star Star Star Star Star ment Share age ified
Deluxe Hotel Resort
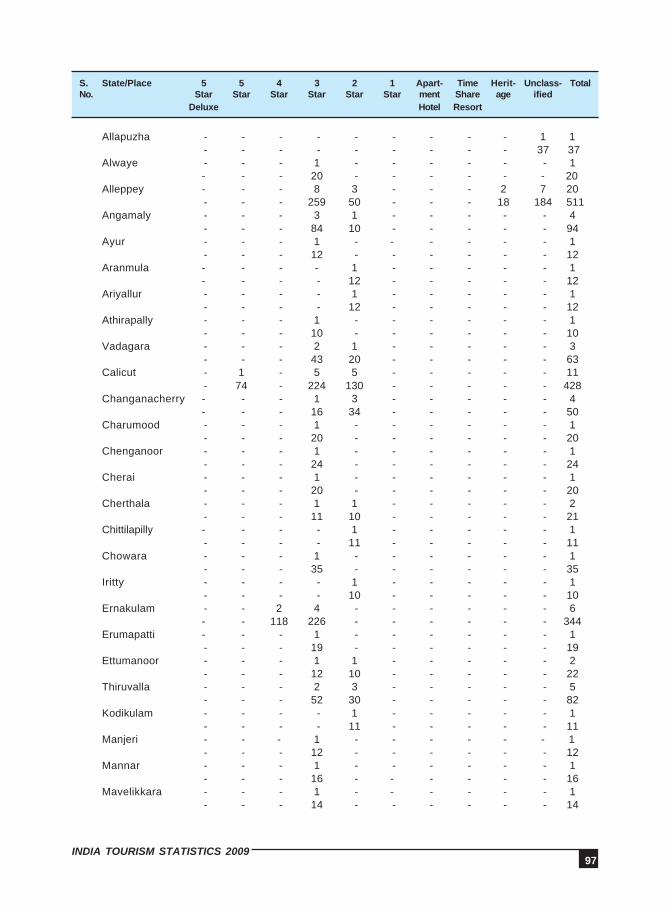
97INDIA TOURISM STATISTICS 2009
Allapuzha - - - - - - - - - 1 1 - - - - - - - - - 37 37
Alwaye - - - 1 - - - - - - 1- - - 20 - - - - - - 20
Alleppey - - - 8 3 - - - 2 7 20 - - - 259 50 - - - 18 184 511
Angamaly - - - 3 1 - - - - - 4 - - - 84 10 - - - - - 94
Ayur - - - 1 - - - - - - 1 - - - 12 - - - - - - 12
Aranmula - - - - 1 - - - - - 1- - - - 12 - - - - - 12
Ariyallur - - - - 1 - - - - - 1 - - - - 12 - - - - - 12
Athirapally - - - 1 - - - - - - 1 - - - 10 - - - - - - 10
Vadagara - - - 2 1 - - - - - 3 - - - 43 20 - - - - - 63
Calicut - 1 - 5 5 - - - - - 11 - 74 - 224 130 - - - - - 428
Changanacherry - - - 1 3 - - - - - 4- - - 16 34 - - - - - 50
Charumood - - - 1 - - - - - - 1 - - - 20 - - - - - - 20
Chenganoor - - - 1 - - - - - - 1 - - - 24 - - - - - - 24
Cherai - - - 1 - - - - - - 1 - - - 20 - - - - - - 20
Cherthala - - - 1 1 - - - - - 2 - - - 11 10 - - - - - 21
Chittilapilly - - - - 1 - - - - - 1 - - - - 11 - - - - - 11
Chowara - - - 1 - - - - - - 1 - - - 35 - - - - - - 35
Iritty - - - - 1 - - - - - 1 - - - - 10 - - - - - 10
Ernakulam - - 2 4 - - - - - - 6- - 118 226 - - - - - - 344
Erumapatti - - - 1 - - - - - - 1 - - - 19 - - - - - - 19
Ettumanoor - - - 1 1 - - - - - 2 - - - 12 10 - - - - - 22
Thiruvalla - - - 2 3 - - - - - 5 - - - 52 30 - - - - - 82
Kodikulam - - - - 1 - - - - - 1 - - - - 11 - - - - - 11
Manjeri - - - 1 - - - - - - 1 - - - 12 - - - - - - 12
Mannar - - - 1 - - - - - - 1 - - - 16 - - - - - - 16
Mavelikkara - - - 1 - - - - - - 1 - - - 14 - - - - - - 14
S. State/Place 5 5 4 3 2 1 Apart- Time Herit- Unclass- TotalNo. Star Star Star Star Star Star ment Share age ified
Deluxe Hotel Resort
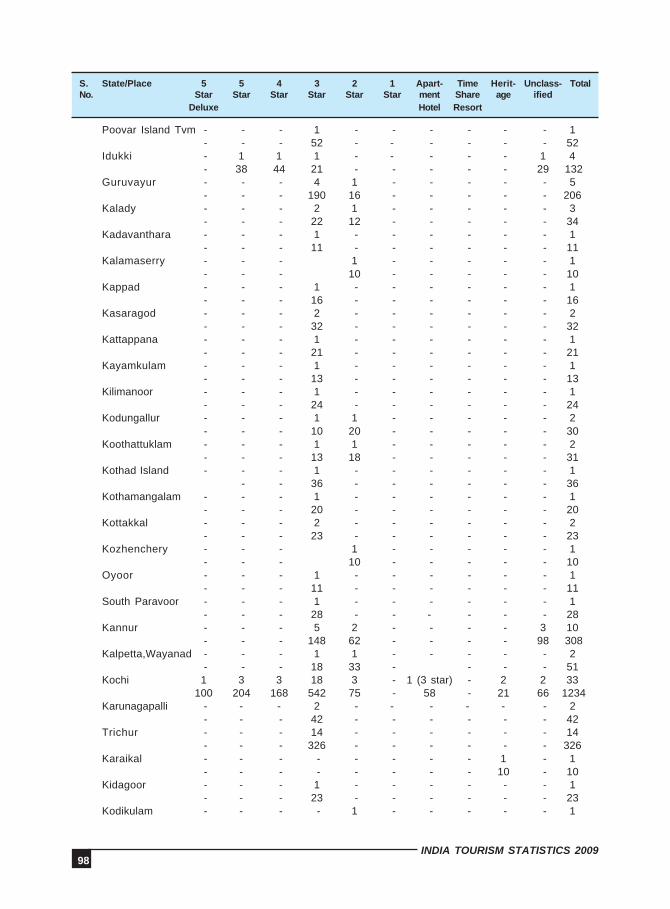
98INDIA TOURISM STATISTICS 2009
Poovar Island Tvm - - - 1 - - - - - - 1 - - - 52 - - - - - - 52
Idukki - 1 1 1 - - - - - 1 4 - 38 44 21 - - - - - 29 132
Guruvayur - - - 4 1 - - - - - 5 - - - 190 16 - - - - - 206
Kalady - - - 2 1 - - - - - 3 - - - 22 12 - - - - - 34
Kadavanthara - - - 1 - - - - - - 1 - - - 11 - - - - - - 11
Kalamaserry - - - 1 - - - - - 1 - - - 10 - - - - - 10
Kappad - - - 1 - - - - - - 1 - - - 16 - - - - - - 16
Kasaragod - - - 2 - - - - - - 2 - - - 32 - - - - - - 32
Kattappana - - - 1 - - - - - - 1 - - - 21 - - - - - - 21
Kayamkulam - - - 1 - - - - - - 1 - - - 13 - - - - - - 13
Kilimanoor - - - 1 - - - - - - 1 - - - 24 - - - - - - 24
Kodungallur - - - 1 1 - - - - - 2 - - - 10 20 - - - - - 30
Koothattuklam - - - 1 1 - - - - - 2 - - - 13 18 - - - - - 31
Kothad Island - - - 1 - - - - - - 1 - - 36 - - - - - - 36
Kothamangalam - - - 1 - - - - - - 1 - - - 20 - - - - - - 20
Kottakkal - - - 2 - - - - - - 2 - - - 23 - - - - - - 23
Kozhenchery - - - 1 - - - - - 1 - - - 10 - - - - - 10
Oyoor - - - 1 - - - - - - 1 - - - 11 - - - - - - 11
South Paravoor - - - 1 - - - - - - 1 - - - 28 - - - - - - 28
Kannur - - - 5 2 - - - - 3 10 - - - 148 62 - - - - 98 308
Kalpetta,Wayanad - - - 1 1 - - - - - 2 - - - 18 33 - - - - 51
Kochi 1 3 3 18 3 - 1 (3 star) - 2 2 33100 204 168 542 75 - 58 - 21 66 1234
Karunagapalli - - - 2 - - - - - - 2 - - - 42 - - - - - - 42
Trichur - - - 14 - - - - - - 14 - - - 326 - - - - - - 326
Karaikal - - - - - - - - 1 - 1 - - - - - - - - 10 - 10
Kidagoor - - - 1 - - - - - - 1 - - - 23 - - - - - - 23
Kodikulam - - - - 1 - - - - - 1
S. State/Place 5 5 4 3 2 1 Apart- Time Herit- Unclass- TotalNo. Star Star Star Star Star Star ment Share age ified
Deluxe Hotel Resort
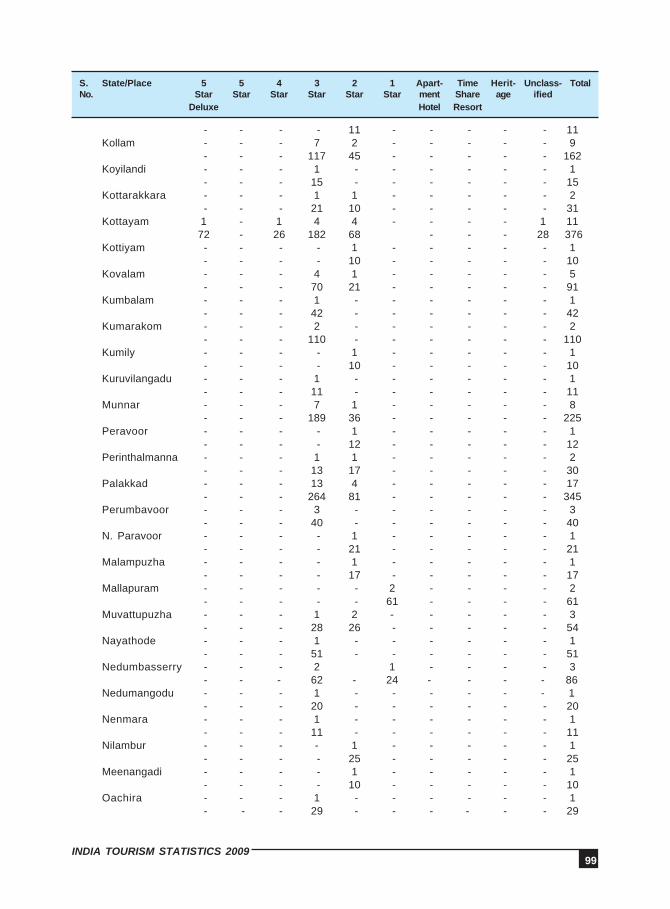
99INDIA TOURISM STATISTICS 2009
- - - - 11 - - - - - 11Kollam - - - 7 2 - - - - - 9
- - - 117 45 - - - - - 162Koyilandi - - - 1 - - - - - - 1
- - - 15 - - - - - - 15Kottarakkara - - - 1 1 - - - - - 2
- - - 21 10 - - - - - 31Kottayam 1 - 1 4 4 - - - - 1 11
72 - 26 182 68 - - - 28 376Kottiyam - - - - 1 - - - - - 1
- - - - 10 - - - - - 10Kovalam - - - 4 1 - - - - - 5
- - - 70 21 - - - - - 91Kumbalam - - - 1 - - - - - - 1
- - - 42 - - - - - - 42Kumarakom - - - 2 - - - - - - 2
- - - 110 - - - - - - 110Kumily - - - - 1 - - - - - 1
- - - - 10 - - - - - 10Kuruvilangadu - - - 1 - - - - - - 1
- - - 11 - - - - - - 11Munnar - - - 7 1 - - - - - 8
- - - 189 36 - - - - - 225Peravoor - - - - 1 - - - - - 1
- - - - 12 - - - - - 12Perinthalmanna - - - 1 1 - - - - - 2
- - - 13 17 - - - - - 30Palakkad - - - 13 4 - - - - - 17
- - - 264 81 - - - - - 345Perumbavoor - - - 3 - - - - - - 3
- - - 40 - - - - - - 40N. Paravoor - - - - 1 - - - - - 1
- - - - 21 - - - - - 21Malampuzha - - - - 1 - - - - - 1
- - - - 17 - - - - - 17Mallapuram - - - - - 2 - - - - 2
- - - - - 61 - - - - 61Muvattupuzha - - - 1 2 - - - - - 3
- - - 28 26 - - - - - 54Nayathode - - - 1 - - - - - - 1
- - - 51 - - - - - - 51Nedumbasserry - - - 2 1 - - - - 3
- - - 62 - 24 - - - - 86Nedumangodu - - - 1 - - - - - - 1
- - - 20 - - - - - - 20Nenmara - - - 1 - - - - - - 1
- - - 11 - - - - - - 11Nilambur - - - - 1 - - - - - 1
- - - - 25 - - - - - 25Meenangadi - - - - 1 - - - - - 1
- - - - 10 - - - - - 10Oachira - - - 1 - - - - - - 1
- - - 29 - - - - - - 29
S. State/Place 5 5 4 3 2 1 Apart- Time Herit- Unclass- TotalNo. Star Star Star Star Star Star ment Share age ified
Deluxe Hotel Resort
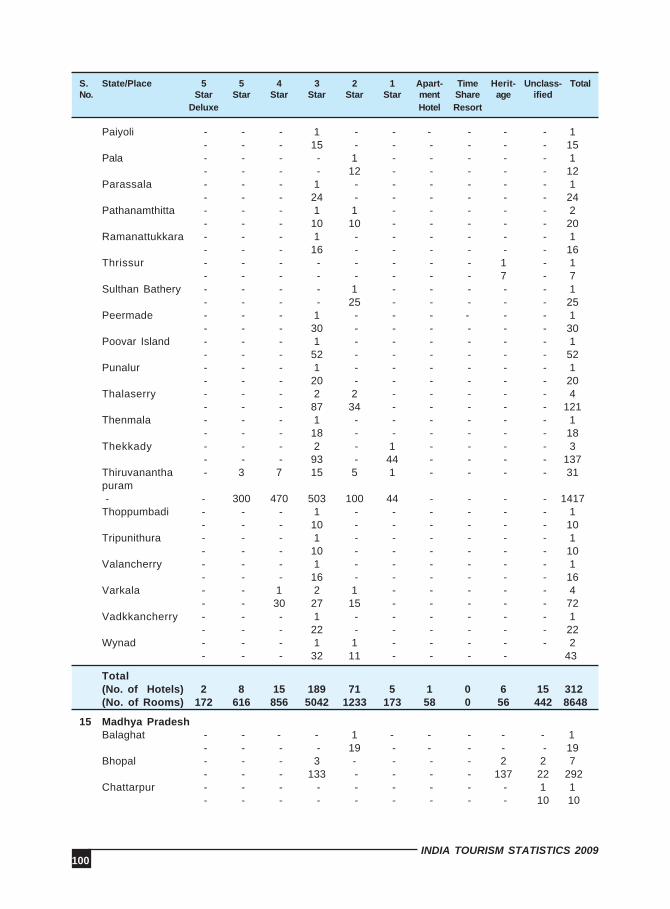
100INDIA TOURISM STATISTICS 2009
Paiyoli - - - 1 - - - - - - 1 - - - 15 - - - - - - 15
Pala - - - - 1 - - - - - 1 - - - - 12 - - - - - 12
Parassala - - - 1 - - - - - - 1 - - - 24 - - - - - - 24
Pathanamthitta - - - 1 1 - - - - - 2 - - - 10 10 - - - - - 20
Ramanattukkara - - - 1 - - - - - - 1 - - - 16 - - - - - - 16
Thrissur - - - - - - - - 1 - 1 - - - - - - - - 7 - 7
Sulthan Bathery - - - - 1 - - - - - 1 - - - - 25 - - - - - 25
Peermade - - - 1 - - - - - - 1 - - - 30 - - - - - - 30
Poovar Island - - - 1 - - - - - - 1 - - - 52 - - - - - - 52
Punalur - - - 1 - - - - - - 1 - - - 20 - - - - - - 20
Thalaserry - - - 2 2 - - - - - 4 - - - 87 34 - - - - - 121
Thenmala - - - 1 - - - - - - 1 - - - 18 - - - - - - 18
Thekkady - - - 2 - 1 - - - - 3 - - - 93 - 44 - - - - 137
Thiruvanantha - 3 7 15 5 1 - - - - 31puram - - 300 470 503 100 44 - - - - 1417Thoppumbadi - - - 1 - - - - - - 1
- - - 10 - - - - - - 10Tripunithura - - - 1 - - - - - - 1
- - - 10 - - - - - - 10Valancherry - - - 1 - - - - - - 1
- - - 16 - - - - - - 16Varkala - - 1 2 1 - - - - - 4
- - 30 27 15 - - - - - 72Vadkkancherry - - - 1 - - - - - - 1
- - - 22 - - - - - - 22Wynad - - - 1 1 - - - - - 2
- - - 32 11 - - - - 43
Total(No. of Hotels) 2 8 15 189 71 5 1 0 6 15 312(No. of Rooms) 172 616 856 5042 1233 173 58 0 56 442 8648
15 Madhya PradeshBalaghat - - - - 1 - - - - - 1
- - - - 19 - - - - - 19Bhopal - - - 3 - - - - 2 2 7
- - - 133 - - - - 137 22 292Chattarpur - - - - - - - - - 1 1
- - - - - - - - - 10 10
S. State/Place 5 5 4 3 2 1 Apart- Time Herit- Unclass- TotalNo. Star Star Star Star Star Star ment Share age ified
Deluxe Hotel Resort
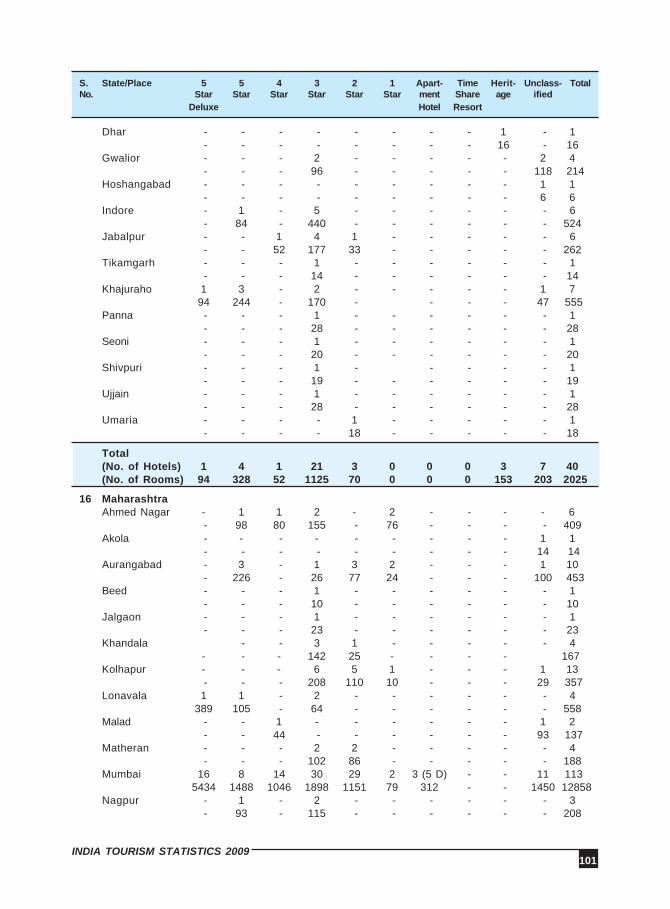
101INDIA TOURISM STATISTICS 2009
Dhar - - - - - - - - 1 - 1 - - - - - - - - 16 - 16
Gwalior - - - 2 - - - - - 2 4 - - - 96 - - - - - 118 214
Hoshangabad - - - - - - - - - 1 1 - - - - - - - - - 6 6
Indore - 1 - 5 - - - - - - 6 - 84 - 440 - - - - - - 524
Jabalpur - - 1 4 1 - - - - - 6 - - 52 177 33 - - - - - 262
Tikamgarh - - - 1 - - - - - - 1 - - - 14 - - - - - - 14
Khajuraho 1 3 - 2 - - - - - 1 794 244 - 170 - - - - 47 555
Panna - - - 1 - - - - - - 1 - - - 28 - - - - - - 28
Seoni - - - 1 - - - - - - 1 - - - 20 - - - - - - 20
Shivpuri - - - 1 - - - - - 1 - - - 19 - - - - - - 19
Ujjain - - - 1 - - - - - - 1 - - - 28 - - - - - - 28
Umaria - - - - 1 - - - - - 1 - - - - 18 - - - - - 18
Total(No. of Hotels) 1 4 1 21 3 0 0 0 3 7 40(No. of Rooms) 94 328 52 1125 70 0 0 0 153 203 2025
16 MaharashtraAhmed Nagar - 1 1 2 - 2 - - - - 6
- 98 80 155 - 76 - - - - 409Akola - - - - - - - - - 1 1
- - - - - - - - - 14 14Aurangabad - 3 - 1 3 2 - - - 1 10
- 226 - 26 77 24 - - - 100 453Beed - - - 1 - - - - - - 1
- - - 10 - - - - - - 10Jalgaon - - - 1 - - - - - - 1
- - - 23 - - - - - - 23Khandala - - 3 1 - - - - - 4
- - - 142 25 - - - - 167Kolhapur - - - 6 5 1 - - - 1 13
- - - 208 110 10 - - - 29 357Lonavala 1 1 - 2 - - - - - - 4
389 105 - 64 - - - - - - 558Malad - - 1 - - - - - - 1 2
- - 44 - - - - - - 93 137Matheran - - - 2 2 - - - - - 4
- - - 102 86 - - - - - 188Mumbai 16 8 14 30 29 2 3 (5 D) - - 11 113
5434 1488 1046 1898 1151 79 312 - - 1450 12858Nagpur - 1 - 2 - - - - - - 3
- 93 - 115 - - - - - - 208
S. State/Place 5 5 4 3 2 1 Apart- Time Herit- Unclass- TotalNo. Star Star Star Star Star Star ment Share age ified
Deluxe Hotel Resort
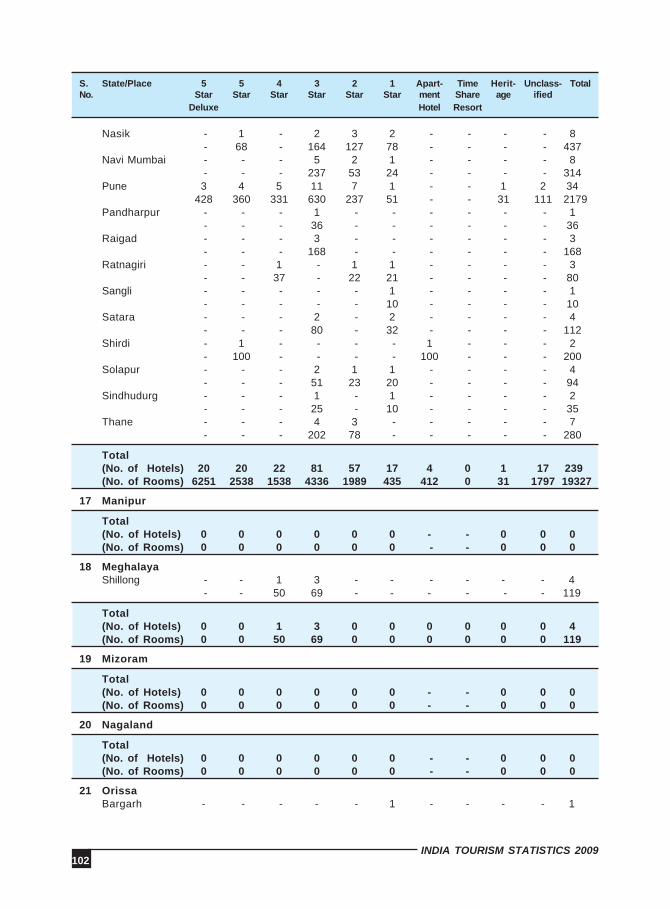
102INDIA TOURISM STATISTICS 2009
Nasik - 1 - 2 3 2 - - - - 8 - 68 - 164 127 78 - - - - 437
Navi Mumbai - - - 5 2 1 - - - - 8 - - - 237 53 24 - - - - 314
Pune 3 4 5 11 7 1 - - 1 2 34428 360 331 630 237 51 - - 31 111 2179
Pandharpur - - - 1 - - - - - - 1 - - - 36 - - - - - - 36
Raigad - - - 3 - - - - - - 3 - - - 168 - - - - - - 168
Ratnagiri - - 1 - 1 1 - - - - 3 - - 37 - 22 21 - - - - 80
Sangli - - - - - 1 - - - - 1 - - - - - 10 - - - - 10
Satara - - - 2 - 2 - - - - 4 - - - 80 - 32 - - - - 112
Shirdi - 1 - - - - 1 - - - 2 - 100 - - - - 100 - - - 200
Solapur - - - 2 1 1 - - - - 4 - - - 51 23 20 - - - - 94
Sindhudurg - - - 1 - 1 - - - - 2 - - - 25 - 10 - - - - 35
Thane - - - 4 3 - - - - - 7 - - - 202 78 - - - - - 280
Total(No. of Hotels) 20 20 22 81 57 17 4 0 1 17 239(No. of Rooms) 6251 2538 1538 4336 1989 435 412 0 31 1797 19327
17 Manipur
Total(No. of Hotels) 0 0 0 0 0 0 - - 0 0 0(No. of Rooms) 0 0 0 0 0 0 - - 0 0 0
18 MeghalayaShillong - - 1 3 - - - - - - 4
- - 50 69 - - - - - - 119
Total(No. of Hotels) 0 0 1 3 0 0 0 0 0 0 4(No. of Rooms) 0 0 50 69 0 0 0 0 0 0 119
19 Mizoram
Total(No. of Hotels) 0 0 0 0 0 0 - - 0 0 0(No. of Rooms) 0 0 0 0 0 0 - - 0 0 0
20 Nagaland
Total(No. of Hotels) 0 0 0 0 0 0 - - 0 0 0(No. of Rooms) 0 0 0 0 0 0 - - 0 0 0
21 OrissaBargarh - - - - - 1 - - - - 1
S. State/Place 5 5 4 3 2 1 Apart- Time Herit- Unclass- TotalNo. Star Star Star Star Star Star ment Share age ified
Deluxe Hotel Resort
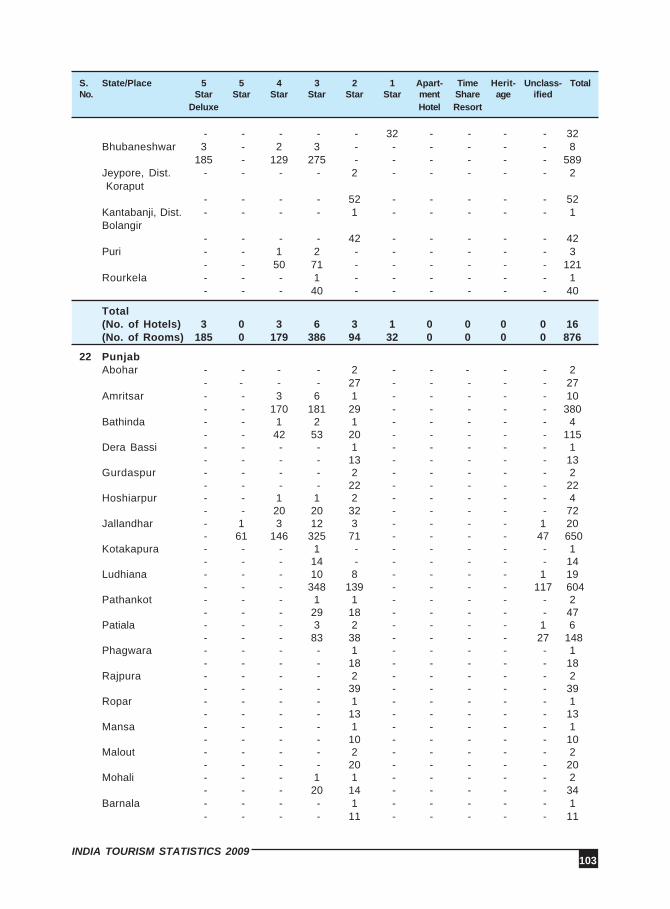
103INDIA TOURISM STATISTICS 2009
- - - - - 32 - - - - 32Bhubaneshwar 3 - 2 3 - - - - - - 8
185 - 129 275 - - - - - - 589Jeypore, Dist. - - - - 2 - - - - - 2 Koraput
- - - - 52 - - - - - 52Kantabanji, Dist. - - - - 1 - - - - - 1Bolangir
- - - - 42 - - - - - 42Puri - - 1 2 - - - - - - 3
- - 50 71 - - - - - - 121Rourkela - - - 1 - - - - - - 1
- - - 40 - - - - - - 40
Total(No. of Hotels) 3 0 3 6 3 1 0 0 0 0 16(No. of Rooms) 185 0 179 386 94 32 0 0 0 0 876
22 PunjabAbohar - - - - 2 - - - - - 2
- - - - 27 - - - - - 27Amritsar - - 3 6 1 - - - - - 10
- - 170 181 29 - - - - - 380Bathinda - - 1 2 1 - - - - - 4
- - 42 53 20 - - - - - 115Dera Bassi - - - - 1 - - - - - 1
- - - - 13 - - - - - 13Gurdaspur - - - - 2 - - - - - 2
- - - - 22 - - - - - 22Hoshiarpur - - 1 1 2 - - - - - 4
- - 20 20 32 - - - - - 72Jallandhar - 1 3 12 3 - - - - 1 20
- 61 146 325 71 - - - - 47 650Kotakapura - - - 1 - - - - - - 1
- - - 14 - - - - - - 14Ludhiana - - - 10 8 - - - - 1 19
- - - 348 139 - - - - 117 604Pathankot - - - 1 1 - - - - - 2
- - - 29 18 - - - - - 47Patiala - - - 3 2 - - - - 1 6
- - - 83 38 - - - - 27 148Phagwara - - - - 1 - - - - - 1
- - - - 18 - - - - - 18Rajpura - - - - 2 - - - - - 2
- - - - 39 - - - - - 39Ropar - - - - 1 - - - - - 1
- - - - 13 - - - - - 13Mansa - - - - 1 - - - - - 1
- - - - 10 - - - - - 10Malout - - - - 2 - - - - - 2
- - - - 20 - - - - - 20Mohali - - - 1 1 - - - - - 2
- - - 20 14 - - - - - 34Barnala - - - - 1 - - - - - 1
- - - - 11 - - - - - 11
S. State/Place 5 5 4 3 2 1 Apart- Time Herit- Unclass- TotalNo. Star Star Star Star Star Star ment Share age ified
Deluxe Hotel Resort
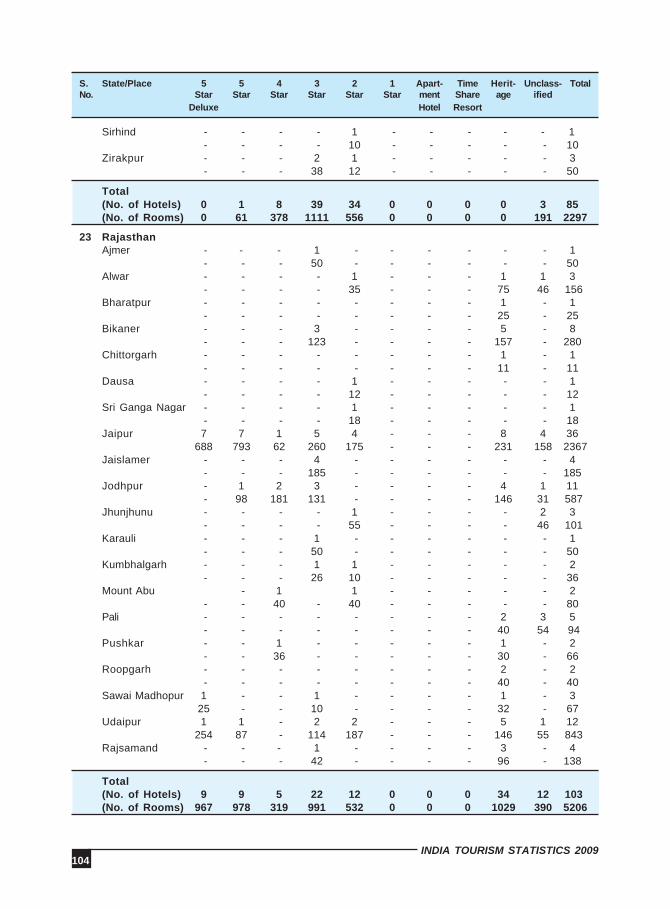
104INDIA TOURISM STATISTICS 2009
Sirhind - - - - 1 - - - - - 1 - - - - 10 - - - - - 10
Zirakpur - - - 2 1 - - - - - 3 - - - 38 12 - - - - - 50
Total(No. of Hotels) 0 1 8 39 34 0 0 0 0 3 85(No. of Rooms) 0 61 378 1111 556 0 0 0 0 191 2297
23 RajasthanAjmer - - - 1 - - - - - - 1
- - - 50 - - - - - - 50Alwar - - - - 1 - - - 1 1 3
- - - - 35 - - - 75 46 156Bharatpur - - - - - - - - 1 - 1
- - - - - - - - 25 - 25Bikaner - - - 3 - - - - 5 - 8
- - - 123 - - - - 157 - 280Chittorgarh - - - - - - - - 1 - 1
- - - - - - - - 11 - 11Dausa - - - - 1 - - - - - 1
- - - - 12 - - - - - 12Sri Ganga Nagar - - - - 1 - - - - - 1
- - - - 18 - - - - - 18Jaipur 7 7 1 5 4 - - - 8 4 36
688 793 62 260 175 - - - 231 158 2367Jaislamer - - - 4 - - - - - - 4
- - - 185 - - - - - - 185Jodhpur - 1 2 3 - - - - 4 1 11
- 98 181 131 - - - - 146 31 587Jhunjhunu - - - - 1 - - - - 2 3
- - - - 55 - - - - 46 101Karauli - - - 1 - - - - - - 1
- - - 50 - - - - - - 50Kumbhalgarh - - - 1 1 - - - - - 2
- - - 26 10 - - - - - 36Mount Abu - 1 1 - - - - - 2
- - 40 - 40 - - - - - 80Pali - - - - - - - - 2 3 5
- - - - - - - - 40 54 94Pushkar - - 1 - - - - - 1 - 2
- - 36 - - - - - 30 - 66Roopgarh - - - - - - - - 2 - 2
- - - - - - - - 40 - 40Sawai Madhopur 1 - - 1 - - - - 1 - 3
25 - - 10 - - - - 32 - 67Udaipur 1 1 - 2 2 - - - 5 1 12
254 87 - 114 187 - - - 146 55 843Rajsamand - - - 1 - - - - 3 - 4
- - - 42 - - - - 96 - 138
Total(No. of Hotels) 9 9 5 22 12 0 0 0 34 12 103(No. of Rooms) 967 978 319 991 532 0 0 0 1029 390 5206
S. State/Place 5 5 4 3 2 1 Apart- Time Herit- Unclass- TotalNo. Star Star Star Star Star Star ment Share age ified
Deluxe Hotel Resort
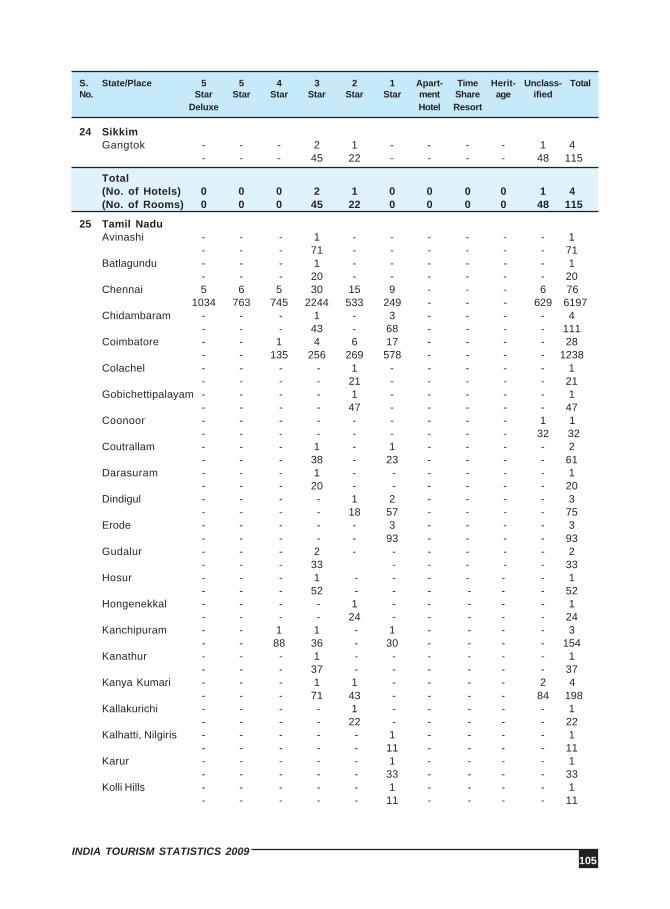
105INDIA TOURISM STATISTICS 2009
24 SikkimGangtok - - - 2 1 - - - - 1 4
- - - 45 22 - - - - 48 115
Total(No. of Hotels) 0 0 0 2 1 0 0 0 0 1 4(No. of Rooms) 0 0 0 45 22 0 0 0 0 48 115
25 Tamil NaduAvinashi - - - 1 - - - - - - 1
- - - 71 - - - - - - 71Batlagundu - - - 1 - - - - - - 1
- - - 20 - - - - - - 20Chennai 5 6 5 30 15 9 - - - 6 76
1034 763 745 2244 533 249 - - - 629 6197Chidambaram - - - 1 - 3 - - - - 4
- - - 43 - 68 - - - - 111Coimbatore - - 1 4 6 17 - - - - 28
- - 135 256 269 578 - - - - 1238Colachel - - - - 1 - - - - - 1
- - - - 21 - - - - - 21Gobichettipalayam - - - - 1 - - - - - 1
- - - - 47 - - - - - 47Coonoor - - - - - - - - - 1 1
- - - - - - - - - 32 32Coutrallam - - - 1 - 1 - - - - 2
- - - 38 - 23 - - - - 61Darasuram - - - 1 - - - - - - 1
- - - 20 - - - - - - 20Dindigul - - - - 1 2 - - - - 3
- - - - 18 57 - - - - 75Erode - - - - - 3 - - - - 3
- - - - - 93 - - - - 93Gudalur - - - 2 - - - - - - 2
- - - 33 - - - - - 33Hosur - - - 1 - - - - - - 1
- - - 52 - - - - - - 52Hongenekkal - - - - 1 - - - - - 1
- - - - 24 - - - - - 24Kanchipuram - - 1 1 - 1 - - - - 3
- - 88 36 - 30 - - - - 154Kanathur - - - 1 - - - - - - 1
- - - 37 - - - - - - 37Kanya Kumari - - - 1 1 - - - - 2 4
- - - 71 43 - - - - 84 198Kallakurichi - - - - 1 - - - - - 1
- - - - 22 - - - - - 22Kalhatti, Nilgiris - - - - - 1 - - - - 1
- - - - - 11 - - - - 11Karur - - - - - 1 - - - - 1
- - - - - 33 - - - - 33Kolli Hills - - - - - 1 - - - - 1
- - - - - 11 - - - - 11
S. State/Place 5 5 4 3 2 1 Apart- Time Herit- Unclass- TotalNo. Star Star Star Star Star Star ment Share age ified
Deluxe Hotel Resort
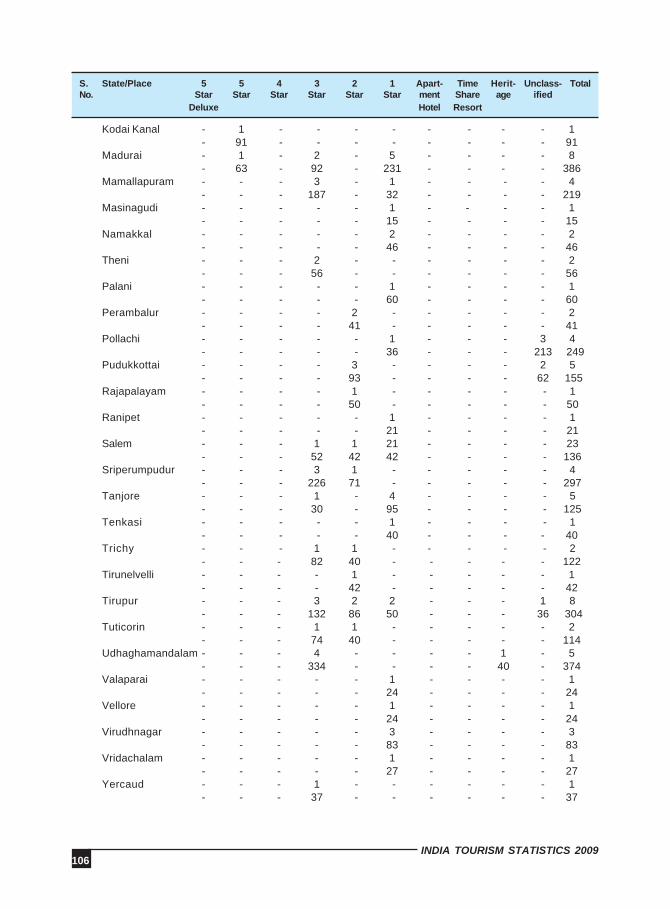
106INDIA TOURISM STATISTICS 2009
Kodai Kanal - 1 - - - - - - - - 1- 91 - - - - - - - - 91
Madurai - 1 - 2 - 5 - - - - 8- 63 - 92 - 231 - - - - 386
Mamallapuram - - - 3 - 1 - - - - 4- - - 187 - 32 - - - - 219
Masinagudi - - - - - 1 - - - - 1- - - - - 15 - - - - 15
Namakkal - - - - - 2 - - - - 2- - - - - 46 - - - - 46
Theni - - - 2 - - - - - - 2- - - 56 - - - - - - 56
Palani - - - - - 1 - - - - 1- - - - - 60 - - - - 60
Perambalur - - - - 2 - - - - - 2- - - - 41 - - - - - 41
Pollachi - - - - - 1 - - - 3 4- - - - - 36 - - - 213 249
Pudukkottai - - - - 3 - - - - 2 5- - - - 93 - - - - 62 155
Rajapalayam - - - - 1 - - - - - 1- - - - 50 - - - - - 50
Ranipet - - - - - 1 - - - - 1- - - - - 21 - - - - 21
Salem - - - 1 1 21 - - - - 23- - - 52 42 42 - - - - 136
Sriperumpudur - - - 3 1 - - - - - 4- - - 226 71 - - - - - 297
Tanjore - - - 1 - 4 - - - - 5- - - 30 - 95 - - - - 125
Tenkasi - - - - - 1 - - - - 1- - - - - 40 - - - - 40
Trichy - - - 1 1 - - - - - 2- - - 82 40 - - - - - 122
Tirunelvelli - - - - 1 - - - - - 1- - - - 42 - - - - - 42
Tirupur - - - 3 2 2 - - - 1 8- - - 132 86 50 - - - 36 304
Tuticorin - - - 1 1 - - - - - 2- - - 74 40 - - - - - 114
Udhaghamandalam - - - 4 - - - - 1 - 5- - - 334 - - - - 40 - 374
Valaparai - - - - - 1 - - - - 1- - - - - 24 - - - - 24
Vellore - - - - - 1 - - - - 1- - - - - 24 - - - - 24
Virudhnagar - - - - - 3 - - - - 3- - - - - 83 - - - - 83
Vridachalam - - - - - 1 - - - - 1- - - - - 27 - - - - 27
Yercaud - - - 1 - - - - - - 1- - - 37 - - - - - - 37
S. State/Place 5 5 4 3 2 1 Apart- Time Herit- Unclass- TotalNo. Star Star Star Star Star Star ment Share age ified
Deluxe Hotel Resort

107INDIA TOURISM STATISTICS 2009
Total(No. of Hotels) 5 8 7 67 40 85 0 0 1 15 228(No. of Rooms) 1034 917 968 4223 1482 1979 0 0 40 1056 11699
26 Tripura Agartala - - - 1 - - - - - - 1
- - - 101 - - - - - - 101
Total(No. of Hotels) 0 0 0 1 0 0 0 0 0 0 1(No. of Rooms) 0 0 0 101 0 0 0 0 0 0 101
27 Uttar PradeshAgra 4 5 - 1 - - - - - - 10
847 745 - 66 - - - - - - 1658Allahabad - - 1 1 - - - - - 1 3
- - 85 27 - - - - - 12 124Gajraula - - - 1 - - - - - - 1
- - - 25 - - - - - - 25Gorakhpur - - - 1 - - - - - - 1
- - - 38 - - - - - - 38Jhansi - - 1 1 - 1 - - - - 3
- - 42 28 - 26 - - - - 96Kanpur - 1 - - - - - - - 1
- 131 - - - - - - - 131Kushinagar - - - 3 - - - - - - 3
- - - 122 - - - - - - 122Lucknow 1 1 1 2 - - - - - - 5
110 98 61 92 - - - - - - 361Mathura - - 1 3 - - - - - - 4
- - 40 93 - - - - - - 133Moradabad 1 - - 1 - - - - - - 2
74 - - 26 - - - - - - 100Sravasti - - - 1 - - - - - - 1
- - - 56 - - - - - - 56Noida 2 - - 1 - - 1 - - - 4
136 - - 40 - - 44 - - - 220Varanasi 1 - - 3 2 - - - 1 - 7
130 - - 136 56 - - - 44 - 366Orai - - - 1 - - - - - 1
- - - 22 - - - - - 22
Total(No. of Hotels) 9 7 4 19 3 1 1 0 1 1 46(No. of Rooms) 1297 974 228 749 78 26 44 0 44 12 3452
28 UttarakhandAlmora - - - - 1 - - - - 1 2
- - - - 10 - - - - 25 35Badrinath - - - - 1 - - - - - 1
- - - - 40 - - - - - 40Dehradun - - 1 1 - - - - - - 2
- - 69 26 - - - - - - 95Haridwar - - - 3 - - - - 1 1 5
- - - 196 - - - - 20 46 262
S. State/Place 5 5 4 3 2 1 Apart- Time Herit- Unclass- TotalNo. Star Star Star Star Star Star ment Share age ified
Deluxe Hotel Resort
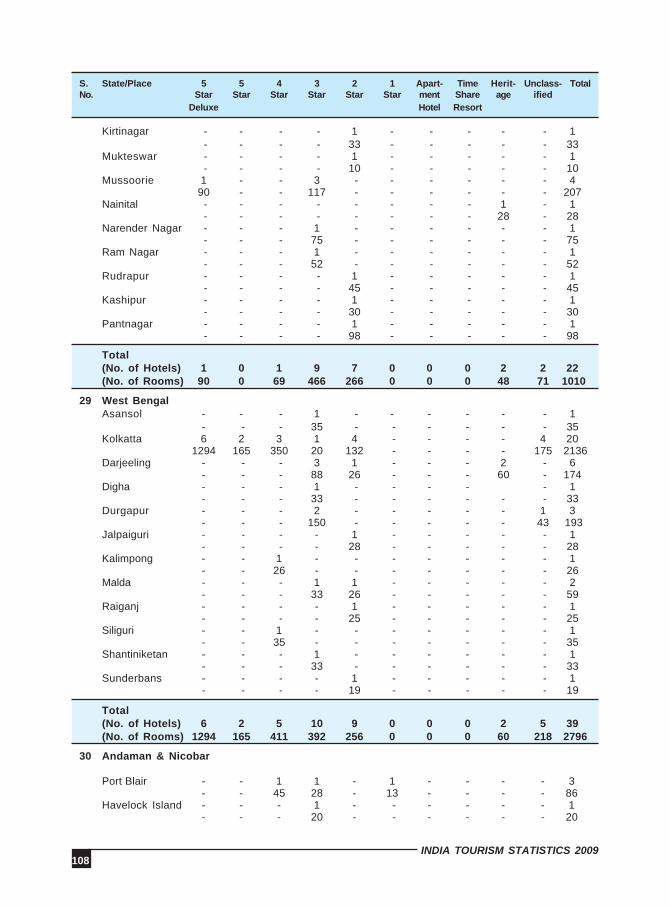
108INDIA TOURISM STATISTICS 2009
Kirtinagar - - - - 1 - - - - - 1 - - - - 33 - - - - - 33
Mukteswar - - - - 1 - - - - - 1 - - - - 10 - - - - - 10
Mussoorie 1 - - 3 - - - - - - 490 - - 117 - - - - - - 207
Nainital - - - - - - - - 1 - 1 - - - - - - - - 28 - 28
Narender Nagar - - - 1 - - - - - - 1 - - - 75 - - - - - - 75
Ram Nagar - - - 1 - - - - - - 1 - - - 52 - - - - - - 52
Rudrapur - - - - 1 - - - - - 1 - - - - 45 - - - - - 45
Kashipur - - - - 1 - - - - - 1 - - - - 30 - - - - - 30
Pantnagar - - - - 1 - - - - - 1 - - - - 98 - - - - - 98
Total(No. of Hotels) 1 0 1 9 7 0 0 0 2 2 22(No. of Rooms) 90 0 69 466 266 0 0 0 48 71 1010
29 West BengalAsansol - - - 1 - - - - - - 1
- - - 35 - - - - - - 35Kolkatta 6 2 3 1 4 - - - - 4 20
1294 165 350 20 132 - - - - 175 2136Darjeeling - - - 3 1 - - - 2 - 6
- - - 88 26 - - - 60 - 174Digha - - - 1 - - - - - 1
- - - 33 - - - - - - 33Durgapur - - - 2 - - - - - 1 3
- - - 150 - - - - - 43 193Jalpaiguri - - - - 1 - - - - - 1
- - - - 28 - - - - - 28Kalimpong - - 1 - - - - - - - 1
- - 26 - - - - - - - 26Malda - - - 1 1 - - - - - 2
- - - 33 26 - - - - - 59Raiganj - - - - 1 - - - - - 1
- - - - 25 - - - - - 25Siliguri - - 1 - - - - - - - 1
- - 35 - - - - - - - 35Shantiniketan - - - 1 - - - - - - 1
- - - 33 - - - - - - 33Sunderbans - - - - 1 - - - - - 1
- - - - 19 - - - - - 19
Total(No. of Hotels) 6 2 5 10 9 0 0 0 2 5 39(No. of Rooms) 1294 165 411 392 256 0 0 0 60 218 2796
30 Andaman & Nicobar
Port Blair - - 1 1 - 1 - - - - 3- - 45 28 - 13 - - - - 86
Havelock Island - - - 1 - - - - - - 1- - - 20 - - - - - - 20
S. State/Place 5 5 4 3 2 1 Apart- Time Herit- Unclass- TotalNo. Star Star Star Star Star Star ment Share age ified
Deluxe Hotel Resort
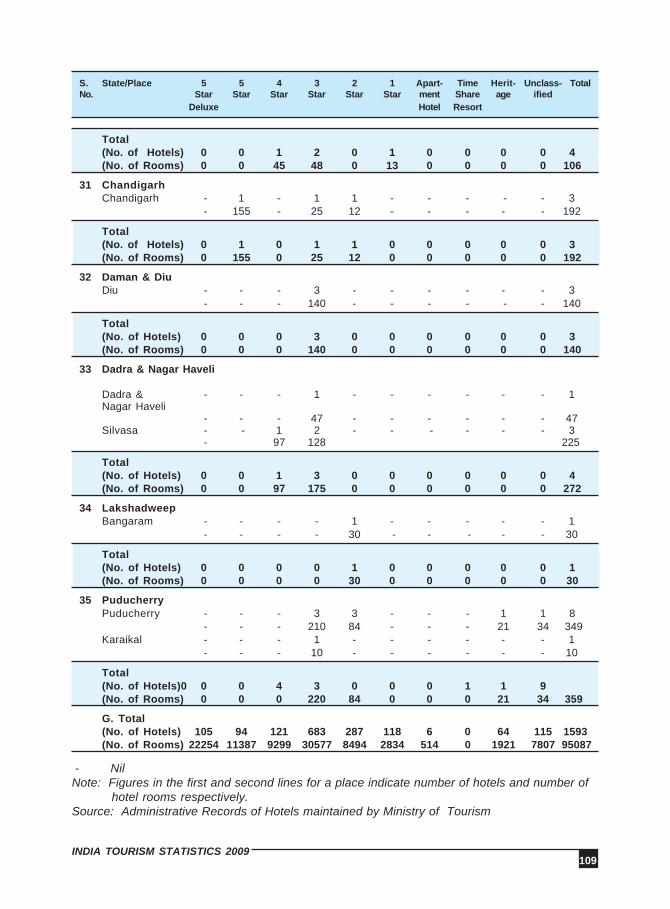
109INDIA TOURISM STATISTICS 2009
S. State/Place 5 5 4 3 2 1 Apart- Time Herit- Unclass- TotalNo. Star Star Star Star Star Star ment Share age ified
Deluxe Hotel Resort
Total(No. of Hotels) 0 0 1 2 0 1 0 0 0 0 4(No. of Rooms) 0 0 45 48 0 13 0 0 0 0 106
31 ChandigarhChandigarh - 1 - 1 1 - - - - - 3
- 155 - 25 12 - - - - - 192
Total(No. of Hotels) 0 1 0 1 1 0 0 0 0 0 3(No. of Rooms) 0 155 0 25 12 0 0 0 0 0 192
32 Daman & DiuDiu - - - 3 - - - - - - 3
- - - 140 - - - - - - 140
Total(No. of Hotels) 0 0 0 3 0 0 0 0 0 0 3(No. of Rooms) 0 0 0 140 0 0 0 0 0 0 140
33 Dadra & Nagar Haveli
Dadra & - - - 1 - - - - - - 1Nagar Haveli
- - - 47 - - - - - - 47Silvasa - - 1 2 - - - - - - 3
- 97 128 225
Total(No. of Hotels) 0 0 1 3 0 0 0 0 0 0 4(No. of Rooms) 0 0 97 175 0 0 0 0 0 0 272
34 LakshadweepBangaram - - - - 1 - - - - - 1
- - - - 30 - - - - - 30
Total(No. of Hotels) 0 0 0 0 1 0 0 0 0 0 1(No. of Rooms) 0 0 0 0 30 0 0 0 0 0 30
35 PuducherryPuducherry - - - 3 3 - - - 1 1 8
- - - 210 84 - - - 21 34 349Karaikal - - - 1 - - - - - - 1
- - - 10 - - - - - - 10
Total(No. of Hotels)0 0 0 4 3 0 0 0 1 1 9(No. of Rooms) 0 0 0 220 84 0 0 0 21 34 359
G. Total(No. of Hotels) 105 94 121 683 287 118 6 0 64 115 1593(No. of Rooms) 22254 11387 9299 30577 8494 2834 514 0 1921 7807 95087
- NilNote: Figures in the first and second lines for a place indicate number of hotels and number of
hotel rooms respectively.Source: Administrative Records of Hotels maintained by Ministry of Tourism
110INDIA TOURISM STATISTICS 2009
6.3 INDIAN HOTEL INDUSTRY SURVEY 2008-09
The Federation of Hotel & Restaurant Associations of India (FHRAI) collects informationfrom its members through a questionnaire for its annual Indian Hotel Industry Survey,which is analysed and presented in a report. For the year 2008-09, FHRAI receivedinformation from 1168 members.
Based on FHRAI’s 2008-09 survey, information on various aspects of hotel industryin India like profile of an average hotel, average number of Employees per hotel, averagepercentage of Trained Employees per hotel and Guest Analysis is presented in Tables6.31 to 6.3.5
Following are the important highlights of the data presented in these tables:-
• Most of the rooms in all categories of hotels were air-conditioned.
• Average employee per room for all categories of hotels taken together was1.6. Among the classified categories, variation was quite low: 1.1 in 1-Star &2-Star categories and 2.0 in 5-Star Deluxe categories.
• About 78% of the employees were trained: highest being 90% under Heritageand lowest 73% under 1-Star category.
• Share of tourists is the highest from ‘other countries’ being 15.3%. UK andUSA dominate the overall visitations with a share of 13.8% and 12.4%respectively.
• Share of tourists from UK and USA was the highest in the 1-Star and abovecategory hotels.
• Share of domestic guests was 74% for all the hotels taken together. However,share of foreign guests was higher in 5-Star Deluxe (56.7%) and Heritage(58.6).
• Leisure tourists constituted about 42% of the total guests and the remaining58% were business guests. Except the Heritage categories of hotels, shareof business guests was higher in other categories.
• While the average stay of foreign guests was 3.5 days, it was 2.9 days fordomestic guests.
• Average stay of business and leisure guests was 2.8 days and 2.5 daysrespectively.
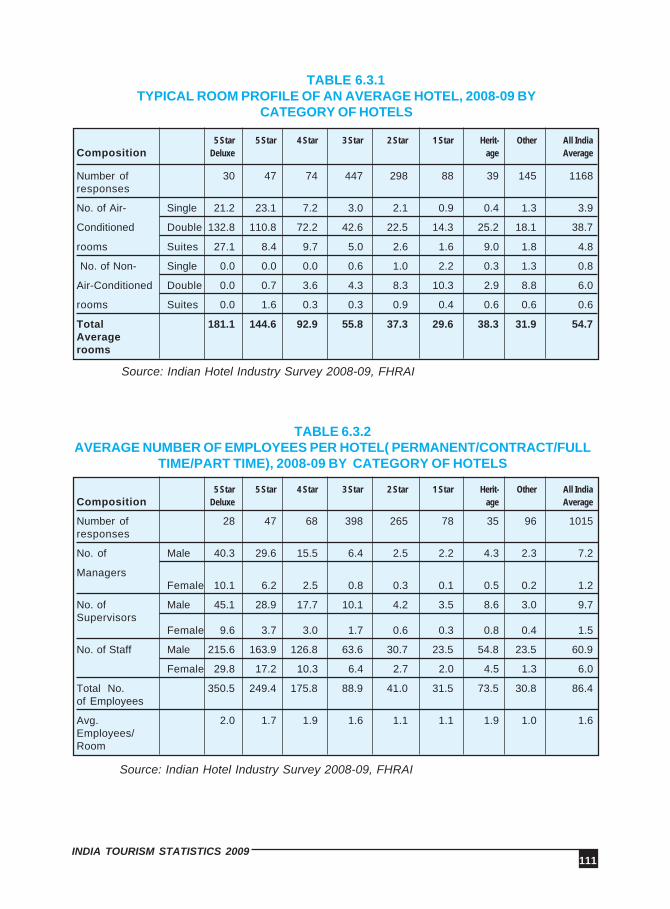
111INDIA TOURISM STATISTICS 2009
TABLE 6.3.1TYPICAL ROOM PROFILE OF AN AVERAGE HOTEL, 2008-09 BY
CATEGORY OF HOTELS
5 Star 5 Star 4 Star 3 Star 2 Star 1 Star Herit- Other All IndiaComposition Deluxe age Average
Number of 30 47 74 447 298 88 39 145 1168responses
No. of Air- Single 21.2 23.1 7.2 3.0 2.1 0.9 0.4 1.3 3.9
Conditioned Double 132.8 110.8 72.2 42.6 22.5 14.3 25.2 18.1 38.7
rooms Suites 27.1 8.4 9.7 5.0 2.6 1.6 9.0 1.8 4.8
No. of Non- Single 0.0 0.0 0.0 0.6 1.0 2.2 0.3 1.3 0.8
Air-Conditioned Double 0.0 0.7 3.6 4.3 8.3 10.3 2.9 8.8 6.0
rooms Suites 0.0 1.6 0.3 0.3 0.9 0.4 0.6 0.6 0.6
Total 181.1 144.6 92.9 55.8 37.3 29.6 38.3 31.9 54.7Averagerooms
Source: Indian Hotel Industry Survey 2008-09, FHRAI
5 Star 5 Star 4 Star 3 Star 2 Star 1 Star Herit- Other All IndiaComposition Deluxe age Average
Number of 28 47 68 398 265 78 35 96 1015responses
No. of Male 40.3 29.6 15.5 6.4 2.5 2.2 4.3 2.3 7.2
Managers Female 10.1 6.2 2.5 0.8 0.3 0.1 0.5 0.2 1.2
No. of Male 45.1 28.9 17.7 10.1 4.2 3.5 8.6 3.0 9.7Supervisors
Female 9.6 3.7 3.0 1.7 0.6 0.3 0.8 0.4 1.5
No. of Staff Male 215.6 163.9 126.8 63.6 30.7 23.5 54.8 23.5 60.9
Female 29.8 17.2 10.3 6.4 2.7 2.0 4.5 1.3 6.0
Total No. 350.5 249.4 175.8 88.9 41.0 31.5 73.5 30.8 86.4of Employees
Avg. 2.0 1.7 1.9 1.6 1.1 1.1 1.9 1.0 1.6Employees/Room
TABLE 6.3.2AVERAGE NUMBER OF EMPLOYEES PER HOTEL( PERMANENT/CONTRACT/FULL
TIME/PART TIME), 2008-09 BY CATEGORY OF HOTELS
Source: Indian Hotel Industry Survey 2008-09, FHRAI
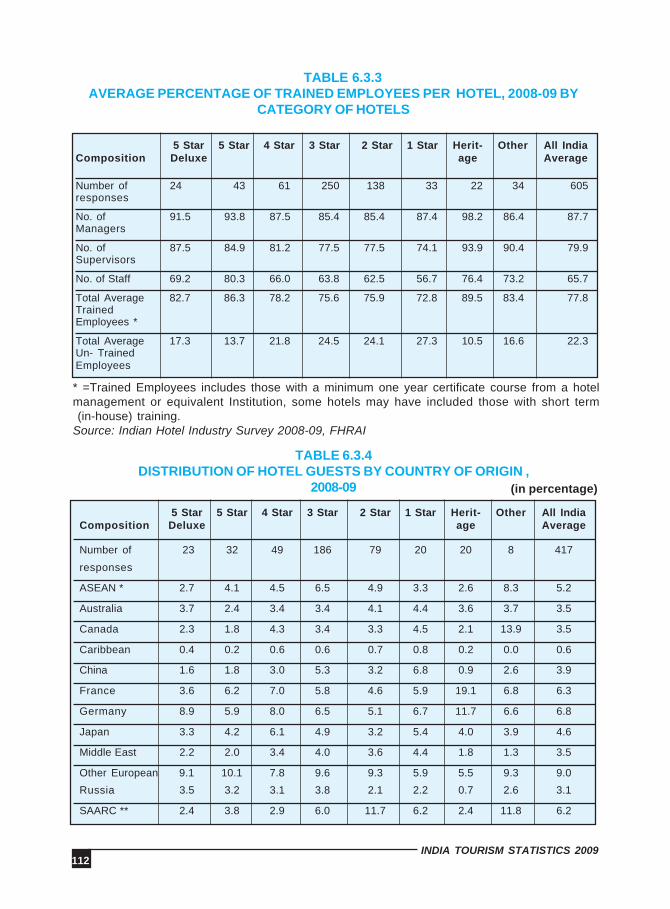
112INDIA TOURISM STATISTICS 2009
5 Star 5 Star 4 Star 3 Star 2 Star 1 Star Herit- Other All IndiaComposition Deluxe age Average
Number of 24 43 61 250 138 33 22 34 605responses
No. of 91.5 93.8 87.5 85.4 85.4 87.4 98.2 86.4 87.7Managers
No. of 87.5 84.9 81.2 77.5 77.5 74.1 93.9 90.4 79.9Supervisors
No. of Staff 69.2 80.3 66.0 63.8 62.5 56.7 76.4 73.2 65.7
Total Average 82.7 86.3 78.2 75.6 75.9 72.8 89.5 83.4 77.8TrainedEmployees *
Total Average 17.3 13.7 21.8 24.5 24.1 27.3 10.5 16.6 22.3Un- TrainedEmployees
TABLE 6.3.3AVERAGE PERCENTAGE OF TRAINED EMPLOYEES PER HOTEL, 2008-09 BY
CATEGORY OF HOTELS
* =Trained Employees includes those with a minimum one year certificate course from a hotelmanagement or equivalent Institution, some hotels may have included those with short term (in-house) training.Source: Indian Hotel Industry Survey 2008-09, FHRAI
TABLE 6.3.4DISTRIBUTION OF HOTEL GUESTS BY COUNTRY OF ORIGIN ,
2008-09 (in percentage)
5 Star 5 Star 4 Star 3 Star 2 Star 1 Star Herit- Other All IndiaComposition Deluxe age Average
Number of 23 32 49 186 79 20 20 8 417
responses
ASEAN * 2.7 4.1 4.5 6.5 4.9 3.3 2.6 8.3 5.2
Australia 3.7 2.4 3.4 3.4 4.1 4.4 3.6 3.7 3.5
Canada 2.3 1.8 4.3 3.4 3.3 4.5 2.1 13.9 3.5
Caribbean 0.4 0.2 0.6 0.6 0.7 0.8 0.2 0.0 0.6
China 1.6 1.8 3.0 5.3 3.2 6.8 0.9 2.6 3.9
France 3.6 6.2 7.0 5.8 4.6 5.9 19.1 6.8 6.3
Germany 8.9 5.9 8.0 6.5 5.1 6.7 11.7 6.6 6.8
Japan 3.3 4.2 6.1 4.9 3.2 5.4 4.0 3.9 4.6
Middle East 2.2 2.0 3.4 4.0 3.6 4.4 1.8 1.3 3.5
Other European 9.1 10.1 7.8 9.6 9.3 5.9 5.5 9.3 9.0
Russia 3.5 3.2 3.1 3.8 2.1 2.2 0.7 2.6 3.1
SAARC ** 2.4 3.8 2.9 6.0 11.7 6.2 2.4 11.8 6.2
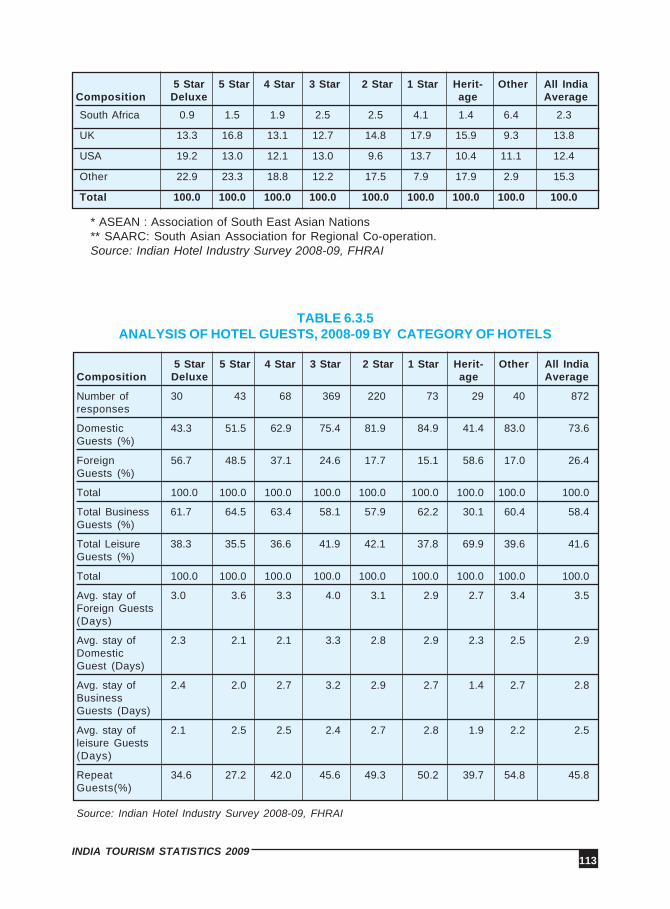
113INDIA TOURISM STATISTICS 2009
* ASEAN : Association of South East Asian Nations** SAARC: South Asian Association for Regional Co-operation.Source: Indian Hotel Industry Survey 2008-09, FHRAI
TABLE 6.3.5ANALYSIS OF HOTEL GUESTS, 2008-09 BY CATEGORY OF HOTELS
5 Star 5 Star 4 Star 3 Star 2 Star 1 Star Herit- Other All IndiaComposition Deluxe age Average
Number of 30 43 68 369 220 73 29 40 872responses
Domestic 43.3 51.5 62.9 75.4 81.9 84.9 41.4 83.0 73.6Guests (%)
Foreign 56.7 48.5 37.1 24.6 17.7 15.1 58.6 17.0 26.4Guests (%)
Total 100.0 100.0 100.0 100.0 100.0 100.0 100.0 100.0 100.0
Total Business 61.7 64.5 63.4 58.1 57.9 62.2 30.1 60.4 58.4Guests (%)
Total Leisure 38.3 35.5 36.6 41.9 42.1 37.8 69.9 39.6 41.6Guests (%)
Total 100.0 100.0 100.0 100.0 100.0 100.0 100.0 100.0 100.0
Avg. stay of 3.0 3.6 3.3 4.0 3.1 2.9 2.7 3.4 3.5Foreign Guests(Days)
Avg. stay of 2.3 2.1 2.1 3.3 2.8 2.9 2.3 2.5 2.9DomesticGuest (Days)
Avg. stay of 2.4 2.0 2.7 3.2 2.9 2.7 1.4 2.7 2.8BusinessGuests (Days)
Avg. stay of 2.1 2.5 2.5 2.4 2.7 2.8 1.9 2.2 2.5leisure Guests(Days)
Repeat 34.6 27.2 42.0 45.6 49.3 50.2 39.7 54.8 45.8Guests(%)
Source: Indian Hotel Industry Survey 2008-09, FHRAI
5 Star 5 Star 4 Star 3 Star 2 Star 1 Star Herit- Other All IndiaComposition Deluxe age Average
South Africa 0.9 1.5 1.9 2.5 2.5 4.1 1.4 6.4 2.3
UK 13.3 16.8 13.1 12.7 14.8 17.9 15.9 9.3 13.8
USA 19.2 13.0 12.1 13.0 9.6 13.7 10.4 11.1 12.4
Other 22.9 23.3 18.8 12.2 17.5 7.9 17.9 2.9 15.3
Total 100.0 100.0 100.0 100.0 100.0 100.0 100.0 100.0 100.0

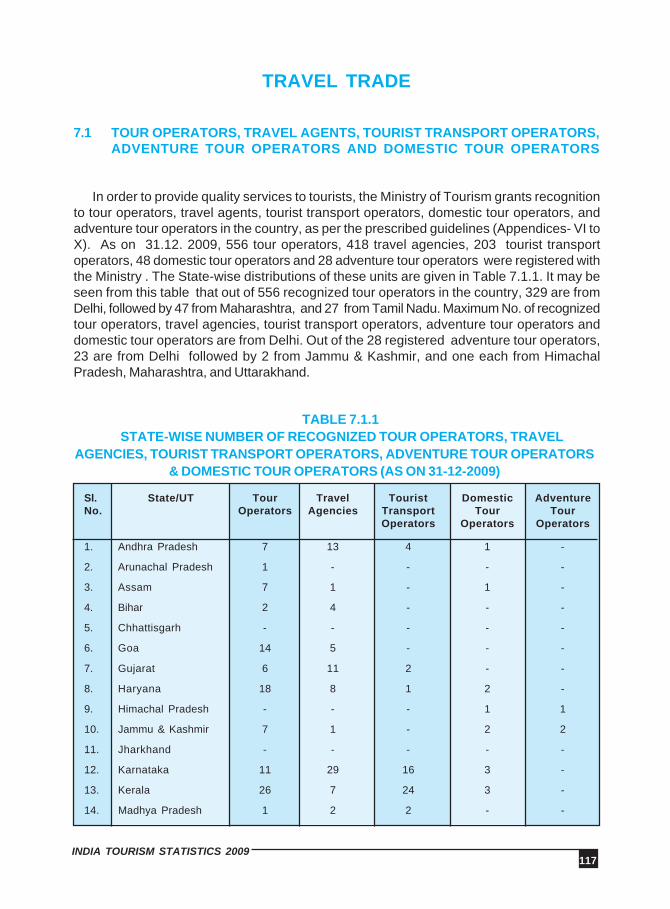
117INDIA TOURISM STATISTICS 2009
TRAVEL TRADE
7.1 TOUR OPERATORS, TRAVEL AGENTS, TOURIST TRANSPORT OPERATORS,ADVENTURE TOUR OPERATORS AND DOMESTIC TOUR OPERATORS
In order to provide quality services to tourists, the Ministry of Tourism grants recognitionto tour operators, travel agents, tourist transport operators, domestic tour operators, andadventure tour operators in the country, as per the prescribed guidelines (Appendices- VI toX). As on 31.12. 2009, 556 tour operators, 418 travel agencies, 203 tourist transportoperators, 48 domestic tour operators and 28 adventure tour operators were registered withthe Ministry . The State-wise distributions of these units are given in Table 7.1.1. It may beseen from this table that out of 556 recognized tour operators in the country, 329 are fromDelhi, followed by 47 from Maharashtra, and 27 from Tamil Nadu. Maximum No. of recognizedtour operators, travel agencies, tourist transport operators, adventure tour operators anddomestic tour operators are from Delhi. Out of the 28 registered adventure tour operators,23 are from Delhi followed by 2 from Jammu & Kashmir, and one each from HimachalPradesh, Maharashtra, and Uttarakhand.
TABLE 7.1.1 STATE-WISE NUMBER OF RECOGNIZED TOUR OPERATORS, TRAVEL
AGENCIES, TOURIST TRANSPORT OPERATORS, ADVENTURE TOUR OPERATORS& DOMESTIC TOUR OPERATORS (AS ON 31-12-2009)
Sl. State/UT Tour Travel Tourist Domestic AdventureNo. Operators Agencies Transport Tour Tour
Operators Operators Operators
1. Andhra Pradesh 7 13 4 1 -
2. Arunachal Pradesh 1 - - - -
3. Assam 7 1 - 1 -
4. Bihar 2 4 - - -
5. Chhattisgarh - - - - -
6. Goa 14 5 - - -
7. Gujarat 6 11 2 - -
8. Haryana 18 8 1 2 -
9. Himachal Pradesh - - - 1 1
10. Jammu & Kashmir 7 1 - 2 2
11. Jharkhand - - - - -
12. Karnataka 11 29 16 3 -
13. Kerala 26 7 24 3 -
14. Madhya Pradesh 1 2 2 - -
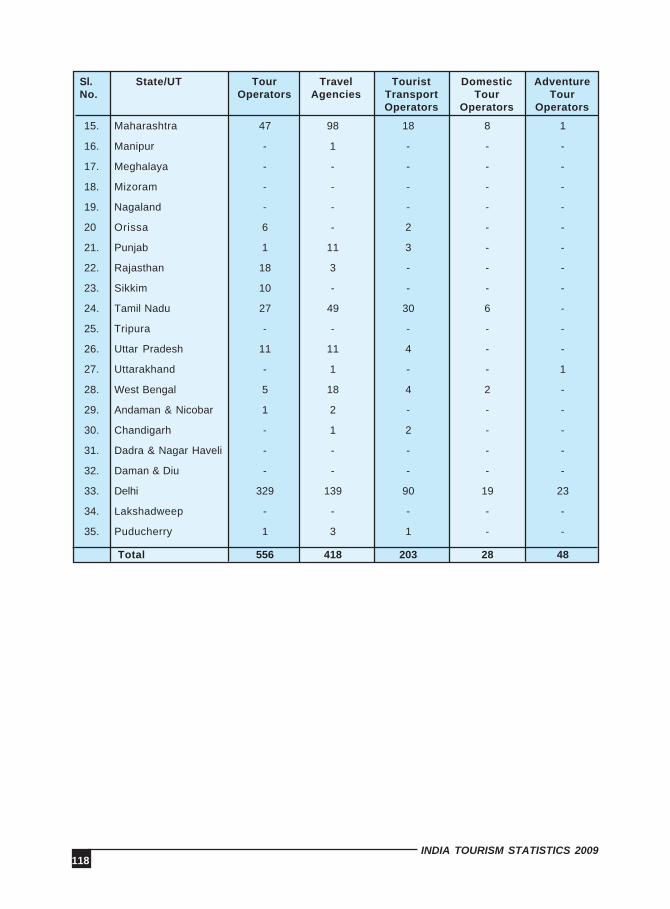
118INDIA TOURISM STATISTICS 2009
15. Maharashtra 47 98 18 8 1
16. Manipur - 1 - - -
17. Meghalaya - - - - -
18. Mizoram - - - - -
19. Nagaland - - - - -
20 Orissa 6 - 2 - -
21. Punjab 1 11 3 - -
22. Rajasthan 18 3 - - -
23. Sikkim 10 - - - -
24. Tamil Nadu 27 49 30 6 -
25. Tripura - - - - -
26. Uttar Pradesh 11 11 4 - -
27. Uttarakhand - 1 - - 1
28. West Bengal 5 18 4 2 -
29. Andaman & Nicobar 1 2 - - -
30. Chandigarh - 1 2 - -
31. Dadra & Nagar Haveli - - - - -
32. Daman & Diu - - - - -
33. Delhi 329 139 90 19 23
34. Lakshadweep - - - - -
35. Puducherry 1 3 1 - -
Total 556 418 203 28 48
Sl. State/UT Tour Travel Tourist Domestic AdventureNo. Operators Agencies Transport Tour Tour
Operators Operators Operators

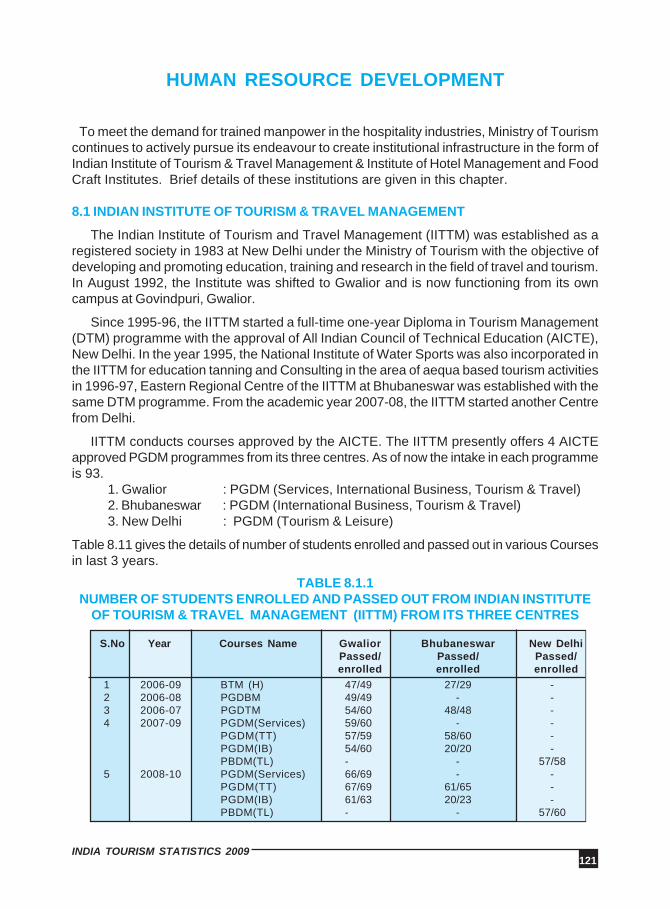
121INDIA TOURISM STATISTICS 2009
HUMAN RESOURCE DEVELOPMENT
To meet the demand for trained manpower in the hospitality industries, Ministry of Tourismcontinues to actively pursue its endeavour to create institutional infrastructure in the form ofIndian Institute of Tourism & Travel Management & Institute of Hotel Management and FoodCraft Institutes. Brief details of these institutions are given in this chapter.
8.1 INDIAN INSTITUTE OF TOURISM & TRAVEL MANAGEMENT
The Indian Institute of Tourism and Travel Management (IITTM) was established as aregistered society in 1983 at New Delhi under the Ministry of Tourism with the objective ofdeveloping and promoting education, training and research in the field of travel and tourism.In August 1992, the Institute was shifted to Gwalior and is now functioning from its owncampus at Govindpuri, Gwalior.
Since 1995-96, the IITTM started a full-time one-year Diploma in Tourism Management(DTM) programme with the approval of All Indian Council of Technical Education (AICTE),New Delhi. In the year 1995, the National Institute of Water Sports was also incorporated inthe IITTM for education tanning and Consulting in the area of aequa based tourism activitiesin 1996-97, Eastern Regional Centre of the IITTM at Bhubaneswar was established with thesame DTM programme. From the academic year 2007-08, the IITTM started another Centrefrom Delhi.
IITTM conducts courses approved by the AICTE. The IITTM presently offers 4 AICTEapproved PGDM programmes from its three centres. As of now the intake in each programmeis 93.
1. Gwalior : PGDM (Services, International Business, Tourism & Travel)2. Bhubaneswar : PGDM (International Business, Tourism & Travel)3. New Delhi : PGDM (Tourism & Leisure)
Table 8.11 gives the details of number of students enrolled and passed out in various Coursesin last 3 years.
TABLE 8.1.1NUMBER OF STUDENTS ENROLLED AND PASSED OUT FROM INDIAN INSTITUTE
OF TOURISM & TRAVEL MANAGEMENT (IITTM) FROM ITS THREE CENTRES
S.No Year Courses Name Gwalior Bhubaneswar New DelhiPassed/ Passed/ Passed/enrolled enrolled enrolled
1 2006-09 BTM (H) 47/49 27/29 -2 2006-08 PGDBM 49/49 - -3 2006-07 PGDTM 54/60 48/48 -4 2007-09 PGDM(Services) 59/60 - -
PGDM(TT) 57/59 58/60 -PGDM(IB) 54/60 20/20 -PBDM(TL) - - 57/58
5 2008-10 PGDM(Services) 66/69 - -PGDM(TT) 67/69 61/65 -PGDM(IB) 61/63 20/23 -PBDM(TL) - - 57/60
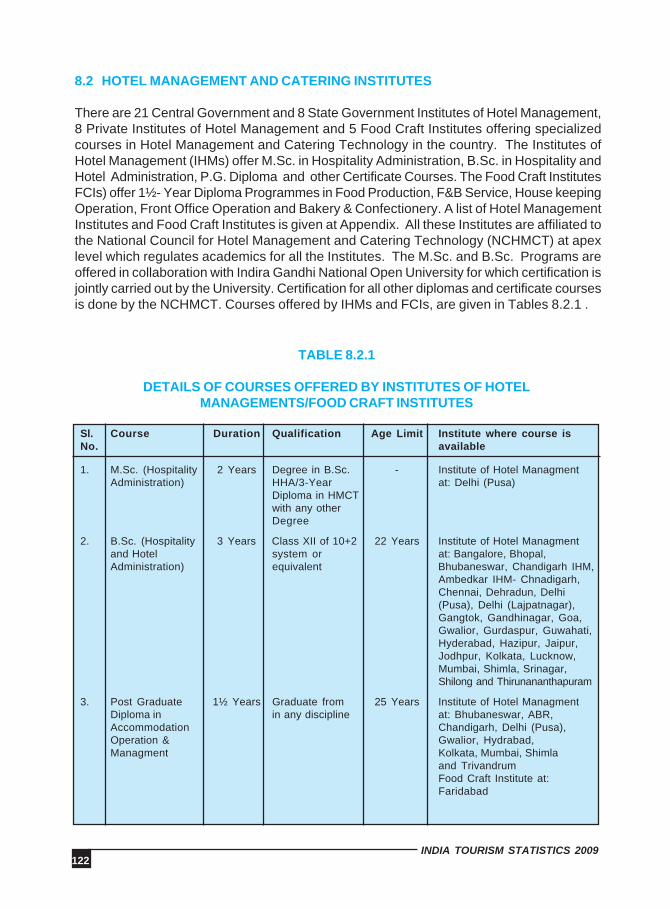
122INDIA TOURISM STATISTICS 2009
TABLE 8.2.1
DETAILS OF COURSES OFFERED BY INSTITUTES OF HOTELMANAGEMENTS/FOOD CRAFT INSTITUTES
Sl. Course Duration Qualification Age Limit Institute where course isNo. available
1. M.Sc. (Hospitality 2 Years Degree in B.Sc. - Institute of Hotel ManagmentAdministration) HHA/3-Year at: Delhi (Pusa)
Diploma in HMCTwith any otherDegree
2. B.Sc. (Hospitality 3 Years Class XII of 10+2 22 Years Institute of Hotel Managmentand Hotel system or at: Bangalore, Bhopal,Administration) equivalent Bhubaneswar, Chandigarh IHM,
Ambedkar IHM- Chnadigarh,Chennai, Dehradun, Delhi(Pusa), Delhi (Lajpatnagar),Gangtok, Gandhinagar, Goa,Gwalior, Gurdaspur, Guwahati,Hyderabad, Hazipur, Jaipur,Jodhpur, Kolkata, Lucknow,Mumbai, Shimla, Srinagar,Shilong and Thirunananthapuram
3. Post Graduate 1½ Years Graduate from 25 Years Institute of Hotel ManagmentDiploma in in any discipline at: Bhubaneswar, ABR,Accommodation Chandigarh, Delhi (Pusa),Operation & Gwalior, Hydrabad,Managment Kolkata, Mumbai, Shimla
and TrivandrumFood Craft Institute at:Faridabad
8.2 HOTEL MANAGEMENT AND CATERING INSTITUTES
There are 21 Central Government and 8 State Government Institutes of Hotel Management,8 Private Institutes of Hotel Management and 5 Food Craft Institutes offering specializedcourses in Hotel Management and Catering Technology in the country. The Institutes ofHotel Management (IHMs) offer M.Sc. in Hospitality Administration, B.Sc. in Hospitality andHotel Administration, P.G. Diploma and other Certificate Courses. The Food Craft InstitutesFCIs) offer 1½- Year Diploma Programmes in Food Production, F&B Service, House keepingOperation, Front Office Operation and Bakery & Confectionery. A list of Hotel ManagementInstitutes and Food Craft Institutes is given at Appendix. All these Institutes are affiliated tothe National Council for Hotel Management and Catering Technology (NCHMCT) at apexlevel which regulates academics for all the Institutes. The M.Sc. and B.Sc. Programs areoffered in collaboration with Indira Gandhi National Open University for which certification isjointly carried out by the University. Certification for all other diplomas and certificate coursesis done by the NCHMCT. Courses offered by IHMs and FCIs, are given in Tables 8.2.1 .
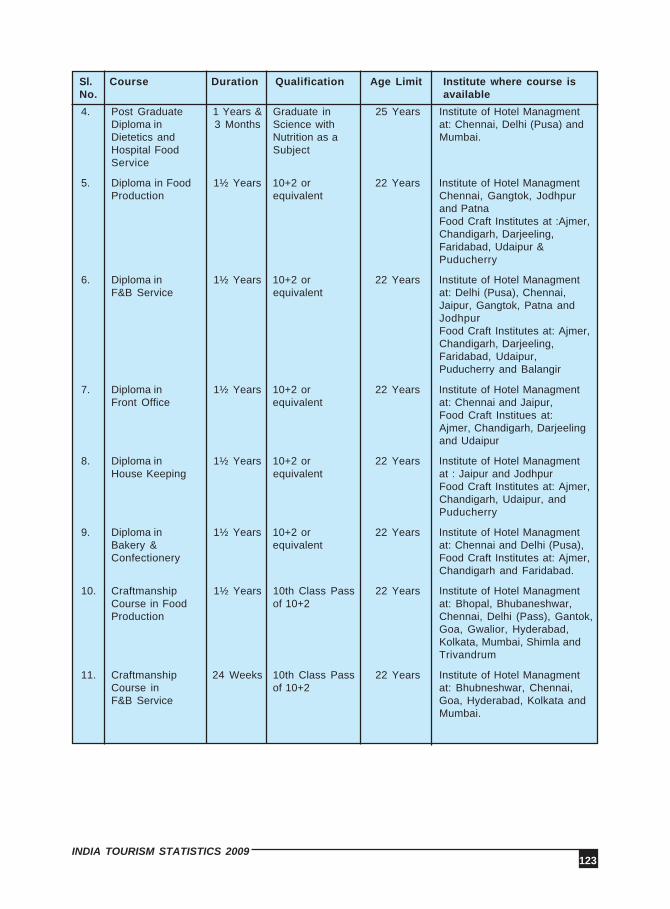
123INDIA TOURISM STATISTICS 2009
Sl. Course Duration Qualification Age Limit Institute where course isNo. available
4. Post Graduate 1 Years & Graduate in 25 Years Institute of Hotel ManagmentDiploma in 3 Months Science with at: Chennai, Delhi (Pusa) andDietetics and Nutrition as a Mumbai.Hospital Food SubjectService
5. Diploma in Food 1½ Years 10+2 or 22 Years Institute of Hotel ManagmentProduction equivalent Chennai, Gangtok, Jodhpur
and PatnaFood Craft Institutes at :Ajmer,Chandigarh, Darjeeling,Faridabad, Udaipur &Puducherry
6. Diploma in 1½ Years 10+2 or 22 Years Institute of Hotel ManagmentF&B Service equivalent at: Delhi (Pusa), Chennai,
Jaipur, Gangtok, Patna andJodhpurFood Craft Institutes at: Ajmer,Chandigarh, Darjeeling,Faridabad, Udaipur,Puducherry and Balangir
7. Diploma in 1½ Years 10+2 or 22 Years Institute of Hotel ManagmentFront Office equivalent at: Chennai and Jaipur,
Food Craft Institues at:Ajmer, Chandigarh, Darjeelingand Udaipur
8. Diploma in 1½ Years 10+2 or 22 Years Institute of Hotel ManagmentHouse Keeping equivalent at : Jaipur and Jodhpur
Food Craft Institutes at: Ajmer,Chandigarh, Udaipur, andPuducherry
9. Diploma in 1½ Years 10+2 or 22 Years Institute of Hotel ManagmentBakery & equivalent at: Chennai and Delhi (Pusa),Confectionery Food Craft Institutes at: Ajmer,
Chandigarh and Faridabad.
10. Craftmanship 1½ Years 10th Class Pass 22 Years Institute of Hotel ManagmentCourse in Food of 10+2 at: Bhopal, Bhubaneshwar,Production Chennai, Delhi (Pass), Gantok,
Goa, Gwalior, Hyderabad,Kolkata, Mumbai, Shimla andTrivandrum
11. Craftmanship 24 Weeks 10th Class Pass 22 Years Institute of Hotel ManagmentCourse in of 10+2 at: Bhubneshwar, Chennai,F&B Service Goa, Hyderabad, Kolkata and
Mumbai.
127INDIA TOURISM STATISTICS 2009
PLAN OUTLAYS
9.1 ANNUAL PLAN OUTLAYS AND FINANCIAL ASSISTANCE PROVIDED TO STATES
The Govt. aims at positioning tourism as a major engine of economic growth andharnessing its direct and multiplier effects for employment and poverty eradication in anenvironmentally sustainable manner. The Plan Schemes of the Ministry of Tourismessentially relate to the following:
(i) Tourism Product/Infrastructure Development
(ii) Human Resource Development
(iii) Promotion and Marketing
(iv) Market Research and
(v) Computerization and Information Technology
Since most of the infrastructure components and delivery systems are within thepurview of the State Governments or private sector, the infrastructure for tourism is mainlybeing developed by providing financial assistance to State/UT Governments, and by providingvarious incentives to private entrepreneurs. Table 9.1.1 gives the scheme-wise outlays ofMinistry of Tourism for the Annual Plan 2010-11. Table 9.1.2 gives Scheme-wise outlay ofMinistry of Tourism for the Eleventh Five Year Plan. Table 9.1.3 gives the number of tourismprojects and amount sanctioned by Ministry of Tourism to various State/UT Governmentsduring the years 2007-08, 2008-09 and 2009-10 in Eleventh Five Year Plan period.
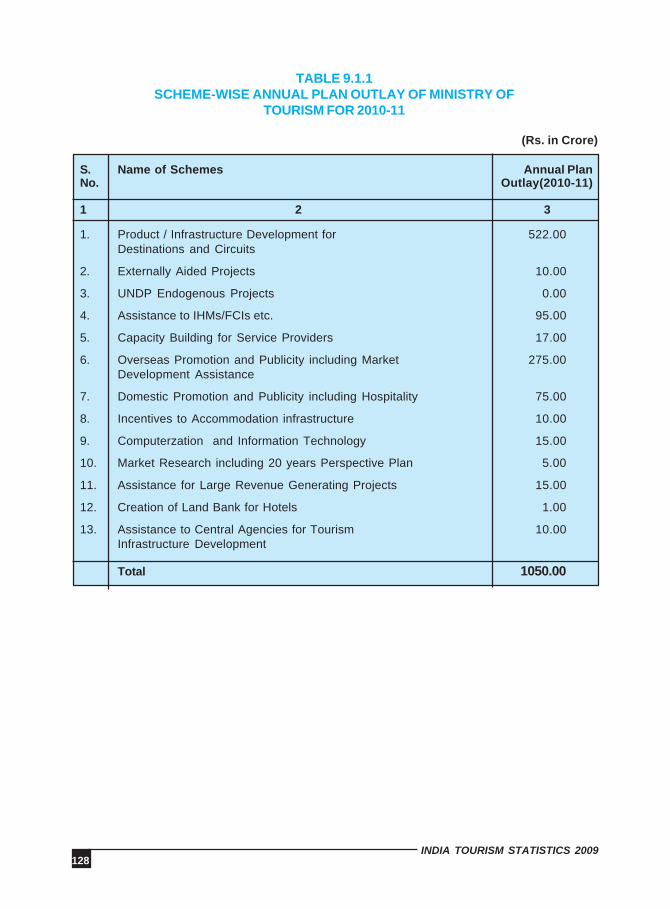
128INDIA TOURISM STATISTICS 2009
(Rs. in Crore)
S. Name of Schemes Annual PlanNo. Outlay(2010-11)
1 2 3
1. Product / Infrastructure Development for 522.00Destinations and Circuits
2. Externally Aided Projects 10.00
3. UNDP Endogenous Projects 0.00
4. Assistance to IHMs/FCIs etc. 95.00
5. Capacity Building for Service Providers 17.00
6. Overseas Promotion and Publicity including Market 275.00Development Assistance
7. Domestic Promotion and Publicity including Hospitality 75.00
8. Incentives to Accommodation infrastructure 10.00
9. Computerzation and Information Technology 15.00
10. Market Research including 20 years Perspective Plan 5.00
11. Assistance for Large Revenue Generating Projects 15.00
12. Creation of Land Bank for Hotels 1.00
13. Assistance to Central Agencies for Tourism 10.00Infrastructure Development
Total 1050.00
TABLE 9.1.1SCHEME-WISE ANNUAL PLAN OUTLAY OF MINISTRY OF
TOURISM FOR 2010-11

129INDIA TOURISM STATISTICS 2009
TABLE 9.1.2SCHEME-WISE PLAN OUTLAY OF MINISTRY OF TOURISM FOR
THE ELEVENTH FIVE YEAR PLAN (2007-2012)
(Rs. in Crore)
Sl. Name of Scheme/Programme Eleventh FiveNo. Year Plan Outlay
A Central Sector Schemes (CS)
1. Computerization and Information Technology 121.002. Domestic Promotion and Publicity including Hospitality 426.003. Overseas Promotion and Publicity including 1010.00
Market Development Assistance4. Externally Aided Projects (Buddisht Centres) 37.005. UNDP Endogenous Projects 2.006. Assistance for Large Revenue Generating Projects 200.007. Construction of Building of IISM at Gulmarg (J&K) 13.008. Equity contribution to ITDC 73.009. Creation of Land for Hotels 14.0010. Assistance to Central Agencies for Tourism 25.00
Infrastructure Development11. Assistance to IHMs/FCIs/IITTM/NIWS 495.0012. Capacity Building for Service Providers 95.0013. Market Research including 20 Years Perspective Plan 29.0014. Incentives to Accommodation Infrastructure 235.00
B Centrally Sponsored Schemes (CSS)
15. Product/Infrastructure, Destinations Development 2381.00
TOTAL 5156.00
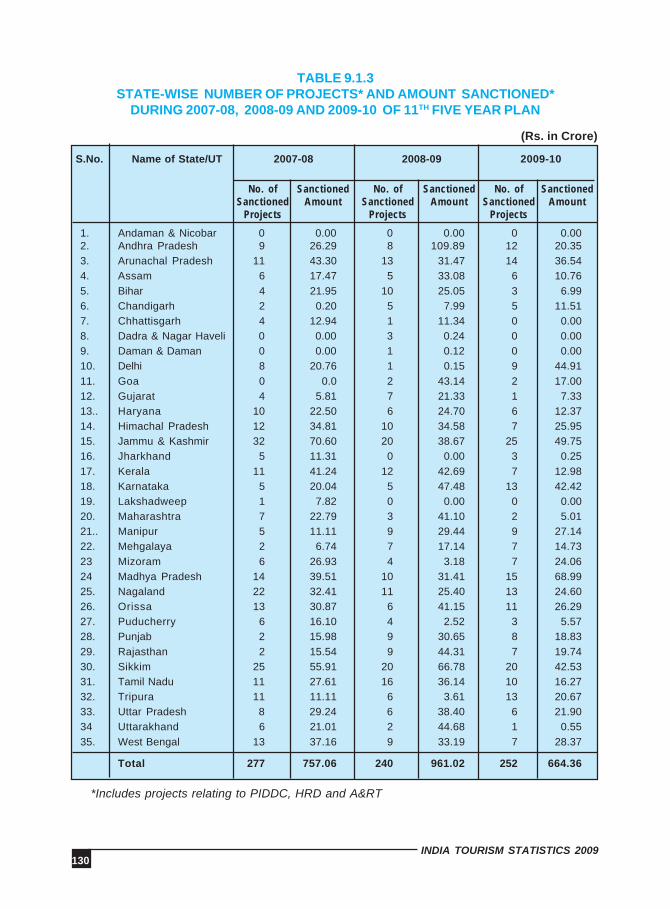
130INDIA TOURISM STATISTICS 2009
TABLE 9.1.3STATE-WISE NUMBER OF PROJECTS* AND AMOUNT SANCTIONED*
DURING 2007-08, 2008-09 AND 2009-10 OF 11TH FIVE YEAR PLAN
S.No. Name of State/UT 2007-08 2008-09 2009-10
No. ofSanctioned
Projects
SanctionedAmount
No. ofSanctioned
Projects
SanctionedAmount
1. Andaman & Nicobar 0 0.00 0 0.00 0 0.002. Andhra Pradesh 9 26.29 8 109.89 12 20.353. Arunachal Pradesh 11 43.30 13 31.47 14 36.544. Assam 6 17.47 5 33.08 6 10.765. Bihar 4 21.95 10 25.05 3 6.996. Chandigarh 2 0.20 5 7.99 5 11.517. Chhattisgarh 4 12.94 1 11.34 0 0.008. Dadra & Nagar Haveli 0 0.00 3 0.24 0 0.009. Daman & Daman 0 0.00 1 0.12 0 0.0010. Delhi 8 20.76 1 0.15 9 44.9111. Goa 0 0.0 2 43.14 2 17.0012. Gujarat 4 5.81 7 21.33 1 7.3313.. Haryana 10 22.50 6 24.70 6 12.3714. Himachal Pradesh 12 34.81 10 34.58 7 25.9515. Jammu & Kashmir 32 70.60 20 38.67 25 49.7516. Jharkhand 5 11.31 0 0.00 3 0.2517. Kerala 11 41.24 12 42.69 7 12.9818. Karnataka 5 20.04 5 47.48 13 42.4219. Lakshadweep 1 7.82 0 0.00 0 0.0020. Maharashtra 7 22.79 3 41.10 2 5.0121.. Manipur 5 11.11 9 29.44 9 27.1422. Mehgalaya 2 6.74 7 17.14 7 14.7323 Mizoram 6 26.93 4 3.18 7 24.0624 Madhya Pradesh 14 39.51 10 31.41 15 68.9925. Nagaland 22 32.41 11 25.40 13 24.6026. Orissa 13 30.87 6 41.15 11 26.2927. Puducherry 6 16.10 4 2.52 3 5.5728. Punjab 2 15.98 9 30.65 8 18.8329. Rajasthan 2 15.54 9 44.31 7 19.7430. Sikkim 25 55.91 20 66.78 20 42.5331. Tamil Nadu 11 27.61 16 36.14 10 16.2732. Tripura 11 11.11 6 3.61 13 20.6733. Uttar Pradesh 8 29.24 6 38.40 6 21.9034 Uttarakhand 6 21.01 2 44.68 1 0.5535. West Bengal 13 37.16 9 33.19 7 28.37
Total 277 757.06 240 961.02 252 664.36
No. ofSanctioned
Projects
SanctionedAmount
*Includes projects relating to PIDDC, HRD and A&RT
(Rs. in Crore)
133INDIA TOURISM STATISTICS 2009
Summary of the Study Report on “Infrastructure Gaps inTourism Sector at Five Tourist Destinations in India
Based on Perception of Tourists”
1 INTRODUCTION:
The Ministry of Tourism (MOT) is making efforts to increase the number of domestic andforeign tourists in the country through marketing tourism using publicity campaign of “IncredibleIndia”, and improving tourists’ facilities in the tourist destinations so as to make them moreattractive. The facilities at tourist destination play an important role in increasing flow oftourists because the satisfied tourists will, generally, give wider publicity by publicizinghappy experiences of their visit to a tourist site. MOT commissioned a study to GFK Mode,New Delhi to study the infrastructure gaps in five tourism destinations namely Kullu-Manali,Himachal Pradesh; Guwahati including Kaziranga, Assam; Badami-Pattadakal-Aihole,Karnataka; Nanded, Maharashtra; Chitrakoot, Uttar Pradesh and Madhya Pradesh.
2 APPROACH TO THE STUDY:
The approach to this study is based on “Importance-Satisfaction” model. That is, the study,first, found out what infrastructure tourists considered as “important” and, then, assessedthe level of their “satisfaction”. Differences in the “importance” and the degree of “satisfaction”with the existing infrastructure became a gap, “importance-Satisfaction gap”. Larger the gapin a particular facility/infrastructure for tourists, higher was the priority to be given forimprovement. This approach was used to assess gaps in the infrastructure which needed tobe strengthened to make the destination more attractive to tourists and would help thetourist destination to achieve its tourist potential. This approach basically, was a “ServiceQuality Approach”.
3 STUDY DESIGN:
The study design was an exit interview where tourists were interviewed at the time they wereabout to leave the site. It was planned to study the importance and satisfaction with thetourist site by taking a sample of 1250 Indians and 1250 foreign tourists. But only 634foreign tourists could be covered even after repeated attempts. Therefore, the number ofdomestic tourists covered was 1953. All the important tourist sites in five tourist destinationin Kullu-Manali, Himachal Pradesh; Guwahati including Kaziranga, Assam; Badami-Pattadakal-Aihole, Karnataka; Nanded, Maharashtra; and Chitrakoot, Uttar Pradesh and Madhya Pradesh,were covered to get the desired sample. Data for the study was collected during August2009 to January 2010.
In making selection of the tourists from the site, it was assured that (i) sample is a randomsample by random time allocation of the sample of the tourists; they were to be interviewed

134INDIA TOURISM STATISTICS 2009
at 11:00 AM, 12:00 Noon, 1:00, 3:00 PM, 4:00 PM and 5:00 PM each day, (ii) sample wasspread over seven days of a week, (iii) it was spread over mornings and evenings, and (iv)both, male and female tourists were covered.
4 SCHEDULES USED IN THE STUDY:
A study tool with “Importance-Satisfaction” questions relevant to the tourism sector wasdesigned. This questionnaire has two sections; one to assess importance tourist assigns todifferent facilities and the other to assess his/her satisfaction level with the existing level ofthe facility. Within each broad category of facility, there were two or more components.
Ten broad categories of facilities studied were:• Air connectivity
• Road connectivity
• Rail connectivity
• Civic administration
• Traffic and transport management
• Tourists’ facilities
• Taxes/permits
• Maintenance and management of monuments/tourist attractions
• Other services, and
• Visa, immigration and customs (for foreign tourists)
The tourists were asked about each facility/component of infrastructure to score it on thescale of 1 to 5, for both “importance” of infrastructure and that on the level of “satisfaction”as per their assessment of the facility/component (shown below).
Importance Satisfaction
Answer Score assigned Answer Score assigned
Least important 1 Poor 1Somewhat important 2 Unsatisfactory 2Not so important 3 Average 3Very important 4 Good 4Most important 5 Excellent 5
Besides these questions on “Importance-Satisfaction”, data was collected on generalbackground information of the tourists —demographic as well as profile of tourist beinginterviewed (a random sample of tourists).
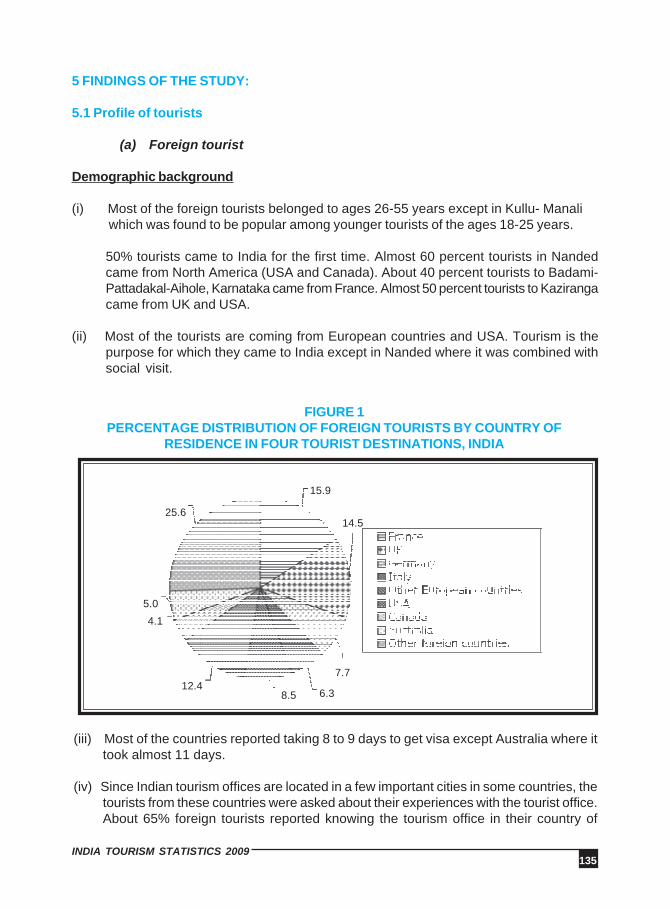
135INDIA TOURISM STATISTICS 2009
5 FINDINGS OF THE STUDY:
5.1 Profile of tourists
(a) Foreign tourist
Demographic background
(i) Most of the foreign tourists belonged to ages 26-55 years except in Kullu- Manali which was found to be popular among younger tourists of the ages 18-25 years.
50% tourists came to India for the first time. Almost 60 percent tourists in Nandedcame from North America (USA and Canada). About 40 percent tourists to Badami-Pattadakal-Aihole, Karnataka came from France. Almost 50 percent tourists to Kazirangacame from UK and USA.
(ii) Most of the tourists are coming from European countries and USA. Tourism is thepurpose for which they came to India except in Nanded where it was combined withsocial visit.
FIGURE 1PERCENTAGE DISTRIBUTION OF FOREIGN TOURISTS BY COUNTRY OF
RESIDENCE IN FOUR TOURIST DESTINATIONS, INDIA
15.9
14.525.6
5.0
4.1
12.48.5 6.3
7.7
(iii) Most of the countries reported taking 8 to 9 days to get visa except Australia where ittook almost 11 days.
(iv) Since Indian tourism offices are located in a few important cities in some countries, thetourists from these countries were asked about their experiences with the tourist office.About 65% foreign tourists reported knowing the tourism office in their country of
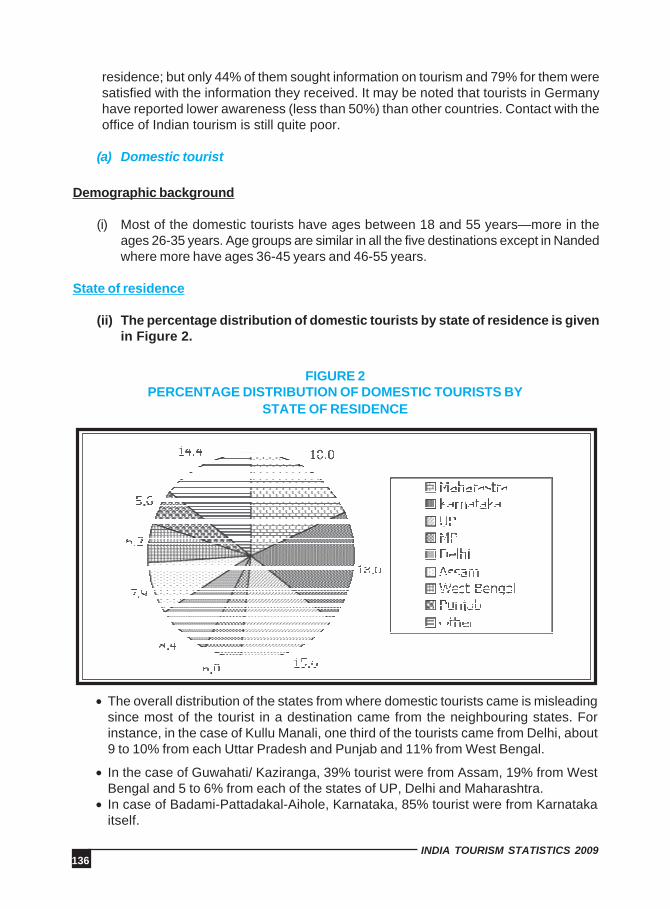
136INDIA TOURISM STATISTICS 2009
residence; but only 44% of them sought information on tourism and 79% for them weresatisfied with the information they received. It may be noted that tourists in Germanyhave reported lower awareness (less than 50%) than other countries. Contact with theoffice of Indian tourism is still quite poor.
(a) Domestic tourist
Demographic background
(i) Most of the domestic tourists have ages between 18 and 55 years—more in theages 26-35 years. Age groups are similar in all the five destinations except in Nandedwhere more have ages 36-45 years and 46-55 years.
State of residence
(ii) The percentage distribution of domestic tourists by state of residence is givenin Figure 2.
FIGURE 2PERCENTAGE DISTRIBUTION OF DOMESTIC TOURISTS BY
STATE OF RESIDENCE
• The overall distribution of the states from where domestic tourists came is misleadingsince most of the tourist in a destination came from the neighbouring states. Forinstance, in the case of Kullu Manali, one third of the tourists came from Delhi, about9 to 10% from each Uttar Pradesh and Punjab and 11% from West Bengal.
• In the case of Guwahati/ Kaziranga, 39% tourist were from Assam, 19% from WestBengal and 5 to 6% from each of the states of UP, Delhi and Maharashtra.
• In case of Badami-Pattadakal-Aihole, Karnataka, 85% tourist were from Karnatakaitself.

137INDIA TOURISM STATISTICS 2009
• For Nanded, two-thirds of the tourists came from Maharashtra; another 18% fromPunjab.
• In the case of Chitrakoot, 87% tourist came from UP and MP.
6 IMPORTANCE - SATISFACTION GAPS IN TOURISM INFRASTRUCTURE:
The tourists were asked to assign scores on the scale of 1- 5 on the degree of “importance”they assign to different facilities/components. They were also asked to assign score to thecurrent level of “satisfaction” with the facility/component.
(i) Indicator of “importance” tourists assign to different facilities/ components of thefacility:
As stated earlier, each tourist interviewed was asked to score each component of thetourist facility. After due analysis, the “Percent tourists reporting scores 4 (very important) or5 (most important)” had been taken as an indicator of the score tourist assigned to “importance”to the facility/component. Obviously, higher the percentage, higher will be importance of thefacility/component.
(ii) Ranks of ten tourist facilities reported as important by foreign tourists are shownbelow:
TABLE 1RANKING OF TEN FACILITIES BY “IMPORTANCE” (PERCENT TOURISTS
REPORTING SCORES 4 OR 5) BY FOREIGN TOURISTS
Facilities Ranking of facilities Average rank Overall( as reported in four (given in four rank
destinations) destinations)
Air connectivity KM=9; G=5; B=9; N=1 6.0 7
Road connectivity KM=4; G=8; B=5; N=2 4.8 4.5
Rail connectivity KM=6; G=9; B=6; N=10 7.8 8.5
Civic administration KM=3; G=2; B=3; N=5 3.3 3
Traffic and transport management KM=7; G=7; B=8; N=9 7.8 8.5
Tourist facilities KM=5; G=3; B=4; N=7 4.8 4.5
Taxes/permits KM=10; G=10; B=10; N=8 9.5 10
Maintenance and management KM=8; G=6; B=2; N=6 5.5 6of monuments/tourist attraction
Other services (including Power KM=2; G=4; B=1; N=4 2.8 1supply and Telephone/mobile connection)
Visa, Immigration and customs KM=1; G=1; B=7; N=3 3.0 2
KM = Kullu-Manali; G= Guwahati including Kaziranga; B = Badami-Pattadakal-Aihole; N = Nanded, Maharashtra
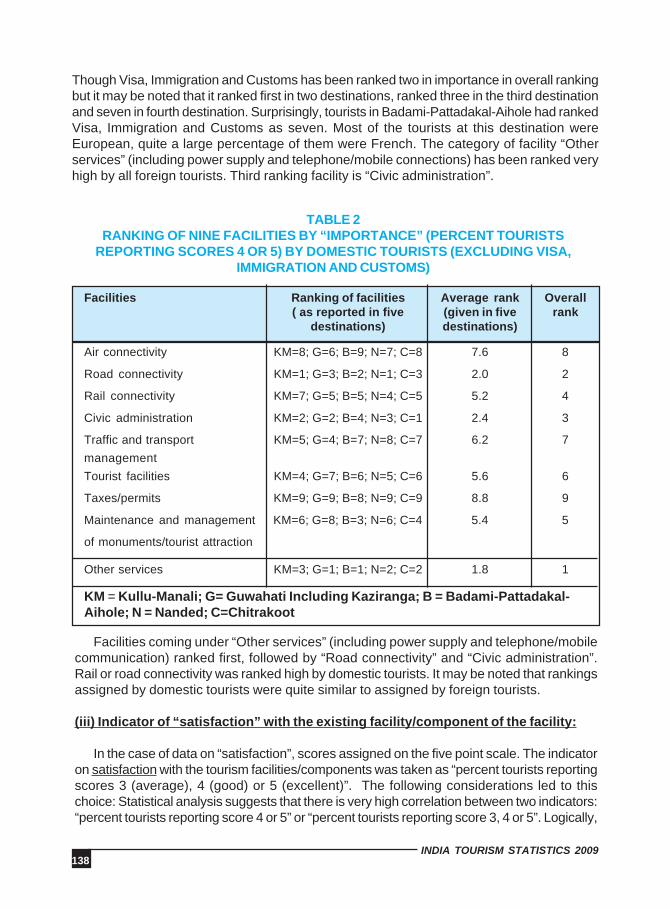
138INDIA TOURISM STATISTICS 2009
Though Visa, Immigration and Customs has been ranked two in importance in overall rankingbut it may be noted that it ranked first in two destinations, ranked three in the third destinationand seven in fourth destination. Surprisingly, tourists in Badami-Pattadakal-Aihole had rankedVisa, Immigration and Customs as seven. Most of the tourists at this destination wereEuropean, quite a large percentage of them were French. The category of facility “Otherservices” (including power supply and telephone/mobile connections) has been ranked veryhigh by all foreign tourists. Third ranking facility is “Civic administration”.
Facilities Ranking of facilities Average rank Overall( as reported in five (given in five rank
destinations) destinations)
Air connectivity KM=8; G=6; B=9; N=7; C=8 7.6 8
Road connectivity KM=1; G=3; B=2; N=1; C=3 2.0 2
Rail connectivity KM=7; G=5; B=5; N=4; C=5 5.2 4
Civic administration KM=2; G=2; B=4; N=3; C=1 2.4 3
Traffic and transport KM=5; G=4; B=7; N=8; C=7 6.2 7managementTourist facilities KM=4; G=7; B=6; N=5; C=6 5.6 6
Taxes/permits KM=9; G=9; B=8; N=9; C=9 8.8 9
Maintenance and management KM=6; G=8; B=3; N=6; C=4 5.4 5
of monuments/tourist attraction
Other services KM=3; G=1; B=1; N=2; C=2 1.8 1
KM = Kullu-Manali; G= Guwahati Including Kaziranga; B = Badami-Pattadakal-Aihole; N = Nanded; C=Chitrakoot
Facilities coming under “Other services” (including power supply and telephone/mobilecommunication) ranked first, followed by “Road connectivity” and “Civic administration”.Rail or road connectivity was ranked high by domestic tourists. It may be noted that rankingsassigned by domestic tourists were quite similar to assigned by foreign tourists.
(iii) Indicator of “satisfaction” with the existing facility/component of the facility:
In the case of data on “satisfaction”, scores assigned on the five point scale. The indicatoron satisfaction with the tourism facilities/components was taken as “percent tourists reportingscores 3 (average), 4 (good) or 5 (excellent)”. The following considerations led to thischoice: Statistical analysis suggests that there is very high correlation between two indicators:“percent tourists reporting score 4 or 5” or “percent tourists reporting score 3, 4 or 5”. Logically,
TABLE 2RANKING OF NINE FACILITIES BY “IMPORTANCE” (PERCENT TOURISTS
REPORTING SCORES 4 OR 5) BY DOMESTIC TOURISTS (EXCLUDING VISA,IMMIGRATION AND CUSTOMS)
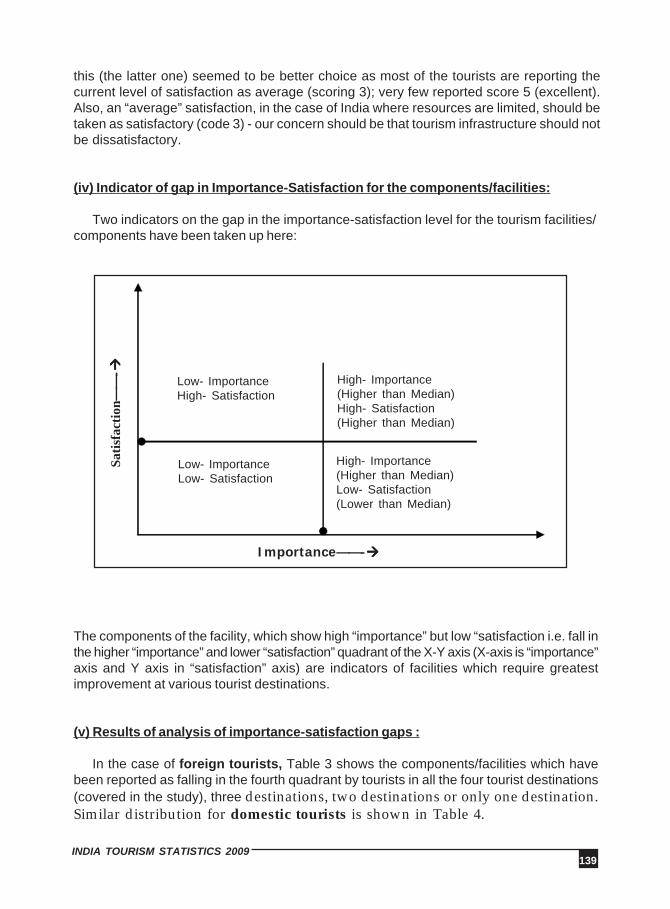
139INDIA TOURISM STATISTICS 2009
this (the latter one) seemed to be better choice as most of the tourists are reporting thecurrent level of satisfaction as average (scoring 3); very few reported score 5 (excellent).Also, an “average” satisfaction, in the case of India where resources are limited, should betaken as satisfactory (code 3) - our concern should be that tourism infrastructure should notbe dissatisfactory.
(iv) Indicator of gap in Importance-Satisfaction for the components/facilities:
Two indicators on the gap in the importance-satisfaction level for the tourism facilities/components have been taken up here:
Satis
fact
ion—
—-
Importance——-
Low- ImportanceHigh- Satisfaction
High- Importance(Higher than Median)High- Satisfaction(Higher than Median)
High- Importance(Higher than Median)Low- Satisfaction(Lower than Median)
Low- ImportanceLow- Satisfaction
The components of the facility, which show high “importance” but low “satisfaction i.e. fall inthe higher “importance” and lower “satisfaction” quadrant of the X-Y axis (X-axis is “importance”axis and Y axis in “satisfaction” axis) are indicators of facilities which require greatestimprovement at various tourist destinations.
(v) Results of analysis of importance-satisfaction gaps :
In the case of foreign tourists, Table 3 shows the components/facilities which havebeen reported as falling in the fourth quadrant by tourists in all the four tourist destinations(covered in the study), three destinations, two destinations or only one destination.Similar distribution for domestic tourists is shown in Table 4.
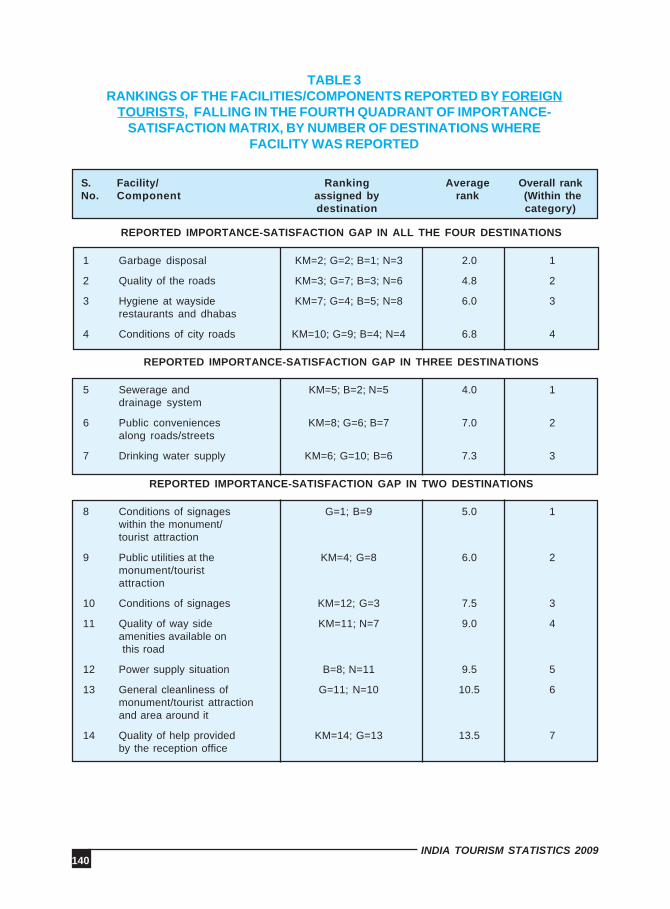
140INDIA TOURISM STATISTICS 2009
TABLE 3RANKINGS OF THE FACILITIES/COMPONENTS REPORTED BY FOREIGN
TOURISTS, FALLING IN THE FOURTH QUADRANT OF IMPORTANCE-SATISFACTION MATRIX, BY NUMBER OF DESTINATIONS WHERE
FACILITY WAS REPORTED
REPORTED IMPORTANCE-SATISFACTION GAP IN ALL THE FOUR DESTINATIONS
1 Garbage disposal KM=2; G=2; B=1; N=3 2.0 1
2 Quality of the roads KM=3; G=7; B=3; N=6 4.8 2
3 Hygiene at wayside KM=7; G=4; B=5; N=8 6.0 3restaurants and dhabas
4 Conditions of city roads KM=10; G=9; B=4; N=4 6.8 4
REPORTED IMPORTANCE-SATISFACTION GAP IN THREE DESTINATIONS
5 Sewerage and KM=5; B=2; N=5 4.0 1drainage system
6 Public conveniences KM=8; G=6; B=7 7.0 2along roads/streets
7 Drinking water supply KM=6; G=10; B=6 7.3 3
REPORTED IMPORTANCE-SATISFACTION GAP IN TWO DESTINATIONS
8 Conditions of signages G=1; B=9 5.0 1within the monument/tourist attraction
9 Public utilities at the KM=4; G=8 6.0 2monument/touristattraction
10 Conditions of signages KM=12; G=3 7.5 3
11 Quality of way side KM=11; N=7 9.0 4amenities available on this road
12 Power supply situation B=8; N=11 9.5 5
13 General cleanliness of G=11; N=10 10.5 6monument/tourist attractionand area around it
14 Quality of help provided KM=14; G=13 13.5 7by the reception office
S. Facility/ Ranking Average Overall rankNo. Component assigned by rank (Within the
destination category)
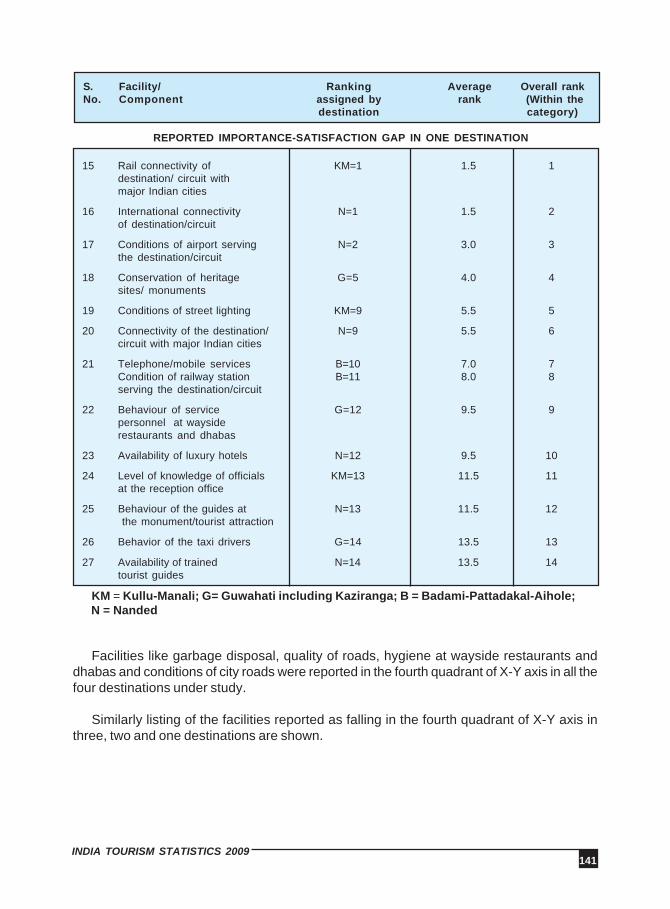
141INDIA TOURISM STATISTICS 2009
S. Facility/ Ranking Average Overall rankNo. Component assigned by rank (Within the
destination category)
REPORTED IMPORTANCE-SATISFACTION GAP IN ONE DESTINATION
15 Rail connectivity of KM=1 1.5 1destination/ circuit withmajor Indian cities
16 International connectivity N=1 1.5 2of destination/circuit
17 Conditions of airport serving N=2 3.0 3the destination/circuit
18 Conservation of heritage G=5 4.0 4sites/ monuments
19 Conditions of street lighting KM=9 5.5 5
20 Connectivity of the destination/ N=9 5.5 6circuit with major Indian cities
21 Telephone/mobile services B=10 7.0 7Condition of railway station B=11 8.0 8serving the destination/circuit
22 Behaviour of service G=12 9.5 9personnel at waysiderestaurants and dhabas
23 Availability of luxury hotels N=12 9.5 10
24 Level of knowledge of officials KM=13 11.5 11at the reception office
25 Behaviour of the guides at N=13 11.5 12 the monument/tourist attraction
26 Behavior of the taxi drivers G=14 13.5 13
27 Availability of trained N=14 13.5 14tourist guides
KM = Kullu-Manali; G= Guwahati including Kaziranga; B = Badami-Pattadakal-Aihole; N = Nanded
Facilities like garbage disposal, quality of roads, hygiene at wayside restaurants anddhabas and conditions of city roads were reported in the fourth quadrant of X-Y axis in all thefour destinations under study.
Similarly listing of the facilities reported as falling in the fourth quadrant of X-Y axis inthree, two and one destinations are shown.
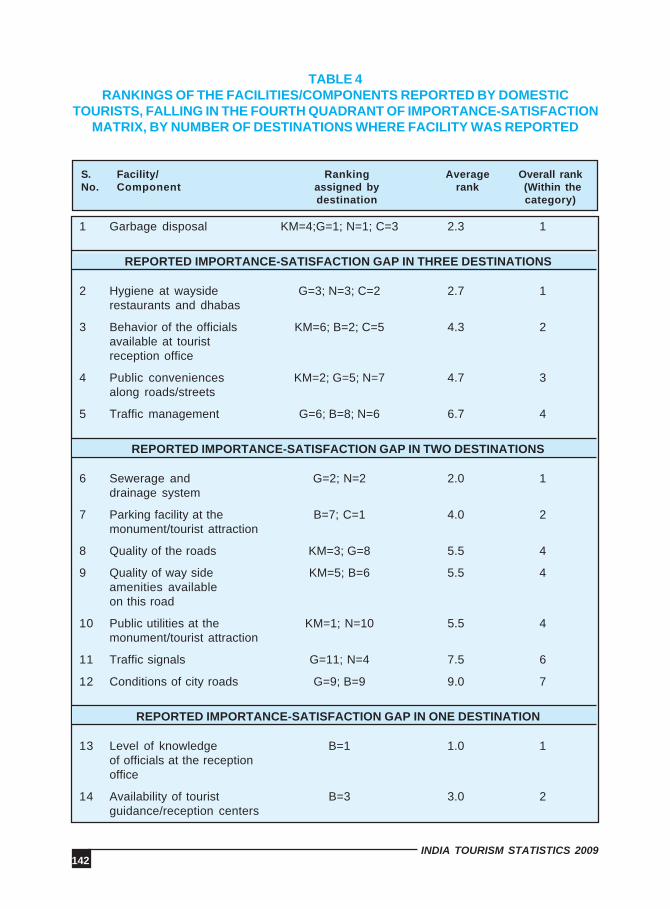
142INDIA TOURISM STATISTICS 2009
TABLE 4RANKINGS OF THE FACILITIES/COMPONENTS REPORTED BY DOMESTIC
TOURISTS, FALLING IN THE FOURTH QUADRANT OF IMPORTANCE-SATISFACTIONMATRIX, BY NUMBER OF DESTINATIONS WHERE FACILITY WAS REPORTED
S. Facility/ Ranking Average Overall rankNo. Component assigned by rank (Within the
destination category)
1 Garbage disposal KM=4;G=1; N=1; C=3 2.3 1
REPORTED IMPORTANCE-SATISFACTION GAP IN THREE DESTINATIONS
2 Hygiene at wayside G=3; N=3; C=2 2.7 1restaurants and dhabas
3 Behavior of the officials KM=6; B=2; C=5 4.3 2available at touristreception office
4 Public conveniences KM=2; G=5; N=7 4.7 3along roads/streets
5 Traffic management G=6; B=8; N=6 6.7 4
REPORTED IMPORTANCE-SATISFACTION GAP IN TWO DESTINATIONS
6 Sewerage and G=2; N=2 2.0 1drainage system
7 Parking facility at the B=7; C=1 4.0 2monument/tourist attraction
8 Quality of the roads KM=3; G=8 5.5 4
9 Quality of way side KM=5; B=6 5.5 4amenities availableon this road
10 Public utilities at the KM=1; N=10 5.5 4monument/tourist attraction
11 Traffic signals G=11; N=4 7.5 6
12 Conditions of city roads G=9; B=9 9.0 7
REPORTED IMPORTANCE-SATISFACTION GAP IN ONE DESTINATION
13 Level of knowledge B=1 1.0 1of officials at the receptionoffice
14 Availability of tourist B=3 3.0 2guidance/reception centers
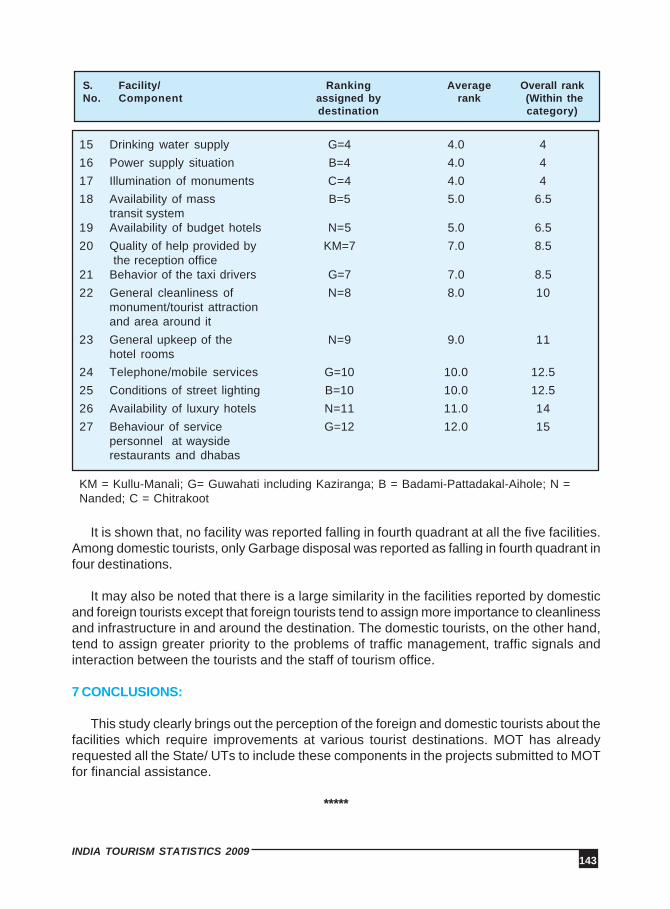
143INDIA TOURISM STATISTICS 2009
15 Drinking water supply G=4 4.0 416 Power supply situation B=4 4.0 417 Illumination of monuments C=4 4.0 418 Availability of mass B=5 5.0 6.5
transit system19 Availability of budget hotels N=5 5.0 6.520 Quality of help provided by KM=7 7.0 8.5
the reception office21 Behavior of the taxi drivers G=7 7.0 8.522 General cleanliness of N=8 8.0 10
monument/tourist attractionand area around it
23 General upkeep of the N=9 9.0 11hotel rooms
24 Telephone/mobile services G=10 10.0 12.525 Conditions of street lighting B=10 10.0 12.526 Availability of luxury hotels N=11 11.0 1427 Behaviour of service G=12 12.0 15
personnel at waysiderestaurants and dhabas
KM = Kullu-Manali; G= Guwahati including Kaziranga; B = Badami-Pattadakal-Aihole; N =Nanded; C = Chitrakoot
S. Facility/ Ranking Average Overall rankNo. Component assigned by rank (Within the
destination category)
It is shown that, no facility was reported falling in fourth quadrant at all the five facilities.Among domestic tourists, only Garbage disposal was reported as falling in fourth quadrant infour destinations.
It may also be noted that there is a large similarity in the facilities reported by domesticand foreign tourists except that foreign tourists tend to assign more importance to cleanlinessand infrastructure in and around the destination. The domestic tourists, on the other hand,tend to assign greater priority to the problems of traffic management, traffic signals andinteraction between the tourists and the staff of tourism office.
7 CONCLUSIONS:
This study clearly brings out the perception of the foreign and domestic tourists about thefacilities which require improvements at various tourist destinations. MOT has alreadyrequested all the State/ UTs to include these components in the projects submitted to MOTfor financial assistance.
*****
144INDIA TOURISM STATISTICS 2009
SUMMARY OF THE STUDY REPORT ON“PROBLEMS AND PROSPECTS OF ACCESSIBLE
TOURISM IN INDIA”
1 INTRODUCTION:
The volume of people with disabilities is growing fast due to an increase in the numberof acquired disabilities besides congenital conditions. In addition to disabled persons,consistent increase in life expectancy of the people also results in the formation of a largepool of old-age citizens, who also encounter access constraints of varying nature. Availablestudies suggest that disability poses serious challenges to the normal living of people inabsence of accessible environment. Thus, their options to enjoyment of equal rights interms of opportunities particularly employment, income and holidaying get reduced.
However, recent years have been witness to many proactive actions from variousagencies, both government and non-government, aimed at creating a better livingenvironment for persons with disabilities as a right and not charity. Some specific lawshave also been enacted to enable their empowerment as well as to mediate with the multi-faceted problems. There are an estimated 600 million persons living with disabilities in theworld today. If one includes the members of their families, there are approximately 2 billionpersons who are directly affected by disability, representing almost a third of the world’spopulation. Thus, persons with disabilities represent a significant overlooked developmentchallenge, and ensuring equality of rights and access for these persons will have anenormous impact on the social and economic situation in countries around the world.1
The United Nations World Tourism Organization (UNWTO) advanced a resolution in2005 supporting ‘accessible tourism for all’, which is recognized as a key reference documentfor guiding the development of the tourism sector along the path of greater accessibility2.Also of importance for equal access to tourism is the UNWTO’s Global Code of Ethics forTourism (1999), which sets a frame of reference for the responsible and sustainabledevelopment of tourism.
The premise of accessible tourism is that there exists a considerable section of thesociety who encounters varying degrees of access constraints, including to that of leisureand recreation opportunities. Those falling in its purview are tourists with disabilities andother reduced mobility groups. Facilitating the tourism needs of such people is essentiallymeant to designate accessible tourism and the very scope of it is inclusive in nature.Catering to the general and specific needs of tourists with reduced mobility groups offerseconomic opportunities of diverse nature, including in leisure and recreation. Indeed,facilitating the leisure and recreation needs of people with special needs is equally a legalrequirement.
2 SCOPE OF THE STUDY:
Travellers with special needs such as the reduced mobility segments along with theirrelatives and caregivers constitute a sizable chunk of the travel market. Facilitating their
145INDIA TOURISM STATISTICS 2009
travel and tourism requirements is not only a legal requirement but also a good businessopportunity. Development possibilities of accessible tourism has already gained dueattention with many country-governments and international agencies such as UNWTO,UNESCAP, the European Union etc. taking pro-active approach to create a access-friendly environment for leisure and recreation needs of this segment. At the same time,it has also been acknowledged that the existing environment is not conducive enough torealise the vast potential that this segment offers.
Impediments in properly tapping the potential of this visitor segment are many. Themajor ones are lack of understanding about the market segment, viz. size, socio-economicand travel-related attributes and; the factors constraining their participation in tourism andtravel activities. Indeed, these are more evident in the developing countries including India.
Keeping this in perspective, Ministry of Tourism has commissioned a study to IITTMGwalior on “Problems and Prospects of Accessible Tourism in India: This study wasconducted to examine some key attributes and dimensions of the travellers with reducedmobility. Those include travel behaviour, purchasing power and major factors constrainingthem to be equal partners in tourism and travel activities in the Indian context. Anexploratory framework was considered appropriate for this study since the understandingof these travel segments in India is scant.
3 SAMPLE SIZE, COVERAGE OF STUDY:
Six attractions, essentially historico-cultural in nature, were selected for this study.The selection was based on the parameters such as popularity, number of tourists visiting,vastness of the monuments, geographical coverage of the site, and topography (i.e.altitude from the ground-level). The locations finalised for the study are Taj Mahal (Agra),Amber Fort (Jaipur), Qutab Minar , (Delhi), Sun Temple (Konark), Mamallapuram (T.N)and Old Goa churches.
A total of 1205 tourists with reduced mobility were surveyed as part of the study. Tofinalise the sample size at each location, quantum of visits in a year at each one and theproportion of foreign and domestic tourists were considered.
4 IMPORTANT FINDINGS :
4.1 Profile of Tourists with Reduced Mobility in India
(i) Attributes of tourists with reduced mobility like age, sex, literacy level, maritalstatus are found to be more or less similar to general tourists in India.However, over three-fourth of respondents were unmarried.
(ii) In terms of education, a healthy trend is that a good number of them arewell educated and possess graduation degree or above. Proportion of illiteratetourists is very small. This can, to certain extent, be attributed to selectionprocess of respondents, in which, those who could understand properly thecontents of the questionnaire and answering those accordingly were onlyconsidered for detailed interview.
146INDIA TOURISM STATISTICS 2009
(iii) Better education attainment being demonstrated by respondents wasreflected in their employment status as well with 60% of them stating to bein some form of jobs. Private sector emerges to be largest employer followedby public sector. Understandably, as many as one-third of domesticrespondents are engaged in some form of self-employment activities. Again,among those employed respondents of domestic origin, nearly 33% areworking at officer/executive levels, whereas, corresponding proportion amongforeign tourists works out to nearly 50%. It further shows the proportion ofsupport staff is more in the sample of domestic tourists.
(iv) Better employment profile is perhaps the reason for better income levels toemerge in this study. For instance, over 34% of households earn more thanRs 40000/- per month and 22% earn in the range of Rs 20001-Rs 40000/-.On the other, almost half of the foreign respondents’ household earnings ina month are more than one lakh rupees.
4.2 Travel Planning and Related Attributes: For domestic tourists; friends andrelatives, people already visited the places and internet are major informationsources. Whereas, for foreign tourists, internet is the major source for all maintourism products; whereas, tourism departments, guide books and relativesand friends also play relatively important roles.
4.3 Mode of booking: The family members or friends and caregivers/attendantsare the major source among domestic tourists. For foreign tourists, travel agentsemerge as the major source, followed by family members or friends andcaregivers.
4.4 Funding Sources: Source of funding for a large number are usually self/ownfunds. Also, family members and relatives provide funds for travel purposesfor good number of respondents, understandably, the students and fullydependant ones. These two sources together constitute nearly 90% of therespondents, meaning that other funding sources may not have been availableor not sought by them.
4.5 Purpose of travel: Purpose of travel is predominantly leisure for both visitorsegments. But, for domestic tourists, religion/ pilgrimage is another notablepurpose. The social reasons, education and training and ‘providing holidayopportunity to the family members’ are worth taking cognizance of.
4.6 Travel arrangement: Both domestic and foreign visitor choose to travel withsome form of package travel arrangement. A comparison of travel arrangementsusually made by them as against the one chose for the present trip reinforcesthis trend. As one would have expected, independent travellers are less inproportion and that is common to both visitor groups.
4.7 Destinations covered and frequency of tour: Appreciably a good number of
147INDIA TOURISM STATISTICS 2009
tourists covered more than one destination as part of current itinerary. Singledestination tourists are found to be around one-third of the sample. As regardsto frequency of tour, they travel comparatively less frequently, especially thedomestic tourists with nearly three-fourth of them reported to have taken onlyone trip prior to the current one.
4.8 Duration of Stay: Average duration of domestic and foreign tourists is 6.75days and 9.54 days respectively. About 46% of domestic tourists fall in 4-7days category and another 24% in 8-14 days duration. Corresponding figuresfor duration of stay of foreign tourists are 39% and 56%.
4.9 Group size and composition: People with reduced mobility usually travel ingroups. The size is normally 3-6 persons. Persons accompanying them duringthis trip were mainly family members, followed by friends and this pattern issome what common for both visitor segments. Similarly, proportion of touristswith disabilities accompanied by caregivers/ attendants during travel was foundaround 11% among foreigners but that appears insignificant among domestictravellers.
4.10 Use of Assistance: As against the reasons for not carrying an attendant/caregiver, nearly half of both the visitor groups were of the opinion that theydid not need one. At the same time, nearly 11% cite the reason of self-empowerment followed by a strong desire to feel freedom.
About three-fourth of the tourists carry some form of mobility equipments, ofwhich, walking stick is more common (around 37%) and then the personal careequipments. A very small share of tourists was found to be wheelchair userswhich are indicative of inaccessibility of the built environment and the facilitiesprovided therein.
4.11 Means of Transport: Means used by the respondents for inter and intra-destination travels throw some interesting patterns. For transportation betweendestinations, foreigners mostly used road (62%) followed by air (34%). Similarly,higher numbers of domestic travellers resort to the roads (70%) followed byrail transport (22%).
Among those who used the roads to travel between destinations, tourist coachesare more common. The proportion of such foreign tourists is as high as 72%,followed by rented vehicles. While a similar pattern follows for domestic touriststoo, respective proportions are found to be comparatively less.
4.12 Expenditure pattern: Results are suggestive of the per trip expenditure oftourists with reduced mobility following the pattern usually observed amonggeneral tourists. Besides, those required the support of mobility enablers,particularly caregiver/attendant usually have to commit substantial quantumof additional amounts to meet such expenses.
148INDIA TOURISM STATISTICS 2009
5 MAJOR PROBLEMS AT DIFFERENT FACETS OF TRAVEL PROCESS:
This was indeed a major focus area of this study because the issues and problems oftourists with reduced mobility during different facets of travel are varied and some ofthose have enough potential to adversely influence the travel decisions and behaviour.Conclusions derived are given below:
5.1 Problems at booking stage: Major problems identified are poor understandingof their specific problems/ requirements among the booking staff and prevalenceof their inhospitable attitude. Other issues are distance of booking centers andto a large extend their inaccessibility. This pattern is common to both visitorsegments.
5.2 Problems during travel phase: In general, intra-destination travel is mostdifficult part, followed by lack of proper information and inadequate signages atmajor points of reference. There are other noticeable constraints as well suchas non-availability of personal aids/ equipments at the stations and in the vehicles,locating affordable and accessible accommodation and lack of knowledge aboutspecific problems of tourists with reduced mobility amongst ground staff. Thispattern is almost similar to both domestic and foreign visitor segments.
5.3 The problems at Places of stay: Problems they encountered at places ofstay are many and indeed more critical. However, there exists a noticeabledifferences in the manner in which the domestic and foreign tourists view thoseproblems. Major ones reported among domestic tourists are lack of necessaryfacilities in the rooms meant for tourists with reduced mobility, lack ofunderstanding about their special needs among staff and inappropriate locationof rooms meant for tourists with reduced mobility. Other issues of importanceinclude comparatively higher room rates of adaptable rooms and absence oflifts.
As regards to foreign tourists, those in the order of importance are lack ofnecessary facilities in the rooms meant for tourists with reduced mobility,inappropriate location of rooms meant for them, inaccessible lobby and absenceof lifts. Non-availability of personal aids/equipments and comparatively higher-prices of adaptable rooms meant for them also call for qualified actions.
5.4 At tourist attractions/ places visited: Specific problems in this facet of travelare again varied. Relative importance of those across visitor segments alsodemonstrates a clear variation in their relative importance. For instance, majorproblems faced by domestic segments are either non-availability of toilets meantfor people with reduced mobility or unhygienic condition of the available ones.Others equally worth citing are absence of public utilities such as telephone,toilet, water tap and the like at convenient places; not availability of ramps ingeneral and/ or those not found at all required points at attractions where theyare present; improper levels of alternate ramps and insufficiently laid pathways.In fact, most of these problems are found to be quite significant as beingdemonstrated in respective indices.
Major issues bothering the foreign tourist segments at attractions are non-

149INDIA TOURISM STATISTICS 2009
availability of ramps in general or level differences of alternate ramps; non-availability of toilets meant for persons with reduced mobility, unhygienic conditionof available ones; lack of access stairs/lifts; inconvenient reach points atattractions and the slippery or coarse tracks. As in the case of domestic segment,these constraints are found to be equally prohibitive in nature.
6 PROSPECTS OF ACCESSIBLE TOURISM IN INDIA:
Development prospect of these visitor segments has been assessed on the basisof the visitor profiles, major problems during different facets of travel and probing of themajor factors that might influence the travel plans of tourists with reduced mobility.Conclusions derived are:
6.1 Domestic tourists with reduced mobility: The critical set of factors to influencetheir travel decisions is economic in nature, viz. reasonably priced tourismproducts and better income opportunities. Besides these, trained staff and theirfriendly treatment of tourists with reduced mobility, providing safety supportsystems, change in attitude of the public towards disabled tourists and informationabout availability of aids/ equipments at attractions would also play varying butimportant roles.
6.2 Foreign tourists with reduced mobility: Factors in the order of importance areprovision of safety support systems, proper information about availability of aids/equipments, reasonably priced-tourism products and availability of accessiblevehicle at destinations.
7 RECOMMENDATIONS:
In consideration of major findings emerged from the study, a set of specific actionpoints are recommended. These are meant not only to address some of the criticalbarriers of this potential visitor segment but also to exploit the business opportunitiesthat emanates for providing specific leisure and recreation products and services themutual benefits.
7.1. Sensitisation of service providers:
(i) Specific programmes to adequately train the employees, especially frontlinestaff should be launched. Focus of such exercise should be to sensitisethem on unique problems of tourists with reduced mobility and to createproper understanding the segments’ development potential.
(ii) For proper awareness creation and sensitisation of the general public abouttravel-related problems these tourists, target-specific measures can bedevised. Besides main public places and utilities, radio, TV and leadingnewspapers can also be used, especially on occasions like Disability Day,Children’s Day, Parents’ Day etc.
(iii) Tourism, travel and hospitality management institutions in India may beadvised to incorporate accessible tourism and disability awareness modulesin their curriculum for both teaching and training purposes. Further, in thoseinstitutions where some orientations have already been provided, elaborate
150INDIA TOURISM STATISTICS 2009
coverage of critical aspects related to management of these tourists shouldbe incorporated.
(iv) Lower to middle-level front-line officials of Central and States TourismDepartments including those posted in tourist offices abroad and usually inregular contact with the tourists may be given accessibility-specific training.
7.2 Provision of Information:
(i) Many government agencies and some non-governmental organisations havealready begun disseminating information on accessible tourism products,mobility enhancement and site appreciation devices. But, that needs to bestrengthened and widespread because it is not only legally binding but alsomakes good economics.
(ii) To make the web space access-friendly, steps for providing informationthrough WAI (web access initiatives) features in line with World Wide WebConsortium (W3C) and as provided by Govt. of India may be encouraged.
(iii) Information on accessible tourism destinations and products in India maybe collected and published in English as well as major Indian languages forwider dissemination.
(iv) Universal Signage on accessibility may be prepared at least in English,Hindi and the local language of the attraction site and installed at majorpoints in the sites and intersections. Depending on foreign tourist-profile atmajor attractions, additional foreign languages can also be considered.
(v) The landmark attractions in the country should have readable formats forvisually-challenged persons.
(vi) All travel and tourism organisations should be advised to document theFact-sheets on access enabling facilities in their premises and publicisethem.
(vii) Tourism communication strategy should be such that accessible tourisminformation would be integral to all campaigns.
7.3 Product Development:
(i) Access Audit of major tourist attractions, transport stations, accommodationunits etc. may be encouraged in collaboration with state governments, NGOsetc.
(ii) Having provisions of accessible vehicles at larger attraction sites may beconsidered. Further, necessary arrangements for providing mobilityequipments, public comforts, utilities etc. at tourist destinations may bemade.
(iii) Potential entrepreneurs may be identified and encouraged for operatingaccess-friendly taxies and tourist coaches.
(iv) Airlines should be advised to replace the step-ladders with slanting ladders(aerobridge) or Forklift Platforms (Eg. Qantas Airways, Australia) for easycarriage of wheel-chairs.
151INDIA TOURISM STATISTICS 2009
(v) Accessibility at the railway stations may be improved by providing accessto major facilities like platforms, facilities like toilets, drinking water,cafeterias and other public places. Specifically, platforms at major stationscan be connected through lifts wherever possible.
7.4 Promotion of Accessible Tourism:
(i) Those tourist destinations/ attractions where certain accessible facilitiesalready exist may be identified and promoted first. In addition to furtherstrengthening accessible facilities in there, some appealing destinationsmay also be identified for accessible development and promotion. Whiledoing so, ‘prime attractions destinations’ can be identified in each region fordevelopment and promotion as ‘model accessible tourism destinations’.
(ii) The country may consider a specific accessible tourism campaign namely“Inclusive India” or “Incredible India: Accessible India”.
(iii) Domain expertise (viz. subject, language etc.) and contact details ofAccessible Tourist Guides and suitable publicised.
(iv) Provision of access-enabling facilities and infrastructure may be mademandatory for all central financial assistance (CFA)-funded schemes of theUnion Ministry of Tourism.
1 United Nation Convention on the Rights of Persons with Disabilities (2007)2 UNWTO Resolution, 2005 on Accessible Tourism for All
***
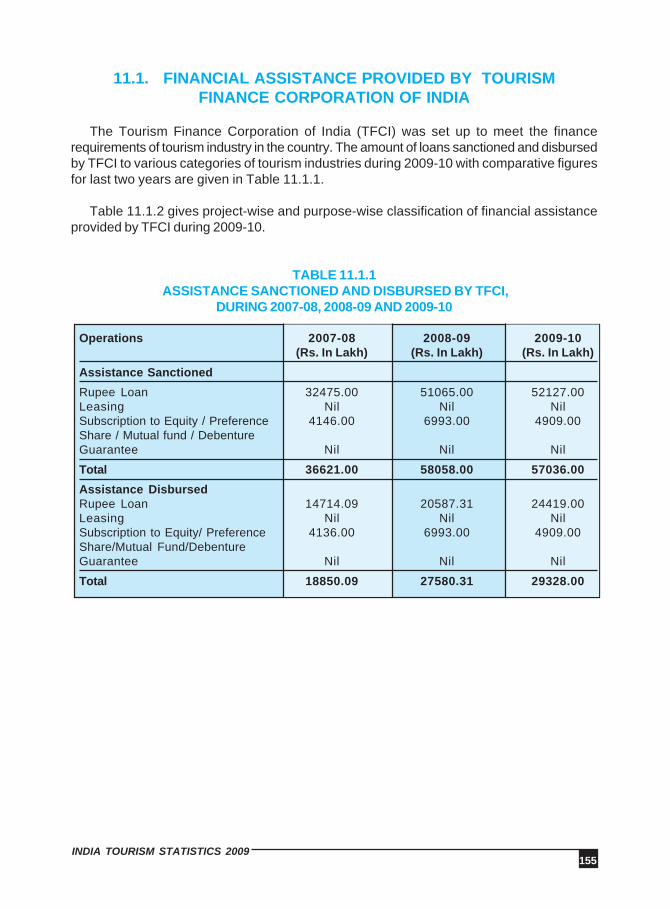
155INDIA TOURISM STATISTICS 2009
11.1. FINANCIAL ASSISTANCE PROVIDED BY TOURISMFINANCE CORPORATION OF INDIA
The Tourism Finance Corporation of India (TFCI) was set up to meet the financerequirements of tourism industry in the country. The amount of loans sanctioned and disbursedby TFCI to various categories of tourism industries during 2009-10 with comparative figuresfor last two years are given in Table 11.1.1.
Table 11.1.2 gives project-wise and purpose-wise classification of financial assistanceprovided by TFCI during 2009-10.
TABLE 11.1.1 ASSISTANCE SANCTIONED AND DISBURSED BY TFCI,
DURING 2007-08, 2008-09 AND 2009-10
Operations 2007-08 2008-09 2009-10(Rs. In Lakh) (Rs. In Lakh) (Rs. In Lakh)
Assistance Sanctioned
Rupee Loan 32475.00 51065.00 52127.00Leasing Nil Nil NilSubscription to Equity / Preference 4146.00 6993.00 4909.00Share / Mutual fund / DebentureGuarantee Nil Nil Nil
Total 36621.00 58058.00 57036.00
Assistance DisbursedRupee Loan 14714.09 20587.31 24419.00Leasing Nil Nil NilSubscription to Equity/ Preference 4136.00 6993.00 4909.00Share/Mutual Fund/DebentureGuarantee Nil Nil Nil
Total 18850.09 27580.31 29328.00
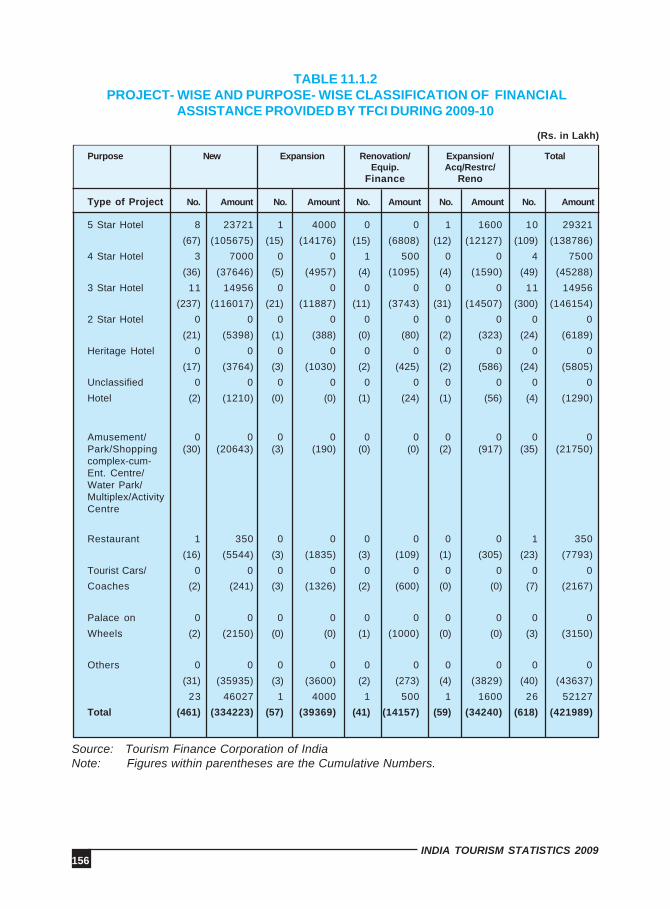
156INDIA TOURISM STATISTICS 2009
TABLE 11.1.2 PROJECT- WISE AND PURPOSE- WISE CLASSIFICATION OF FINANCIAL
ASSISTANCE PROVIDED BY TFCI DURING 2009-10
(Rs. in Lakh)
Purpose New Expansion Renovation/ Expansion/ TotalEquip. Acq/Restrc/
Finance Reno
Type of Project No. Amount No. Amount No. Amount No. Amount No. Amount
5 Star Hotel 8 23721 1 4000 0 0 1 1600 10 29321
(67) (105675) (15) (14176) (15) (6808) (12) (12127) (109) (138786)
4 Star Hotel 3 7000 0 0 1 500 0 0 4 7500
(36) (37646) (5) (4957) (4) (1095) (4) (1590) (49) (45288)
3 Star Hotel 11 14956 0 0 0 0 0 0 11 14956
(237) (116017) (21) (11887) (11) (3743) (31) (14507) (300) (146154)
2 Star Hotel 0 0 0 0 0 0 0 0 0 0
(21) (5398) (1) (388) (0) (80) (2) (323) (24) (6189)
Heritage Hotel 0 0 0 0 0 0 0 0 0 0
(17) (3764) (3) (1030) (2) (425) (2) (586) (24) (5805)
Unclassified 0 0 0 0 0 0 0 0 0 0
Hotel (2) (1210) (0) (0) (1) (24) (1) (56) (4) (1290)
Amusement/ 0 0 0 0 0 0 0 0 0 0Park/Shopping (30) (20643) (3) (190) (0) (0) (2) (917) (35) (21750)complex-cum-Ent. Centre/Water Park/Multiplex/ActivityCentre
Restaurant 1 350 0 0 0 0 0 0 1 350
(16) (5544) (3) (1835) (3) (109) (1) (305) (23) (7793)
Tourist Cars/ 0 0 0 0 0 0 0 0 0 0
Coaches (2) (241) (3) (1326) (2) (600) (0) (0) (7) (2167)
Palace on 0 0 0 0 0 0 0 0 0 0
Wheels (2) (2150) (0) (0) (1) (1000) (0) (0) (3) (3150)
Others 0 0 0 0 0 0 0 0 0 0
(31) (35935) (3) (3600) (2) (273) (4) (3829) (40) (43637)
23 46027 1 4000 1 500 1 1600 26 52127
Total (461) (334223) (57) (39369) (41) (14157) (59) (34240) (618) (421989)
Source: Tourism Finance Corporation of IndiaNote: Figures within parentheses are the Cumulative Numbers.
159INDIA TOURISM STATISTICS 2009
APPENDIX-I
GUIDELINES FOR PROJECT APPROVAL ANDCLASSIFICATION OF TIME SHARE RESORTS
Hotels and other supplementary accommodation are an integral part of a tourist’s visit to aplace and the services offered by them can make or mar a visit completely. Vacation ownershippopularly known as Time Share is one of the fastest growing component of tourism. TimeShare Resorts (TSR) are increasingly becoming popular for the leisure holidays and familyholidays, etc. With the aim of providing standardized world class services to the tourists,the Government of India, Department of Tourism has a voluntary scheme for classificationof fully operational Time Share Resorts in the following categories:-
5 STAR, 4 STAR AND 3 STAR CATEGORIES
The Hotel & Restaurant Approval & Classification Committee (HRACC) inspects andassesses the TSR based on facilities and services offered.
Project approvals are also given in all the above-mentioned categories at the projectimplementation stage.
Classified Time Share Resorts approved/approved projects are eligible for various concessionsand facilities that are announced by the Government from time to time besides, gettingworldwide publicity through the Indiatourism Offices located in India and abroad.
TSRs and Hotels are permitted for mixed use. However, if the TSR intends to use as hotelalso i.e. mixed purpose, it must provide all facilities and amenities as required or the specifiedstar category of hotel in accordance with the Guidelines.
TSRs will be used as vacation ownership. In no circumstances apartments in TSR will besold individually for residential or any other purpose.
TSRs including heritage and resorts which are the members of All India Resort DevelopmentAssociation (AIRDA) will be considered for classification/project approval.
Details of the criteria set and the documents required are given in this document.
For classification and project approvals in the 5 Star, 4 Star and 3 Star, the applicationsalong with the requisite fees may be sent to:-
Hotels and Restaurants DivisionMinistry of Tourism, Government of India
C-I Hutments, Dalhousie Road, New Delhi-110011.

160INDIA TOURISM STATISTICS 2009
FORMAT FOR UNDERTAKING
To,The Secretary(T)Govt. of IndiaMinistry of TourismNew Delhi.
UNDERTAKING
I have read and understood all the terms and conditions mentioned above with respect toproject approval/classification in 1*/2*/3*/4*/5*/5*-D/ Heritage category and hereby agree toabide them. The information and documents provided are correct and authentic to the bestof my knowledge.
Place: Signature and name in block letters
Date: Seal of applicant
161INDIA TOURISM STATISTICS 2009
GENERAL TERMS, CONDITIONS & APPLICATION FORMAT FOR PROJECTAPPROVAL AT PROJECT LEVEL & CLASSIFICATION OF TIME SHARE RESORTS
1) The Ministry of Tourism approves TSR at project stage based on documentation, whichenables the TSR to get certain benefits from the Govt. as may be announced from timeto time. The documents required for project approvals are listed below.
2) Project approvals are valid for 5 years. Project approvals of the Govt. of India, Ministryof Tourism cease 3 months from the date that the TSR becomes operational even if allits rooms are not ready. The TSR must apply for classification within these 3 months.
3) The Ministry of Tourism, Govt. of India reserves the right to modify the guidelines/termsand conditions from time to time.
4) Application form. This covers
i) Proposed name of the TSR
ii) Name of the promoters with a note on their business antecedents
iii) Complete postal address of the promoters/tel./fax/email
iv) Status of the owners/ promoters
(1) If Public/ private limited company with copies of Memorandum and Articles of Association
(2) If Partnership, a copy of partnership deed and certificate of registration
(3) If proprietary concern, name and address of proprietor/certificate of registration
v) Location of TSR site with postal address
vi) Details of the site
(1) Area (in sq. meters)(2) Title – owned/ leased with copies of sale/ lease deed(3) Copy of Land Use Permit from local authorities(4) Distances from Railway station, airport, main shopping centers (in Kms)
vii) Details of the project
(1) Copy of feasibility report.(2) Star category planned.(3) Number of apartments and area for each type of room (in sq.ft.)(4) Number of attached baths and areas (in sq.ft.)(5) Details of public areas – Lobby/lounge, restaurants, bars, shopping, banquet/ conference halls, health club, swimming pool, parking facilities.
162INDIA TOURISM STATISTICS 2009
(6) Facilities for the physically challenged persons.
(7) Eco-friendly practices and any other additional facilities (please indicate area in sq.ft for each facility mentioned above at 5,6 &7)
(8) Date by which project is expected to be completed and operational.
viii) Blue prints/ sketch plans signed by owners and architect showing.
(1) Site plan
(2) Front and side elevations.
(3) Floor plans for all floors.
(4) Detail of guest room and bath room with dimensions in sq.ft.
(5) Details of Fire Fighting Measures/ Hydrants etc.
(6) Details of measures for energy conservation and water harvesting.
ix) Air-conditioning details for guest rooms, public areas.
x) Local approvals by
(1) Municipal authorities.
(2) Concerned Police Authorities.
(3) Any other local authority as may be required.
(4) Approval/NOC from Airport Authority of India for projects located near Airports.
The above mentioned approvals/NOCs are the responsibility of the promoters/concernedcompany as the case may be. The Department’s approval is no substitute for any statutoryapproval and the approval given is liable to be withdrawn in case of any violations withoutnotice.
xi) Proposed capital structure
(1) Total project cost.(2) Equity component with details of paid up capital(3) Debt – with current and proposed sources of funding
xii) Letter of acceptance of regulatory conditions.
xiii) Please indicate whether the promoter intends to give a few rooms or all rooms on a time- share basis.
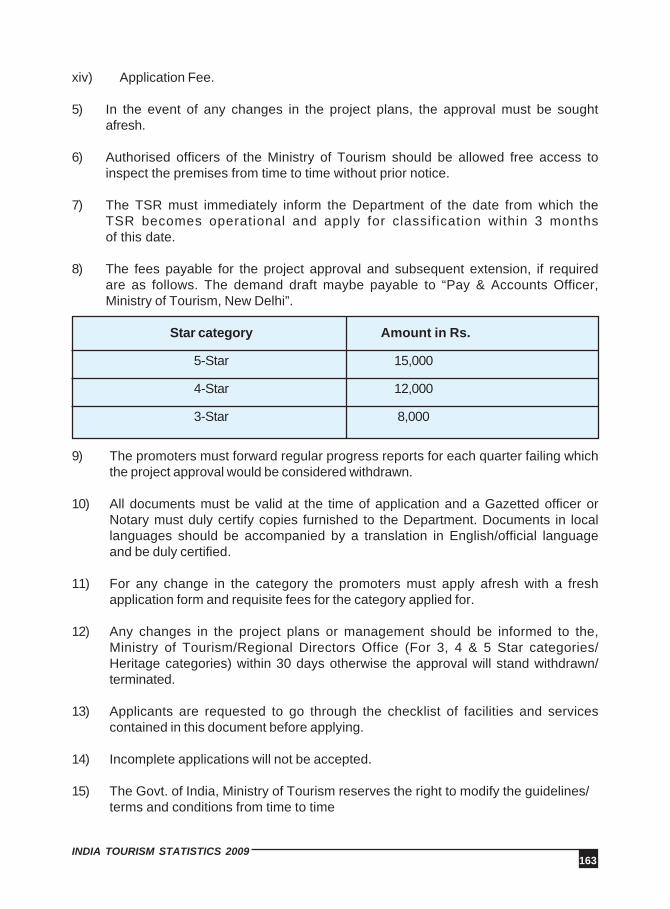
163INDIA TOURISM STATISTICS 2009
xiv) Application Fee.
5) In the event of any changes in the project plans, the approval must be soughtafresh.
6) Authorised officers of the Ministry of Tourism should be allowed free access toinspect the premises from time to time without prior notice.
7) The TSR must immediately inform the Department of the date from which theTSR becomes operational and apply for classification within 3 monthsof this date.
8) The fees payable for the project approval and subsequent extension, if requiredare as follows. The demand draft maybe payable to “Pay & Accounts Officer,Ministry of Tourism, New Delhi”.
Star category Amount in Rs.
5-Star 15,000
4-Star 12,000
3-Star 8,000
9) The promoters must forward regular progress reports for each quarter failing whichthe project approval would be considered withdrawn.
10) All documents must be valid at the time of application and a Gazetted officer orNotary must duly certify copies furnished to the Department. Documents in locallanguages should be accompanied by a translation in English/official languageand be duly certified.
11) For any change in the category the promoters must apply afresh with a freshapplication form and requisite fees for the category applied for.
12) Any changes in the project plans or management should be informed to the,Ministry of Tourism/Regional Directors Office (For 3, 4 & 5 Star categories/Heritage categories) within 30 days otherwise the approval will stand withdrawn/terminated.
13) Applicants are requested to go through the checklist of facilities and servicescontained in this document before applying.
14) Incomplete applications will not be accepted.
15) The Govt. of India, Ministry of Tourism reserves the right to modify the guidelines/terms and conditions from time to time
164INDIA TOURISM STATISTICS 2009
TSR CLASSIFICATION/RECLASSIFICATION
1. Classification for newly operational TSR must be sought within 3 months of completionof approved TSR projects. Operating TSR’s may opt for classification at any stage.However, TSRs seeking re-classification should apply for reclassification one year priorto the expiry of the current period of classification.
2. If the TSR fails to reapply three months before the expiry of the classification order, theapplication will be treated as a fresh classification case.
3. Once a TSR applies for classification/ re-classification, it should be ready at all timesfor inspection by the HRACC. No requests for deferment of inspection will be entertained.
4. Classification will be valid for 5 (Five) years from the date of issue of orders or in caseof reclassification from the date of expiry of the last classification provided that theapplication has been received within the stipulated time mentioned above, along with allvalid documents. Incomplete applications will not be accepted.
5. TSRs applying for classification must provide the following documentation.
a) Application Form detailing
i) Name of the TSR.ii) Name and address of the promoters/owners with a note on their business antecedents.iii) Complete postal address of the hotel with tel. no/fax/email.iv) Status of the owners/ promoters
(1) If Public/ private limited company with copies of Memorandum and Articles ofAssociation.
(2) If Partnership, a copy of partnership deed and certificate of registration.(3) If proprietary concern, name and address of proprietor/certificate of registration.
v) Date on which the hotel became operational.vi) Details of hotel site with postal address and distance from Airport/Railway Station/
City Centre/Downtown shopping area (in kms).vii) Details of the hotel.
(1) Area (in sq. metres) with title – owned/ leased with copies of sale/ lease deed(2) Copy of Land Use Permit from local authorities(3) Star category being applied for.(4) Number of rooms and area for each type of room in sq.ft. (single/double/suites).(5) Number of attached baths.
(6.) Details of public areas – Lobby/lounge, restaurants, bars, shopping area, banquet/conference halls, health club, swimming pool, parking facilities, facilities for the physicallychallenged persons, Eco-friendly practices and any other additional facilities. The areafor each facility should be indicated in sq.ft.
165INDIA TOURISM STATISTICS 2009
(7) Detail of guestroom and bathroom with dimensions in sq.ft.
(8) Details of Fire Fighting Measures/ Hydrants etc.
(9) Details of measures for energy conservation and water harvesting and other Eco-friendly measures and initiatives.
(10) Air-conditioning details for guest rooms, public areas Certificates/No ObjectionCertificates (attested copies).
a) Certificate/ licence from Municipality/ Corporation to show that your establishmentis registered as a hotel.
b) Certificate/ licence from concerned Police Department authorizing the runningof a hotel
c) Clearance Certificate from Municipal Health Officer/ Sanitary Inspector givingclearance to your establishment from sanitary/hygienic point of view.
d) No Objection Certificate with respect to fire fighting arrangements from the FireService Department (Local Fire Brigade Authorities).
e) Public liability insurance.
f) Bar Licence (necessary for 4*, 5* & 5*-D only).
g) Money Changers Licence (necessary for 4*,5*& 5*-D only).
h) Sanctioned building plans/occupancy certificate
i) If classified earlier, a copy of the earlier “Certificate of Classification issued byMinistry of Tourism.
j) For Heritage property, certificate from the local authority stating age of theproperty and showing new and old built up areas separately.
k) Any other local authority as may be required.
l) Approval /NOC from AAI for projects located near Airports
m) Please indicate whether a few rooms or all rooms are to be let out on a time-share basis.
n) Application fees.

166INDIA TOURISM STATISTICS 2009
The above-mentioned approvals/No Objection Certificates are the responsibility of the Owners/promoters/concerned Company as the case may be. The Department’s approval is nosubstitute for any statutory approval and the approval given is liable to be withdrawn withoutnotice in case of any violations or misrepresentation of facts.
6. All applications for classification or re-classification must be complete in all respects –application form, application fee, prescribed clearances, NOCs, certificates etc. -incomplete application is liable to be rejected.
7. TSRs will qualify for classification as Heritage hotels provided a minimum 50% of thefloor area was built before 1935 and no substantial change has been made in the facade.Hotels, which have been classified/re-classified under Heritage categories prior to issueof these Guidelines will continue under Heritage categories even if they were built between1935-1950.
8. The application fees payable for classification/reclassification are as follows. The demanddraft maybe payable to “Pay & Accounts Officer, Ministry of Tourism, New Delhi”.
Star Category Classification/Reclassification fees in Rs.
3-Star 10,000
4-Star 15,000
5-Star 20,000
9. The classification committee will consist as follows
(a) Chaired by Chairman (HRACC) or his representative. Representatives fromAIRDA/FHRAI/HAI/IATO/TAAI/IHM/RD/local Indiatourism office /MemberSecretary will constitute the other members of the Committee.
(b) The Chairman and any 3 members will constitute a quorum.
(c) The minutes will be approved by the Chairman (HRACC).
(d) In case of any dissatisfaction with the decision of HRACC the hotel mayappeal to Secretary (T), Government of India for review and reconsiderationwithin 30 days of receiving the communication regarding classification/reclassification. No requests will be entertained beyond this period.
167INDIA TOURISM STATISTICS 2009
10. TSR will be classified following two stage procedure.
The presence of facilities and services will be evaluated against the enclosed checklist.
(a) TSRs will be required to adopt environment friendly practices and facilities forphysically challenged persons.
(b) The quality of facilities and services will be evaluated against the mark sheet.
11. The TSR is expected to maintain required standards at all times. The ClassificationCommittee may inspect a hotel at any time without previous notice. The Committeemay request that its members be recommended overnight to inspect the level of services.
12. Any deficiencies/rectification pointed out by the HRACC must be complied with withinthe stipulated time, which has been allotted in consultation with the hotel representativesduring inspection. Failure to do so will result in rejection of the application.
13. The Committee may assign a star category lower but not higher than that applied for.
14. The TSR must be able to convince the Committee that they are looking sufficient stepsto conserve energy and harvest water, garbage segregation, and disposal/recycling asper Pollution Control Board (PCB)norms and following other Eco-friendly measures.
15. For any change in the star category the promoters must apply afresh with a freshapplication form and requisite fees for the category applied for.
16. Any changes in the plans or management of the hotel should be informed to the HRACC,Govt. of India, Department of Tourism within 30 days otherwise the classification willstand withdrawn/terminated.
17. Applicants are requested to go through the checklist of facilities and services containedin this document before applying,
18. Incomplete applications will not be considered. All cases of classification would befinalised within three months of the application being made.
19. The Govt. of India, Ministry of Tourism reserves the right to modify the guidelines/termsand conditions from time to time.
***
169INDIA TOURISM STATISTICS 2009
APPENDIX-II
GUIDELINES FOR CLASSIFICATION OFHERITAGE HOTELS
DEFINITION : “Heritage Hotels” cover running hotels in palaces / castles/forts/havelies/hunting lodges/residences of any size built prior to 1950. The facade, architectural features and generalconstruction should nave the distinctive qualities and ambience in keeping with the traditionalway of life of the area. The architecture of the property to be considered for this categoryshould not normally be interfered with Any extension, improvement, renovation, change inthe exisiting structures should be in keeping with the traditional architectural styles andconstructional technique harmonizing the new with the old. After expansion /renovation thenewly built up area added should not exceed 50% of the total built up (plinth)area in includingthe old and new structures. For this purpose, facilities such as swimming pools, lawns etc.will be excluded. Heritage hotels will be sub-classified in the following categories:
HERITAGE :This category will cover hotels in Residences/Havelies/Hunting Lodges/Castles/Forts/ Palacesbuilt prior to 1950. The hotel should have a minimum of 5 rooms (10 Beds)
HERITAGE CLASSIC :This category will cover hotels in Residences/Havelies/Hunting Lodges/Castles/Forts/ Palacesbuilt prior to 1935. The hotel should have a minimum of 15 rooms (30 beds).
HERITAGE GRAND :This category will cover hotels in Residences/Havelies/Hunting Lodges/Castles/Forts/Palaces built prior to 1935. The hotel should have a minimum of 15 rooms (30 beds).
ROOM & BATH SIZE : No room or bathroom size is prescibes for any of the categories. However, general ambience,comfort and imaginative readaptation would be considered while awarding sub-classificationclassic or ‘grand’
SPECIAL FEATURES :
HERITAGE:General features and ambience should conform to the overall concept of heritage andarchitectural distinctiveness.
HERITAGE CLASSIC :General features and ambience should conform to the overall concept of heritage andarchitectural distinctiveness.The hotel should provode at least one of the under mentionedsporting facilities.
170INDIA TOURISM STATISTICS 2009
HERITAGE GRAND :General features and ambience should conform to the overall concept of heritage andarchitectural distinctiveness. However all public and private areas including rooms shouldhave superior appearance and décor. At least 50% of the rooms should be airconditioned(except in hill stations where there should be heating arrangements). The hotel should alsoprovide at least two of the under mentioned sporting facilities.
SPORTING FACILITIES :Swimming pool, Health Club, Lawn Tenis, squash, Riding, Golf course provided the ownershipvests with the concerned hotel. Apart from these facilities, credit would also be given forsupplementary sporting facilities such as Golf, Boating , Sailing, Fishing or other adventuresports such as Ballooning, Parasailing, Wind-surfing, Safari excursions, Trekking etc. andindoor games.
CUISINE :
HERITAGE :The hotels should offer traditional cuisine of the area.
HERITAGE CLASSIC :The hotel should offer traditional cuisine but should have 4 to 5 items which have closeapproximation to continental cuisine.
HERITAGE GRAND :The hotel should offer traditional and continental cuisine.
MANAGEMENT :The hotel may be managed and by the owning family and / or professionals.
Note:- Classification in any of the above categories will be given keeping in view the overallstandard of the property. The hotel could be judged by the quality of service and the years ofexperience that the owner/ staff have had in the business.
GENRAL FEATURES :There should be adequate parking space for cars. All public rooms and areas and the guestrooms should be well maintained and well equipped with quality carpets/area rugs/ goodquality duries, furniture, fittings etc. in good taste and in keeping with the traditional lifestyle.If carpeting is not provided, the quality of flooring should be very good (This is not suggestthat old and original flooring whether in stone or any other material should be replacedunnecessarily). The guest rooms should be clean, airy, pest free, without dampness andmusty odour, and of reasonably large size, with attached bathrooms with modern facilities(e.g. flush commodes, wash basins, running hot and cold water, etc.). There should be awell appointed lobby and / or lounge equipped with furniture of high standard, with separateladies and gents cloak rooms with good fittings.

171INDIA TOURISM STATISTICS 2009
FACILITIES :There should be a reception, cash and information counter attended by trained and experiencedpersonnel. There should be money changing facilities and left luggage room. There shouldbe a well equipped, well furnished and well maintained dining room on the premises and,wherever permissible by law, there should be an elegant, well equipped bar/ permit room.The kitchen and pantry should be professionally designed to ensure efficiency of operationand should be well equipped. Crockery, cutlery, glassware should be of high standard and insufficient quantity, keeping in view the lifestyle and commensurate with the number of gueststo kitchen must be clean, airy, well lighted and protected from pests. There must be afiltration/ purification plant for drinking water. There must be three tier washing system withrunning hot and cold water, hygienic garbage disposal arrangements, and frost free deepfreezer and refrigerator (where the arrangement is for fresh food for each meal, standbygenerator will not be insisted upon ).
SERVICES :The hotel should offer good quality cuisine and the pod and beverage service should be ofgood standard. There should be qualified, trained, experienced, efficient and courteous staffin service and clean uniforms and the staff coming in contact with the guests should understandEnglish. Housekeeping at these hotels should be of the highest possible standard and hereshould be a plentiful supply of linen, blankets, and rowels, etc.which should be of highquality. Each guest room should be provided with a vacuum jug/ ask with bacteria freedrinking water. Arrangements or heating/ cooling must be provided for the guest room inseasons. Places which have telephone lines must have at least one phone in the office withcall ells in each guest room, Arrangements for medical assistance must be there in case ofneed. The staff/room ratio must be in keeping with the number of guest room in each property.These hotels must be run a professional basis while losing none of their ambience andservices.
The hotel should be environment friendly. The gardens and grounds should be very wellmaintained. There should be an efficient system of disposal of garbage and treatment ofwastes and effluents. The hotel should present authentic and specially mimeographed localentertainment to the guests. They should also have, wherever possible, arrangements forecial services such as wildlife viewing, water sports, horse/ camel/ elephant riding or safarisetc.
Note:- The Ministry of Tourism, Government of India reserves the right to amend and revisethe above guidelines from time to time.

173INDIA TOURISM STATISTICS 2009
APPENDIX-III
GUIDELINES FOR APPROVAL OFCONVENTION CENTRES
Meetings, Incentives, Conference and Exhibitions (MICE) are today becoming an importantsegment of the tourism industry. With the opening up of India’s economy, MICE tourism islikely to grow further in the future. Our country therefore needs more Convention and ExhibitionCentres to meet the requirement of this lucrative segment of the tourism. Taking this factinto consideration, therefore, the Ministry of Tourism has decided to grant approval toconvention centres to encourage investment and standardize facilities at the conventioncentres.
APPROVAL
Approved convention centres, being essential tourism infrastructure are eligible for variousbenefits including among other things, income tax concession under the Income Tax Actand priority consideration of its various requirements like telephone, telex, LPG etc. by theGovernment Authorities at Municipal, State and union Levels or a semi or quasi-Governmentbody.
The approval can be applied for at project/ planning stage. A convention centre approvedat the project stage will be eligible for consideration for allocation of foreign exchange for itsessential import of equipment and provisions. On completion and becoming functional it willget worldwide publicity through tourist literature published by the Ministry of Tourism anddistributed through its offices in India and Overseas. Approved convention center will alsobe eligible to apply to the Industrial Finance Corporation of India and the State FinancialCorporations of loan. However, application for loan and incentives are considered by therespective Ministries/Departments and Financial Institutions in the context of request toproduce a detailed feasibility study etc. and the project approval by the Ministry of Tourismshould not in any way be construed as an assurance for the grant of any incentive or loanthereto.
GENERAL FEATURES:
It is very essential that the proposed convention centre should contain at least oneconvention hall, two mini convention halls, one exhibition hall, one restaurant and parkingfacilities as per details given below:-
1. CONVENTION HALL: convention hall as the name suggests should have audio Visualconferencing equipment, facility for high fidelity recording, video projection/ video graphsetc. and skilled manpower at various levels. The seating capacity in the hall may be ina classroom style in the following category:-
a) Above 1500pax orb) 1200-1500 pax or
174INDIA TOURISM STATISTICS 2009
c) 800-1200 pax ord) 300-800 pax
2. MINI CONVENTION HALLS: Mini Convention halls are equally important inConvention Centres as these halls are required for various seminars, committees,meetings etc. the seating capacity therefore, may be in a theatrical or classroomstyle to seat as follows:-
a) 200-300 pax orb) 100-200 pax orc) 50-100 pax ord) 20-50 pax
3. EXHIBITION HALL: Exhibition Hall is another important feature in convention centre.Delegates to the convention as well as trade relative promoters take part in tradeshows to promote their products during conventions. As such, it is essential thatsuch exhibition hall should have a capacity to accommodate at least 20 booths of 3mts by 3 mts in size excluding passages in between the booths.
4. RESTAURANTS: Restaurants in the convention centres should confirm to the existingguidelines of HRACC laid down by the Ministry.
5. PARKING: Parking facility for not less than 50 cars and five coaches.
6. RESIDENTIAL ACCOMMODATION FOR DELEGATES/ PARTICIPANTS: applicableonly if, promoters, desire to have residential accommodation in the conventioncomplex and the guidelines laid down by the Ministry in respect of star categoryhotels will apply.
7. In addition to the above facilities convention centre should include the following
INFRASTRUCTURAL FACILITIES:
i. Landscaped forefront.ii. Exhibition Management Centre.iii. Administrative facilities for corporate office including IITTM/ Internet etc.iv. Trade Show/ Fair Facilities such as Tourist Office, Bank and Money Changing
facilities, Travel Desk, STD/ISD, Press Lounge, VIP Lounges etc.v. Technical facilities such as plant room, electric substation, stores, electric power
back-up-system, fire hydrant etc.vi. Gate complex for stipulating entry and exit.vii. Information booths.viii. Public Convenience.ix. Stationary Shops and Kiosks.x. Public Address System.xi. First aid with doctor on call facilities.xii. Security office and booths for security arrangements.
175INDIA TOURISM STATISTICS 2009
xiii. Storage complex for custom storage and handling etc.xiv. Fire safety arrangements.xv. Locker facilities.
In order to enhance the value of the above facilities there must be space forother ancillary activities also. This could include the following:
a) Handicraft shops, souvenir shop.b) Facility for the physically disabled person.c) Other facility for enhancing costumer satisfaction.
APPLICATION
1. The application for approval of a convention centre should be submitted, in the prescribedform complete in all respects, to the Secretary (T) Govt. of India, Transport Bhawan,New Delhi.
2. The power to approve convention centres at a project stage/ operational stage/ re-approval will be exercised by the Chairman (HRACC).
3. The Re-approval is required to be done after 3 years. The application fee is non refundableand is payable by demand Draft to the Pay & Accounts officer, Ministry of Tourism,New Delhi. The fee for project approval / Operational Approval and Re-approval will beas follows:-
1) Approval at the project stage – Rs.5000 /-2) Approval at the operational stage _ Rs.10,000/-3) Re-approval _ Rs.5,000/-
REQUIREMENT
Various documents and information to be furnished about convention centre projects whenapplying for project approval are given in details in the application form. However, the basicrequirements are indicated so that these are sent along with the application:-
i) A PROJECT REPORT establishing the feasibility of the proposed conventioncentre, describing the amenities to be provided at the convention centreparticularly mentioning any special or distinctive features.
ii) The site selected should be suitable for the construction of convention centreintended for use by domestic as well as international business travelers. Whileselecting the site such aspects as its accessibility from airport / railway station/ shopping areas etc. making it a convenient location, may be kept in mind asalso that it environs are not pollution prone, crowded, noisy, unhygienic etc.
iii) A land use permission certificate from the concerned state/ local authoritycertifying that it is permissible to construct a convention centre on the site
176INDIA TOURISM STATISTICS 2009
selected. Blue prints of the sketch plans of the project duly approved by theState authority and signed by the architect and the promoter should be furnished.
iv) Ownership deed of the land.
v) Urban land ceiling certificate, if applicable.
vi) Approval of International Airport Authority of India/ Director General of civil aviationif the project is near an airport.
vii) Name and Business antecedents of the promoters.
viii) Proposed Ownership structure, giving full details as to whether the newundertaking will be owned by individual(s) or a firm or a company.
ix) Estimated cost of the project and the manner in which it is proposed to raise thefunds to meet the required investments.
x) The Ministry has prescribed some regulatory conditions to be adhered to bypromoters or approved convention centre projects. The promoter should furnishthe acceptance of these regulatory conditions in the prescribed form. Theregulatory conditions and the form of there acceptance have also been appended.
REGULATORY CONDITIONS FOR APPROVAL OF CONVENTION CENTRE PROJECT
All convention centres approved by the Ministry of Tourism are required to furnish thefollowing information:-
1) Documents relating to its legal status i.e. if the company is incorporated under thecompanies act, a copy of its memorandum and articles of association, if it ispartnership firm, a copy of the partnership deed and the certificate of registrationunder the partnership act; if it is a proprietory concern, name and address of theproprietor etc.
2) Any license and/or approvals required from the local administration/police and/ orother concerned authorities for the construction/operation of the convention centreshould be obtained directly by the promoters from the concerned authorities. Theapproval by the Ministry will not in any substitute for them. The Ministry’s approvalwill be deemed to have been withdrawn in case of violation of any condition asbrought to its notice.
3) In the event of the promoters making any changes in the plans of the project assubmitted earlier, the approval of this ministry will have to be applied for a fresh.
4) As a project which has been approved from the of view of its suitability for foreignorientele the promoter will be eligible for grant of loan from Central/ State FinancialInstitutions and priority in the procurement of building material, telephone and telex
177INDIA TOURISM STATISTICS 2009
connections etc. however, this approval should not in any way be construed as anassurance for the grant of these facilities since this would fall within the jurisdictionof the concerned authorities and the rules prescribed for the purpose.
CONDITIONS TO BE FULFILLED AFTER THE CONVENTION CENTRE/HOTELBECOMES FUNCTIONAL
1) The Convention Centre must immediately inform this Ministry the date from which itbecomes functional, and apply for approval within 3 months thereafter.
2) The Convention Centre will submit the following information to the Director General,Ministry of Tourism, so as to reach on or before 31st March each year for the precedingfinancial year:-
(a) A bank certificate in regard to foreign exchange deposited by the conventioncentre/ hotel;
(b) No. of conventions/ conferences/ seminars held and the no. of participants asper Performa given below:-
Sl. No. Name of conference / Date No. of Name of Seminar Participants Organisation
Domestic/ International
1 2 3 4 5 6
(c) Total bed capacity offered by the Hotel as under:-(provided the convention centreis having residential accommodation)
Single Rooms:
Double Rooms:
Suites:
(d) Number of rooms occupied on a permanent/ semi permanent basis by Residents/staff Officers etc;
(e) A specimen copy of the current tariff card (applicable to convention centre havingresidential accommodation);
(f) List of the name of the Senior Executive with their designation, experience etc.
(g) Total number of persons employed.
(h) Annual report of the convention centre / hotel and a statement showing the audited
178INDIA TOURISM STATISTICS 2009
balance sheet and profit and loss account within 4 months of the close of thefinancial year;
(i) Statistical returns in regard to the number of the events, held guests, rooms,occupancy, income and employment on quarterly basis as prescribed by theMinistry of Tourism from time to time.
3) The Regional Director/ Director/ Manager of the Government of India Tourist Officesof the region and the Director General, Ministry of Tourism would be kept informedfrom time to time of facilities introduced for withdrawn and of any additions arealternations made in regard to convention centre.
4) The hotel tariff should be prominently displayed in each room. This card shall alsoindicate all taxes, service charge etc. (where applicable)
5) Normally, no rooms will be let out for purposes other than residential. However, withthe prior approval of the Ministry of Tourism not more than 10 percent of the roomsin the hotel will be let out to any person or company for residential or commercialpurposes.
6) The convention centre should at all times adhere to the high standard of maintenanceand services for which it has been approved and in all dealing with its guests observepractice worthy of an establishment of repute.
7) The officers of the Ministry of Tourism or any other officer deputed by it to inspectpremises from time to tome will be allowed free access with or without prior notice.
IN THE EVENT OF BRANCH OF ANY OF THE ABOVE CONDITIONS BYTHE CONVENTION CENTRE, THE MINISTRY OF TOURISM SHALL HAVE THE RIGHT
TO WITHDRAW APPROVAL.
179INDIA TOURISM STATISTICS 2009
APPLICATION PROFORMA FOR APPROVAL OFCONVENTION CENTRE
1. Proposed name of the convention centre
2. Name of Promoters:(A note giving details of business antecedents may be enclosed)
3. Complete postal address of thePromoters
4. Status of owners/ promoters: Whether
(a) Company:(If so, a copy of the Memorandum & Articles of Association may be furnished)
(OR)
(b) Partnership Firm:(If so, a copy of partnership deed and Certificate of registration under thePartnership Act may be furnished)(OR)
(c) Proprietory concern (Give name and address of the proprietor)
5. Location of convention centre alongWith Postal address:
6. Details of the Site
(a) Area
(b) Title
Whether outright purchase(If so, a copy of the registered sale deed should be furnished)(OR) On lease
(c) whether the required land use permit for the construction of convention Centre on ithas been obtained (if so, a Copy the certificate from the concerned Local authoritiesshould be furnished).
(d) Distance from Railway Station:(e) Distance from Airport:(f) Distance from main city centre:
180INDIA TOURISM STATISTICS 2009
7. Details of the convention centre project:(Copy of the project/ feasibility report Should be furnished)
(I) No. of Convention Halls(Please indicate seating capacity)a)b)c)d)
(II) No. of Mini Convention Halls(Please indicate seating capacity)a)b)c)d)
(III) Exhibition Hall(Please indicate area)
(IV) Restaurant(Please indicate area)
(V) Parking(Please indicate area and no. ofCars / coaches than can be parked)
(VI) Star category of accommodationUnit planned (if applicable).
I. No. of guest rooms and their area:Number Area
a) Singleb) Doublec) Suites
Total:
II No. of attached baths and their areas:
(a) How many of bathrooms will have longBaths or the most modern shower chambers(Give break up)
(b) Details of public areas:Number Area of Each
181INDIA TOURISM STATISTICS 2009
(i) Lounge Lobby/ Reception
(ii) Restaurants
(iii) Bar
(iv) Shopping
(v) Banquet/ catering facilities
(vi) Health club
(vii) Swimming Pool
NOTE: It may be insured that areas of guest rooms and attached bathrooms confirmto the minimum standards laid down by the Ministry of Tourism for restaurantsand for different star categories of hotels.
Blue Prints of the sketch plans of the project.
(A complete set duly approved by the State Authorities and signed by the promoterand the architect should be furnished, including/ showing among other things, thefollowing:-
(i) Site plan
(ii) Front and side elevation
(iii) Floor wise distribution of public Areas/guest rooms and other facilities;
(iv) (a) Area of convention halls/ mini convention hall/ exhibition hall.
(b) Area of guest rooms with dimensions (if applicable)
(c) Area of bathrooms with dimensions
8. Air-conditioning:
(a) whether all the convention halls and guest rooms will be air-conditioned.(b) whether all the public areas will be air-conditioned.(c) Give details of type of air conditioning
9. Approval:
Whether the convention centre project has been approved / cleared by/ under the followingagencies/ Acts wherever applicable:
182INDIA TOURISM STATISTICS 2009
(a) Municipal authorities(b) Urban lands(ceiling), Act(c) Any other Local/ State Govt.(d) Authorities Concerned.
10. Proposed Capital Structure:
(a) Total estimated cost:
(i) Equity(ii) Loan:(iii) Equity capital so far raised:
(b) (i) Sources from which loan is proposed to be raised(ii) Present position of the loan.
11. Acceptance of regulatory conditions:(This should be furnished in the prescribed Performa)
12. Application Fee-Demand Draft No._________
13. If you are interested in availing of any or all of the following benefits of the IncomeTax Act 1961 kindly mention Yes/No against each of the following provisions:
Section 80-HHD
Any Other
Signature…………………...............
Full Name and Designation of the
Applicant…………………...............
Place………………………..............
Dated………………………………….
183INDIA TOURISM STATISTICS 2009
FORMAT OF ACCEPTANCE OF REGULATORY CONDITIONS FORAPPROVAL OF CONVENTION CENTRE PROJECT AND
CONDITION TO BE FULFILLED AFTER THE CONVENTIONCENTRE / HOTEL BECOMES FUNCTIONAL
To,
The Secretary (T), Govt. of, India,
Ministry of Tourism,Transport Bhawan,
New Delhi
Sub: Acceptance of regulatory conditions for approval of convention centre project &condition to be fulfilled after the convention centre /hotel becomes functional.
Dear Sir,
I have received a copy of the regulatory conditions for approval of convention centreprojects prescribed by the Ministry of Tourism for convention centre on its approved list, andwish to confirm that I have read and understood the same and hereby agree to abide by thesame and such other conditions as may be laid down from time to time by the Ministry ofTourism for approval of convention centre.
Yours faithfully,
(Name in Block letters) Managing Director/ Partner/ Proprietor
Name of the convention centre Dated:______________
(Note: This letter should be in the Company Letter Head)
185INDIA TOURISM STATISTICS 2009
APPENDIX-IV
GUIDELINES FOR APPROVAL & CLASSIFICATION/RE-CLASSIFICATION OF APARTMENT HOTELS
Hotels are an integral part of a tourist’s visit to a place and the services offered by them canmake or mar a visit completely. Apartment Hotels are increasingly becoming popular withbusiness travellers who come to India for some assignments, for family holidays, etc. whichare sometimes stretching for months together. With the aim of providing standardized, worldclass services to the tourists, the Government of India, Ministry of Tourism has a voluntaryscheme for classification of fully operational Apartment Hotels in the following categories:
5 STAR DELUXE, 5 STAR, 4 STAR, AND 3 STAR
The Hotel & Restaurant Approval & Classification Committee (HRACC) inspects and assessesthe hotels based on facilities and services offered.
Project approvals are also given in all the above-mentioned categories at the projectimplementation stage.
Classified Apartment Hotels/approved projects are eligible for various concessions andfacilities that are announced by the Government from time to time besides, getting worldwidepublicity through the Indiatourism Offices located in India and abroad.
In no circumstances apartments in the Apartment Hotel will be sold individually for residentialor any other purpose.
Details of the criteria set and the documents required are given in this document. Forclassification/reclassification and project approvals of Apartment Hotels, the applicationsalong with the requisite fees may be sent to:-
Member Secretary (HRACC)/Hotel and Restaurants Division, Ministry of Tourism,Government of India,
C-1 Hutments, Dalhousie Road, New Delhi 110011.
186INDIA TOURISM STATISTICS 2009
GENERAL TERMS, CONDITIONS & APPLICATION ATPROJECT LEVEL & CLASSIFICATION/ RECLASSIFICATION
FORMAT FOR PROJECT APPROVAL OFAPARTMENT HOTELS
APPROVAL AT PROJECT LEVEL
1. The Ministry of Tourism approves Apartment hotels at project stage based ondocumentation, which enables the hotels to get certain benefits from the govt. asannounced from time to time. The documents required for project approvals are listedbelow.
2. Project approvals are valid for 5 years. Project approvals of the Govt. of India,Department of Tourism cease 3 months from the date that the Apartment hotel becomesoperational even if all its rooms are not ready. The Apartment Hotel must apply forclassification within these 3 months.
3. The Ministry of Tourism, Govt. of India reserves the right to modify the guidelines/terms and conditions from time to time.
4. APPLICATION FORM THIS COVERS
i. Proposed name of the Apartment Hotelii. Name of the promoters with a note on their business antecedentsiii. Complete postal address of the promoters/tel./fax/emailiv. Status of the owners/ promoters
(1) If Public/ private limited company with copies of Memorandum and Articlesof Association
(2) If Partnership, a copy of partnership deed and certificate of registration(3) If proprietary concern, name and address of proprietor/certificate of
registration
v. Location of apartment hotel site with postal address
vi. Details of the site(1) Area (in sq. meters)(2) Title – owned/ leased with copies of sale/ lease deed(3) Copy of Land Use Permit from local authorities(4) Distances from Railway station, airport, main shopping centers (in Kms)
vii. Details of the Project (1) Copy of feasibility report.
(2) Star category planned
187INDIA TOURISM STATISTICS 2009
(3) Number of apartments and area for each type of room (in sq.ft.)(4) Number of attached baths and areas (in sq.ft.)(5) Details of public areas – Lobby/lounge, restaurants, bars, shopping, banquet/
conference halls, health club, swimming pool, parking facilities etc.(6) Facilities for the physically challenged persons.(7) Eco-friendly practices and any other additional facilities.
(please indicate area in sq.ft for each facility mentioned above at 5,6 &7)(8) Date by which project is expected to be completed and operational.
viii) Blue prints/ sketch plans signed by owners and architect showing(1) Site plan(2) Front and side elevations(3) Floor plans for all floors(4) Detail of guestroom and bathroom with dimensions in sq.ft.(5) Details of Fire Fighting Measures/ Hydrants etc.(6) Details of measures for energy conservation and water harvesting.
ix) Air-conditioning details for guest rooms, public areas
x) Local approvals by(1) Municipal authorities(2) Concerned Police Authorities(3) Any other local authority as maybe required.(4) Approval /NOC from Airport Authority of India for projects located near Airports
The above mentioned approvals/NOCs are the responsibility of the promoters/concernedcompany as the case may be. The Department’s approval is no substitute for any statutoryapproval and the approval given is liable to be withdrawn in case of any violations withoutnotice.
xi) Proposed capital structureTotal project cost
(a) Equity component with details of paid up capital(b) Debt – with current and proposed sources of fundingxii) Letter of acceptance of regulatory conditions.xiii) Please indicate whether the promoter intends to give a few rooms or all
rooms on a time- share basis.xiv) Application Fee
5. In the event of any changes in the project plans, the approval must be sought afresh.
6. Authorised officers of the Department of Tourism should be allowed free access to inspectthe premises from time to time without prior notice
7. The Apartment Hotel must immediately inform the Department of the date from which itbecomes operational and apply for classification within 3 months of this date.
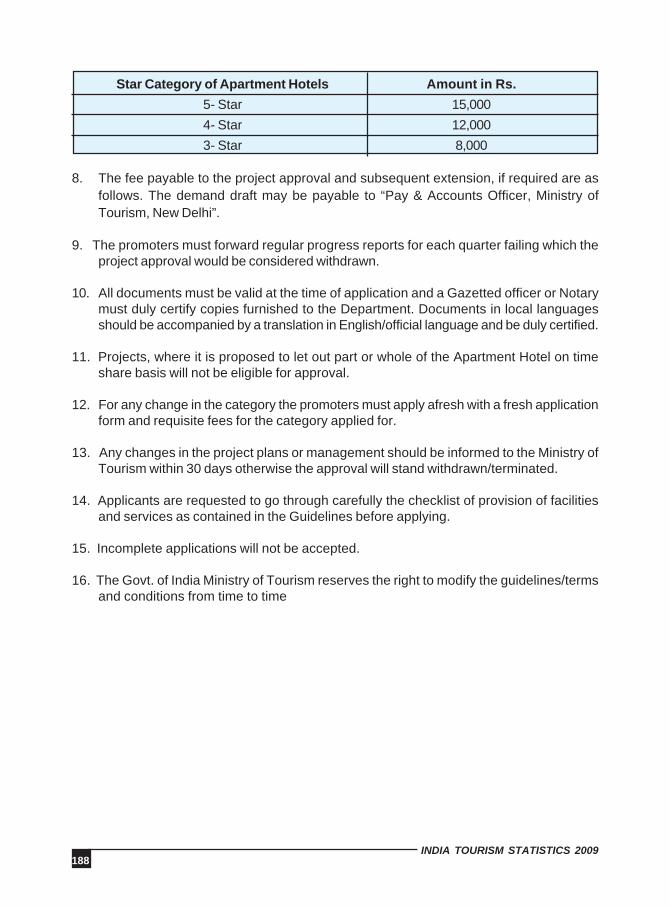
188INDIA TOURISM STATISTICS 2009
Star Category of Apartment Hotels Amount in Rs.
5- Star 15,0004- Star 12,0003- Star 8,000
8. The fee payable to the project approval and subsequent extension, if required are asfollows. The demand draft may be payable to “Pay & Accounts Officer, Ministry ofTourism, New Delhi”.
9. The promoters must forward regular progress reports for each quarter failing which theproject approval would be considered withdrawn.
10. All documents must be valid at the time of application and a Gazetted officer or Notarymust duly certify copies furnished to the Department. Documents in local languagesshould be accompanied by a translation in English/official language and be duly certified.
11. Projects, where it is proposed to let out part or whole of the Apartment Hotel on timeshare basis will not be eligible for approval.
12. For any change in the category the promoters must apply afresh with a fresh applicationform and requisite fees for the category applied for.
13. Any changes in the project plans or management should be informed to the Ministry ofTourism within 30 days otherwise the approval will stand withdrawn/terminated.
14. Applicants are requested to go through carefully the checklist of provision of facilitiesand services as contained in the Guidelines before applying.
15. Incomplete applications will not be accepted.
16. The Govt. of India Ministry of Tourism reserves the right to modify the guidelines/termsand conditions from time to time
189INDIA TOURISM STATISTICS 2009
APARTMENT HOTEL - CLASSIFICATION/ECLASSIFICATION GUIDELINES
1. Classification for newly operational Apartment Hotels must be sought within 3 monthsof completion of approved Apartment Hotel projects. Operating Apartment Hotels mayopt for classification at any stage. However, those seeking re-classification shouldapply for reclassification one year prior to the expiry of the current period ofclassification.
2. If the Apartment Hotel fails to reapply 1 year before the expiry of the classificationorder, the application will be treated as a fresh classification case.
3. Once an Apartment Hotel applies for classification/ re-classification, it should be readyat all times for inspection by the HRACC. No requests for deferment of inspection willbe entertained.
4. Classification will be valid for 5 (Five) years from the date of issue of orders or in caseof reclassification from the date of expiry of the last classification provided that theapplication has been received within the stipulated time mentioned above, along withall valid documents. Incomplete applications will not be accepted.
5. Apartment Hotels which propose to let out part of or all its rooms on time-share basisare not eligible to be classified
6. Apartment Hotels applying for classification must provide the following documentation.Application Form detailingi. Name of the Apartment Hotelii. Name and address of the promoters/owners with a note on their business
antecedentsiii. Complete postal address of the Apartment Hotel with tel. no/fax/emailiv. Status of the owners/ promoters
(1) If Public/ private limited company with copies of Memorandum and Articlesof Association
(2) If Partnership, a copy of partnership deed and certificate of registration(3) If proprietary concern, name and address of proprietor/certificate of
registration.v. Date on which the Apartment Hotel became operational.vi. Details of Apartment Hotel site with distance from Airport/Railway Station/ City Centre/Downtown shopping area (in kms)vii. Details of the Apartment Hotel
a. Area (in sq. metres) with title – owned/ leased with copies of sale/lease deedb. Copy of Land Use Permit from local authoritiesc. Star category being applied ford. Number of rooms and area for each type of room in sq.ft. (single/double/suites)
190INDIA TOURISM STATISTICS 2009
e. Number of attached bathsf. Details of public areas – Lobby/lounge, restaurants, bars, shopping area, banquet/
conference halls, health club, swimming pool, parking facilities, facilities for thephysically challenged persons, Eco-friendly practices and any other additionalfacilities. The area for each facility should be indicated in sq.ft
g. No of bathrooms with dimensions in sq.ft.h. Details of Fire Fighting Measures/ Hydrants etc.i. Details of measures for energy conservation and water harvesting and other Eco-
friendly practices, measures and initiatives.j. Air-conditioning details for guest rooms, public areas
viii. Certificates/No Objection Certificate’s (attested copies)
a. Certificate/ licence from Municipality/ Corporation to show that your establishmentis registered as an Apartment Hotel
b. Certificate/ licence from concerned Police Department authorizing the running ofan Apartment Hotel
c. Clearance Certificate from Municipal Health Officer/ Sanitary Inspector givingclearance to
d. your establishment from sanitary/hygienic point of view
e. No Objection Certificate with respect to fire fighting arrangements from the FireService Department (Local Fire Brigade Authorities)
f. Public liability insurance
g. Bar Licence (necessary for 4*, 5* & 5*-D only)
h. Money Changers Licence (necessary for 4*,5*& 5*-D only)
i. Sanctioned building plans/occupancy certificate
j. If classified earlier, a copy of the earlier “Certificate of Classification issuedby Department of Tourism
k. For Heritage property, certificate from the local authority stating age of the propertyand showing new and old built up areas separately.
l. Any other local authority as maybe required.
m. Approval /NOC from AAI for projects located near Airports
n. Please indicate whether a few rooms or all rooms are to be let out on a time-sharebasis.
o. Application fees
The above-mentioned approvals/No Objection Certificates are the responsibility of the Owners/promoters/concerned Company as the case may be. The Ministry’s approval is no substitutefor any statutory approval and the approval given is liable to be withdrawn without notice incase of any violations or misrepresentation of facts.
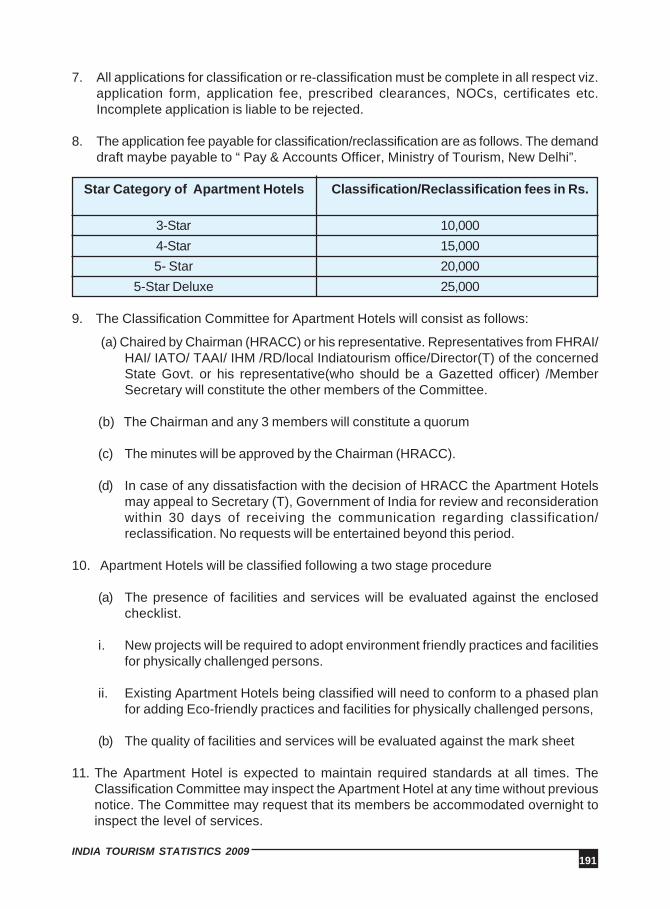
191INDIA TOURISM STATISTICS 2009
7. All applications for classification or re-classification must be complete in all respect viz.application form, application fee, prescribed clearances, NOCs, certificates etc.Incomplete application is liable to be rejected.
8. The application fee payable for classification/reclassification are as follows. The demanddraft maybe payable to “ Pay & Accounts Officer, Ministry of Tourism, New Delhi”.
Star Category of Apartment Hotels Classification/Reclassification fees in Rs.
3-Star 10,0004-Star 15,0005- Star 20,000
5-Star Deluxe 25,000
9. The Classification Committee for Apartment Hotels will consist as follows:
(a) Chaired by Chairman (HRACC) or his representative. Representatives from FHRAI/HAI/ IATO/ TAAI/ IHM /RD/local Indiatourism office/Director(T) of the concernedState Govt. or his representative(who should be a Gazetted officer) /MemberSecretary will constitute the other members of the Committee.
(b) The Chairman and any 3 members will constitute a quorum
(c) The minutes will be approved by the Chairman (HRACC).
(d) In case of any dissatisfaction with the decision of HRACC the Apartment Hotelsmay appeal to Secretary (T), Government of India for review and reconsiderationwithin 30 days of receiving the communication regarding classification/reclassification. No requests will be entertained beyond this period.
10. Apartment Hotels will be classified following a two stage procedure
(a) The presence of facilities and services will be evaluated against the enclosedchecklist.
i. New projects will be required to adopt environment friendly practices and facilitiesfor physically challenged persons.
ii. Existing Apartment Hotels being classified will need to conform to a phased planfor adding Eco-friendly practices and facilities for physically challenged persons,
(b) The quality of facilities and services will be evaluated against the mark sheet
11. The Apartment Hotel is expected to maintain required standards at all times. TheClassification Committee may inspect the Apartment Hotel at any time without previousnotice. The Committee may request that its members be accommodated overnight toinspect the level of services.
192INDIA TOURISM STATISTICS 2009
12. Any deficiencies/ rectification pointed out by the HRACC must be complied with withinthe stipulated time, which has been allotted in consultation with the hotel representativesduring inspection. Failure to do so will result in rejection of the application.
13. The committee may assign a star category lower but not higher than that applied for.
14. The Apartment Hotel must be able to convince the committee that they are taking sufficientsteps to conserve energy and harvest water, garbage segregation, and disposal/recyclingas per Pollution Control Board (PCB) norms and following other Eco-friendly measures.
15. For any change in the star category the promoters must apply afresh with a freshapplication form and requisite fees for the category applied for.
16. Any changes in the plans or management of the Apartment Hotel should be informed tothe HRACC, Govt. of India, Ministry of Tourism within 30 days otherwise the classificationwill stand withdrawn/terminated.
17. Applicants are requested to go through the checklist of facilities and services containedin this document before applying.
18. Incomplete applications will not be considered. All cases of classification would befinalised within three months of the application being made.
19. The Govt. of India, Ministry of Tourism reserves the right to modify the guidelines/termsand conditions from time to time.
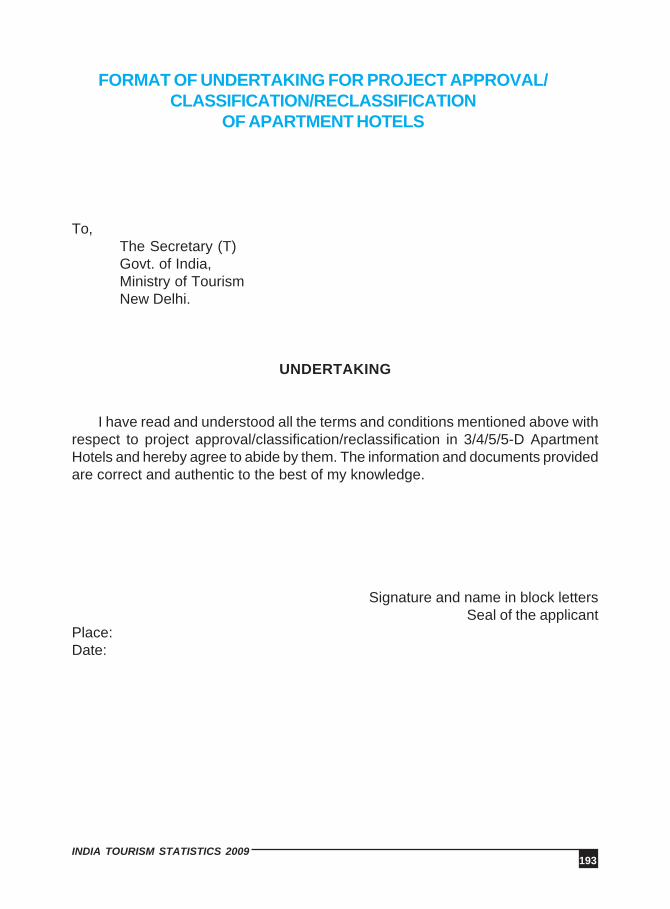
193INDIA TOURISM STATISTICS 2009
FORMAT OF UNDERTAKING FOR PROJECT APPROVAL/CLASSIFICATION/RECLASSIFICATION
OF APARTMENT HOTELS
To,The Secretary (T)Govt. of India,Ministry of TourismNew Delhi.
UNDERTAKING
I have read and understood all the terms and conditions mentioned above withrespect to project approval/classification/reclassification in 3/4/5/5-D ApartmentHotels and hereby agree to abide by them. The information and documents providedare correct and authentic to the best of my knowledge.
Signature and name in block lettersSeal of the applicant
Place:Date:
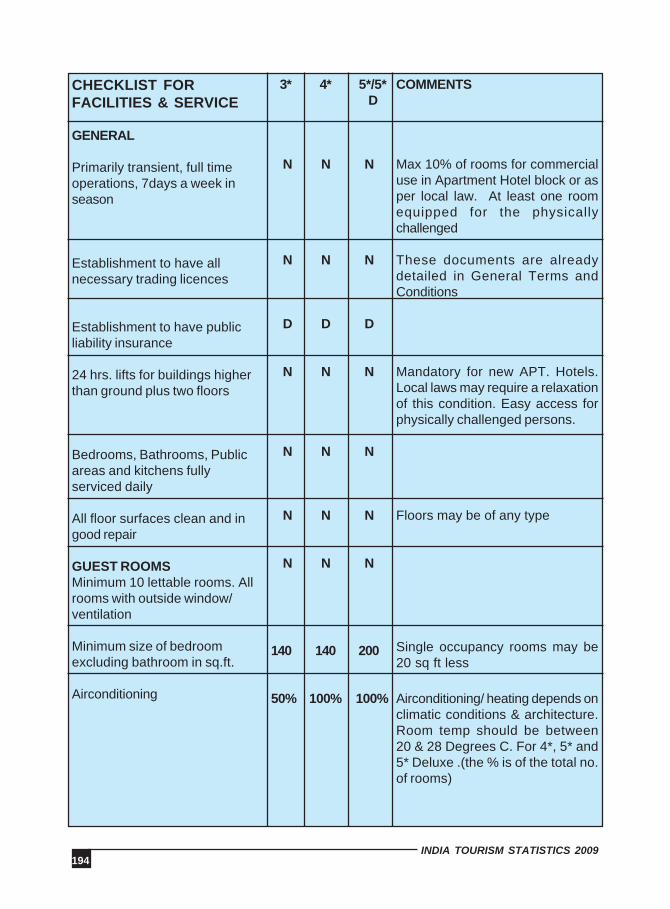
194INDIA TOURISM STATISTICS 2009
CHECKLIST FORFACILITIES & SERVICE
GENERAL
Primarily transient, full timeoperations, 7days a week inseason
Establishment to have allnecessary trading licences
Establishment to have publicliability insurance
24 hrs. lifts for buildings higherthan ground plus two floors
Bedrooms, Bathrooms, Publicareas and kitchens fullyserviced daily
All floor surfaces clean and ingood repair
GUEST ROOMSMinimum 10 lettable rooms. Allrooms with outside window/ventilation
Minimum size of bedroomexcluding bathroom in sq.ft.
Airconditioning
COMMENTS
Max 10% of rooms for commercialuse in Apartment Hotel block or asper local law. At least one roomequipped for the physicallychallenged
These documents are alreadydetailed in General Terms andConditions
Mandatory for new APT. Hotels.Local laws may require a relaxationof this condition. Easy access forphysically challenged persons.
Floors may be of any type
Single occupancy rooms may be20 sq ft less
Airconditioning/ heating depends onclimatic conditions & architecture.Room temp should be between20 & 28 Degrees C. For 4*, 5* and5* Deluxe .(the % is of the total no.of rooms)
3* 4* 5*/5*D
N N N
N N N
D D D
N N N
N N N
N N N
N N N
140 140 200
50% 100% 100%
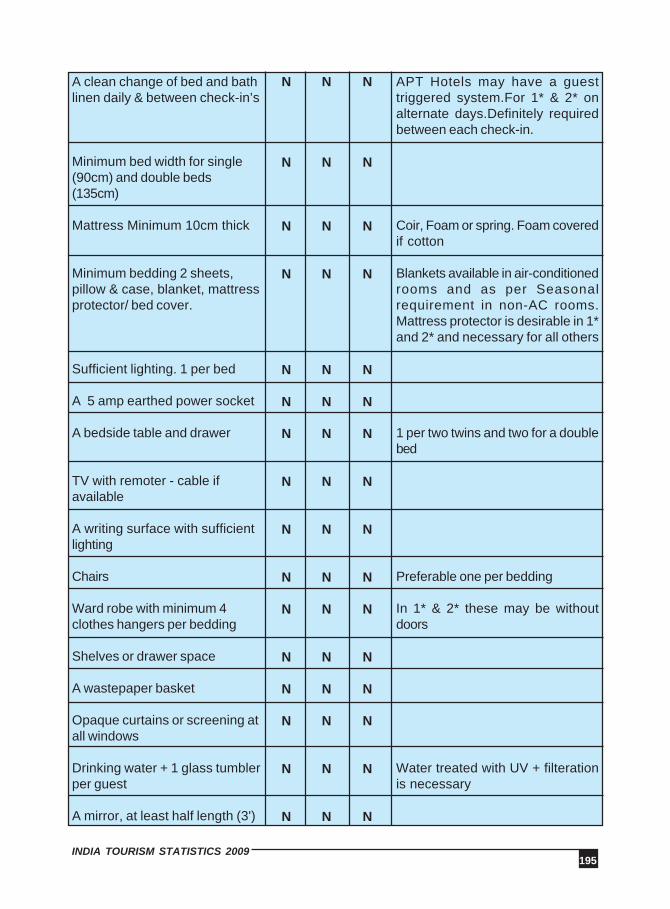
195INDIA TOURISM STATISTICS 2009
A clean change of bed and bathlinen daily & between check-in’s
Minimum bed width for single(90cm) and double beds(135cm)
Mattress Minimum 10cm thick
Minimum bedding 2 sheets,pillow & case, blanket, mattressprotector/ bed cover.
Sufficient lighting. 1 per bed
A 5 amp earthed power socket
A bedside table and drawer
TV with remoter - cable ifavailable
A writing surface with sufficientlighting
Chairs
Ward robe with minimum 4clothes hangers per bedding
Shelves or drawer space
A wastepaper basket
Opaque curtains or screening atall windows
Drinking water + 1 glass tumblerper guest
A mirror, at least half length (3')
APT Hotels may have a guesttriggered system.For 1* & 2* onalternate days.Definitely requiredbetween each check-in.
Coir, Foam or spring. Foam coveredif cotton
Blankets available in air-conditionedrooms and as per Seasonalrequirement in non-AC rooms.Mattress protector is desirable in 1*and 2* and necessary for all others
1 per two twins and two for a doublebed
Preferable one per bedding
In 1* & 2* these may be withoutdoors
Water treated with UV + filterationis necessary
N N N
N N N
N N N
N N N
N N N
N N N
N N N
N N N
N N N
N N N
N N N
N N N
N N N
N N N
N N N
N N N

196INDIA TOURISM STATISTICS 2009
A stationary folder containingstationery and envelopes
A ‘ do not disturb’ notice
Night spread/ bedcover withnightly turndown service
In room safe
Minibar / Fridge
Iron and ironing board onrequest
SUITESBATHROOMS
Percentage of rooms withdedicated (private) bathroomswith room
Minimum Size of Bathroom insquare feet
Communal Bathrooms on samefloor as rooms for 1* & 2*.Access not through Publicareas, Kitchens etc
1 bath towel and 1 handtowel tobe provided per guestOne W.C. brush per toilet seat
Guest toiletries to be provided.Minimum 1 new soap per guest
A clothes-hook in each bath/shower room
A sanitary bin
Each Western WC toilet to havea seat and lid, toilet paper
Contents must conform to local laws
2% of room block with a minimumof 1
Dedicated bathrooms need not be“attached” but must have privateaccess
25% of bathrooms in 1* & 2* to beWestern style WC
All bathrooms, shower stallslockable.Toilet area to have sanitarybin with lid
If no attached/ dedicated bath, toprovide in room
Where bathroom is not attached,toiletries provided in room
In communal bathrooms, thesemust have a cover
N N N
N N N
N N N
N
N
N N
N N
ALL ALL ALL
36 36 45
NA NA NA
N N N
N N N
N N N
N N N
N N N
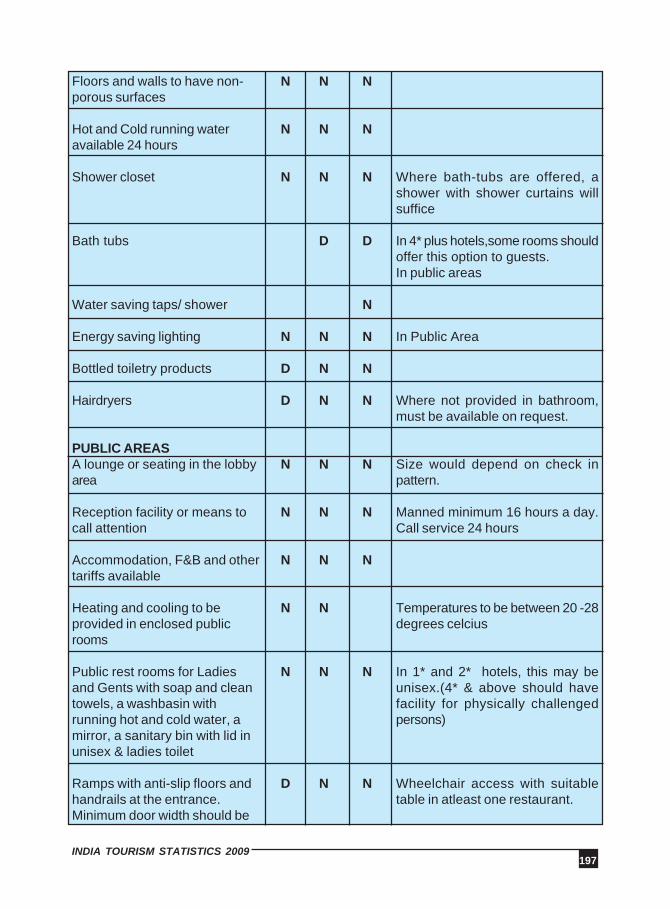
197INDIA TOURISM STATISTICS 2009
Floors and walls to have non-porous surfaces
Hot and Cold running wateravailable 24 hours
Shower closet
Bath tubs
Water saving taps/ shower
Energy saving lighting
Bottled toiletry products
Hairdryers
PUBLIC AREASA lounge or seating in the lobbyarea
Reception facility or means tocall attention
Accommodation, F&B and othertariffs available
Heating and cooling to beprovided in enclosed publicrooms
Public rest rooms for Ladiesand Gents with soap and cleantowels, a washbasin withrunning hot and cold water, amirror, a sanitary bin with lid inunisex & ladies toilet
Ramps with anti-slip floors andhandrails at the entrance.Minimum door width should be
Where bath-tubs are offered, ashower with shower curtains willsuffice
In 4* plus hotels,some rooms shouldoffer this option to guests.In public areas
In Public Area
Where not provided in bathroom,must be available on request.
Size would depend on check inpattern.
Manned minimum 16 hours a day.Call service 24 hours
Temperatures to be between 20 -28degrees celcius
In 1* and 2* hotels, this may beunisex.(4* & above should havefacility for physically challengedpersons)
Wheelchair access with suitabletable in atleast one restaurant.
N N N
N N N
N N N
D D
N
N N N
D N N
D N N
N N N
N N N
N N N
N N
N N N
D N N
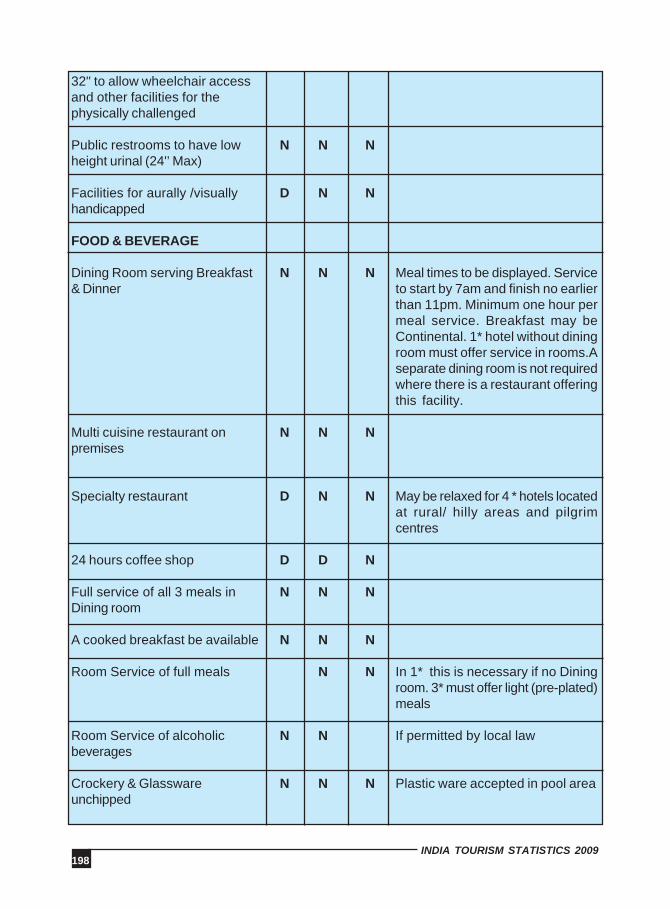
198INDIA TOURISM STATISTICS 2009
32" to allow wheelchair accessand other facilities for thephysically challenged
Public restrooms to have lowheight urinal (24'’ Max)
Facilities for aurally /visuallyhandicapped
FOOD & BEVERAGE
Dining Room serving Breakfast& Dinner
Multi cuisine restaurant onpremises
Specialty restaurant
24 hours coffee shop
Full service of all 3 meals inDining room
A cooked breakfast be available
Room Service of full meals
Room Service of alcoholicbeverages
Crockery & Glasswareunchipped
Meal times to be displayed. Serviceto start by 7am and finish no earlierthan 11pm. Minimum one hour permeal service. Breakfast may beContinental. 1* hotel without diningroom must offer service in rooms.Aseparate dining room is not requiredwhere there is a restaurant offeringthis facility.
May be relaxed for 4 * hotels locatedat rural/ hilly areas and pilgrimcentres
In 1* this is necessary if no Diningroom. 3* must offer light (pre-plated)meals
If permitted by local law
Plastic ware accepted in pool area
N N N
D N N
N N N
N N N
D N N
D D N
N N N
N N N
N N
N N
N N N
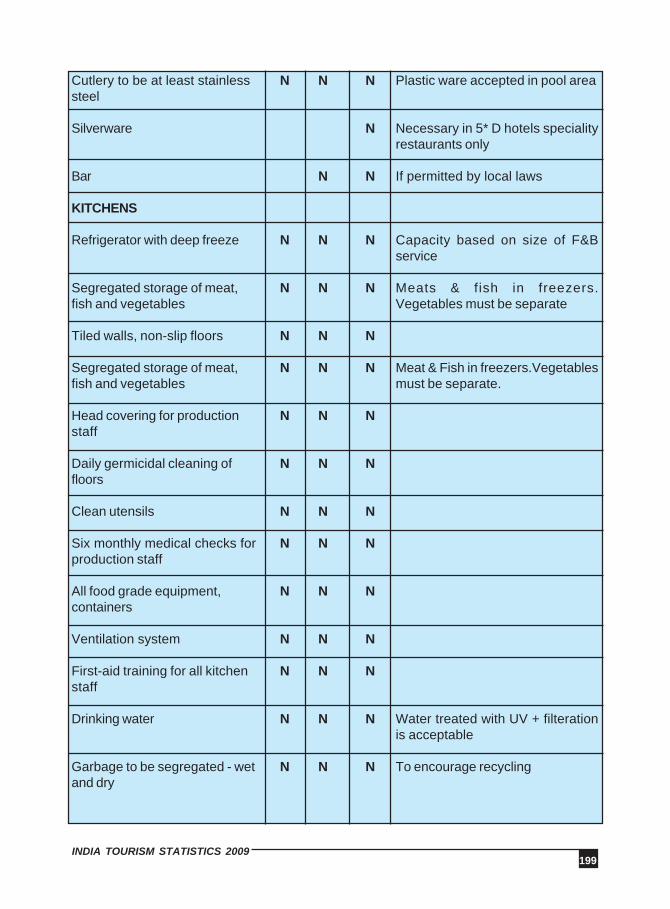
199INDIA TOURISM STATISTICS 2009
Cutlery to be at least stainlesssteel
Silverware
Bar
KITCHENS
Refrigerator with deep freeze
Segregated storage of meat,fish and vegetables
Tiled walls, non-slip floors
Segregated storage of meat,fish and vegetables
Head covering for productionstaff
Daily germicidal cleaning offloors
Clean utensils
Six monthly medical checks forproduction staff
All food grade equipment,containers
Ventilation system
First-aid training for all kitchenstaff
Drinking water
Garbage to be segregated - wetand dry
Plastic ware accepted in pool area
Necessary in 5* D hotels specialityrestaurants only
If permitted by local laws
Capacity based on size of F&Bservice
Meats & fish in freezers.Vegetables must be separate
Meat & Fish in freezers.Vegetablesmust be separate.
Water treated with UV + filterationis acceptable
To encourage recycling
N N N
N
N N
N N N
N N N
N N N
N N N
N N N
N N N
N N N
N N N
N N N
N N N
N N N
N N N
N N N
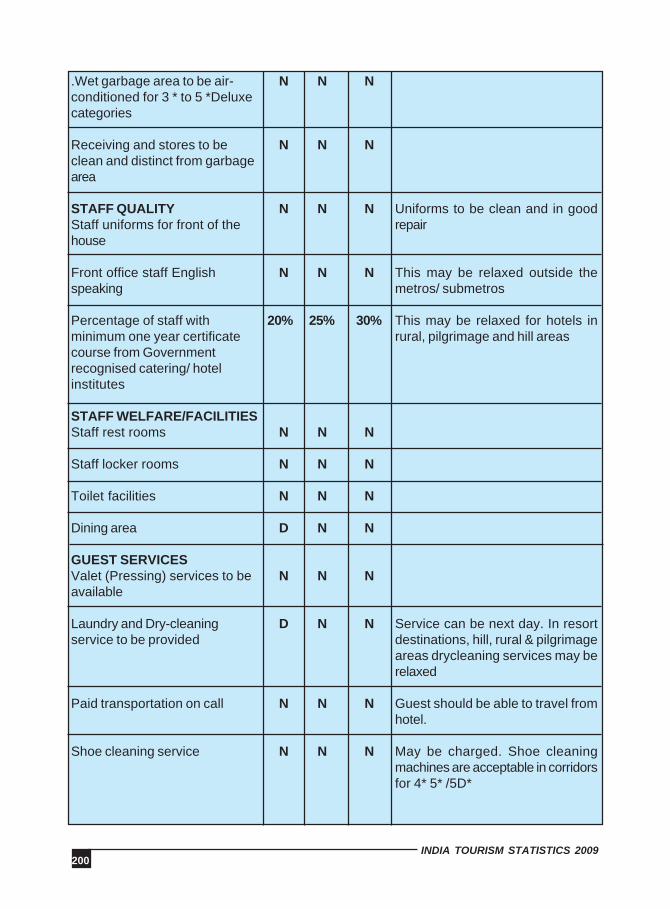
200INDIA TOURISM STATISTICS 2009
.Wet garbage area to be air-conditioned for 3 * to 5 *Deluxecategories
Receiving and stores to beclean and distinct from garbagearea
STAFF QUALITYStaff uniforms for front of thehouse
Front office staff Englishspeaking
Percentage of staff withminimum one year certificatecourse from Governmentrecognised catering/ hotelinstitutes
STAFF WELFARE/FACILITIESStaff rest rooms
Staff locker rooms
Toilet facilities
Dining area
GUEST SERVICESValet (Pressing) services to beavailable
Laundry and Dry-cleaningservice to be provided
Paid transportation on call
Shoe cleaning service
Uniforms to be clean and in goodrepair
This may be relaxed outside themetros/ submetros
This may be relaxed for hotels inrural, pilgrimage and hill areas
Service can be next day. In resortdestinations, hill, rural & pilgrimageareas drycleaning services may berelaxed
Guest should be able to travel fromhotel.
May be charged. Shoe cleaningmachines are acceptable in corridorsfor 4* 5* /5D*
N N N
N N N
N N N
N N N
20% 25% 30%
N N N
N N N
N N N
D N N
N N N
D N N
N N N
N N N
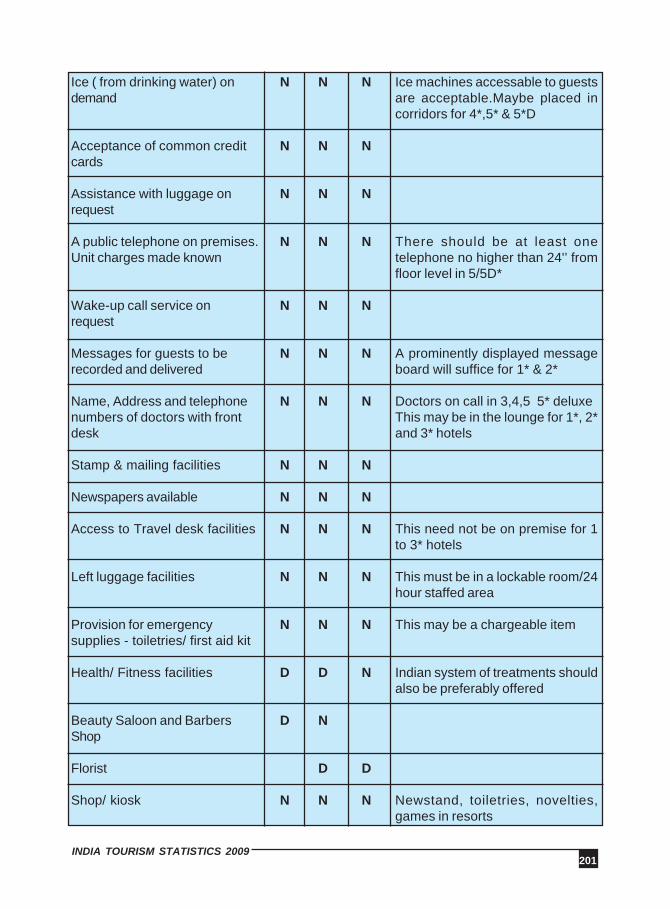
201INDIA TOURISM STATISTICS 2009
Ice ( from drinking water) ondemand
Acceptance of common creditcards
Assistance with luggage onrequest
A public telephone on premises.Unit charges made known
Wake-up call service onrequest
Messages for guests to berecorded and delivered
Name, Address and telephonenumbers of doctors with frontdesk
Stamp & mailing facilities
Newspapers available
Access to Travel desk facilities
Left luggage facilities
Provision for emergencysupplies - toiletries/ first aid kit
Health/ Fitness facilities
Beauty Saloon and BarbersShop
Florist
Shop/ kiosk
Ice machines accessable to guestsare acceptable.Maybe placed incorridors for 4*,5* & 5*D
There should be at least onetelephone no higher than 24'’ fromfloor level in 5/5D*
A prominently displayed messageboard will suffice for 1* & 2*
Doctors on call in 3,4,5 5* deluxeThis may be in the lounge for 1*, 2*and 3* hotels
This need not be on premise for 1to 3* hotels
This must be in a lockable room/24hour staffed area
This may be a chargeable item
Indian system of treatments shouldalso be preferably offered
Newstand, toiletries, novelties,games in resorts
N N N
N N N
N N N
N N N
N N N
N N N
N N N
N N N
N N N
N N N
N N N
N N N
D D N
D N
D D
N N N

202INDIA TOURISM STATISTICS 2009
Money changing facilities
Bookshop
SAFETY & SECURITYStaff trained in fire fighting drill
Security arrangements for allhotel entrances
Each bedroom door fitted withlock and key, viewport/peephole & internal securingdevice
Safekeeping facilities available
Smoke detectors
Safe-keeping facilities available
Smoke detectors
Fire and emergency procedurenotices displayed in roomsbehind door
Fire and emergency alarmsshould have visual & audiblesignals.
First aid kit with Over theCounter medicines with frontdesk
COMMUNICATION FACILITIESA telephone for incoming &outgoing calls in the room
PC available for guest use withinternet access
E-mail service
Quarterly drill or as per law
A safety chain/ wishbone latch isacceptable in place of viewport/peephole
These can be battery operated
4* plus should have direct dial andSTD/ISD facilities. 1*,2* and 3*may go through exchange
This can be a paid service. Upto 3*,PC can be in excutive offices.Internet subject to local accessbeing available
Subject to local internet accessbeing available
D N N
D N N
N N N
N N N
N N N
N N N
N N N
N N N
N N N
N N N
N N N
N N N
N N N
N N N
N N N
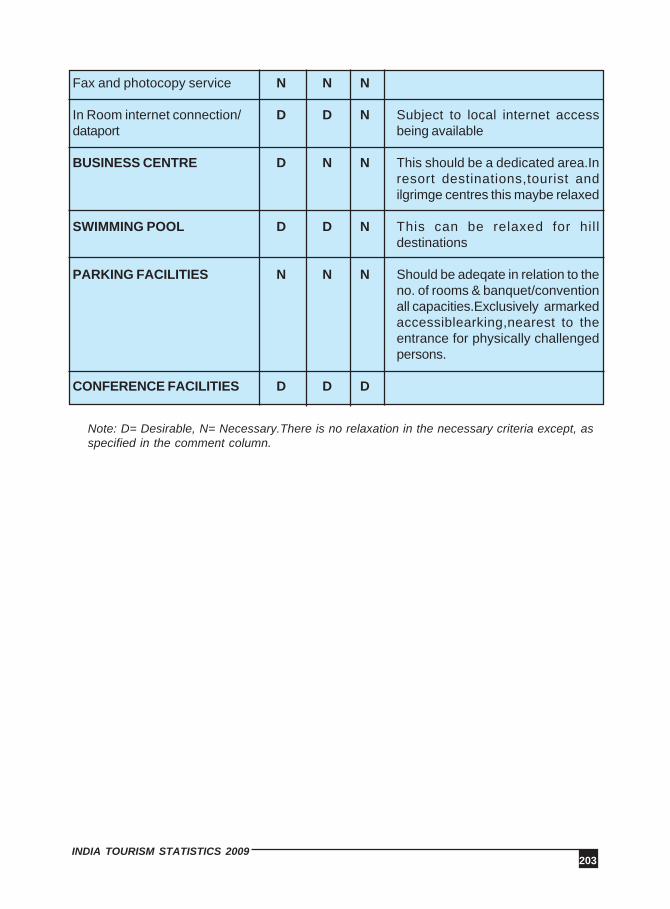
203INDIA TOURISM STATISTICS 2009
Fax and photocopy service
In Room internet connection/dataport
BUSINESS CENTRE
SWIMMING POOL
PARKING FACILITIES
CONFERENCE FACILITIES
Subject to local internet accessbeing available
This should be a dedicated area.Inresort destinations,tourist andilgrimge centres this maybe relaxed
This can be relaxed for hilldestinations
Should be adeqate in relation to theno. of rooms & banquet/conventionall capacities.Exclusively armarkedaccessiblearking,nearest to theentrance for physically challengedpersons.
Note: D= Desirable, N= Necessary.There is no relaxation in the necessary criteria except, asspecified in the comment column.
N N N
D D N
D N N
D D N
N N N
D D D
205INDIA TOURISM STATISTICS 2009
APPENDIX-V
GUIDELINES FOR APPROVAL AND REGISTRATION OFINCREDIBLE INDIA BED AND BREAKFAST
ESTABLISHMENTS
INTRODUCTION
Hotels and other supplementary accommodation are an integral part of a tourist’svisit to a place and the services offered by them can make his/her visit memorable. With theaim of providing comfortable Home Stay Facilities of Standardized World Class Services tothe tourists, and to supplement the availability of accommodation in the Metros and touristdestinations, Ministry of Tourism will classify fully operational rooms of Home Stay Facilitiesas “Incredible India Bed and Breakfast (B&B) Establishments”. The basic idea is to providea clean and affordable place for foreigners and domestic tourists alike including an opportunityfor foreign tourists to stay with an Indian family to experience Indian customs and traditionsand relish authentic Indian cuisine.
The Bed & Breakfast facilities will be categorized as follows:-
(a)Silver(b) Gold
The Regional Classification Committee, as specified in the guidelines, will inspectand assess the Bed & Breakfast Establishments, based on facilities and services offered.The details of the standards, facilities, services and the documents required for approval ofsuch establishments will be as per these guidelines.
Bed & Breakfast Establishments, once approved by Ministry of Tourism, will beduly publicized. A directory of all such approved establishments will also be prepared, so asto enable domestic as well as foreign tourists to live in a homely environment and to takeadvantage of the scheme. In addition, efforts will be made to organize short term training inhospitality trade to those who would opt for such training.
DETAILED GUIDELINES
1. The classification for B&B establishment will be given only in those cases wherethe owner /promoter of the establishment along with his /her family is physicallyresiding in the same establishment and letting out minimum one room and maximumfive rooms (10 beds).
2. The scheme will be on Bed and Breakfast basis and charges will have to be leviedaccordingly. The type of breakfast to be offered will have to be specified, the chargeswill have to be displayed and the visitors will have to be informed in advance so asto avoid unnecessary dispute.
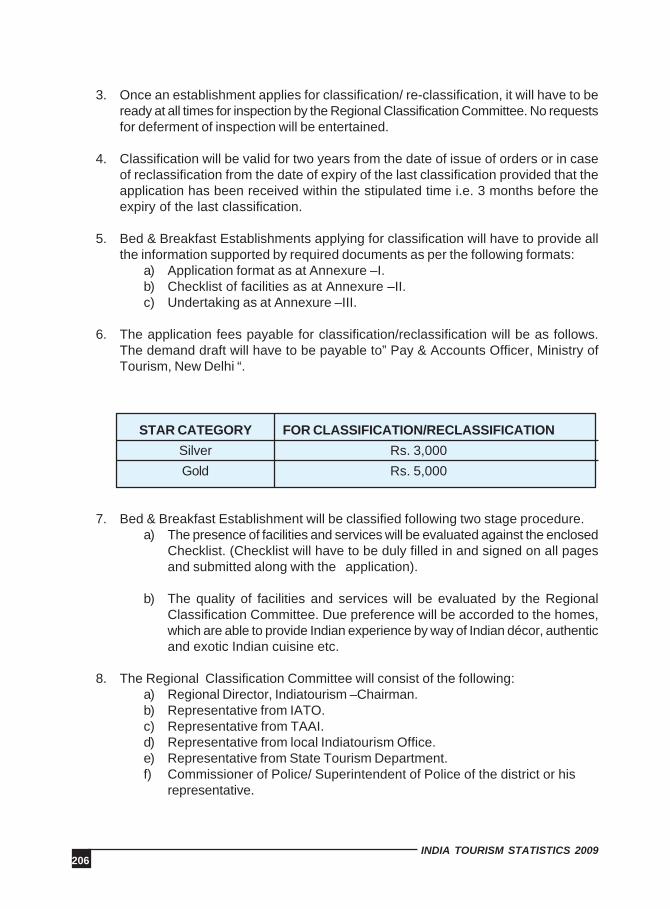
206INDIA TOURISM STATISTICS 2009
3. Once an establishment applies for classification/ re-classification, it will have to beready at all times for inspection by the Regional Classification Committee. No requestsfor deferment of inspection will be entertained.
4. Classification will be valid for two years from the date of issue of orders or in caseof reclassification from the date of expiry of the last classification provided that theapplication has been received within the stipulated time i.e. 3 months before theexpiry of the last classification.
5. Bed & Breakfast Establishments applying for classification will have to provide allthe information supported by required documents as per the following formats:
a) Application format as at Annexure –I.b) Checklist of facilities as at Annexure –II.c) Undertaking as at Annexure –III.
6. The application fees payable for classification/reclassification will be as follows.The demand draft will have to be payable to” Pay & Accounts Officer, Ministry ofTourism, New Delhi “.
STAR CATEGORY FOR CLASSIFICATION/RECLASSIFICATION
Silver Rs. 3,000Gold Rs. 5,000
7. Bed & Breakfast Establishment will be classified following two stage procedure.a) The presence of facilities and services will be evaluated against the enclosed
Checklist. (Checklist will have to be duly filled in and signed on all pagesand submitted along with the application).
b) The quality of facilities and services will be evaluated by the RegionalClassification Committee. Due preference will be accorded to the homes,which are able to provide Indian experience by way of Indian décor, authenticand exotic Indian cuisine etc.
8. The Regional Classification Committee will consist of the following:a) Regional Director, Indiatourism –Chairman.b) Representative from IATO.c) Representative from TAAI.d) Representative from local Indiatourism Office.e) Representative from State Tourism Department.f) Commissioner of Police/ Superintendent of Police of the district or his
representative.
207INDIA TOURISM STATISTICS 2009
9. The Chairman and any 2 members, where the presence of the police representative willbe mandatory, will constitute a quorum. The recommendation of the Committee will beapproved by the Chairman Hotel and Restaurant Approval and Classification Committee(HRACC).
10. Any deficiencies/rectifications pointed out by the Regional Classification Committeewill have to be complied within the stipulated time which will be allotted in consultationwith the representative /representatives of the establishment during inspection. Failureto do so will result in rejection of the application.
11. The Committee may recommend to the Chairman, HRACC a category either higher orlower than the one applied for. In case the category applied for is higher than the onerecommended by the Committee, then the applicant will have to deposit the requiredfee for the recommended category. However, in case of the category recommendedbeing lower than the one applied for, then there will be no refund of extra classificationfee.
12. The Bed & Breakfast Establishment will be expected to maintain required standards atall times. The Chairman, HRACC could authorize a surprise inspection of theestablishment at any time without previous notice.
13. Any changes in the facilities of the Bed & Breakfast Establishment will have to beinformed to the Regional Director, Indiatourism Office, within 30 days. If any violationof this comes to the notice of the Committee then the classification will stand withdrawn/terminated.
14. All cases of classification would be finalised within 30 days of the application beingmade to the Regional Director concerned complete in all respect.
15. In case of any dissatisfaction with the decision of HRACC, the establishment mayappeal to Secretary, Ministry of Tourism, Government of India for review andreconsideration within 30 days of receiving the communication regarding classification/reclassification. No requests will be entertained beyond this period.
16. Ministry of Tourism, Government of India reserves the right to modify the guidelines/terms and conditions from time to time.
17. The rate of taxes for property, electricity and water to be paid for classified B&BEstablishments will be those prescribed by the appropriate authorities.
Note: Items No. 5 (c) 6, 8, and 15 may be suitably amended by the State Government/UT.
WHERE TO APPLY
The applications along with the requisite fees may be sent to:-
1. Regional Director (North), India tourism, 88 Janpath, New Delhi -110001.
208INDIA TOURISM STATISTICS 2009
Tel: 011-23320005/8 (for States of Jammu & Kashmir, Himachal Pradesh, Punjab,Haryana, Uttranchal, NCT of Delhi, UT of Chandigarh and Uttar Pradesh exceptAgra and Varanasi).
2. Regional Director (West), Indiatourism, 123 M. Karve Road, Mumbai -400020.Tel:022-22033144 (for States of Gujarat, Chattisgarh, UT of Daman & Diu, Dadra NagarHaveli and Maharashtra except Aurangabad).
3 Regional Director (South), Indiatourism, 154 Anna Sallai, Chennai -600002. Tel:044- 28460193 (for States of Tamil Nadu and UT of Lakshwadweep).
4 Regional Director (East), Indiatourism, “Embassy”, 4 Shakespeare Sarani, Kolkata-700071. Tel: 033 -22825813 (for States of West Bengal and Jharkhand).
5 Regional Director (North- East), Indiatourism, Amravati Path, Christian Basti, G.S.Road, Guwahati -781007. Tel: 0361- 2341603 (for States of Assam, Tripura, Mizoram,Nagaland, and Sikkim).
6. Director, Indiatourism, KFC Building, 48 Church Street, Bangalore -560001,Karnataka. Tel: 080-25585417 (for the State of Karnataka).
7. Director, Indiatourism, State Hotel, Khasa Kothi, Jaipur- 302001. Tel: 0141-2372200 (for the State of Rajasthan).
8. Director, Indiatourism, Sudama Palace, Kankar Bagh Road, Patna-800020, Bihar.Tel: 0612-2345776 (for the State of Bihar).
9. Manager, Indiatourism, 191, The Mall, Agra- 282001, Uttar Pradesh. Tel: 0562-2226378 (for the city of Agra).
10. Manager, Indiatourism, 15-B, The Mall, Varanasi – 221001, Uttar Pradesh. Tel:0542- 2501784 (for the city of Varanasi).
11. Manager, Indiatourism, B/21B.J.B. Nagar, Bhubaneshwar -751014, Orissa. Tel:0674-2432203 (for the State of Orissa).
12. Manager, Indiatourism, Near Western Group of Temples, Khajuraho -471606,Madhya Pradesh. Tel: 07686- 242347 (for the State of Madhya Pradesh).
13. Manager, Indiatourism, VIP Road, 189, IInd Floor, Port Blair-744103, Andaman&Nicobar Islands. Tel: 03192- 236348 (for the UT of Andaman & Nicobar Islands).
14. Manager, Indiatourism, 3-60-140, IInd floor, Netaji Bhawan, Liberty Road, HimayatNagar, Hyderabad -500029, Andhra Pradesh. Tel: 040-23261360 (for the State ofAndhra Pradesh).
209INDIA TOURISM STATISTICS 2009
15. Manager, Indiatourism, Willingdon Island, Kochi -682009, Kerala. Tel: 0484-2668352 (for the State of Kerala).
16. Manager, Indiatourism, Communidade Building, Church Square, Panaji -403001,Goa. Tel: 0832-2223412 (for the State of Goa).
17. Manager, Indiatourism, ‘Krishna Vilas’, Station Road, Aurangabad -431005,Maharashtra. Tel: 0240- 2364999 (for the city of Aurangabad).
18. Manager, Indiatourism, U Tirot Singh Syiem Road, Police Bazaar, Shillong -793001,Meghalaya. Tel: 0364-225632 (for the State of Meghalaya).
19. Manager, Indiatourism, Sector ‘C’, Barapani Police Point, Naharlagun -791110,Arunachal Pradesh. Tel: 0360-2244328 (for the State of Arunachal Pradesh).
20. Manager, Indiatourism, Old Lambu Lane, Jail Road, Imphal -795001, Manipur. Tel:03852-221131 (for the State of Manipur).
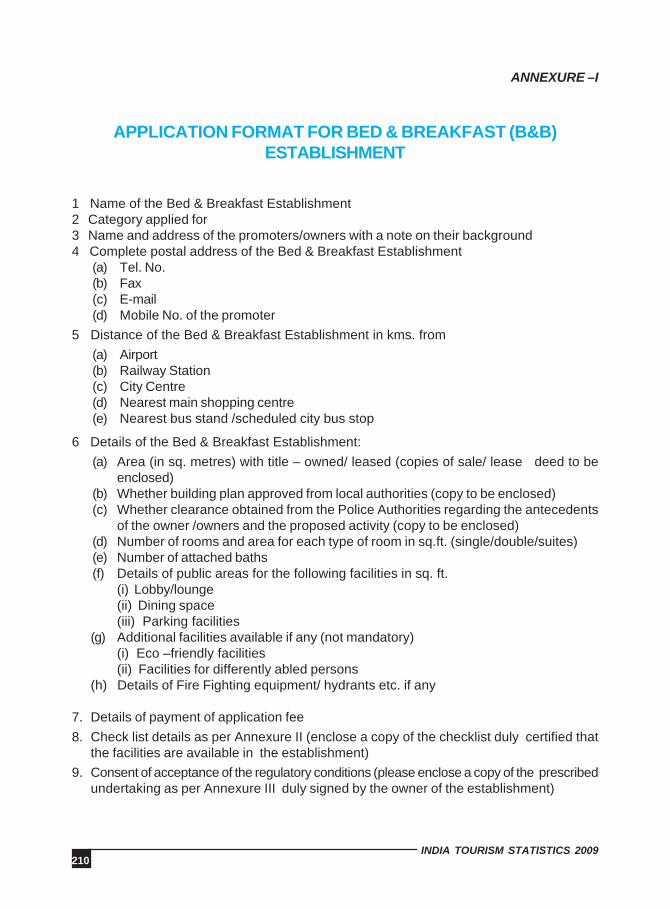
210INDIA TOURISM STATISTICS 2009
ANNEXURE –I
APPLICATION FORMAT FOR BED & BREAKFAST (B&B)ESTABLISHMENT
1 Name of the Bed & Breakfast Establishment2 Category applied for3 Name and address of the promoters/owners with a note on their background4 Complete postal address of the Bed & Breakfast Establishment
(a) Tel. No.(b) Fax(c) E-mail(d) Mobile No. of the promoter
5 Distance of the Bed & Breakfast Establishment in kms. from(a) Airport(b) Railway Station(c) City Centre(d) Nearest main shopping centre(e) Nearest bus stand /scheduled city bus stop
6 Details of the Bed & Breakfast Establishment:(a) Area (in sq. metres) with title – owned/ leased (copies of sale/ lease deed to be
enclosed)(b) Whether building plan approved from local authorities (copy to be enclosed)(c) Whether clearance obtained from the Police Authorities regarding the antecedents
of the owner /owners and the proposed activity (copy to be enclosed)(d) Number of rooms and area for each type of room in sq.ft. (single/double/suites)(e) Number of attached baths(f) Details of public areas for the following facilities in sq. ft.
(i) Lobby/lounge(ii) Dining space(iii) Parking facilities
(g) Additional facilities available if any (not mandatory)(i) Eco –friendly facilities(ii) Facilities for differently abled persons
(h) Details of Fire Fighting equipment/ hydrants etc. if any
7. Details of payment of application fee8. Check list details as per Annexure II (enclose a copy of the checklist duly certified that
the facilities are available in the establishment)9. Consent of acceptance of the regulatory conditions (please enclose a copy of the prescribed
undertaking as per Annexure III duly signed by the owner of the establishment)
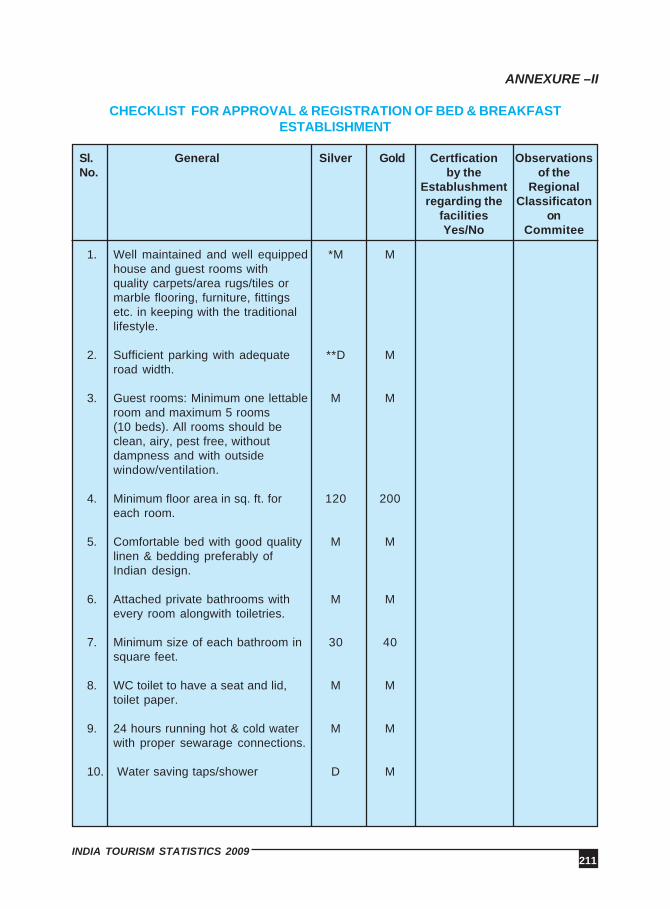
211INDIA TOURISM STATISTICS 2009
ANNEXURE –II
CHECKLIST FOR APPROVAL & REGISTRATION OF BED & BREAKFASTESTABLISHMENT
Sl. General Silver Gold Certfication ObservationsNo. by the of the
Establushment Regionalregarding the Classificaton
facilities onYes/No Commitee
1. Well maintained and well equipped *M Mhouse and guest rooms withquality carpets/area rugs/tiles ormarble flooring, furniture, fittingsetc. in keeping with the traditionallifestyle.
2. Sufficient parking with adequate **D Mroad width.
3. Guest rooms: Minimum one lettable M Mroom and maximum 5 rooms(10 beds). All rooms should beclean, airy, pest free, withoutdampness and with outsidewindow/ventilation.
4. Minimum floor area in sq. ft. for 120 200each room.
5. Comfortable bed with good quality M Mlinen & bedding preferably ofIndian design.
6. Attached private bathrooms with M Mevery room alongwith toiletries.
7. Minimum size of each bathroom in 30 40square feet.
8. WC toilet to have a seat and lid, M Mtoilet paper.
9. 24 hours running hot & cold water M Mwith proper sewarage connections.
10. Water saving taps/shower D M
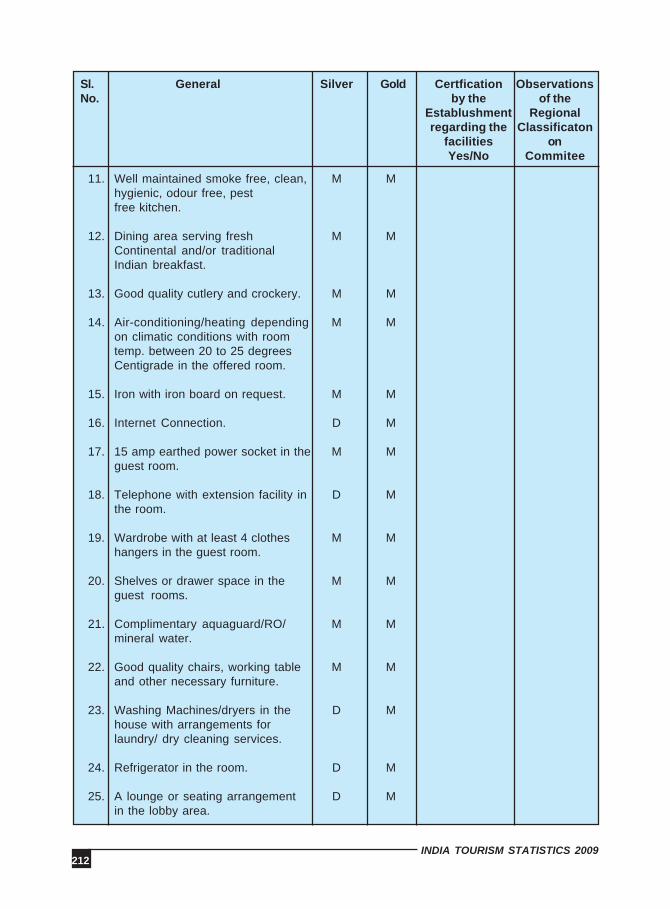
212INDIA TOURISM STATISTICS 2009
11. Well maintained smoke free, clean, M Mhygienic, odour free, pestfree kitchen.
12. Dining area serving fresh M MContinental and/or traditionalIndian breakfast.
13. Good quality cutlery and crockery. M M
14. Air-conditioning/heating depending M Mon climatic conditions with roomtemp. between 20 to 25 degreesCentigrade in the offered room.
15. Iron with iron board on request. M M
16. Internet Connection. D M
17. 15 amp earthed power socket in the M Mguest room.
18. Telephone with extension facility in D Mthe room.
19. Wardrobe with at least 4 clothes M Mhangers in the guest room.
20. Shelves or drawer space in the M Mguest rooms.
21. Complimentary aquaguard/RO/ M Mmineral water.
22. Good quality chairs, working table M Mand other necessary furniture.
23. Washing Machines/dryers in the D Mhouse with arrangements forlaundry/ dry cleaning services.
24. Refrigerator in the room. D M
25. A lounge or seating arrangement D Min the lobby area.
Sl. General Silver Gold Certfication ObservationsNo. by the of the
Establushment Regionalregarding the Classificaton
facilities onYes/No Commitee

213INDIA TOURISM STATISTICS 2009
26. Heating and cooling to be provided D Min enclosed public rooms.
27. Garbage disposal facilities as per M MMunicipal laws.
28. Acceptance of cash/ cheque/ D.D. M M
29. Message facilities for guests . M M
30. Name, address and telephone M Mnumber of doctors.
31. Left luggage facilities. M M
32. Assistance with luggage, on D Mrequest.
33. Safekeeping facilities in the room. D M
34. Smoke/heat detectors in the house. D D
35. Security guard facilities. D M
36. Maintenance of register for guest M Mcheck-in and check-out recordsincluding passport details in caseof foreign tourists.
* ‘M’ stands for mandatory** ‘D’ stands for desirable.
Note:- The grading in the various categories will depend on the quality of accommodation, facilities andservices provided.
Sl. General Silver Gold Certfication ObservationsNo. by the of the
Establushment Regionalregarding the Classificaton
facilities onYes/No Commitee
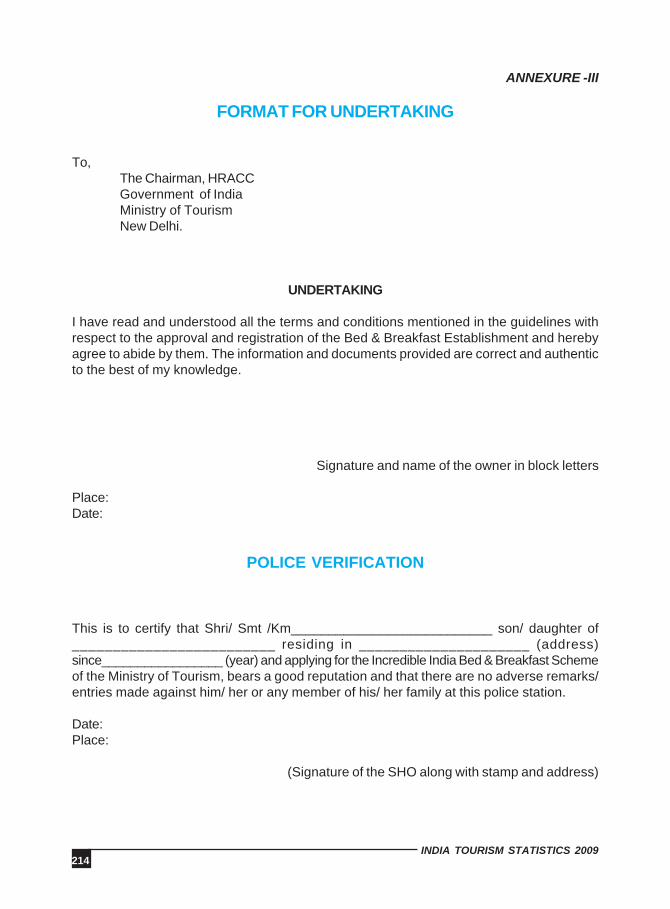
214INDIA TOURISM STATISTICS 2009
ANNEXURE -III
FORMAT FOR UNDERTAKING
To,The Chairman, HRACCGovernment of IndiaMinistry of TourismNew Delhi.
UNDERTAKING
I have read and understood all the terms and conditions mentioned in the guidelines withrespect to the approval and registration of the Bed & Breakfast Establishment and herebyagree to abide by them. The information and documents provided are correct and authenticto the best of my knowledge.
Signature and name of the owner in block letters
Place:Date:
POLICE VERIFICATION
This is to certify that Shri/ Smt /Km___________________________ son/ daughter of_________________________ residing in _____________________ (address)since_________________ (year) and applying for the Incredible India Bed & Breakfast Schemeof the Ministry of Tourism, bears a good reputation and that there are no adverse remarks/entries made against him/ her or any member of his/ her family at this police station.
Date:Place:
(Signature of the SHO along with stamp and address)
215INDIA TOURISM STATISTICS 2009
GUIDELINES FOR RECOGNITION / RENEWAL AS AN APPROVEDTRAVEL AGENT
[Revised with effect from 4th December 2009]
1. The aims and objectives of the scheme for recognition of Travel Agent are to encouragequality standard and service in this category so as to promote tourism in India. Thisis a voluntary scheme open to all bonafide travel agencies to bring them in organizedsector.
2. Definition: A Travel Agent is one who makes arrangements of tickets for travel byair, rail, ship, passport, visa, etc. It may also arrange accommodation, tours,entertainment and other tourism related services.
3. The application for recognition shall be addressed to the Additional Director General,Ministry of Tourism, Transport Bhawan, No.1, Parliament Street, New Delhi-110001.
4. The recognition as an approved Travel Agent shall be granted by the Ministry ofTourism, Government of India, New Delhi initially, for five years, based on theInspection Report / Recommendations of a Committee comprising of concernedRegional Director and a member of TAAI.
5. The application for renewal/extension shall be addressed to the Regional Director ofthe concerned region as per the following addresses:-
a) The Regional Director (East), India Tourism, “Embassy”, 4, Shakespeare Sarani,Kolkata – 700 071, West Bengal. Phone No. (033) 2282 5813 / 2282 1475, Fax:(033) 2282 3521, Email: [email protected]
b) The Regional Director (West), India Tourism, 123, M. Karve Road, Opp. ChurchGate, Mumbai – 400 020, Maharashtra. Phone No. (022) 2208 3263 / 2207 4333/ 2207 4334, Fax: (022) 2201 4496, Email: [email protected],[email protected]
c) The Regional Director (North), India Tourism, 88 – Janpath, New Delhi 110 001.Phone No. (011) 2332 0342 / 2332 0005 / 2332 0008, Fax: (011) 2332 0109,Email: [email protected]
d) The Regional Director (South), India Tourism, 154, Anna Salai, Chennai – 600002, Tamil Nadu. Phone No. (044) 2846 0285 / 2846 1459, Fax: (044) 28460193, Email: [email protected], [email protected]
e) The Regional Director (North – East), India Tourism, Asom Paryatan Bhawan,3rd Floor, Near Nepali Mandir, A. K. Azad Road, Paltan Bazar, Guwahati – 781008, Assam. Phone No. (0361) 273 7554, Fax No. (0361) 273 7553, Email:[email protected]
6. The renewal / extension, thereafter, shall be granted for five years after Inspectionconducted by a Committee comprising of concerned Regional Director and a member
APPENDIX-VI

216INDIA TOURISM STATISTICS 2009
of TAAI, on an application made by the Travel Agent along with the requisite fee /documents.
7. The documents received from applicants after scrutiny in all respects will beacknowledged by the Travel Trade Division in respect of first approval and by theconcerned Regional Director for renewal. The inspection for first approval / renewalshall be conducted by the Inspection Team within a period of sixty working daysfrom the receipt of complete application.
8. The following conditions must be fulfilled by the Travel Agency for grant of recognitionby Ministry of Tourism:-
i) The application for grant of recognition / renewal shall be in the prescribedform and submitted in duplicate along with the required documents.
ii) The travel Agency should have a minimum Paid up Capital or (Capitalemployed) of Rs.3.00 lakh duly supported by the Audited Balance Sheet/Chartered Accountant’s Certificate.
iii) The Travel Agency should be approved by International Air TransportAssociation (IATA) or should be General Sales Agent (GSA) / PassengerSales Agent (PSA) of an IATA member Airlines.
iv) The Travel Agency should have been in operation for a minimum period ofone year before the date of application.
v) The minimum office space should be at least 150 sq. ft for rest of India and100 sq. ft for hilly areas which are above 1000 meters from sea level.Besides, the office may be located in a neat and clean surrounding andequipped with telephone, fax and computer reservation system etc. Thereshould be sufficient space for reception and easy access to toilet facilities.
vi) The Travel Agency should be under the charge of the Owner or a full timemember who is adequately trained, experienced in matters regarding ticketing,itineraries, transport, accommodation facilities, currency, customs regulationsand tourism and travel related services. Besides this, greater emphasismay be given to effective communication skills, knowledge of foreignlanguages, other than English.
There should be a minimum of four qualified staff out of which at least oneshould have Diploma / Degree in Tourism & Travel Management from arecognized University, IITTM or an institution approved by AICTE. The ownerof the firm would be included as one of the qualified employees.
The academic qualifications may be relaxed in case of the other two staffmembers who are exceptionally experienced personnel in Airlines, Shipping,Transport and PR agencies, Hotel and other Corporate Bodies and those whohave worked for three years with IATA / UFTA agencies and also those whohave two years experience with Ministry of Tourism approved Travel Agencies.
For the agencies located in the North – Eastern region, remote and ruralareas, there should be a minimum of two staff out of which one should be aqualified employee with a Diploma / Degree in Tourism & Travel Management
217INDIA TOURISM STATISTICS 2009
from a recognized University, IITTM or an institution approved by AICTE.The owner of the firm would be included as one of the qualified employees.
vii) The Travel Agency should be an income-tax assessee and should have filedIncome Tax Return for the current assessment year.
viii) Disclaimer: The Travel Agency should employ only Regional Level Guidestrained and licensed by Ministry of Tourism, Government of India and StateLevel Guides approved by the State Governments. The implementation ofthis clause would be subject to the decision of Hon’ble High Court of Rajasthanin Writ Petition No. 5607 / 2004 and other Hon’ble Courts.
ix) For outsourcing any of the services relating to tourists, the travel agenciesshall use approved specialized agencies in the specific field of activity.
9. The Travel Agency will be required to pay a non-refundable fee of Rs.3, 000/- whileapplying for the recognition and renewal of Head Office as well as each BranchOffice. The fee will be payable to the Pay and Accounts Officer, Ministry of Tourism,in the form of a Bank Draft.
10. The recognition / renewal will be granted to the Head Office of the Travel Agency.Branch Offices will be approved along with the Head Office or subsequently, providedthe particulars of the Branch Offices are submitted to Ministry of Tourism forrecognition and concerned Regional Director for renewal and accepted by it.
11. The Travel Agency so granted recognition / renewal shall be entitled to such incentivesand concessions as may be granted by the Government from time to time and shallabide by the terms and conditions of recognition as prescribed from time to time bythe Ministry of Tourism, Government of India.
12. Even though the scheme of granting approval of recognition to service providers ofTravel Trade is voluntary, in nature, there is a need to have a pro - active role ofMinistry of Tourism and Travel Trade to ensure that more and more service providersseek approval and then service the tourists. There is also a need to educate thestakeholders as well as consumers against the potential risk of availing servicesthrough the unapproved service providers.
13. It shall be mandatory for an approved service provider of Travel Trade to prominentlydisplay the Certificate of approval of recognition given by Ministry of Tourism in theoffice by pasting it on a board or in a picture frame so that it is visible to a potentialtourist.
14. The decision of the Ministry of Tourism, Government of India in the matter ofrecognition / renewal shall be final. However, MOT may in their discretion refuse torecognize / renew any firm or withdraw / withhold at any time recognition / renewalalready granted with the approval of the Competent Authority. Before such a decisionis taken, necessary Show Cause Notice would invariably be issued and the replyconsidered on merit. This will be done after careful consideration and generally asa last resort. Circumstances in which withdrawal is effected would also be indicated.
15. The guidelines including application form may be downloaded from websitewww.tourism.gov.in
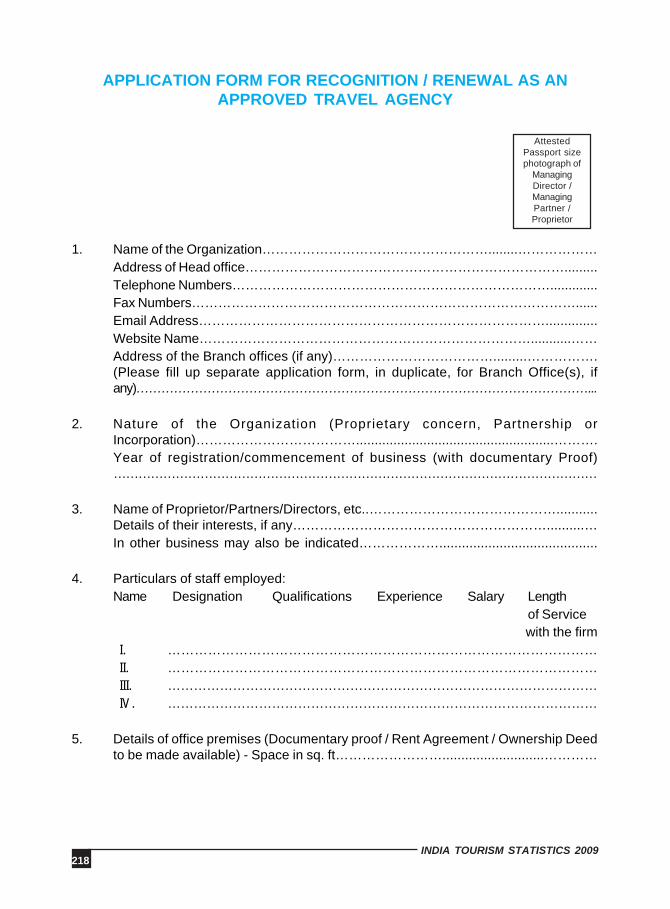
218INDIA TOURISM STATISTICS 2009
APPLICATION FORM FOR RECOGNITION / RENEWAL AS ANAPPROVED TRAVEL AGENCY
AttestedPassport sizephotograph of
ManagingDirector /ManagingPartner /Proprietor
1. Name of the Organization……………………………………………........………………Address of Head office……………………………………………………………….........Telephone Numbers……………………………………………………………….............Fax Numbers……………………………………………………………………………......Email Address……………………………………………………………………..............Website Name…………………………………………………………………...........……Address of the Branch offices (if any)……………………………….........…………….(Please fill up separate application form, in duplicate, for Branch Office(s), ifany)………………………………………………………………………………………………...
2. Nature of the Organization (Proprietary concern, Partnership orIncorporation)……………………………….....................................................……….Year of registration/commencement of business (with documentary Proof)………………………………………………………………………………………………………
3. Name of Proprietor/Partners/Directors, etc..……………………………………...........Details of their interests, if any…………………………………………………..........…In other business may also be indicated………………..........................................
4. Particulars of staff employed:Name Designation Qualifications Experience Salary Length
of Servicewith the firm
I. ……………………………………………………………………………………II. ……………………………………………………………………………………III. ………………………………………………………………………………………IV. ………………………………………………………………………………………
5. Details of office premises (Documentary proof / Rent Agreement / Ownership Deedto be made available) - Space in sq. ft……………………...........................…………

219INDIA TOURISM STATISTICS 2009
Location area (please tick mark the right category)commercial residentialReception area…………… …Accessibility to toilets (Please write Yes or No)………..........
6. Name of Bankers (please attach a reference letter on original letterhead from yourBankers)………………………………………………………………………….........…….
7. Name of Auditors…………………………………………………………………......…….A Balance - Sheet and Profit & Loss Statement pertaining to the travel business, asprescribed under Company Law, must be submitted by each applicant. These auditedstatements should be in respect of your establishment for the last completed financialyear or for the calendar year immediately preceding the date of submission of yourapplication. Also furnish details of your turnover in the following statement:-
Particulars of the Travel Agency concerned:
a) Paid up capital (Capital employed)…………….........…………………………………..b) Loans:
i) Secured ………………………………………………...………………………ii) Unsecured ………………………………………………..……………………..
c) Reserves …… …………………………………………………………………………….
d) Current liabilities and provisions ……………………………………….......…………..
e) Total (a to d): ……………………………………………………………...………………f) Fixed assets (excluding intangible assets). …………………………….....………….g) Investment …………………………………………………………………....……………h) Current assets …………………………………………………………………...………...i) Intangible Assets ………………………………………………………………...………..j) Total (f to i) ……………………………………………………………………....…………
Notes:i. Intangible assets should include goodwill expenses, tenancy and business rights,
deferred revenue expenditure, accumulated loss etc.ii. Reserves should include balance of profit and loss Account and exclude taxation
reserve.iii. Current liabilities and provisions would include taxation reserve.iv. Current assets should include sundry debts, loans advances, cash and bank balance.
8. A copy of Acknowledgement in respect of Income tax returns for the currentassessment year should be enclosed ………………………………………........……..
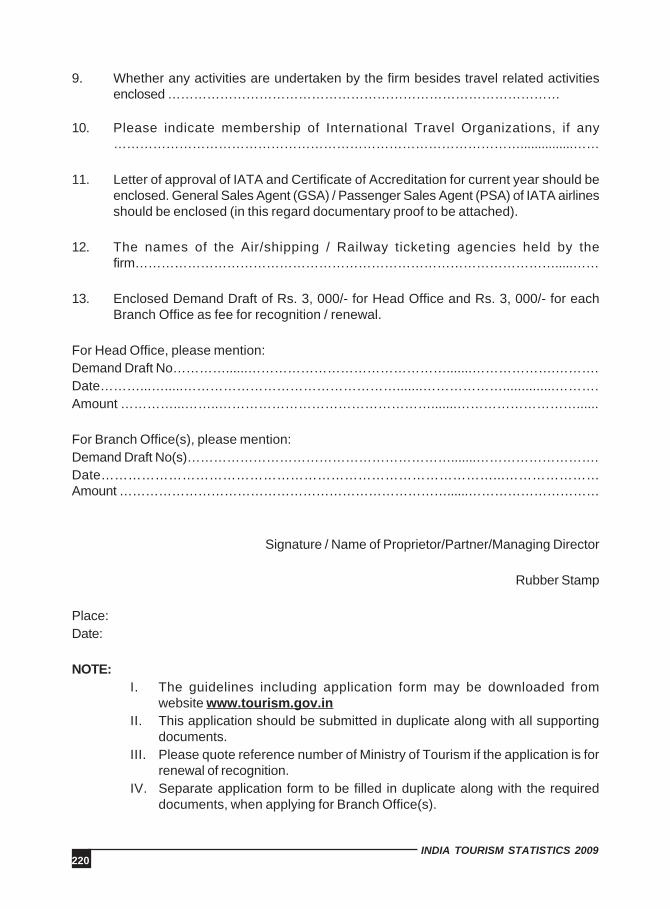
220INDIA TOURISM STATISTICS 2009
9. Whether any activities are undertaken by the firm besides travel related activitiesenclosed ………………………………………………………………………………
10. Please indicate membership of International Travel Organizations, if any…………………………………………………………………………………...............……
11. Letter of approval of IATA and Certificate of Accreditation for current year should beenclosed. General Sales Agent (GSA) / Passenger Sales Agent (PSA) of IATA airlinesshould be enclosed (in this regard documentary proof to be attached).
12. The names of the Air/shipping / Railway ticketing agencies held by thefirm…………………………………………………………………………………….....……
13. Enclosed Demand Draft of Rs. 3, 000/- for Head Office and Rs. 3, 000/- for eachBranch Office as fee for recognition / renewal.
For Head Office, please mention:Demand Draft No…………......……………………………………….......……………….……….Date………...….....………………………………………….......………………..............……….Amount …………...……..………………………………………….......………………………......
For Branch Office(s), please mention:Demand Draft No(s)…………………………………………………….......……………………….Date……………………………………………………………………………...…………………Amount …………………………………………………………………......…………………………
Signature / Name of Proprietor/Partner/Managing Director
Rubber Stamp
Place:Date:
NOTE:I. The guidelines including application form may be downloaded from
website www.tourism.gov.inII. This application should be submitted in duplicate along with all supporting
documents.III. Please quote reference number of Ministry of Tourism if the application is for
renewal of recognition.IV. Separate application form to be filled in duplicate along with the required
documents, when applying for Branch Office(s).
221INDIA TOURISM STATISTICS 2009
LIST OF DOCUMENTS (CHECK LIST) REQUIRED FOR FIRSTAPPROVAL / RENEWAL AS AN APPROVED TRAVEL AGENT
1. Application form in duplicate duly filled in.
2. Two attested photographs pasted on both the copies of application form.
3. Documentary proof (preferably registration certificates from Government) in supportof beginning of operations of your firm.
4. A copy of Complete Audited Balance Sheet for the latest financial year.
5. Income Tax Acknowledgement for the latest assessment year.
6. Service Tax Registration number from concerned authority.
7. Certificate of Chartered Accountant stating your Paid-up Capital not less than Rs.3.00 Lakh. For Travel Agents from the North – East region, remote and rural areas,the minimum Paid up Capital (or Capital employed) should be at least Rs. 50,000/-duly supported by the Chartered Accountant’s certificate.
8. A copy of IATA approval letter indicating Numerical Code Number and a copy of IATAAccreditation Certificate for the Current year.
9. Reference letter from Bank on its letterhead (Original) regarding your firm’s bankaccount.
10. The details of staff employed giving names, designation, educational qualification &experience in tourism field and length of service in your organization (copies ofcertificates to be enclosed):
a) There should be a minimum of four qualified staff out of which at least oneshould have Diploma / Degree in Tourism & Travel Management from a recognizedUniversity, IITTM or an institution approved by AICTE. The owner of the firmwould be included as one of the qualified employees.
b) The academic qualifications may be relaxed in case of the other two staffmembers who are exceptionally experienced personnel in Airlines, Shipping,Transport and PR agencies, Hotel and other Corporate Bodies and those whohave worked for three years with IATA / UFTA agencies and also those whohave two years experience with Ministry of Tourism approved Travel Agencies.
c) For the agencies located in the North – Eastern region, remote and rural areas,there should be a minimum of two staff out of which one should be a qualifiedemployee with a Diploma / Degree in Tourism & Travel Management from arecognized University, IITTM or an institution approved by AICTE. The owner ofthe firm would be included as one of the qualified employees.
222INDIA TOURISM STATISTICS 2009
****
11. List of Directors / Partners or name of the Proprietor.
12. Details of office premises, whether located in commercial or residential area, officespace in sq. ft. (the minimum office space should be at least 150 sq. ft for rest ofIndia and 100 sq. ft for hilly areas which are above 1000 meters from sea level) andaccessibility to toilet and reception area.
13. A Demand Draft for Rs. 3,000/- towards processing fees payable to Pay and AccountsOfficer, Ministry of Tourism, Government of India.
14. Documents duly attested by competent officer.
NOTE:
I. The above - mentioned documents may be submitted in duplicate.
II. Please fill up separate application form(s), in duplicate, for Branch Office(s), if any.
III. The guidelines including application form may be downloaded fromwebsite www.tourism.gov.in
223INDIA TOURISM STATISTICS 2009
GUIDELINES FOR RECOGNITION / RENEWAL AS AN APPROVEDINBOUND TOUR OPERATOR
[Revised with effect from 4th December 2009]
1. The aims and objectives of the scheme for recognition of Inbound Tour Operator are toencourage quality standard and service in this category so as to promote tourism inIndia and abroad. This is a voluntary scheme open to all bonafide tour operators tobring them in organized sector.
2. Definition: An Inbound tour operator is one who makes arrangements for transport,accommodation, sight seeing, entertainment and other tourism related services forforeign tourists.
3. The application for recognition shall be addressed to the Additional Director General,Ministry of Tourism, Transport Bhawan, 1, Parliament Street, New Delhi - 110 001.
4. The recognition as an approved Inbound Tour Operator shall be granted by the Ministryof Tourism, Government of India, New Delhi initially, for five years, based on theInspection Report / Recommendations of a Committee comprising of concernedRegional Director and a member of IATO.
5. The application for renewal/extension shall be addressed to the Regional Director ofthe concerned region as per the following addresses:-
a) The Regional Director (East), India Tourism, “Embassy”, 4, Shakespeare Sarani,Kolkata – 700 071, West Bengal. Phone No. (033) 2282 5813 / 2282 1475, Fax:(033) 2282 3521, Email: [email protected]
b) The Regional Director (West), India Tourism, 123, M. Karve Road, Opp. ChurchGate, Mumbai – 400 020, Maharashtra. Phone No. (022) 2208 3263 / 2207 4333 /2207 4334, Fax: (022) 2201 4496, Email: [email protected],[email protected]
c) The Regional Director (North), India Tourism, 88 – Janpath, New Delhi 110 001.Phone No. (011) 2332 0342 / 2332 0005 / 2332 0008, Fax: (011) 2332 0109,Email: [email protected]
d) The Regional Director (South), India Tourism, 154, Anna Salai, Chennai – 600002, Tamil Nadu. Phone No. (044) 2846 0285 / 2846 1459, Fax: (044) 2846 0193,Email: [email protected], [email protected]
e) The Regional Director (North – East), India Tourism, Asom Paryatan Bhawan, 3rd
Floor, Near Nepali Mandir, A. K. Azad Road, Paltan Bazar, Guwahati – 781 008,Assam. Phone No. (0361) 273 7554, Fax No. (0361) 273 7553, Email:[email protected]
6. The renewal / extension, thereafter, shall be granted for five years after inspection conductedby a Committee comprising of concerned Regional Director and a member of IATO, on anapplication made by the Tour Operator along with the requisite fee / documents.
APPENDIX-VII
224INDIA TOURISM STATISTICS 2009
7. The documents received from applicants after scrutiny in all respects will beacknowledged by the Travel Trade Division in respect of first approval and by theconcerned Regional Director for renewal. The inspection for first approval / renewalshall be conducted by the Inspection Team within a period of sixty working days fromthe receipt of complete application.
8. The following conditions must be fulfilled by the Inbound Tour Operator for grant ofrecognition / renewal by Ministry of Tourism:
i) The application for grant of recognition / renewal shall be in the prescribed form andsubmitted in duplicate along with the required documents.
ii) The Inbound Tour operators located in rest of India should have a minimum Paid upCapital (or Capital employed) of Rs.3.00 lakh and Rs. 50,000/- in the case of North –Eastern region, remote and rural areas, duly supported by the latest Audited BalanceSheet/Chartered Accountant’s certificate.
iii) The turn-over in terms of foreign exchange earnings by the firm from inbound touroperations only during the preceding financial year or calendar year should be aminimum of Rs. 25.00 lakh for rest of India and Rs. 5.00 lakh for the North – Easternregion, remote and rural areas duly supported by Chartered Accountant’s certificate.However, for the North – Eastern Region, the Chartered Accountant’s Certificateregarding turn – over of the firm in Rupee earnings would be treated as ForeignExchange earnings, provided there is documentary evidence that such earnings arefrom inbound tour operations only.
iv) The Inbound Tour operator should have an office under the charge of the owner or afull time member of their staff, who is adequately trained / experienced in mattersregarding transport, accommodation, currency, customs regulations and generalinformation about tourism and travel related services. However, greater emphasismay be given to effective communication skills and knowledge of foreign languageother than English.
There should be a minimum of four qualified staff out of which at least one shouldhave Diploma / Degree in Tourism & Travel Management from a recognizedUniversity, IITTM or an institution approved by AICTE. The owner of the firm wouldbe included as one of the qualified employees.
The academic qualifications may be relaxed in case of the other two staff memberswho are exceptionally experienced personnel in Airlines, Shipping, Transport, PRAgencies, Hotels and other corporate bodies and those who have two years experiencewith Ministry of Tourism approved tour operators.
For the agencies located in the North – Eastern region, remote and rural areas, thereshould be a minimum of two staff out of which one should be a qualified employeewith a Diploma / Degree in Tourism & Travel Management from a recognized University,IITTM or an institution approved by AICTE. The owner of the firm would be includedas one of the qualified employees.
v) The Inbound Tour Operator should have been in operation for a minimum period ofone year before the date of application.
vi) The minimum office space should be at least 150 sq. ft for rest of India and 100 sq.
225INDIA TOURISM STATISTICS 2009
ft for hilly areas which are above 1000 meters from sea level. Besides, the officemay be located in neat and clean surroundings and equipped with telephone, fax andcomputer reservation system etc. There should be sufficient space for reception andeasy access to toilets.
vii. The Inbound Tour operator should be an income tax assessee and should have filedIncome Tax Returns for the last or current assessment year.
viii. Disclaimer: The Inbound Tour Operator should employ only Regional Level Guidestrained and licensed by Ministry of Tourism, Government of India and State LevelGuides approved by the State Governments. The implementation of this clause wouldbe subject to the decision of Hon’ble High Court of Rajasthan in Writ Petition No.5607 / 2004 and other Hon’ble Courts.
ix. The Inbound Tour Operator shall contract / use approved specialized agencies in thefield of adventure options and related services for the tourists
9. The inbound tour operator will be required to pay a non - refundable fee of Rs.3, 000/-while applying for the recognition and renewal of Head Office as well as each BranchOffice. The fee will be made payable to the Pay & Accounts Officer, Ministry of Tourismin the form of a Bank Draft.
10. The recognition / renewal will be granted to the Head Office of the Inbound Tour Operator.Branch offices will be approved along with the Head Office or subsequently, provided theparticulars of the Branch offices are submitted to Ministry of Tourism for recognition andfor renewal to the concerned Regional Director and accepted by it.
11. The Inbound Tour Operator so granted recognition / renewal shall be entitled to suchincentives and concessions as may be granted by the Government from time to time andshall abide by the terms and conditions of recognition as prescribed from time to time bythe Ministry of Tourism, Government of India.
12. Even though the scheme of granting approval of recognition to service providers of TravelTrade is voluntary, in nature, there is a need to have a pro - active role of Ministry ofTourism and Travel Trade to ensure that more and more service providers seek approvaland then service the tourists. There is also a need to educate the stakeholders as well asconsumers against the potential risk of availing services through the unapproved serviceproviders.
13. It shall be mandatory for an approved service provider of Travel Trade to prominentlydisplay the Certificate of approval of recognition given by Ministry of Tourism in the officeby pasting it on a board or in a picture frame so that it is visible to a potential tourist.
14. The decision of the Ministry of Tourism, Government of India in the matter of recognition/ renewal shall be final. However, MOT may in their discretion refuse to recognize / renewany firm or withdraw / withhold at any time recognition / renewal already granted with theapproval of the Competent Authority. Before such a decision is taken, necessary ShowCause Notice would invariably be issued and the reply considered on merit. This will bedone after careful consideration and generally as a last resort. Circumstances in whichwithdrawal is effected would also be indicated.
15. The guidelines including application form may be downloaded from websitewww.tourism.gov.in

226INDIA TOURISM STATISTICS 2009
APPLICATION FORM FOR RECOGNITION / RENEWAL AS ANAPPROVED INBOUND TOUR OPERATOR
AttestedPassport sizephotograph of
ManagingDirector /ManagingPartner /Proprietor
1. Name of the Organization …………………………………………….............……………Address of Head office………………………………………………….…….................…Telephone Numbers……………………………………………………......……..…………..Fax Numbers…………………………………………………………......……………………Email Address…………………………………………………………....………..…………..Website Name…………………………………………………………........…………………Address of the Branch offices (if any)................................................................... ..(Please fill up separate application form, in duplicate for Branch Office(s),if any)..................................................................................................................
2. Nature of the Organization (Proprietary concern, Partnership or Incorporation)………………………………………………………………………………....................……Year of registration/commencement of business (with documentary proof)………………………………………………………………………………………………………
3. Name of Proprietor/ Partners/ Directors/ etc. ……………............………………………Details of their interests, if any ………………………………………………………………In other business may also be indicated…………………………………………...............
4. Particulars of staff employed:Name Designation Qualifications Experience Salary Length
of Servicewith the firm
I. ……………………………………………………………......…………………………………II. …………………………………………………………………………......……………………III. …………………………………………………………………………......……………………IV. ……………………………………………………………………………......…………………5. Details of office premises (Documentary proof / Rent Agreement / Ownership Deed to
be made available) - Space in sq. ft………………………………Location area (please tick mark the right category)commercialresidentialReception area…………… …Accessibility to toilets (Please write Yes or No)………..
6. Name of Bankers (please attach a reference letter on original letterhead from your
227INDIA TOURISM STATISTICS 2009
Bankers) ……………………………………….............………………………………………
7. Name of Auditors ………………………………………………………………………A Balance-Sheet and Profit & Loss Statement pertaining to the inbound tour operationbusiness, as prescribed under Company Law, must be submitted by each applicant.These audited statements should be in respect of your establishment for the lastcompleted financial year or for the calendar year immediately preceding the date ofsubmission of your application. Also furnish details of your turnover in the followingstatement:-
PARTICULARS OF THE INBOUND TOUR OPERATOR CONCERNED
a) Paid up Capital (Capital employed)……………………......………………….……….b) Loans:
i) Secured …………………………………………………………....……………ii) Unsecured ………………………………………………………..…...…………..
c) Reserves…..............................................................................................….d) Current liabilities and provisions...................................……….…………………..e) Total (a to d):f) Fixed assets (excluding intangible assets) ……………………...……………………g) Investment ………………………………………………………….…………………….h) Current assets …………………………………………………….……………………...i) Intangible Assets ……………………………………………….………………………..j) Total (f to i) ……………………………………………………….……………………….
Notes:i) Intangible assets should include goodwill preliminary expenses, tenancy and business
rights, deferred revenue expenditure, accumulated loss etc.ii) Reserves should include balance of Profit & Loss Account and exclude taxation reserve.iii) Current liabilities and provisions would include taxation reserve.iv) Current assets should include sundry debts, loans advances, cash and bank balance.8. A copy of Acknowledgement in respect of Income tax returns for the current assessment
year should be enclosed ………………………………..............................……………..9. Certificate of Chartered Accountant in original regarding turn over through Foreign
Exchange from Inbound Tour Operations only for the preceding or latestyear………………………………………………………………………………………………...
10. Documents pertaining to any promotional activities undertaken by the firm should beenclosed………………………………………………………………………..
11. Please indicate membership of International Travel Organizations, if any………………………………………………………………………………………………………
12. Give details of:a) Volume of international tourist traffic handled. (Please submit a certificate from a
Chartered Accountant). This certificate should show the foreign exchange earnings
228INDIA TOURISM STATISTICS 2009
receipts from inbound tour operations only during the current financial year or theyear immediately preceding the date of submission of your application.
b) Clientele: special tourist groups handled, if any, their size, frequency, etc.c) Steps taken to promote international tourist traffic and details of the groups
handled, if any.d) Special programmes if any, arranged for foreign tourists.e) Please attach publicity material such as brochures / folders / leaflets / posters
concerning itineraries and website address of the agency.13. Number of conferences handled, if any, and the details of total number of passengers
for such conferences with details of locations, etc.14. Number of incentive tours handled.15. Please enclose Demand Draft of Rs. 3,000/- for Head Office and Rs. 3, 000/- for each
Branch Office as fee for recognition / renewal payable to the Pay & Accounts Officer,Ministry of Tourism.
For Head Office, please mention:Demand Draft No………………………………………………………………………………..Date………………… ……………………………………………………………………………..Amount ……………………………………………………………………………………………
For Branch office(s), please mention:Demand Draft No………………………………………………………………………………..Date………………………………………………………………………………………………...Amount ……………………………………………………………………………………………
Signature of Proprietor/Partner/Managing Director
Rubber StampPlace:Date:
NOTE:I. The guidelines including application form may be downloaded from
website www.tourism.gov.inII. This application should be submitted in duplicate along with all supporting
documents.III.Please quote reference number of Ministry of Tourism if the application is for renewal
of recognition.IV.Separate application form to be filled in duplicate along with the required documents,
when applying for Branch Office(s).
229INDIA TOURISM STATISTICS 2009
LIST OF DOCUMENTS (CHECK LIST) REQUIRED FOR FIRSTAPPROVAL/ RENEWAL AS AN APPROVED INBOUND TOUR
OPERATOR
1. Application form in duplicate duly filled in.
2. Two attested photographs pasted on both the copies of application form.
3. Documentary proof (preferably registration certificates from Government) in support ofbeginning of operations of your firm.
4. A copy of Complete Audited Balance Sheet for the latest financial year.
5. Income Tax Acknowledgement for the latest assessment year.
6. Service Tax Registration number from the concerned authority.
7. The Inbound Tour operators located in rest of India should have a minimum Paid upCapital (or Capital employed) of Rs.3.00 lakh and Rs. 50,000/- in the case of North –East region, remote and rural areas, duly supported by the latest Audited Balance Sheet/Chartered Accountant’s certificate.
8. Reference letter from Bank on its letterhead (in original) regarding your firm’s bank account.
9. Details of staff employed giving names, designation, educational qualification &experience if any, in tourism field, and length of service in your organization (copies ofcertificates to be enclosed):
a) There should be a minimum of four qualified staff out of which at least one shouldhave Diploma / Degree in Tourism & Travel Management from a recognizedUniversity, IITTM or an institution approved by AICTE. The owner of the firm wouldbe included as one of the qualified employees.
b) The academic qualifications may be relaxed in case of the other two staff memberswho are exceptionally experienced personnel in Airlines, Shipping, Transport, PRAgencies, Hotels and other corporate bodies and those who have two yearsexperience with Ministry of Tourism approved tour operators.
c) For the agencies located in the North – Eastern region, remote and rural areas, thereshould be a minimum of two staff out of which one should be a qualified employeewith a Diploma / Degree in Tourism & Travel Management from a recognizedUniversity, IITTM or an institution approved by AICTE. The owner of the firm wouldbe included as one of the qualified employees.
10. List of Directors/Partners or name of the Proprietor.
230INDIA TOURISM STATISTICS 2009
11. Details of office premises, whether located in commercial or residential area, exactoffice space in sq. ft. (at least 150 sq. ft for rest of India and 100 sq. ft for hilly areaswhich are located above 1000 meters from sea level) and accessibility to toilet andreception area.
12. Certificate of Chartered Accountant on original letter head in support of turnover in foreignexchange from inbound tour operations only during the last financial / calendar yearwhich should not be less than Rs. 25.00 Lakh in case of Inbound Tour Operator from restof India and Rs. 5.00 lakh from the North – Eastern Region, remote and rural areas.However, for the North – Eastern Region, the Chartered Accountant’s Certificate regardingturn – over of the firm in Rupee earnings would be treated as Foreign Exchange earnings,provided there is documentary evidence that such earnings are from inbound touroperations only.
13. Demand Draft for Rs. 3,000/- towards processing fees payable to Pay and AccountsOfficer, Ministry of Tourism, Government of India.
14. Documents duly attested by competent officer.
NOTE:
I. The above - mentioned documents may be submitted in duplicate.
II. Please fill up separate application form(s), in duplicate, for BranchOffice(s), if any.
III. The guidelines including application form may be downloaded fromwebsite www.tourism.gov.in
231INDIA TOURISM STATISTICS 2009
GUIDELINES FOR RECOGNITION / RENEWAL AS AN APPROVEDTOURIST TRANSPORT OPERATOR
[Revised with effect from 4th December 2009]
1. The aims & objectives of the scheme for recognition of Tourist Transport Operator areto encourage quality standard and service in this category so as to promote tourism inIndia. This is a voluntary scheme open to all bonafide tourist transport operators tobring them in organized sector.
2. Definition: A Tourist Transport Operator Organization is one, who provides touristtransport like cars, coaches, boats etc. to tourists for transfers, sightseeing andjourneys to tourist places etc..
3. The application for recognition shall be addressed to the Additional Director General,Transport Bhawan, No.1, Parliament Street, New Delhi-110 001.
4. The recognition as an approved Tourist Transport Operator shall be granted by theMinistry of Tourism, Government of India, New Delhi initially, for five years, based onthe Inspection Report / Recommendations of a Committee comprising of concernedRegional Director and a member of ITTA.
5. The application for renewal / extension shall be addressed to the Regional Director ofthe concerned region as per the following addresses:-
a) The Regional Director (East), India Tourism, “Embassy”, 4, Shakespeare Sarani,Kolkata – 700 071, West Bengal. Phone No. (033) 2282 5813 / 2282 1475,Fax: (033) 2282 3521, Email: [email protected]
b) The Regional Director (West), India Tourism, 123, M. Karve Road, Opp. ChurchGate, Mumbai – 400 020, Maharashtra. Phone No. (022) 2208 3263 / 2207 4333 /2207 4334, Fax: (022) 2201 4496, Email: [email protected],[email protected]
c) The Regional Director (North), India Tourism, 88 – Janpath, New Delhi 110 001.Phone No. (011) 2332 0342 / 2332 0005 / 2332 0008, Fax: (011) 2332 0109,Email: [email protected]
d) The Regional Director (South), India Tourism, 154, Anna Salai, Chennai – 600 002,Tamil Nadu. Phone No. (044) 2846 0285 / 2846 1459, Fax: (044) 2846 0193,Email: [email protected], [email protected]
e) The Regional Director (North – East), India Tourism, Asom Paryatan Bhawan, 3rd
Floor, Near Nepali Mandir, A. K. Azad Road, Paltan Bazar, Guwahati – 781 008,Assam. Phone No. (0361) 273 7554, Fax No. (0361) 273 7553,Email: [email protected]
APPENDIX-VIII
232INDIA TOURISM STATISTICS 2009
6. The renewal / extension, thereafter, shall be granted for five years after inspectionconducted by a Committee comprising of concerned Regional Director and a memberof ITTA, on an application made by the Tourist Transport Operator along with therequisite fee / documents.
7. The documents received from applicants after scrutiny in all respects will beacknowledged by the Travel Trade Division in respect of first approval and by theconcerned Regional Director for renewal. The inspection for first approval / renewalshall be conducted by the Inspection Team within a period of sixty working days fromthe receipt of complete application.
8. The following conditions must be fulfilled by the Tourist Transport Operator for grant ofrecognition by Ministry of Tourism:-
(i) The application for grant of recognition shall be in the prescribed form and submittedin duplicate along with the required documents.
(ii) The applicant should have been in the tourist transport operation business for aminimum period of one year at the time of application.
(iii) The Tourist Transport Operator has operated in the above period a minimumnumber of six tourist vehicles with proper tourist permits issued by theconcerned State Transport Authority (STA) / Road Transport Authority (RTA) forcommercial tourist vehicles. Out of these six tourist vehicles, at least four mustbe cars. The tourist vehicles and the related documents should be in the name ofthe company except where the owner is a Proprietor.
(iv) The applicant should have adequate knowledge of handling the tourist transportvehicles for transferring tourists from the Airport, Railway Stations, Bus Stations,etc., and for sight-seeing of tourists, both foreign and domestic. The driversshould have working knowledge of English and Hindi / local languages.
(v) The drivers of the tourist vehicles should wear proper uniform and must possessadequate knowledge of taking the tourists for sight seeing.
(vi) The applicant should have proper parking space for the vehicles.
(vii) The Tourist Transport Operator is registered with the appropriate authority forcarrying on the business of operating tourist transport vehicles.
(viii) The minimum office space should be at least 150 sq. ft for rest of India and 100sq. ft for hilly areas which are above 1000 meters from sea level. Besides theoffice may be located in the commercial area and equipped with telephone, fax,computers etc. Its surroundings should also be neat and clean. There should besufficient space for reception and easy access to the toilet facilities.
(ix) The turn-over of the firm from Tourist Transport operations only should be a minimumof Rs. 25.00 lakh for rest of India and Rs. 10.00 lakh for the North – Easternregion, remote & rural areas duly supported by a Certificate issued by CharteredAccountant.
233INDIA TOURISM STATISTICS 2009
(x) The applicant should be income tax assessee and should submit copy ofacknowledgement certificate as proof of having filed income tax return forcurrent assessment year.
9. For Ex-Defence personnel, the condition of being in the business of tourist transportvehicles for one year is relaxable to six months and having six vehicles is relaxableto four tourist vehicles provided the candidate is sponsored by the Director Generalof Resettlement, Ministry of Defence, New Delhi. However, the Ex - Defencepersonnel who apply under this scheme must themselves operate the tourist transportbusiness and should not be hire men of other financiers.
10. The Tourist Transport Operator is required to pay a non-refundable fee of Rs. 3,000/-while applying for the recognition / renewal for Head Office and each Branch Office.The fee will be made payable to the Pay & Accounts Officer, Ministry of Tourism in theform of a Bank Draft.
11. The recognition / renewal will be granted to the Head Office of the Tourist TransportOperator. Branch offices will be approved along with the Head Office or subsequently,provided the particulars of the Branch offices are submitted to Ministry of Tourism forrecognition and for renewal to the concerned Regional Director and accepted by it.
12. The Tourist Transport Operator so granted recognition / renewal shall be entitled tosuch incentives and concessions as may be granted by the Government from time totime and shall abide by the terms and conditions of recognition as prescribed formtime to time by the Ministry of Tourism, Government of India.
13. Even though the scheme of granting approval of recognition to service providers ofTravel Trade is voluntary, in nature, there is a need to have a pro - active role ofMinistry of Tourism and Travel Trade to ensure that more and more service providersseek approval and then service the tourists. There is also a need to educate thestakeholders as well as consumers against the potential risk of availing services throughthe unapproved service providers.
14. It shall be mandatory for an approved service provider of Travel Trade to prominentlydisplay the Certificate of approval of recognition given by Ministry of Tourism in theoffice by pasting it on a board or in a picture frame so that it is visible to a potentialtourist.
15. The decision of the Ministry of Tourism, Government of India in the matter of recognition/ renewal shall be final. However, MOT may in its discretion refuse to recognize / renewany firm or withdraw / withhold at any time recognition / renewal already granted withthe approval of the Competent Authority. Before such a decision is taken, necessaryShow Cause Notice would invariably be issued and the reply considered on merit. Thiswill be done after careful consideration and generally, as a last resort. The circumstancesin which withdrawal is resorted would also be indicated.
16. The guidelines including application form may be downloaded fromwebsite www.tourism.gov.in
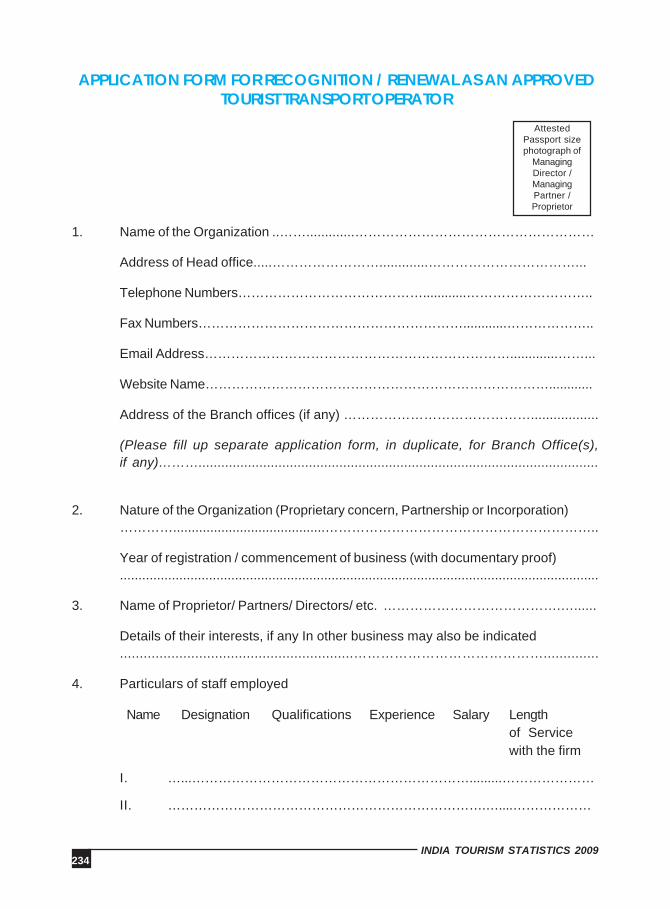
234INDIA TOURISM STATISTICS 2009
AttestedPassport sizephotograph of
ManagingDirector /ManagingPartner /Proprietor
1. Name of the Organization ..…….............………………………………………………
Address of Head office.....…………………….............……………………………...
Telephone Numbers……………………………………............………………………..
Fax Numbers……………………………………………………............………………..
Email Address…………………………………………………………….............……...
Website Name……………………………………………………………………............
Address of the Branch offices (if any) ……………………………………..................
(Please fill up separate application form, in duplicate, for Branch Office(s),if any)……….........................................................................................................
2. Nature of the Organization (Proprietary concern, Partnership or Incorporation)………….........................................……………………………………………………..
Year of registration / commencement of business (with documentary proof).................................................................................................................................
3. Name of Proprietor/ Partners/ Directors/ etc. ………………………………….…......
Details of their interests, if any In other business may also be indicated...........................................................……………………………………..............
4. Particulars of staff employed
Name Designation Qualifications Experience Salary Lengthof Servicewith the firm
I. …...……………………………………………………….........…………………
II. ……………………………………………………………….…....………………
APPLICATION FORM FOR RECOGNITION / RENEWAL AS AN APPROVEDTOURIST TRANSPORT OPERATOR
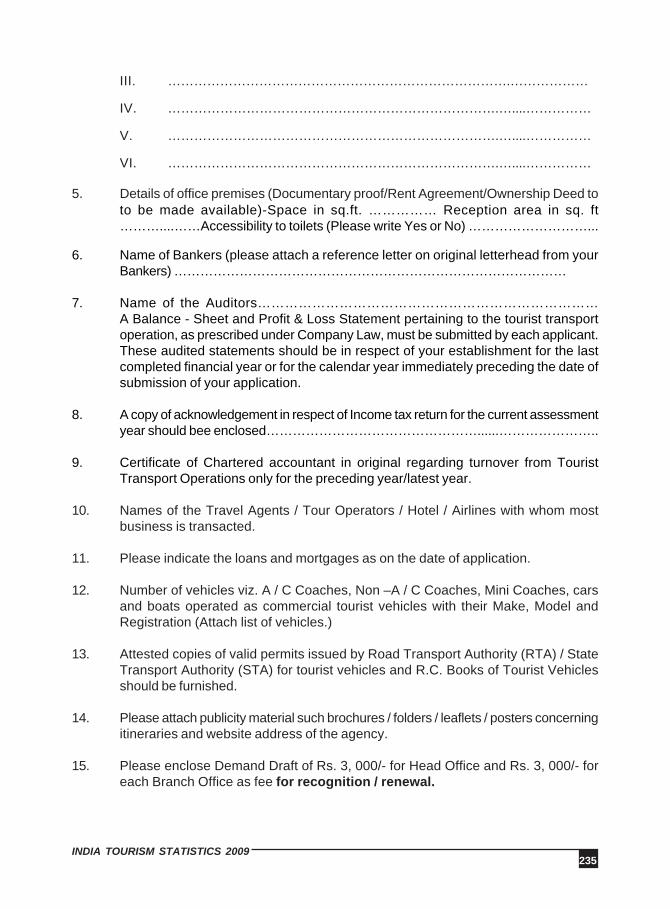
235INDIA TOURISM STATISTICS 2009
III. …………………………………………………………………….………………
IV. ………………………………………………………………….…....……………
V. ………………………………………………………………….…....……………
VI. ………………………………………………………………….…....……………
5. Details of office premises (Documentary proof/Rent Agreement/Ownership Deed toto be made available)-Space in sq.ft. …………… Reception area in sq. ft………....……Accessibility to toilets (Please write Yes or No) ………………………...
6. Name of Bankers (please attach a reference letter on original letterhead from yourBankers) ………………………………………………………………………………
7. Name of the Auditors…………………………………………………………………A Balance - Sheet and Profit & Loss Statement pertaining to the tourist transportoperation, as prescribed under Company Law, must be submitted by each applicant.These audited statements should be in respect of your establishment for the lastcompleted financial year or for the calendar year immediately preceding the date ofsubmission of your application.
8. A copy of acknowledgement in respect of Income tax return for the current assessmentyear should bee enclosed…………………………………………......…………………..
9. Certificate of Chartered accountant in original regarding turnover from TouristTransport Operations only for the preceding year/latest year.
10. Names of the Travel Agents / Tour Operators / Hotel / Airlines with whom mostbusiness is transacted.
11. Please indicate the loans and mortgages as on the date of application.
12. Number of vehicles viz. A / C Coaches, Non –A / C Coaches, Mini Coaches, carsand boats operated as commercial tourist vehicles with their Make, Model andRegistration (Attach list of vehicles.)
13. Attested copies of valid permits issued by Road Transport Authority (RTA) / StateTransport Authority (STA) for tourist vehicles and R.C. Books of Tourist Vehiclesshould be furnished.
14. Please attach publicity material such brochures / folders / leaflets / posters concerningitineraries and website address of the agency.
15. Please enclose Demand Draft of Rs. 3, 000/- for Head Office and Rs. 3, 000/- foreach Branch Office as fee for recognition / renewal.
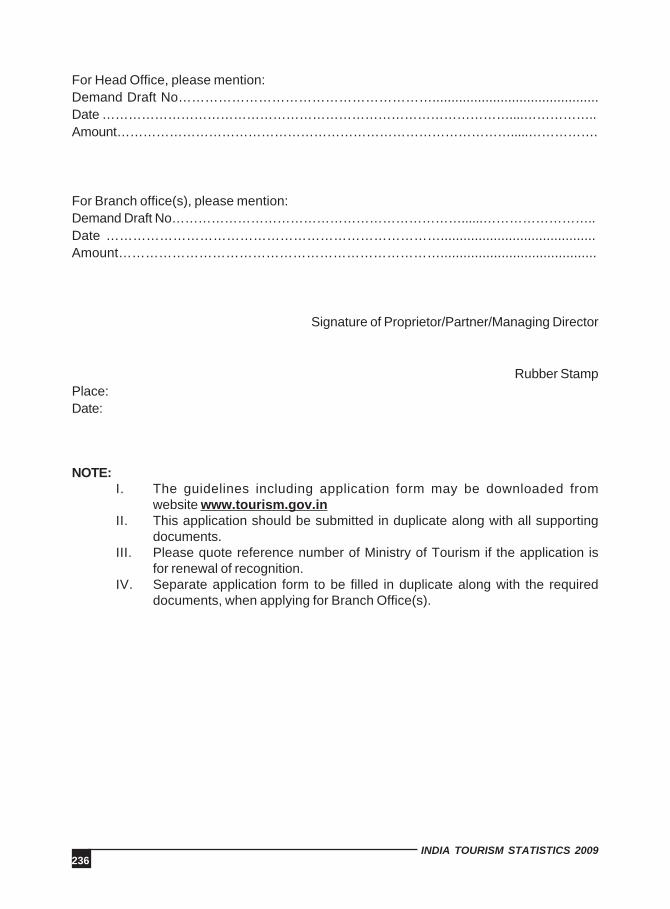
236INDIA TOURISM STATISTICS 2009
For Head Office, please mention:Demand Draft No…………………………………………………............................................Date …………………………………………………………………………………....……………..Amount……………………………………………………………………………….....…………….
For Branch office(s), please mention:Demand Draft No…………………………………………………………......……………………..Date ………………………………………………………………….........................................Amount……………………………………………………………….........................................
Signature of Proprietor/Partner/Managing Director
Rubber StampPlace:Date:
NOTE:I. The guidelines including application form may be downloaded from
website www.tourism.gov.inII. This application should be submitted in duplicate along with all supporting
documents.III. Please quote reference number of Ministry of Tourism if the application is
for renewal of recognition.IV. Separate application form to be filled in duplicate along with the required
documents, when applying for Branch Office(s).
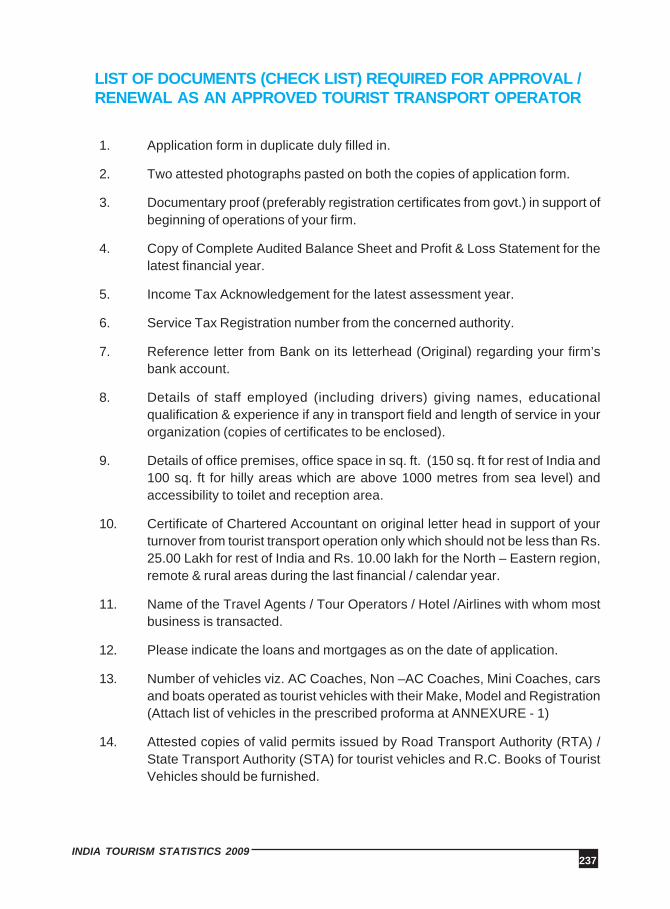
237INDIA TOURISM STATISTICS 2009
LIST OF DOCUMENTS (CHECK LIST) REQUIRED FOR APPROVAL /RENEWAL AS AN APPROVED TOURIST TRANSPORT OPERATOR
1. Application form in duplicate duly filled in.
2. Two attested photographs pasted on both the copies of application form.
3. Documentary proof (preferably registration certificates from govt.) in support ofbeginning of operations of your firm.
4. Copy of Complete Audited Balance Sheet and Profit & Loss Statement for thelatest financial year.
5. Income Tax Acknowledgement for the latest assessment year.
6. Service Tax Registration number from the concerned authority.
7. Reference letter from Bank on its letterhead (Original) regarding your firm’sbank account.
8. Details of staff employed (including drivers) giving names, educationalqualification & experience if any in transport field and length of service in yourorganization (copies of certificates to be enclosed).
9. Details of office premises, office space in sq. ft. (150 sq. ft for rest of India and100 sq. ft for hilly areas which are above 1000 metres from sea level) andaccessibility to toilet and reception area.
10. Certificate of Chartered Accountant on original letter head in support of yourturnover from tourist transport operation only which should not be less than Rs.25.00 Lakh for rest of India and Rs. 10.00 lakh for the North – Eastern region,remote & rural areas during the last financial / calendar year.
11. Name of the Travel Agents / Tour Operators / Hotel /Airlines with whom mostbusiness is transacted.
12. Please indicate the loans and mortgages as on the date of application.
13. Number of vehicles viz. AC Coaches, Non –AC Coaches, Mini Coaches, carsand boats operated as tourist vehicles with their Make, Model and Registration(Attach list of vehicles in the prescribed proforma at ANNEXURE - 1)
14. Attested copies of valid permits issued by Road Transport Authority (RTA) /State Transport Authority (STA) for tourist vehicles and R.C. Books of TouristVehicles should be furnished.
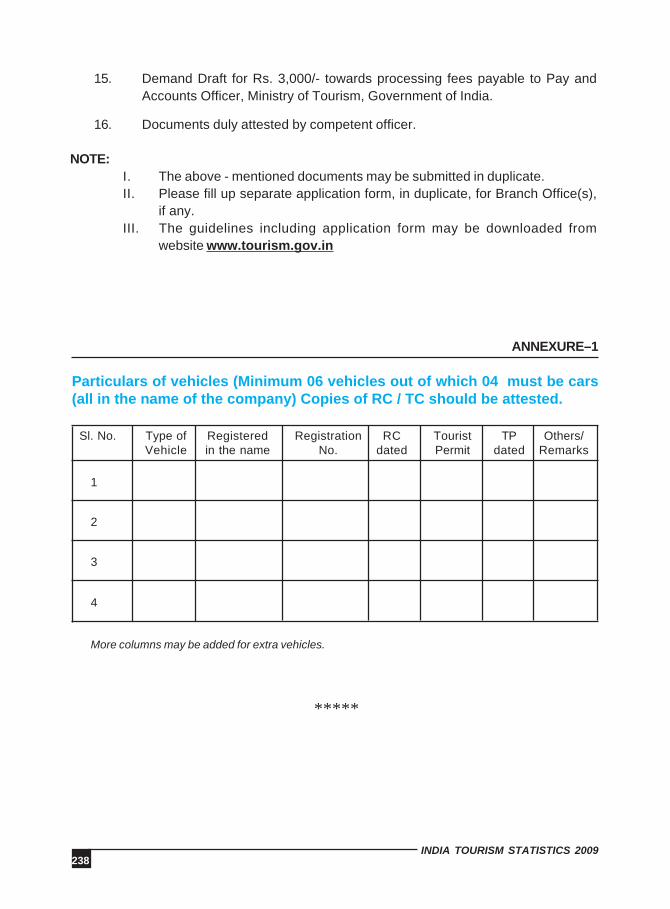
238INDIA TOURISM STATISTICS 2009
ANNEXURE–1
Particulars of vehicles (Minimum 06 vehicles out of which 04 must be cars(all in the name of the company) Copies of RC / TC should be attested.
Sl. No. Type of Registered Registration RC Tourist TP Others/Vehicle in the name No. dated Permit dated Remarks
1
2
3
4
More columns may be added for extra vehicles.
*****
15. Demand Draft for Rs. 3,000/- towards processing fees payable to Pay andAccounts Officer, Ministry of Tourism, Government of India.
16. Documents duly attested by competent officer.
NOTE:I. The above - mentioned documents may be submitted in duplicate.II. Please fill up separate application form, in duplicate, for Branch Office(s),
if any.III. The guidelines including application form may be downloaded from
website www.tourism.gov.in
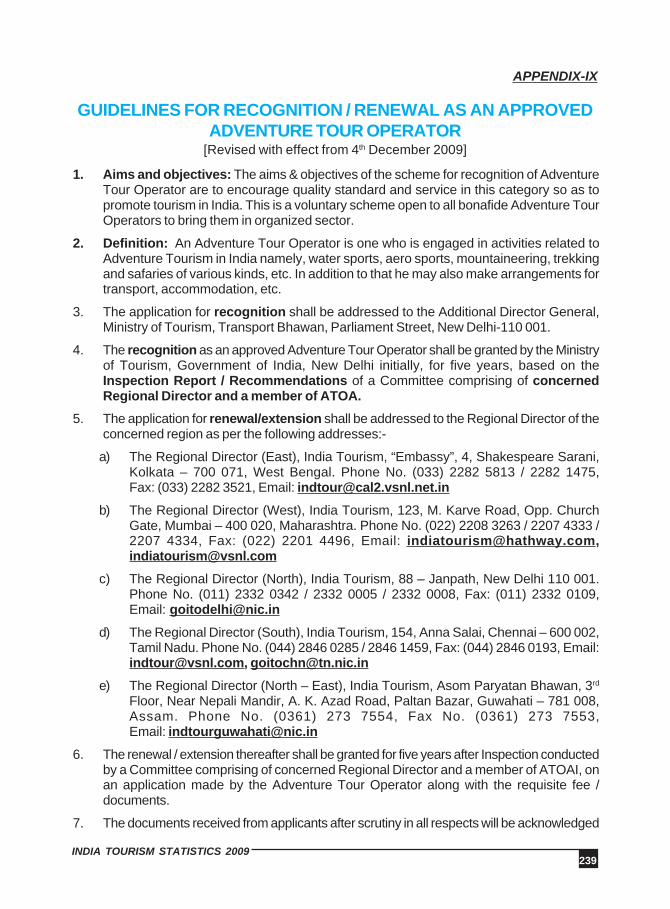
239INDIA TOURISM STATISTICS 2009
APPENDIX-IX
GUIDELINES FOR RECOGNITION / RENEWAL AS AN APPROVEDADVENTURE TOUR OPERATOR
[Revised with effect from 4th December 2009]
1. Aims and objectives: The aims & objectives of the scheme for recognition of AdventureTour Operator are to encourage quality standard and service in this category so as topromote tourism in India. This is a voluntary scheme open to all bonafide Adventure TourOperators to bring them in organized sector.
2. Definition: An Adventure Tour Operator is one who is engaged in activities related toAdventure Tourism in India namely, water sports, aero sports, mountaineering, trekkingand safaries of various kinds, etc. In addition to that he may also make arrangements fortransport, accommodation, etc.
3. The application for recognition shall be addressed to the Additional Director General,Ministry of Tourism, Transport Bhawan, Parliament Street, New Delhi-110 001.
4. The recognition as an approved Adventure Tour Operator shall be granted by the Ministryof Tourism, Government of India, New Delhi initially, for five years, based on theInspection Report / Recommendations of a Committee comprising of concernedRegional Director and a member of ATOA.
5. The application for renewal/extension shall be addressed to the Regional Director of theconcerned region as per the following addresses:-
a) The Regional Director (East), India Tourism, “Embassy”, 4, Shakespeare Sarani,Kolkata – 700 071, West Bengal. Phone No. (033) 2282 5813 / 2282 1475,Fax: (033) 2282 3521, Email: [email protected]
b) The Regional Director (West), India Tourism, 123, M. Karve Road, Opp. ChurchGate, Mumbai – 400 020, Maharashtra. Phone No. (022) 2208 3263 / 2207 4333 /2207 4334, Fax: (022) 2201 4496, Email: [email protected],[email protected]
c) The Regional Director (North), India Tourism, 88 – Janpath, New Delhi 110 001.Phone No. (011) 2332 0342 / 2332 0005 / 2332 0008, Fax: (011) 2332 0109,Email: [email protected]
d) The Regional Director (South), India Tourism, 154, Anna Salai, Chennai – 600 002,Tamil Nadu. Phone No. (044) 2846 0285 / 2846 1459, Fax: (044) 2846 0193, Email:[email protected], [email protected]
e) The Regional Director (North – East), India Tourism, Asom Paryatan Bhawan, 3rd
Floor, Near Nepali Mandir, A. K. Azad Road, Paltan Bazar, Guwahati – 781 008,Assam. Phone No. (0361) 273 7554, Fax No. (0361) 273 7553,Email: [email protected]
6. The renewal / extension thereafter shall be granted for five years after Inspection conductedby a Committee comprising of concerned Regional Director and a member of ATOAI, onan application made by the Adventure Tour Operator along with the requisite fee /documents.
7. The documents received from applicants after scrutiny in all respects will be acknowledged
240INDIA TOURISM STATISTICS 2009
by the Travel Trade Division in respect of first approval and by the concerned RegionalDirector for renewal. The inspection for first approval / renewal shall be conducted by theInspection Team within a period of sixty working days from the receipt of completeapplication.
8. The following conditions must be fulfilled by the Adventure Tour Operator for grant ofrecognition / renewal by the Ministry of Tourism:-
i) The application for grant of recognition / renewal shall be in the prescribed form andsubmitted in duplicate along with the required documents.
ii) The Adventure Tour Operator should have a minimum Paid up Capital (Capital employed)of Rs. 3.00 lakhs duly supported by the latest audited Balance Sheet / CharteredAccountant’s certificate.
iii) The turnover in terms of foreign exchange or Indian Rupees by the firm from AdventureTourism / Adventure Sports related activities only should be a minimum of Rs.10.00 lakhduly supported by a certificate issued by Chartered Accountant.
iv) The minimum office space should be at least 150 sq. ft for rest of India and 100 sq. ftfor hilly areas which are above 1000 meters from sea level. The office should belocated in neat and clean surroundings and equipped with telephone, fax and computer/computer reservation system etc. There should be sufficient space for reception andeasy access to toilets.
v) The Adventure Tour operator should have a minimum of four qualified staff out of whichat least one should have Diploma / Degree in Tourism & Travel Management from arecognized University, IITTM, any institution approved by AICTE or should be trainedfrom reputed specialized Institutes in Private / Public Sector. The owner of the firm wouldbe included as one of the qualified employees. Either, the Owner / Director himself ortheir Operations - Chief employed should be well qualified in the activity the adventureoperator wants to pursue, which is determined by certification by any national or internationalinstitute in the activity or minimum of eight years of practical experience.
The academic qualifications may be relaxed in case of the other two staff members whoare exceptionally experienced personnel in Airlines, Shipping, Transport, PR Agencies,Hotels and other corporate bodies and those who have two years experience with Ministryof Tourism approved tour operators.
For the agencies located in the North – Eastern region, remote and rural areas, thereshould be a minimum of two qualified staff out of which one should have a Diploma /Degree in Tourism & Travel Management from a recognized University, IITTM or aninstitution approved by AICTE or should be trained from reputed specialized Institutes inPrivate / Public Sector. The owner of the firm would be included as one of the qualifiedemployees.
vi) The Agency must clearly indicate its specialization of activities or activity it wishes topursue as business like trekking, water sports, aero sports, scuba diving, Safaris etc.
vii) The operator must have his own Adventure equipment as well as specializedtrained staff.
viii) The field staff members of the party must be qualified for the activity or must haveminimum of five years of practical experience. The staff member must obtain anAdventure certificate from the specialized organizations like IMF (for
241INDIA TOURISM STATISTICS 2009
Mountaineering/trekking) & NIWS Goa (for Water Sports/Aero sports, etc.).
ix) Field members of the company must be qualified in First - Aid / C.P.R by RedCross or equivalent body or Certificate Course conducted by the Adventure TourOperators Association of India.
x) The party must sign an undertaking for adherence to sustainable ecological practiceand protection of environment in keeping with guidelines for eco-tourism and safetyand security guidelines of Ministry of Tourism/Adventure Tour Operator Associationof India.
xi) It will be recommended to distribute a copy of the Eco - Tourism guidelines toeach client.
xii) The agency must maintain in its office premises all the maps and reference materialconcerning the particular activities it desires to pursue as business.
xiii) The party must have printed brochure or website clearly describing its i) presentactivities (ii) Its area of operation (iii) its commitment to follow Eco - Tourismguidelines.
xiv) The firm should clearly indicate the area of specialization in all their promotionaland display material.
xv) Principles of Eco Tourism as being espoused by ATOAL Membership of PATAGreen Leaf are optional.
xvi) The Adventure Tour Operator should have filed Income Tax Return for the currentassessment year.
xvii) The Adventure Tour Operator should have been in operation for a minimum periodof one year before the date of application.
9. Although a large number of activities come under Adventure Tourism, the Ministry ofTourism has decided to grant recognition primarily to the following four categories ofAdventure Tour Operators at this point of time:-
I. Operators dealing with water sports.
II. Operators dealing with aero-sports.
III. Operators dealing with safaris of various types.
IV. Operators dealing with mountaineering and trekking.
10. Safety guidelines: (i) Safety guidelines for water sports, Aero - sports, safaris,mountaineering and trekking which have to be followed by Adventure Tour Operatorshave been appended for reference at Annexure I. It may be noted that in a number ofadventure activities, a risk is involved and, therefore, it must be ensured by the AdventureTour Operator that safety guidelines are strictly followed. In case the Tour Operator ismaking arrangements through Sub - Agents, it would be the responsibility of the PrincipalTour Operator to ensure that Sub - Agents provide proper equipment to clients and allsafety measures are followed to.
(ii) The Adventure Tour Operator may also ensure that his counterpart abroad must obtain anundertaking from the foreign tourists that in case of any loss, damage / accident, etc., thetravel agency would not be responsible and the client must be covered by the Medical
242INDIA TOURISM STATISTICS 2009
Insurance and should include the cost of repatriation fee if he / she is to continue the tour.
(iii) Insurance: The Adventure Tour Operator has qualified staff to handle the operations.Since adventure has an in - built risk factor, the Clients / Adventure Tour Operatorsshould be covered by insurance. This insurance is termed as “Special ContingencyPolicy”. It is specific to cover the risk factor of the Client / Adventure Tour Operator, i.e.it covers accidental deaths, loss of limbs and / or eyes and permanent/partial disability.
(iv) Disclaimer: The Ministry of Tourism, Government of India would not be responsible forany claims by clients of the approved Adventure Tour Operator.
11. The Adventure Tour Operator would be required to Pay a non - refundable fee ofRs.3, 000/- (Rupees three thousand only) while applying for the recognition andrenewal of the Head Office as well as each Branch Office. The fee would be madepayable to the Pay & Accounts Officer, Ministry of Tourism in the form of a Bank Draft.
12. The recognition / renewal would be granted to the Head Office of Adventure Tour Operators.Branch Offices would be approved along with head office or subsequently, providedparticulars of Branch Offices are submitted to Ministry of Tourism for recognition and forrenewal to the concerned Regional Director and accepted by it.
13. For recognition / renewal of Adventure Tour Operator, representatives from the AdventureTour Operators Association of India specializing in such activities will be included asInspection Team members.
14. The Adventure Tour Operators so granted recognition / renewal shall be entitled to suchincentives and concessions as may be granted by Government of India from time to timeand shall abide by the terms and conditions of recognition as prescribed from time totime by the Ministry of Tourism, Government of India.
15. While submitting the application, the Adventure Tour Operator must indicate thearrangements for emergency lift and evacuation of clients in case of mishap.
16. Even though the scheme of granting approval of recognition to service providers of TravelTrade is voluntary, in nature, there is a need to have a pro - active role of Ministry ofTourism and Travel Trade to ensure that more and more service providers seek approvaland then service the tourists. There is also a need to educate the stakeholders as well asconsumers against the potential risk of availing services through the unapproved serviceproviders.
17. It shall be mandatory for an approved service provider of Travel Trade to prominentlydisplay the Certificate of approval of recognition given by Ministry of Tourism in the officeby pasting it on a board or in a picture frame so that it is visible to a potential tourist.
18. The decision of the Ministry of Tourism, Government of India in the matter of recognition/ renewal shall be final. However, MOT may in their discretion refuse to recognize / renewany firm or withdraw / withhold recognition / renewal already granted with the approval ofthe Competent Authority at any time. Before such a decision is taken, necessary ShowCause Notice would be issued and the reply considered on merit. Termination will bedone only after careful consideration and generally as a last resort. Reasons for withdrawalwould be mentioned in the Show Cause Notice and final order. In special circumstancessuch as threat to the security of the State detailed reasons may be withheld.
19. The guidelines including application form may be downloaded from websitewww.tourism.gov.in
243INDIA TOURISM STATISTICS 2009
ANNEXURE I
GUIDELINES FOR SAFETY AND RESCUE INADVENTURE SPORTS
INTRODUCTION
1.1 An Adventure Tour Operator is one who is engaged in activities related to AdventureTourism in India, namely, water sports, aero sports, mountaineering and trekking,safaris of various natures, etc. In addition to that he may also make arrangementsfor transport, accommodation etc.
GENERAL GUIDELINES FOR ALL ADVENTURE SPORTS
2.1 Every group of persons taking part in adventure sports must be accompanied by aperson designated as a “leader”.
2.2 “Leaders” must possess appropriate qualification and skills as indicated in relevantchapters of this document.
2.3 Every person joining a group engaged in adventure sports must receive an introductorytraining and leaders should be satisfied that they have acquired the skills necessaryto participate.
2.4 Leaders should have a first aid certification and must be competent to impart first aidtraining in the use of stretchers.
2.5 Leaders should be familiar with search procedures and should brief all group membersin these procedures.
2.6 All group members must be familiar with the use of radios where these are beingused.
2.7 Leaders should be familiar with helicopter operations, know how to approach ahelicopter and procedures for being winched up and down.
2.8 Leaders should be proficient in the use of maps and compasses in any weather byday or night.
2.9 Leaders should be satisfied that all members are medically fit to take part in theadventure sports.
2.10 Leaders should satisfy themselves that equipment to be used meets all the safetynorms for each adventure sport; all inspections have been carried out as recommended
244INDIA TOURISM STATISTICS 2009
by the manufacturer and is fit for use.
2.11 Under no circumstances should the capacity rated by the manufacturer of adventuresports equipment be exceeded, any unauthorized modifications except as additionalsafety measures be carried out or sub standard material used.
2.12 Information regarding nature of activity, area of operation, period of activity, possiblehazards, persons to be contacted in an emergency and list of members should begiven to the concerned safety and rescue committees.
2.13 Suitable hand held devices with graded distress signal capabilities should be madeavailable to adventure tourist groups at suitable prices when available in India.
2.14 A qualified Doctor should be available on call
2.15 Communication facilities such as Mobile Telephone / Walkie - Talkie etc. should beavailable.
GUIDELINES FOR WATER SPORTS
3.1 All leaders or guides must possess a valid certificate or license from a recognizedinstitution or association. They should have an adequate experience in the concernedsport.
3.2 All leaders and guides must be good swimmers and should be well trained in waterrescue techniques, first-aid & CPR (Cardio pulmonary resuscitation).
3.3 A rescue craft should always be in sight or in radio contact of the persons or groupengaged in water sports. The rescue craft could be powered or un - powered accordingto requirements of the sport but it must have a first aid kit, spare life jackets andthrow lines/rescue bags. For river sports, a minimum of two crafts (i.e. two rafts or araft and one/two safety/rescue kayaks is a must.
3.4 All participants should wear suitable buoyancy aids and where necessary protectiveheadgear. Helmets are a must for river sports.
3.5 In water sports, where there is a possibility of being thrown in the water, all participantsshould be swimmers.
3.6 All equipment should be inspected by a competent person or the manufacturer onceevery season or six months, whichever is less.
3.7 A log book should be maintained for each craft, which should be a record of usage,inspection, repairs and modifications. A river logbook must be maintained bemaintained for river rafting operations.
245INDIA TOURISM STATISTICS 2009
3.8 All craft which are away from the base of operations should carry a first-aid kit,emergency equipment and repair kit. They should, where appropriate, carry navigationalequipment.
3.9 All craft should display of the list of minimum equipment and accessories asrecommended by the manufacturer.
3.10 The capacity rating of the craft should be prominently displayed so as to be visible tothe users along with a warning of potential hazards.
3.11 No person should be allowed to participate under the influence of illicit drugs or alcohol.
3.12 Incidents and accidents should be immediately reported to the concerned safetycommittee.
3.13 Medical concerns: Those suffering from any serious medical conditions such as aweak heart, epilepsy, back / spinal problems (such as slip disc) & expecting mothersshould not be allowed to participate in river sports/adventure sports such as scubadiving etc.
3.14 Age limit: The age limit for water sports should be prominently displayed in all literatureand also base of operations. For river sports, the age limit is: 14 years & above forall sections, 10 years and above on float trips (grade II). Based on the river section/conditions, this can be relaxed by 1 or 2 years by the trip leader.
3.15 A liability waiver should be signed by the client prior to the river trip. This shouldclearly mention the inherent risks involved in the sport.
3.16 For river sports, life jackets must be on at all times while on the river. The life-jackets must be fastened properly and have a minimum buoyancy of 8-9 kgs.Appropriate life-jackets should be used. Inflatable life-jackets should not be used onthe river.
GUIDELINES FOR AERO SPORTS
4.1 All aero sports must be carried out under an instructor or guide holding a valid licenseor certificate from a recognized institution, club or association.
4.2 All pilots and parachutists must be medically examined and certified fit to participatein aero sports.
4.3 Passengers should be medically fit and briefed on emergency procedures.
246INDIA TOURISM STATISTICS 2009
4.4 All aero sports should be undertaken only in day light hours.
4.5 Clearance in powered flying, such as micro light and powered hang gliders should beobtained from the concerned air traffic control while flying in controlled airspace. Inuncontrolled areas, a responsible person should be available on ground to give take-off and landing clearances.
4.6 For un - powered flying, such as hang gliding and paragliding a launch master shouldbe present at the take off site and a landing area safety officer at the landing zone.
4.7 First aid equipment along with suitable trained person should be available at all times.
4.8 All pilots, passengers and parachutists must wear protective helmets.
4.9 All aero sports activity must be undertaken when sky is clear of clouds; the surfaceis in sight and with visibility at least one nautical mile.
4.10 No person should be allowed to participate in aero sports under the influence of drugsand alcohol.
4.11 Rules for avoiding collision:(For these rules micro light, powered hang gliders etc. may be read as aircraft)
1. No aircraft shall be flown in such a way as to create a danger of collision.2. Formation flying is not recommended.3. All aircraft must avoid passing under, over or in front of another aircraft unless
well clear of it.4. The lower aircraft always have right of way, except for aircraft in any emergency.5. When two aircraft approach each other head on, they should turn on their right.6. Overtaking is not allowed under any circumstances.
4.12 All aircraft, parachutes and airborne equipment must be inspected and certified fit bya competent person on a daily basis.
4.13 Log books should be maintained for all aircraft, parachutes and airborne equipmentwhich would record its usage, inspections, modifications and repairs.
4.14 Repairs and modifications of airborne aero sports equipment must be carried out withthe approval of the manufacturer.
4.15 All clubs, associations, government and other bodies offering aero sports facilitiesmust maintain a manual of operation which should be available at the site of the aerosports activity and a copy should be sent to the concerned safety committee forreview. This manual should contain standard operating procedures, list of mandatory
247INDIA TOURISM STATISTICS 2009
checks of equipment, details and specifications of equipment and emergencyprocedures.
GUIDELINES FOR MOUNTAINEERING AND TREKKING
5.1 All members of mountaineering expeditions should be adequately qualified for takingpart in the sport. Basic course certificate issued by National Mountaineering Institutesshould be considered adequate for this purpose.
5.2 Leaders of mountaineering expeditions should possess adequate qualificationsapproved by Indian Mountaineering Foundation.
5.3 Members of mountaineering expeditions and trekking groups should be physically fit.
5.4 Equipment used for mountaineering and trekking should be UAAI certified or approvedby the Indian Mountaineering Foundation.
5.5 Rescue equipment, such as ropes, harnesses, pulley systems and portable stretchersmust be maintained as a separate kit in a suitable package marked boldly with thewords “Rescue equipment”.
FORMATION OF SAFETY AND RESCUE COMMITTEE
6.1 In addition to having an element of risk, adventure sports are usually undertaken inremote areas, often inaccessible by road. In order to minimize the risks it must beensured that adequate safety measures are adopted by all agencies conductingadventure sports especially where tourists are involved. Rescue arrangements alsohave to be speedily put into operation to minimize loss of life and limb in the event ofmishaps.
6.2 The formation, therefore, of state level committees for safety and rescue of tourists,is essential. The committees should be able to oversee implementation of safetymeasures and co-ordinate rescue efforts.
6.3 The safety and rescue committee should function as a nodal agency for all adventureactivities in the state. It should draw its members from the various executivedepartments such as departments of Tourism, Sports, Police and military authoritiesand representatives from ATOAL.
6.4 Similar committee should be formed at the District level under the districtadministration.
URGENT SAFETY NOTICESThese notices will be issued subsequently, as and when required, to update theseguidelines, based on suggestions and reports received.

248INDIA TOURISM STATISTICS 2009
APPLICATION FORM FOR RECOGNITION / RENEWAL AS ANAPPROVED ADVENTURE TOUR OPERATOR
AttestedPassport sizephotograph of
ManagingDirector /ManagingPartner /Proprietor
1. Organization ………………………………………..........................…………………….
Address of Head office.…………………………………………....……………….....…....
…………………………………………..……………………………...............……………
Telephone Numbers…………………………………………………………...............…...
Fax Numbers……………………………………………………………………...…….........
Email Address………………………………………………………………................……
Website Name……………………………………………………………………….............
Address of the Branch offices (if any) …………………………........................………………………………………………………………………………………………………….……....
(Please fill up separate application form, in duplicate, for Branch Office(s), if any)
2. Nature of the Organization (Proprietary concern, Partnership or Incorporation)…………. …………………………………………......................................................(Also please indicate the Specialization of activities)Year of registration/commencement of business (with documentary proof)………………………………………………………………………………………………………..
3. Name of Proprietor/Directors/Partners etc…………………………………………...........Details of their interests, if any ………………………………… In other business mayalso be indicated…………………………………………………….................................
4. Particulars of staff employed:Name Designation Qualifications Experience Salary Length
of Servicewith the firm
I. .…………..………………………………………………..……………..........….II. ………………………………………………………………………..…………….III. …………………………………………………………………………..………….IV. ……………………………………………………………………………..……….
5. Details of office premises (Documentary proof / Rent Agreement / Ownership Deedto be made available)-Space in sq. ft………………….........................………………
249INDIA TOURISM STATISTICS 2009
Location area (please tick mark the right box)
commercial
residential
Reception area……………Accessibility to toilets (Please write Yes or No)………......
6. Name of Bankers (please attach a reference letter on original letterhead from yourBankers)…………………………………………………………....……………………..
7. Name of Auditors ……………………………………………………………………… ABalance-Sheet and Profit & Loss statement pertaining to the tour operation business,as prescribed under Company Law, must be submitted by each applicant. Theseaudited statements should be in respect of your establishment for the last completedfinancial year or for the calendar year immediately preceding the date of submissionof your application. Also furnish details of your turnover in the following statement:-
PARTICULARS OF THE ADVENTURE TOUR OPERATOS CONCERNED
a) Paid up Capital (Capital employed) ……………………….........………………………..b) Loans:
i) Secured ……………………………........…………………………ii) Unsecured …………………............………………………………..
c) Reserves …………………………………………………………………………...........….
d) Current liabilities and provisions…................……………………………………………
e) Total (a to d): …………………………………………………………....…………………
f) Fixed assets (excluding intangible assets)………………………….....………………..
g) Investment ……………………………………………………………….....……………….
h) Current assets ……………………………………………………………....……………...
i) Intangible Assets ………………………………………………………….....……………..
j) Total (f to i) ………………………………………………………………....……………….
Notes:
i) Reserves should include balance of profit and loss Account and exclude taxationreserve.
ii) Current liabilities and provisions should include taxation reserve.
iii) Current assets should include sundry debts, loans advances, cash and bank balance
iv) Intangible assets should include goodwill preliminary expenses, tenancy and businessrights, deferred revenue expenditure, accumulated loss etc.
250INDIA TOURISM STATISTICS 2009
8. Copy of acknowledgement in respect of Income tax return for the current assessmentyear should be enclosed ………………………………………….............
9. Certificate of Chartered Accountant in original regarding turn over from Adventuretourism / Adventure sports related activities only for the preceding or latest year.
10. Whether any other activities are undertaken by the firm besides tour operations.
11. Please indicate membership of International Travel Organizations, if any………………………………………………………………………………………………………..
12. Give details of:
a) Volume of tourist traffic handled upto the date of application showing foreign anddomestic tourist traffic separately. Please submit a certificate from CharteredAccountant in original. This certificate should show the receipts from AdventureTour operations only during the financial year or the calendar year immediatelypreceding the date of submission of your application.
b) Clientele: special tourist groups handled, if any, their size, frequency, etc.
c) Steps taken to promote domestic tourist traffic and details of the groups handled,if any.
d) Special programmes if any, arranged for foreign tourists
13. Please indicate details of trained manpower available to operate such tours. (Pleasegive details of the persons employed in your organization who are trained and alsoattach copies of their certificates of training they have undertaken).
14. Whether the agency has its own equipments or hired from another handling agency.Give details of the equipment available.
15. The handling agency if located outside or at operational area must also be approvedby the Ministry of Tourism, Government of India.
16. Give details of the facilities available with them (handling agency located outside)including trained manpower, equipment, etc.
17. In case of emergency, please indicate the equipments available for emergency lift up/evacuation of the persons. In respect of emergencies, the following undertaking hasto be signed by the Adventure Tour Operator:-
251INDIA TOURISM STATISTICS 2009
UNDERTAKING:
I, Shri / Smt. ……………………….undertake the responsibility for operation of this adventuretour (specify details) for efficient handling of the operation and bear the damages (tolife or property of dislocation of environment) being the Principal Agent. I also promisethat guidelines for operation of…………………………(Adventure Sports) as circulatedby Ministry of Tourism will be followed in letter and spirit.
18. In case of any change in the scope of activities the same may be brought to thenotice of MOT within one month.
19. Indicate the type of insurance facilities available with the company whether group orpersonal.
20. Whether porters used for adventure purposes are also experienced and insured.
21. Any additional information the organization would like to give with the reference to theadventure tourism activities undertaken by the firm.
22. Please enclose Demand Draft of Rs. 3,000/- for Head Office and Rs.3, 000/- for eachBranch Office as fee for recognition/renewal.
For Head Office, please mention:
Demand Draft No………........……...Date ………………………Amount ……………..........…
For Branch office(s) please mention:
Demand Draft No………........……...Date ………………………Amount ……………..........…
Signature of Proprietor/Partner/Managing Director
Rubber StampPlace:Date:
NB. I The guidelines including application form may be downloaded fromwebsite www.tourism.gov.in
II. This application should be submitted in duplicate along with all supportingdocuments.
III. Please quote reference number of Ministry of Tourism if the application is forrenewal of recognition.
IV. Separate application form to be filled in duplicate along with the requireddocuments, when applying for Branch Office(s).

252INDIA TOURISM STATISTICS 2009
LIST OF DOCUMENTS (CHECK LIST) REQUIRED FORFIRST APPROVAL/ RENEWAL AS AN APPROVED
ADVENTURE TOUR OPERATOR
1. Application form in duplicate duly filled in.
2. Two attested photographs pasted on both the copies of application form.
3. Documentary proof (preferably registration certificates from govt.) in support ofbeginning of operations of your firm.
4. Copy of Complete Audited Balance Sheet for the latest financial year.
5. Income Tax Acknowledgement for the latest assessment year.
6. Service Tax Registration certificate from the concerned authority.
7. Certificate of Chartered Accountant stating your paid-up capital not less than Rs.3.00 lakhs.
8. Reference letter from Bank on its letterhead (in original) regarding your firm’s bankaccount.
9. Details of staff employed giving names, educational qualification & experience ifany in tourism field and length of service in your organization (copies of certificatesto be enclosed):
a) The Adventure Tour operator should have a minimum of four qualified staff out ofwhich at least one should have Diploma / Degree in Tourism & Travel Managementfrom a recognized University, IITTM, any institution approved by AICTE or shouldbe trained from reputed specialized Institutes in Private / Public Sector. The ownerof the firm would be included as one of the qualified employees. Either, the Owner /Director himself or their Operations - Chief employed should be well qualified in theactivity the adventure operator wants to pursue, which is determined by certificationby any national or international institute in the activity or minimum of eight years ofpractical experience.
b) The academic qualifications may be relaxed in case of the other two staff memberswho are exceptionally experienced personnel in Airlines, Shipping, Transport, PRAgencies, Hotels and other corporate bodies and those who have two yearsexperience with Ministry of Tourism approved tour operators.
c) For the agencies located in the North – Eastern region, remote and rural areas, thereshould be a minimum of two qualified staff out of which one should have a Diploma/ Degree in Tourism & Travel Management from a recognized University, IITTM oran institution approved by AICTE or should be trained from reputed specializedInstitutes in Private / Public Sector. The owner of the firm would be included as oneof the qualified employees.

253INDIA TOURISM STATISTICS 2009
*****
10. List of Directors/Partners or name of the Proprietor.
11. Details of office premises, whether located in commercial or residential area, officespace in sq. ft. (The minimum office space should be at least 150 sq. ft for rest ofIndia and 100 sq. ft for hilly areas which are above 1000 meters from sea level) andaccessibility to toilet and reception area.
12. Certificate of Chartered Accountant on original letter head in support of your turnoverin foreign exchange or in Indian Rupees from adventure tourism related activitiesonly which should not be less than Rs. 10.00 Lakh during the last financial / calendaryear.
13. Demand Draft for Rs. 3,000/- towards processing fees payable to Pay and AccountsOfficer, Ministry of Tourism, Government of India.
14. Documents duly attested by competent officer.
NOTE:
I. The above - mentioned documents may be submitted in duplicate.
II. Please fill up separate application form(s), in duplicate, for Branch Office(s),if any.
III. The guidelines including application form may be downloaded fromwebsite www.tourism.gov.in
254INDIA TOURISM STATISTICS 2009
1. The aims & objectives of the scheme for recognition of Domestic Tour Operator are toencourage quality standard and service in this category so as to promote tourism inIndia. This is a voluntary scheme open to all bonafide tour Operators to bring them inorganized sector.
2. Definition: A domestic tour operator is one who makes arrangements for transport,accommodation, sight seeing, entertainment and other tourism related services fordomestic tourists.
3. The application for recognition shall be addressed to the Additional Director General,Ministry of Tourism, Transport Bhawan, 1, Parliament Street, New Delhi- 110 001.
4. The recognition as an approved Domestic Tour Operator shall be granted by theMinistry of Tourism, Government of India, New Delhi initially, for five years, based onthe Inspection Report / Recommendations of a Committee comprising of concernedRegional Director and a member of ADTOI.
5. The application for renewal/extension shall be addressed to the Regional Director ofthe concerned region as per the following addresses:-
a) The Regional Director (East), India Tourism, “Embassy”, 4, Shakespeare Sarani,Kolkata – 700 071, West Bengal. Phone No. (033) 2282 5813 / 2282 1475,Fax: (033) 2282 3521, Email: [email protected]
b) The Regional Director (West), India Tourism, 123, M. Karve Road, Opp. ChurchGate, Mumbai – 400 020, Maharashtra. Phone No. (022) 2208 3263 / 22074333 / 2207 4334, Fax: (022) 2201 4496, Email: [email protected],[email protected]
c) The Regional Director (North), India Tourism, 88 – Janpath, New Delhi 110 001.Phone No. (011) 2332 0342 / 2332 0005 / 2332 0008, Fax: (011) 2332 0109,Email: [email protected]
d) The Regional Director (South), India Tourism, 154, Anna Salai, Chennai – 600002, Tamil Nadu. Phone No. (044) 2846 0285 / 2846 1459, Fax: (044) 28460193, Email: [email protected], [email protected]
e) The Regional Director (North – East), India Tourism, Asom Paryatan Bhawan,3rd Floor, Near Nepali Mandir, A. K. Azad Road, Paltan Bazar, Guwahati – 781008, Assam. Phone No. (0361) 273 7554, Fax No. (0361) 273 7553, Email:[email protected]
6. The renewal / extension, thereafter, shall be granted for five years after inspectionconducted by a Committee comprising of concerned Regional Director and a memberof ADTOI, on an application made by the Domestic Tour Operator along with therequisite fee / documents.
APPENDIX-X
GUIDELINES FOR RECOGNITION / RENEWAL AS AN APPROVEDDOMESTIC TOUR OPERATOR
[Revised with effect from 4th December 2009]
255INDIA TOURISM STATISTICS 2009
7. The documents received from applicants after scrutiny in all respects will beacknowledged by the Travel Trade Division in respect of first approval and by theconcerned Regional Director for renewal. The inspection for first approval / renewalshall be conducted by the Inspection Team within a period of sixty working days fromthe receipt of complete application.
8. The following conditions must be fulfilled by the Domestic Tour Operator for grant ofrecognition / renewal by Ministry of Tourism:
i) The application for grant of recognition / renewal shall be in the prescribed formand submitted in duplicate along with the required documents.
ii) The Domestic Tour operator should have a minimum Paid up Capital (or Capitalemployed) of Rs.3.00 lakh duly supported by the latest Audited Balance Sheet/ Chartered Accountant’s certificate.
iii) The turn-over of the firm from domestic tour operation business only should bea minimum of Rs. 20.00 lakh duly supported by Chartered Accountant’scertificate.
iv) The Domestic Tour operator should have an office under the charge of theowner or a full time member of their staff, who is adequately trained / experiencedin matters regarding transport, accommodation, currency, customs regulationsand general information about tourism and travel related services. However,greater emphasis may be given to effective communication skills in Hindi andEnglish.
There should be a minimum of four qualified staff out of which at least one should haveDiploma / Degree in Tourism & Travel Management from a recognized University, IITTM oran institution approved by AICTE. The owner of the firm would be included as one of thequalified employees.
The academic qualifications may be relaxed in case of the other two staff members who areexceptionally experienced personnel in Airlines, Shipping, Transport, PR Agencies, Hotelsand other corporate bodies and those who have two years experience with Ministry of Tourismapproved tour operators.
For the agencies located in the North – Eastern region, remote and rural areas, there shouldbe a minimum of two staff out of which one should be a qualified employee with a Diploma /Degree in Tourism & Travel Management from a recognized University, IITTM or an institutionapproved by AICTE. The owner of the firm would be included as one of the qualified employees.
v) The Domestic Tour Operator should have been in operation for a minimumperiod of one year before the date of application.
vi) The minimum office space should be at least 150 sq. ft for rest of India and100 sq. ft for hilly areas which are above 1000 meters from sea level.Besides, the office should be located in neat and clean surroundings andequipped with telephone, fax and computer/computer reservation system etc.There should be sufficient space for reception and easy access to toilets.
256INDIA TOURISM STATISTICS 2009
vii) The Domestic Tour operator should be an income tax assessee and shouldhave filed Income Tax Returns for the last or current assessment year. Theyshould have registered for Service Tax and made full payment of the assessedservice tax for the preceding year.
viii) Disclaimer: The Domestic Tour Operator should employ only Regional LevelGuides trained and licensed by Ministry of Tourism, Government of India andState Level Guides approved by the State Governments. The implementationof this clause would be subject to the decision of Hon’ble High Court of Rajasthanin Writ Petition No. 5607 / 2004 and other Hon’ble Courts.
ix) The Domestic Tour operator shall contract / use approved specialized agenciesin the field of Adventure Options and related services for the tourists.
9. The Domestic Tour operator will be required to pay a non - refundable fee ofRs.3, 000/- while applying for the recognition and renewal of Head Office as well aseach Branch Office. The fee will be made payable to the Pay & Accounts Officer,Ministry of Tourism in the form of a Bank Draft.
10. The recognition / renewal will be granted to the Head Office of the Domestic TourOperator. Branch offices will be approved along with the Head Office or subsequently,provided the particulars of the Branch offices are submitted to Ministry of Tourismfor recognition and for renewal to the concerned Regional Director and accepted byit.
11. The Domestic Tour operator so granted recognition / renewal shall be entitled to suchincentives and concessions as may be granted by the Government from time to timeand shall abide by the terms and conditions of recognition as prescribed from time totime by the Ministry of Tourism, Government of India.
12. Even though the scheme of granting approval of recognition to service providers ofTravel Trade is voluntary, in nature, there is a need to have a pro - active role ofMinistry of Tourism and Travel Trade to ensure that more and more service providersseek approval and then service the tourists. There is also a need to educate thestakeholders as well as consumers against the potential risk of availing servicesthrough the unapproved service providers.
13. It shall be mandatory for an approved service provider of Travel Trade to prominentlydisplay the Certificate of approval of recognition given by Ministry of Tourism in theoffice by pasting it on a board or in a picture frame so that it is visible to a potentialtourist.
14. The decision of the Ministry of Tourism, Government of India in the matter ofrecognition / renewal shall be final. However, MOT may in their discretion refuse torecognize / renew any firm or withdraw / withhold at any time recognition / renewalalready granted with the approval of the Competent Authority. Before such a decisionis taken, necessary Show Cause Notice would invariably be issued and the replyconsidered on merit. This will be done after careful consideration and generally as alast resort. Circumstances in which withdrawal is effected would also be indicated.
15. The guidelines including application form may be downloaded fromwebsite www.tourism.gov.in
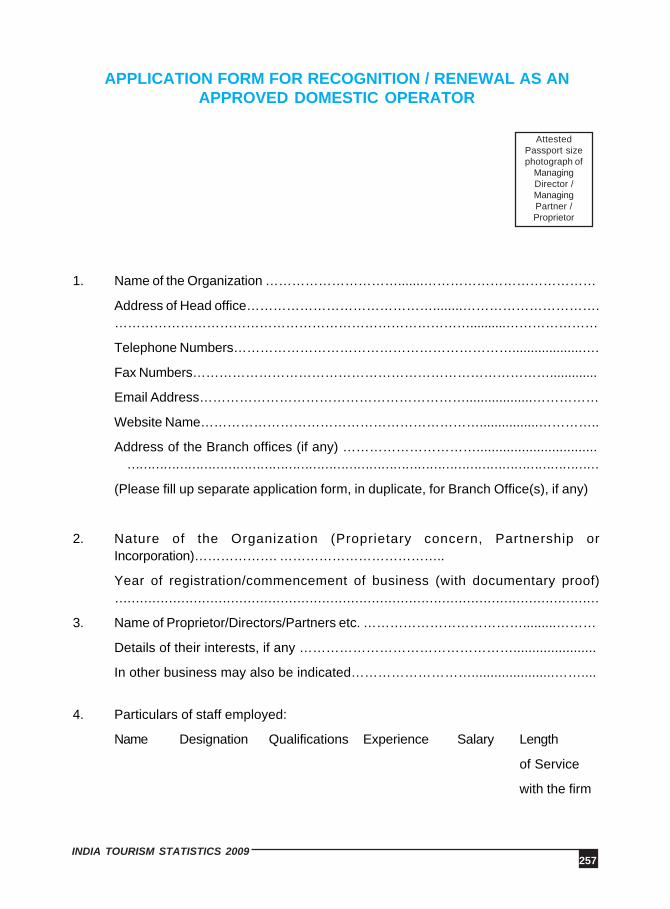
257INDIA TOURISM STATISTICS 2009
APPLICATION FORM FOR RECOGNITION / RENEWAL AS ANAPPROVED DOMESTIC OPERATOR
AttestedPassport sizephotograph of
ManagingDirector /ManagingPartner /Proprietor
1. Name of the Organization ………………………….......…………………………………
Address of Head office……………………………………........………………………….………………………………………………………………………..........…………………
Telephone Numbers………………………………………………………...................….
Fax Numbers……………………………………………………………………….............
Email Address……………………………………………………..................……………
Website Name………………………………………………………................…………..
Address of the Branch offices (if any) …………………………................................ ………………………………………………………………………………………………………
(Please fill up separate application form, in duplicate, for Branch Office(s), if any)
2. Nature of the Organization (Proprietary concern, Partnership orIncorporation)………………. ………………………………..
Year of registration/commencement of business (with documentary proof)………………………………………………………………………………………………………
3. Name of Proprietor/Directors/Partners etc. ……………………………….........………
Details of their interests, if any …………………………………………......................
In other business may also be indicated………………………......................……....
4. Particulars of staff employed:
Name Designation Qualifications Experience Salary Length
of Service
with the firm

258INDIA TOURISM STATISTICS 2009
I. ………………………………………………….........……………………………
II. …………………………………………………………...…………………………
III. ………………………………………………………………………………………
IV. ……………………………………………………………...………………………
5. Details of office premises (Documentary proof/Rent Agreement / Ownership Deed tobe made available)-Space in sq. ft………………
Location area (please tick mark the right box)
commercial
residential
Reception area………………
Accessibility to toilets (Please write Yes or No)…………………….
6. Name of Bankers (please attach a reference letter on original letterhead from yourBankers)……………………………………………………………………………….
7. Name of Auditors ………………………………………………………………………A complete Audited Balance-Sheet and Profit & Loss Statement pertaining to thedomestic tour operation business, as prescribed under Company Law, must besubmitted by each applicant. These audited statements should be in respect of yourestablishment for the last completed financial year or for the calendar year immediatelypreceding the date of submission of your application. Also furnish details of yourturnover in the following statement:-
PARTICULARS OF THE DOMESTIC TOUR OPERATOR CONCERNED
a) Paid up Capital (Capital employed) ………………………………………………
b) Loans:
i) Secured …………………………………………………………………………..
ii) Unsecured ………………………………………………………………………….
c) Reserves……. …………………………………………………………………………….
d) Current liabilities and provisions……………………………..
e) Total (a to d): ……………………………………………………………………………
f) Fixed assets (excluding intangible assets)………………………………………….
g) Investment ………………………………………………………………………………

259INDIA TOURISM STATISTICS 2009
h) Current assets …………………………………………………………………………..
i) Intangible Assets ………………………………………………………………………..
j) Total (f to i) ……………………………………………………………………………….
Notes:
i) Intangible assets should include goodwill preliminary expenses, tenancy andbusiness rights, deferred revenue expenditure, accumulated loss etc.
ii) Reserves should include balance of Profit and Loss Account and exclude taxationreserve.
iii) Current liabilities and provisions would include taxation reserve.
iv) Current assets should include sundry debts, loans advances, cash and bank balance.
8. A copy of acknowledgement in respect of Income tax return for the current assessmentyear should be enclosed……………………………………………...
9. Certificate of Chartered Accountant in original regarding turn over from DomesticTour Operations only for the preceding or latest year.
10. Documents pertaining to any promotional activities undertaken by the firm shouldbe enclosed.
11. Please indicate membership of International Travel Organizations, if any………………………………………………………………………………………………………
12. Give details of :
a) Volume of domestic tourist traffic handled (Please submit a certificate fromChartered Accountant). This certificate should show the receipts from DomesticTour operation only during the financial year or the calendar year immediatelypreceding the date of submission of your application.
b) Clientele: special tourist groups handled, if any, their size, frequency, etc.
c) Steps taken to promote domestic tourist traffic and details of the groups handled,if any.
d) Special programmes if any, arranged for domestic tourists.
e) Please attach publicity material such as brochures / folders / leaflets / postersconcerning itineraries and website address of the agency.
13. Number of conferences handled, if any, and the total number of passengers for suchconferences with details of locations, etc.
14. Number of incentive tours handles.
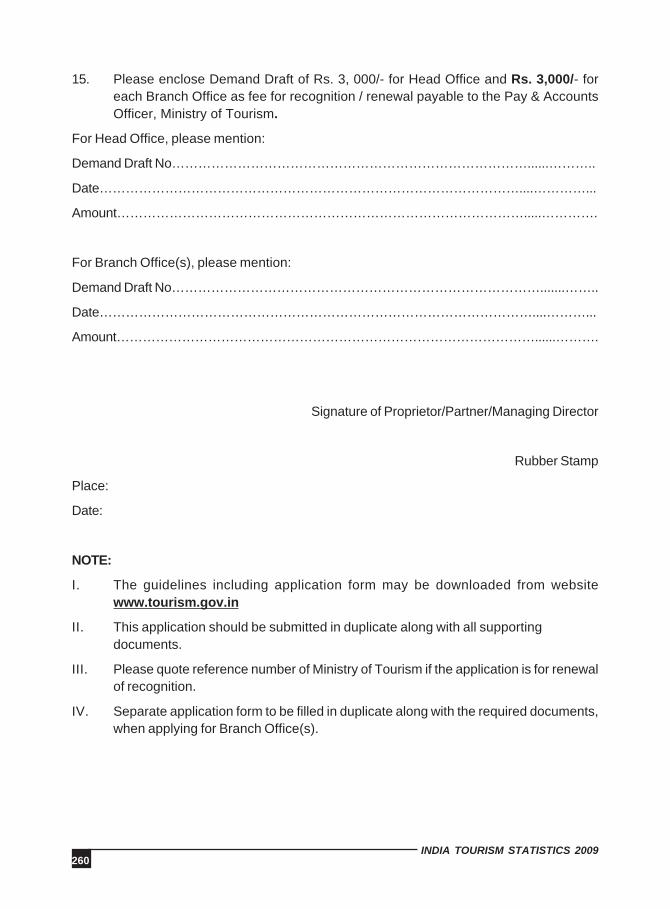
260INDIA TOURISM STATISTICS 2009
15. Please enclose Demand Draft of Rs. 3, 000/- for Head Office and Rs. 3,000/- foreach Branch Office as fee for recognition / renewal payable to the Pay & AccountsOfficer, Ministry of Tourism.
For Head Office, please mention:
Demand Draft No………………………………………………………………………......………..
Date……………………………………………………………………………………....…………...
Amount………………………………………………………………………………….....………….
For Branch Office(s), please mention:
Demand Draft No………………………………………………………………………….......……..
Date………………………………………………………………………………………....………...
Amount……………………………………………………………………………………......……….
Signature of Proprietor/Partner/Managing Director
Rubber Stamp
Place:
Date:
NOTE:
I. The guidelines including application form may be downloaded from websitewww.tourism.gov.in
II. This application should be submitted in duplicate along with all supportingdocuments.
III. Please quote reference number of Ministry of Tourism if the application is for renewalof recognition.
IV. Separate application form to be filled in duplicate along with the required documents,when applying for Branch Office(s).
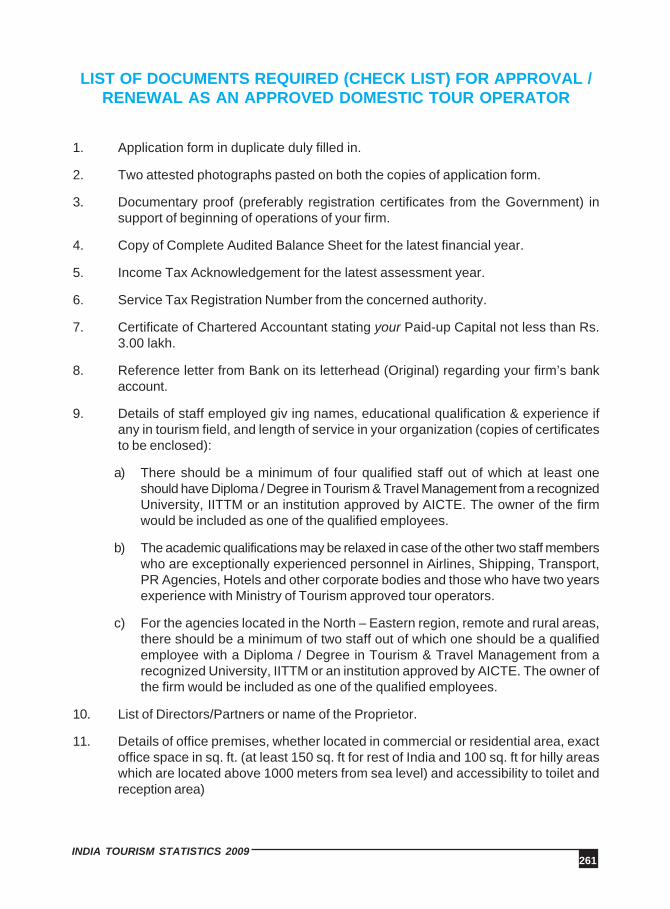
261INDIA TOURISM STATISTICS 2009
LIST OF DOCUMENTS REQUIRED (CHECK LIST) FOR APPROVAL /RENEWAL AS AN APPROVED DOMESTIC TOUR OPERATOR
1. Application form in duplicate duly filled in.
2. Two attested photographs pasted on both the copies of application form.
3. Documentary proof (preferably registration certificates from the Government) insupport of beginning of operations of your firm.
4. Copy of Complete Audited Balance Sheet for the latest financial year.
5. Income Tax Acknowledgement for the latest assessment year.
6. Service Tax Registration Number from the concerned authority.
7. Certificate of Chartered Accountant stating your Paid-up Capital not less than Rs.3.00 lakh.
8. Reference letter from Bank on its letterhead (Original) regarding your firm’s bankaccount.
9. Details of staff employed giv ing names, educational qualification & experience ifany in tourism field, and length of service in your organization (copies of certificatesto be enclosed):
a) There should be a minimum of four qualified staff out of which at least oneshould have Diploma / Degree in Tourism & Travel Management from a recognizedUniversity, IITTM or an institution approved by AICTE. The owner of the firmwould be included as one of the qualified employees.
b) The academic qualifications may be relaxed in case of the other two staff memberswho are exceptionally experienced personnel in Airlines, Shipping, Transport,PR Agencies, Hotels and other corporate bodies and those who have two yearsexperience with Ministry of Tourism approved tour operators.
c) For the agencies located in the North – Eastern region, remote and rural areas,there should be a minimum of two staff out of which one should be a qualifiedemployee with a Diploma / Degree in Tourism & Travel Management from arecognized University, IITTM or an institution approved by AICTE. The owner ofthe firm would be included as one of the qualified employees.
10. List of Directors/Partners or name of the Proprietor.
11. Details of office premises, whether located in commercial or residential area, exactoffice space in sq. ft. (at least 150 sq. ft for rest of India and 100 sq. ft for hilly areaswhich are located above 1000 meters from sea level) and accessibility to toilet andreception area)

262INDIA TOURISM STATISTICS 2009
***
12. Certificate of Chartered Accountant on original letter head in support of your turnoverfrom domestic tour operations only which should not be less than Rs. 20.00 Lakhduring the last financial/calendar year.
13. Demand Draft for Rs. 3,000/- towards processing fees payable to Pay and AccountsOfficer, Ministry of Tourism, Govt. of India.
14. Documents duly attested by competent officer.
NOTE:
I. The above - mentioned documents may be submitted in duplicate.II. Please fill up separate application form(s), in duplicate, for Branch Office (s),
if any.III. The guidelines including application form may be downloaded from
website www.tourism.gov.in
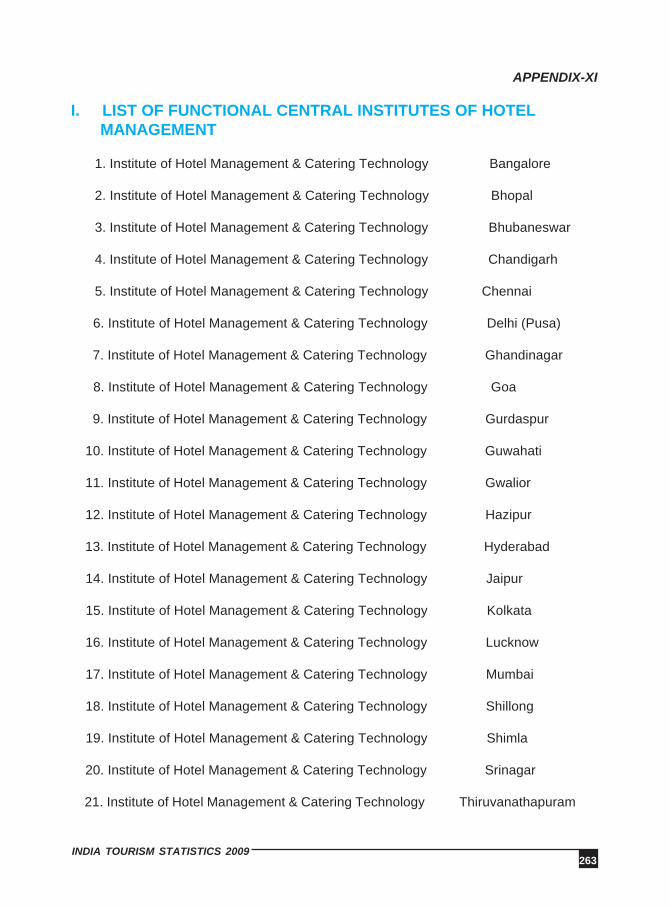
263INDIA TOURISM STATISTICS 2009
APPENDIX-XI
I. LIST OF FUNCTIONAL CENTRAL INSTITUTES OF HOTEL MANAGEMENT
1. Institute of Hotel Management & Catering Technology Bangalore
2. Institute of Hotel Management & Catering Technology Bhopal
3. Institute of Hotel Management & Catering Technology Bhubaneswar
4. Institute of Hotel Management & Catering Technology Chandigarh
5. Institute of Hotel Management & Catering Technology Chennai
6. Institute of Hotel Management & Catering Technology Delhi (Pusa)
7. Institute of Hotel Management & Catering Technology Ghandinagar
8. Institute of Hotel Management & Catering Technology Goa
9. Institute of Hotel Management & Catering Technology Gurdaspur
10. Institute of Hotel Management & Catering Technology Guwahati
11. Institute of Hotel Management & Catering Technology Gwalior
12. Institute of Hotel Management & Catering Technology Hazipur
13. Institute of Hotel Management & Catering Technology Hyderabad
14. Institute of Hotel Management & Catering Technology Jaipur
15. Institute of Hotel Management & Catering Technology Kolkata
16. Institute of Hotel Management & Catering Technology Lucknow
17. Institute of Hotel Management & Catering Technology Mumbai
18. Institute of Hotel Management & Catering Technology Shillong
19. Institute of Hotel Management & Catering Technology Shimla
20. Institute of Hotel Management & Catering Technology Srinagar
21. Institute of Hotel Management & Catering Technology Thiruvanathapuram
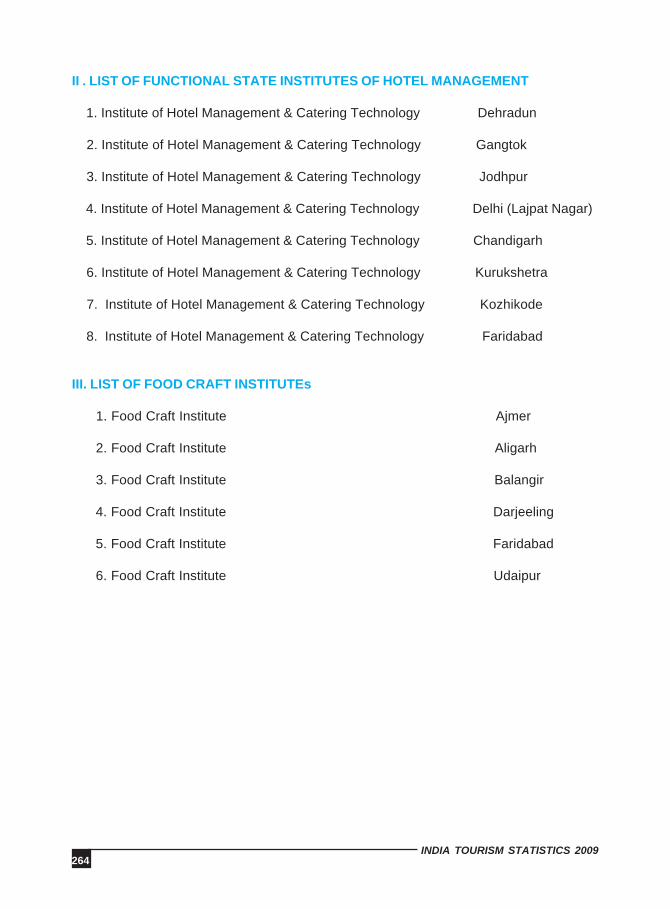
264INDIA TOURISM STATISTICS 2009
II . LIST OF FUNCTIONAL STATE INSTITUTES OF HOTEL MANAGEMENT
1. Institute of Hotel Management & Catering Technology Dehradun
2. Institute of Hotel Management & Catering Technology Gangtok
3. Institute of Hotel Management & Catering Technology Jodhpur
4. Institute of Hotel Management & Catering Technology Delhi (Lajpat Nagar)
5. Institute of Hotel Management & Catering Technology Chandigarh
6. Institute of Hotel Management & Catering Technology Kurukshetra
7. Institute of Hotel Management & Catering Technology Kozhikode
8. Institute of Hotel Management & Catering Technology Faridabad
III. LIST OF FOOD CRAFT INSTITUTEs
1. Food Craft Institute Ajmer
2. Food Craft Institute Aligarh
3. Food Craft Institute Balangir
4. Food Craft Institute Darjeeling
5. Food Craft Institute Faridabad
6. Food Craft Institute Udaipur

265INDIA TOURISM STATISTICS 2009
APPENDIX-XII
GUIDELINES OF SCHEME FOR IHMs/FCIs/IITTM/ITIs/POLYTECHNIC
INSTITUTES/UNIVERSITIES/GOVT. COLLEGES/GOVT.VOCATIONAL SCHOOLS/PSUs
The Ministry of Tourism extends financial assistance for the setting up and up-gradationof Institutes of Hotel Management & Catering Technology & Applied Nutrition (IHMs), FoodCraft Institutes (FCIs) in the country. The Indian Institute of Tourism & Travel Management(IITTM) and National Council of Hotel Management & Catering Technology (NCHMCT) arealso eligible for this assistance. The purpose underlying these efforts is to create institutionalinfrastructure that could foster and facilitate professional education and training specific totourism, travel and hospitality industry. The institutional infrastructure, however, not onlyneeds to be expanded constantly in order to meet the ever increasing demand of skilledpersonnel/ professionals, but also needs to be strengthened and upgraded so that it retains/acquires internationally acceptable benchmark of quality. It is in the backdrop of this that theexisting guidelines for regulating outflow of assistance have been reviewed, primarily with aview to eliminating the felt inadequacies in the scheme of things and to meet the newemerging realities, and it has been decided to adopt the following revised guidelines.
Section A - IHMs / NCHMCT / IITTM
Eligibility
2. A society created by the Central/State Government/ UT Administration to manage anIHM shall be eligible for Central assistance. The two autonomous societies created bythe Central Government, namely the Indian Institute of Tourism & Travel Management& National Council of Hotel Management & Catering Technology shall also be eligiblefor Central assistance.
Scope
3. Central assistance shall be admissible for the following:
NEW INSTITUTES
a) Setting up of an IHM.b) Setting up of centres / branches of IITTM / NCHMCT / existing IHMs.
CONDITIONS
i) Assistance shall be considered for the setting up of an IHM proposed by a State
266INDIA TOURISM STATISTICS 2009
Government / UT Administration only after the State Government/UT Administrationconcerned has transferred a developedpiece of land, free from all encumbrances,necessary for the purpose, measuring not less that five acres and has also committedto provide basic services/utilities like electricity, water supply, provision of sewerageetc.
ii) Assistance shall be on the condition that the proposed IHM shall also conduct skillcourses.
iii) Assistance shall be subject to ceiling of Rs.1000 lakhs for the setting up of an IHM.The cost thereof, if it exceeds the ceiling, shall be met by the State Government/UTAdministration concerned. An additional assistance of upto Rs.200 lakhs may beconsidered in case the same is intended to meet the cost of additional hostel facilities.However, quantum of assistance for the setting up of an IHM created by the CentralGovernment, or the setting up of a centre/branch of the IITTM or NCHMCT, shall notbe subject to this ceiling.
iv) Assistance to a new IHM proposed by the State Govt. / UT Administration shall beutilized subject to further ceilings of Rs. 800 lakhs on construction and Rs. 200 lakhson purchase of equipments.
v) Assistance may cover expenditure on such items as campus development, teachingblock, administrative block, kitchens, laboratories, library, hostels, computer labs,mess, canteens, auditorium, seminar halls, basic recreational facilities, staff quarters,purchase of equipments and on any other incidental though indispensable items.
EXISTING INSTITUTES
a) Expansion of an existing Institute/including hostels to provide not only for a feltinfrastructural inadequacy but also to up-grade the existing one to internationalstandards.
b) For new equipments required to make an institute to keep abreast withtechnological advancements.
c) For modernization of institute’s library.
d) For modernization of laboratories including computer labs.
CONDITIONS
i) Central assistance to existing IHMs including FCIs upgraded to IHMs set up by theState Govts. / UT Administrations shall be subject to over-all ceiling of Rs. 1000 lakhsin each case with ceiling of Rs. 800 lakhs on construction and Rs. 200 lakhs onequipments applied. An upgraded IHM shall be considered for ssistance only upon acertification by the NCHMCT to the effect that the Institute so upgraded possesses aminimum of infrastructure (a campus with minimum area of five acres, buildings,
267INDIA TOURISM STATISTICS 2009
laboratories and equipments) as to qualify as an IHM. An additional assistance of uptoRs.200 lakhs may be considered in case same is intended to meet the cost of additionalhostel facilities. The ceiling of assistance to a State IHM shall take into account theassistance extended to it previously under the Scheme.
ii) Modernization of library and laboratories shall be treated different from constructionand equipments though assistance to cover them shall also be within the ceiling of Rs.1000 lakhs.
iii) Assistance to Central Institutes including IITTM and NCHMCT shall be need-basednot subject to a ceiling.
vi) Assistance shall be on the condition that the IHM shall also conduct skill courses.

268INDIA TOURISM STATISTICS 2009
SECTION B - FCIs
Eligibility
4. A society created by the Central Government/State Government/ UT Administrations tomanage an FCI shall be eligible for Central assistance.
Scope
I NEW FCIs
5. Central assistance shall be admissible for the setting up of an FCI.
Conditions
i) Assistance shall be considered for the setting up of an FCI by the Central Governmentor proposed by a State Government / UT Administration. In the latter case, assistanceshall be considered only after the State Government/UT Administration concerned hastransferred a developed piece of land, free from all encumbrances, necessary for thepurpose, measuring not less than three acres and has also committed to provide basicservices/utilities like electricity, water supply, provision of sewerage etc. Assistanceshall also be considered for the setting up an FCI in an existing building offered by theState Government/ UT Administration concerned for the purpose provided such changeover is otherwise feasible.
ii) Assistance shall be subject to ceiling of Rs.475 lakhs for the setting up of an FCI. Thecost thereof, if it exceeds the ceiling, shall be met by the State Government/UTAdministration concerned. However, quantum of assistance for the setting up of anFCI created by the Central Government shall not be subject to this ceiling.
iii) Assistance to a new FCI proposed by the State Govt. / UT Administration shall beutilized subject to further ceilings of Rs. 375 lakhs on construction and Rs. 100 lakhson purchase of equipments.
iv) Assistance may cover expenditure on such items as campus development, teachingblock, administrative block, kitchens, laboratories, library, hostels, mess, canteens,auditorium, seminar halls, basic recreational facilities, staff quarters, purchase ofequipments and on any other incidental though indispensable item.
II EXISTING FCIs
i) Expansion of an existing Institute/including hostels to provide not only for a feltinfrastructural inadequacy but also to up-grade the existing one.
ii) For replacing equipments which are dated or which are spent or for acquiring newequipments necessary to keep abreast with technological advancements.
269INDIA TOURISM STATISTICS 2009
a) For the modernization of library.b) For the modernization of laboratories.
CONDITIONS
i) Central assistance to an existing FCI set up by the State Govt. / UTAdministrationshall be subject to over-all ceiling of Rs. 475 lakhs with ceiling of Rs. 375 lakhs onconstruction and Rs. 100 lakhs on equipments applied. Modernization of library andlaboratories shall be treated different from construction and equipments thoughassistance to cover them shall also be within the ceiling of Rs.475 lakhs. The ceiling ofassistance to a State FCI shall take into account the assistance extended to it previouslyunder the Scheme.
ii) Assistance to Central FCIs shall be need-based not subject to any ceiling.
SECTION C - EXECUTIVE DEVELOPMENT CENTRES
6. No new Executive Development Centres (EDCs) shall be sanctioned though assistanceto the EDCs that already stand sanctioned will continue on terms o fconditions of eachsanction. The Ministry of Tourism will, however, promote setting up of EDCs in publicprivate partnership mode.
SECTION D - OTHER GENERAL CONDITIONS/NORMS
7. Central assistance shall be further subject to the following conditions/norms:
i) Central assistance shall under no circumstances be utilized for meeting recurring and/or establishment expenditures.
ii) IHMs/FCIs shall normally charge fee as prescribed by the NCHMCT.
iii) There shall be at least three nominees of the Ministry of Tourism on the Board ofGovernors (BOGs) of an IHM/FCI society.
iv) IHMs/FCIs shall follow the academic/admission norms prescribed by the NCHMCT.Admissions to IHMs shall be on the basis of a joint entrance examination. An undertakingto this effect shall be given by the State Government/UT Administration concernedbefore funds are sanctioned for the setting up an IHM.
v) The State Government/UT Administration or the society concerned shall complete thebuilding project, including expansion/up-gradation of the existing building, within a periodof three years or such period as may be prescribed by the Central Ministry of Tourismdepending on the nature of the project.
vi) Proposal for new IHM/FCI shall be submitted by the State Government/UT Administrationduly supported with ‘Detailed Project Report’ prepared by a reputed/established agencyhaving experience and capability of executing such projects.
270INDIA TOURISM STATISTICS 2009
vii) Central assistance shall be further subject to any other project specific conditions thatthe Central Ministry of Tourism may impose.
SECTION E - PROMOTIONAL INITIATIVES
8. The Ministry of Tourism may consider, on being approached, one time Central FinancialAssistance not exceeding Rs. 200 lakhs to a governmental institute, such as ITI,polytechnic institute, university, college owned by a government or a university, apublic sector undertaking which offers course(s) specific to hospitality crafts (includingmanagement courses) or travel/tourism, for facilitating development of institutionalinfrastructure, subject to conditions that the Ministry may impose on case to casebasis. Similarly, the Ministry may also consider, on being approached, one time CFAnot exceeding Rs. 25 lakhs to a government school (including a Kendriya Vidyalaya)which offers hospitality/tourism course at +2 stage, to enable it to develop laboratoryand acquire equipments necessary for and specific to the course. The assistanceshall be subject to such conditions as the Ministry may impose on case to case basis.The assistance will broadly cover the following :
a) INDUSTRIAL TRAINING INSTITUTES
Recipient:Institutions planning to conduct hospitality programmes.
Amount:For expenditure on civil works, equipment, furniture and fixtures etc. subject to amaximum of Rs. 2 crores.
Courses to be conducted:One year and upto two years trade certificate (after class X) in;a. Food Productionb. House keepingc. Front Officed. Food & Beverage Servicee. Bakery & Confectionary
Group sizes:Theory: 50 Students Practical: 25 Students ( At least two trades will be offered )
Civil works: Assistance limited upto Rs.100 lakhs1. Minor alterations & modifications.2. Improvement of Kitchen, Pantry and training restaurant flooring.3. Improvement in wall surface (glazed tiles etc.) of kitchen and pantry.4. Plumbing and electrical improvement work for kitchen, pantry and training restaurant.
271INDIA TOURISM STATISTICS 2009
Heavy & Small Equipment, Furniture & Fixtures etc. in; (Assistance limitedupto Rs.150 lakhs)
1. Basic Training Kitchen2. Advanced Training Kitchen / Pantry / Scullery3. Quantity Food Kitchen & Pot Wash Area4. Larder5. Demonstration Kitchen6. Basic Training Restaurant7. Advanced Training Restaurant8. Bar9. Student Dining Hall & Scullery10. General Stores11. Front Office Lab12. House Keeping Lab13. Linen Room14. Laundry15. Demonstration Lab (House Keeping)16. Bakery17. Confectionery
Note: It is only an illustrative list and not exhaustive.
b) VOCATIONAL SCHOOLS
Recipient: +2 level Vocational stream schools planning to conduct hospitality programmes.
Amount: For expenditure on civil works, equipment, furniture and fixtures etc. subject to a maximum of Rs. 25 lakhs.
Courses to be conducted:a) Two year Vocational course in Food Productionb) Two year Vocational course in Food & Beverage Service
Group sizes: Theory: 60 Students Practical: 30 Students
Civil works: Assistance limited to Rs. 5 lakhs1. Minor alterations & modifications.2. Improvement of Kitchen, Pantry and training restaurant flooring.3. Improvement in wall surface (glazed tiles etc.) of kitchen and pantry.4. Plumbing and electrical improvement work for kitchen, pantry and
training restaurant.
Heavy & Small Equipment, Furniture & Fixtures etc. in; (Assistance 20 Lakhs)1. Training Kitchen:
2. General Stores:
3. Basic Training Restaurant
Note: It is only an illustrative list and not exhaustive.
272INDIA TOURISM STATISTICS 2009
c) UNIVERSITIES & OTHER COLLEGES
Recipient: Institutions planning to conduct hospitality & travel tourism programmes.
Amount: For expenditure on civil works, equipment, furniture and fixtures etc.subject to a maximum of Rs. 200 lakhs.
Courses to be conducted after 10+2 stage:a) Three year diploma/degree in Hotel Management, Travel & Tourismb) One/Two year trade diploma in; atleast one of the following :c) Food Productiond) House keepinge) Front Officef) Food & Beverage Serviceg) Bakery & Confectionary
Group sizes: Theory: 40 Students & Practical: 20 Students
Civil works: Assistance limited to 50 lakhs.1. Minor alterations & modifications.2. Improvement of Kitchen, Pantry and training restaurant flooring etc.3. Improvement in wall surface (glazed tiles etc.) of kitchen and pantry.4. Plumbing and electrical improvement work for kitchen, pantry and training restaurant.
Heavy & Small Equipment, Furniture & Fixtures etc. in; (Assistance 150 Lakhs)1. Basic Training Kitchen2. Advanced Training Kitchen / Pantry / Scullery3. Quantity Food Kitchen & Pot Wash Area4. Larder5. Demonstration Kitchen6. Basic Training Restaurant7. Advanced Training Restaurant8. Bar9. Student Dining Hall & Scullery10. General Stores11. Front Office Lab12. House Keeping Lab13. Linen Room14. Laundry15. Demonstration Lab (House Keeping)16. Bakery17. Confectionery
Note: It is only an illustrative list and not exhaustive.
273INDIA TOURISM STATISTICS 2009
d) POLYTECHNICS & PSUs
Recipient: Institutions planning to conduct hospitality & travel tourism programmes.
Amount: For expenditure on civil works, equipment, furniture and fixtures etc.subject to a maximum of Rs. 200 lakhs.
Courses to be conducted after 10+2 stage:
a. Three year diploma/degree in Hotel Management, Travel & Tourismb. One/Two year trade diploma in atleast one of the following :;c. Food Productiond. House keepinge. Front Officef. Food & Beverage Serviceg. Bakery & Confectionary
Group sizes: Theory: 40 Students & Practical: 20 Students
Civil works: Assistance limited to 50 lakhs.1. Minor alterations & modifications.2. Improvement of Kitchen, Pantry and training restaurant flooring etc.3. Improvement in wall surface (glazed tiles etc.) of kitchen and pantry.4. Plumbing and electrical improvement work for kitchen, pantry and training restaurant.
Heavy & Small Equipment, Furniture & Fixtures etc. in; (Assistance 150 Lakhs)1. Basic Training Kitchen2. Advanced Training Kitchen / Pantry / Scullery3. Quantity Food Kitchen & Pot Wash Area4. Larder5. Demonstration Kitchen6. Basic Training Restaurant7. Advanced Training Restaurant8. Bar9. Student Dining Hall & Scullery10. General Stores11. Front Office Lab12. House Keeping Lab13. Linen Room14. Laundry15. Demonstration Lab (House Keeping)16. Bakery17. Confectionery
Note: It is only an illustrative list and not exhaustive.
274INDIA TOURISM STATISTICS 2009
APPENDIX-XIII
REVISED GUIDELINES OF SCHEME FOR PRODUCT/INFRASTRCUTURE DEVELOPMENT FOR
DESTINATIONS AND CIRCUITS
I. IN THE 9TH PLAN ASSISTANCE WAS PROVIDED IN THE FOLLOWING FIELDS:-
1. Construction of budget accommodation.2. Tourist complexes.3. Wayside amenities.4. Tourist Reception Centre.5. Refurbishment of monuments.6. Special tourism projects.7. Adventure and sports facilities.8. Sound and Light shows and illumination of monuments.
These schemes were merged into following two schemes during the 10th five year plan.
(1.) Integrated Development of Tourist Circuits(2.) Product/Infrastructure and Destination Development.
2. In order to carefully regulate the Product Development the above two schemes arenow merged into one scheme “Product/Infrastructure Development for Destinationsand Circuits”. This scheme will have the following two components;
A) Major destinations and circuits developmentB) Rural Tourism infrastructure development
A. MAJOR DESTINATIONS AND CIRCUITS DEVELOPMENT
3. The focus under this revised scheme will be on the improvement of existing productand developing new tourism products to the world standard. It will also focus onIntegrated Infrastructure Development of the tourist sites. These tourist sites/destinations would be carefully selected based on its tourism potential. The aimwould be to provide all infrastructure facilities required by the tourists within suchdestinations and circuits. Master Planning of these destinations and circuits will beundertaken so as to develop them in an integrated holistic manner. The aim will beconvergence of resources and expertise through coordinated action with StateGovernments/UTs and Private Sectors. Tourist Destinations and Circuits in eachState would be identified in consultation with the State Governments and would betaken up for development. This would include activities ranging from preparation ofa master plan to implementation of the master plan. Projects to be taken up underthis scheme should follow an integrated, projectised, area development approach.
275INDIA TOURISM STATISTICS 2009
Comprehensive DPRs should be prepared for each project after consultations withall the stakeholders.
4. Definition of a destination: Destination is a place of tourist interest. For being eligibleunder this scheme the destination must be among the most visited sites in the State, ora recognized Heritage monument. A group of tourist attractions located in the same village,town or city would also qualify.
5. Definition of a Circuit: A tourist Circuit is defined as a route on which at least three majortourist destinations are located such that none of these are in the same town, village orcity. At the same time they are not separated by a long distance. It should have welldefined entry and exit points. A tourist who enters at the entry point should get motivatedto visit all the places identified on the circuit. The objective of having a tourist circuit is toincrease the total provide to the tourist the attractions of all the destinations located onthe circuit.
6. Identification of tourist destinations and Circuits: The destinations & circuits will beselected on the basis of its tourism potential in consultation with the State Governments.The Destinations/ Circuits to be taken up for development will be identified by the Ministryof Tourism at the beginning of each year. A tourist circuit could be limited to a State or itcould be a regional circuit covering more than a State/UT. The identification of the project,the implementing agency, and the mode of channelisation of funds would be done inconsultation with the State Govt./UT Administration.
7. Funding pattern of the project: The Ministry of Tourism would bear 100% of the projectcost based on the project plan and estimates submitted, excluding the items which arethe exclusive responsibility of the State Governments, as mentioned at para- 8 below.While there may be no ceiling on project cost, Government of India contribution would becapped at Rs. 25 crore for destination development and Rs.50 crore for circuit developmentfor identified major destinations and circuits based on tourist traffic. However, the existingceiling of Rs.5 crore and Rs.8 crore for destination and circuit espectively would continuefor other projects. In respect of each large project involving central financial assistance ofRs.25 crore and above, the Ministry should formalise MOUs with State Government andother stakeholders indicating the works to be undertaken by them in physical and financialterms. Total project should include contribution from State Government and contributionfrom other stakeholders. State Government contribution towards land, rehabilitationpackage, O&M and external infrastructure like water supply, electricity and roads, asenvisaged in para-8 below, should be quantified in the DPR. The provisions for preparationof comprehensive DPRs for Destinations/Circuit Project will be as follows: a) LargeDestinations/Circuit Project involving central financial assistance of Rs.25 crore and abovewill be assisted towards the cost of DPR preparation amounting to 50% of the total costof DPR preparation or Rs.15 lakh, whichever is lower. b) As far as the assistance towardspreparation of DPR for smaller projects of destination/circuits are concerned, the assistancewill be limited to 50% of the total cost of DPR preparation or Rs.10 lakh, whichever islower.
276INDIA TOURISM STATISTICS 2009
8. Activities/items under State/UT component: The State/UT Governments will be fullyresponsible for the following components of the project:
i) Making the land available for development.
ii) Implementation of rehabilitation package, where shifting of dwellings or commercialunits is required. However, the Government of India would provide assistance forconstruction of Tourist Reception Centres including shopping complexes to house thedisplaced shops.
iii) Operation, maintenance and management of the assets created.
iv) External infrastructure like Water Supply, Electricity and Roads (not covered underPara -9 (iv) below)
9. Activities/items under Central component: The assistance under this scheme will befocussed on development of public goods instead of private goods. There should also beconvergence with other programmes of Government and duplication shall be avoided.The following works may be taken up under the Scheme under the Central component.
i. Improvement of the surroundings of the destination. This would include activities likeland scaping, development of parks, fencing, compound wall etc.
ii. Illumination of the Tourist destination and the area around and SEL Shows etc.
iii. Providing for improvement in solid waste management and sewerage management,Public Conveniences, etc.
iv. Improvement of road connectivity leading to the tourist sites, especially from the NationalHighways/State highways and other entry points.
v. Construction of Wayside Public Conveniences.
vi. Construction of Budget Accommodation, Restaurant & Wayside Amenities includingone time assistance for its air-conditioning and furnishings. This component will besupported only in selected places of Jammu & Kashmir and all North Eastern States,and Eco-tourism projects where private sector investment is not forthcoming or notpossible.
vii. Procurement of equipments directly related to tourism, like Water Sports, AdventureSports, Eco-friendly modes of transport for moving within the Tourism Zone andequipments for cleaning of the tourist destination will be eligible for 25% grant.
viii. Construction of public buildings which are required to be demolished because ofimplementation of the Master Plan.
ix. Refurbishment of the Monuments.
x. Signages and display boards showing Tourist Area Maps and documentation on placesof interest at the locations.
xi. Tourist Arrival Centres, Reception Centres, Interpretation Centresxii. Improvement ofmunicipal services directly related to Tourism
xii. Other work/activities directly related to tourism.
277INDIA TOURISM STATISTICS 2009
10. Release of Funds: The funds would be released to the implementing agency as indicatedin Para 6 above in three instalments for identified destination and circuit amounting toRs.25 crore and Rs.50 crore respectively, once the detailed cost estimates of the projectsare received. On sanction of the project, the first instalment of 50% of the approvedCentral Financial Assistance (CFA) will be released to the implementing agency. Thesecond instalment of 30% will be released after receipt of 50% utilisation certificate ofthe previous instalment. The balance 20% would be released on the completion of thework and on receipt of the Utilisation Certificate. However, CFA in two instalments wouldbe released for other destination and circuit sanctioned for Rs.5 crore and Rs.8 crorerespectively. The first instalment in this case will be 80% of the approved CFA on sanctionof the project and second instalment will be balance 20% of the approved CFA on thecompletion of the work and on receipt of the Utilisation Certificate.
11. Codal formalities: The Implementing agency shall follow all codal formalities whileawarding contracts and procurement of equipment and ensure complete transparency inits transactions. There would not be any compulsion to execute projects through CPWD.The execution of projects would primarily be the responsibility of State Governments andlocal agencies. However, whenever a project is to be driven by the Central Government,central agencies could be engaged both for project preparation and for implementationwith consent of State/UT Govt. concerned.
12. Management of assets created: The infrastructure and assets created will be maintainedand managed by the State/UT Governments or their agencies with no financial commitmentto Govt. of India. The sustainable maintenance plan for the assets to be created must bebuilt into the project proposal for this purpose.
13. Monitoring Committee: State level Monitoring Committees would be set up under theChairmanship of the respective Secretary (Tourism) of the State/UT Government. ThisCommittee would consist of a nominee of the Ministry of Tourism, Govt. of India and anominee of the implementing agency. This committee will monitor the physical and financialprogress of the sanctioned projects and submit the reports to the Ministry on regularbasis. The Committee will be responsible for completion of projects within the stipulatedperiod.
B. RURAL TOURISM INFRASTRUCTURE DEVELOPMENT
14. Tourism growth potential can be harnessed as a strategy for Rural Development. Thedevelopment of a strong platform around the concept of Rural tourism is definitely usefulfor a country like India, where almost 74% of the population resides in its 7 million villages.Across the world the trends of industrialization and development have had an urbancentric approach. Alongside, the stresses of urban lifestyles have led to a “counter-urbanization”syndrome. This has led to growing interest in the rural areas. At the sametime this trend of urbanization has led to falling income levels, lesser job opportunities inthe rural areas leading to desertion of villages. Rural Tourism is one of the few activitieswhich can provide a solution to these problems. Besides, there are other factors whichare shifting the trend towards rural tourism like increasing levels of awareness, growinginterest in heritage and culture and improved accessibility, and environmental
278INDIA TOURISM STATISTICS 2009
consciousness. In the developed countries, this has resulted in a new style of tourism ofvisiting village settings to experience and live a relaxed and healthy lifestyle. This concepthas taken the shape of a Rural Tourism Product.
Under this Scheme, thrust will be to promote village tourism as the primary tourismproduct to spread tourism and its socio-economic benefits to rural and new geographicregions. Key geographic regions would be identified for development and promotion ofRural Tourism. The implementation would be done through a Convergence Committeeheaded by the District Collector. Activities like improving the environment, hygiene,infrastructure etc. would be eligible for assistance. Apart from providing financial assistancethe focus would be to tap the resources available under different schemes of Ministry ofRural Development, State Govts. and other Ministries/Departments of the Govt. of India.
15. Definition of Rural Tourism: Any form of tourism that showcases the rural life, art,culture and heritage at rural locations, thereby benefiting the local community economicallyand socially as well as enabling interaction between the tourists and the locals for a moreenriching tourism experience can be termed as rural tourism. Rural tourism is essentiallyan activity which takes place in the countryside. It is multi-faceted and may entail farm/agricultural tourism, cultural tourism, nature tourism, adventure tourism, and ecotourism.As against conventional tourism, rural tourism has certain typical characteristics like: itis experience oriented, the locations are sparsely populated, it is predominantly in naturalenvironment, it meshes with seasonality and local events and is based on preservationof culture, heritage and traditions.
16. Identification of villages: Each State/UT Govt. would be requested to furnish proposalsfor promotion of rural tourism. Based on the merits, the proposals would be identified forimplementation in the country.
17. Preparation of detailed plan for implementation of the project: After short listing theproposals, the State/UT Govts would be requested to draw up a detailed plan of action.The thrust here would be to achieve convergence between the different schemes of theGovt. of India and the State Govts. It should be ensured that at least 50% of the projectshould be implemented through achieving convergence of different schemes. Assistanceupto Rs.3.00 lakh would be provided to the State Govt. for engaging an expert for preparingthe project report.
18. Assistance under the Scheme: A maximum of Rs. 50 lakh would be sanctioned underthis scheme. The activities listed under the para 19 could be taken up.
19. Permissible activities: The following works may be taken up under the Scheme:
i) Improvement of the surroundings of the village. This would include activitieslike landscaping, development of parks, fencing, compound wall etc.
ii) Improvements to roads within the Panchayat limits. This shall not includeany major road which connects the village.
iii) Illumination in the village.iv) Providing for improvement in solid waste management and sewerage
279INDIA TOURISM STATISTICS 2009
management.v) Construction of Wayside Amenities.vi) Procurement of equipments directly related to tourism, like Water Sports,
Adventure Sports, Eco-friendly modes of transport for moving within the tourismzone.
vii) Refurbishment of the Monuments.viii) Signages.ix) Reception Centres.x) Other work/activities directly related to tourism.xi) Tourist Accommodation.
20. Constitution of a Convergence Committee: A Convergence Committee would be setup under the District Collector with all stakeholders as members, to oversee theimplementation of the project. Since, there is a need for flexibility and innovation whileimplementing such projects, therefore, this Committee will also decide to change sanctioneditems based on new perceptions emerging during implementation within overall projectplan and cost already sanctioned keeping the Ministry of Tourism informed for record.
21. Execution of the works: The execution of the work would be entrusted to any CentralGovt./State Govt. agency and the funds would be released directly to the implementingagency by the Govt. of India as recommended by the State Govt.
22. Installments of release: On sanction of a work the first instalment of 80% of the sanctionedamount of CFA will be released. The second instalment of 20% would be released onsubmission of the UC and completion certificate.
23. Codal formalities: The implementing agency shall follow all codal formalities whileawarding contracts and procurement of equipments and ensure complete transparency inits transactions. While executing the works the implementing agency shall follow theSchedule of rates prescribed by the CPWD or the State PWD or Zila Parishad/Panchayator DRDA or Rural Engineering Department. However, if there is any item of work to beundertaken does not have rates prescribed by any one of the above mentioned agenciesthen the District Collector could certify the reasonableness of the rates.
24. Management of assets created: The infrastructure and assets created will be maintainedand managed by the State/UT Governments or their agencies with no financial commitmentto Govt. of India. The sustainable maintenance plan for the assets to be created must bebuilt into the project proposal for this purpose.
***
280INDIA TOURISM STATISTICS 2009
APPENDIX-XIV
REVISED SCHEME OF ASSISTANCE FOR LARGE REVENUEGENERATING PROJECTS
1. Preamble: It is recognized that the development of tourism infrastructure projectsrequires very large investment that may not be possible out of the budgetary resourcesof the Government of India alone. In order to remove these shortcomings and to bringin private sector, corporate and institutional resources as well as techno-managerialefficiencies, it is proposed to promote large revenue generating projects for developmentof tourism infrastructure.
2. Scope of the Scheme: Large revenue generating project, which can be admissible forassistance under this scheme, should be a project, which is also a tourist attraction, orused by tourists and generates revenue through a levy of fee or user charges on thevisitors. Projects like Tourist trains, Cruise vessels, Cruise Terminals, ConventionCentres, Golf Courses open for both domestic and international tourists, Health andRejuvenation facilities and last mile connectivity to tourist destinations (air and cruiseincluding heli tourism) etc. would qualify for assistance. However, this is only anillustrative list and Ministry of Tourism will examine all such cases critically and willhave the final say on whether or not the project under consideration has a tourismimpact. Hotel & Restaurant component will not be eligible for assistance under thescheme either on a stand-alone basis or as an integral part of some other projectHowever, catering facility (not open for general public) as integral part of the project tomeet the in house needs could be eligible for assistance. Procurement of vehicles andsports facilities like stadiums will also not be eligible for assistance under the scheme.
3. Promoters of Project: The projects promoted by Public Sector undertakings, Agencies,or Autonomous Bodies of Central/State Governments as well as projects promoted byprivate sector/PPP Projects recommended by the State Governments/UTAdministrations will be eligible for assistance.
4. Eligibility for assistance: Justification for providing assistance/subsidy. would beascertained on the basis of feasibility study/DPR at the stage of consideration of theproject by the Competent Authority. The projects selected for assistance under thisscheme would not be eligible for subsidy from other schemes of Central Government orState Governments. Similarly, the projects which have already availed subsidy/financialassistance from any other scheme of the Central or State Govt., would not be eligiblefor Government of India assistance under this scheme.
5. Requirement of a Special Purpose Vehicle (SPV): A SPV would have to be set upby the implementing partners in case a private party is promoting the project on its ownor in PPP mode, prior to the consideration of their project under this scheme. However,where the promoter of the project is a State PSU, Agency, Autonomous Body or Central
281INDIA TOURISM STATISTICS 2009
Govt. PSU, Agency or Autonomous Body, a separate SPV need not be required. Inboth the cases, a separate Project Management Group would be required and separateaccounts would be maintained for the project. The Project Management Group, whereSPV has to be set up will consist of, (i) MD/CEO of the SPV (ii) Project Director/Manager (iii) Finance Director (iv) A representative of the State Govt. to be nominatedby them. In the other cases, the Project Management Group will consist of (i) MD/CEOof State PSUs/Central PSUs/Statutory Body, (ii) State Tourism Secretary(where StateGovt. is directly involved), (iii) Project Director/Manager (iv) Finance Director of theCentral/State PSU/Statutory Body or the Director-Finance Department of StateGovernment.
6. Appraisal/Feasibility Report: All project proposals under this scheme must beaccompanied by project appraisal carried out by an independent public financialinstitution. The public financial institution should clearly state that the project is financiallyviable. In case of private sector/PPP projects the financial institutions should alsoindicate their willingness to provide loan for the project. In case the promoter wants totake loan from another financial institution/bank, their appraisal and a letter from themclearly indicating willingness to grant loan for the project should be enclosed with theproposal. Grant-in-aid for preparation of DPR would be admissible at 50% of the actualcost subject to a maximum of Rs.25 lakh per project. No Grant-in-aid would be admissiblefor preparation of Feasibility Report. Public financial institutions, in this case, will includea public financial institution under Section 4A of the Companies Act, 1956 and anyinstitution notified by the Government as authorized to discharge the functions of apublic financial institution under this Scheme. Anyone of these institutions could alsofund the large revenue generating projects admissible under the scheme.
7. Norms for funding: The amount of assistance under the scheme would be released toPublic Sector Undertakings, Agencies or Autonomous Bodies of Central/StateGovernments if the project is promoted by them. In case of private sector / PPPproject, the assistance would be released to SPV through the financial institutions.The quantum of subsidy for Private Sector/PPP projects will be determined through acompetitive bidding process undertaken by the concerned State Governments/UTAdministrations. Specific reasons will be required to be brought on record in casecompetitive bidding process is not adopted for determining the quantum of subsidy. Insuch cases a High Level Committee constituted by the Ministry of Tourism willrecommend the exemption from competitive bidding process as well as quantum ofsubsidy. There should be a minimum loan component of 25% in the case of privatesector/ PPP projects. The subsidy under the scheme will have a cap of Rs.50 Cr.subject to a maximum of 25% of total project cost or 50% of equity contribution of thepromoters, whichever is lower. The total project cost in this case will mean the total of:
(i.) Capital cost of the project, including cost of land, material, labour, transport,consumables, testing, commissioning, overheads, contingencies, interest duringconstruction, insurance and supervision (including any taxes and levies);
(ii.) Pre-operative cost such as formulation, development, design and engineering; andexpenses related to fund mobilization if required, such as fees for financial services
282INDIA TOURISM STATISTICS 2009
and brokerage. In case of Public Sector projects the first installment, limited to 25% ofthe assistance to be provided by the Ministry, will be released only after 25% of thetotal cost of the project has been contributed by the promoter and the implementationof the project has started. The second installment, limited to 50% of the assistance tobe provided by the Ministry, would be disbursed only after 50% of the promoter’s amountis contributed. The last installment of balance 25% of the assistance, to be providedby the Ministry, will be released after the project is fully functional. In case of privatesector/PPP projects the assistance would be credit linked. The first installment, limitedto 25% of the assistance to be provided by the Ministry will be released only after 25%of the total cost of the project has been contributed by the promoters and proportionateloan amount has also been disbursed. The second installment limited to 50% of theassistance to be provided by the Ministry would be disbursed only after 50% of thepromoter’s amount is contributed and proportionate amount of loan is also disbursed.The last installment of balance 25% of the assistance, to be provided by the Ministry,will be released after the project is fully functional. Release of funds for projectssanctioned till 31.3.2007 will however; be in accordance with the guidelines in operationfrom 2.11.2006 to 31.3.2007.
8. Recovery of Government Grant: In case the project is not completed after release ofone or more installments of grant due to some reasons including omissions andcommissions of the promoters, the amount of grant will be recoverable. The amount ofgrant will also be recoverable for failure on the part of promoters to comply with theterms and conditions specific to tourism development in each case. Recoveries will bewith penal interest.
9. Approval procedures: The project proposals will be appraised by SFC/EFC dependingupon the cost of the project before obtaining approval of the competent expendituresanctioning authority.
10. Monitoring and Evaluation: The financial institution, which is funding the project, willbe responsible for regular monitoring and periodic evaluation of project compliance withagreed milestones and performance levels. In case there is no financial institutioninvolved in the project then an agency will be designated while sanctioning the projectfor regular monitoring and evaluation as stated above and the cost for the same will bemet out of the scheme. Ministry of Tourism will have a separate Monitoring Groupconsisting of the concerned Joint Secretary & Director in charge of the scheme alongwith Financial Advisor to regularly monitor and review the sanctioned projects.
***
285INDIA TOURISM STATISTICS 2009
DEFINITIONS
1. DEFINITIONS FOLLOWED IN INDIA
ARRIVALS:
The data presented in this publication refer to the number of arrivals of tourists/visitors andnot to the number of persons. An individual who makes multiple trips to the country iscounted each time as a new arrival. This is also true in the case of Indian nationals goingabroad.
FOREIGN VISITORS:
A Foreign visitor is any person visiting the country on a foreign passport whose main purposeof visit is other than the exercise of an activity remunerated from within the country orestablishment of residence in the country.
This definition covers two segments of visitors: “Tourists” and “Same Day Visitors”.
FOREIGN TOURIST:
A foreign tourist is a person visiting India on a foreign passport, staying at least twenty fourhours in the country, the purpose of whose journey can be classified under one of thefollowing headings:
(i) Leisure (recreation, holiday, health, study, religion and sport); (ii) Business, family mission, meeting.
The following are not regarded as ‘foreign tourists’:
(i) Persons arriving with or without a contract, to take up an occupation or engagein activities remunerated from within the country;
ii) Persons coming to establish residence in the country;(iii) “Same Day Visitors” i.e. temporary visitors staying less than twenty four hours
in the country (including travelers on cruises).
EXCURSIONIST:
A visitor in accordance with the foregoing definition and staying less than 24 hours in thecountry is treated as “Same Day Visitor” or “Excursionist”.
CRUISE PASSENGER:
A visitor, as defined above, who arrives in the country aboard a cruise ship and does notspend a night at an accommodation establishment in the country is treated as a cruisepassenger.

286INDIA TOURISM STATISTICS 2009
PORTS:
Ports are the points of entry of foreign visitors into India. At present, there are seventy twoports. The list of these ports is given below.
Sl. Name of port Type of port Sl. Name of port Type of portNo. No.
1 Agartala Land Checkpost 36 Kailashahar Land Checkpost2 Agra Airport 37 Kakinada Seaport3 Ahmedabad Airport 38 Kandala Seaport4 Alang Seaport 39 Karimaganj Seaport5 Amritsar Airport 40 Khowai Land Checkpost6 Attari Rail Land Checkpost 41 Kolkata Airport7 Attari Wagha Land Checkpost 42 Lalgolaghat Land Checkpost8 Bandasa Land Checkpost 43 Lucknow Airport9 Bangalore Airport 44 Mahadipore Land Checkpost10 Bedi Bender Seaport 45 Mangalore Seaport11 Bhavnagar Seaport 46 Mankachar Land Checkpost12 Calicut Airport 47 Marmagoa Seaport13 Changrabandha Land Checkpost 48 Muhurighat Land Checkpost14 Chennai Seaport 49 Mumbai Airport15 Chennai Airport 50 Mumbai Seaport16 Cochin Seaport 51 Munabao Land Checkpost17 Cochin Airport 52 Nagapattinam Seaport18 Coimbatore Airport 53 Nagpur Airport19 Cuddalore Seaport 54 Nhava Sheva Seaport20 Dabolim Airport 55 Paradeep Seaport21 Dalaighat Land Checkpost 56 Patna Airport22 Dalu Land Checkpost 57 Port Blair Airport23 Dawki Land Checkpost 58 Port Blair Seaport24 Delhi Airport 59 Pune Airport25 Gauriphanta Land Checkpost 60 Radhikapore Land Checkpost26 Gaya Airport 61 Ragna Land Checkpost27 Gede Rly. Station Land Checkpost 62 Ranjganj Land Checkpost28 Ghojadanga Land Checkpost 63 Raxual Land Checkpost29 Guwahati Airport 64 Rupaidiha Land Checkpost30 Haridaspur Land Checkpost 65 Sonauli Land Checkpost31 Hilli Land Checkpost 66 Srimantapur Land Checkpost32 Hyderabad Land Airport 67 Sutarkandi Land Checkpost33 Jaigaon Kalimpong Land Checkpost 68 Trichy Airport34 Jaipur Airport 69 Trivandrum Airport35 Jogbani Purnea Land Checkpost 70 Tuticorin Seaport
71 Varanasi Airport72 Vaisakhapatanam Seaport
287INDIA TOURISM STATISTICS 2009
REGIONS:
The regional classification of countries, used for the presentation of data in the publication,is as follows:
1) Africa comprises the continent of Africa including, Egypt and the adjoining islands.
2) Australasia includes Australia, New Zealand, Fiji and the Pacific Island groups likeFrench Polynesia, Papua New Guinea, New Caledonia etc.
3) East Asia comprises China, Hongkong,Japan, Korea, Macau, etc.
4) West Asia comprises countries in the Middle East including Turkey, Cyprus and PersianGulf countries excluding Iran.
5) South Asia includes Iran, Afghanistan, Sri Lanka, Maldives and countries of the Indiansub continent.
6) South East Asia comprises countries of Indo-China including Myanmar & ASEANcountries.
7) North America includes Canada and the USA.
8) Central and South America comprises countries in the Central and South America, andthe Caribbean Islands.
9) Eastern Europe comprises all the countries of former Soviet Union, Yugoslavia, Czech,Slovakia, Hungary, Poland, etc.
10) Western Europe includes all the countries of Europe excluding East European countries,Turkey and Cyprus.
DOMESTIC TOURIST:
A domestic tourist is a person who travels within the country to a place other than his usualplace of residence and stays at hotels or other accommodation establishments run oncommercial basis or in dharamshalas/sarais/musafirkhanas/agrashalas/choultries etc. for aduration of not less than 24 hours or one night and for not more than 12 months at a time forany of the following purposes:-
i) Pleasure (holiday, leisure, sports, etc.);
ii) Pilgrimage , religious and social functions;
iii) Business conferences and meetings; and
iv) Study and health.
The following are not regarded as domestic tourists:
(i) Persons arriving with or without a contract to take up an occupation or engage in activities remunerated from within the State/Centre.
(ii) Persons coming to establish more or less permanent residence in the State/Centre.
288INDIA TOURISM STATISTICS 2009
(iii) Persons visiting their hometowns or native places on leave or a short visit for meetingrelations and friends, attending social and religious functions etc. and staying in theirown homes or with relatives and friends and not using any sight -seeing facilities.
(iv) Foreigners resident in India.
INDIAN NATIONALS GOING ABROAD:
Any person going abroad with an Indian passport is regarded as an Indian national goingabroad irrespective of the purpose and the destination.
TRAVEL RECEIPTS/FOREIGN EXCHANGE EARNINGS FROM TOURISM:
These are receipts of the country as a result of consumption expenditure, i.e. paymentsmade for goods and services acquired, by foreign visitors in the economy out of foreigncurrency brought by them.
ACCOMMODATION ESTABLISHMENTS:
Places in which rooms are provided to tourists for stay, and classified as hotels, touristbungalows, travelers’ lodges, youth hostels, etc.
APPROVED HOTELS:
Hotels which conform to certain laid down standards on physical features, standards offacilities and other services are approved by the Tourism Departments of Central and StateGovernments and are known as approved hotels. These are graded variously as five stardeluxe, five star, four star, etc.
OCCUPANCY RATE:
The occupancy rate refers to the ratio between available capacity (in terms of rooms orbeds) and the extent to which it is used. Occupancy is worked out on the basis of number ofrooms occupied by both domestic and international tourists.
2. INTERNATIONAL DEFINITIONS
TOURISM:
The activities of persons traveling to and in places outside their usual environment for notmore than one consecutive year for leisure, business and other purposes.
DOMESTIC TOURISM: Residents of a given country traveling only within that country.
INBOUND TOURISM: In relation to a given country non-residents traveling to that country.
OUTBOUND TOURISM: In relation to a given country, residents traveling another country.
INTERNAL TOURISM: Domestic and Inbound Tourism.
NATIONAL TOURISM: Domestic and Out bound Tourism.
289INDIA TOURISM STATISTICS 2009
INTERNATIONAL TOURISM: Inbound and Outbound Tourism.
VISITORS:
All type of travelers engaged in tourism are described as Visitors, and as such the termrepresents the basic concept for the whole system of tourism statistics.
INTERNATIONAL VISITORS :
Any person who travels to a country other than that in which is his/her usual residence, butoutside his/her usual environment, for a period not exceeding 12 months and whose mainpurpose of visit is other than the exercise of an activity remunerated from within the countryvisited.
INTERNATIONAL VISITORS INCLUDE:
Tourists (overnight visitors): Visitors who stay at least one night in a collective ofprivate accommodation in the country visited.
Same Day Visitors: Visitors who do not spend a night in a collective or private accom-modation in the country visited. This definition includes passengers of cruise ships whoreturn to the ship every night to sleep on board even though the ship remains in port forseveral days. Also included in this group are, by extension, owners or passengers ofYachts, and passengers on a group tour accommodated in a train.
Domestic Visitors: Any person residing in a country who travels to a place within thecountry, outside his/her usual environment for a period not exceeding 12 months, and whosemain purpose of visit is other than the exercise of an activity remunerated from within theplace visited.
DOMESTIC VISITORS INCLUDE:
Tourists (overnight visitors): Visitors who stay at least one night in a collective orprivate accommodation in the place visited.
Same Day Visitors: Visitors who do not spend one night in a collective or privateaccommodation in the place visited.
***