Embed Size (px)
Citation preview
HORIZON RESEARCH
-Please Refer To Important Disclosures On The Last Page Of This Report-
Indian Basmati Rice Industry
Rohit Anand, CFA (ICFAI)
(+91 11) 9811941920
July 25, 2012
A 34 Mohan Cooperative
Mathura Road
New Delhi
110044
HORIZON RESEARCH
-1-
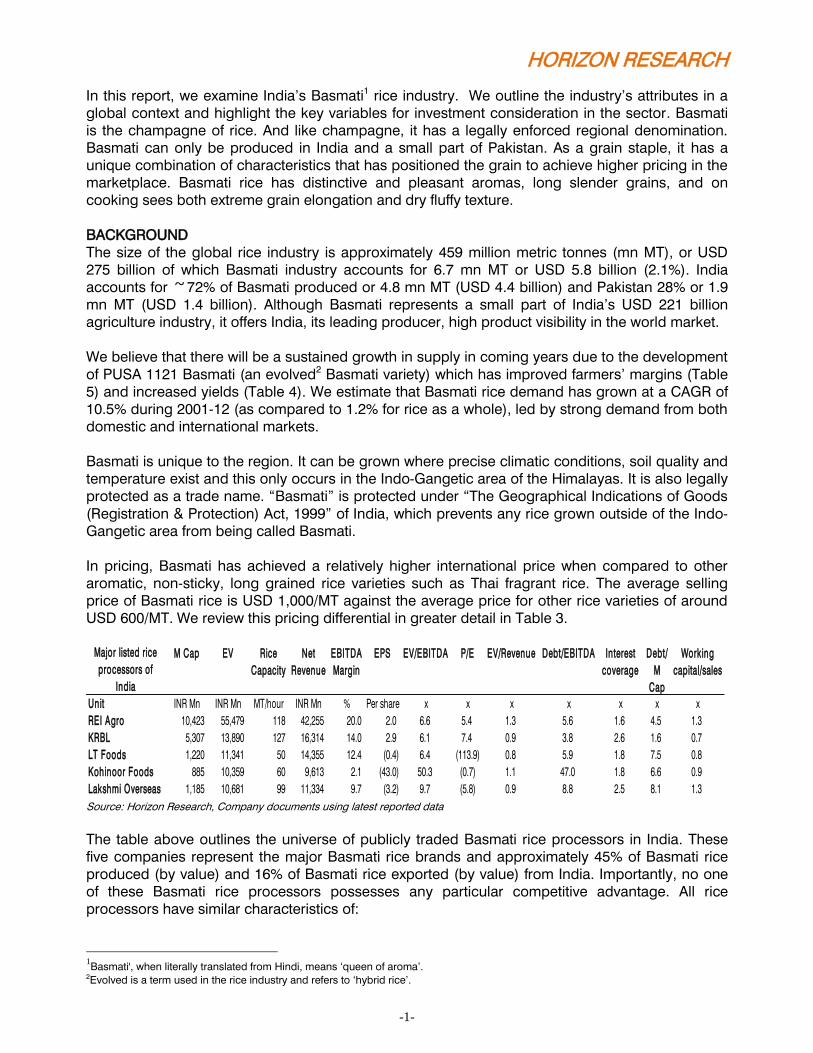
In this report, we examine India’s Basmati1 rice industry. We outline the industry’s attributes in a
global context and highlight the key variables for investment consideration in the sector. Basmati
is the champagne of rice. And like champagne, it has a legally enforced regional denomination.
Basmati can only be produced in India and a small part of Pakistan. As a grain staple, it has a
unique combination of characteristics that has positioned the grain to achieve higher pricing in the
marketplace. Basmati rice has distinctive and pleasant aromas, long slender grains, and on
cooking sees both extreme grain elongation and dry fluffy texture.
BACKGROUND
The size of the global rice industry is approximately 459 million metric tonnes (mn MT), or USD
275 billion of which Basmati industry accounts for 6.7 mn MT or USD 5.8 billion (2.1%). India
accounts for ~72% of Basmati produced or 4.8 mn MT (USD 4.4 billion) and Pakistan 28% or 1.9
mn MT (USD 1.4 billion). Although Basmati represents a small part of India’s USD 221 billion
agriculture industry, it offers India, its leading producer, high product visibility in the world market.
We believe that there will be a sustained growth in supply in coming years due to the development
of PUSA 1121 Basmati (an evolved2 Basmati variety) which has improved farmers’ margins (Table
5) and increased yields (Table 4). We estimate that Basmati rice demand has grown at a CAGR of
10.5% during 2001-12 (as compared to 1.2% for rice as a whole), led by strong demand from both
domestic and international markets.
Basmati is unique to the region. It can be grown where precise climatic conditions, soil quality and
temperature exist and this only occurs in the Indo-Gangetic area of the Himalayas. It is also legally
protected as a trade name. “Basmati” is protected under “The Geographical Indications of Goods
(Registration & Protection) Act, 1999” of India, which prevents any rice grown outside of the Indo-
Gangetic area from being called Basmati.
In pricing, Basmati has achieved a relatively higher international price when compared to other
aromatic, non-sticky, long grained rice varieties such as Thai fragrant rice. The average selling
price of Basmati rice is USD 1,000/MT against the average price for other rice varieties of around
USD 600/MT. We review this pricing differential in greater detail in Table 3.
Source: Horizon Research, Company documents using latest reported data
The table above outlines the universe of publicly traded Basmati rice processors in India. These
five companies represent the major Basmati rice brands and approximately 45% of Basmati rice
produced (by value) and 16% of Basmati rice exported (by value) from India. Importantly, no one
of these Basmati rice processors possesses any particular competitive advantage. All rice
processors have similar characteristics of:
1Basmati', when literally translated from Hindi, means ‘queen of aroma’.
2Evolved is a term used in the rice industry and refers to ‘hybrid rice’.
Major listed rice
processors of
India
M Cap EV Rice
Capacity
Net
Revenue
EBITDA
Margin
EPS EV/EBITDA P/E EV/Revenue Debt/EBITDA Interest
coverage
Debt/
M
Cap
Working
capital/sales
Unit INR Mn INR Mn MT/hour INR Mn % Per share x x x x x x x
REI Agro 10,423 55,479 118 42,255 20.0 2.0 6.6 5.4 1.3 5.6 1.6 4.5 1.3
KRBL 5,307 13,890 127 16,314 14.0 2.9 6.1 7.4 0.9 3.8 2.6 1.6 0.7
LT Foods 1,220 11,341 50 14,355 12.4 (0.4) 6.4 (113.9) 0.8 5.9 1.8 7.5 0.8
Kohinoor Foods 885 10,359 60 9,613 2.1 (43.0) 50.3 (0.7) 1.1 47.0 1.8 6.6 0.9
Lakshmi Overseas 1,185 10,681 99 11,334 9.7 (3.2) 9.7 (5.8) 0.9 8.8 2.5 8.1 1.3
Usher Agro 2,486 5,826 62 7,009 13.4 11.3 6.2 5.8 0.8 3.9 9.3 1.5 0.6
HORIZON RESEARCH
-2-
High working capital requirements
High debt leverage due to capital requirements for the necessity to ‘age’ Basmati,
A production recovery rate3 of ~65%
Limited brand differentiation and visibility with scale
Low pricing power
Negative free cash flow
Limited product differentiation with most farmers preferring to grow the common rice grain
known as PUSA 1121,
Significant over capacity in paddy milling,
Historically have grown through exports,
Risk of decline in margins over the next 18 months. In 2008 the Government of India
imposed a Minimum Export Price (MEP) on Basmati to prevent export of lower quality rice.
There are indications that the MEP will be removed in the near future and this could lower
average realizations.
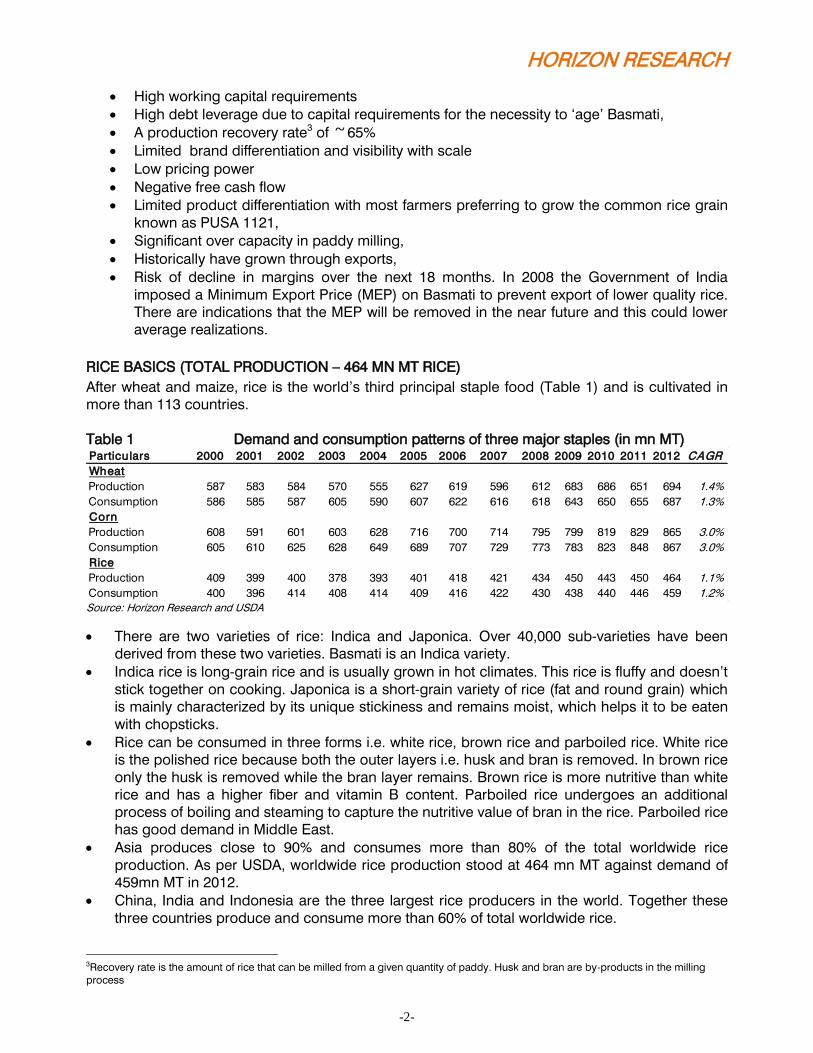
RICE BASICS (TOTAL PRODUCTION – 464 MN MT RICE)
After wheat and maize, rice is the world’s third principal staple food (Table 1) and is cultivated in
more than 113 countries.
Table 1 Demand and consumption patterns of three major staples (in mn MT)
Source: Horizon Research and USDA
There are two varieties of rice: Indica and Japonica. Over 40,000 sub-varieties have been
derived from these two varieties. Basmati is an Indica variety.
Indica rice is long-grain rice and is usually grown in hot climates. This rice is fluffy and doesn’t
stick together on cooking. Japonica is a short-grain variety of rice (fat and round grain) which
is mainly characterized by its unique stickiness and remains moist, which helps it to be eaten
with chopsticks.
Rice can be consumed in three forms i.e. white rice, brown rice and parboiled rice. White rice
is the polished rice because both the outer layers i.e. husk and bran is removed. In brown rice
only the husk is removed while the bran layer remains. Brown rice is more nutritive than white
rice and has a higher fiber and vitamin B content. Parboiled rice undergoes an additional
process of boiling and steaming to capture the nutritive value of bran in the rice. Parboiled rice
has good demand in Middle East.
Asia produces close to 90% and consumes more than 80% of the total worldwide rice
production. As per USDA, worldwide rice production stood at 464 mn MT against demand of
459mn MT in 2012.
China, India and Indonesia are the three largest rice producers in the world. Together these
three countries produce and consume more than 60% of total worldwide rice.
3Recovery rate is the amount of rice that can be milled from a given quantity of paddy. Husk and bran are by-products in the milling
process
Particulars 2000 2001 2002 2003 2004 2005 2006 2007 2008 2009 2010 2011 2012 CAGR
Wheat
Production 587 583 584 570 555 627 619 596 612 683 686 651 694 1.4%
Consumption 586 585 587 605 590 607 622 616 618 643 650 655 687 1.3%
Corn
Production 608 591 601 603 628 716 700 714 795 799 819 829 865 3.0%
Consumption 605 610 625 628 649 689 707 729 773 783 823 848 867 3.0%
Rice
Production 409 399 400 378 393 401 418 421 434 450 443 450 464 1.1%
Consumption 400 396 414 408 414 409 416 422 430 438 440 446 459 1.2%
HORIZON RESEARCH
-3-
In 2012 the top 3 rice exporting countries were India, Thailand and Vietnam (~60% of the total
export).
BASMATI BASICS (INDIA’S PRODUCTION – 4.1 MN MT IN FY11, 4.7 MN MT IN FY12)
India and Pakistan are the sole Basmati producers
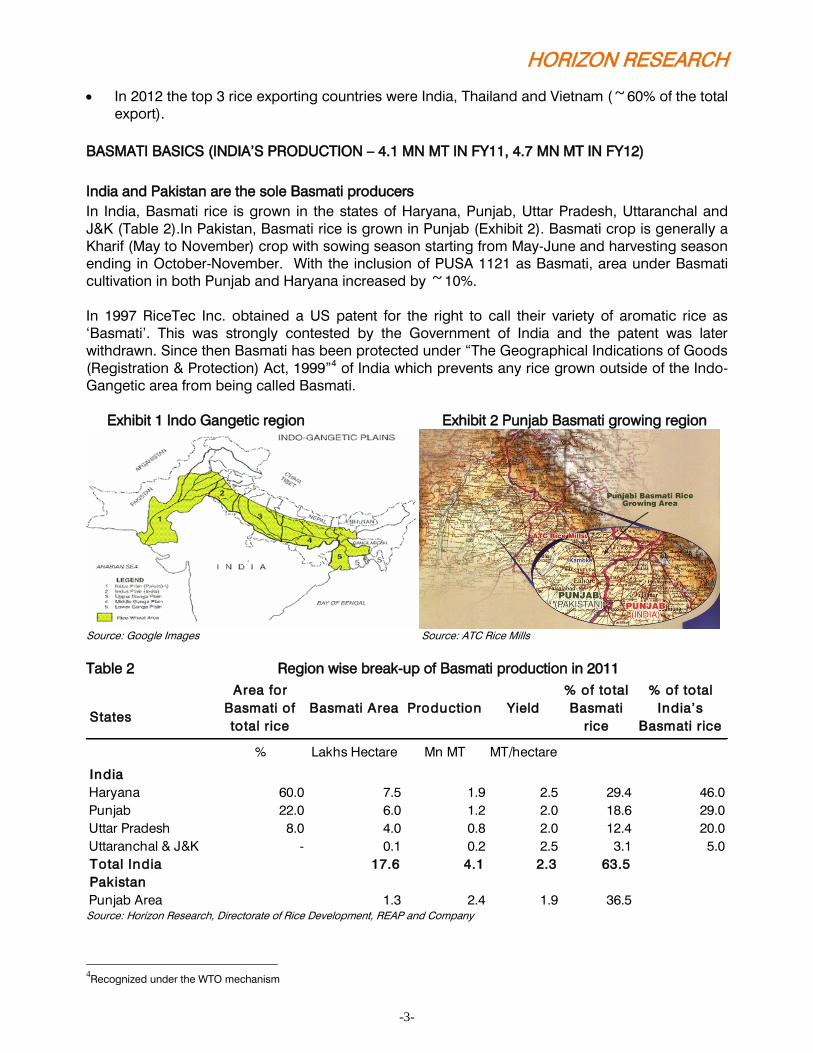
In India, Basmati rice is grown in the states of Haryana, Punjab, Uttar Pradesh, Uttaranchal and
J&K (Table 2).In Pakistan, Basmati rice is grown in Punjab (Exhibit 2). Basmati crop is generally a
Kharif (May to November) crop with sowing season starting from May-June and harvesting season
ending in October-November. With the inclusion of PUSA 1121 as Basmati, area under Basmati
cultivation in both Punjab and Haryana increased by ~10%.
In 1997 RiceTec Inc. obtained a US patent for the right to call their variety of aromatic rice as
‘Basmati’. This was strongly contested by the Government of India and the patent was later
withdrawn. Since then Basmati has been protected under “The Geographical Indications of Goods
(Registration & Protection) Act, 1999”4 of India which prevents any rice grown outside of the Indo-
Gangetic area from being called Basmati.
Exhibit 1 Indo Gangetic region Exhibit 2 Punjab Basmati growing region
Source: Google Images Source: ATC Rice Mills
Table 2 Region wise break-up of Basmati production in 2011
Source: Horizon Research, Directorate of Rice Development, REAP and Company
4Recognized under the WTO mechanism
States
% Lakhs Hectare Mn MT MT/hectare
India
Haryana 60.0 7.5 1.9 2.5 29.4 46.0
Punjab 22.0 6.0 1.2 2.0 18.6 29.0
Uttar Pradesh 8.0 4.0 0.8 2.0 12.4 20.0
Uttaranchal & J&K - 0.1 0.2 2.5 3.1 5.0
Total India 17.6 4.1 2.3 63.5
Pakistan
Punjab Area 1.3 2.4 1.9 36.5
% of total
Basmati
rice
% of total
India’s
Basmati rice
Area for
Basmati of
total rice
Basmati Area Production Yield
HORIZON RESEARCH
-4-
Basmati price premium
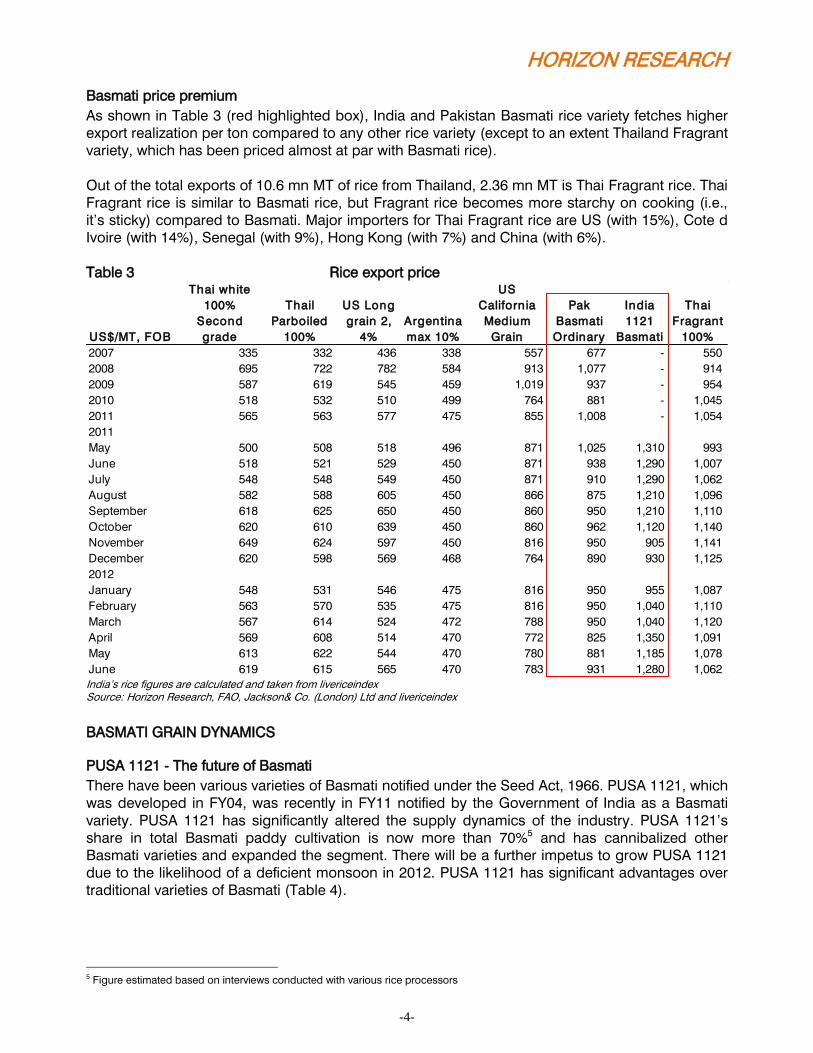
As shown in Table 3 (red highlighted box), India and Pakistan Basmati rice variety fetches higher
export realization per ton compared to any other rice variety (except to an extent Thailand Fragrant
variety, which has been priced almost at par with Basmati rice).
Out of the total exports of 10.6 mn MT of rice from Thailand, 2.36 mn MT is Thai Fragrant rice. Thai
Fragrant rice is similar to Basmati rice, but Fragrant rice becomes more starchy on cooking (i.e.,
it’s sticky) compared to Basmati. Major importers for Thai Fragrant rice are US (with 15%), Cote d
Ivoire (with 14%), Senegal (with 9%), Hong Kong (with 7%) and China (with 6%).
Table 3 Rice export price
India’s rice figures are calculated and taken from livericeindex Source: Horizon Research, FAO, Jackson& Co. (London) Ltd and livericeindex
BASMATI GRAIN DYNAMICS
PUSA 1121 - The future of Basmati
There have been various varieties of Basmati notified under the Seed Act, 1966. PUSA 1121, which
was developed in FY04, was recently in FY11 notified by the Government of India as a Basmati
variety. PUSA 1121 has significantly altered the supply dynamics of the industry. PUSA 1121’s
share in total Basmati paddy cultivation is now more than 70%5 and has cannibalized other
Basmati varieties and expanded the segment. There will be a further impetus to grow PUSA 1121
due to the likelihood of a deficient monsoon in 2012. PUSA 1121 has significant advantages over
traditional varieties of Basmati (Table 4).
5 Figure estimated based on interviews conducted with various rice processors
US$/MT, FOB
Thai white
100%
Second
grade
Thail
Parboiled
100%
US Long
grain 2,
4%
Argentina
max 10%
US
California
Medium
Grain
Pak
Basmati
Ordinary
India
1121
Basmati
Thai
Fragrant
100%
2007 335 332 436 338 557 677 - 550
2008 695 722 782 584 913 1,077 - 914
2009 587 619 545 459 1,019 937 - 954
2010 518 532 510 499 764 881 - 1,045
2011 565 563 577 475 855 1,008 - 1,054
2011
May 500 508 518 496 871 1,025 1,310 993
June 518 521 529 450 871 938 1,290 1,007
July 548 548 549 450 871 910 1,290 1,062
August 582 588 605 450 866 875 1,210 1,096
September 618 625 650 450 860 950 1,210 1,110
October 620 610 639 450 860 962 1,120 1,140
November 649 624 597 450 816 950 905 1,141
December 620 598 569 468 764 890 930 1,125
2012
January 548 531 546 475 816 950 955 1,087
February 563 570 535 475 816 950 1,040 1,110
March 567 614 524 472 788 950 1,040 1,120
April 569 608 514 470 772 825 1,350 1,091
May 613 622 544 470 780 881 1,185 1,078
June 619 615 565 470 783 931 1,280 1,062
HORIZON RESEARCH
-5-
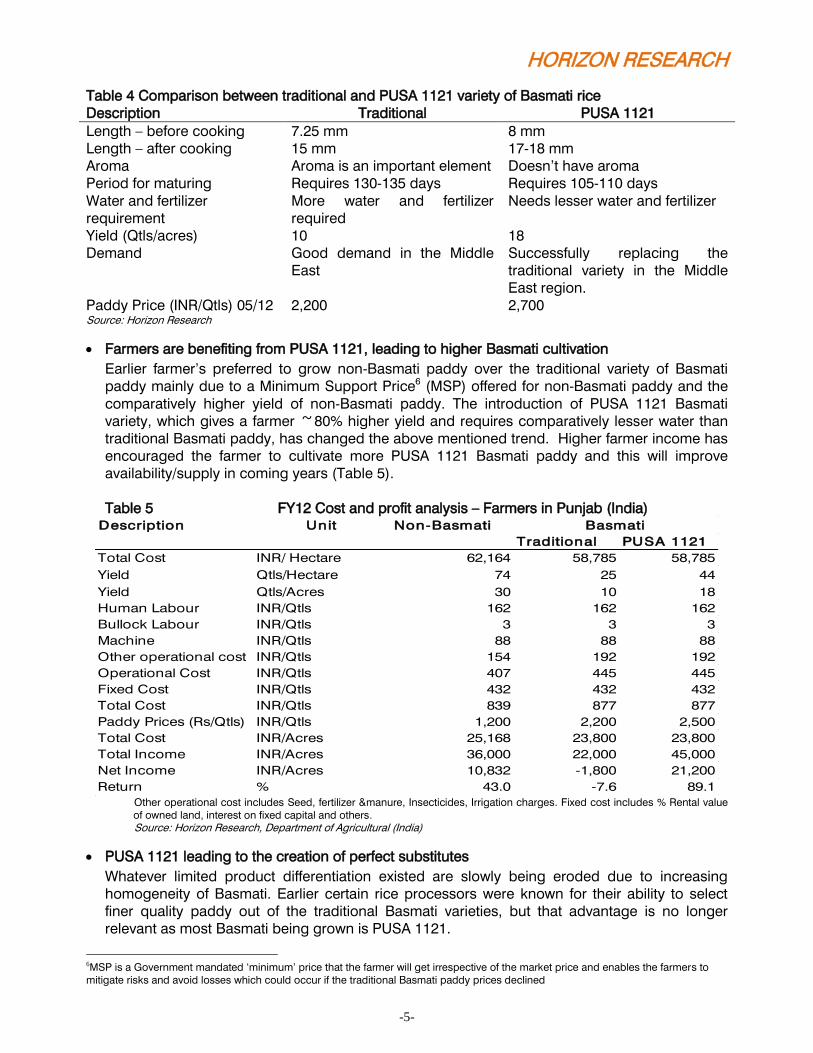
Table 4 Comparison between traditional and PUSA 1121 variety of Basmati rice
Description Traditional PUSA 1121
Length – before cooking 7.25 mm 8 mm
Length – after cooking 15 mm 17-18 mm
Aroma Aroma is an important element Doesn’t have aroma
Period for maturing Requires 130-135 days Requires 105-110 days
Water and fertilizer
requirement
More water and fertilizer
required
Needs lesser water and fertilizer
Yield (Qtls/acres) 10 18
Demand Good demand in the Middle
East
Successfully replacing the
traditional variety in the Middle
East region.
Paddy Price (INR/Qtls) 05/12 2,200 2,700 Source: Horizon Research
Farmers are benefiting from PUSA 1121, leading to higher Basmati cultivation
Earlier farmer’s preferred to grow non-Basmati paddy over the traditional variety of Basmati
paddy mainly due to a Minimum Support Price6 (MSP) offered for non-Basmati paddy and the
comparatively higher yield of non-Basmati paddy. The introduction of PUSA 1121 Basmati
variety, which gives a farmer ~80% higher yield and requires comparatively lesser water than
traditional Basmati paddy, has changed the above mentioned trend. Higher farmer income has
encouraged the farmer to cultivate more PUSA 1121 Basmati paddy and this will improve
availability/supply in coming years (Table 5).
Table 5 FY12 Cost and profit analysis – Farmers in Punjab (India)
Other operational cost includes Seed, fertilizer &manure, Insecticides, Irrigation charges. Fixed cost includes % Rental value
of owned land, interest on fixed capital and others.
Source: Horizon Research, Department of Agricultural (India)
PUSA 1121 leading to the creation of perfect substitutes
Whatever limited product differentiation existed are slowly being eroded due to increasing
homogeneity of Basmati. Earlier certain rice processors were known for their ability to select
finer quality paddy out of the traditional Basmati varieties, but that advantage is no longer
relevant as most Basmati being grown is PUSA 1121.
6MSP is a Government mandated ‘minimum’ price that the farmer will get irrespective of the market price and enables the farmers to
mitigate risks and avoid losses which could occur if the traditional Basmati paddy prices declined
Description Unit Non-Basmati
Traditional PUSA 1121
Total Cost INR/ Hectare 62,164 58,785 58,785
Yield Qtls/Hectare 74 25 44
Yield Qtls/Acres 30 10 18
Human Labour INR/Qtls 162 162 162
Bullock Labour INR/Qtls 3 3 3
Machine INR/Qtls 88 88 88
Other operational cost INR/Qtls 154 192 192
Operational Cost INR/Qtls 407 445 445
Fixed Cost INR/Qtls 432 432 432
Total Cost INR/Qtls 839 877 877
Paddy Prices (Rs/Qtls) INR/Qtls 1,200 2,200 2,500
Total Cost INR/Acres 25,168 23,800 23,800
Total Income INR/Acres 36,000 22,000 45,000
Net Income INR/Acres 10,832 -1,800 21,200
Return % 43.0 -7.6 89.1
Basmati
HORIZON RESEARCH
-6-
Working capital needs due to ageing process
Ageing is necessary to (a) ensure a higher recovery of head rice and reduce the proportion of
broken rice while processing, (b) remove moisture and (c) increase the aroma. Both paddy and
rice are aged though there is a limit to the effectiveness of ageing paddy beyond six months. Rice
can be aged for longer periods and rice aged beyond a year has a price premium but remains a
niche product.
Ageing results in high working capital requirements. Indian banks have generally been liberal in
financing these working capital requirements. Since FY09 financing standards have been very low
and credit has been easily available. The result has been that most processors have purchased
more paddy than was necessary which in turn has resulted in higher inventory holding periods
(Table 6).
Table 6 Overall Inventory days
Companies FY07 FY08 FY09 FY10 FY11
REI Agro(BSE: 532106) 414 466 470 402 461
KRBL(BSE: 530813) 291 397 293 220 364
Kohinoor Foods (BSE: 512559) 255 281 303 305 316
LT Foods(BSE: 532783) 231 279 320 314 303 Source: Horizon Research
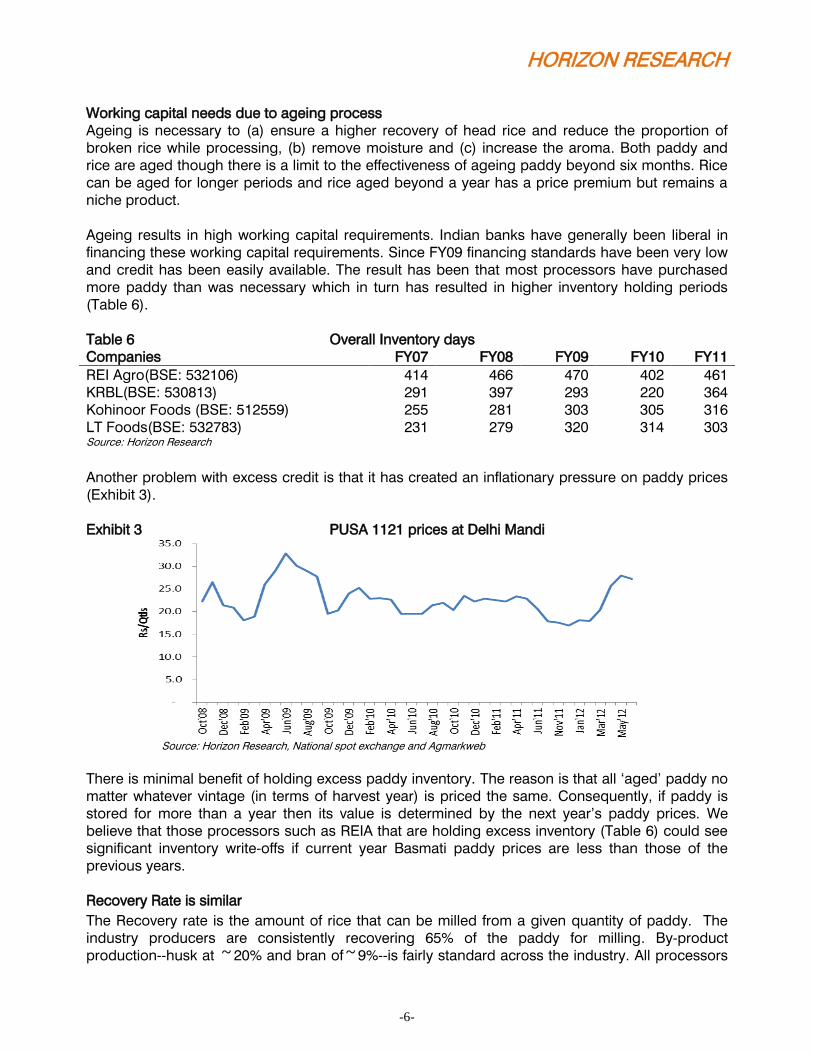
Another problem with excess credit is that it has created an inflationary pressure on paddy prices
(Exhibit 3).
Exhibit 3 PUSA 1121 prices at Delhi Mandi
Source: Horizon Research, National spot exchange and Agmarkweb
There is minimal benefit of holding excess paddy inventory. The reason is that all ‘aged’ paddy no
matter whatever vintage (in terms of harvest year) is priced the same. Consequently, if paddy is
stored for more than a year then its value is determined by the next year’s paddy prices. We
believe that those processors such as REIA that are holding excess inventory (Table 6) could see
significant inventory write-offs if current year Basmati paddy prices are less than those of the
previous years.
Recovery Rate is similar
The Recovery rate is the amount of rice that can be milled from a given quantity of paddy. The
industry producers are consistently recovering 65% of the paddy for milling. By-product
production--husk at ~20% and bran of~9%--is fairly standard across the industry. All processors
HORIZON RESEARCH
-7-
have access to the latest and improved technologies in processing and storage and we therefore
assert that there are limited competitive advantages in recovery.
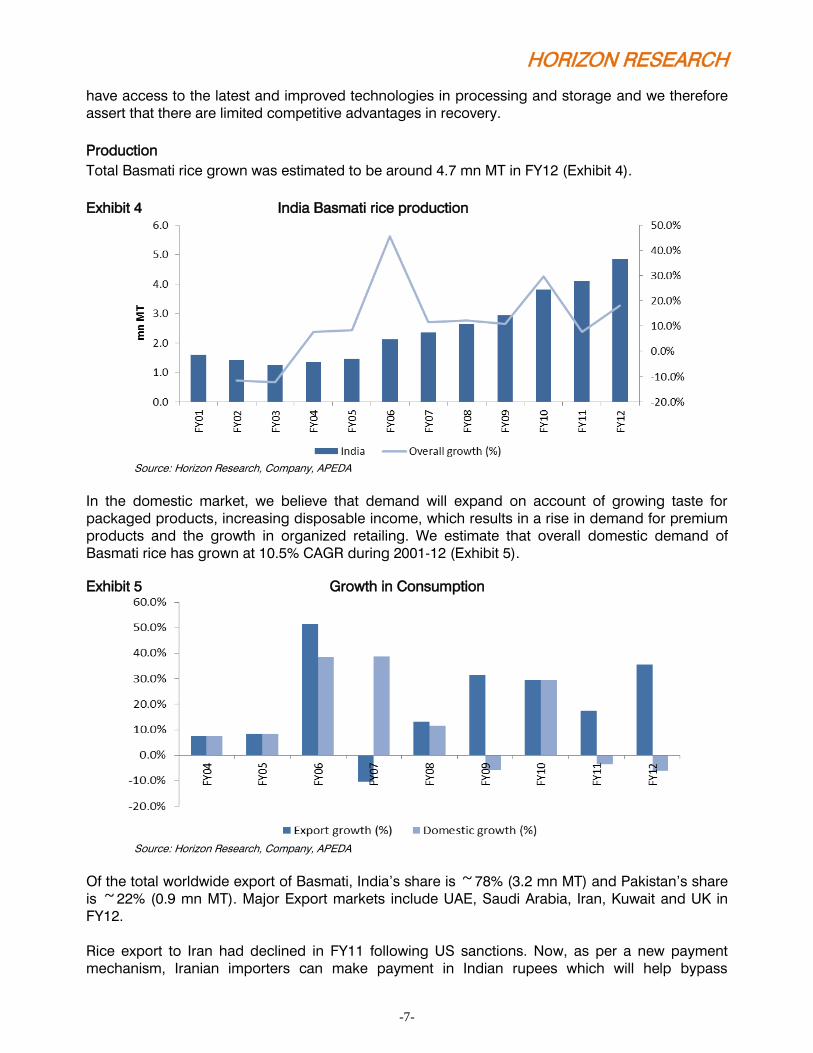
Production
Total Basmati rice grown was estimated to be around 4.7 mn MT in FY12 (Exhibit 4).
Exhibit 4 India Basmati rice production
Source: Horizon Research, Company, APEDA
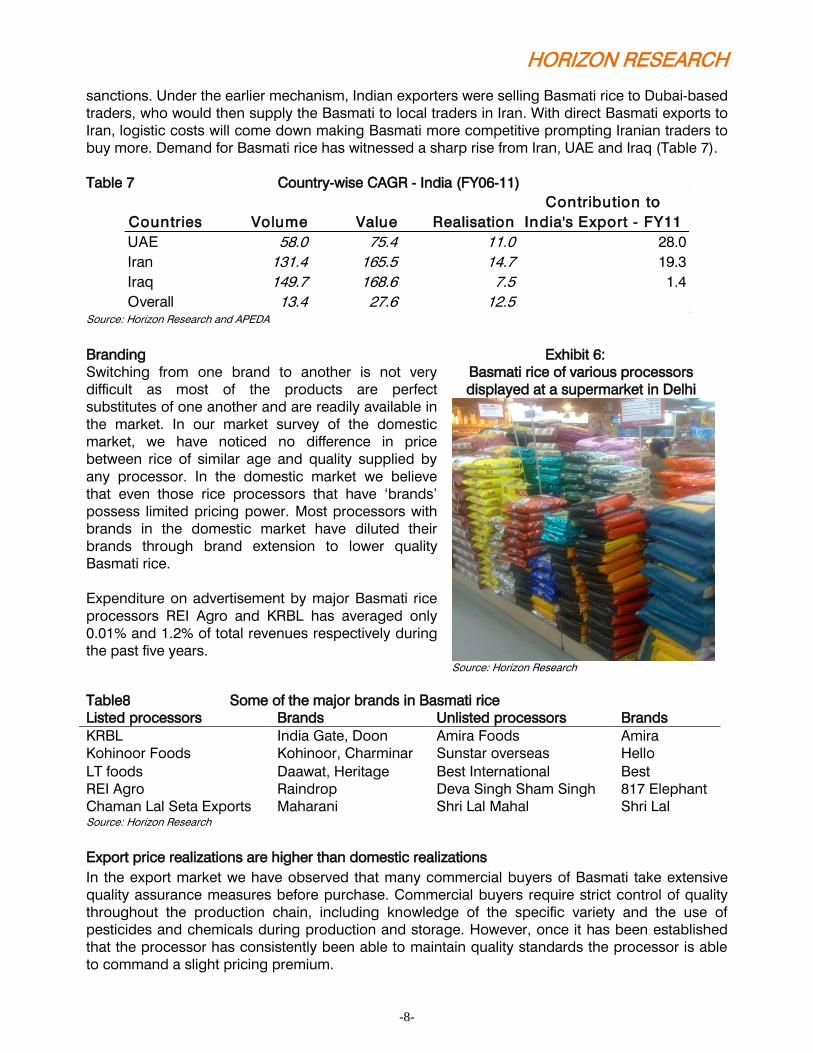
In the domestic market, we believe that demand will expand on account of growing taste for
packaged products, increasing disposable income, which results in a rise in demand for premium
products and the growth in organized retailing. We estimate that overall domestic demand of
Basmati rice has grown at 10.5% CAGR during 2001-12 (Exhibit 5).
Exhibit 5 Growth in Consumption
Source: Horizon Research, Company, APEDA
Of the total worldwide export of Basmati, India’s share is ~78% (3.2 mn MT) and Pakistan’s share
is ~22% (0.9 mn MT). Major Export markets include UAE, Saudi Arabia, Iran, Kuwait and UK in
FY12.
Rice export to Iran had declined in FY11 following US sanctions. Now, as per a new payment
mechanism, Iranian importers can make payment in Indian rupees which will help bypass
HORIZON RESEARCH
-8-
sanctions. Under the earlier mechanism, Indian exporters were selling Basmati rice to Dubai-based
traders, who would then supply the Basmati to local traders in Iran. With direct Basmati exports to
Iran, logistic costs will come down making Basmati more competitive prompting Iranian traders to
buy more. Demand for Basmati rice has witnessed a sharp rise from Iran, UAE and Iraq (Table 7).
Table 7 Country-wise CAGR - India (FY06-11)
Source: Horizon Research and APEDA
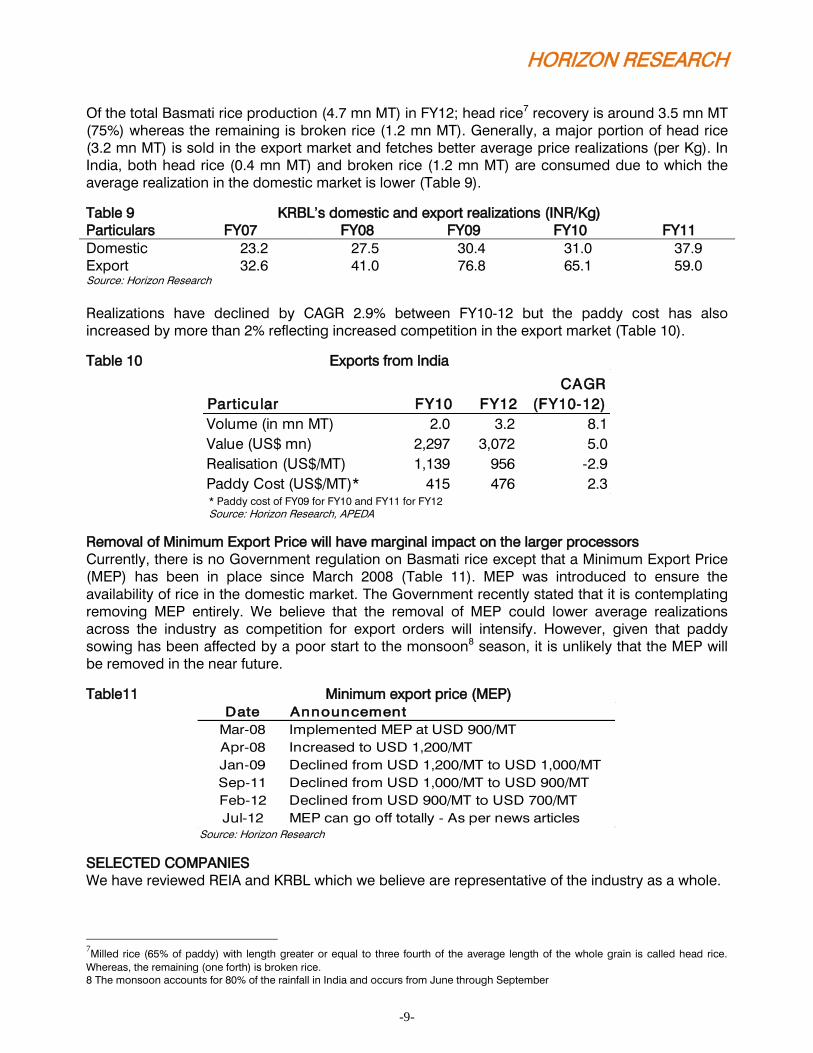
Branding Exhibit 6:
Switching from one brand to another is not very
difficult as most of the products are perfect
substitutes of one another and are readily available in
the market. In our market survey of the domestic
market, we have noticed no difference in price
between rice of similar age and quality supplied by
any processor. In the domestic market we believe
that even those rice processors that have ‘brands’
possess limited pricing power. Most processors with
brands in the domestic market have diluted their
brands through brand extension to lower quality
Basmati rice.
Expenditure on advertisement by major Basmati rice
processors REI Agro and KRBL has averaged only
0.01% and 1.2% of total revenues respectively during
the past five years.
Basmati rice of various processors
displayed at a supermarket in Delhi
Source: Horizon Research
Table8 Some of the major brands in Basmati rice
Listed processors Brands Unlisted processors Brands
KRBL India Gate, Doon Amira Foods Amira
Kohinoor Foods Kohinoor, Charminar Sunstar overseas Hello
LT foods Daawat, Heritage Best International Best
REI Agro Raindrop Deva Singh Sham Singh 817 Elephant
Chaman Lal Seta Exports Maharani Shri Lal Mahal Shri Lal Source: Horizon Research
Export price realizations are higher than domestic realizations
In the export market we have observed that many commercial buyers of Basmati take extensive
quality assurance measures before purchase. Commercial buyers require strict control of quality
throughout the production chain, including knowledge of the specific variety and the use of
pesticides and chemicals during production and storage. However, once it has been established
that the processor has consistently been able to maintain quality standards the processor is able
to command a slight pricing premium.
Countries Volume Value Realisation
Contribution to
India's Export - FY11
UAE 58.0 75.4 11.0 28.0
Iran 131.4 165.5 14.7 19.3
Iraq 149.7 168.6 7.5 1.4
Overall 13.4 27.6 12.5
HORIZON RESEARCH
-9-
Of the total Basmati rice production (4.7 mn MT) in FY12; head rice7 recovery is around 3.5 mn MT
(75%) whereas the remaining is broken rice (1.2 mn MT). Generally, a major portion of head rice
(3.2 mn MT) is sold in the export market and fetches better average price realizations (per Kg). In
India, both head rice (0.4 mn MT) and broken rice (1.2 mn MT) are consumed due to which the
average realization in the domestic market is lower (Table 9).
Table 9 KRBL’s domestic and export realizations (INR/Kg)
Particulars FY07 FY08 FY09 FY10 FY11
Domestic 23.2 27.5 30.4 31.0 37.9
Export 32.6 41.0 76.8 65.1 59.0 Source: Horizon Research
Realizations have declined by CAGR 2.9% between FY10-12 but the paddy cost has also
increased by more than 2% reflecting increased competition in the export market (Table 10).
Table 10 Exports from India
* Paddy cost of FY09 for FY10 and FY11 for FY12
Source: Horizon Research, APEDA
Removal of Minimum Export Price will have marginal impact on the larger processors
Currently, there is no Government regulation on Basmati rice except that a Minimum Export Price
(MEP) has been in place since March 2008 (Table 11). MEP was introduced to ensure the
availability of rice in the domestic market. The Government recently stated that it is contemplating
removing MEP entirely. We believe that the removal of MEP could lower average realizations
across the industry as competition for export orders will intensify. However, given that paddy
sowing has been affected by a poor start to the monsoon8 season, it is unlikely that the MEP will
be removed in the near future.
Table11 Minimum export price (MEP)
Source: Horizon Research
SELECTED COMPANIES
We have reviewed REIA and KRBL which we believe are representative of the industry as a whole.
7Milled rice (65% of paddy) with length greater or equal to three fourth of the average length of the whole grain is called head rice.
Whereas, the remaining (one forth) is broken rice. 8 The monsoon accounts for 80% of the rainfall in India and occurs from June through September
Particular FY10 FY12
CAGR
(FY10-12)
Volume (in mn MT) 2.0 3.2 8.1
Value (US$ mn) 2,297 3,072 5.0
Realisation (US$/MT) 1,139 956 -2.9
Paddy Cost (US$/MT)* 415 476 2.3
Date Announcement
Mar-08 Implemented MEP at USD 900/MT
Apr-08 Increased to USD 1,200/MT
Jan-09 Declined from USD 1,200/MT to USD 1,000/MT
Sep-11 Declined from USD 1,000/MT to USD 900/MT
Feb-12 Declined from USD 900/MT to USD 700/MT
Jul-12 MEP can go off totally - As per news articles
HORIZON RESEARCH
-10-
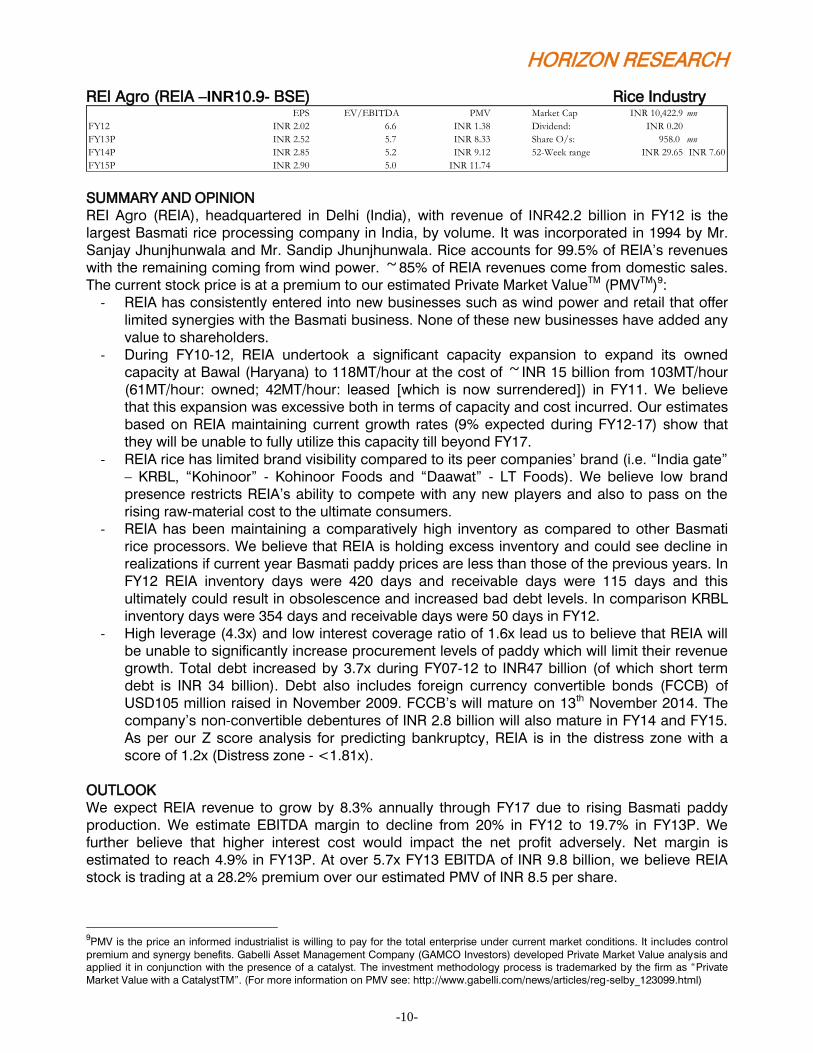
REI Agro (REIA –INR10.9- BSE) Rice Industry
SUMMARY AND OPINION
REI Agro (REIA), headquartered in Delhi (India), with revenue of INR42.2 billion in FY12 is the
largest Basmati rice processing company in India, by volume. It was incorporated in 1994 by Mr.
Sanjay Jhunjhunwala and Mr. Sandip Jhunjhunwala. Rice accounts for 99.5% of REIA’s revenues
with the remaining coming from wind power. ~85% of REIA revenues come from domestic sales.
The current stock price is at a premium to our estimated Private Market ValueTM (PMVTM)9:
- REIA has consistently entered into new businesses such as wind power and retail that offer
limited synergies with the Basmati business. None of these new businesses have added any
value to shareholders.
- During FY10-12, REIA undertook a significant capacity expansion to expand its owned
capacity at Bawal (Haryana) to 118MT/hour at the cost of ~INR 15 billion from 103MT/hour
(61MT/hour: owned; 42MT/hour: leased [which is now surrendered]) in FY11. We believe
that this expansion was excessive both in terms of capacity and cost incurred. Our estimates
based on REIA maintaining current growth rates (9% expected during FY12-17) show that
they will be unable to fully utilize this capacity till beyond FY17.
- REIA rice has limited brand visibility compared to its peer companies’ brand (i.e. “India gate”
– KRBL, “Kohinoor” - Kohinoor Foods and “Daawat” - LT Foods). We believe low brand
presence restricts REIA’s ability to compete with any new players and also to pass on the
rising raw-material cost to the ultimate consumers.
- REIA has been maintaining a comparatively high inventory as compared to other Basmati
rice processors. We believe that REIA is holding excess inventory and could see decline in
realizations if current year Basmati paddy prices are less than those of the previous years. In
FY12 REIA inventory days were 420 days and receivable days were 115 days and this
ultimately could result in obsolescence and increased bad debt levels. In comparison KRBL
inventory days were 354 days and receivable days were 50 days in FY12.
- High leverage (4.3x) and low interest coverage ratio of 1.6x lead us to believe that REIA will
be unable to significantly increase procurement levels of paddy which will limit their revenue
growth. Total debt increased by 3.7x during FY07-12 to INR47 billion (of which short term
debt is INR 34 billion). Debt also includes foreign currency convertible bonds (FCCB) of
USD105 million raised in November 2009. FCCB’s will mature on 13th November 2014. The
company’s non-convertible debentures of INR 2.8 billion will also mature in FY14 and FY15.
As per our Z score analysis for predicting bankruptcy, REIA is in the distress zone with a
score of 1.2x (Distress zone - <1.81x).
OUTLOOK
We expect REIA revenue to grow by 8.3% annually through FY17 due to rising Basmati paddy
production. We estimate EBITDA margin to decline from 20% in FY12 to 19.7% in FY13P. We
further believe that higher interest cost would impact the net profit adversely. Net margin is
estimated to reach 4.9% in FY13P. At over 5.7x FY13 EBITDA of INR 9.8 billion, we believe REIA
stock is trading at a 28.2% premium over our estimated PMV of INR 8.5 per share.
9PMV is the price an informed industrialist is willing to pay for the total enterprise under current market conditions. It includes control
premium and synergy benefits. Gabelli Asset Management Company (GAMCO Investors) developed Private Market Value analysis and
applied it in conjunction with the presence of a catalyst. The investment methodology process is trademarked by the firm as “Private
Market Value with a CatalystTM”. (For more information on PMV see: http://www.gabelli.com/news/articles/reg-selby_123099.html)
EPS EV/EBITDA PMV Market Cap INR 10,422.9 mn
FY12 INR 2.02 6.6 INR 1.38 Dividend: INR 0.20
FY13P INR 2.52 5.7 INR 8.33 Share O/s: 958.0 mn
FY14P INR 2.85 5.2 INR 9.12 52-Week range INR 29.65 INR 7.60
FY15P INR 2.90 5.0 INR 11.74
HORIZON RESEARCH
-11-
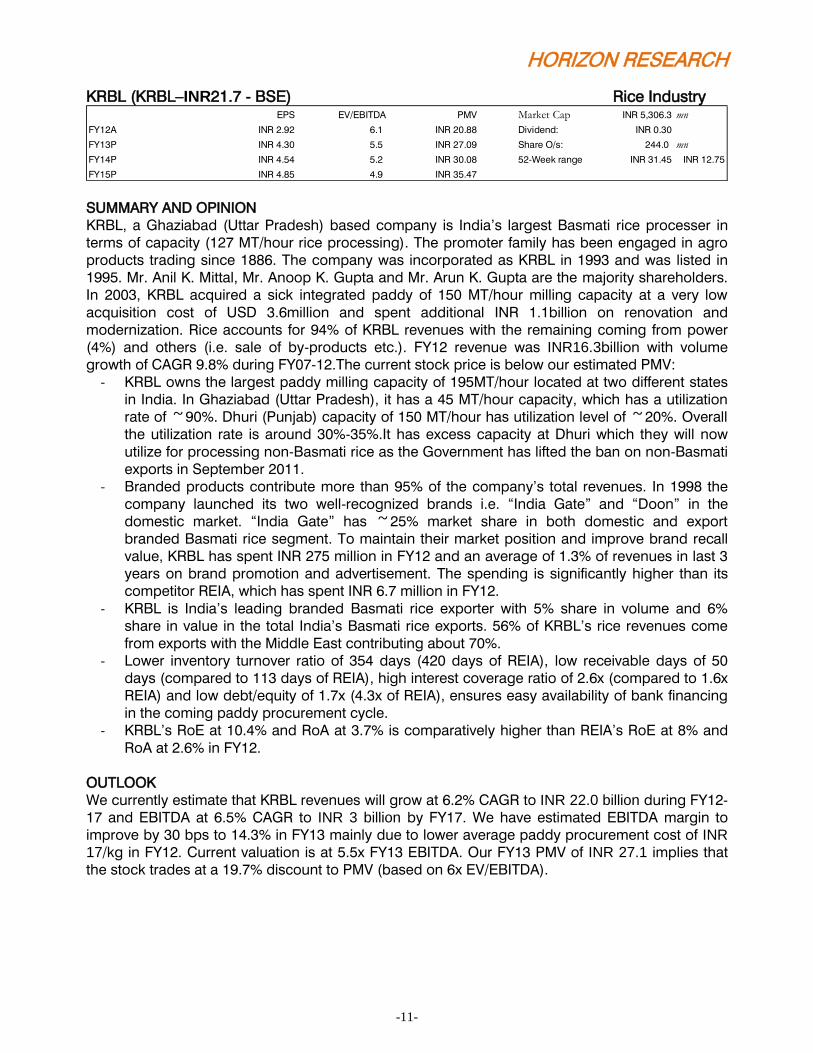
KRBL (KRBL–INR21.7 - BSE) Rice Industry
SUMMARY AND OPINION
KRBL, a Ghaziabad (Uttar Pradesh) based company is India’s largest Basmati rice processer in
terms of capacity (127 MT/hour rice processing). The promoter family has been engaged in agro
products trading since 1886. The company was incorporated as KRBL in 1993 and was listed in
1995. Mr. Anil K. Mittal, Mr. Anoop K. Gupta and Mr. Arun K. Gupta are the majority shareholders.
In 2003, KRBL acquired a sick integrated paddy of 150 MT/hour milling capacity at a very low
acquisition cost of USD 3.6million and spent additional INR 1.1billion on renovation and
modernization. Rice accounts for 94% of KRBL revenues with the remaining coming from power
(4%) and others (i.e. sale of by-products etc.). FY12 revenue was INR16.3billion with volume
growth of CAGR 9.8% during FY07-12.The current stock price is below our estimated PMV:
- KRBL owns the largest paddy milling capacity of 195MT/hour located at two different states
in India. In Ghaziabad (Uttar Pradesh), it has a 45 MT/hour capacity, which has a utilization
rate of ~90%. Dhuri (Punjab) capacity of 150 MT/hour has utilization level of ~20%. Overall
the utilization rate is around 30%-35%.It has excess capacity at Dhuri which they will now
utilize for processing non-Basmati rice as the Government has lifted the ban on non-Basmati
exports in September 2011.
- Branded products contribute more than 95% of the company’s total revenues. In 1998 the
company launched its two well-recognized brands i.e. “India Gate” and “Doon” in the
domestic market. “India Gate” has ~25% market share in both domestic and export
branded Basmati rice segment. To maintain their market position and improve brand recall
value, KRBL has spent INR 275 million in FY12 and an average of 1.3% of revenues in last 3
years on brand promotion and advertisement. The spending is significantly higher than its
competitor REIA, which has spent INR 6.7 million in FY12.
- KRBL is India’s leading branded Basmati rice exporter with 5% share in volume and 6%
share in value in the total India’s Basmati rice exports. 56% of KRBL’s rice revenues come
from exports with the Middle East contributing about 70%.
- Lower inventory turnover ratio of 354 days (420 days of REIA), low receivable days of 50
days (compared to 113 days of REIA), high interest coverage ratio of 2.6x (compared to 1.6x
REIA) and low debt/equity of 1.7x (4.3x of REIA), ensures easy availability of bank financing
in the coming paddy procurement cycle.
- KRBL’s RoE at 10.4% and RoA at 3.7% is comparatively higher than REIA’s RoE at 8% and
RoA at 2.6% in FY12.
OUTLOOK
We currently estimate that KRBL revenues will grow at 6.2% CAGR to INR 22.0 billion during FY12-
17 and EBITDA at 6.5% CAGR to INR 3 billion by FY17. We have estimated EBITDA margin to
improve by 30 bps to 14.3% in FY13 mainly due to lower average paddy procurement cost of INR
17/kg in FY12. Current valuation is at 5.5x FY13 EBITDA. Our FY13 PMV of INR 27.1 implies that
the stock trades at a 19.7% discount to PMV (based on 6x EV/EBITDA).
EPS EV/EBITDA PMV Market Cap INR 5,306.3 mn
FY12A INR 2.92 6.1 INR 20.88 Dividend: INR 0.30
FY13P INR 4.30 5.5 INR 27.09 Share O/s: 244.0 mn
FY14P INR 4.54 5.2 INR 30.08 52-Week range INR 31.45 INR 12.75
FY15P INR 4.85 4.9 INR 35.47
HORIZON RESEARCH
-12-
INVESTMENT CASE AND CONCLUSION
India’s agriculture industry is heavily reliant on the annual monsoon rains and there are clear
indications that FY13 will see deficient rains in most parts of India. Propitiously, the impending
failure of this year’s monsoon should translate into increased Basmati rice production and in
particular increased PUSA 1121 production due to their lower water requirement as compared to
non-Basmati rice. PUSA 1121 has changed the dynamics of the industry. Since FY09 Basmati rice
production has increased almost 1.9x on account of rise in cultivation area and higher productivity
of PUSA 1121.
Though a probable decline in credit availability, high existing inventory levels and increase in
cultivation of Basmati should ensure that Basmati paddy prices will not appreciate in FY13, rice
processors will be unable to benefit as increasing competition has resulted in declining margins
and significant over capacity.
Within the industry we believe that REIA will face significant pressure on margins compared to
their competitors as they do not have any brand visibility, have a minor presence in the export
market, and, with the highest inventory days in the industry will face inventory obsolescence and
margin pressure. In the past REIA has successfully undertaken several fund raising activities
including through an IPO, GDR, QIP issue, rights issue, 2 FCCB issues, spun off a their retail
subsidiary, and, they have raised over INR 47 billion in debt through a number of banks. We
believe that in the past REIA has been able to raise capital when needed to finance operations and
capacity expansion but if this access to capital stops it could lead to significant disruptions in their
operations. Their aggressive expansion and disproportionate expenditure on new facilities has
affected shareholder value. Due to these factors, we believe REIA stock is a sell.
KRBL has an edge over other processors. Their presence in export and domestic markets, lower
inventory levels and debt/equity of 1.6x (4.5x of REI Agro) and high interest coverage ratio of 2.6x
(compared to 1.6x REIA) should ensure that EBITDA margins are maintained.
Investors looking to benefit from the Basmati industry must be selective and take a call based on
the PMV of the company.
HORIZON RESEARCH
-13-
Rohit Anand, the Research Analyst who prepared this report, hereby certify that the views expressed in this report
accurately reflect the analyst’s personal views about the subject companies and their securities. The Research Analyst
has not been, is not and will not be receiving direct or indirect compensation for expressing the specific
recommendation or view in this report.
Rohit Anand, Analyst Horizon Research 2012 Manjit Singh Kalha, Managing Partner Marc Gabelli, Managing Partner Anvesha Thakker, CFA, Partner Rohit Anand, CFA (ICFAI), Analyst
Important Disclosures A 34 Mohan Cooperative, Mathura Road New Delhi 110044 Horizon Research TEL (+91
11) 4056 2508
Horizon Research ("we" or "us") attempts to provide timely, value-added insights into companies or industry dynamics for
institutional investors. Our research reports generally contain a recommendation of "buy," "hold," "sell" or "non-rated.” We
do not undertake to "upgrade" or "downgrade" ratings after publishing a report.
Ratings
Analysts’ ratings are largely (but not always) determined by our “private market value,” or PMV methodology. Our basic
goal is to understand in absolute terms what a rational, strategic buyer would pay for an asset in an open, arms-length
transaction. At the same time, analysts also look for underlying catalysts that could encourage those private market
values to surface.
A Buy rated stock is one that in our view is trading at a meaningful discount to our estimated PMV. We could expect a
more modest private market value to increase at an accelerated pace, the discount of the public stock price to PMV to
narrow through the emergence of a catalyst, or some combination of the two to occur.
A Hold is a stock that may be trading at or near our estimated private market value. We may not anticipate a large
increase in the PMV, or see some other factors at work.
A Sell is a stock that may be trading at or above our estimated PMV. There may be little upside to the value, or limited
opportunity to realize the value. Economic or sector risk could also be increasing.
We prepared this report as a matter of general information. We do not intend for this report to be a complete description
of any security or company and it is not an offer or solicitation to buy or sell any security. All facts and statistics are from
sources we believe to be reliable, but we do not guarantee their accuracy. We do not undertake to advise you of
changes in our opinion or information. Unless otherwise noted, all stock prices reflect the closing price on the business
day immediately prior to the date of this report. We do not use "price targets" predicting future stock performance. We
do refer to "private market value" or PMV, which is the price that we believe an informed buyer would pay to acquire
100% of a company. There is no assurance that there are any willing buyers of a company at this price and we do not
intend to suggest that any acquisition is likely. Additional information is available on request.
Disclosure of interest:
Neither Horizon Research nor its affiliates received any compensation from the company (s) covered herein in
the past twelve months for Issue Management, Mergers & Acquisitions, Buyback of shares and other corporate
advisory services.
Affiliates of Horizon Research are currently not having any mandate from the subject company (s).
The Equity Analyst holds no shares of the company (s) covered as on the date of publication of the research.
Directors of Horizon Research do not hold shares of the company (s).