Embed Size (px)
Citation preview
Indiana Fiscal Year 2016 Closeout Report
Indiana Fiscal Policy Institute Information Brief August 2, 2016
2 | P a g e
About the Author Brad Gottschlich is a recent graduate of the Masters of Public Affairs program at Indiana
University’s School of Public and Environmental Affairs in Indianapolis. Gottschlich was the
Indiana Fiscal Policy Institute’s research fellow in 2015 and 2016, and he’s served several
internships related to the Indiana General Assembly since he was an undergraduate student at
Ball State University.
About the IFPI The Indiana Fiscal Policy Institute (IFPI), formed in 1987, is a private, non-profit governmental
research organization. The IFPI’s mission is to enhance the effectiveness and accountability of
state and local government through the education of public sector, business and labor leaders on
significant fiscal policy questions, and the consequences of state and local decisions. The IFPI
makes a significant contribution to the important, on-going debate over the appropriate role of
government. The IFPI does not lobby, support or oppose candidates for public office. Instead it
relies on objective research evidence as the basis for assessing sound state fiscal policy.
Contact:
John Ketzenberger
President
Indiana Fiscal Policy Institute
One American Square, Suite 150
Indianapolis, IN 46282
Phone: 317-366-2431
www.indianafiscal.org
Copyright 2016, Indiana Fiscal Policy Institute
3 | P a g e
Introduction
Three things marked the closeout of Indiana’s budget for Fiscal Year 2016 on July 25.
First, the closeout was about 10 days later than usual. Typically the state’s closeout is announced
during the second week in July. This year, however, was not typical. Gov. Mike Pence’s
selection as candidate for vice president on the Republican ticket broke in the news on July 14,
the same day the closeout was conducted in 2015. Between his selection as the candidate and the
subsequent Republican convention, it’s no surprise the closeout was delayed.
Second, the governor did not participate in the public release for the first time in recent memory.
The lieutenant governor and the auditor conducted the press conference in conjunction with the
release of the revenue report, surplus statements and reversion summaries.
Finally, while the reports showed again that Indiana is well managed from a financial
standpoint—a hallmark of nearly all administrations over the last several decades—there is some
cause for concern in the revenue report. For the second time in three years overall tax collections
lagged both the Budget Committee’s projections and the previous year’s results. While it’s not
unusual for tax revenue to be below projections, it is unusual for actual collections to fall year-
over-year. That this occurred at a time of economic expansion and low unemployment adds to
the concern.
The weakness is especially apparent in personal income and sales tax collections, which grew by
just $13 million out of $12.4 billion total, or just 0.001 percent in FY2016 vs. FY2015. About 84
percent of Indiana’s general tax revenue derives from these two sources, which also happen to be
particularly sensitive to the economy’s performance. Unfortunately, the growth rate for Indiana’s
tax revenue has barely topped 2 percent in a given year since the recession ended. It will take
extraordinary growth of 3.5 percent to bring revenue level with expectations of the December
2015 forecast used to construct the current two-year budget. The consequences if this growth
does not occur include additional budget reversions or outright reductions, and a dramatically
reduced surplus.
Although Indiana completed the fiscal year with a positive annual surplus and a slight increase in
the year’s total reserve combined balance, the fundamental premise of this report is to assess the
previous fiscal year along with historical trends to project how it may affect deliberations on a
new two-year budget when the next session begins in January. This paper will examine and
analyze the FY 2016 general fund revenue report, describe trends in the major revenues collected
over time, discuss historical trends in reserves and their liquidity, and look ahead to 2017 by
providing an overview of common state budgeting strategies that have been implemented.
Relevant recent legislation will be included throughout as needed.
4 | P a g e
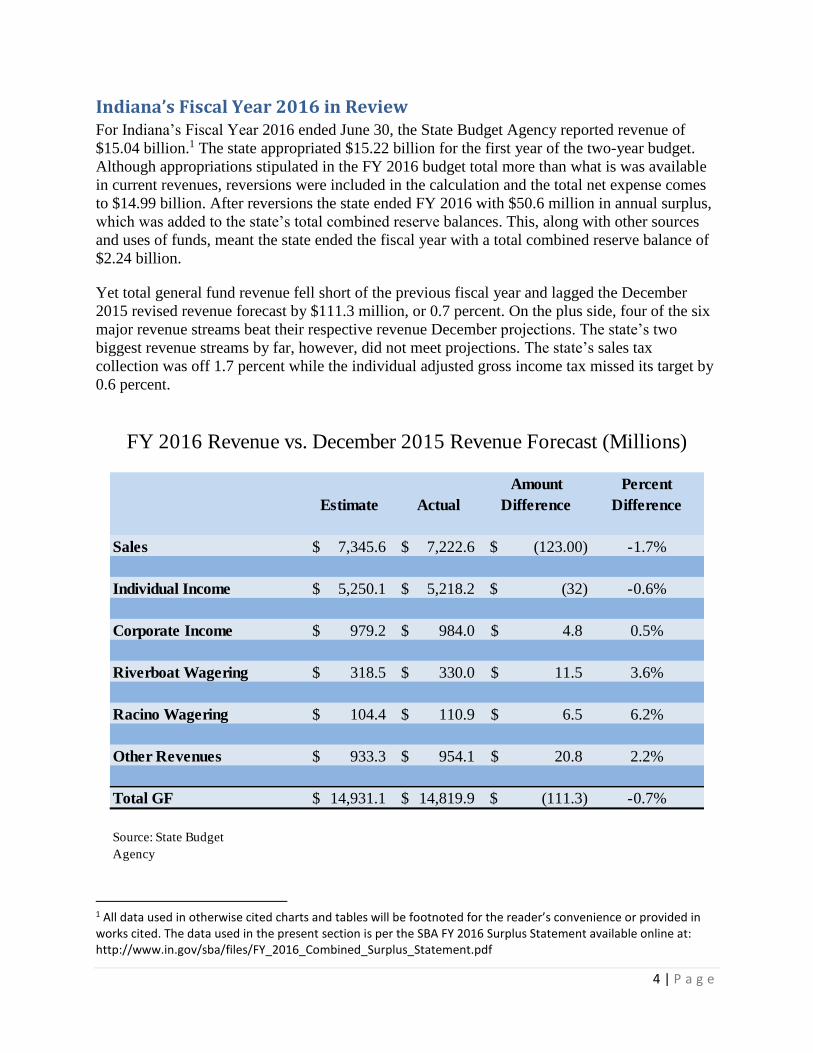
Indiana’s Fiscal Year 2016 in Review For Indiana’s Fiscal Year 2016 ended June 30, the State Budget Agency reported revenue of
$15.04 billion.1 The state appropriated $15.22 billion for the first year of the two-year budget.
Although appropriations stipulated in the FY 2016 budget total more than what is was available
in current revenues, reversions were included in the calculation and the total net expense comes
to $14.99 billion. After reversions the state ended FY 2016 with $50.6 million in annual surplus,
which was added to the state’s total combined reserve balances. This, along with other sources
and uses of funds, meant the state ended the fiscal year with a total combined reserve balance of
$2.24 billion.
Yet total general fund revenue fell short of the previous fiscal year and lagged the December
2015 revised revenue forecast by $111.3 million, or 0.7 percent. On the plus side, four of the six
major revenue streams beat their respective revenue December projections. The state’s two
biggest revenue streams by far, however, did not meet projections. The state’s sales tax
collection was off 1.7 percent while the individual adjusted gross income tax missed its target by
0.6 percent.
1 All data used in otherwise cited charts and tables will be footnoted for the reader’s convenience or provided in works cited. The data used in the present section is per the SBA FY 2016 Surplus Statement available online at: http://www.in.gov/sba/files/FY_2016_Combined_Surplus_Statement.pdf
Estimate Actual
Amount
Difference
Percent
Difference
Sales 7,345.6$ 7,222.6$ (123.00)$ -1.7%
Individual Income 5,250.1$ 5,218.2$ (32)$ -0.6%
Corporate Income 979.2$ 984.0$ 4.8$ 0.5%
Riverboat Wagering 318.5$ 330.0$ 11.5$ 3.6%
Racino Wagering 104.4$ 110.9$ 6.5$ 6.2%
Other Revenues 933.3$ 954.1$ 20.8$ 2.2%
Total GF 14,931.1$ 14,819.9$ (111.3)$ -0.7%
Source: State Budget
Agency
FY 2016 Revenue vs. December 2015 Revenue Forecast (Millions)
5 | P a g e
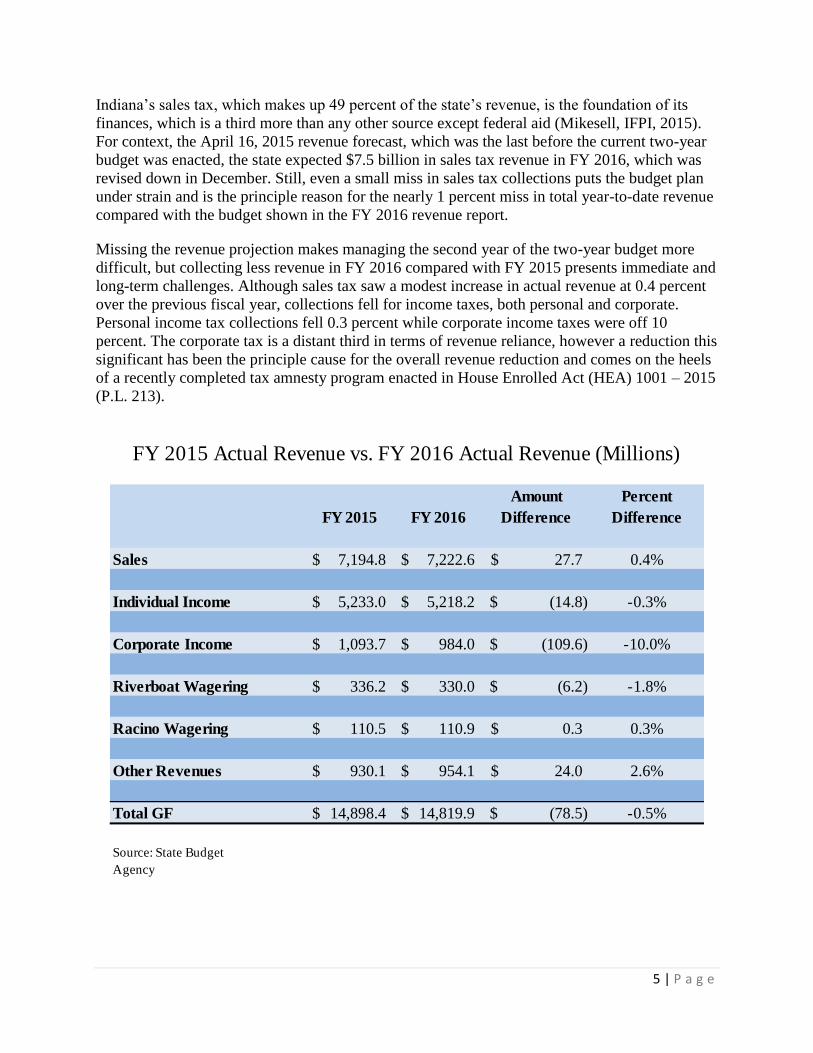
Indiana’s sales tax, which makes up 49 percent of the state’s revenue, is the foundation of its
finances, which is a third more than any other source except federal aid (Mikesell, IFPI, 2015).
For context, the April 16, 2015 revenue forecast, which was the last before the current two-year
budget was enacted, the state expected $7.5 billion in sales tax revenue in FY 2016, which was
revised down in December. Still, even a small miss in sales tax collections puts the budget plan
under strain and is the principle reason for the nearly 1 percent miss in total year-to-date revenue
compared with the budget shown in the FY 2016 revenue report.
Missing the revenue projection makes managing the second year of the two-year budget more
difficult, but collecting less revenue in FY 2016 compared with FY 2015 presents immediate and
long-term challenges. Although sales tax saw a modest increase in actual revenue at 0.4 percent
over the previous fiscal year, collections fell for income taxes, both personal and corporate.
Personal income tax collections fell 0.3 percent while corporate income taxes were off 10
percent. The corporate tax is a distant third in terms of revenue reliance, however a reduction this
significant has been the principle cause for the overall revenue reduction and comes on the heels
of a recently completed tax amnesty program enacted in House Enrolled Act (HEA) 1001 – 2015
(P.L. 213).
FY 2015 FY 2016
Amount
Difference
Percent
Difference
Sales 7,194.8$ 7,222.6$ 27.7$ 0.4%
Individual Income 5,233.0$ 5,218.2$ (14.8)$ -0.3%
Corporate Income 1,093.7$ 984.0$ (109.6)$ -10.0%
Riverboat Wagering 336.2$ 330.0$ (6.2)$ -1.8%
Racino Wagering 110.5$ 110.9$ 0.3$ 0.3%
Other Revenues 930.1$ 954.1$ 24.0$ 2.6%
Total GF 14,898.4$ 14,819.9$ (78.5)$ -0.5%
Source: State Budget
Agency
FY 2015 Actual Revenue vs. FY 2016 Actual Revenue (Millions)
6 | P a g e
While the December 2015 revenue forecast to the State Budget Committee came close to
predicting the reduction in corporate income tax revenue year-over-year, it significantly
overestimated sales and personal income tax revenue.2 Yet it is the underperforming growth in
sales tax that actually strains the budget, especially going forward. If the lackluster performance
continues, perhaps a closer look will be needed in the next cycle of budget deliberations to
determine whether the state can continue to rely on forecasted sales tax growth in the current
form, or whether to consider additional revenue by broadening the tax base to additional services
(Mikesell, IFPI, 2015).
Amid the slow economic growth, the General Assembly continued to enact cuts to several taxes,
including the inheritance tax, corporate income tax and the personal income tax. This is likely to
blame for the 0.4 percent reduction in overall tax collection between FY 2013 and FY 2014, but
it’s less likely the reason for the loss of revenue between FY 2015 and FY 2016. The end result
is that Indiana’s tax revenue fell from one year to the next in two out of the last three years, a
most unusual result during a time of low unemployment and economic growth, albeit sluggish.
Yet Indiana does maintain healthy reserve balances, suggesting the administration, legislators
and others involved in administering the budget have managed to so far balance the tax policy
and slow growth.
2 Page 12 of the presentation shows percent growth prediction for actual FY 2016 over actual FY 2015 and although the prediction is near accurate for the corporate tax, the subtotal of major taxes coming to 0.2 percent growth relied heavily on primarily a 2.1 percent increase in in sales tax actual growth and a 0.3 percent individual AGI actual growth. This compares to what we now know as an actual 0.4 percent growth in sales and a -0.3 percent growth in Individual AGI. It ca be accessed online at: http://www.in.gov/sba/files/rev_forecast_20151217_Presentation.pdf
7 | P a g e
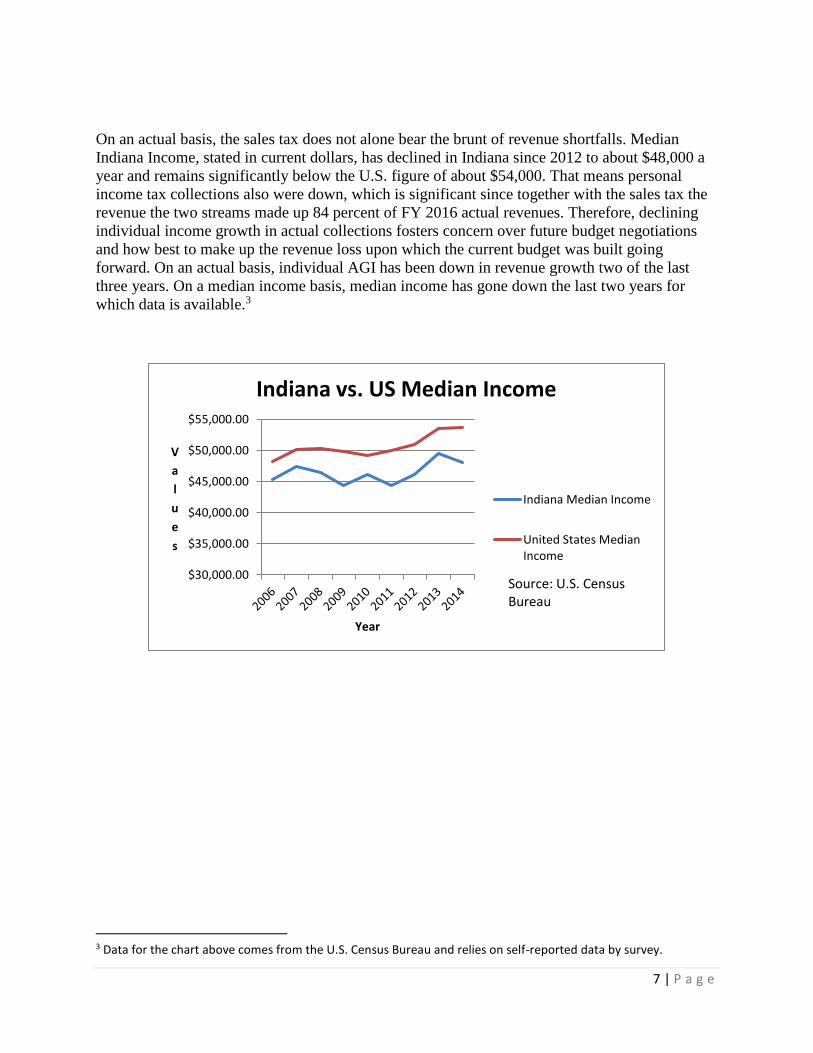
On an actual basis, the sales tax does not alone bear the brunt of revenue shortfalls. Median
Indiana Income, stated in current dollars, has declined in Indiana since 2012 to about $48,000 a
year and remains significantly below the U.S. figure of about $54,000. That means personal
income tax collections also were down, which is significant since together with the sales tax the
revenue the two streams made up 84 percent of FY 2016 actual revenues. Therefore, declining
individual income growth in actual collections fosters concern over future budget negotiations
and how best to make up the revenue loss upon which the current budget was built going
forward. On an actual basis, individual AGI has been down in revenue growth two of the last
three years. On a median income basis, median income has gone down the last two years for
which data is available.3
3 Data for the chart above comes from the U.S. Census Bureau and relies on self-reported data by survey.
$30,000.00
$35,000.00
$40,000.00
$45,000.00
$50,000.00
$55,000.00
V
a
l
u
e
s
Year
Indiana vs. US Median Income
Indiana Median Income
United States MedianIncome
Source: U.S. Census Bureau
8 | P a g e
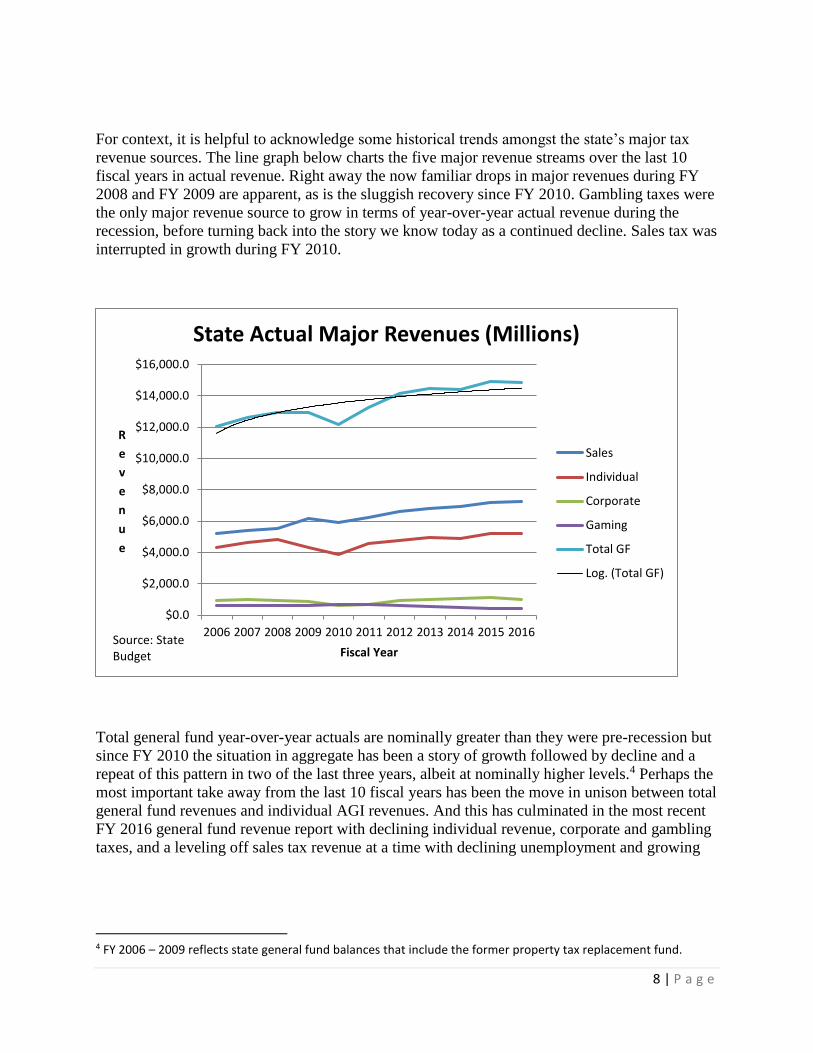
For context, it is helpful to acknowledge some historical trends amongst the state’s major tax
revenue sources. The line graph below charts the five major revenue streams over the last 10
fiscal years in actual revenue. Right away the now familiar drops in major revenues during FY
2008 and FY 2009 are apparent, as is the sluggish recovery since FY 2010. Gambling taxes were
the only major revenue source to grow in terms of year-over-year actual revenue during the
recession, before turning back into the story we know today as a continued decline. Sales tax was
interrupted in growth during FY 2010.
Total general fund year-over-year actuals are nominally greater than they were pre-recession but
since FY 2010 the situation in aggregate has been a story of growth followed by decline and a
repeat of this pattern in two of the last three years, albeit at nominally higher levels.4 Perhaps the
most important take away from the last 10 fiscal years has been the move in unison between total
general fund revenues and individual AGI revenues. And this has culminated in the most recent
FY 2016 general fund revenue report with declining individual revenue, corporate and gambling
taxes, and a leveling off sales tax revenue at a time with declining unemployment and growing
4 FY 2006 – 2009 reflects state general fund balances that include the former property tax replacement fund.
$0.0
$2,000.0
$4,000.0
$6,000.0
$8,000.0
$10,000.0
$12,000.0
$14,000.0
$16,000.0
2006 2007 2008 2009 2010 2011 2012 2013 2014 2015 2016
R
e
v
e
n
u
e
Fiscal Year
State Actual Major Revenues (Millions)
Sales
Individual
Corporate
Gaming
Total GF
Log. (Total GF)
Source: State Budget
9 | P a g e
GDP in Indiana.5 To be sure, the reliance on sales and individual income tax has been the root of
negative actual general fund growth in two of the last three years.
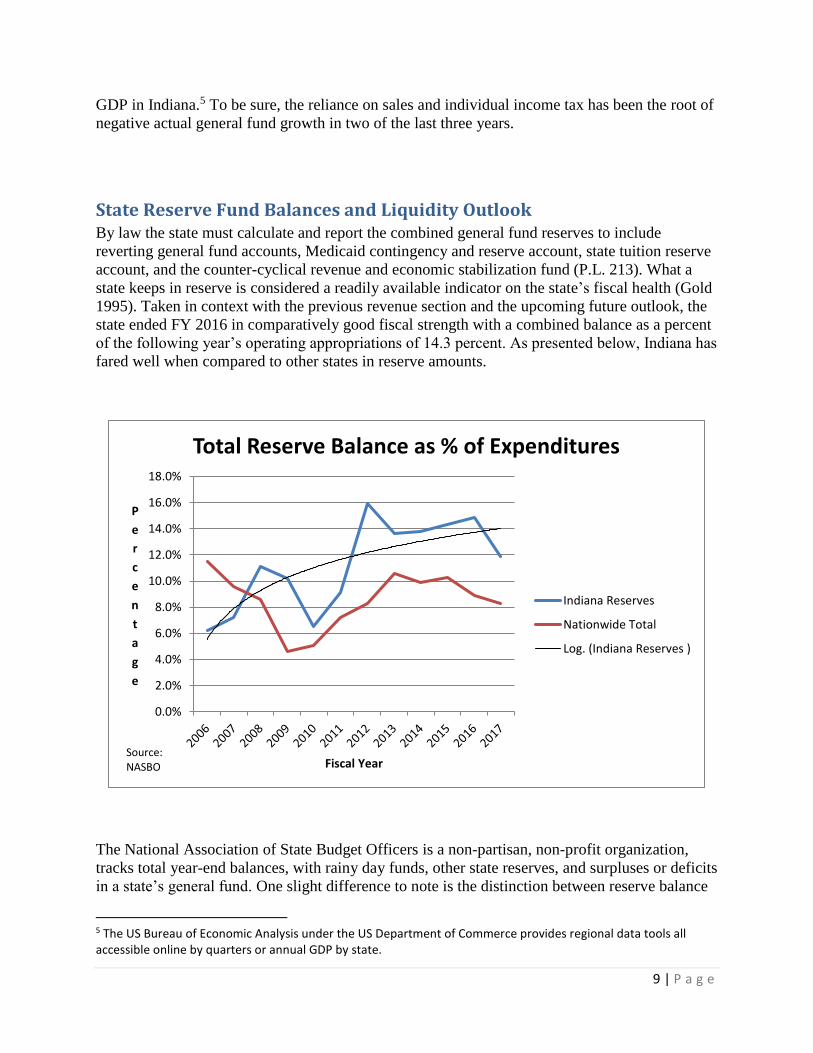
State Reserve Fund Balances and Liquidity Outlook By law the state must calculate and report the combined general fund reserves to include
reverting general fund accounts, Medicaid contingency and reserve account, state tuition reserve
account, and the counter-cyclical revenue and economic stabilization fund (P.L. 213). What a
state keeps in reserve is considered a readily available indicator on the state’s fiscal health (Gold
1995). Taken in context with the previous revenue section and the upcoming future outlook, the
state ended FY 2016 in comparatively good fiscal strength with a combined balance as a percent
of the following year’s operating appropriations of 14.3 percent. As presented below, Indiana has
fared well when compared to other states in reserve amounts.
The National Association of State Budget Officers is a non-partisan, non-profit organization,
tracks total year-end balances, with rainy day funds, other state reserves, and surpluses or deficits
in a state’s general fund. One slight difference to note is the distinction between reserve balance
5 The US Bureau of Economic Analysis under the US Department of Commerce provides regional data tools all accessible online by quarters or annual GDP by state.
0.0%
2.0%
4.0%
6.0%
8.0%
10.0%
12.0%
14.0%
16.0%
18.0%
P
e
r
c
e
n
t
a
g
e
Fiscal Year
Total Reserve Balance as % of Expenditures
Indiana Reserves
Nationwide Total
Log. (Indiana Reserves )
Source: NASBO
10 | P a g e
as percent of appropriation, which is used in Indiana’s surplus statement, and reserve balance as
percent of same year expenditure that NASBO uses, which is shown in the graph above.
Consistent here with the previous revenue graph, is that states generally draw down reserves
during recessions or bad revenue cycles, and build the balances during improved cycles. They
are used essentially now as they were over the last 20 years to provide flexibility in demands of
the operating budget (CBO 1998). Reserve balances for Medicaid ($577.6 million), state tuition
reserve ($345.9 million), and Rainy Day Fund ($544.6 million) come in at about $1.47 billion,
including a $165.5 million transfer from the state’s general fund to the Rainy Day Fund. In
addition, the general fund reserve at the end of FY 2016 was $776.3 million.
States have primarily accomplished reserves by maintaining general fund balances to provide for
administrative flexibility. Nationally there has been a rapid decrease in total reserves over the
last fiscal year compared with FY 2015, reaching the greatest rate of decline outside of recession
years. Indiana’s reserves grew slightly even though HEA 1001 – 2016 stipulated a transfer of
excess reserves from the general fund into the State Highway Fund and a local matching grant
fund at an estimated total of $445.9 million once the FY 2016 ended. Looking ahead, it will be
more difficult to maintain reserves as reflected in the 2017 forecast level (P.L. 146), which could
affect liquidity. Using the reserves like this is, in part, a reality that the state’s revenues have not
met anticipated growth. If the state’s economy—and thus median Hoosiers’ incomes—do not
grow over the next 12 months at levels unseen in recent years, it likely means lower reserves and
that constrict the General Assembly’s decisions in the coming budget deliberations.
Other reserved balances have not been drawn on, but serve specific purposes that are evident in
their names. The desire to preserve these reserve balances have been expressed by lawmakers
still conscious of the great recession, and who do not wish to be in a position that forces them to
decide which bills to pay. For example, if Medicaid service providers don’t get paid for almost
six months, their willingness to provide services to the state becomes affected (CBO 1998).
Although no official rule of thumb exists for the exact size of reserves, studies have looked at
previous recessions and calculated what states would have needed to avoid dramatic steps like
tax increases or expenditure reductions. For example, in the 1990-1991 recession Indiana would
have needed 15.86 percent of budget appropriations in reserves to avoid major tax and
expenditure decisions, and 21 percent to leave balances as they were pre-recession (Sobel &
Holcombe 1998).
Expectations for the Future Next year’s budget considerations will be more difficult if the results posted for FY 2016
continue. On the revenue side, declining or stagnating taxes have been observed in the past as
attributable to sales taxes not being applicable to services (Gold 1995) and more recently studied
by Mikesell (IFPI, 2015) in Indiana. However states are not limited to meeting these challenges
by adjusting tax rates up or down. These measures can be avoided for the most part if one-time
measures are used heavily, spending is cut, or the burden is shifted to the federal or local
11 | P a g e
governments (Gold 1995). And to some extent these strategies are what have been observed
recently in Indiana.
Infrastructure needs were the main focus of the General Assembly’s 2016 session and were
primarily satisfied with one-time measures including the transfer of general fund liquidity to
local-state matching grant program and state highway funds, and distributions to locals from the
local option income tax trust funds to be primarily used for infrastructure needs (P.L. 126). These
measures help fulfill a need for additional transportation fund, but the long-term solution remains
unresolved and the current fiscal situation will affect those negotiations in the coming session.
Spending has also been cut or reverted over the last 10 fiscal years. The reversions have helped
cover yearly shortfalls in the general fund in years past. Spending cuts were most drastic during
the recession years, but remain ongoing in the years that have followed.6
Finally, the state has expanded Medicaid in the form of HIP 2.0 and the last budget bill provided
language stipulating the transfer of money between hospitals and the state in order for the
ongoing roll-out of the plan and the increase draw for federal matching dollars into the state (P.L.
213). It has been noticed in prior years that significant growth in state strategies to shift Medicaid
costs to the federal government has contributed to the growth of the federal budget for the need
(Gold 1995). The Medicaid outlook continues to be a major draw on state budget, and projected
growth in spending and enrollment is expected in recent outlooks (NASBO 2016).
Conclusion Indiana’s fiscal management remains a strength. The state does maintain reserves, adopts
responsible budgets and has a strong system in place to administer spending. The state’s Triple A
rating from bonding agencies is testament to the state’s fiscal position.
However recent revenue trends are reason for concern. Tax cuts and a sluggish economy means
there is less tax revenue available than present forecasts indicate, and more troublesome is the
drop in actual revenue collections in two of the last three fiscal years.
If the current situation holds the General Assembly and the new governor are in for a challenging
budgeting process during the next session.
6 Agency reversions and total fund reversions are available in each year fiscal close out on the State Budget Agency’s website.
12 | P a g e
Works Cited CBO Memorandum. (1998). States' Use of of Surplus Funds. The Congressional Budget Office.
Douglas, J.W., & Gaddie, R.K. (2002). State Rainy Day Funds and Fiscal Crises: Rainy Day
Funds and the 1990-1991 Recession Revisited. Public Budgeting and Finance.
Gold, S.D. (1995). The Fiscal Crisis of the States: Lessons for the Future. Georgetown
University Press, Washington D.C.
Mikesell. (2015). Considering Sales Taxation of Services in Indiana. The Indiana Fiscal Policy
Institute.
NASBO. (2016). Spring 2016 Fiscal Survey of the States. The National Association of State
Budget Officers. Date accessed 7/25/2016. http://www.nasbo.org/publications-data/fiscal-
survey-of-the-states
P.L 146. (2016). Road Funding. Indiana General Assembly.
http://iga.in.gov/legislative/2016/bills/house/1001
P.L. 126. (2016). Local Income Tax Distributions. Indiana General Assembly.
http://iga.in.gov/legislative/2016/bills/senate/67
P.L. 213. (2015). State Biennial Budget. Indiana General Assembly.
https://iga.in.gov/legislative/2015/bills/house/1001
Sobel, R.S., & Holcombe, R.G. (1996). The Impact of State Rainy Day Funds in easing State
Fiscal Crises During the 1990-1991 Recession. Public Budgeting and Finance.