Embed Size (px)
Citation preview
CHAPTER 1 The SurveysCHAPTER 1 The Surveys
This chapter covers changes in Indiana since the 2011-2015 SCORP. It looks briefly at state and national trends that affect how we use and provide outdoor recreation. The chapter also examines the backbone of this SCORP: the surveys done by our third-party surveyors, the methods they used, and the results.
Indiana’s SCORPs differ from those created by other states.
1. We try to directly “‘count’” (via local government self-reported data) public outdoor recreation acreage, both by county and by level of government.
2. We hire third-party surveyors. We ensure these surveyors are objective, unbiased and professional.
3. We ask members of the public their preferences for outdoor recreation activities and ask professional outdoor recreation providers for their opinions and ideas, too.
This approach allows this SCORP to show what public outdoor recreation acreage actually exists, both geographically, and by cumulative “type” of acreage. SCORP readers can cross-compare against their peers in multiple ways. Surveying both the public and outdoor recreation professionals this way allows the DNR to look at what real people actually want to do for outdoor
recreation, as well as how recreation professionals provide those activities. The method also reveals the needs and challenges both groups face.
Indiana’s SCORP continues to be a multi-purpose information source for many groups. Researchers use it for data on recreation preferences. Park professionals use it when writing park plans or strategic documents. Local government leaders use it to compare their community to local and regional competition. And interested members of the public use it to learn what activities their friends and neighbors enjoy doing while visiting public outdoor recreation sites.
Just as previous Indiana SCORPs, this SCORP used three main surveys:
• The Outdoor Recreation Participation Survey, which o Asks members of the the public about their
outdoor recreation activities and frequency of use.
• The Trail User Survey, whicho Asks members of the the public about how
they use one of our most popular amenities.
•The Local Parks and Recreation Provider Survey, whicho Asks professional and non-profit local
outdoor recreation providers about their challenges, issues, and solutions.
26
THE OUTDOOR RECREATION PARTICIPATION SURVEYOutdoor Recreation Participation Survey Methods:
• Survey used paper intercept surveys.
• The questionnaire asks 22 regular questions, and one large, multi-part question containing 49 separate recreational-activity categories.
• The estimated time needed to take the survey was 8-10 minutes.
• Paper survey results were manually entered into the database.
• Respondents were chosen on a next-available basis.
• People younger than 17 were not discouraged from taking the survey, but were not actively recruited.
• The survey was conducted at county fairs, libraries, and other public locations throughout the state.
• The survey took place from May 2014 through September 2014.
• The completed respondent database consists of 6,381 valid respondents.
Outdoor Recreation Participation Survey Demographic Results:
• Respondents were 57.9% female, 42.1% male.
• Average age of respondents was 40.3 years.
CHAPTER 1 The Indiana Statewide Comprehensive Outdoor Recreation Plan 2016-2020
• Every county in Indiana was represented in the data.
• 58% of survey respondents were married, 24% were single (never married), and 7% were single (divorced). [All results are somewhat comparable to U.S. Census demographic data for Indiana.]
• 82% of respondents reported themselves as white, 12% as black, 3% as Hispanic/Latino, and 1% as multi-racial.
• 70% of respondents stated that they had between two and four family members living in their household.
• 57% of respondents reported having no persons younger than 18 living in their household.
Outdoor Recreation Participation Survey Results:
• The top three reasons why respondents participate in outdoor recreation were
o To be with Family and Friends ............... 41%o Physical Health ....................................... 31%o Mental Health ........................................ 27%
• The top five outdoor recreation activities that respondents wanted to do in the future were:
o Walking/Hiking/Jogging/Running (pedestrian activities)
o Campingo Fishingo Swimmingo Canoeing/Kayaking/Tubing
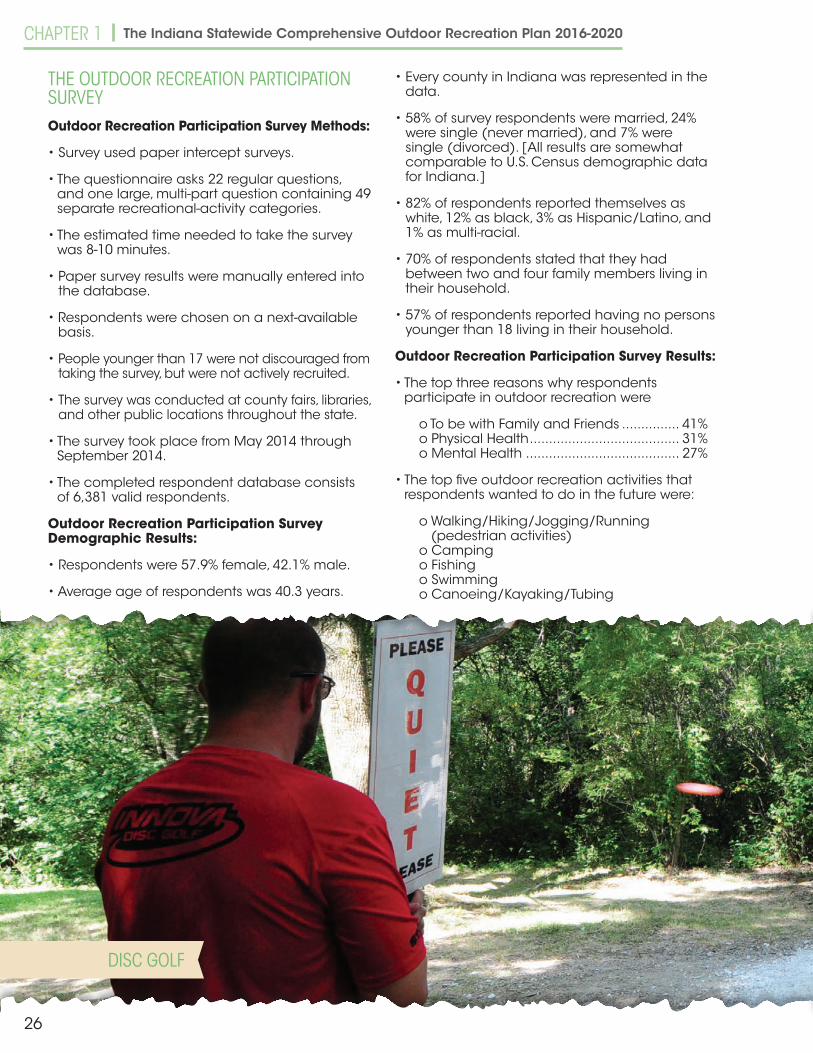
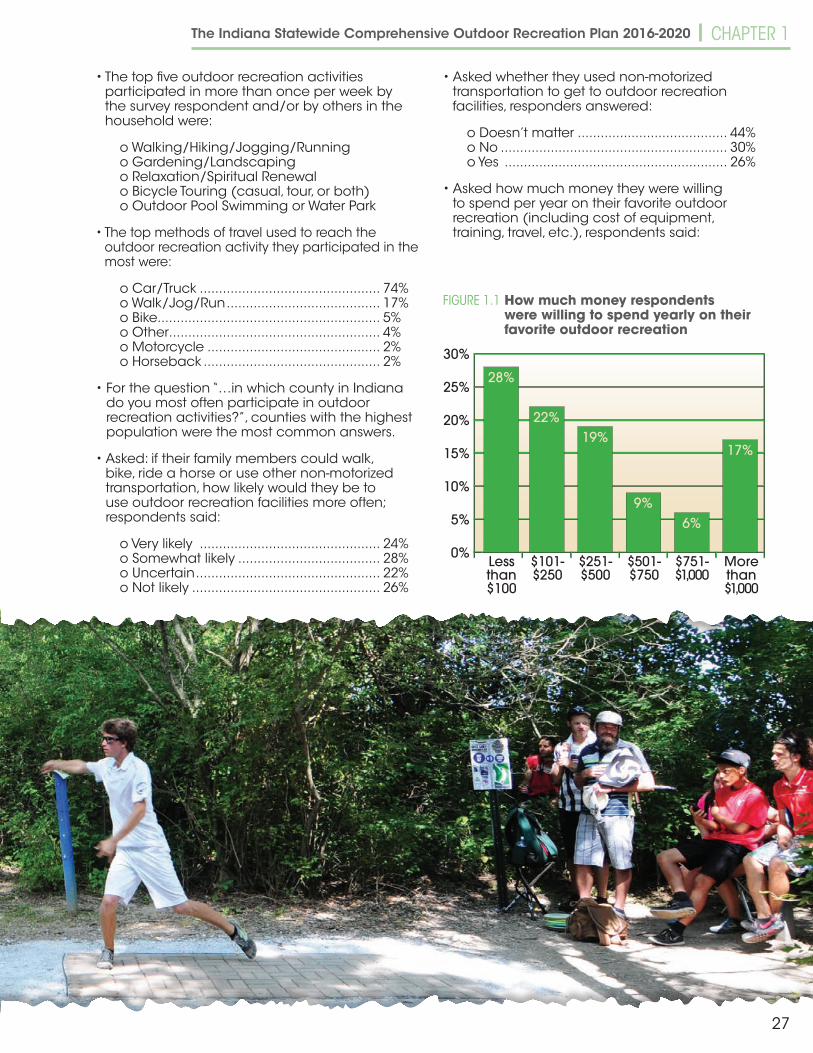
DISC GOLF
27
• The top five outdoor recreation activities participated in more than once per week by the survey respondent and/or by others in the household were:
o Walking/Hiking/Jogging/Runningo Gardening/Landscapingo Relaxation/Spiritual Renewalo Bicycle Touring (casual, tour, or both)o Outdoor Pool Swimming or Water Park
• The top methods of travel used to reach the outdoor recreation activity they participated in the most were:
o Car/Truck ............................................... 74%o Walk/Jog/Run ........................................ 17%o Bike.......................................................... 5%o Other ....................................................... 4%o Motorcycle ............................................. 2%o Horseback .............................................. 2%
• For the question “…in which county in Indiana do you most often participate in outdoor recreation activities?”, counties with the highest population were the most common answers.
• Asked: if their family members could walk, bike, ride a horse or use other non-motorized transportation, how likely would they be to use outdoor recreation facilities more often; respondents said:
o Very likely ............................................... 24%o Somewhat likely ..................................... 28%o Uncertain ................................................ 22%o Not likely ................................................. 26%
The Indiana Statewide Comprehensive Outdoor Recreation Plan 2016-2020 CHAPTER 1
0%
5%
10%
15%
20%
25%
30%
Less than $100
$101- $250
$251- $500
$501- $750
$751- $1,000
More than $1,000
28%
22%19%
9%6%
17%
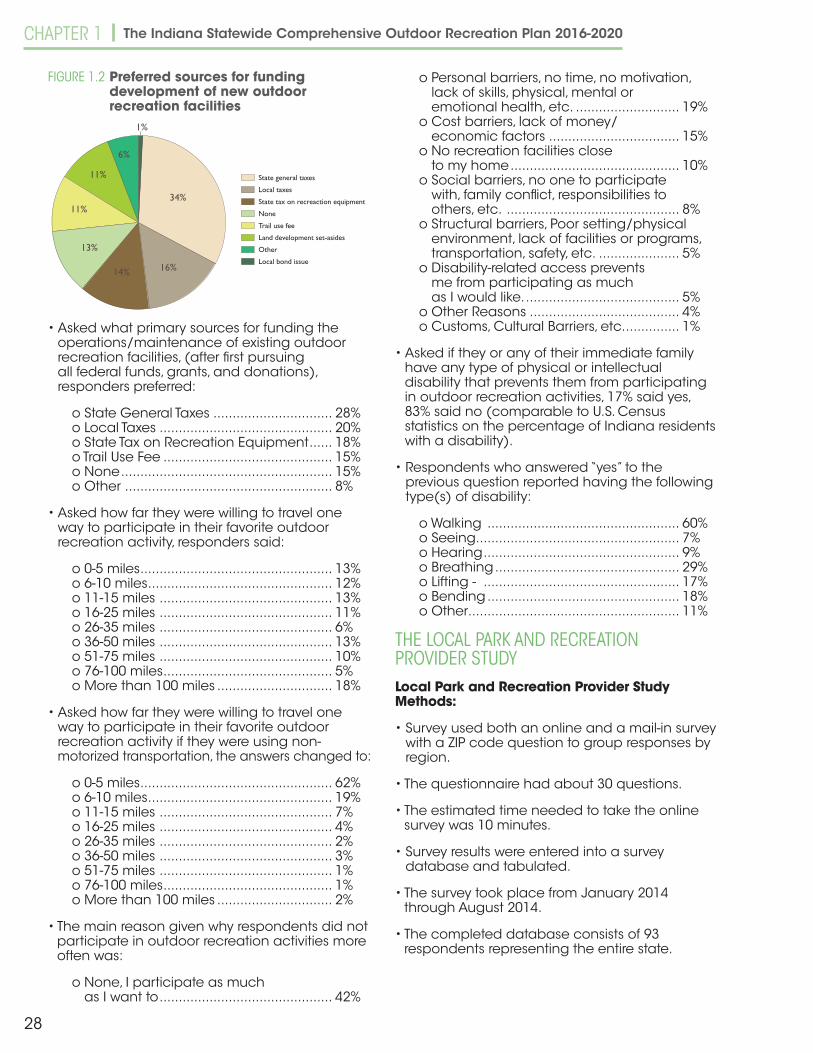
FIGURE 1.1 How much money respondents were willing to spend yearly on their favorite outdoor recreation
• Asked whether they used non-motorized transportation to get to outdoor recreation facilities, responders answered:
o Doesn’t matter ....................................... 44%o No ........................................................... 30%o Yes .......................................................... 26%
• Asked how much money they were willing to spend per year on their favorite outdoor recreation (including cost of equipment, training, travel, etc.), respondents said:
28
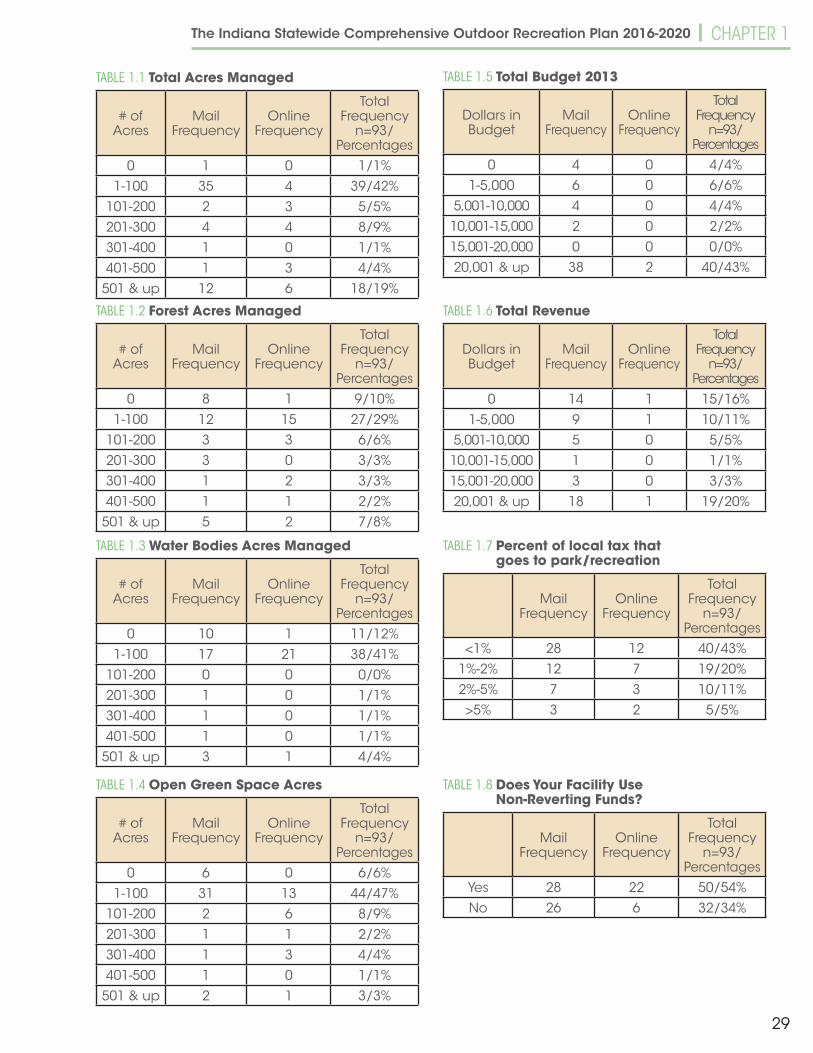
• Asked what primary sources for funding the operations/maintenance of existing outdoor recreation facilities, (after first pursuing all federal funds, grants, and donations), responders preferred:
o State General Taxes ............................... 28%o Local Taxes ............................................. 20%o State Tax on Recreation Equipment ...... 18%o Trail Use Fee ............................................ 15%o None ....................................................... 15%o Other ...................................................... 8%
• Asked how far they were willing to travel one way to participate in their favorite outdoor recreation activity, responders said:
o 0-5 miles .................................................. 13%o 6-10 miles ................................................ 12%o 11-15 miles ............................................. 13%o 16-25 miles ............................................. 11%o 26-35 miles ............................................. 6%o 36-50 miles ............................................. 13%o 51-75 miles ............................................. 10%o 76-100 miles ............................................ 5%o More than 100 miles .............................. 18%
• Asked how far they were willing to travel one way to participate in their favorite outdoor recreation activity if they were using non-motorized transportation, the answers changed to:
o 0-5 miles .................................................. 62%o 6-10 miles ................................................ 19%o 11-15 miles ............................................. 7%o 16-25 miles ............................................. 4%o 26-35 miles ............................................. 2%o 36-50 miles ............................................. 3%o 51-75 miles ............................................. 1%o 76-100 miles ............................................ 1%o More than 100 miles .............................. 2%
• The main reason given why respondents did not participate in outdoor recreation activities more often was:
o None, I participate as much as I want to ............................................. 42%
CHAPTER 1 The Indiana Statewide Comprehensive Outdoor Recreation Plan 2016-2020
Local bond issue
Trail use fee
State general taxes
None
Land development set-asides
Other
State tax on recreaction equipment
Local taxes34%
16%14%
13%
11%
11%
6%
1%
FIGURE 1.2 Preferred sources for funding development of new outdoor recreation facilities
o Personal barriers, no time, no motivation, lack of skills, physical, mental or emotional health, etc. ........................... 19%
o Cost barriers, lack of money/ economic factors .................................. 15%
o No recreation facilities close to my home ............................................ 10%
o Social barriers, no one to participate with, family conflict, responsibilities to others, etc. ............................................. 8%
o Structural barriers, Poor setting/physical environment, lack of facilities or programs, transportation, safety, etc. ..................... 5%
o Disability-related access prevents me from participating as much as I would like. ........................................ 5%
o Other Reasons ....................................... 4%o Customs, Cultural Barriers, etc. .............. 1%
• Asked if they or any of their immediate family have any type of physical or intellectual disability that prevents them from participating in outdoor recreation activities, 17% said yes, 83% said no (comparable to U.S. Census statistics on the percentage of Indiana residents with a disability).
• Respondents who answered “yes” to the previous question reported having the following type(s) of disability:
o Walking .................................................. 60%o Seeing ..................................................... 7%o Hearing ................................................... 9%o Breathing ................................................ 29%o Lifting - ................................................... 17%o Bending .................................................. 18%o Other ....................................................... 11%
THE LOCAL PARK AND RECREATION PROVIDER STUDYLocal Park and Recreation Provider Study Methods:
• Survey used both an online and a mail-in survey with a ZIP code question to group responses by region.
• The questionnaire had about 30 questions.
• The estimated time needed to take the online survey was 10 minutes.
• Survey results were entered into a survey database and tabulated.
• The survey took place from January 2014 through August 2014.
• The completed database consists of 93 respondents representing the entire state.
29
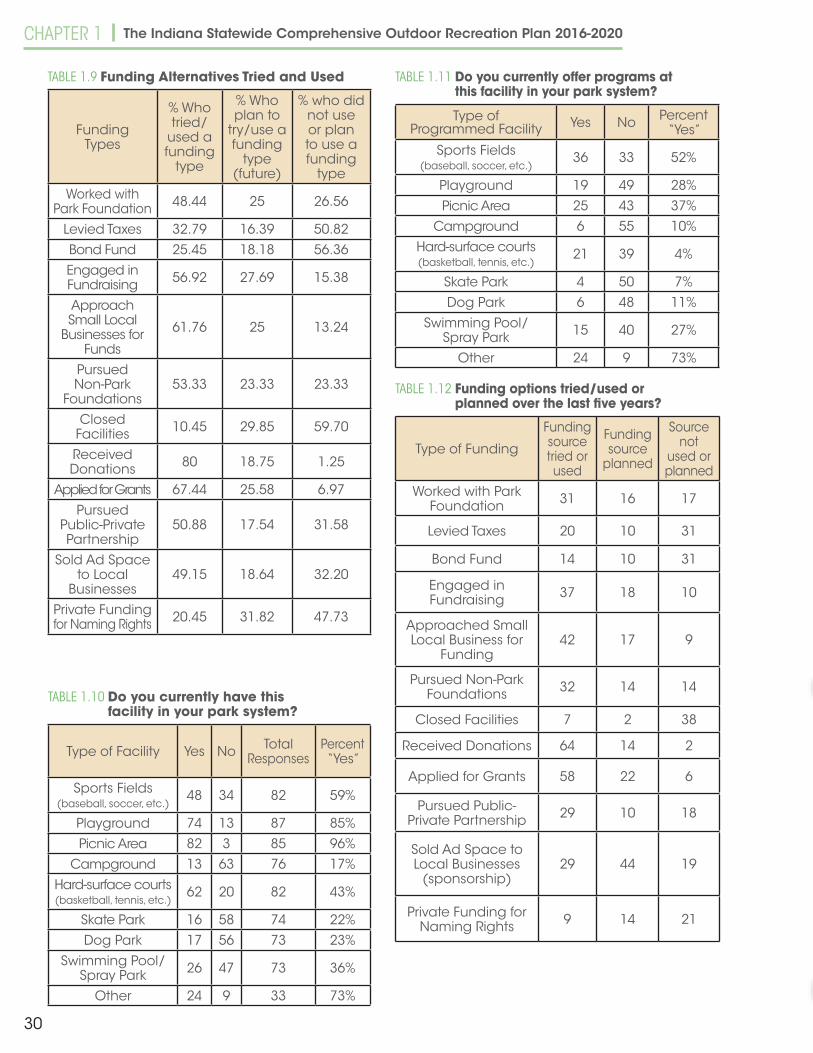
TABLE 1.1 Total Acres Managed
# of Acres
Mail Frequency
Online Frequency
Total Frequency
n=93/Percentages
0 1 0 1/1%1-100 35 4 39/42%
101-200 2 3 5/5%201-300 4 4 8/9%301-400 1 0 1/1%401-500 1 3 4/4%
501 & up 12 6 18/19%
TABLE 1.7 Percent of local tax that goes to park/recreation
Mail Frequency
Online Frequency
Total Frequency
n=93/Percentages
<1% 28 12 40/43%1%-2% 12 7 19/20%2%-5% 7 3 10/11%>5% 3 2 5/5%
TABLE 1.6 Total Revenue
Dollars in Budget
Mail Frequency
Online Frequency
Total Frequency
n=93/Percentages
0 14 1 15/16%1-5,000 9 1 10/11%
5,001-10,000 5 0 5/5%10,001-15,000 1 0 1/1%15,001-20,000 3 0 3/3%20,001 & up 18 1 19/20%
TABLE 1.5 Total Budget 2013
Dollars in Budget
Mail Frequency
Online Frequency
Total Frequency
n=93/Percentages
0 4 0 4/4%1-5,000 6 0 6/6%
5,001-10,000 4 0 4/4%10,001-15,000 2 0 2/2%15,001-20,000 0 0 0/0%20,001 & up 38 2 40/43%
The Indiana Statewide Comprehensive Outdoor Recreation Plan 2016-2020 CHAPTER 1
TABLE 1.2 Forest Acres Managed
# of Acres
Mail Frequency
Online Frequency
Total Frequency
n=93/Percentages
0 8 1 9/10%1-100 12 15 27/29%
101-200 3 3 6/6%201-300 3 0 3/3%301-400 1 2 3/3%401-500 1 1 2/2%
501 & up 5 2 7/8%
TABLE 1.3 Water Bodies Acres Managed
# of Acres
Mail Frequency
Online Frequency
Total Frequency
n=93/Percentages
0 10 1 11/12%1-100 17 21 38/41%
101-200 0 0 0/0%201-300 1 0 1/1%301-400 1 0 1/1%401-500 1 0 1/1%
501 & up 3 1 4/4%
TABLE 1.4 Open Green Space Acres
# of Acres
Mail Frequency
Online Frequency
Total Frequency
n=93/Percentages
0 6 0 6/6%1-100 31 13 44/47%
101-200 2 6 8/9%201-300 1 1 2/2%301-400 1 3 4/4%401-500 1 0 1/1%
501 & up 2 1 3/3%
TABLE 1.8 Does Your Facility Use Non-Reverting Funds?
Mail Frequency
Online Frequency
Total Frequency
n=93/Percentages
Yes 28 22 50/54%No 26 6 32/34%
30
Type of Programmed Facility Yes No Percent
“Yes”Sports Fields
(baseball, soccer, etc.)36 33 52%
Playground 19 49 28%Picnic Area 25 43 37%
Campground 6 55 10%Hard-surface courts (basketball, tennis, etc.)
21 39 4%
Skate Park 4 50 7%Dog Park 6 48 11%
Swimming Pool/ Spray Park 15 40 27%
Other 24 9 73%
TABLE 1.11 Do you currently offer programs at this facility in your park system?
Type of Funding
Funding source tried or used
Funding source
planned
Source not
used or planned
Worked with Park Foundation 31 16 17
Levied Taxes 20 10 31
Bond Fund 14 10 31
Engaged in Fundraising 37 18 10
Approached Small Local Business for
Funding42 17 9
Pursued Non-Park Foundations 32 14 14
Closed Facilities 7 2 38
Received Donations 64 14 2
Applied for Grants 58 22 6
Pursued Public-Private Partnership 29 10 18
Sold Ad Space to Local Businesses
(sponsorship)29 44 19
Private Funding for Naming Rights 9 14 21
TABLE 1.12 Funding options tried/used or planned over the last five years?
CHAPTER 1 The Indiana Statewide Comprehensive Outdoor Recreation Plan 2016-2020
TABLE 1.9 Funding Alternatives Tried and Used
Funding Types
% Who tried/
used a funding
type
% Who plan to
try/use a funding
type (future)
% who did not use or plan to use a funding
typeWorked with
Park Foundation 48.44 25 26.56
Levied Taxes 32.79 16.39 50.82Bond Fund 25.45 18.18 56.36Engaged in Fundraising 56.92 27.69 15.38
Approach Small Local
Businesses for Funds
61.76 25 13.24
Pursued Non-Park
Foundations53.33 23.33 23.33
Closed Facilities 10.45 29.85 59.70
Received Donations 80 18.75 1.25
Applied for Grants 67.44 25.58 6.97Pursued
Public-Private Partnership
50.88 17.54 31.58
Sold Ad Space to Local
Businesses49.15 18.64 32.20
Private Funding for Naming Rights 20.45 31.82 47.73
TABLE 1.10 Do you currently have this facility in your park system?
Type of Facility Yes No Total Responses
Percent “Yes”
Sports Fields (baseball, soccer, etc.)
48 34 82 59%
Playground 74 13 87 85%Picnic Area 82 3 85 96%
Campground 13 63 76 17%Hard-surface courts (basketball, tennis, etc.)
62 20 82 43%
Skate Park 16 58 74 22%Dog Park 17 56 73 23%
Swimming Pool/Spray Park 26 47 73 36%
Other 24 9 33 73%
31
Type of Land Acquisition
Funding
Funding source tried or used
Funding source
planned
Source not
used or planned
Land and Water Conservation Fund
Grant used to Purchase Land
18 16 25
Partner with Local Schools for Public Use of their Land or Recreational
Facilities
17 9 32
Utility Corridors or rights of Way 17 10 25
Land Trust or Other Nonprofit
Landowners13 11 33
Conservation Easement with
Other Landowners13 9 31
Cooperation with Private Landowners 14 7 28
Indiana Dept. of Natural Resources
Grant Programs (other than LWCF)
24 20 17
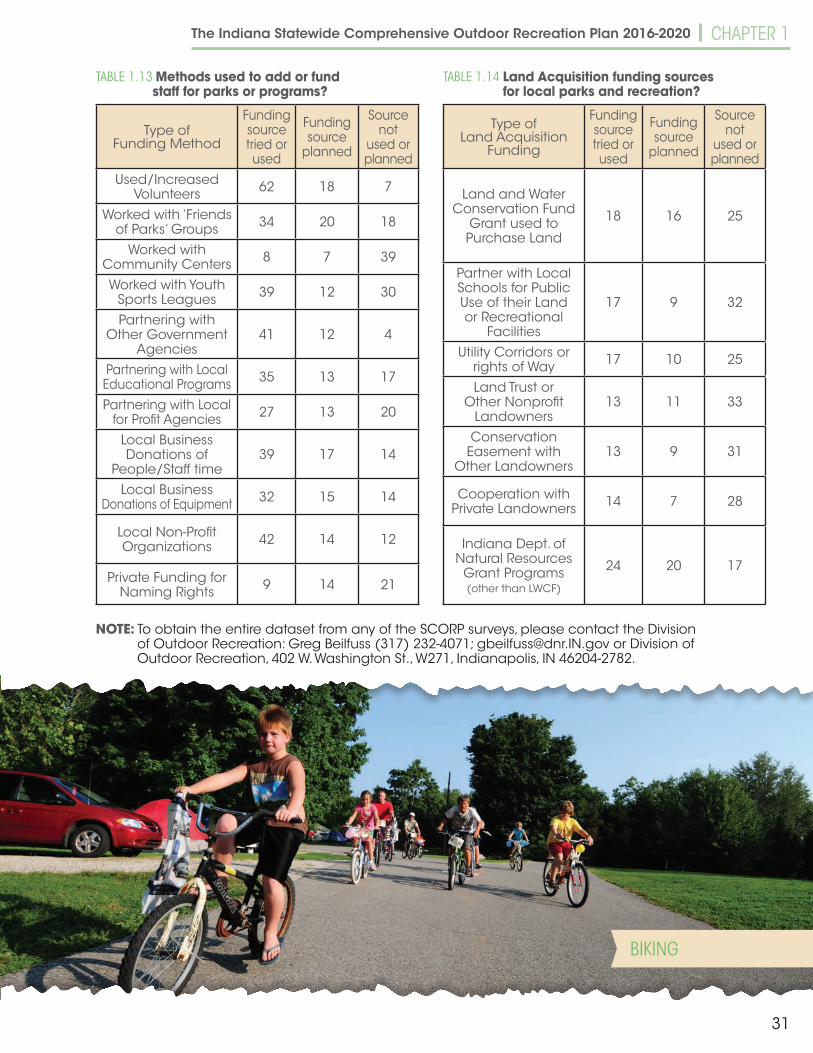
TABLE 1.14 Land Acquisition funding sources for local parks and recreation?
Type of Funding Method
Funding source tried or used
Funding source
planned
Source not
used or planned
Used/Increased Volunteers 62 18 7
Worked with ‘Friends of Parks’ Groups 34 20 18
Worked with Community Centers 8 7 39
Worked with Youth Sports Leagues 39 12 30
Partnering with Other Government
Agencies41 12 4
Partnering with Local Educational Programs 35 13 17
Partnering with Local for Profit Agencies 27 13 20
Local Business Donations of
People/Staff time39 17 14
Local Business Donations of Equipment 32 15 14
Local Non-Profit Organizations 42 14 12
Private Funding for Naming Rights 9 14 21
TABLE 1.13 Methods used to add or fund staff for parks or programs?
NOTE: To obtain the entire dataset from any of the SCORP surveys, please contact the Division of Outdoor Recreation: Greg Beilfuss (317) 232-4071; [email protected] or Division of Outdoor Recreation, 402 W. Washington St., W271, Indianapolis, IN 46204-2782.
The Indiana Statewide Comprehensive Outdoor Recreation Plan 2016-2020 CHAPTER 1
BIKING
32
Type of Partner Facility
Yes, We partner with this group.
No, We do not partner
with this group.
Privately-Owned Neighborhood Parks in HOA/Subdivisions 8 18
Private For- Profit Providers 20 48Non-Profit Provider
(e.g. YMCA, etc.)35 34
School Systems providing recreation 48 23
State Properties 17 50Federal Properties 4 61
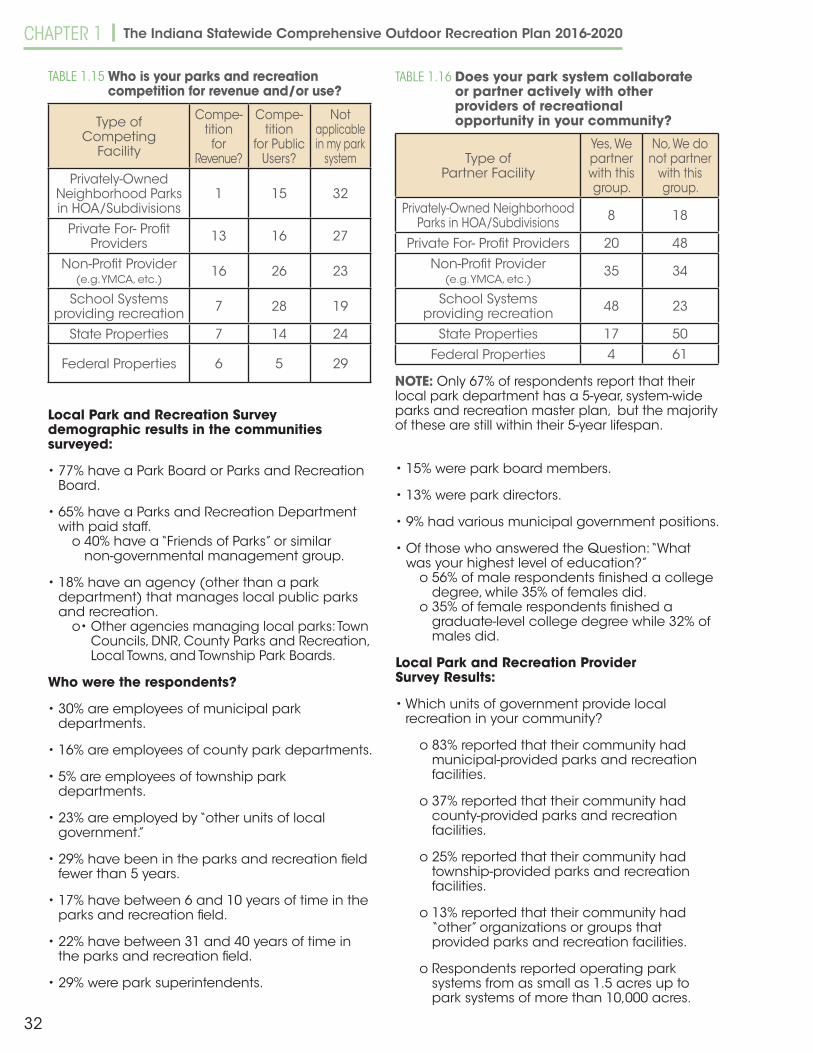
TABLE 1.16 Does your park system collaborate or partner actively with other providers of recreational opportunity in your community?
NOTE: Only 67% of respondents report that their local park department has a 5-year, system-wide parks and recreation master plan, but the majority of these are still within their 5-year lifespan.
Local Park and Recreation Survey demographic results in the communities surveyed:
• 77% have a Park Board or Parks and Recreation Board.
• 65% have a Parks and Recreation Department with paid staff.
o 40% have a “Friends of Parks” or similar non-governmental management group.
• 18% have an agency (other than a park department) that manages local public parks and recreation.
o• Other agencies managing local parks: Town Councils, DNR, County Parks and Recreation, Local Towns, and Township Park Boards.
Who were the respondents?
• 30% are employees of municipal park departments.
• 16% are employees of county park departments.
• 5% are employees of township park departments.
• 23% are employed by “other units of local government.”
• 29% have been in the parks and recreation field fewer than 5 years.
• 17% have between 6 and 10 years of time in the parks and recreation field.
• 22% have between 31 and 40 years of time in the parks and recreation field.
• 29% were park superintendents.
Type of Competing
Facility
Compe-tition for
Revenue?
Compe-tition
for Public Users?
Not applicable in my park
systemPrivately-Owned
Neighborhood Parks in HOA/Subdivisions
1 15 32
Private For- Profit Providers 13 16 27
Non-Profit Provider (e.g. YMCA, etc.)
16 26 23
School Systems providing recreation 7 28 19
State Properties 7 14 24
Federal Properties 6 5 29
TABLE 1.15 Who is your parks and recreation competition for revenue and/or use?
CHAPTER 1 The Indiana Statewide Comprehensive Outdoor Recreation Plan 2016-2020
• 15% were park board members.
• 13% were park directors.
• 9% had various municipal government positions.
• Of those who answered the Question: “What was your highest level of education?”
o 56% of male respondents finished a college degree, while 35% of females did.
o 35% of female respondents finished a graduate-level college degree while 32% of males did.
Local Park and Recreation Provider Survey Results:
• Which units of government provide local recreation in your community?
o 83% reported that their community had municipal-provided parks and recreation facilities.
o 37% reported that their community had county-provided parks and recreation facilities.
o 25% reported that their community had township-provided parks and recreation facilities.
o 13% reported that their community had “other” organizations or groups that provided parks and recreation facilities.
o Respondents reported operating park systems from as small as 1.5 acres up to park systems of more than 10,000 acres.
33
The Indiana Statewide Comprehensive Outdoor Recreation Plan 2016-2020 CHAPTER 1
o Respondents reported 2013 budgets ranging from $15,800 up to $3.9 million.
o Respondents also reported earning revenues ranging from $2,249 up to $2 million.
THE TRAILS USER SURVEYTrails User Survey Methods: • The estimated time needed to take the survey
was between 3 and 6 minutes.
• Paper survey results were manually entered into the database post-survey.
• Respondents were always chosen on a next available basis.
• People under 17 were not discouraged from taking the survey, but they also were not actively recruited.
• The survey was conducted at county fairs, libraries, and other public locations throughout the state.
• The survey took place from March through July of 2014.
• The completed database consists of 1,043 respondents.
Trails User Survey Demographic Results:
• 47.3% of respondents were male, and 52.7% were female.
• Average age of respondents was 39.9.
• 77.7% of respondents were white (non-Hispanic), 16.4% black/African-American and 2.1% Hispanic.
• Every county statewide across Indiana was represented in the data.
Trails User Survey Results:
• Walking is the trail activity participated in the most.
• The general public is three to four times more likely to use trails for walking than for most other activities.
• More than 80% of respondents use trails for walking sometime during the year.
• The top three trail activities are:o Walkingo Bicycle Touring (casual, tour, or both)o Using trails for alternative transportation routes
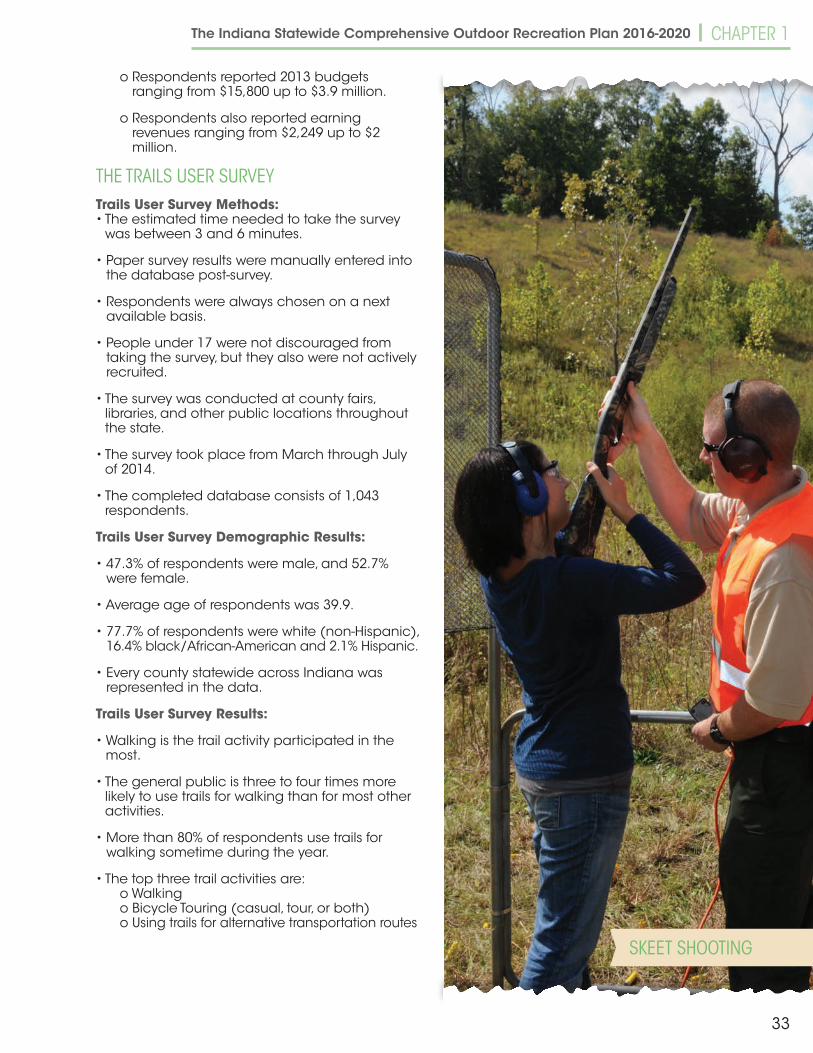
SKEET SHOOTING
34
CHAPTER 1 The Indiana Statewide Comprehensive Outdoor Recreation Plan 2016-2020
• The top three reasons why respondents used trails were:
o Pleasure, Relaxation, Recreation (53%)o Health/Physical Training (32%)o Family or Social Outing (35%)
• Asked what trail activity they would like to participate in at least 12 times per year in the future, respondents said:
o Walking/Running/Jogging (69%)o Bicycle Touring (casual, touring or both) (41%)o Hiking/Backpacking (39%)
• 64% of respondents said there was a trail within 5 miles or 10 minutes of their home.
• 35% prefer native soil as their trail surface, 29% selected asphalt.
• 79% of those who had an opinion either strongly or somewhat agreed that trail connectivity should be an important part of a community’s infrastructure.
• Respondents believed that trail connectivity was extremely important for:
o Personal Health (60%)o Community Health (55%)o Environmental Health (44%)o Alternative Transportation Corridors (30%)
• Word of mouth was the top way that respondents find out about trail opportunities; trail websites was second; signage at parks was third.
• Asked why they do not use trails as much as they would like, respondents said:
o Personal barriers (no time, no motivation, lack of skills, physical /mental and emotional health, ability level, etc.) were cited by 35% of respondents.
o 29% of respondents said they participated as much as they wanted.
o 19% of respondents said that there were no trails close to their home.
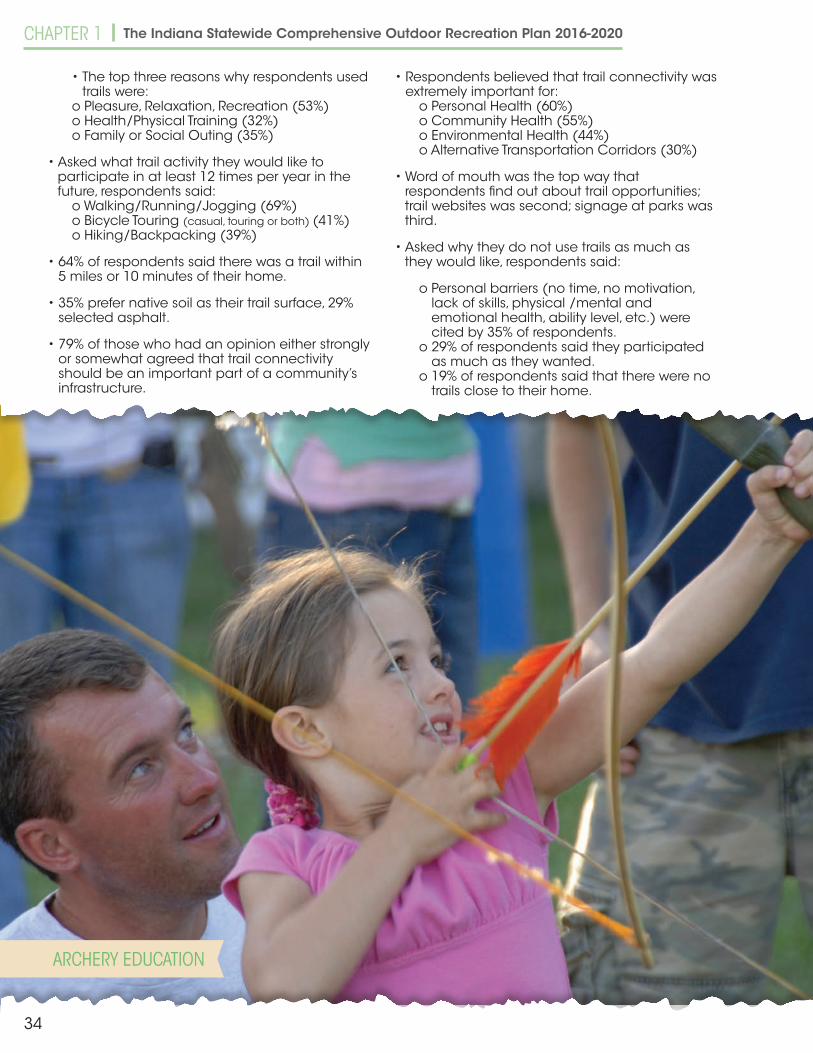
ARCHERY EDUCATION
35
The Indiana Statewide Comprehensive Outdoor Recreation Plan 2016-2020 CHAPTER 1
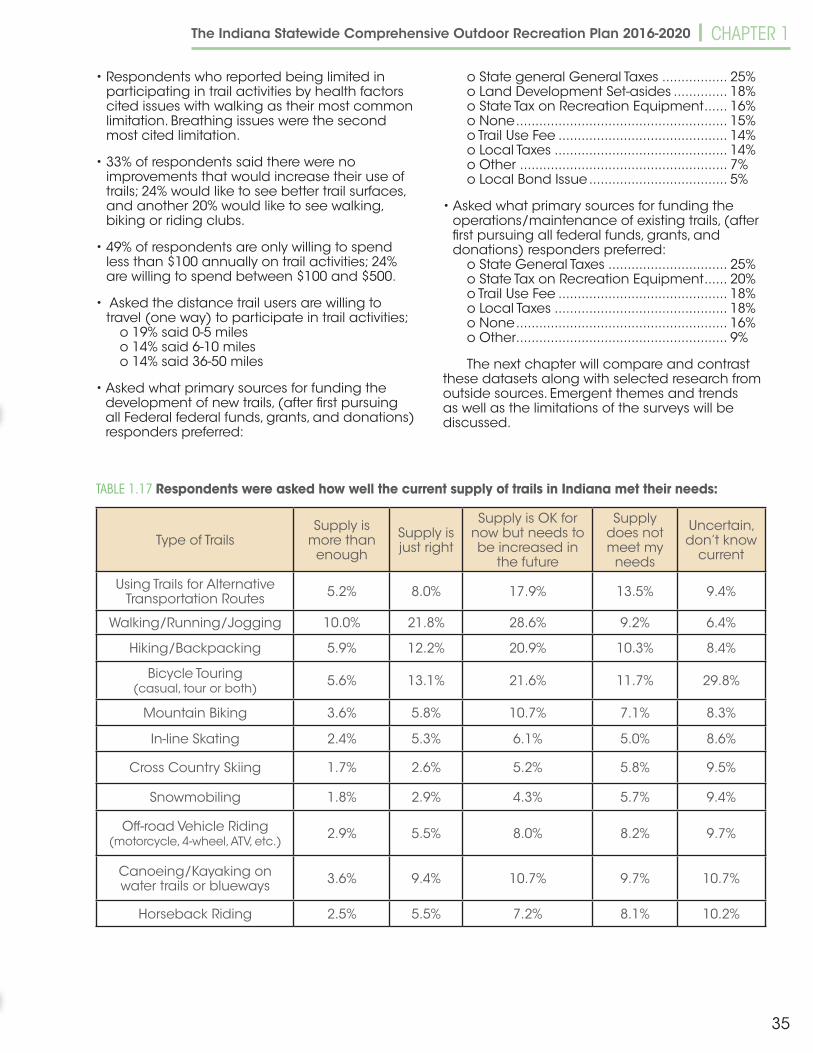
Type of TrailsSupply is
more than enough
Supply is just right
Supply is OK for now but needs to be increased in
the future
Supply does not meet my
needs
Uncertain, don’t know
current
Using Trails for Alternative Transportation Routes 5.2% 8.0% 17.9% 13.5% 9.4%
Walking/Running/Jogging 10.0% 21.8% 28.6% 9.2% 6.4%
Hiking/Backpacking 5.9% 12.2% 20.9% 10.3% 8.4%
Bicycle Touring (casual, tour or both) 5.6% 13.1% 21.6% 11.7% 29.8%
Mountain Biking 3.6% 5.8% 10.7% 7.1% 8.3%
In-line Skating 2.4% 5.3% 6.1% 5.0% 8.6%
Cross Country Skiing 1.7% 2.6% 5.2% 5.8% 9.5%
Snowmobiling 1.8% 2.9% 4.3% 5.7% 9.4%
Off-road Vehicle Riding (motorcycle, 4-wheel, ATV, etc.) 2.9% 5.5% 8.0% 8.2% 9.7%
Canoeing/Kayaking on water trails or blueways 3.6% 9.4% 10.7% 9.7% 10.7%
Horseback Riding 2.5% 5.5% 7.2% 8.1% 10.2%
TABLE 1.17 Respondents were asked how well the current supply of trails in Indiana met their needs:
• Respondents who reported being limited in participating in trail activities by health factors cited issues with walking as their most common limitation. Breathing issues were the second most cited limitation.
• 33% of respondents said there were no improvements that would increase their use of trails; 24% would like to see better trail surfaces, and another 20% would like to see walking, biking or riding clubs.
• 49% of respondents are only willing to spend less than $100 annually on trail activities; 24% are willing to spend between $100 and $500.
• Asked the distance trail users are willing to travel (one way) to participate in trail activities;
o 19% said 0-5 mileso 14% said 6-10 miles o 14% said 36-50 miles
• Asked what primary sources for funding the development of new trails, (after first pursuing all Federal federal funds, grants, and donations) responders preferred:
o State general General Taxes ................. 25%o Land Development Set-asides .............. 18%o State Tax on Recreation Equipment ...... 16%o None ....................................................... 15%o Trail Use Fee ............................................ 14%o Local Taxes ............................................. 14%o Other ...................................................... 7%o Local Bond Issue .................................... 5%
• Asked what primary sources for funding the operations/maintenance of existing trails, (after first pursuing all federal funds, grants, and donations) responders preferred:
o State General Taxes ............................... 25%o State Tax on Recreation Equipment ...... 20%o Trail Use Fee ............................................ 18%o Local Taxes ............................................. 18%o None ....................................................... 16%o Other ....................................................... 9%
The next chapter will compare and contrast these datasets along with selected research from outside sources. Emergent themes and trends as well as the limitations of the surveys will be discussed.
SURFING