Embed Size (px)
Citation preview

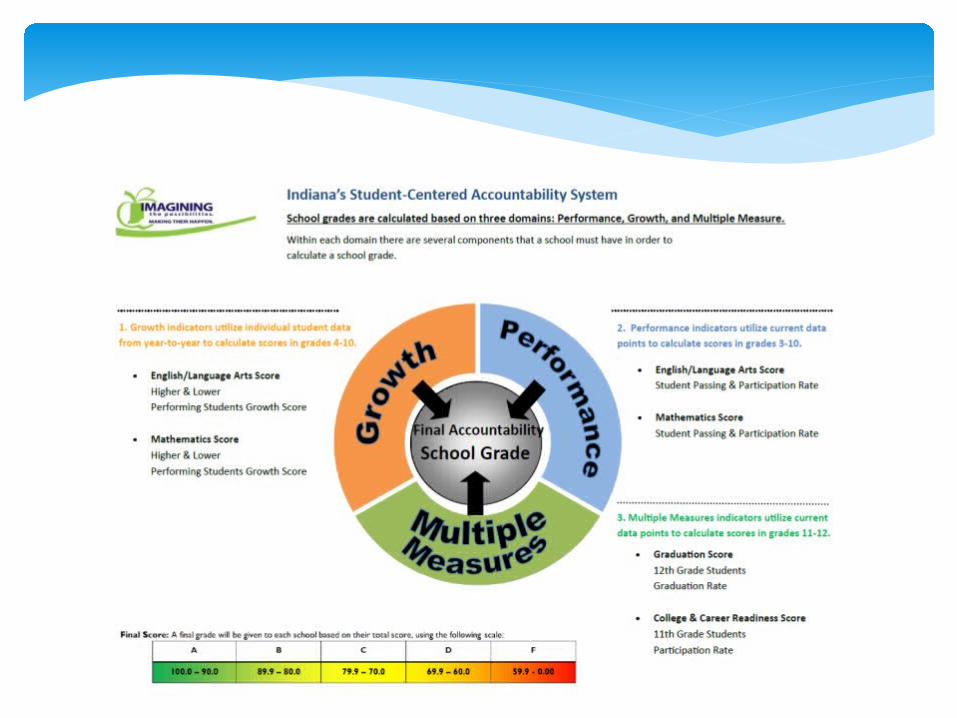
Indiana’sStudent-Centered Accountability System
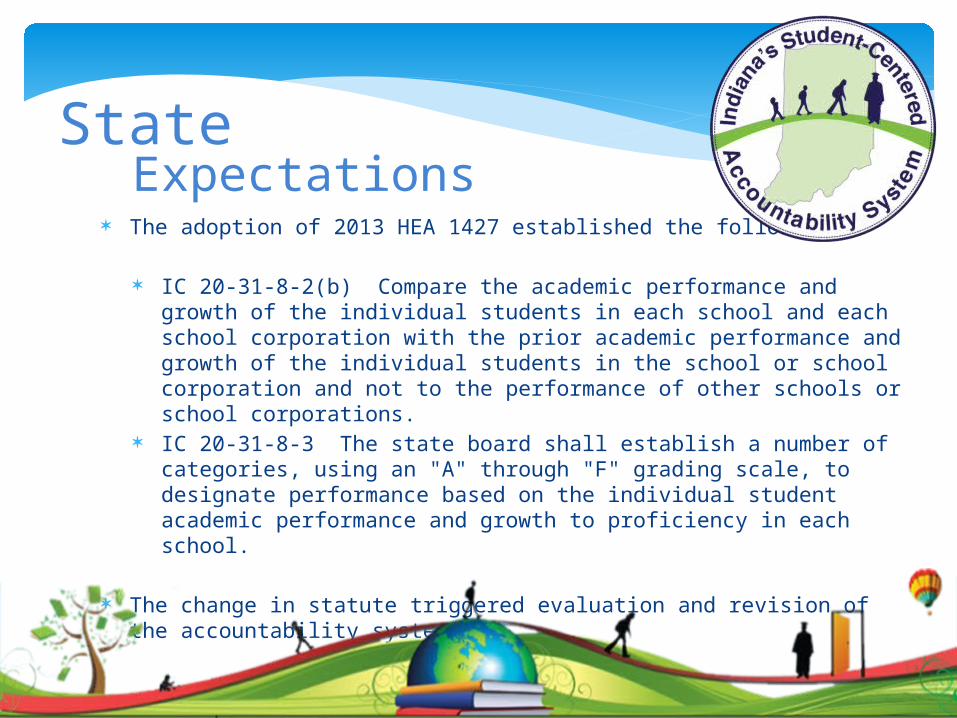
The adoption of 2013 HEA 1427 established the following:
IC 20-31-8-2(b) Compare the academic performance and growth of the individual students in each school and each school corporation with the prior academic performance and growth of the individual students in the school or school corporation and not to the performance of other schools or school corporations.
IC 20-31-8-3 The state board shall establish a number of categories, using an "A" through "F" grading scale, to designate performance based on the individual student academic performance and growth to proficiency in each school.
The change in statute triggered evaluation and revision of the accountability system.
StateExpectations
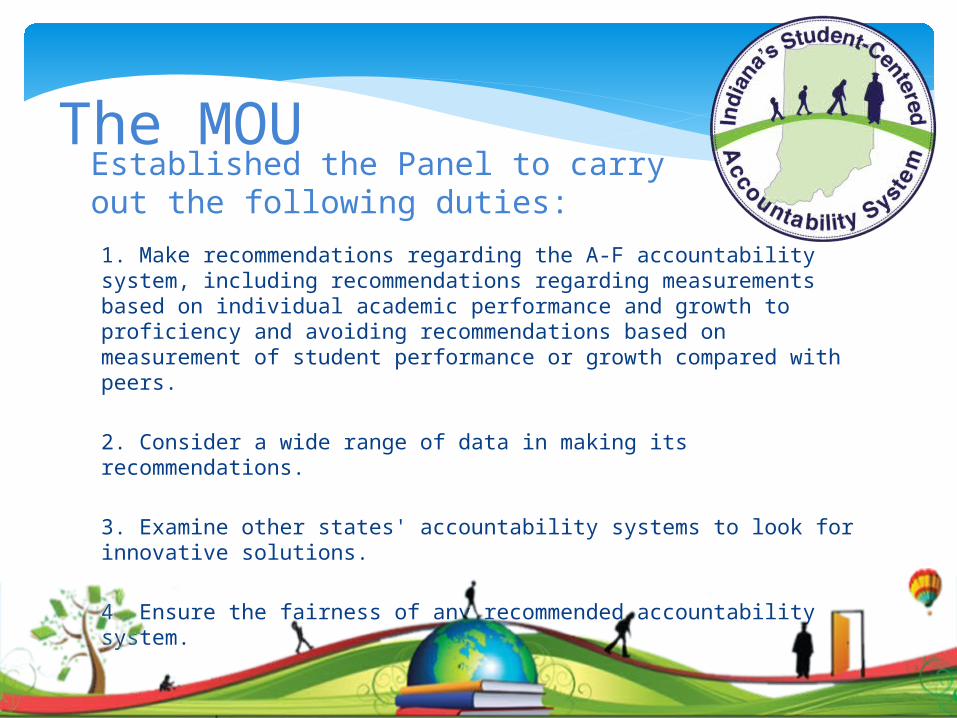
1. Make recommendations regarding the A-F accountability system, including recommendations regarding measurements based on individual academic performance and growth to proficiency and avoiding recommendations based on measurement of student performance or growth compared with peers.
2. Consider a wide range of data in making its recommendations. 3. Examine other states' accountability systems to look for innovative solutions. 4. Ensure the fairness of any recommended accountability system.
The MOUEstablished the Panel to carry out the following duties:
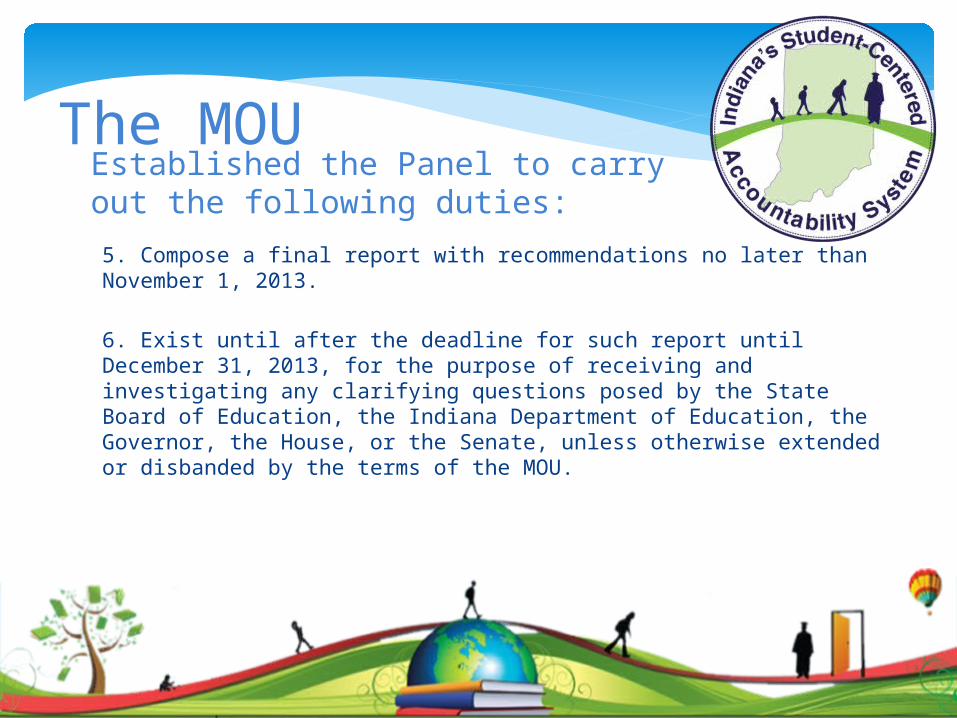
5. Compose a final report with recommendations no later than November 1, 2013. 6. Exist until after the deadline for such report until December 31, 2013, for the purpose of receiving and investigating any clarifying questions posed by the State Board of Education, the Indiana Department of Education, the Governor, the House, or the Senate, unless otherwise extended or disbanded by the terms of the MOU.
The MOUEstablished the Panel to carry out the following duties:

Journeyof the Accountability System
The panel met 13 times between September 19, 2013 and September 22, 2014 first defining then refining recommendations for an accountability system.
The Panel started the journey by reviewing common vocabulary, assessment data availability and non-assessment data availability.
The Panel reviewed the State and Federal expectations for accountability systems.
The Journeyof the accountability system

1. Growth for all students is highly valued and schools should be rewarded for individual student growth.
2. The model should be clear, understandable, fair, and transparent. Schools should be able to understand the statistical calculations and be able to use the data to inform instruction.
3. Multiple data points should inform both growth and performance.
4. The model should allow for flexibility for changes in assessments, allow for all configurations of schools, and align with federal Title I category requirements.
The PanelDefined values for an accountability system:
ResolutionsFour resolutions were considered by the Panel:
• Overall Framework• Performance• Growth• Multiple Measure
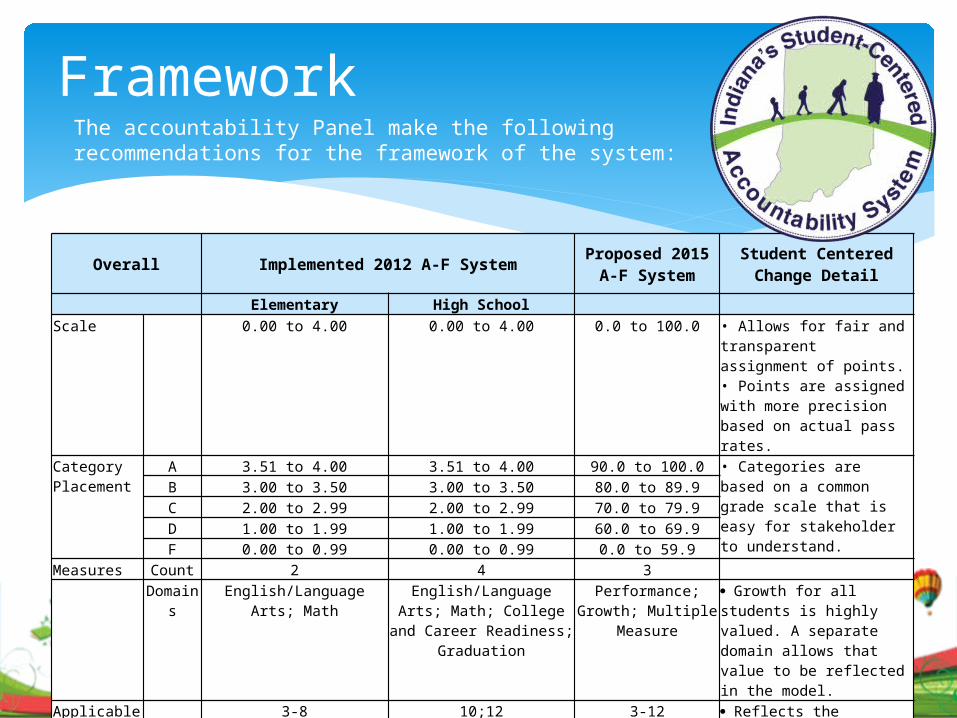
Framework The accountability Panel make the following recommendations for the framework of the system:
Overall Implemented 2012 A-F System Proposed 2015 A-F System
Student Centered Change Detail
Elementary High School Scale 0.00 to 4.00 0.00 to 4.00 0.0 to 100.0 • Allows for fair and transparent
assignment of points.• Points are assigned with more precision based on actual pass rates.
Category Placement
A 3.51 to 4.00 3.51 to 4.00 90.0 to 100.0 • Categories are based on a common grade scale that is easy for stakeholder to understand.
B 3.00 to 3.50 3.00 to 3.50 80.0 to 89.9C 2.00 to 2.99 2.00 to 2.99 70.0 to 79.9D 1.00 to 1.99 1.00 to 1.99 60.0 to 69.9F 0.00 to 0.99 0.00 to 0.99 0.0 to 59.9
Measures Count 2 4 3 Domains English/Language Arts; Math English/Language Arts; Math;
College and Career Readiness; Graduation
Performance; Growth; Multiple Measure
· Growth for all students is highly valued. A separate domain allows that value to be reflected in the model.
Applicable Grades
3-8 10;12 3-12 · Reflects the resolutions from Education Roundtable and SBOE concerning tested grades 03-10 and the inclusion of grade 11 assessment participation.
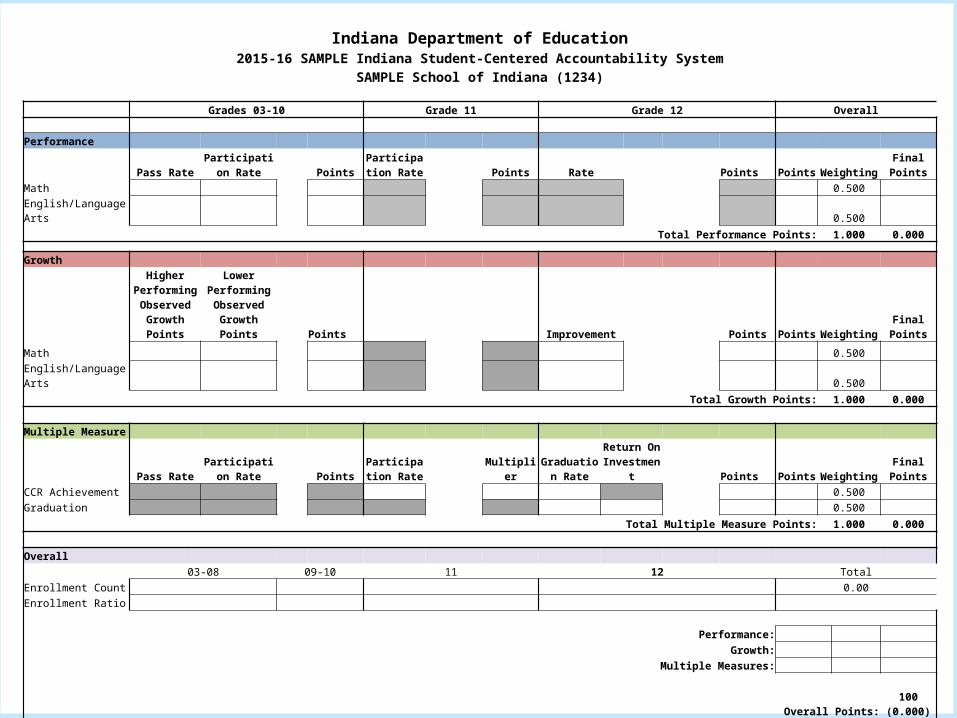
Indiana Department of Education2015-16 SAMPLE Indiana Student-Centered Accountability System
SAMPLE School of Indiana (1234)
Grades 03-10 Grade 11 Grade 12 Overall
Performance
Pass RateParticipation
Rate PointsParticipation
Rate Points Rate Points Points Weighting Final PointsMath 0.500 English/Language Arts 0.500
Total Performance Points: 1.000 0.000
Growth
Higher Performing Observed
Growth Points
Lower Performing Observed
Growth Points Points Improvement Points Points Weighting Final Points
Math 0.500 English/Language Arts 0.500
Total Growth Points: 1.000 0.000
Multiple Measure
Pass RateParticipation
Rate PointsParticipation
Rate MultiplierGraduation
RateReturn On Investment Points Points Weighting Final Points
CCR Achievement 0.500 Graduation 0.500
Total Multiple Measure Points: 1.000 0.000
Overall 03-08 09-10 11 12 Total
Enrollment Count 0.00Enrollment Ratio
Performance:
Growth: Multiple Measures:
Overall Points: 100 (0.000)
Overall Grade:
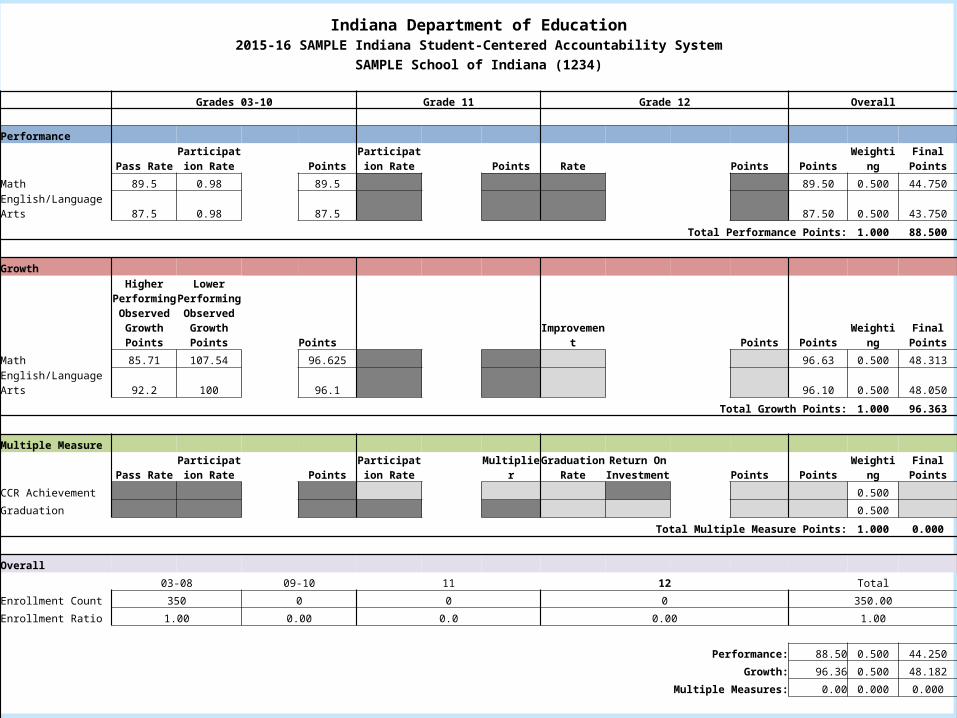
Indiana Department of Education2015-16 SAMPLE Indiana Student-Centered Accountability System
SAMPLE School of Indiana (1234)
Grades 03-10 Grade 11 Grade 12 Overall
Performance
Pass RateParticipation
Rate PointsParticipation
Rate Points Rate Points Points Weighting Final Points
Math 89.5 0.98 89.5 89.50 0.500 44.750
English/Language Arts 87.5 0.98 87.5 87.50 0.500 43.750
Total Performance Points: 1.000 88.500
Growth
Higher Performing Observed
Growth Points
Lower Performing Observed
Growth Points Points Improvement Points Points Weighting Final Points
Math 85.71 107.54 96.625 96.63 0.500 48.313
English/Language Arts 92.2 100 96.1 96.10 0.500 48.050
Total Growth Points: 1.000 96.363
Multiple Measure
Pass RateParticipation
Rate PointsParticipation
Rate MultiplierGraduation
RateReturn On Investment Points Points Weighting Final Points
CCR Achievement 0.500
Graduation 0.500
Total Multiple Measure Points: 1.000 0.000
Overall
03-08 09-10 11 12 Total
Enrollment Count 350 0 0 0 350.00
Enrollment Ratio 1.00 0.00 0.0 0.00 1.00
Performance: 88.50 0.500 44.250
Growth: 96.36 0.500 48.182
Multiple Measures: 0.00 0.000 0.000
Overall Points: 92.432
Overall Grade: A
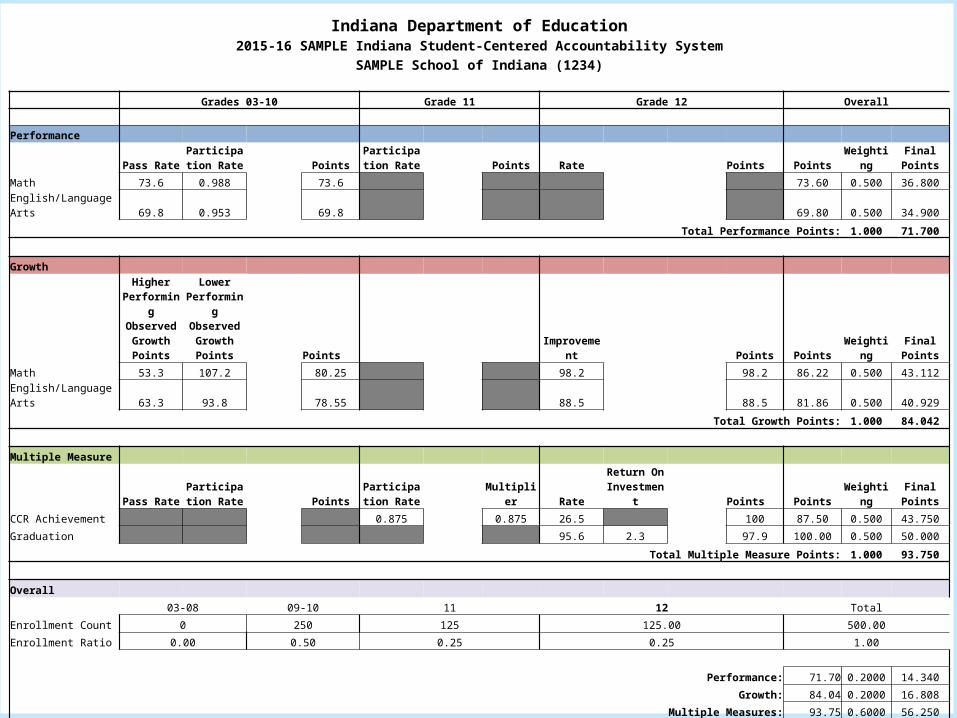
Indiana Department of Education2015-16 SAMPLE Indiana Student-Centered Accountability System
SAMPLE School of Indiana (1234)
Grades 03-10 Grade 11 Grade 12 Overall
Performance
Pass RateParticipation
Rate PointsParticipation
Rate Points Rate Points Points Weighting Final Points
Math 73.6 0.988 73.6 73.60 0.500 36.800
English/Language Arts 69.8 0.953 69.8 69.80 0.500 34.900
Total Performance Points: 1.000 71.700
Growth
Higher Performing Observed Growth Points
Lower Performing Observed Growth Points Points Improvement Points Points Weighting Final Points
Math 53.3 107.2 80.25 98.2 98.2 86.22 0.500 43.112
English/Language Arts 63.3 93.8 78.55 88.5 88.5 81.86 0.500 40.929
Total Growth Points: 1.000 84.042
Multiple Measure
Pass RateParticipation
Rate PointsParticipation
Rate Multiplier RateReturn On Investment Points Points Weighting Final Points
CCR Achievement 0.875 0.875 26.5 100 87.50 0.500 43.750
Graduation 95.6 2.3 97.9 100.00 0.500 50.000
Total Multiple Measure Points: 1.000 93.750
Overall
03-08 09-10 11 12 Total
Enrollment Count 0 250 125 125.00 500.00
Enrollment Ratio 0.00 0.50 0.25 0.25 1.00
Performance: 71.70 0.2000 14.340
Growth: 84.04 0.2000 16.808
Multiple Measures: 93.75 0.6000 56.250
Overall Points: 87.398
Overall Grade: B
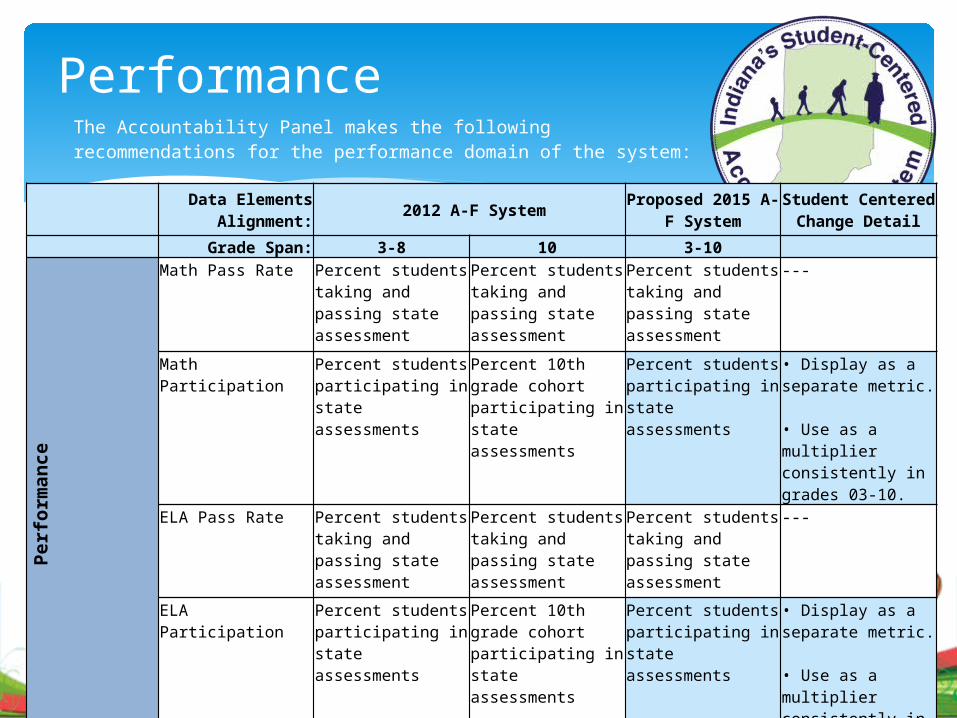
PerformanceThe Accountability Panel makes the following recommendations for the performance domain of the system:
Data Elements Alignment: 2012 A-F System Proposed 2015 A-F
SystemStudent Centered
Change Detail
Grade Span: 3-8 10 3-10
Performance
Math Pass Rate Percent students taking and passing state assessment
Percent students taking and passing state assessment
Percent students taking and passing state assessment
---
Math Participation Percent students participating in state assessments
Percent 10th grade cohort participating in state assessments
Percent students participating in state assessments
• Display as a separate metric. • Use as a multiplier consistently in grades 03-10.
ELA Pass Rate Percent students taking and passing state assessment
Percent students taking and passing state assessment
Percent students taking and passing state assessment
---
ELA Participation Percent students participating in state assessments
Percent 10th grade cohort participating in state assessments
Percent students participating in state assessments
• Display as a separate metric. • Use as a multiplier consistently in grades 03-10.
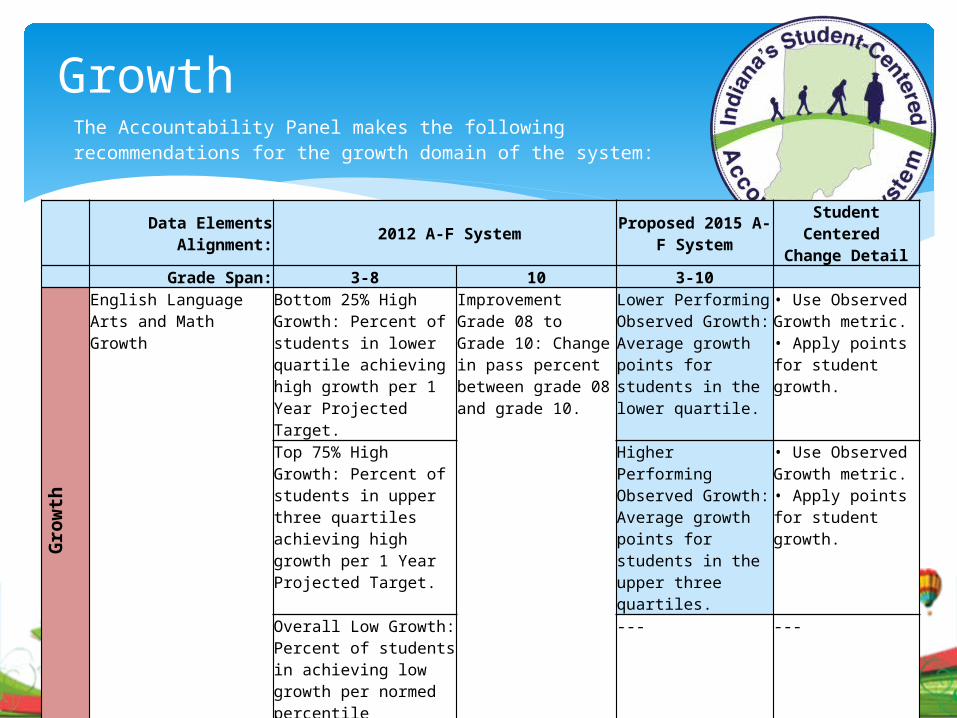
GrowthThe Accountability Panel makes the following recommendations for the growth domain of the system:
Data Elements Alignment: 2012 A-F System Proposed 2015 A-F System
Student Centered Change Detail
Grade Span: 3-8 10 3-10
Growth
English Language Arts and Math Growth
Bottom 25% High Growth: Percent of students in lower quartile achieving high growth per 1 Year Projected Target.
Improvement Grade 08 to Grade 10: Change in pass percent between grade 08 and grade 10.
Lower Performing Observed Growth: Average growth points for students in the lower quartile.
• Use Observed Growth metric. • Apply points for student growth.
Top 75% High Growth: Percent of students in upper three quartiles achieving high growth per 1 Year Projected Target.
Higher Performing Observed Growth: Average growth points for students in the upper three quartiles.
• Use Observed Growth metric. • Apply points for student growth.
Overall Low Growth: Percent of students in achieving low growth per normed percentile calculations.
--- ---
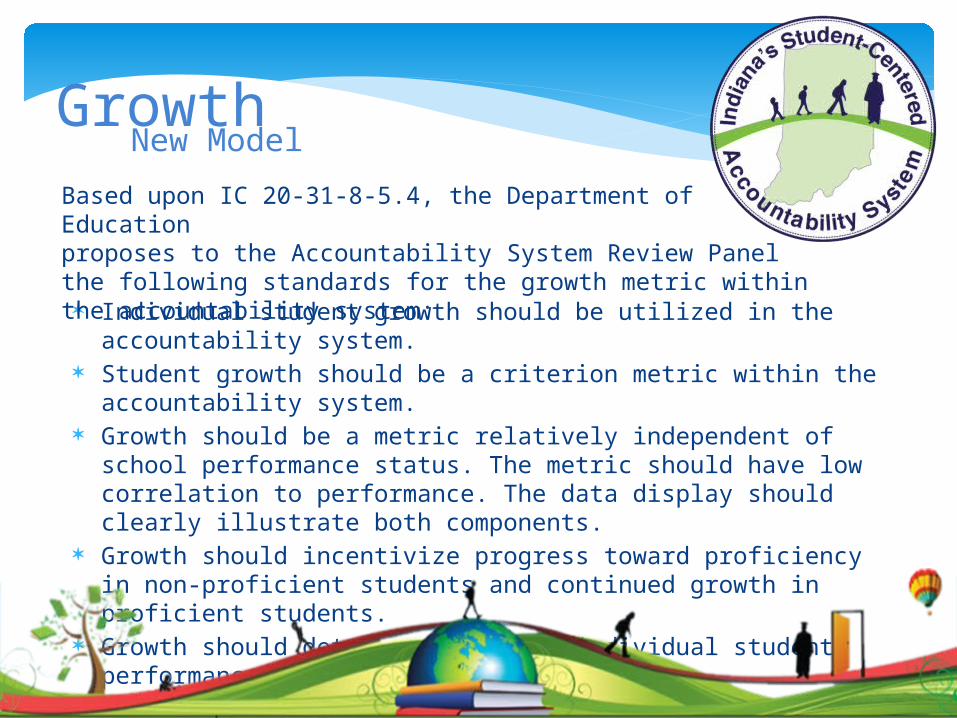
Individual student growth should be utilized in the accountability system.
Student growth should be a criterion metric within the accountability system.
Growth should be a metric relatively independent of school performance status. The metric should have low correlation to performance. The data display should clearly illustrate both components.
Growth should incentivize progress toward proficiency in non-proficient students and continued growth in proficient students.
Growth should deter a decline in individual student performance levels.
GrowthNew Model
Based upon IC 20-31-8-5.4, the Department of Education proposes to the Accountability System Review Panel the following standards for the growth metric within the accountability system:
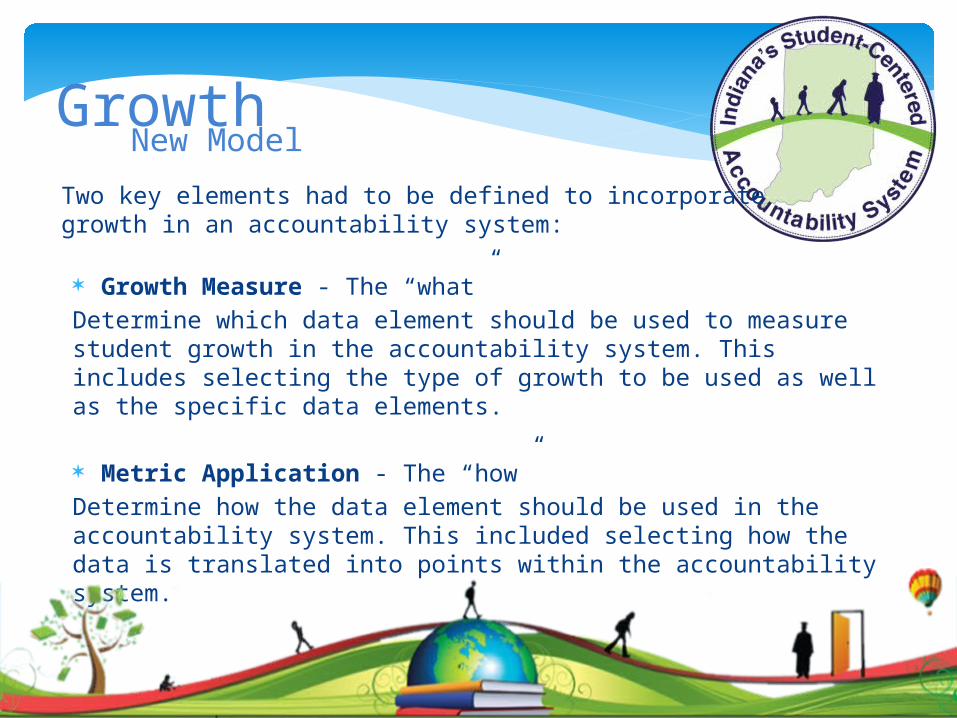
Growth Measure - The “what” Determine which data element should be used to measure student growth in the accountability system. This includes selecting the type of growth to be used as well as the specific data elements.
Metric Application - The “how”Determine how the data element should be used in the accountability system. This included selecting how the data is translated into points within the accountability system.
GrowthNew Model
Two key elements had to be defined to incorporate growth in an accountability system:
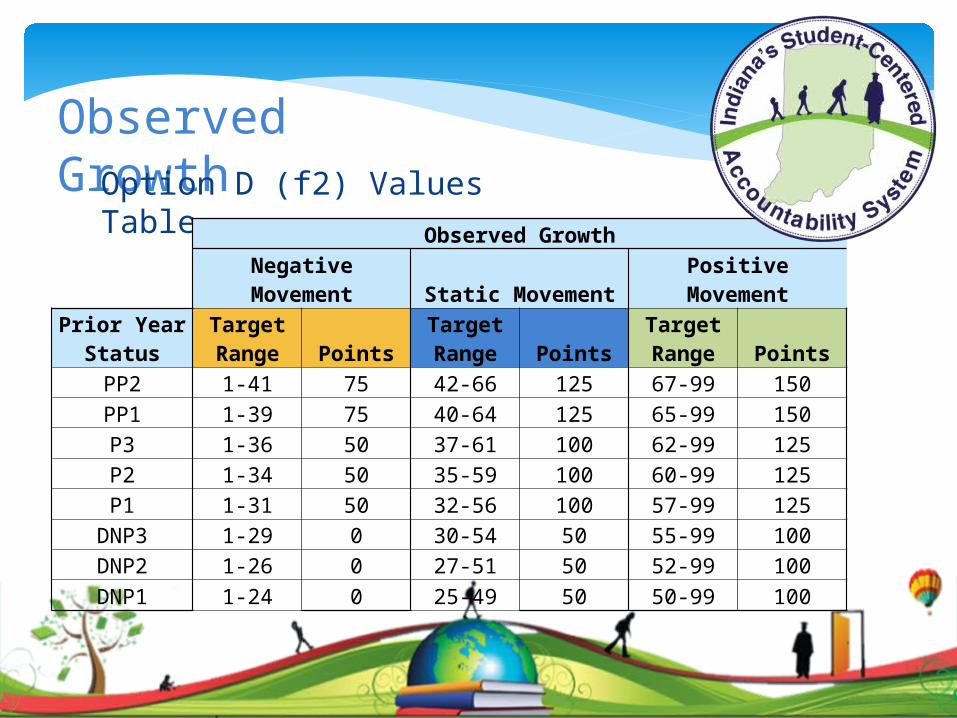
Observed GrowthOption D (f2) Values
Table Observed GrowthNegative Movement Static Movement Positive Movement
Prior Year Status
Target Range Points
Target Range Points
Target Range Points
PP2 1-41 75 42-66 125 67-99 150PP1 1-39 75 40-64 125 65-99 150P3 1-36 50 37-61 100 62-99 125P2 1-34 50 35-59 100 60-99 125P1 1-31 50 32-56 100 57-99 125
DNP3 1-29 0 30-54 50 55-99 100DNP2 1-26 0 27-51 50 52-99 100DNP1 1-24 0 25-49 50 50-99 100
GrowthGrade 12
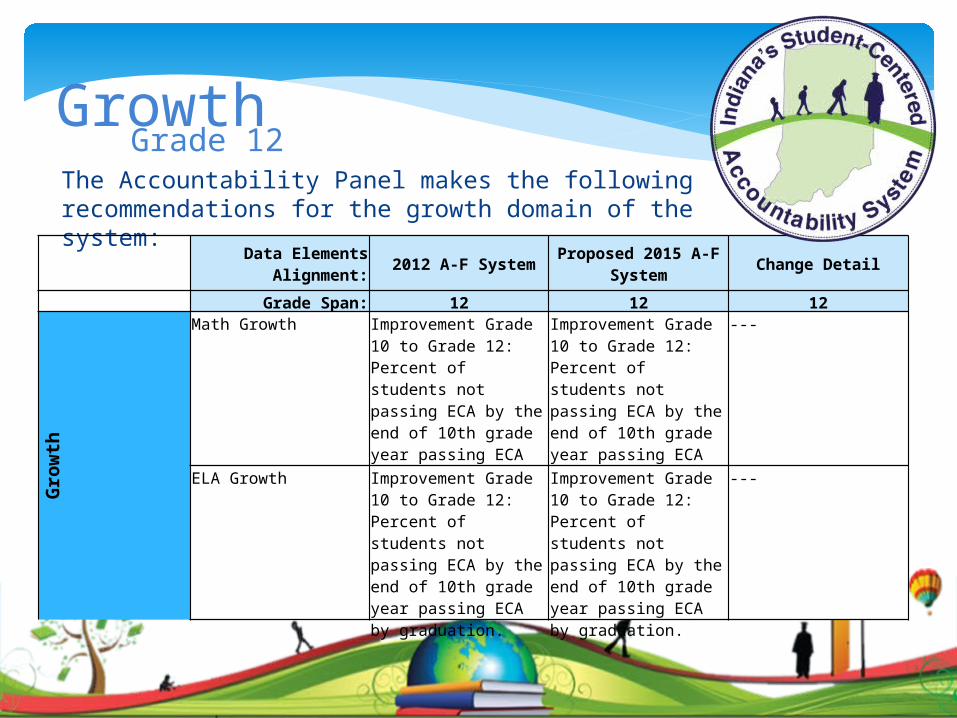
The Accountability Panel makes the following recommendations for the growth domain of the system:
Data Elements Alignment: 2012 A-F System Proposed 2015 A-F System Change Detail
Grade Span: 12 12 12
Growth
Math Growth Improvement Grade 10 to Grade 12: Percent of students not passing ECA by the end of 10th grade year passing ECA by graduation.
Improvement Grade 10 to Grade 12: Percent of students not passing ECA by the end of 10th grade year passing ECA by graduation.
---
ELA Growth Improvement Grade 10 to Grade 12: Percent of students not passing ECA by the end of 10th grade year passing ECA by graduation.
Improvement Grade 10 to Grade 12: Percent of students not passing ECA by the end of 10th grade year passing ECA by graduation.
---
Multiple Measure
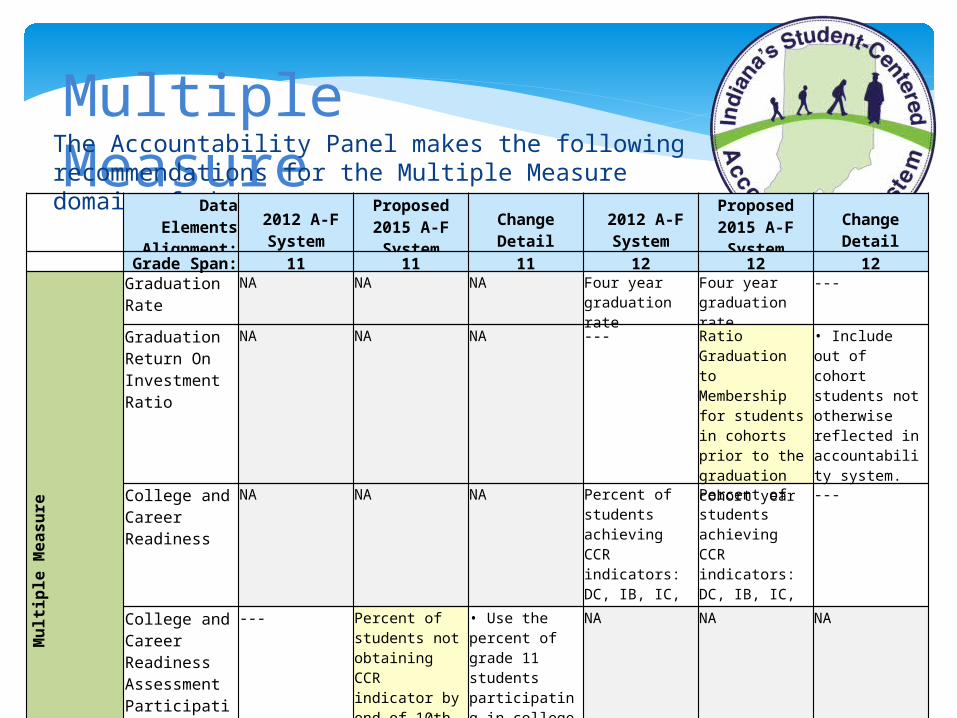
The Accountability Panel makes the following recommendations for the Multiple Measure domain of the system:Data Elements
Alignment: 2012 A-F SystemProposed 2015
A-F System Change Detail 2012 A-F SystemProposed 2015
A-F System Change Detail Grade Span: 11 11 11 12 12 12
Multiple Measure
Graduation Rate NA NA NA Four year graduation rate
Four year graduation rate
---
Graduation Return On Investment Ratio
NA NA NA --- Ratio Graduation to Membership for students in cohorts prior to the graduation cohort year
• Include out of cohort students not otherwise reflected in accountability system.
College and Career Readiness
NA NA NA Percent of students achieving CCR indicators: DC, IB, IC, AP
Percent of students achieving CCR indicators: DC, IB, IC, AP
---
College and Career Readiness Assessment Participation
--- Percent of students not obtaining CCR indicator by end of 10th grade year achieveing indicator by graduation
• Use the percent of grade 11 students participating in college and career ready assessments.• Use a multiplier for college and career readiness achievement.
NA NA NA
Next Steps
• Rule making timeline• Public hearing and comment• Data pilot
• Transition plan for baseline Observed Growth
• Communication plan

Contact Info
• For questions, please email the IDOE School Accountability at [email protected] or Debbie Dailey at [email protected]