Embed Size (px)
Citation preview
ISID
INDIA’S FDI INFLOWSTrends & Concepts
February 2011
Working PaperNo: 2011/01
K.S. Chalapati Rao & Biswajit Dhar
(1,1) -1- WP2011cvr.indd 24/02/2011 13:09:30(1,1) -1- WP2011cvr.indd 24/02/2011 13:09:30
K.S. Chalapati Rao & Biswajit Dhar
Institute for Studies in Industrial Development 4, Institutional Area, Vasant Kunj, New Delhi - 110 070 Phone: +91 11 2676 1600; Fax: +91 11 2676 1631
E-mail: <[email protected]> Website: <http://isid.org.in>
February 2011
ISID
WORKING PAPER
2011/01
INDIA’S FDI INFLOWS Trends and Concepts


CONTENTS
Abstract 1
1. Introduction 2
2. Conceptual and Definitional Issues 6
2.1 10% Threshold and Significant Influence vs. Control 11
2.2 Need for Case‐by‐Case Approach 15
2.3 Round‐Tripping 18
2.4 Indian Practice 19
3. Analysis of Inflows 22
3.1 The Aggregates 22
3.2 Analysis of Individual Inflows 30
3.3 Other Aspects 42
3.4 Private Equity and Venture Capital 47
4. Summary and Concluding Observations 52
4.1 Measurement and Classification (Direct or Portfolio?) 56
4.2 A Case for Selective Approach towards FDI 60
4.3 Need for a Relevant Data System 66
List of Tables
Table 1 Cross‐border M&As by Private Equity firms, 2000–2010 9
Table 2 Daimler Chrysler Investment in Tata Motors 15
Table 3 Foreign ‘Promoter’ of Ballarpur Industries Ltd 16
Table 4 Reported FDI Flows into India and their Main Components
(As per International Best Practices) 23
Table 5 Entry Route‐wise Distribution of FDI Equity Inflows 25
Table 6 Major Sector‐wise Distribution of FDI Equity Inflows
during 2005‐2008 27
Table 7 Major Sector‐wise Distribution of FDI Inflows in 2009 28
Table 8 India’s FDI Equity Inflows: Top 10 Home Countries 29
Table 9 Sector and Entry Mode‐wise Distribution of Top 2,748 Reported FDI
Inflows during September 2004 and December 2009 31
Table 10 Illustrative Cases of Business Unit Transfers to FDI Companies 32
Table 11 London Stock Exchange Listed Companies whose Control Appears
to be with Indians and which Invested in India 35
Table 12 Sector and Type of Foreign Investor‐wise Distribution
of Top 2,748 Inflows 36
Table 13 Sectoral Distribution of Various Types of Top 2,748 Inflows 38
Table 14 Foreign Investor‐wise and Entry Route‐wise Distribution
of the 2,748 FDI Inflows 39
Table 15 Type of Foreign Investor‐wise and Source Country Type‐wise
Distribution of the 2,748 FDI Equity Inflows 40
Table 16 Sector‐wise and Source Country Type‐wise Distribution of FDI Inflows 41
Table 17 Reported FDI inflow into Some Listed Companies 43
Table 18 Illustrative List of Reported Inflows which do not Qualify as FDI 44
Table 19 Reported FDI Inflows on account of Home Sweet Home
Developers Ltd. 44
Table 20 Companies which could be Classified as FDI Companies
by the 10% Criterion 46
Table 21 Companies which could be Classified as FDI Companies
by the 10% Criterion and where the Companies are Constituents
of Some Indian Promoter Groups 47
Table 22 Illustrative Cases of Overlapping of Domestic and Foreign Venture
Capital Investors Registered with SEBI 49
Table 23 Growing Importance of Round‐tripping Inflows 50
Table 24 Year‐wise FDI Equity Inflows According to the
Type of Investor 51
List of Charts
Chart 1 Average Reported FDI Equity Inflows during Different Periods 24
Chart 2 Share of Inflows through the Acquisition Route in FDI Equity Inflows 25
Chart 3 Sectoral Composition of Reported FDI Equity Inflows during
2005‐2008 28
Chart 4 Type of Investor‐wise Distribution of Top 2,748 Inflows 37
Chart 5 Sectoral Composition of Private Equity and
Round‐Tripped Investments 38
Chart 6 Share of Inflows subjected to Specific Government Approvals
for Different Types of Inflows 39
Chart 7 Share of Tax Havens in the Inflows by Different Types of Investors 40
Chart 8 Share of Tax Havens in the FDI Equity Inflows of Different Sectors 41
Chart 9 Share of Different Categories of Foreign Investors
in Inflows during 2009 51
Chart 10 Differing Behaviour of FDI, Portfolio and Round‐tripping
Investments in 2009 52
List of Boxes and Diagrams
Diagram Composition of the Reported Top 2,748 FDI Inflows 55
Box FDI Comprises a Package of Resources … 63
List of Annexure
Annexure A Illustrative Cases of FDI Inflows which Involve Acquisition
of Companies in India 69
Annexure B Illustrative Cases of Large FDI Inflows where the
Indian Investee Company/Promoters Appears to have
Direct Relationship with the Foreign Investor 70
Annexure C1 Corporate structure of Ishaan Real Estate plc., Isle of Man 72
Annexure C2 Corporate Structure of Unitech Corporate Parks plc., Isle of Man 73
Annexure C3 Vedanta Group’s Organisational Chart as on February 28, 2010 74
Annexure D Educational Qualifications and Past Experience of Indians
Working with General Atlantic, a Leading US‐Based PE Firm 75
Annexure E Tables Relating to PE/VC Investments in India 78

INDIAʹS FDI INFLOWS
Trends and Concepts
K.S. Chalapati Rao and Biswajit Dhar*
[Abstract: India’s inward investment regime went through a series of changes since economic reforms
were ushered in two decades back. The expectation of the policy makers was that an “investor friendly”
regime will help India establish itself as a preferred destination of foreign investors. These expectations
remained largely unfulfilled despite the consistent attempts by the policy makers to increase the
attractiveness of India by further changes in policies that included opening up of individual sectors,
raising the hitherto existing caps on foreign holding and improving investment procedures. But after
2005‐06, official statistics started reporting steep increases in FDI inflows. This paper is an attempt to
explain this divergence from the earlier trend.
At the outset, the paper dwells on the ambiguities surrounding the definition and the non‐adherence of
international norms in measuring the FDI inflows. The study finds that portfolio investors and round‐
tripping investments have been important contributors to India’s reported FDI inflows thus blurring
the distinction between direct and portfolio investors on one hand and foreign and domestic investors
on the other. These investors were also the ones which have exploited the tax haven route most. These
observations acquire added significance in the context of the substantial fall in the inflows seen during
2010‐11.
In most countries, particularly those that have faced chronic current account deficits, obtaining stable
long term FDI flows was preferred over volatile portfolio investments. This distinction between
long term FDI and the volatile portfolio investments has now been removed in the accepted official
definition of FDI. From an analytical point of view, the blurring of the lines between long term FDI and
the volatile portfolio investments has meant that the essential characteristics of FDI, especially the
positive spill‐overs that the long term FDI was seen to result in, are being overlooked. FDI that is
dominated by financial investments, though a little more stable than the portfolio investments through
the stock market, cannot deliver the perceived advantages of FDI. The net result is that while much of
the FDI cannot enhance India’s ability to earn foreign exchange through exports of goods and services
and thus cover the current account gap on its own strength, large inflows of portfolio capital causes
currency appreciation and erodes the competitiveness of domestic players. The falling share of
manufacturing and even of IT and ITES means that there is less likelihood of FDI directly contributing
* K.S. Chalapati Rao ([email protected]) is with the Institute for Studies in Industrial Development (ISID), New
Delhi and Biswajit Dhar ([email protected]) with the Research and Information System for Developing
Countries (RIS), New Delhi.
Disclaimer: The views expressed here are those of the individual authors and do not necessarily reflect the
official policy or position of their respective institutions. References to companies, organisations and
individuals have been made only to illustrate or explain a phenomenon for discussion purposes and these
are based on publicly available information.
2
to export earnings. India seems to have been caught in a trap wherein large inflows are regularly
required in order to finance the current account deficit. To keep FDI flowing in, the investment regime
has to be liberalised further and M&As are allowed freely.
Even at the global level, the developmental impact of FDI is being given lesser importance
notwithstanding the repeated assertions to the contrary in some fora. International data on FDI and its
impact has never been unambiguous. If FDI has to deliver, it has to be defined precisely and chosen with
care instead of treating it as generic capital flow. India should strengthen its information base that will
allow a proper assessment of the impact that FDI can make on its development aspirations.]
1. Introduction
The perception of the role foreign direct investment (FDI) plays in the development
process has evolved over time. Starting from the mid‐sixties when the role of FDI in
economic development was recognised and obstacles to the flow of FDI from
industrialized to developing countries were sought to be removed there was a sharp
change in the early 1970s when TNCs, the chief vehicles for FDI, were looked at
suspiciously notwithstanding the recognised benefits. The dominant approach was to
“monitor, restrict and regulate the activities of TNCs”. Following the commercial bank
debt crisis and the aid fatigue, in the 1980s, once again, countries became more interested
in non‐debt creating sources of external private finance.1 Since then, more attention is
being paid to the possible role of FDI in economic development. An extensive amount of
literature on FDI has emerged regarding its role in not just augmenting domestic savings
for investment but more as provider of technologies and managerial skills essential for a
developing country to achieve rapid economic development. While many questions
relating to the impact of TNCs on development have remained controversial, the focus
now is more on how to maximize the positive effects of FDI.2
A concomitant form of capital flows to FDI is portfolio investment (FPI).
Notwithstanding its attractiveness as non‐debt creating nature, a facet seen to be positive
because of the debt crises of the ‘eighties, and its contribution to financial sector
development, FPI, which is volatile in nature, is associated with problems specific to it.
Steep appreciation in the currencies of recipient countries and the consequent adverse
impact on the price competitiveness of domestic players and asset price bubbles have
been associated with large influx of foreign portfolio capital flows. The loss of
competitiveness diminishes the host country’s ability to improve its current account on
1 Yingqi Wei and V. N. Balasubramanyam, Foreign Direct Investment: Six Country Case Studies, Edward Elgar
Publishing, 2004. 2 For a description of this and the role played by the UN, especially UNCTAD, in this process see: Torbjorn
Fredriksson, “Forty years of UNCTAD research on FDI”, Transnational Corporations, Volume 12, Number 3,
December 2003, pp. 1‐39. See also Marica Carcokovic and Ross Levine, “Does Foreign Direct Investment
Accelerate Economic Growth?” in Theodore H. Moran, Edward M. Graham and Magnus Blomstrom (eds.),
Does Foreign Direct Investment Promote Development?, Centre for Global Development, Washington, 2005, for
a review of the literature on the impact of FDI on economic growth.
3
the strength of export of goods and services thus contributing to a situation of perpetual
dependence. Managing the external sector has thus become a major issue by itself and
attracted suggestions for imposing capital controls to moderate the flows. The recent
global financial crisis has revived the need to place some restrictions on capital flows.
Even the IMF, a staunch votary of capital account convertibility, has acknowledged that
capital controls are a legitimate part of the toolkit to manage capital inflows in certain
circumstances.3 Thus, FDI is preferred over FPI because the former is seen to be stable
and, being a bundle of assets in addition to capital, it could enable the host economy to
gain competitiveness.
As global capital flows expanded manifold and into different sectors, India’s approach
towards FDI too changed ever since independence; the initial approach overwhelmingly
reflecting hostility following the experience with the colonial rule. From being assigned
the role of supplementing and strengthening the domestic private sector, FDI was given
greater freedom and a role of its own to contribute to India’s development process along
with gradual liberalization of India’s economic policies which started in the 1980s.4 The
New Industrial Policy, 1991, which accelerated the process of liberalisation, stated:
While Government will continue to follow the policy of self‐reliance, there would be
greater emphasis placed on building up our ability to pay for imports through our own
foreign exchange earnings. …
Foreign investment and technology collaboration will be welcomed to obtain higher
technology, to increase exports and to expand the production base….
Foreign investment would bring attendant advantages of technology transfer,
marketing expertise, introduction of modern managerial techniques and new
possibilities for promotion of exports. … The government will therefore welcome
foreign investment which is in the interest of the countryʹs industrial
development.5 (Emphasis added)
More recently, the Economic Survey 2008‐09 reiterated that:
FDI is considered to be the most attractive type of capital flow for emerging
economies as it is expected to bring latest technology and enhance production capabilities
of the economy.6 (Emphasis added)
And the National Manufacturing Competitiveness Council specified that:
3 Jonathan D. Ostry, et. al., “Capital Inflows: The Role of Controls”, IMF Staff Position Note, February 19,
2010, SPN/ 10/04. Last year, Brazil, Thailand and South Korea strengthened capital controls. See: Biswajit
Dhar, “Uses and abuses of capital controls”, Mint, October 26, 2010. 4 For a review, see Biswajit Dhar, “State Regulation of Foreign Private Capital in India”, Corporate Studies
Group Working Paper, 1988. 5 See: “Statement on Industrial Policy July 24, 1991” in Ministry of Commerce and Industry, Handbook of
Industrial Policy and Statistics, 2001. 6 Ministry of Finance, Economic Survey 2008‐09, para 133.
4
Foreign investments mean both foreign portfolio investments and foreign direct
investments (FDI). FDI brings better technology and management, access to
marketing networks and offers competition, the latter helping Indian companies
improve, quite apart from being good for consumers. This efficiency contribution of
FDI is much more important.7
Starting from such basic premise, from a regime of selective approach to foreign
investment with emphasis on transfer of high technology and promotion of exports, since
the beginning of the ‘nineties India has gradually expanded the scope for FDI by
progressively increasing the number of eligible sectors as also the limits for FDI in an
enterprise. The steps taken included removing the general ceiling of 40% on foreign
equity under the Foreign Exchange Regulation Act, 1973 (FERA), lifting of restrictions on
the use of foreign brand names in the domestic market, removing restrictions on entry
and expansion of foreign direct investment into consumer goods, abandoning the phased
manufacturing programme (PMP), diluting the dividend balancing condition and export
obligations, liberalising the terms for import of technology and royalty payments and
permitting foreign investment up to 24% of equity of small scale units and reducing the
corporate tax rates. FDI limit for small scale units was, however, dispensed with in 2009.
The number of items reserved for the small scale sector has since been drastically pruned
to just 20 thus virtually freeing the sector both from ownership criterion and product
reservation.8 The parallel process of virtual withdrawal of the Industrial Licensing
System and the retreating from the primacy given to public sector also enhanced the
scope for FDI participation in India.
Alongside opening up of the FDI regime, steps were taken to allow foreign portfolio
investments into the Indian stock market through the mechanism of foreign institutional
investors. The objective was not only to facilitate non‐debt creating foreign capital
inflows but also to develop the stock market in India, lower the cost of capital for Indian
enterprises and indirectly improve corporate governance structures. On their part, large
Indian companies have been allowed to raise capital directly from international capital
markets through commercial borrowings and depository receipts having underlying
Indian equity. Thus the country adopted a two‐pronged strategy: one to attract FDI
which is associated with multiple attendant benefits of technology, access to export
markets, skills, management techniques, etc. and two to encourage portfolio capital flows
which ease the financing constraints of Indian enterprises. FDI is also preferred as it is
seen to be more stable than short term portfolio capital flows which have the tendency to
be volatile and hence can cause financial instability—basic expectations from both types
of capital have been different from each other.
7 India, National Manufacturing Competitiveness Council, The National Strategy for Manufacturing, 2006, pp.
23‐24. 8 See: http://www.dcmsme.gov.in/publications/reserveditems/reserved2010.pdf
5
As a result of the many steps that have been taken, India’s FDI policy is now quite open
and comparable to many countries.9 Caps on FDI shares are now applicable to only a few
sectors, mainly in the services sector.10 Barring attempts at protecting Indian
entrepreneurs with whom the foreign investors had already been associated with either
as joint venture partners or technology licensors, it has been a case of progressive
liberalisation of the FDI policy regime. Simultaneously, the government has continuously
strived to remove the hurdles in the path of foreign investors both at the stage of entry
and later in the process of establishing the venture, in order to maximize FDI inflows.
Much of the foreign investment can now take advantage of the automatic approval route
without seeking prior permission of the Central Government. While India did attract
considerable amount of foreign portfolio investments, its record in FDI inflows for a long
time was seen to be below its potential particularly when seen in comparison with the
massive inflows reported by China. The progressive liberalization of the foreign
investment policy as well as the steps to improve the investment climate could thus be
seen as attempts to overcome this perceived failure to match initial expectations and also
in comparison with China. More recently, however, additional scrutiny for security
reasons11 and for minimizing loss of revenue due to abuse of the double taxation
avoidance agreements and round‐tripping have been additional but restrictive features
that are being referred to in respect of India’s FDI policy regime.
In the overall, inflows of FDI have increased substantially compared to the earlier regime
in which the scope for FDI was quite restricted. As a result, the stock of FDI in India
jumped from $1.66 bn at the end of 1990, to $17.5 bn by the end of 2000 and further to a
little above $164 bn by the end of 2009.12 In the process, the FDI stock more than doubled
between 2000 and 2004 and more than quadrupled between 2004 and 2009. The addition
during 2004 and 2008 is quite spectacular as the stock increased by nearly $125 bn. Since
2000‐01 an important change was introduced in the way FDI statistics are compiled
which has made strict comparison of inflows overtime inapt. Though this did contribute
9 See: Planning Commission, Report of the Steering Group on Foreign Direct Investment, August 2002, p. 22 and
“Foreign Direct Investment in India: How Can it be Increased?” in IMF, India: Selected Issues, January 7, 2005,
available at http://www.imf.org/external/pubs/ft/scr/2005/cr0587.pdf. 10 These include air transport services, ground handling services, asset reconstruction companies, private
sector banking, broadcasting, commodity exchanges, credit information companies, insurance, print media,
telecommunications and satellites and defence production. Besides, FDI is not permitted in a few areas like
agriculture (except floriculture, horticulture, development of seeds, animal husbandry, pisciculture,
aquaculture and cultivation of vegetables and mushrooms) retail trading (except single brand product
retailing), lottery, gambling and betting, chit fund, mutual benefit financial companies, trading in
transferable development rights, real estate, manufacturing of cigars, cigarettes, tobacco or tobacco
substitutes, atomic energy, and railway transport (other than mass rapid transport systems). See
Consolidated FDI Policy (Effective from October 1, 2010) of the Department of Industrial Policy and
Promotion (DIPP), Government of India, available at http://www.dipp.nic.in/FDI_Circular/
FDI_Circular_02of2010.pdf. 11 This issue was taken up by the National Security Council. 12 UNCTAD, World Investment data.
6
to the observed increase in the reported FDI inflows there is no denying the fact of the
sharp increase in the inflows especially during the last few years. There were hints that
private equity might have been a major contributing factor to the enhanced inflows.13
However, this question has not been examined in any detail.
This was the starting point of our enquiry into the nature of FDI inflows in the recent past.
A preliminary examination of the individual inflow details did throw up the need to
analyse the data more intently. Subsequently, a perusal of RBI’s Master Circular on Foreign
Investment in India and the Draft Press Note (DPN) on FDI Regulatory Framework issued
in December 2009 made us further aware of the issues that could be associated with
compilation of FDI inflows in India. The present exercise is thus primarily an attempt to
examine the inflow data by going beyond the broad aggregates with a view to bring out the
lesser explored characteristics of FDI in India and their developmental implications. This
has necessarily led us to examine India’s efforts to conform to international best practices
on the one hand and to take a close look at some of the criteria adopted by international
agencies themselves on the other. In the process, we also had an opportunity to look at the
rationale and implications of the criteria proposed by the DPN and its follow up viz.,
Consolidated FDI Policy (CFP) which became effective from April 1, 2010. In view of the
difficulties faced in getting the relevant information, we are constrained to term the
exercise as a first approximation to the ground reality. Notwithstanding this limitation, we do
hope that the exercise succeeds in creating awareness among policy makers and
researchers not only in India but also at the international level that there is a need to take a
closer look at the present phenomenon of FDI.
The study covers the reported FDI inflows during September 2004 and December 2009. The
choice of the period has been solely influenced by the availability of data on actual inflows
by recipient companies incorporated in India, the disclosure of which was started in
September 2004. Till then only approvals were being reported. Importantly, this covers the
period which witnessed the sharpest increases in inflows. It may also be pointed out that
the analysis provided in the paper would be helpful in understanding the sharp fall in FDI
inflows during 2010‐11 when the inflows for the first nine months have fallen almost by a
quarter compared to the inflows during the corresponding period of the previous year.
2. Conceptual and Definitional Issues
Before embarking on a discussion of India’s FDI inflows and their various characteristics
it would be relevant and essential to describe what has come to be internationally
recognized as FDI. This could provide a basis for categorising India’s inflows. Here we
13 See for instance: CP Chandrasekhar, Private Equity: A New Role for Finance?, Economic and Political Weekly,
March 31, 2007, CP Chandrasekhar and Jayati Ghosh, “Private Equity and India’s FDI Boom”, Business Line,
May 1, 2007; T T Ram Mohan , “Are FDI flows into India for real?”, Economic Times, October 5, 2007 and
“RBI confirms FDI data included PE inflows”Livemint.com, July 9 2007.
7
shall rely extensively on official documents and academic literature. According to the
Benchmark Definition of OECD, the most referred to and relied upon definition of FDI:
Foreign direct investment reflects the objective of establishing a lasting interest by a
resident enterprise in one economy (direct investor) in an enterprise (direct investment
enterprise) that is resident in an economy other than that of the direct investor. The
lasting interest implies the existence of a long‐term relationship between the direct
investor and the direct investment enterprise and a significant degree of influence on
the management of the enterprise. The direct or indirect ownership of 10% or more of
the voting power of an enterprise resident in one economy by an investor resident in
another economy is evidence of such a relationship.
...Direct investment is not solely limited to equity investment but also relates to
reinvested earnings and inter‐company debt.14
It needs to be underlined that the key aspect of the above definition is lasting interest
which is supposed to be evidenced by the fact of ownership of at least 10% voting power
(because it is assumed to give the investor power to exercise significant influence over
the investee). It should also be noted that apart from equity inflows there are other items
to be considered for inclusion in the FDI statistics and there can be a variety of difficulties
in measuring each of these. The crucial point, however, is that the first stage of
identifying a direct investment enterprise is the ownership of 10% voting power and the
rest basically follow from that. All investments below the 10% limit are considered as
portfolio investments.
While this is the operational distinction between FDI and FPI, for a theoretical
differentiation between the two one can refer to Dunning, who said:
First, FDI involves the transfer of other resources than capital (technology,
management, organizational and marketing skills, etc.) and it is the expected return
on these, rather than on the capital per se, which prompts enterprises to become
MNEs. Thus capital is simply a conduit for transfer of other resources than the raison
d’être for direct investment. Second, in the case of direct investment, resources are
transferred internally within the firm rather than externally between two independent
parties: de jure control is still retained over their usage. ... These are the essential
differences between portfolio and direct investment.15 (emphasis added)
14 Debt instruments include marketable securities such as bonds, debentures, commercial paper, promissory
notes, non‐participating preference shares and other tradable non‐equity securities as well as loans,
deposits, trade credit and other accounts payable/ receivable. All cross‐border positions and transactions
related to these instruments, between enterprises covered by an FDI relationship other than between related
financial intermediaries are included in FDI.
See: OECD, Benchmark Definition of Foreign Direct Investment, Fourth Edition, 2008, pp. 48‐49. 15 John H. Dunning, “Trade, location of economic activity and the multinational enterprise: a search for an
eclectic approach”, in John Dunning (ed.), The Theory of Transnational Corporations, UN Library on
Transnational Corporations, Volume I, Routledge, 1993, p. 185. UNCTAD too made similar observations
when comparing foreign portfolio and direct investments. See: UNCTAD, World Investment Report, 1997,
Chapter III (Foreign Portfolio Equity Investment).
8
Long back, Hymer, in his seminal work, offered an explanation why portfolio investors
seek control and made a distinction within FDI. He had classified direct investment into
two types: Type 1 and Type 2.
There are two main types of reasons why an investor will seek control. The first,
which I shall call direct investment, Type 1, has to do with the prudent use of assets.
The investor seeks control over the enterprise in order to ensure the safety of his
investment. This reason applies to domestic investment as well.
...
The theory of Type 1 direct investment is very similar to the theory of portfolio investment.
The interest rate is the key factor in both. Direct investment of Type 1 will substitute
for portfolio investment when the distrust of foreigners is high or when fear of
expropriation and risks of exchange‐rate changes are high, but its movements will
still be in response to differences in the interest rate.
...
There is another type of direct investment that does not depend on the interest rate
and which I shall call direct investment of Type 2, or international operations. In this
second type of direct investment, the motivation for controlling the foreign enterprise
is not the prudent use of assets but something quite different. The control of the
foreign enterprise is desired in order to remove competition between that foreign
enterprise and enterprises in other countries. Or the control is desired in order to
appropriate fully the returns on certain skills and abilities.16
It can be seen from the above that but for the control aspect Type 1 direct investment is
nothing but portfolio investment.17 Buckley and Brooke’s characterisation that FDI “...
represents a packaged transfer of capital, technology, management and other skills, which
takes place internally within the multinational firms” (emphasis added) is similar to
Dunning’s description of FDI and Hymer’s elaboration of Type 2 direct investment.18
16 Stephen Hymer, “On multinational corporations and foreign direct investment”, in John Dunning (ed.), The
Theory of Transnational Corporations, UN Library on Transnational Corporations, Volume I, Routledge, 1993,
p. 25. 17 Interestingly, the European Commission also in its submission to the WTO categorically stated that:
Portfolio investors, as a general rule do not expect to obtain additional benefits derived from the
management control of the enterprise in which they invest. Their main concern is the appreciation of the
value of their capital and the return that it can generate regardless of any long‐term relationship
consideration or control of the enterprise. This is the main rationale behind portfolio investment, that
makes it substantially different from FDI.
The Commission, however, mentioned that
“… if any of those instruments complies with the criteria of FDI capital transactions they are considered
part of FDI”.
See: “Concept Paper on the Definition of Investment” WT/WGTI/W/115, 16 April 2002, available at
http://trade.ec.europa.eu/doclib/docs/2004/july/tradoc_111123.pdf 18 Peter J. Buckley and Michael Z. Brooke, International Business Studies : An Overview, Blackwell Publishers,
Oxford, 1992, p. 249.
9
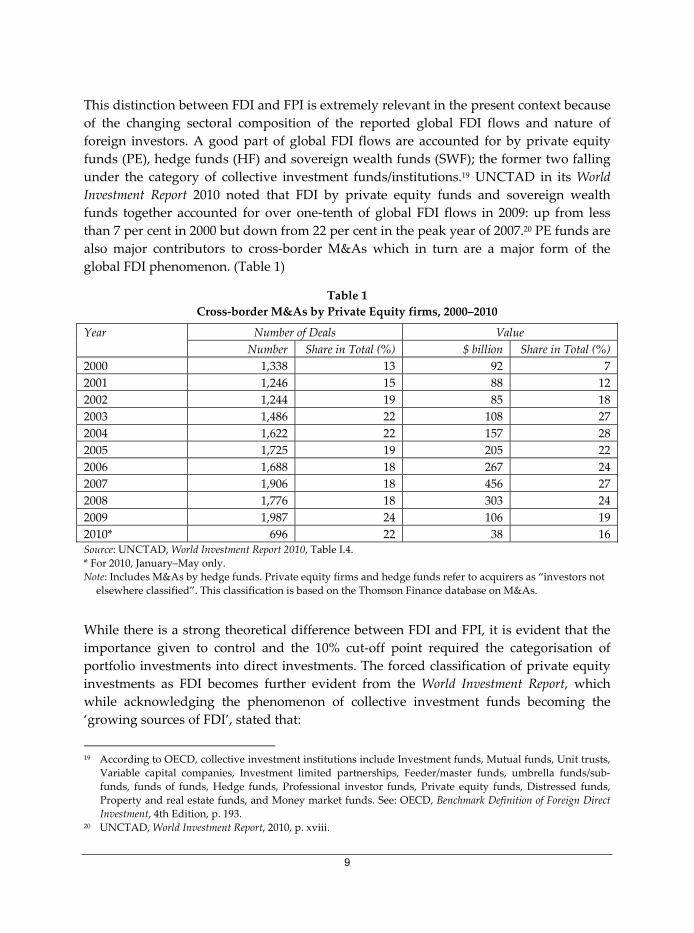
This distinction between FDI and FPI is extremely relevant in the present context because
of the changing sectoral composition of the reported global FDI flows and nature of
foreign investors. A good part of global FDI flows are accounted for by private equity
funds (PE), hedge funds (HF) and sovereign wealth funds (SWF); the former two falling
under the category of collective investment funds/institutions.19 UNCTAD in its World
Investment Report 2010 noted that FDI by private equity funds and sovereign wealth
funds together accounted for over one‐tenth of global FDI flows in 2009: up from less
than 7 per cent in 2000 but down from 22 per cent in the peak year of 2007.20 PE funds are
also major contributors to cross‐border M&As which in turn are a major form of the
global FDI phenomenon. (Table 1)
Table 1
Cross‐border M&As by Private Equity firms, 2000–2010
Year Number of Deals Value
Number Share in Total (%) $ billion Share in Total (%)
2000 1,338 13 92 7
2001 1,246 15 88 12
2002 1,244 19 85 18
2003 1,486 22 108 27
2004 1,622 22 157 28
2005 1,725 19 205 22
2006 1,688 18 267 24
2007 1,906 18 456 27
2008 1,776 18 303 24
2009 1,987 24 106 19
2010* 696 22 38 16 Source: UNCTAD, World Investment Report 2010, Table I.4.
* For 2010, January–May only.
Note: Includes M&As by hedge funds. Private equity firms and hedge funds refer to acquirers as “investors not
elsewhere classified”. This classification is based on the Thomson Finance database on M&As.
While there is a strong theoretical difference between FDI and FPI, it is evident that the
importance given to control and the 10% cut‐off point required the categorisation of
portfolio investments into direct investments. The forced classification of private equity
investments as FDI becomes further evident from the World Investment Report, which
while acknowledging the phenomenon of collective investment funds becoming the
‘growing sources of FDI’, stated that:
19 According to OECD, collective investment institutions include Investment funds, Mutual funds, Unit trusts,
Variable capital companies, Investment limited partnerships, Feeder/master funds, umbrella funds/sub‐
funds, funds of funds, Hedge funds, Professional investor funds, Private equity funds, Distressed funds,
Property and real estate funds, and Money market funds. See: OECD, Benchmark Definition of Foreign Direct
Investment, 4th Edition, p. 193. 20 UNCTAD, World Investment Report, 2010, p. xviii.
10
As long as cross‐border investments of private equity and hedge funds exceed the
10% equity threshold of the acquired firm, these investments are classified and
should be recorded as FDI, even if a majority of such investments are short term and
are closer in nature to portfolio investments. Investments by these funds may be the
latest examples of portfolio investment turning into FDI.21 (emphasis added)
Just a little earlier UNCTAD had said:
Cross‐border investments of private equity funds that lead to an ownership of 10% or
more are in most cases recorded as FDI even if private equity funds do not always have
the motivation for a lasting interest or a long‐term relationship with the acquired enterprise.22
(emphasis added)
It, however, cautioned that:
FDI by collective investment funds is a new form of foreign investment, which raises
a number of questions that deserve further research. For instance, how does FDI
financed by private equity funds differ from FDI by TNCs in its strategic
motivations? Who controls such funds? And what are their impacts on host
economies?23
OECD too echoed this when it said:
Both aspects, investments in CIIs (collective investment institutions) and by CIIs, are
included in FDI statistics as far as the basic FDI criteria are met. However, the nature
and motivation of CIIs may differ from those of MNEs and there is a need to observe
this phenomenon more closely in the coming years.24
OECD in its benchmark definition (4th Edition) clarified that investments by CIIs which
were till then being classified as portfolio investments due to lack of clarity in
international standards should be included in FDI statistics as long as they meet the FDI
criteria. Interestingly, OECD also said that
CIIs are generally “brass plate” enterprises and are managed by professional
investors who may offer a variety of funds with their own market orientation and
who make investment decisions on behalf of investors. Administration, management,
custodial and trustee services may be provided to the CIIs by separate service
providers,...25
Private equity (including venture capital) certainly has a shorter investment horizon
unlike the traditional FDI which would not start off with a pre‐conceived idea of exiting
an enterprise.26 Private equity investors have the overriding objective of large and fast 21 UNCTAD, World Investment Report, 2006, p. 16. 22 UNCTAD, World Investment Report, 2005, p. 37, n31. 23 UNCTAD, World Investment Report, 2006, p. 21. 24 OECD, Benchmark Definition of Foreign Direct Investment, 4th Edition, 2008, p. 23. 25 ibid., pp. 192‐193 26 In sharp contrast to FDI is the behaviour of private equity.
Private equity professionals have their eye on the exit from the moment they first see a business plan. ... If a
contd…
11
capital gains and revenue in other forms and there is no question/intention of integrating
the investee company into their own structures like an MNC does.27 By their very
character, these are not long term investors. Also, in their operations one cannot
distinguish between domestic and foreign. They do not fall under any of the motives of
FDI namely, resource seeking, efficiency seeking, market seeking or strategic asset
seeking. If their investments have to be treated as FDI, they may be categorised as pure
‘return seeking’ FDI.
2.1 10% Threshold and Significant Influence vs. Control
Keeping the issue of classification of private equity and other collective investments per se
aside for the time being, there is a need to have a close look at the crucial 10% threshold
itself. Indeed, one of the tasks assigned to the Direct Investment Technical Expert Group
(DITEG), a joint IMF/OECD expert group, was to examine whether it could be raised to
20%. The DITEG recommended the increase in the threshold to 20% in the following
manner.
The group endorsed the proposal to move to 20 per cent of voting power or ordinary
shares as the threshold for the operational definition for a direct investment
relationship, even though it was recognised that changing the current threshold of 10
per cent to 20 per cent would not have a significant impact on the data. The group
found that there were no strong conceptual grounds for choosing 10 or 20 per cent, and so
any choice below 50 per cent would be arbitrary. However, there are strong practical
arguments for supporting the change to 20 per cent threshold, namely with regard to
accounting standards. International Accounting Standards (IAS) as well as the
accounting standard used by the United States utilize a 20 per cent threshold for
financial statements.28 (emphasis added)
This recommendation was, however, rejected by the OECD Workshop on International
Investment Statistics which decided to:
(i) to maintain the current 10 per cent threshold, thus not endorsing the
recommendation of DITEG to change the threshold to 20 per cent;
(ii) to maintain the strict application of the 10 per cent threshold with a view to
achieving cross‐country comparability of FDI statistics,...29 (emphasis added)
fund manager canʹt see an obvious exit route in a potential investment, then it wonʹt touch it.
See: http://www.altassets.com/private‐equity‐glossary.html 27 It is indeed said that: “Ultimately, of course, the private equity business is all about achieving financial
returns. Some firms may have aspirations to add value and growth, but that is a means to an end—the goal
is to make money.” See: “Private Equity in India: An Executive Round Table” at
http://content.spencerstuart.com/sswebsite/pdf/lib/PrivateEquityIndia_2007_web2.pdf 28 Direct Investment Technical Expert Group (DITEG) Outcome Paper # 2 (Revised version), September 24,
2004. The DITEG was created in 2004 as a joint IMF/OECD expert group to make recommendations on the
methodology of direct investment statistics for the revision of the BPM5 and the Benchmark Definition. 29 Draft Summary of the Meeting of the OECD Workshop on International Investment Statistics (October 12‐13
contd…
12
While it is repeatedly emphasized that investors could exercise significant influence even
with less than 10% share in equity and that there can be situations where even a higher
share in equity need not be accompanied by control, yet a strict adherence to the 10%
criterion is advocated for the sake of uniformity at the international level. The OECD’s
position in this regard is that:
Some compilers may argue that in some cases an ownership of as little as 10% of the
voting power may not lead to the exercise of any significant influence while on the
other hand, an investor may own less than 10% but have an effective voice in the
management. Nevertheless, the recommended methodology does not allow any
qualification of the 10% threshold and recommends its strict application to ensure
statistical consistency across countries. (emphasis added).30
It is thus evident that there is no absoluteness to the 10% level and the criterion has
remained unchanged in the most recent exercise on the definition mainly in order to
ensure international comparability. On the other hand, the assumption that raising the
threshold would not have much impact on the FDI data is something that needs to be
looked closely into especially when the nature of foreign investors has got diversified. In
this context, the assertion of IMF Balance of Payment Manual (5th Edition) needs special
mention.
Most direct investment enterprises are either (i) branches or (ii) subsidiaries that are
wholly or majority owned by non‐residents or in which a clear majority of the voting
stock is held by a single direct investor or group. The borderline cases are thus likely
to form a rather small proportion of the universe.31
It is, however, more likely that the lower limit of 10% for ascertaining influence coupled
with non‐exclusion of investments by collective investment schemes for consideration as
FDI would have resulted in the estimated FDI flows being far larger than otherwise
especially in the context of the global capital flows changing their character and collective
investment funds playing a major role. A foreign investor when investing in another
enterprise in the same line of activity, whether domestic or foreign, would seek to have
control because of the involvement of many factors. While the general preference could
be a wholly‐owned entity, circumstances like the necessity to enter into joint ventures
and host country regulations may require the foreign investor to settle for a lower share.
In each of these situations control on the one hand and directly relevant contribution to
2004), prepared by the OECD.
30 OECD, Benchmark Definition of Foreign Direct Investment, Fourth Edition, 2008, p. 49. Interestingly, the New
Palgrave Dictionary of Economics does not use the term significant influence. It terms 10% as implying
controlling interest when it says:
Foreign direct investment (FDI) occurs when an individual or firm acquires controlling interest
(typically defined as at least ten per cent ownership) in productive assets in another country.
Bruce A. Blonigen, “Foreign Direct Investment”, in Steven N. Durlauf and Lawrence E. Blume (eds.), The
New Palgrave Dictionary of Economics, Second Edition, 2008, pp. 459‐462. 31 IMF Balance of Payments Manual, 5th Edition, p. 87.
13
the enterprise’s operation by the foreign investor on the other, are logical to expect.
Going by Hymer’s direct investment of Type 2, control would be necessary so as to
prevent competition. In case of joint ventures it has been indeed said:
Even if a foreign entity cannot own a majority of a joint venture, it may be able to
legally obtain operational control through other means. One may surround the joint
venture with contractual obligations to the foreign venturer. For example, if the joint
venture is to assemble components manufactured in the United States, the U.S.
investor retains significant control over the joint venture regardless of how many shares the
investor owns or how many directors it can name to the board because it controls the
supply of components. Similarly, a U.S. investor can exercise control through supply
contracts, marketing agreements, management contracts, and veto power in the joint
venture agreements. (emphasis added)32
Another relevant aspect is that the widely adopted OECD definition is based on the
assumption of significant influence. Interestingly, a distinction was made by Lipsey by
referring to United Nations System of National Accounts (SNA) wherein he said:
What constitutes a foreign direct investment entity has been defined differently
for balance of payments purposes and for studies of firm behavior.
The dominant current definition of a direct investment entity, prescribed for balance‐
of‐payments compilations by the International Monetary Fund (IMF) (1993), and
endorsed by the OECD (1996), avoids the notion of control by the investor in favor of
a much vaguer concept (long term interest and significant influence).
The IMF definition is governing for balance‐of‐payments compilations, but there is a
different, but related, concept and a different official definition in the United Nations
System of National Accounts, ... that retains the idea of control, and reflects the micro
view more. In these accounts, which measure production, consumption, and
investment, rather than the details of capital flows, there is a definition of “foreign‐
controlled resident corporations.” Foreign‐controlled enterprises include subsidiaries
more than 50 percent owned by a foreign parent. “Associates” of which foreign
ownership of equity is 10–50 percent, “may be included or excluded by individual
countries according to their qualitative assessment of foreign control…” (Inter‐Secretariat
Working Group on National Accounts, 1993, pp. 340–1). Thus, from the viewpoint of
a host country, and for analyzing production, trade, and employment, control
remains the preferred concept.33 (emphasis added)
IMF also made this point clear when it said:
The concept described in this Manual is broader than the SNA concept of foreign‐
controlled, ..., resident enterprises. In the SNA, that distinction ... is made in the
32 Schaffer Richard, Beverley Earle and Filiberto Agusti (1999), International Business Law and Its Environment,
4th Edition, West Educational Publishing Co, Cincinnati, p. 581. 33 Robert E Lipsey, “Foreign Direct Investment and the Operations of Multinational Firms: Concepts, History,
and Data”, in E. Kwan Choi and James Harrigan (ed.), Handbook of International trade, Blackwell, 2003, pp.
287‐319.

14
compilation of various accounts because of the distinction’s potential analytic
usefulness in the examination of differences (characteristics such as value added,
investment, employment, etc.) between enterprise subsectors. Thus, linkage of the
direct investment component of the financial account with the foreign‐controlled
sector is by no means a complete one, primarily because the two serve different
purposes. As presented in this Manual, the primary distinguishing feature of direct
investment is the significant influence that gives the investor an effective voice in
management. For the foreign‐controlled sector, the primary distinguishing feature is
control.34
Thus for economic analysis of foreign investment one needs to focus more on control and
look into the circumstances of investment rather than any specific percentage. In fact, the
European Commission (EC) suggested that to ascertain a direct investment relationship
when the foreign investor holds less than 10% of the equity, the following criteria could
be taken into account to determine whether a direct investment relationship exists:
a) representation in the Board of Directors;
b) participation in policymaking processes;
c) inter‐company transactions;
d) interchange of managerial personnel;
e) provision of technical information; and
f) provision of long‐term loans at lower than existing market rates.35
On the other hand, the EC also emphasised the need to go beyond the standard
definition and taking into account the national legal provisions as also circumstances.
Situations vary very much from country to country and depend on the legal
framework for corporate governance, i.e. the legislation regulating the allocation of
property rights and control of enterprises. ... Precise allocation of control between
national and foreign entities requires compilers of statistics not just to apply the
definition but also to make a supplementary assessment.36
Since, voting power of more than 10% also does not always ensure control, it is logical
that one needs to follow a case‐by‐case approach in such cases too.
34 IMF, Balance of Payments Manual, 1993. 35 Supra note 17. 36 See: Eurostat, European Commission, Foreign Affiliates Statistics (FATS) Recommendations Manual, Eurostat’s
Methodologies & Working Papers, 2009 Edition, p. 14. Available at
http://epp.eurostat.ec.europa.eu/cache/ITY_OFFPUB/KS‐AR‐09‐014/EN/KS‐AR‐09‐014‐EN.PDF. A
description of legal provisions in India and how in practice the general perceptions can be defeated has been
described in K.S. Chalapati Rao and Biswajit Dhar, “Operation of FDI Caps in India and Corporate Control
Mechanisms”, ISID Working paper WP2010/11 available at http://isid.org.in/pdf/WP1011.PDF.
15
2.2 Need for Case‐by‐Case Approach
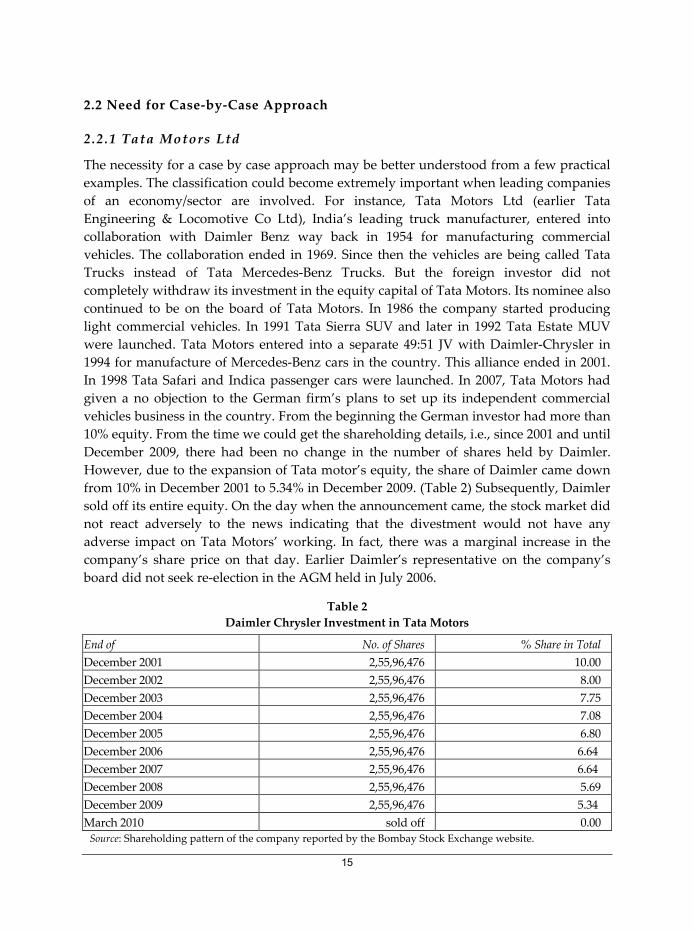
2.2 .1 Tata Motors Ltd
The necessity for a case by case approach may be better understood from a few practical
examples. The classification could become extremely important when leading companies
of an economy/sector are involved. For instance, Tata Motors Ltd (earlier Tata
Engineering & Locomotive Co Ltd), India’s leading truck manufacturer, entered into
collaboration with Daimler Benz way back in 1954 for manufacturing commercial
vehicles. The collaboration ended in 1969. Since then the vehicles are being called Tata
Trucks instead of Tata Mercedes‐Benz Trucks. But the foreign investor did not
completely withdraw its investment in the equity capital of Tata Motors. Its nominee also
continued to be on the board of Tata Motors. In 1986 the company started producing
light commercial vehicles. In 1991 Tata Sierra SUV and later in 1992 Tata Estate MUV
were launched. Tata Motors entered into a separate 49:51 JV with Daimler‐Chrysler in
1994 for manufacture of Mercedes‐Benz cars in the country. This alliance ended in 2001.
In 1998 Tata Safari and Indica passenger cars were launched. In 2007, Tata Motors had
given a no objection to the German firm’s plans to set up its independent commercial
vehicles business in the country. From the beginning the German investor had more than
10% equity. From the time we could get the shareholding details, i.e., since 2001 and until
December 2009, there had been no change in the number of shares held by Daimler.
However, due to the expansion of Tata motor’s equity, the share of Daimler came down
from 10% in December 2001 to 5.34% in December 2009. (Table 2) Subsequently, Daimler
sold off its entire equity. On the day when the announcement came, the stock market did
not react adversely to the news indicating that the divestment would not have any
adverse impact on Tata Motors’ working. In fact, there was a marginal increase in the
company’s share price on that day. Earlier Daimler’s representative on the company’s
board did not seek re‐election in the AGM held in July 2006.
Table 2
Daimler Chrysler Investment in Tata Motors
End of No. of Shares % Share in Total
December 2001 2,55,96,476 10.00
December 2002 2,55,96,476 8.00
December 2003 2,55,96,476 7.75
December 2004 2,55,96,476 7.08
December 2005 2,55,96,476 6.80
December 2006 2,55,96,476 6.64
December 2007 2,55,96,476 6.64
December 2008 2,55,96,476 5.69
December 2009 2,55,96,476 5.34
March 2010 sold off 0.00
Source: Shareholding pattern of the company reported by the Bombay Stock Exchange website.
16
In the prospectus issued in 1980, the company did not mention any special relationship
with Daimler. It merely stated:
As regards Daimler–Benz AG their present holding in the company is approximately
13% of the subscribed equity capital. It is in the long term interest of the Company
that Daimler‐Benz AG, who are world leaders in the field of automobile
manufacture, maintain their equity percentage.37
Given this background, it would be important whether Tata Motors can be classified as
an FDI company and if so till what period. For us it looks appropriate, notwithstanding
the continued equity participation by Daimler of at least 10% thereafter and
representation on the board, to treat it as an FDI company only till 1969 when the
technical collaboration ceased. There is no evidence to show that the subsequent
developments at Tata Motors were in any way directly contributed by Daimler.
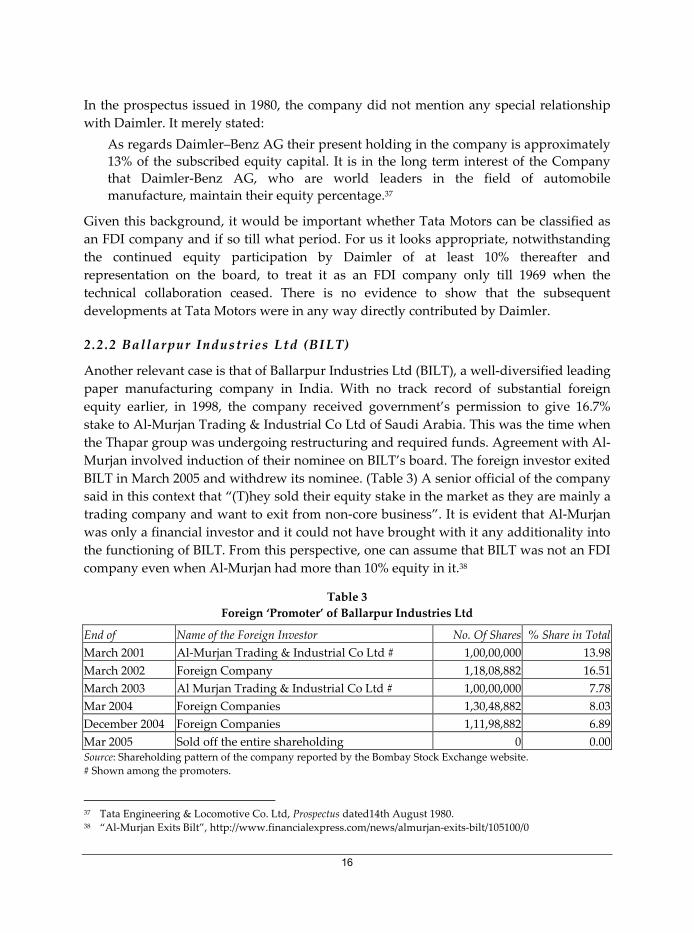
2.2 .2 Ballarpur Industries Ltd (BILT)
Another relevant case is that of Ballarpur Industries Ltd (BILT), a well‐diversified leading
paper manufacturing company in India. With no track record of substantial foreign
equity earlier, in 1998, the company received government’s permission to give 16.7%
stake to Al‐Murjan Trading & Industrial Co Ltd of Saudi Arabia. This was the time when
the Thapar group was undergoing restructuring and required funds. Agreement with Al‐
Murjan involved induction of their nominee on BILT’s board. The foreign investor exited
BILT in March 2005 and withdrew its nominee. (Table 3) A senior official of the company
said in this context that “(T)hey sold their equity stake in the market as they are mainly a
trading company and want to exit from non‐core business”. It is evident that Al‐Murjan
was only a financial investor and it could not have brought with it any additionality into
the functioning of BILT. From this perspective, one can assume that BILT was not an FDI
company even when Al‐Murjan had more than 10% equity in it.38
Table 3
Foreign ‘Promoter’ of Ballarpur Industries Ltd
End of Name of the Foreign Investor No. Of Shares % Share in Total
March 2001 Al‐Murjan Trading & Industrial Co Ltd # 1,00,00,000 13.98
March 2002 Foreign Company 1,18,08,882 16.51
March 2003 Al Murjan Trading & Industrial Co Ltd # 1,00,00,000 7.78
Mar 2004 Foreign Companies 1,30,48,882 8.03
December 2004 Foreign Companies 1,11,98,882 6.89
Mar 2005 Sold off the entire shareholding 0 0.00Source: Shareholding pattern of the company reported by the Bombay Stock Exchange website.
# Shown among the promoters.
37 Tata Engineering & Locomotive Co. Ltd, Prospectus dated14th August 1980. 38 “Al‐Murjan Exits Bilt”, http://www.financialexpress.com/news/almurjan‐exits‐bilt/105100/0
17
2.2 .3 VST Tillers Tractors (VST)
The company, market leader in tillers, was started in 1967 as a joint venture and technical
collaboration with Mitsubishi Heavy Industries and Mitsubishi Corporation, Japan for
the manufacture of Power Tillers and Diesel Engines. In 1984, an additional technical and
financial collaboration was entered into with Mitsubishi Agricultural Machinery
Company Ltd, Japan for the manufacture of 18.5 HP, 4 wheel drive Tractor. According to
the earliest available shareholding pattern of the company (June 2002), the foreign
collaborators had 3.78% equity shareholding. Subsequently, this shareholding was
shown against foreign promoters, Mitsubishi Heavy Industry Pvt Ltd being one of them.
The company’s annual report also acknowledged the joint venture partners, Mitsubishi
Heavy Industries Ltd and Mitsubishi Machinery Co Ltd, Japan till 2003‐04. It is only in
2006‐07 when the company promoted MHI‐VST Diesel Engines Pvt Ltd as a joint venture
with the Mitsubishi group that the representation on the company’s board was reduced
from two to one.
It is pertinent to note that the Articles of Association of VST specifically state that:
The regulation for the management of the Company and for the observance of the
members thereof and their representatives shall be such as are contained in these
Articles. The Company shall adopt and carry into effect the Joint Venture agreement
dated 10th November 1966 entered into by the Promoters with the Joint Venture
partners M/s. Mitsubishi Heavy Industries Ltd. and Mitsubishi Corporation
(formerly known as Mitsubishi Shoji Kaisha Ltd, Japan). The aforesaid agreement
shall form a part of these articles of association for all intents and purposes and
particularly the provisions contained therein relating to transfer of shares and pre‐
emptive rights of the parties thereto, to acquire the shares.
…
The joint venture partners M/s. Mitsubishi Heavy Industries Limited, M/s. Mitsubishi
Corporation and M/s. Mitsubishi Agricultural Machinery Company Limited, Japan
shall be collectively entitled to appoint one Director mentioned in clause (a) above,
and shall be entitled to remove him from that office and to appoint any other person
thereto from time to time.39
In the circumstances, the company may be treated as an FDI company in spite of such a
low share of the foreign partners.
The above examples underline the need for case‐by‐case approach for ascertaining
control. In this context, it may also be relevant to refer to the Securities and Exchange
Board of India (SEBI) Takeover Regulations Advisory Committee which noted that
... given the case‐specific nature of “control” as a concept, the Committee decided to
refrain from stipulating whether the power to say ”no” would constitute “control”
39 Memorandum and Articles of Association of VST Tillers Tractors Ltd filed on November 10, 2009 with the
MCA.
18
for purposes of the Takeover Regulations. Whether a person has acquired control by
virtue of affirmative rights would therefore have to be discerned from the facts and
circumstances surrounding each case.40
2.3 Round‐Tripping
Another important aspect of the global capital flows is the phenomenon of round‐
tripping which acquired prominence in the context of huge FDI inflows to China.41 The
OECD was of the view that
Round‐tripping refers to the channelling abroad by direct investors of local funds
and the subsequent return of these funds to the local economy in the form of direct
investment.42
In general, OCED categorised direct investment enterprise to be of the round‐tripping
type if its ultimate investor belongs to the same economy.43 Again, OECD noted that, in
practice, all transactions/positions between fellow enterprises relate to the funds
circulating within multinational groups via shared service centres or to take advantage of
the best financing opportunities and that “(T)hey may also represent round‐tripping of
capital”.44 While China’s round‐tripping FDI is often discussed, in fact, because of flow of
investments among group companies, even FDI into the USA has an element of round‐
tripping.45
OECD identifies the main incentives for round‐tripping as: (i) tax and fiscal advantages;
(ii) property right protection; (iii) expectations on exchange control and exchange rate
and; (iv) access to better financial service. Regarding the last one, it explains that financial
markets of some economies not being well developed, enterprises resident in these
economies have to access overseas financial markets for better financial services, such as
listing of companies in overseas stock markets. The funds raised will be brought back to
host economies in the form of FDI. Round‐tripping may occur as a part of this process. In
order to give an idea of the genuine magnitude FDI, the Benchmark Definition
recommended separate supplementary breakdowns when this phenomenon affected
significantly FDI data of a country.46
40 Securities and Exchange Board of India, Report of the Takeover Regulations Advisory Committee, July 19, 2010, p.
29. (Chairman: C. Achutan) 41 See for example: Nirupam Bajpai and Nandita Dasgupta , “What Constitutes Foreign Direct Investment?
Comparison of India and China”, CGSD Working Paper No. 1, January 2004, Working Papers Series, Center
on Globalization and Sustainable Development, The Earth Institute at Columbia University. Also see: Geng
Xiao, “People’s Republic of China’s Round‐Tripping FDI: Scale, Causes and Implications”, July 2004
available at www.hiebs.hku.hk/working_paper_updates/pdf/wp1137.pdf. 42 OECD, Benchmark Definition of Foreign Direct Investment,: Fourth Edition, 2008, p. 158. 43 ibid., pp. 159‐160. 44 ibid., p. 24. 45 ibid., pp. 212‐213. 46 ibid., p. 159.
19
Round‐tripping is important not only from the point of view of overstating of capital flows.
As the OECD pointed out, some domestic companies may raise finances abroad and bring
the same back into the national economy. In this case, though it would not amount to
overstatement of capital flows, the flows do not carry with them the additional attributes of
technology, management skills, marketing network, etc. Thus the receiving enterprises
would be like domestic enterprises irrespective of the level of ‘foreign held equity’.
2.4 Indian Practice
From the above, it is evident that the choice of 10% for determining FDI relationship has
been more of a convenient thumb rule and that it has been mandated in order to
maintain international comparability. In India, for a long time, foreign direct investments
were associated with ‘control and direction of the enterprise by foreign investors’.
Branches of foreign companies were the obvious cases to fall under this category. In
addition, Indian joint stock companies were also regarded as controlled from abroad if
either of the following two conditions were met:
(a) the foreign ownership was sufficiently large to bestow control over the affairs of
the company and/or
(b) there was an association or an agreement with the foreign owners by virtue of
which control is vested (directly or indirectly) in them.47
For operational purposes, besides Indian subsidiaries of foreign companies, (i) companies
in which non‐residents belonging to one country owned 40 per cent or more of the
ordinary shares, (ii) companies managed by foreign‐controlled managing agents in terms
of a managing agency agreement and (iii) other companies 25% or more of whose
ordinary shares were owned by another foreign‐controlled company in India were
treated as controlled from abroad. Interestingly, portfolio investments comprised
ordinary shares held by non‐residents, other than those treated as foreign controlled, as
well as preference shares and debentures held by all non‐residents, irrespective of whether
they exercised control or not.
For studies on finances of foreign controlled rupee companies (FCRCs) RBI essentially
followed the above basic approach with some modification possibly because the Managing
Agency system was abolished in 1969. FCRCs were defined as:
Indian joint stock Companies which were subsidiaries of foreign companies,
companies in which 40 per cent or more of the equity capital was held outside India
in any one country and companies in which 25 per cent or more of the equity capital
was held by a foreign company or its nominee were treated as Foreign‐Controlled
Rupee Companies (FCRCs). 48
47 RBI, Report on the Survey of India’s Foreign Liabilities and Assets as on 31st December 1955, 1957, p. 10. 48 RBI, “Finances of Foreign Direct Investment Companies, 1993‐94”, RBI Monthly Bulletin, March 1999, p. 245.
20
However, following the Balance of Payments Manual (5th edition), RBI adopted the FDI
company concept and explained:
A direct investment enterprise is defined as an incorporated or unincorporated
enterprise in which a direct investor, who is resident in another economy, owns 10%
or more of the ordinary shares or voting power (for an incorporated enterprise) or
the equivalent (for an unincorporated). As such, a company in which 10 per cent or
more equity capital is held by a single non‐resident investor is defined as a Foreign
Direct Investment Company. (emphasis added)49
The emphasis has been more on bringing India’s FDI reporting system in alignment with
the international reporting system. This was further operationalised following the
recommendations of the RBI Committee on Compilation of Foreign Direct Investment in
India in 2002. In this process, the 10% criterion has been taken as inviolable and the finer
aspects of FDI have been ignored. In particular, the representative character of company
finance studies based on the new criteria compared to those based on FCRCs to reflect the
operations of FDI in India were also not discussed. The fact of unquestioned allegiance to
the 10% criterion ignoring the context surrounding the investment is reflected at many
places. For instance, the Economic Advisory Council to the Prime Minister in its Review of
the Economy 2007‐08 said:
Inflows of Private Equity (PE) investments have also been quite large. Since in most
cases PE flows constitute less than 10% of the capital of the company being invested
they should ideally be reported under Portfolio Capital, and not under FDI. It is not
clear what the current accounting practice is. (emphasis added)
Implied in this statement is the EAC’s belief that in India FDI is measured strictly according
to the minimum 10% shareholding criterion. It is also evident that but for the insistence on
the 10% criterion, foreign private equity would have been classified as portfolio capital
rather than as FDI. Also reflected in the above is the fact that an important official advisory
body was unaware of certain aspects of computing FDI in India.
The thin line between FDI and foreign portfolio investments (by FIIs) as far as
classification of foreign private equity and venture capital in India is further evident from
the following observation of the Working Group on Foreign Investment set up by the
Ministry of Finance.
Inflows into unlisted equity: At a conceptual level, a private equity or venture
capital fund outside India can invest in India in three ways. First, private investment
in unlisted equity can take place if the foreign entity creates an investment vehicle
which obtains an FII registration. Second, even without registering as an FII a private
equity or venture capital fund outside India can invest in an Indian unlisted
company up to the level of caps for FIIs. These investments would be treated as FDI,
... These two mechanisms, put together, characterize the main avenues for private
49 ibid.
21
equity/venture capital inflows into India. The third way for private equity or venture
capital funds outside India to invest in the country is to register as an FVCI with SEBI
and be regulated as such.50 (emphasis added)
The Consolidated FDI Policy (CFP) issued by the Department of Industrial Policy and
Promotion (DIPP) on March 31, 2010 and its predecessor Draft Press Note (DPN) on FDI
Regulatory Framework throw light on the way FDI is being measured in India. While
reiterating the motivation of the direct investor as:
... a strategic long term relationship with the direct investment enterprise to ensure
the significant degree of influence by the direct investor in the management of the
direct investment enterprise.
the CFP further explained:
Investment in Indian companies can be made both by non‐resident as well as
resident Indian entities. Any non‐resident investment in an Indian company is direct
foreign investment.51 (emphasis added)
Interestingly, the DPN issued earlier for discussion by the Government, stated that:
In India the ‘lasting interest’ is not evinced by any minimum holding of percentage of
equity capital/shares/voting rights in the investment enterprise.52
This suggests that all foreign investments (other than those purchased by FIIs on the
stock market) in equity capital and equity related instruments are being treated as FDI
irrespective of the extent of foreign share. It is obvious that in not all the cases there will be
lasting interest and the ability or intention to significantly influence the management of
the investee company. While this contrasts sharply with the ‘international best practice’,
one cannot expect such FDI to be accompanied by the attendant attributes and deliver the
perceived benefits from FDI. Dunning’s OLI paradigm suggests that the foreign investor
should have certain advantages over the domestic enterprises in order to compensate for
the disadvantages associated with operating in an alien environment. Pure financial
investments are less likely to be accompanied by such ownership advantages which the
foreign investor would like to internalise.
In the backdrop of the internationally adopted criterion not being followed in practice, one
may not expect round‐tripping by domestic investors to be treated separately as a distinct
category of capital flow other than FDI. In spite of the fact that some well‐known companies
which raised money by listing abroad have invested back in India and occasional reports in
the press regarding some delayed or disapproved FDI proposals because of suspected round‐
50 See: Ministry of Finance, Report of the Working Group on Foreign Investment, 30 July 2010, p. 71. (Chairman:
U.K. Sinha) 51 Department of Industrial Policy and Promotion (DIPP), Ministry of Commerce and Industry, Consolidated
FDI Policy (Effective from April 1, 2010) available at
http://siadipp.nic.in/policy/fdi_circular/fdi_circular_1_2010.pdf. 52 Draft Press Note: “Regulatory Framework of FDI”, issued in December 2009 by the DIPP.
22
tripping of funds, this phenomenon has never been explored fully in case of India.53 A news
report of 2003 attributed to RBI did, however, say that round‐tripped FDI as a part of the total
FDI was insignificant and could be as low as 2–3%.54
Interestingly, Bain & Co., a major global business and strategy consulting firm, says:
Employing another tactic, some domestic PE funds invest in Indian companies
through wholly owned offshore subsidiaries. Because several jurisdictions, including
Singapore and Mauritius, have double‐taxed treaties with India, PE funds can use
Special Purpose Vehicles based there to avoid transferability restrictions when they
eventually exit from an investment.55
From the foregoing it is evident that besides the usual classification of market seeking,
efficiency seeking, resource/strategic asset seeking FDI there are also categories that
could be called return seeking and round tripping FDI. The last two, strictly speaking,
cannot be equated with FDI. Thus there is a case for analysing the reported FDI inflows,
keeping the expectations from FDI, by suitably classifying the foreign investors. We shall,
in the following, try to analyse India’s FDI inflows from this perspective.
3. Analysis of Inflows
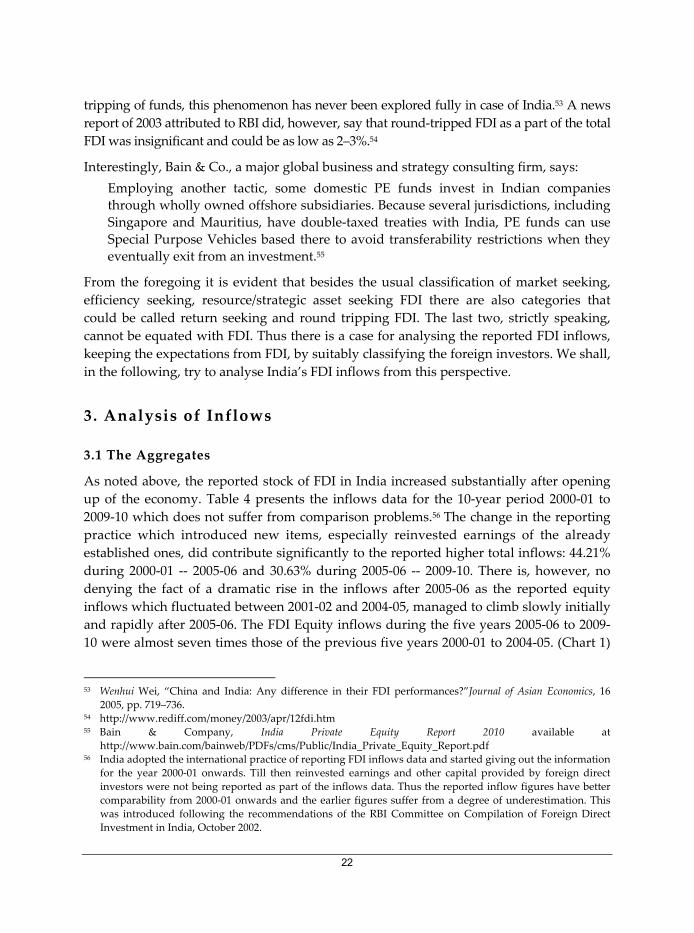
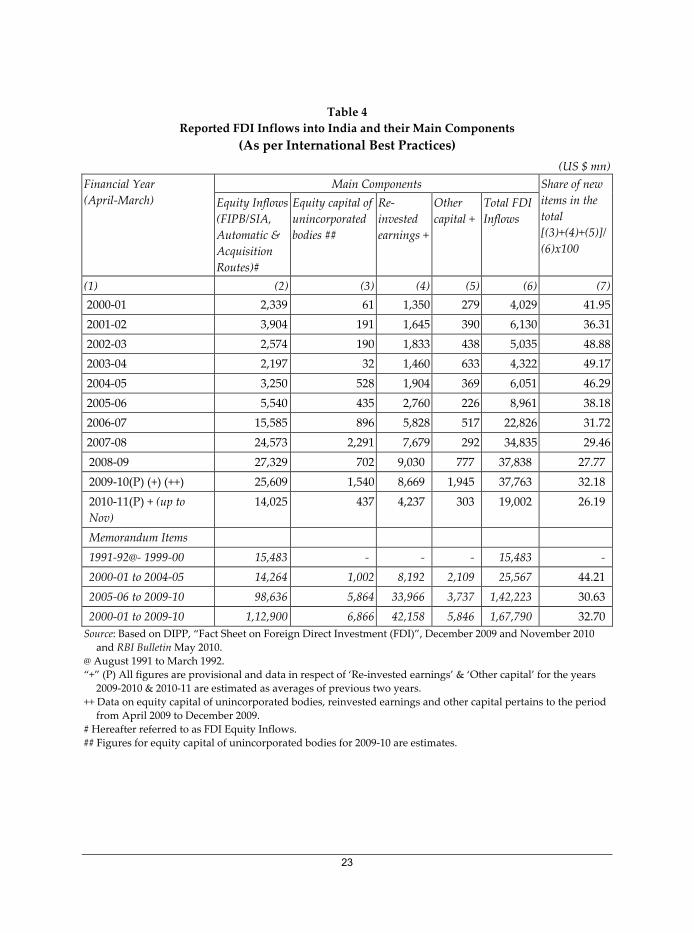
3.1 The Aggregates
As noted above, the reported stock of FDI in India increased substantially after opening
up of the economy. Table 4 presents the inflows data for the 10‐year period 2000‐01 to
2009‐10 which does not suffer from comparison problems.56 The change in the reporting
practice which introduced new items, especially reinvested earnings of the already
established ones, did contribute significantly to the reported higher total inflows: 44.21%
during 2000‐01 ‐‐ 2005‐06 and 30.63% during 2005‐06 ‐‐ 2009‐10. There is, however, no
denying the fact of a dramatic rise in the inflows after 2005‐06 as the reported equity
inflows which fluctuated between 2001‐02 and 2004‐05, managed to climb slowly initially
and rapidly after 2005‐06. The FDI Equity inflows during the five years 2005‐06 to 2009‐
10 were almost seven times those of the previous five years 2000‐01 to 2004‐05. (Chart 1)
53 Wenhui Wei, “China and India: Any difference in their FDI performances?”Journal of Asian Economics, 16
2005, pp. 719–736. 54 http://www.rediff.com/money/2003/apr/12fdi.htm 55 Bain & Company, India Private Equity Report 2010 available at
http://www.bain.com/bainweb/PDFs/cms/Public/India_Private_Equity_Report.pdf 56 India adopted the international practice of reporting FDI inflows data and started giving out the information
for the year 2000‐01 onwards. Till then reinvested earnings and other capital provided by foreign direct
investors were not being reported as part of the inflows data. Thus the reported inflow figures have better
comparability from 2000‐01 onwards and the earlier figures suffer from a degree of underestimation. This
was introduced following the recommendations of the RBI Committee on Compilation of Foreign Direct
Investment in India, October 2002.
23
Table 4
Reported FDI Inflows into India and their Main Components
(As per International Best Practices)
(US $ mn)
Financial Year
(April‐March)
Main Components Share of new
items in the
total
[(3)+(4)+(5)]/
(6)x100
Equity Inflows
(FIPB/SIA,
Automatic &
Acquisition
Routes)#
Equity capital of
unincorporated
bodies ##
Re‐
invested
earnings +
Other
capital +
Total FDI
Inflows
(1) (2) (3) (4) (5) (6) (7)
2000‐01 2,339 61 1,350 279 4,029 41.95
2001‐02 3,904 191 1,645 390 6,130 36.31
2002‐03 2,574 190 1,833 438 5,035 48.88
2003‐04 2,197 32 1,460 633 4,322 49.17
2004‐05 3,250 528 1,904 369 6,051 46.29
2005‐06 5,540 435 2,760 226 8,961 38.18
2006‐07 15,585 896 5,828 517 22,826 31.72
2007‐08 24,573 2,291 7,679 292 34,835 29.46
2008‐09 27,329 702 9,030 777 37,838 27.77
2009‐10(P) (+) (++) 25,609 1,540 8,669 1,945 37,763 32.18
2010‐11(P) + (up to
Nov)
14,025 437 4,237 303 19,002 26.19
Memorandum Items
1991‐92@‐ 1999‐00 15,483 ‐ ‐ ‐ 15,483 ‐
2000‐01 to 2004‐05 14,264 1,002 8,192 2,109 25,567 44.21
2005‐06 to 2009‐10 98,636 5,864 33,966 3,737 1,42,223 30.63
2000‐01 to 2009‐10 1,12,900 6,866 42,158 5,846 1,67,790 32.70
Source: Based on DIPP, “Fact Sheet on Foreign Direct Investment (FDI)”, December 2009 and November 2010
and RBI Bulletin May 2010.
@ August 1991 to March 1992.
“+” (P) All figures are provisional and data in respect of ‘Re‐invested earnings’ & ‘Other capital’ for the years
2009‐2010 & 2010‐11 are estimated as averages of previous two years.
++ Data on equity capital of unincorporated bodies, reinvested earnings and other capital pertains to the period
from April 2009 to December 2009.
# Hereafter referred to as FDI Equity Inflows.
## Figures for equity capital of unincorporated bodies for 2009‐10 are estimates.
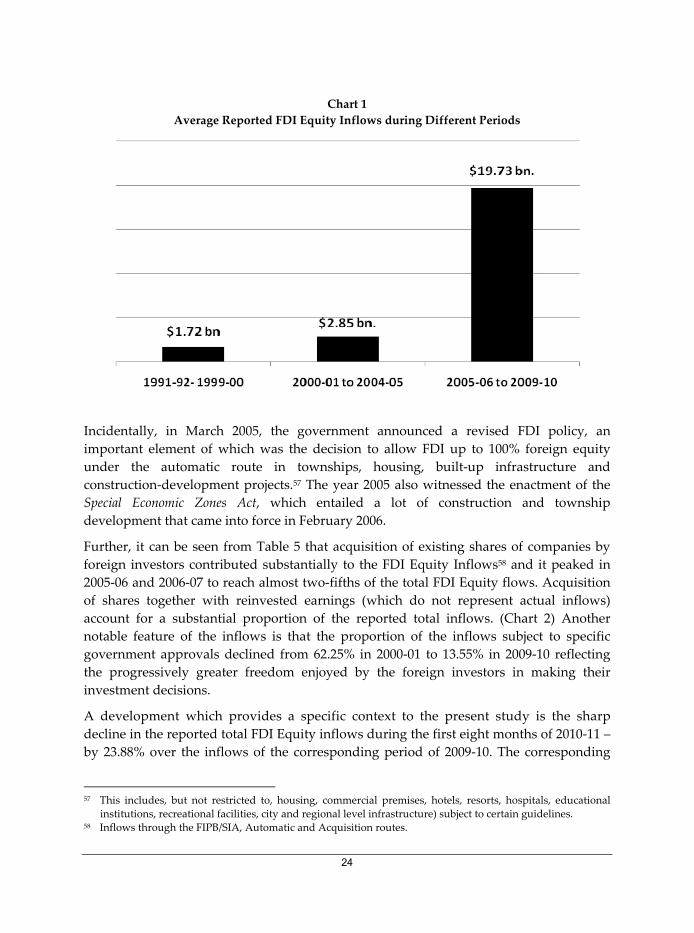
24
Chart 1
Average Reported FDI Equity Inflows during Different Periods
Incidentally, in March 2005, the government announced a revised FDI policy, an
important element of which was the decision to allow FDI up to 100% foreign equity
under the automatic route in townships, housing, built‐up infrastructure and
construction‐development projects.57 The year 2005 also witnessed the enactment of the
Special Economic Zones Act, which entailed a lot of construction and township
development that came into force in February 2006.
Further, it can be seen from Table 5 that acquisition of existing shares of companies by
foreign investors contributed substantially to the FDI Equity Inflows58 and it peaked in
2005‐06 and 2006‐07 to reach almost two‐fifths of the total FDI Equity flows. Acquisition
of shares together with reinvested earnings (which do not represent actual inflows)
account for a substantial proportion of the reported total inflows. (Chart 2) Another
notable feature of the inflows is that the proportion of the inflows subject to specific
government approvals declined from 62.25% in 2000‐01 to 13.55% in 2009‐10 reflecting
the progressively greater freedom enjoyed by the foreign investors in making their
investment decisions.
A development which provides a specific context to the present study is the sharp
decline in the reported total FDI Equity inflows during the first eight months of 2010‐11 –
by 23.88% over the inflows of the corresponding period of 2009‐10. The corresponding
57 This includes, but not restricted to, housing, commercial premises, hotels, resorts, hospitals, educational
institutions, recreational facilities, city and regional level infrastructure) subject to certain guidelines. 58 Inflows through the FIPB/SIA, Automatic and Acquisition routes.
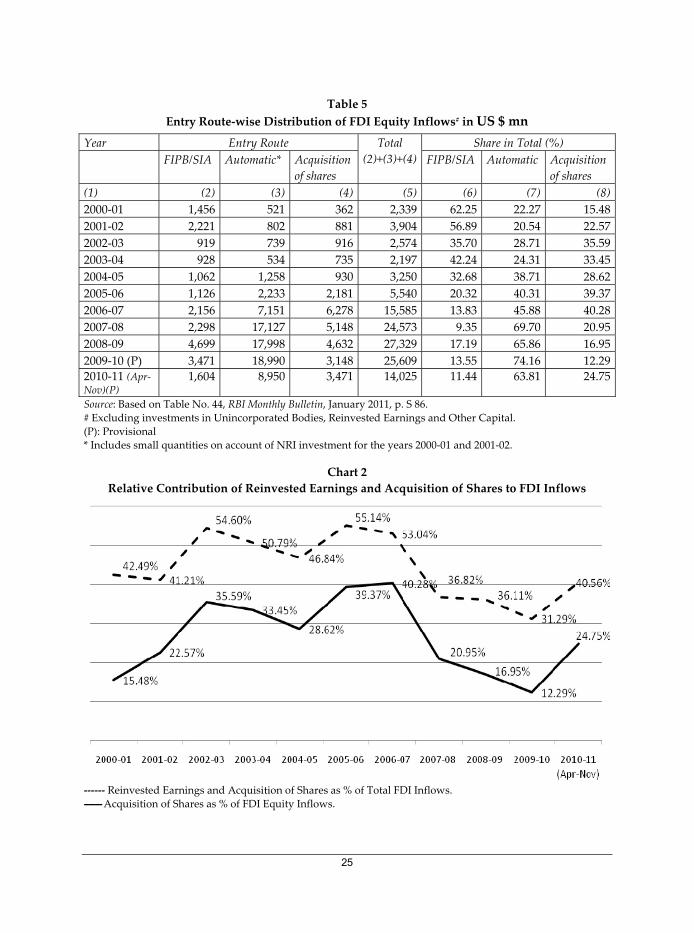
25
Table 5
Entry Route‐wise Distribution of FDI Equity Inflows# in US $ mn
Year Entry Route Total
(2)+(3)+(4)
Share in Total (%)
FIPB/SIA Automatic* Acquisition
of shares
FIPB/SIA Automatic Acquisition
of shares
(1) (2) (3) (4) (5) (6) (7) (8)
2000‐01 1,456 521 362 2,339 62.25 22.27 15.48
2001‐02 2,221 802 881 3,904 56.89 20.54 22.57
2002‐03 919 739 916 2,574 35.70 28.71 35.59
2003‐04 928 534 735 2,197 42.24 24.31 33.45
2004‐05 1,062 1,258 930 3,250 32.68 38.71 28.62
2005‐06 1,126 2,233 2,181 5,540 20.32 40.31 39.37
2006‐07 2,156 7,151 6,278 15,585 13.83 45.88 40.28
2007‐08 2,298 17,127 5,148 24,573 9.35 69.70 20.95
2008‐09 4,699 17,998 4,632 27,329 17.19 65.86 16.95
2009‐10 (P) 3,471 18,990 3,148 25,609 13.55 74.16 12.29
2010‐11 (Apr‐Nov)(P)
1,604 8,950 3,471 14,025 11.44 63.81 24.75
Source: Based on Table No. 44, RBI Monthly Bulletin, January 2011, p. S 86.
# Excluding investments in Unincorporated Bodies, Reinvested Earnings and Other Capital. (P): Provisional * Includes small quantities on account of NRI investment for the years 2000‐01 and 2001‐02.
Chart 2
Relative Contribution of Reinvested Earnings and Acquisition of Shares to FDI Inflows
‐‐‐‐‐‐ Reinvested Earnings and Acquisition of Shares as % of Total FDI Inflows.
‐‐‐‐‐‐‐ Acquisition of Shares as % of FDI Equity Inflows.
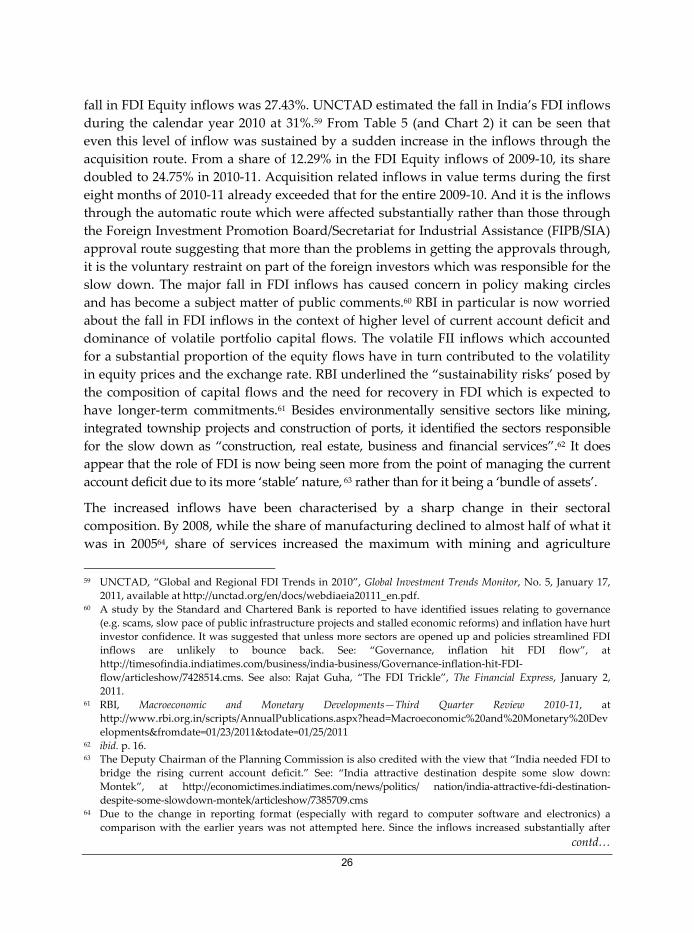
26
fall in FDI Equity inflows was 27.43%. UNCTAD estimated the fall in India’s FDI inflows
during the calendar year 2010 at 31%.59 From Table 5 (and Chart 2) it can be seen that
even this level of inflow was sustained by a sudden increase in the inflows through the
acquisition route. From a share of 12.29% in the FDI Equity inflows of 2009‐10, its share
doubled to 24.75% in 2010‐11. Acquisition related inflows in value terms during the first
eight months of 2010‐11 already exceeded that for the entire 2009‐10. And it is the inflows
through the automatic route which were affected substantially rather than those through
the Foreign Investment Promotion Board/Secretariat for Industrial Assistance (FIPB/SIA)
approval route suggesting that more than the problems in getting the approvals through,
it is the voluntary restraint on part of the foreign investors which was responsible for the
slow down. The major fall in FDI inflows has caused concern in policy making circles
and has become a subject matter of public comments.60 RBI in particular is now worried
about the fall in FDI inflows in the context of higher level of current account deficit and
dominance of volatile portfolio capital flows. The volatile FII inflows which accounted
for a substantial proportion of the equity flows have in turn contributed to the volatility
in equity prices and the exchange rate. RBI underlined the “sustainability risks’ posed by
the composition of capital flows and the need for recovery in FDI which is expected to
have longer‐term commitments.61 Besides environmentally sensitive sectors like mining,
integrated township projects and construction of ports, it identified the sectors responsible
for the slow down as “construction, real estate, business and financial services”.62 It does
appear that the role of FDI is now being seen more from the point of managing the current
account deficit due to its more ‘stable’ nature, 63 rather than for it being a ‘bundle of assets’.
The increased inflows have been characterised by a sharp change in their sectoral
composition. By 2008, while the share of manufacturing declined to almost half of what it
was in 200564, share of services increased the maximum with mining and agriculture
59 UNCTAD, “Global and Regional FDI Trends in 2010”, Global Investment Trends Monitor, No. 5, January 17,
2011, available at http://unctad.org/en/docs/webdiaeia20111_en.pdf. 60 A study by the Standard and Chartered Bank is reported to have identified issues relating to governance
(e.g. scams, slow pace of public infrastructure projects and stalled economic reforms) and inflation have hurt
investor confidence. It was suggested that unless more sectors are opened up and policies streamlined FDI
inflows are unlikely to bounce back. See: “Governance, inflation hit FDI flow”, at
http://timesofindia.indiatimes.com/business/india‐business/Governance‐inflation‐hit‐FDI‐
flow/articleshow/7428514.cms. See also: Rajat Guha, “The FDI Trickle”, The Financial Express, January 2,
2011. 61 RBI, Macroeconomic and Monetary Developments—Third Quarter Review 2010‐11, at
http://www.rbi.org.in/scripts/AnnualPublications.aspx?head=Macroeconomic%20and%20Monetary%20Dev
elopments&fromdate=01/23/2011&todate=01/25/2011 62 ibid. p. 16. 63 The Deputy Chairman of the Planning Commission is also credited with the view that “India needed FDI to
bridge the rising current account deficit.” See: “India attractive destination despite some slow down:
Montek”, at http://economictimes.indiatimes.com/news/politics/ nation/india‐attractive‐fdi‐destination‐
despite‐some‐slowdown‐montek/articleshow/7385709.cms 64 Due to the change in reporting format (especially with regard to computer software and electronics) a
comparison with the earlier years was not attempted here. Since the inflows increased substantially after
contd…
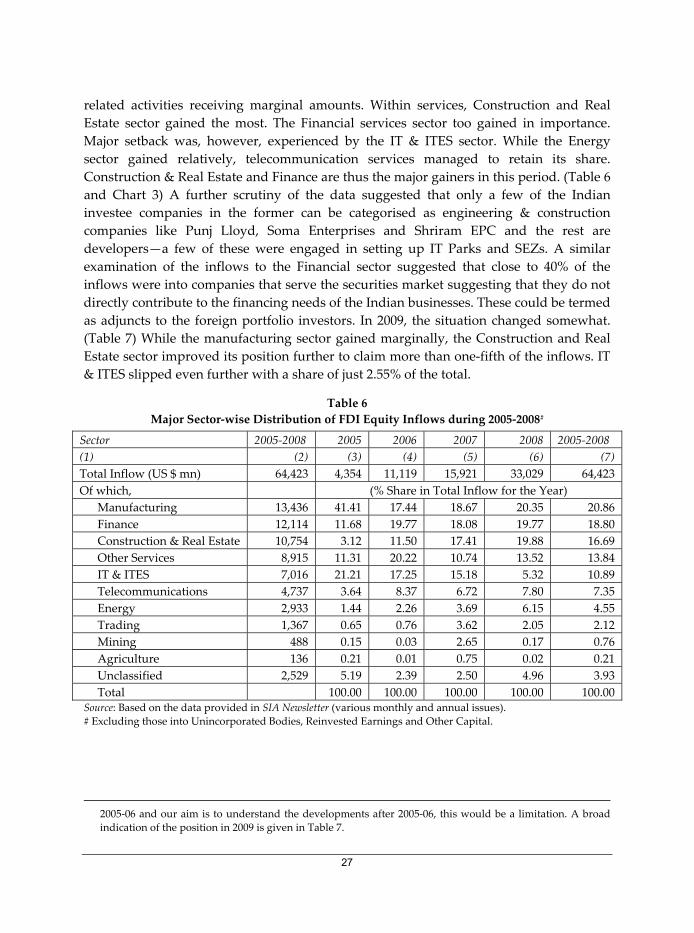
27
related activities receiving marginal amounts. Within services, Construction and Real
Estate sector gained the most. The Financial services sector too gained in importance.
Major setback was, however, experienced by the IT & ITES sector. While the Energy
sector gained relatively, telecommunication services managed to retain its share.
Construction & Real Estate and Finance are thus the major gainers in this period. (Table 6
and Chart 3) A further scrutiny of the data suggested that only a few of the Indian
investee companies in the former can be categorised as engineering & construction
companies like Punj Lloyd, Soma Enterprises and Shriram EPC and the rest are
developers—a few of these were engaged in setting up IT Parks and SEZs. A similar
examination of the inflows to the Financial sector suggested that close to 40% of the
inflows were into companies that serve the securities market suggesting that they do not
directly contribute to the financing needs of the Indian businesses. These could be termed
as adjuncts to the foreign portfolio investors. In 2009, the situation changed somewhat.
(Table 7) While the manufacturing sector gained marginally, the Construction and Real
Estate sector improved its position further to claim more than one‐fifth of the inflows. IT
& ITES slipped even further with a share of just 2.55% of the total.
Table 6
Major Sector‐wise Distribution of FDI Equity Inflows during 2005‐2008#
Sector 2005‐2008 2005 2006 2007 2008 2005‐2008
(1) (2) (3) (4) (5) (6) (7)
Total Inflow (US $ mn) 64,423 4,354 11,119 15,921 33,029 64,423
Of which, (% Share in Total Inflow for the Year)
Manufacturing 13,436 41.41 17.44 18.67 20.35 20.86
Finance 12,114 11.68 19.77 18.08 19.77 18.80
Construction & Real Estate 10,754 3.12 11.50 17.41 19.88 16.69
Other Services 8,915 11.31 20.22 10.74 13.52 13.84
IT & ITES 7,016 21.21 17.25 15.18 5.32 10.89
Telecommunications 4,737 3.64 8.37 6.72 7.80 7.35
Energy 2,933 1.44 2.26 3.69 6.15 4.55
Trading 1,367 0.65 0.76 3.62 2.05 2.12
Mining 488 0.15 0.03 2.65 0.17 0.76
Agriculture 136 0.21 0.01 0.75 0.02 0.21
Unclassified 2,529 5.19 2.39 2.50 4.96 3.93
Total 100.00 100.00 100.00 100.00 100.00 Source: Based on the data provided in SIA Newsletter (various monthly and annual issues).
# Excluding those into Unincorporated Bodies, Reinvested Earnings and Other Capital.
2005‐06 and our aim is to understand the developments after 2005‐06, this would be a limitation. A broad
indication of the position in 2009 is given in Table 7.
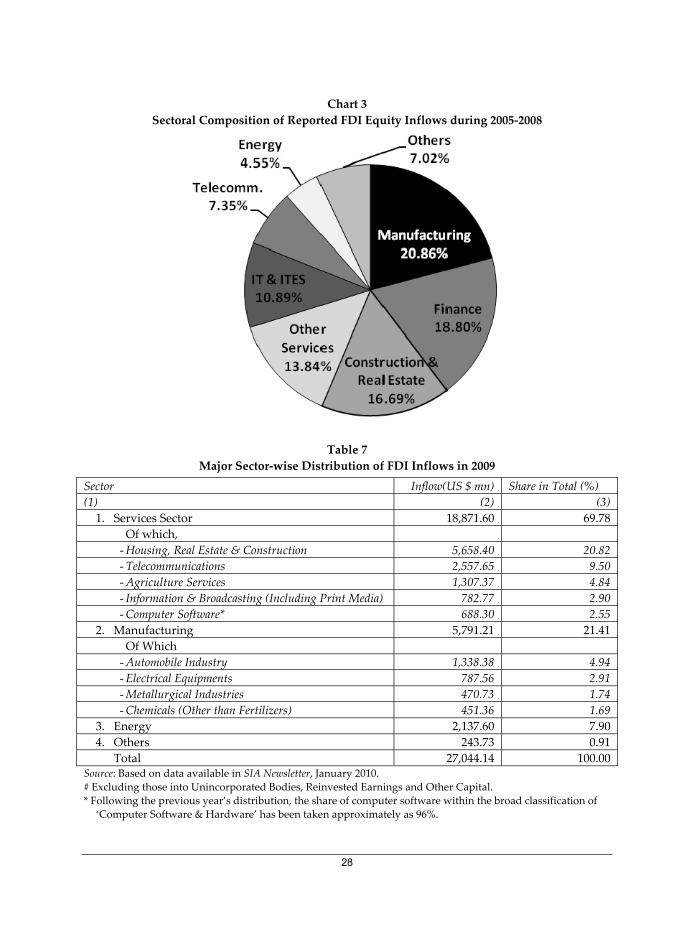
28
Chart 3
Sectoral Composition of Reported FDI Equity Inflows during 2005‐2008
Table 7
Major Sector‐wise Distribution of FDI Inflows in 2009
Sector Inflow(US $ mn) Share in Total (%)
(1) (2) (3)
1. Services Sector 18,871.60 69.78
Of which,
- Housing, Real Estate & Construction 5,658.40 20.82
- Telecommunications 2,557.65 9.50
- Agriculture Services 1,307.37 4.84
- Information & Broadcasting (Including Print Media) 782.77 2.90
- Computer Software* 688.30 2.55
2. Manufacturing 5,791.21 21.41
Of Which
- Automobile Industry 1,338.38 4.94
- Electrical Equipments 787.56 2.91
- Metallurgical Industries 470.73 1.74
- Chemicals (Other than Fertilizers) 451.36 1.69
3. Energy 2,137.60 7.90
4. Others 243.73 0.91
Total 27,044.14 100.00Source: Based on data available in SIA Newsletter, January 2010.
# Excluding those into Unincorporated Bodies, Reinvested Earnings and Other Capital.
* Following the previous year’s distribution, the share of computer software within the broad classification of
‘Computer Software & Hardware’ has been taken approximately as 96%.
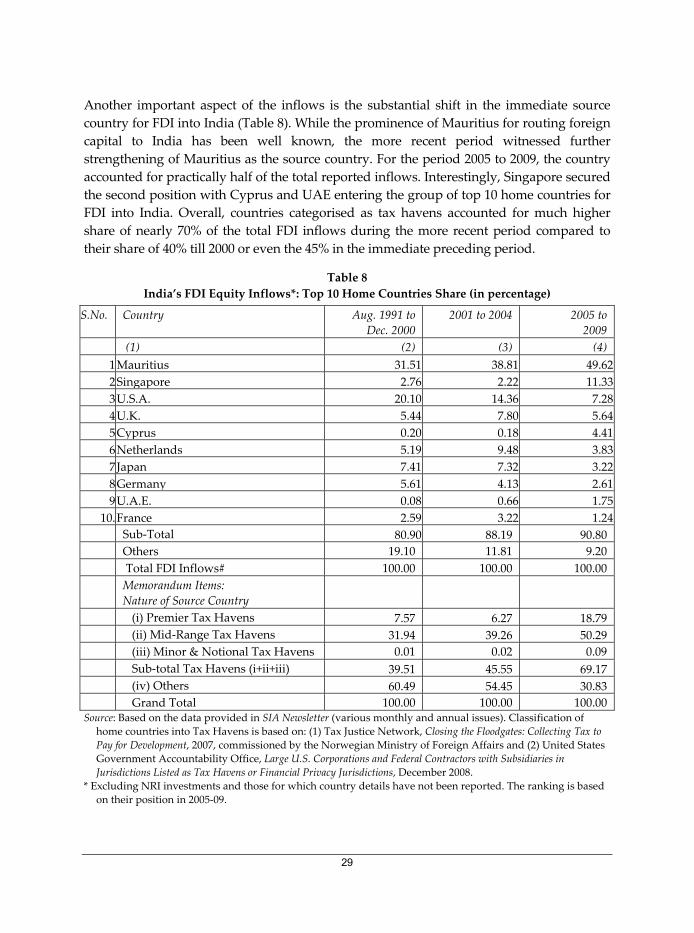
29
Another important aspect of the inflows is the substantial shift in the immediate source
country for FDI into India (Table 8). While the prominence of Mauritius for routing foreign
capital to India has been well known, the more recent period witnessed further
strengthening of Mauritius as the source country. For the period 2005 to 2009, the country
accounted for practically half of the total reported inflows. Interestingly, Singapore secured
the second position with Cyprus and UAE entering the group of top 10 home countries for
FDI into India. Overall, countries categorised as tax havens accounted for much higher
share of nearly 70% of the total FDI inflows during the more recent period compared to
their share of 40% till 2000 or even the 45% in the immediate preceding period.
Table 8
India’s FDI Equity Inflows*: Top 10 Home Countries Share (in percentage)
S.No. Country Aug. 1991 to
Dec. 2000
2001 to 2004 2005 to
2009
(1) (2) (3) (4)
1Mauritius 31.51 38.81 49.62
2Singapore 2.76 2.22 11.33
3U.S.A. 20.10 14.36 7.28
4U.K. 5.44 7.80 5.64
5Cyprus 0.20 0.18 4.41
6Netherlands 5.19 9.48 3.83
7Japan 7.41 7.32 3.22
8Germany 5.61 4.13 2.61
9U.A.E. 0.08 0.66 1.75
10.France 2.59 3.22 1.24
Sub‐Total 80.90 88.19 90.80
Others 19.10 11.81 9.20
Total FDI Inflows# 100.00 100.00 100.00
Memorandum Items:
Nature of Source Country
(i) Premier Tax Havens 7.57 6.27 18.79
(ii) Mid‐Range Tax Havens 31.94 39.26 50.29
(iii) Minor & Notional Tax Havens 0.01 0.02 0.09
Sub‐total Tax Havens (i+ii+iii) 39.51 45.55 69.17
(iv) Others 60.49 54.45 30.83
Grand Total 100.00 100.00 100.00Source: Based on the data provided in SIA Newsletter (various monthly and annual issues). Classification of
home countries into Tax Havens is based on: (1) Tax Justice Network, Closing the Floodgates: Collecting Tax to
Pay for Development, 2007, commissioned by the Norwegian Ministry of Foreign Affairs and (2) United States
Government Accountability Office, Large U.S. Corporations and Federal Contractors with Subsidiaries in
Jurisdictions Listed as Tax Havens or Financial Privacy Jurisdictions, December 2008.
* Excluding NRI investments and those for which country details have not been reported. The ranking is based
on their position in 2005‐09.
30
3.2 Analysis of Individual Inflows
To understand the above developments better, we now turn to data on individual
inflows reported for the period September 2004 ‐‐ December 2009 and analyse these by
the sector, home‐country type and nature of inflow route. A crucial element added by us
to the official data is classification of the foreign investors. To keep the exercise within
manageable limits while also retaining its representative character, we have chosen all
the inflows each amounting to US $ 5 mn or more.65 Out of the 29,233 reported inflows
through (i) Foreign Investment Promotion Board (FIPB)/Secretariat for Industrial
Assistance (SIA) approval route, (ii) automatic route and (iii) acquisition of existing
shares of Indian companies by foreign investors covering an investment of US $ 92.36 bn
(FDI Equity inflows), the relevant ones were 2,748. This data was taken from successive
issues of the SIA Newsletter.66 The 2,748 equity inflows accounted for $80.92 bn out of
$92.36 bn or 87.61% of the total inflows reported for the period by the SIA on its website.
Since these are individual inflows and a company could have received inflows more than
once during the period, we have tried to identify individual companies by taking into
account name changes that have occurred. We could thus identify 1,659 recipient
companies corresponding to these 2,748 cases of inflows.67 One major lacuna of this data
source is that it does not reveal the share of the foreign investor in the Indian investee
company. Since only a few of the 1,659 companies were listed on the Indian stock
exchanges, we could not independently ascertain the foreign shares in most cases.
From Table 9 it can be seen that the sectoral distribution of inflows represented by the
top 2,748 cases broadly corresponds to the overall distribution presented in Table 6. Only
about 15% of the selected inflows were subjected to a formal approval process. Overall,
about 21% of the inflows were on account of acquisition of existing shares by foreign
investors. This practice was, however, more prominent in the case of IT & ITES
companies. A word of caution is, however, called for in interpreting the data on
acquisitions as the inflows reported under this head could be under‐representing the
extent of acquisition of existing businesses by foreign investors in India.68 The inflows 65 It is quite possible that the same combination of foreign investor and Indian investee company might have
reported other inflows too but which were lower than $ 5mn each. These however, were not taken into
account in this exercise. 66 The individual elements of information on inflows are: name of the foreign investor, name of the country
from which the amount was remitted, name of the recipient Indian entity, product/activity of the venture,
inflow in Indian rupees and equivalent US $. The SIA Newsletter offers three lists, one each for FIPB/SIA
approvals, payment against acquisition of existing shares and inflows recorded by the RBI under the
automatic route. 67 The number of companies is only an approximation as we might not have been able to take note of all the
name changes in case of Indian investee companies. 68 Preliminary results of an ongoing study suggest that inflows into acquired companies accounted for a little
less than half of the total FDI inflows (other than that classified as portfolio/PE/VC/HF/round‐tripping, etc.)
into manufacturing companies See: K.S. Chalapati Rao and M.R. Murthy, “Location of FDI in India: A
Discussion of Some Less Explored Aspects”, paper presented in the international seminar The Globalization of
Production Models and Innovation in Emerging Economies: Comparative Research on Subnational Industrial Policies,
contd…
31
reported under this category should reflect purchase of shares of companies incorporated
in India in the process of their takeover by foreign companies. A few illustrative cases given
in Annexure A show that the reported data do not uniformly reflect this process. For
instance, the 2,748 large inflows selected by us for detailed examination have three
entries relating to Cementrum BV’s (Netherlands) investment in Mysore Cements Ltd.
Two entries are reported as being under the Acquisition Route and the third under the
Automatic Route. Possibly this is due to the fact that the former two relate to the transfer
of existing shares of Mysore Cements to Cementrum and in case of the third one, newly
created shares of Mysore Cements (expansion of capital) were issued to Cementrum.
Table 9
Sector and Entry Mode‐wise Distribution of Top 2,748 Reported FDI Inflows#
during September 2004 and December 2009
No. of
Companies
Inflow
(US $
mn)
Share in
Total (%)
Shares of Different Routes of Inflow (%)
FIPB/SIA
Approval
RBI
Automatic
Route
Acquisi
tion
Total
(1) (2) (3) (4) (5) (6) (7) (8)
Manufacturing 492 18,015 22.26 19.59 56.56 23.85 100.00
Services 1,084 54,739 67.65 14.81 65.87 19.32 100.00
Real Estate &
Construction
382 14,526 17.95 2.85 88.68 8.47 100.00
Financial 194 13,974 17.27 18.96 64.60 16.44 100.00
IT & ITES 147 8,283 10.24 10.44 43.73 45.83 100.00
Telecommunications 25 6,292 7.78 29.58 58.72 11.70 100.00
Other Infrastructure 50 4,364 5.39 7.08 64.65 28.26 100.00
Research &
Development
5 90 0.11 27.73 56.70 15.57 100.00
Other Services 281 7,209 8.91 27.50 54.92 17.58 100.00
Energy 75 6,251 7.72 3.57 81.06 15.37 100.00
Mining & Agriculture 8 1,911 2.36 1.23 30.01 68.75 100.00
Grand Total 1,659 80,915 100.00 14.68 64.13 21.19 100.00Source: Based on the actual inflows reported in the monthly issues of SIA Newsletter. # Each amounting to US $ 5 mn or more.
There is also the possibility of when a division/unit of an existing company was taken
over by a foreign company it may not always be reported as an acquisition by the same
company. What appears to have been followed is that when the foreign investor bought
the shares which were already held by another investor, it is treated as a case of
acquisition and when new shares of the target are issued to the same foreign investor
they are reported under the FIPB/SIA or Automatic Routes as the case may be. It is
held at the Institute for Studies in Industrial Development, New Delhi, during November 19–20, 2010.

32
obvious that both these type of inflows are related to a takeover of an Indian company.
There could be justification for treating them differently if fresh shares are issued after a
long gap when the foreign investor felt the need to infuse more funds to revive the
business or expand it. Further, for a proper assessment of the M&A situation in India, it
is essential to take note of the acquisition of specific business units of companies as
distinct from takeover of the companies themselves. A few illustrative such cases
involving foreign companies are listed in Table 10.69
Table 10
Illustrative Cases of Business Unit Transfers to FDI Companies
Acquirer Acquired Division of
Birla NGK Insulators Pvt Ltd Jayshree Insulator unit of Indian Rayon. & Industries
Ltd
EBG India Pvt Ltd (now Thyssen Krupp
Electrical Steel India Pvt Ltd)
Steel division of Raymond Ltd
FCB ‐ KCP Ltd Sugar Machinery Division of KCP Ltd
KBX Motorbike Products Pvt Ltd Kalyani Brakesʹ two‐wheeler brake production
Kirloskar Copeland Ltd Compressor manufacturing division of Kirloskar
Brothers Ltd
Lafarge Aggregates & Concrete (I) Pvt
Ltd
Concrete mix division of Larsen & Toubro Ltd
Lafarge India Pvt Ltd Tata Steelʹs Cement Plant
Lafarge India Pvt Ltd Cement division of Raymond Ltd
Lanxess India Pvt Ltd Chemicals & wind power business of Gwalior
Chemical Industries Ltd
Novozymes South Asia Pvt Ltd Enzymes business of Biocon
Osram India Pvt Ltd Lighting Davison of ECE Industries Ltd
Parry Monsanto Seeds Pvt Ltd Seeds division of EID Parry India Ltd
Raymond UCO Denim Pvt Ltd Denim unit of Raymond Ltd was transferred to the JV
Sinochem India Pvt Ltd Butachlor and alachlor businesses of Monsanto India
South Asia Tyres Ltd 2 & 3 ‐ wheeler tyre unit of Ceat.
Tecumseh Products India Pvt Ltd Compressor manufacturing unit of Shriram group
Thyssenkrupp ECE Elevator Pvt Ltd Elevator Division of ECE Industries Ltd
VE Commercial Vehicles Ltd LCV unit of Eicher Motors Ltd
Vetoquinol India Animal Health Pvt Ltd Animal healthcare business of Wockhardt Ltd
While the manufacturing sector stood at the top with the largest number of companies,
its share in the amount received was considerably lower. In terms of number of
recipients, Construction & Real Estate stood at the second position with as many as 382
69 This phenomenon was discussed earlier in some detail in S.K. Goyal, et. al., Foreign Investment Approvals and
Implementation Status: A Review (August 1991 – December 1994), Institute for Studies in Industrial
Development, March 1995.

33
companies. It is interesting to note that only a small proportion (2.85%) of the foreign
investment in Construction and Real Estate sector entered through the formal approval
route. The Financial sector also has a relatively better position both with regard to the
number of companies as also the inflows. While inflows to Mining & Agriculture sectors
were subject to least approval mechanism, their share in the total was quite low. The
Energy sector is also largely free from initial approval process. R&D (excluding the
companies covered in IT&ITES) attracted a miniscule share of the inflows represented by
the 2,748 cases.
In order to further understand the nature of reported FDI inflows, which could indicate
the possible behaviour of the foreign investors and their contribution to enterprise
development, we have classified the foreign investors into different categories keeping in
mind the discussion on concepts presented in Section II. The classification heavily relied
upon of websites of companies, newspapers, analysts, professional bodies, consultants,
investment advisers, etc. as also and ISID Press Clippings archives. Foreign companies
which invested in their own area of functioning irrespective of the sector they are
engaged in have been categorised as FDI investors.70 This is because an investor investing
in his own line of activity could directly contribute to the functioning of the investee
company. Since it was not possible to get the foreign share in each of the companies, all
those cases were uniformly treated as FDI. Since there could be some passive
investments, our estimate of FDI could be on the higher side. All individual investors
whose names suggest that they could be of Indian origin and companies known to have
been promoted by them are termed as NRIs. Investments by banks and other financial
intermediaries (unless these are in their own respective sectors) are termed as Other
Portfolio investments as the main objective of such investments could be capital gains
and they on their own may not be able to add directly to the functioning of the domestic
investee company. For instance, a bank investing in a manufacturing company is
identified as a portfolio investor (e.g., investments of HSBC Bank and Royal Bank of
Scotland in Reliance Ports and Terminals Ltd). This is because their involvement could at
best be like a financial investor who (whether domestic or foreign) might seek
representation on the recipient company’s board in case of substantial investments. The
same, however, is classified as FDI in case the recipient Indian entity is a bank. Other
portfolio investors known to be in the private equity/venture capital activity, hedge
funds or sovereign wealth funds (SWF) have been classified as PE/VC/HF investors.71
There have been some important cases where no specific information was available from
70 However, cases like Cargill Holdings BV investing in Cargill Capital & Financial Services Pvt Ltd. and HPFS
Venture Holdings Ltd. investing in Hewlett Packard Financial Services (India) Pvt Ltd. are also treated as
FDI. 71 While venture capital is a subset of private equity and has a different connotation in respect of risky and
high technology ventures, available information does not enable an easy and clearcut distinction between
the two. Hence these are very often referred to together.
34
any source. The classification of such investments took into account the circumstances of
the investment and as such there could be some subjective element.72
Inflows by those who have their main base in India and who have expanded out of India
have been treated as cases of Round‐tripping. This is irrespective of whether the money
brought in by them is raised abroad from other investors, might have been taken out from
India by them at some point in the past or generated out of their past foreign investments. In
a way this is expected to reflect the fact that control over the investee company remains with
Indians who have strong base in India and except for capital inflow there would not be any
additionality in terms of foreign management expertise, technology, etc. Apart from the well‐
known cases of Essar group, Zee Tele group and Vedanta/Sterlite group, we could identify
some more with the help of internet. For instance, Biometrix Marketing Pvt Ltd of Singapore
is a subsidiary of Reliance Genemedix PLC (which the Reliance Life Sciences group took over
in early 2007). In view of this, the investments of Biometrix in Reliance Ports & Terminals Ltd,
Relogistics Infrastructure, Reliance Utilities Ltd and Reliance Gas Transportation
Infrastructure Ltd have been put under the round‐tripping category by us. The investments
by Ballarpur Paper Holding BV and NQC Global (Mauritius) Ltd in Bilt Graphic Paper
Products Ltd and Bilt Paper Holdings Ltd respectively were also placed in this category.
Similar is the case with the investments by Ishaan Real Estate and Unitech Corporate Parks
(See Annexure B for an illustrative list and Annexures C1, C2 & C3 for diagrammatic
representation of three sets of companies).73 We have also classified the investment of Hitech
Infra Ltd (Mauritius) in Krishnapatnam Port Co Ltd (KPCL) as a case of Round‐tripping.74
72 A relevant case is that of Travorto Holdings Ltd of Cyprus which is reported to have invested `1,418 crore in
Tata Capital Ltd. Neither a perusal of the prospectus nor a search of the internet or even the documents filed
by Tata Capital with the ROC (available on the Ministry of Corporate Affairs website) yielded any details of
the foreign investor. It could be any thing: A PE/VC investor, a case of round‐tripping or simple portfolio
capital seeking good return or FDI by a foreign financial institution. We have classified it as portfolio
investment. Another important case is that of Gypsy Rover (or Gytsy Rover?), a foreign investor in BPL
Mobile communication Ltd., about which only suggestive information is available but no confirmation
could be made. Given the circumstances in which it was made, we have treated it as a case of round‐
tripping. See for instance: “Gypsy Rover Mystery Deepens” at
http://economictimes.indiatimes.com/articleshow/3830644.cms?prtpage=1.
Another case which we could finally trace as an OCB belonging to Mr. P.K. Jani and his associates is that of
Satin Ltd of British Virginia, a non‐promoter shareholder of Standard Industries Ltd with 38.86% share in
equity. 73 Here too one finds the leading international audit firms playing multiple roles. 74 It has been reported that Hitech Infra had common directors with KPCL and that it had borrowed funds
from the Bahrain branch of ICICI. The proposal was reported to have been approved by the FIPB overruling
the objections raised by the Department of Revenue in the Ministry of Finance. See:
http://steelguru.com/news/index/Njg5Mjk%3D/
FIPB_approves_Hitech_Infra_investment_in_Krishnapatnam_Port%250D%250A.html (accessed last on May
21, 2010). KPCL also received investment from (i) Chinta Investment Private Co Ltd; (ii) CVR Investments
Pvt Co Ltd; and (iii) Navaneeta Investments Pvt Co. Ltd (all of Mauritius) for which post‐facto approval was
given by the Government. Incidentally, the group is known as CVR Group (after the founder’s name C.
Visweswara Rao) and Chinta is the surname of the promoter family. Two of the Indian shareholders of the
company are: Navaneeta Agriculture Development Co Ltd and Navaneeta Agritech Pvt Ltd. (See the
contd…
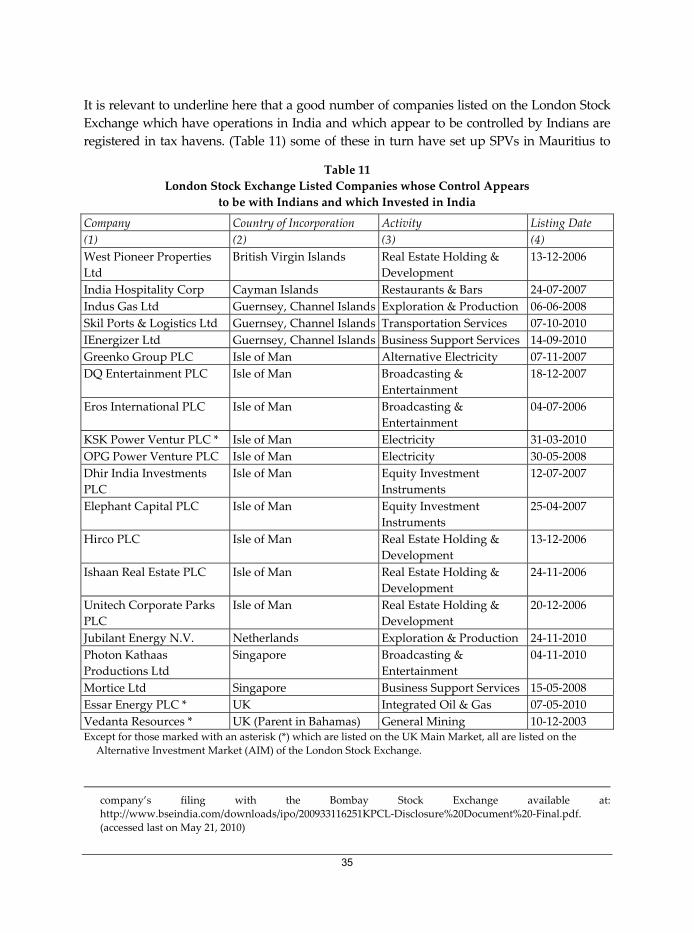
35
It is relevant to underline here that a good number of companies listed on the London Stock
Exchange which have operations in India and which appear to be controlled by Indians are
registered in tax havens. (Table 11) some of these in turn have set up SPVs in Mauritius to
Table 11
London Stock Exchange Listed Companies whose Control Appears
to be with Indians and which Invested in India
Company Country of Incorporation Activity Listing Date
(1) (2) (3) (4)
West Pioneer Properties
Ltd
British Virgin Islands Real Estate Holding &
Development
13‐12‐2006
India Hospitality Corp Cayman Islands Restaurants & Bars 24‐07‐2007
Indus Gas Ltd Guernsey, Channel Islands Exploration & Production 06‐06‐2008
Skil Ports & Logistics Ltd Guernsey, Channel Islands Transportation Services 07‐10‐2010
IEnergizer Ltd Guernsey, Channel Islands Business Support Services 14‐09‐2010
Greenko Group PLC Isle of Man Alternative Electricity 07‐11‐2007
DQ Entertainment PLC Isle of Man Broadcasting &
Entertainment
18‐12‐2007
Eros International PLC Isle of Man Broadcasting &
Entertainment
04‐07‐2006
KSK Power Ventur PLC * Isle of Man Electricity 31‐03‐2010
OPG Power Venture PLC Isle of Man Electricity 30‐05‐2008
Dhir India Investments
PLC
Isle of Man Equity Investment
Instruments
12‐07‐2007
Elephant Capital PLC Isle of Man Equity Investment
Instruments
25‐04‐2007
Hirco PLC Isle of Man Real Estate Holding &
Development
13‐12‐2006
Ishaan Real Estate PLC Isle of Man Real Estate Holding &
Development
24‐11‐2006
Unitech Corporate Parks
PLC
Isle of Man Real Estate Holding &
Development
20‐12‐2006
Jubilant Energy N.V. Netherlands Exploration & Production 24‐11‐2010
Photon Kathaas
Productions Ltd
Singapore Broadcasting &
Entertainment
04‐11‐2010
Mortice Ltd Singapore Business Support Services 15‐05‐2008
Essar Energy PLC * UK Integrated Oil & Gas 07‐05‐2010
Vedanta Resources * UK (Parent in Bahamas) General Mining 10‐12‐2003 Except for those marked with an asterisk (*) which are listed on the UK Main Market, all are listed on the
Alternative Investment Market (AIM) of the London Stock Exchange.
company’s filing with the Bombay Stock Exchange available at:
http://www.bseindia.com/downloads/ipo/200933116251KPCL‐Disclosure%20Document%20‐Final.pdf.
(accessed last on May 21, 2010)

36
invest in India. While we do not know how the shareholding of the founders was financed, in
a few cases institutional investors appear prominently in the list of shareholders. To that
extent, it suggests that FII funds instead of coming directly into the Indian stock market, in
which case they would have been classified as portfolio capital, are coming via the LSE listed
companies into India as FDI. Had they subscribed to GDR/ADRs of Indian companies, the
funds would again have been classified as foreign portfolio inflows. This was the case with
some other non‐Indian controlled LSE listed companies as well. As we shall see later, since a
good part of such inflows was not subjected to the FIPB/SIA route, one could say that it is
neither subjected to FII nor FDI regulations.
Going by the foregoing criteria, out of the total $81 bn inflows under study less than half can
be termed as FDI. The next most important category is PE/VC/HF with almost 27% in the
total followed by the Round‐tripping variety with a share of about 10%. It needs to be
specified here that Round‐tripping investments which also have the characteristics of
PE/VC/HF have been clubbed with total PE/VC/HF investments. If these are also taken into
account, the share of Round‐tripping investments will work out to about 14% of the total.
Other portfolio investments work out to a little more than 9% and NRI investments, some of
which can be termed as portfolio investments, are about 5% of the total. What strikes one
most is that PE/VC/HFs were more important in case of the services sector compared to the
manufacturing sector. (Table 12 and Chart 4) Within the services, they were more important
for the Construction & Real Estate sector. What could be termed as FDI accounts for only 13%
Table 12
Sector and Type of Foreign Investor‐wise Distribution of Top 2,748 Inflows
Sector Total Inflow(US $ mn)
Share of Different Types of Foreign Investors (%)
FDI Other Portfolio
PE/VC/HF #
Round Tripping Only
NRI Unclassified
Total
(1) (2) (3) (4) (5) (6) (7) (8) (9)Total 80,915 47.85 9.25 26.91 10.30 5.22 0.48 100.00
A. Manufacturing 18,015 61.57 8.82 15.48 8.05 5.47 0.61 100.00B. Services 54,739 44.06 8.51 31.80 9.85 5.28 0.49 100.00
Construction & Real Estate
14,526 12.82 9.77 58.17 13.25 4.43 1.56 100.00
Financial 13,974 58.70 5.11 29.09 2.62 4.28 0.21 100.00
IT & ITES 8,283 61.35 2.85 19.95 1.19 14.66 0.00 100.00Telecommunications 6,292 80.75 3.79 7.66 7.80 0.00 0.00 100.00
Other Infrastructure 4,364 14.11 29.60 13.15 38.19 4.96 0.00 100.00Research & Development
90 56.87 0.00 43.13 0.00 0.00 0.00 100.00
Other Services 7,209 44.72 10.55 29.79 11.71 3.03 0.19 100.00C. Energy 6,251 36.08 19.10 18.72 20.47 5.52 0.10 100.00
D. Mining & Agriculture
1,911 65.42 1.99 21.43 11.16 0.00 0.00 100.00
Source: See Table 9.
# includes investment that could be categorised as round‐tripping.
37
Chart 4
Type of Investor‐wise Distribution of Top 2,748 Inflows
of the inflows into this sector.75 This sector’s inflows are also important for Round‐tripping
investment. Most of the investment in the Telecommunications sector is in the form of FDI.
Understandably, the R&D sector (excluding the IT&ITES) received investment only from two
types of investors: either FDI or PE/VC/HF. Other infrastructure sectors depended heavily on
portfolio or Round‐tripping investment. In a way, this might be suggestive of the position
that in most of the infrastructure sectors foreign investment offered little except for financial
resources. The financial sector too was exposed to a large proportion of PE/VC/HF
investments and portfolio capital.
While FDI accounted for less than half of the total inflows studied, only a little more than one‐
fourth of it went into the Manufacturing sector which means that manufacturing FDI accounted
for just about 14% of the total reported inflows during the period. (Table 13) A good percentage
of it went into Financial services (21.19%), IT&ITES (13.12%) and Telecommunications (13.12%).
Important recipients of portfolio capital are manufacturing (21.25%), Construction and Real
Estate (18.97%), other infrastructure (17.26%) and Energy (15.96%). Construction and Real
Estate sector had the lion’s share of investments by PE/VC/HFs with 38.8% share followed by
Financial Services with 18.67%. The Manufacturing Sector received 12.81% of their investment.
Prominent recipients of Round‐tripping investment are Construction and Real Estate (23.10%),
Other Infrastructure (20%) and Energy (15.22%). While 80% of the PE/VC/HF investment is in
the Services sector, Construction and Real Estate alone accounted for 38.80% of the total
followed by the financial sector with 18.67%. Though total Round Tripping investments were
slightly more evenly distributed compared to PE/VC/HF investments, nearly 70% of it is in
services with Construction and Real Estate alone claiming one‐third. Interestingly, 60% of the
75 This is by companies like EMAAR of UAE and Capitaland of Singapore.
38
investment that could simultaneously be classified as both PE/VC/HF and Round‐tripping
went into the Construction and Real Estate sector. (Chart 5)
Table 13
Sectoral Distribution of Various Types of Top 2,748 Inflows (in Percentages)
Sector FDI Portfolio PE/VC/HF(incl. Round Tripping)
Round Tripped PE/VC/HF
Round Tripping (excl. PE/VC/HF)
Round Tripping Total
NRI
(1) (2) (3) (4) (5) (6) (7) (8)
Manufacturing 28.65 21.25 12.81 10.84 17.40 15.56 23.35
Services 62.30 62.29 79.94 85.19 64.69 70.45 68.48
Construction & Real Estate 4.81 18.97 38.80 60.11 23.10 33.49 15.25
Financial 21.19 9.54 18.67 9.85 4.39 5.92 14.16
IT & ITES 13.12 3.16 7.59 1.75 1.18 1.34 28.77
Telecommunications 13.12 3.19 2.21 3.23 5.89 15.29 0.00
Other Infrastructure 1.59 17.26 2.63 0.38 20.00 4.34 5.12
Research & Development 0.13 0.00 0.18 0.00 0.00 0.00 0.00
Other Services 8.33 10.17 9.86 9.88 10.13 10.06 5.18
Energy 5.83 15.96 5.37 3.96 15.36 12.16 8.18
Mining & Agriculture 3.23 0.51 1.88 0.00 2.56 1.84 0.00
Grand Total 100.00 100.00 100.00 100.00 100.00 100.00 100.00
Source: See Table 9. Note: Unclassified ones are not shown here.
Chart 5
Sectoral Composition of Private Equity and Round‐Tripped Investments

39
Interestingly, almost three‐fourths of the PE/VC/HF capital which is a prominent source for
the Construction & Real Estate sector, came through the automatic route. A further 17%
followed the acquisition route with only about 9% being subjected to government
approval. (Table 14 and Chart 6) Similar is the case with the inflow that could be termed as
Round‐tripping. One‐third of the Other Portfolio capital took the acquisition route thereby
suggesting that much of it was not adding to the existing investment. In any case, it is
unlikely to be interested in/capable of directly contributing to enhance the functioning of
the investee companies. While the proportion of inflows that are subject to a formal
approval process is generally low, the proportion surprisingly is the highest for FDI. It does
appear that an overwhelming portion of the foreign investment made under categories
other than FDI does not go through a formal approval process. At 36%, non‐acquisition
type FDI accounts for only a shade over one‐third of the total report equity inflows.
Table 14
Foreign Investor‐wise and Entry Route‐wise Distribution of the 2,748 FDI Inflows
in Percentages
Type of Foreign Investor Total Inflow
($ mn)
FIPB/SIA
Approval
RBI Automatic Acquisition Total
(1) (2) (3) (4) (5) (6)
FDI 38,717 22.77 52.99 24.25 100.00
Portfolio 7,481 3.89 62.55 33.56 100.00
PE/VC/HF (incl. RT) 21,778 8.94 74.07 17.00 100.00
Round Tripping (excl.
PE/VC/HF)
8,333 8.35 73.70 17.95 100.00
NRI 4,222 1.65 97.12 1.23 100.00
Unclassified 385 16.39 83.61 0.00 100.00
Grand Total 80,915 14.68 64.13 21.19 100.00 Source: See Table 9.
Chart 6
Share of Inflows subjected to Specific Government Approvals for Different Types of Inflows
40
An important and well‐recognised dimension of India’s FDI is the fact of foreign
investors’ extensive use of recognized tax havens for entry into India. Table 15 (and Chart
7) presents the use of such countries by different categories of foreign investors. In a
number of cases, predominantly NRIs and acquisition cases, the data source did not
report the country of the foreign investor. For purposes of this exercise, such cases had to
be excluded. While in the overall, the share of tax havens conforms to the general pattern,
it is apparent that the route is exploited more by investors under the PE/VC/HF and
Table 15
Type of Foreign Investor‐wise and Source Country Type‐wise Distribution
of the 2,748 FDI Equity Inflows
Type of Foreign
Investor
Total
Inflow
($ mn)
Of which Share of Different Types of Source Countries (%)
(classified investments only)
Classified* Unidentified Premier Tax
Havens
Other Tax
Havens
Other
Countries
Total
Classified
(1) (2) (3) (4) (5) (6) (7) (8)
FDI 38,717 34,874 3,843 15.93 46.27 37.80 100.00
Portfolio 7,481 4,552 2,929 25.73 31.67 42.60 100.00
PE/VC/HF incl.
Round‐Tripping
21,778 20,985 793 15.84 72.86 11.30 100.00
PE/VC/HF & RT 3,252 3,134 98 7.23 91.99 0.78 100.00
Round Tripping
(excl.
PE/VC/HF)
8,333 7,508 825 30.07 59.59 10.34 100.00
NRI 4,222 1,444 2,778 50.94 1.98 47.07 100.00
Unclassified 385 375 10 40.16 48.75 11.09 100.00
Grand Total 80,915 69,737 11,179 18.92 53.85 27.23 100.00Source: See Table 9.
* Excluding the cases where the country of the foreign investor was not identified. These mostly involved the
acquisition of existing shares and NRIs. For the basis of country classification, see: Table 8.
Chart 7
Share of Tax Havens in the Inflows by Different Types of Investors
41
Round‐tripping categories. Further from Table 16 (and Chart 8) it can be seen that
Telecommunications, Construction and Real Estate activities as also IT/ITES extensively
used the tax havens which by all indications could not be the primary home countries.
Manufacturing and Energy sectors used this route to the least extent. Practically the
entire amount that is Round‐tripped by Indian PE/VC/HF investors came through tax‐
havens as indicated by Bain & Co and cited in Section II.
Table 16
Sector‐wise and Source Country Type‐wise Distribution of FDI Inflows
Sector Identified
Inflows *
($ mn)
Share of Different Types of Source Countries (%)
Premier Tax
Havens
Other Tax
Havens
Other
Countries
Total
(1) (2) (3) (4) (5) (6)
Manufacturing 14,484 17.15 32.21 50.64 100.00
Services 49,399 19.72 62.51 17.78 100.00
Construction & Real Estate 13,256 15.71 74.19 10.10 100.00
Financial 12,683 23.12 54.38 22.50 100.00
IT & ITES 7,481 17.13 72.83 10.03 100.00
Telecommunications 5,742 9.39 84.90 5.72 100.00
Other Infrastructure 3,516 48.33 22.90 28.77 100.00
Research & Development 90 0.00 58.76 41.24 100.00
Other Services 6,630 18.17 44.71 37.12 100.00
Energy 5,283 11.10 34.96 53.94 100.00
Primary 572 67.19 28.68 4.12 100.00
Grand Total 69,736 18.92 53.85 27.23 100.00
Source: See Table 9. * Excluding the cases where the country of the foreign investor was not identified. These mostly involved the
acquisition of existing shares and NRIs. For the basis of country classification, see: Table 8.
Chart 8
Share of Tax Havens in the FDI Equity Inflows of Different Sectors
42
3.3 Other Aspects
Apart from these broad but important characteristics of the inflows, we did come across
certain aspects of the reported inflows which suggest that the reported inflows may not
strictly conform to the international practice of identifying an FDI relationship. For
instance, some of the reported inflows into listed companies did not appear among the
shareholders with at least 1% shareholding either because they had already withdrawn
their investment or their share (either initially or remaining at the end of December 2008)
amounted to less than 1% of the investee company’s equity capital.76 Further evidence to
the fact that not all inflows would qualify to be FDI in the sense that is normally
understood is provided in Table 17 and Table 18. The foreign investors shown in Table
17, most of which are evidently investment companies/fund managers do not qualify as
FDI even on the basis of the percentage of shares held by them. We have classified these
investments under PE/VC/HF or portfolio categories as the case may be. It would be
difficult to visualize that ‘Various FIIs’ and NRIs would exhibit the characteristics
associated with foreign direct investors. Similar is the case with the individuals shown in
Table 19 who probably subscribed to the shares of a housing project. It is highly unlikely
that anyone of them would be holding a stake that would exert significant influence on
the management of Home Sweet Home Developers Ltd.
Further, irrespective of the perspective regarding PE/VC/HF investments, it is difficult to
visualize the types of inflows shown in Tables 18 & 19 and the ESOPs given to the
employees of HCL Technologies Ltd, as FDI. Even going by the internationally adopted
criteria all these inflows should have been treated as portfolio capital. This opens up a
critical aspect of reporting of FDI data in India. Irrespective of the share of such inflows
in the total reported FDI, these examples are important because they illustrate that India
has not been looking for the critical aspects of internationally propagated FDI definition
in classifying the inflows. While international best practices are sought to be followed,
the critical aspects of minimum qualifying share in equity capital, ability to significantly
influence management and lasting interest may not have been taken into consideration
while compiling India’s FDI statistics. This was evident from the discussion presented in
Section II.
Merely looking for 10% share of a single foreign shareholder for identifying an FDI
company, which the RBI seems to have followed for its studies on Finances of FDI
Companies, without taking into consideration that could be a portfolio investor
(including an FII) opens up the possibility of classifying the companies listed in Table 20
as FDI companies. It would be difficult to visualise that these can exhibit the
characteristics associated with an FDI company and that the foreign shareholder would
contribute anything more than risk capital (if the shares were acquired in the secondary
76 There is, however, a possibility that some of the foreign investors might have subscribed to convertible
preference shares/bonds which could get reflected in the equity after conversion.
43
Table 17
Reported FDI inflow into Some Listed Companies
Indian Company Foreign Investor Inflow Route &
Month and Year
of Reporting
Share (%)
in Equity
Capital as
on
31‐12‐2008
(1) (2) (3) (4)
ABG Shipyard Ltd Merlion India Fund I Ltd R‐Oct.2005 8.76
Allcargo Global Logistic Ltd New Vernon Pvt Equity Ltd R‐Oct.2006 3.81
Anant Raj Industries Ltd Master Trust Bank of Japan Ltd.
A/c HSBC Indian Equity Mother
Fund
R‐Apr‐Sep.
2006
1.36
Anant Raj Industries Ltd Quantum (M) Ltd R‐Apr.2008 1.50
Anant Raj Industries Ltd Lehman Brothers Asia Ltd R‐Apr‐
Sep.2006
1.82
Bharat Hotels Ltd Dubai Ventures Ltd R‐May.2008 5.00
Dalmia Cement (Bharat) Ltd Boron (I) Ltd R‐Oct.2006 4.42
Development Credit Bank
Ltd
GRA Finance Corpn. Ltd. R‐Dec.2007 1.87
Edelweiss Capital Ltd Lehman Brothers Netherlands
Horizon BV
R‐Feb.2008 1.80
Edelweiss Capital Ltd Shuaa Capital Psc R‐Feb.2008 2.20
Hexaware Technologies Ltd GA Global Investments Ltd R‐Nov.2007 7.36
Indiabulls Financial Services
Ltd
Deutsche Bank Trust Company R‐ Aug.2005 1.31
Jindal Poly Films Ltd SAIF II Mauritius Co Ltd AC‐Apr‐Sep.
2006
6.66
JK Paper Ltd International Finance Corp R‐Apr‐Sep.2006 9.84
Jubilant Organosys Ltd GA European Investments Ltd AC‐Jul.2005 7.93
KPR Mill Ltd Ares Investments R‐Feb.2007 6.78
Punj Lloyd Ltd Merlion India Fund III Ltd R‐Dec.2005 3.19
Sarda Energy & Minerals
Ltd
LB India Holdings Mauritius Ii Ltd R‐Mar.2008 7.73
Torrent Pharmaceuticals Ltd GPC Mauritius AC‐Oct.2007
& AC‐Jan.2008
4.83
Yes Bank Ltd Orient Global Tamrind Fund Pte
Ltd
R‐Apr.2008 4.95
Source: Company‐wise details of FDI inflows reported in the SIA Newsletter, various issues. The Shares in equity
capital of the respective companies shown in column (4) are taken from the Bombay Stock Exchange website.
In Column (3) ‘R’ indicates that the inflow was through the Automatic Route and ‘AC’ indicates the Acquisition of
existing shares by the foreign investor.
44
Table 18
Illustrative List of Reported Inflows which do not Qualify as FDI
Indian Company Foreign Investor Reporting Month # Inflow (` Cr.)
(1) (2) (3) (4)
Akruti Nirman Ltd Various Apr.2007 155.34
Arshhiya Technologies Various FIIs May2008 350.00
Bajaj Auto Finance Ltd Various Oct.2007 157.50
Bajaj Auto Finance Ltd Various NRIs Dec.2007 126.48
Bharat Earth Movers Ltd 42 FIIs Jan.2008 147.15
Gitanjali Gems Ltd Various NRIs/FIIs Nov.2007 109.11
Hindalco Industries Ltd Various Feb.2008 666.58
Hindustan Oil Exploration Co Ltd Various NRIs/FIIs Sep.2008 220.36
Housing Development &
Infrastructure Ltd
Various May2008 706.67
IRB Infrastructure Developers Ltd Various IPO Sep.2008 476.61
Kotak Mahindra Bank Ltd Various Feb.2008 1,615.00
Mahindra & Mahindra Ltd Various FFI,FC, FFI ApSep.2006 260.63
Mahindra Gesco Developers Ltd Various Jun.2007 324.08
Mercator Lines Ltd Various FIIs May2008 196.97
Mercator Lines Ltd Various NRIs May2008 21.56
Mundra Port and SEZ Ltd Various NRIs/FIIs Feb.2008 710.57
Panacea Biotec Ltd As Per List Attached Nov.2006 118.31
Panacea Biotec Ltd As Per List Nov.2006 101.59
Phoenix Mills Ltd Various FIIs Dec.2007 317.72
Reliance Communications Ltd Various FIIs May2008 845.48
Sterlite Industries Ltd Various NRIs Oct.2007 1,667.64
Tata Consultancy Services Ltd Group of Non‐Resident Mar.2006 2,148.61
Tech Mahindra Ltd Various Jul.2007 171.97
Welspun Gujarat Stahl Rohren Ltd Various FIIs Feb.2008 302.15
Zee Telefilms Ltd Various Investors Apr.2008 152.49
Source: Company‐wise details of FDI inflows reported in the SIA Newsletter, various issues.
# All these inflows were through the Automatic Route.
Table 19
Reported FDI Inflows on account of Home Sweet Home Developers Ltd.
Name of the Foreign Investor Inflow (` mn) Name of the Foreign Investor Inflow (` mn)
Archana Vadya 0.01 Satya Kavachri 0.01
Ashish Srivastava 0.01 Satya Simha Prasad 0.01
Baiju Anand G Nair 0.01 Senthil Palanisamy 0.01
Brajesh Goyal 0.01 Shiddalingnagouda Rati 0.01
C.Sivanandan 0.01 Srikanth Patibanda 0.01
Devi Prasad Ivaturi 0.01 Srikumar Gopakumar 0.01
45
Name of the Foreign Investor Inflow (` mn) Name of the Foreign Investor Inflow (` mn)
Eswar Vemulapalli 0.01 Srinivasu Sudireddi 0.01
Jayakrishnan Radhakrishnan 0.01 Srinvasa R Gaddamadugu 0.01
Krishna Kumar Vavilala 0.01 Sukir Kumaresan 0.01
Lakkoji 0.01 Venkateshwarlu Ravikant 0.01
Leela Prasad Koneru 0.01 Vijaya Kumar Christopher 0.01
Nakkapalli Veera Sekhar Babu 0.01 41 Non Resident Indians 0.21
Nirupama Henjarappa 0.01 Six NRIʹs One share each 0.03
Pradeep Shantaram Bhat 0.01 Six NRIs 1 share each 0.03
Raghu Bharadvaj 0.01 Ravi Kanth V. 0.01
Rama Murthy Setty 0.01 Suman Vijayagopal 0.01
Ramesh Babu Doddi 0.01 1.Srivamsi Madhwapthy 2.Ravi
Mikkilineni
0.01
Ramesh Babu Vusirikala 0.01 Padmanabha C.J. 0.01
Ranganatha Bande 0.01 Raju Nunna 0.01
Sangeeth Omanama 0.01 Ramesh Racheria 0.01Source: Inflow details reported in the SIA Newsletter, various issues of 2006.
market, even that contribution cannot be counted upon). In fact, assuming that
PE/VC/HF investors would exercise management control an appropriate question to ask
would be whether one could distinguish between such domestic and foreign investors in
terms of their management inputs and contribution to the performance of the domestic
company. Interestingly, Hymer pointed out that such foreign investors seek control over
the enterprise in order to ensure the safety of his investment and that the “reason applies
to domestic investment as well”. These are the cases that fall under Hymer’s Type 1 FDI
category. In fact, it might not be possible to distinguish domestic and foreign financial
investors especially when the latter are promoted by locals after gaining considerable
experience in similar businesses abroad. For instance, a perusal of senior management
(including Indians) and other Indians working with General Atlantic, a leading global
investment firm, reveals that most of these have commonality in terms of the business
schools they attended and past employment with consultancy/investment firms.
(Annexure D) This is also true when operations in the host country are handled by locals
with foreign investors exercising control but not strategy.77 Then there are Indian
companies which float offshore companies and bring back the funds raised abroad as
FDI. It is evident that analysis of FDI companies’ operations based on the sole 10%
77 It is even said that “Whereas an Indian‐based private equity firm is more likely to understand the particular
dynamics affecting an Indian company, US‐based firms often mistakenly approach investment
opportunities with a belief that a model that works in the US will transpose successfully to India. It can be
difficult for them to get the balance right between introducing best practice and discarding what is
irrelevant and possibly even damaging for Indian companies.” See: “Private Equity in India: An Executive
Round Table” at http://content.spencerstuart.com/sswebsite/pdf/lib/PrivateEquityIndia_2007_web2.pdf
(Accessed on May 18, 2010).
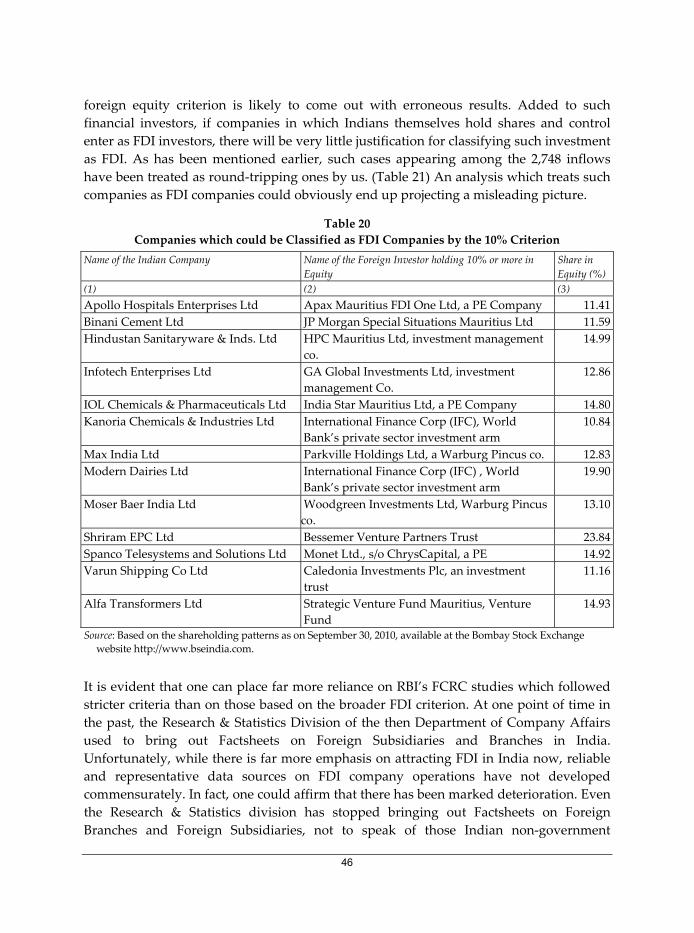
46
foreign equity criterion is likely to come out with erroneous results. Added to such
financial investors, if companies in which Indians themselves hold shares and control
enter as FDI investors, there will be very little justification for classifying such investment
as FDI. As has been mentioned earlier, such cases appearing among the 2,748 inflows
have been treated as round‐tripping ones by us. (Table 21) An analysis which treats such
companies as FDI companies could obviously end up projecting a misleading picture.
Table 20
Companies which could be Classified as FDI Companies by the 10% Criterion
Name of the Indian Company Name of the Foreign Investor holding 10% or more in
Equity
Share in
Equity (%)
(1) (2) (3)
Apollo Hospitals Enterprises Ltd Apax Mauritius FDI One Ltd, a PE Company 11.41
Binani Cement Ltd JP Morgan Special Situations Mauritius Ltd 11.59
Hindustan Sanitaryware & Inds. Ltd HPC Mauritius Ltd, investment management
co.
14.99
Infotech Enterprises Ltd GA Global Investments Ltd, investment
management Co.
12.86
IOL Chemicals & Pharmaceuticals Ltd India Star Mauritius Ltd, a PE Company 14.80
Kanoria Chemicals & Industries Ltd International Finance Corp (IFC), World
Bank’s private sector investment arm
10.84
Max India Ltd Parkville Holdings Ltd, a Warburg Pincus co. 12.83
Modern Dairies Ltd International Finance Corp (IFC) , World
Bank’s private sector investment arm
19.90
Moser Baer India Ltd Woodgreen Investments Ltd, Warburg Pincus
co.
13.10
Shriram EPC Ltd Bessemer Venture Partners Trust 23.84
Spanco Telesystems and Solutions Ltd Monet Ltd., s/o ChrysCapital, a PE 14.92
Varun Shipping Co Ltd Caledonia Investments Plc, an investment
trust
11.16
Alfa Transformers Ltd Strategic Venture Fund Mauritius, Venture
Fund
14.93
Source: Based on the shareholding patterns as on September 30, 2010, available at the Bombay Stock Exchange
website http://www.bseindia.com.
It is evident that one can place far more reliance on RBI’s FCRC studies which followed
stricter criteria than on those based on the broader FDI criterion. At one point of time in
the past, the Research & Statistics Division of the then Department of Company Affairs
used to bring out Factsheets on Foreign Subsidiaries and Branches in India.
Unfortunately, while there is far more emphasis on attracting FDI in India now, reliable
and representative data sources on FDI company operations have not developed
commensurately. In fact, one could affirm that there has been marked deterioration. Even
the Research & Statistics division has stopped bringing out Factsheets on Foreign
Branches and Foreign Subsidiaries, not to speak of those Indian non‐government
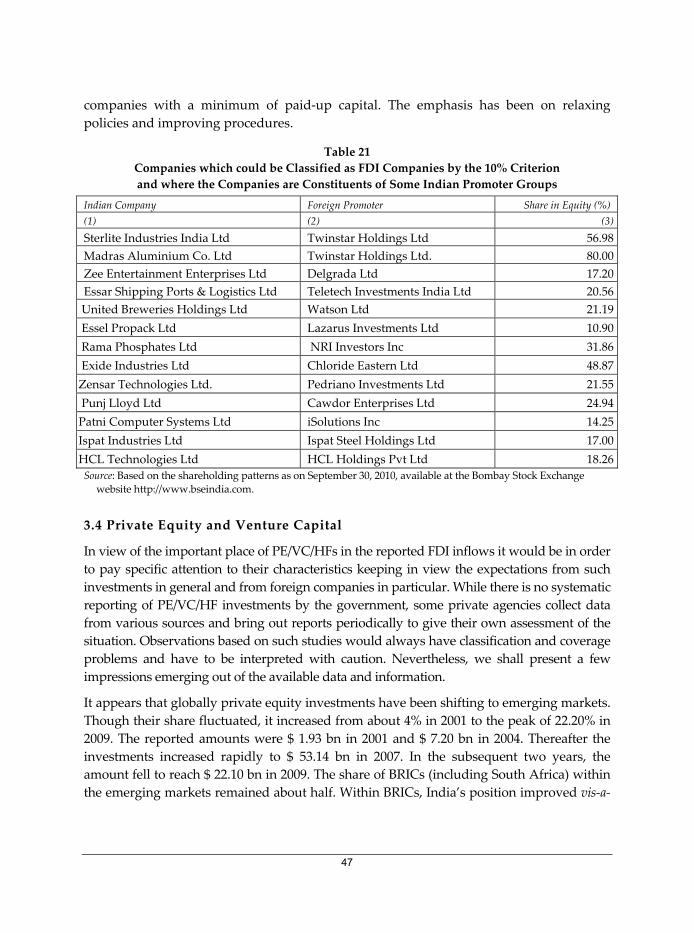
47
companies with a minimum of paid‐up capital. The emphasis has been on relaxing
policies and improving procedures.
Table 21
Companies which could be Classified as FDI Companies by the 10% Criterion
and where the Companies are Constituents of Some Indian Promoter Groups
Indian Company Foreign Promoter Share in Equity (%)
(1) (2) (3)
Sterlite Industries India Ltd Twinstar Holdings Ltd 56.98
Madras Aluminium Co. Ltd Twinstar Holdings Ltd. 80.00
Zee Entertainment Enterprises Ltd Delgrada Ltd 17.20
Essar Shipping Ports & Logistics Ltd Teletech Investments India Ltd 20.56
United Breweries Holdings Ltd Watson Ltd 21.19
Essel Propack Ltd Lazarus Investments Ltd 10.90
Rama Phosphates Ltd NRI Investors Inc 31.86
Exide Industries Ltd Chloride Eastern Ltd 48.87
Zensar Technologies Ltd. Pedriano Investments Ltd 21.55
Punj Lloyd Ltd Cawdor Enterprises Ltd 24.94
Patni Computer Systems Ltd iSolutions Inc 14.25
Ispat Industries Ltd Ispat Steel Holdings Ltd 17.00
HCL Technologies Ltd HCL Holdings Pvt Ltd 18.26
Source: Based on the shareholding patterns as on September 30, 2010, available at the Bombay Stock Exchange
website http://www.bseindia.com.
3.4 Private Equity and Venture Capital
In view of the important place of PE/VC/HFs in the reported FDI inflows it would be in order
to pay specific attention to their characteristics keeping in view the expectations from such
investments in general and from foreign companies in particular. While there is no systematic
reporting of PE/VC/HF investments by the government, some private agencies collect data
from various sources and bring out reports periodically to give their own assessment of the
situation. Observations based on such studies would always have classification and coverage
problems and have to be interpreted with caution. Nevertheless, we shall present a few
impressions emerging out of the available data and information.
It appears that globally private equity investments have been shifting to emerging markets.
Though their share fluctuated, it increased from about 4% in 2001 to the peak of 22.20% in
2009. The reported amounts were $ 1.93 bn in 2001 and $ 7.20 bn in 2004. Thereafter the
investments increased rapidly to $ 53.14 bn in 2007. In the subsequent two years, the
amount fell to reach $ 22.10 bn in 2009. The share of BRICs (including South Africa) within
the emerging markets remained about half. Within BRICs, India’s position improved vis‐a‐
48
vis China till 2007 when it managed to overtake China, though it fell behind China in the
subsequent two years.78 The Working Group on Foreign Investment also acknowledged
this when it said: “FDI inflows began in the early 1990s and have gathered momentum,
particularly after India became important to global private equity funds.”79
Though precise break‐up between foreign and local PE/VC/HF investors is not available,
it does appear that foreign funds dominate the PE/VC/HF scene in India. For instance,
according to SEBI, at the end of December 2009, against the total investments of `26,827 crore by Foreign Venture Capital Investors (FVCIs) registered with it, investments by
Indian Venture Capital Funds (VCFs) was of the order of `15,232 crore.80 A closer examination of the list of registered FVCIs, however, suggests that some of the FVCIs
were indeed promoted by Indian financial institutions like the ICICI, IDFC, UTI and
IL&FS.81 (Table 22) In view of this, not all FVCIs can be expected to exhibit the
characteristics of a foreign venture capital. Yet another aspect to the registered FVCIs,
relevant in the overall context of this study is that out of the 144 FVCIs as many as 140
were based in Mauritius (including the ones related to Indian institutions; expectedly
most of these (once again including those promoted by the Indian institutions) are
located at just a few addresses), two in Cyprus and the remaining two in Singapore.
Another dimension to the domestic VCFs is that some of these belong to Indian large
business group and financial institutions. Composition of top management and
investment advisers of some of the registered VCs suggests that it is difficult to classify
them either as Indian or foreign.82
From probably a more systematic study of the sector (foreign and domestic funds
together) in India, we find that Manufacturing was not the favoured area for PE/VC
investment as telecom & media, engineering & construction and financial services
claimed increasingly larger shares.83 (Annexure E) Companies which are in their late
stage of development or which are already listed on the stock exchanges were the most
78 EMPEA Industry Statistics & PitchDeck available at http://www.empea.net/Main‐Menu‐Category/Resource‐
Library/EMPEA‐Industry‐Statistics‐PitchDeck‐1H‐2010‐ppt‐‐Public.aspx 79 Ministry of Finance, Report of the Working Group on Foreign Investment, 30 July 2010, p. 45. 80 Excluding the `9,661 crore investment foreign FVCIs in Indian VCFs. 81 “We’re getting enquiries from several investment managers now. The idea of setting up offshore funds is
fast catching among Indian asset management companies,” said Chetan Nagendra, head of India practice,
Harneys Westwood & Riegels, a firm that services clients setting up businesses in British Virgin Islands
(BVI) and Cayman Islands. See: “Indian mutual funds approach zero tax destinations to raise offshore
capital” at http://economictimes.indiatimes.com/articleshow/5582011.cms?prtpage=1 (last accessed on May
24, 2010). Also relevant here are the observations of Bain & Co cited in Section II. 82 E.g. Helio Venture Partners India LLC, Mauritius FIRE Capital Fund, Nexus India and NEA Indo‐US
Ventures. Confusion of a similar kind is unavoidable when going though the Ernst & Young’s joint
publication with Outlook Business magazine—“Private Equity in Numbers”, December 2008. 83 Thillai Rajan A and Ashish Deshmukh, On Top of the World; Still Miles to Soar, India Venture Capital and
Private Equity Report, Indian Institute of Technology Madras, 2009. By many indications it was the real
estate sector that the funds including VCs were targeting. Relaxation of FDI policy and encouragement to
SEZs gave a boost to this phenomenon.
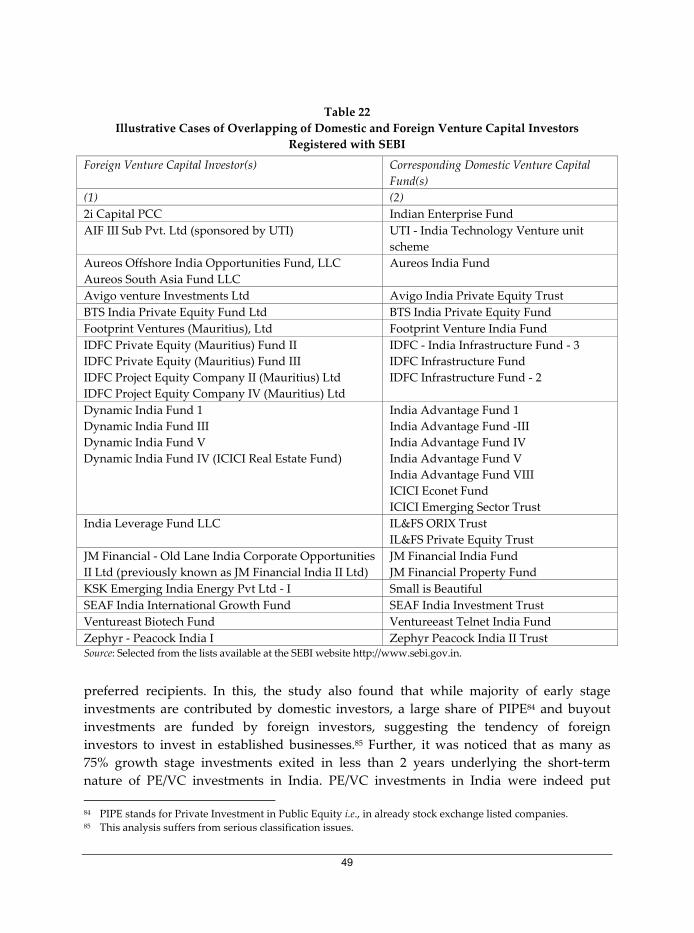
49
Table 22
Illustrative Cases of Overlapping of Domestic and Foreign Venture Capital Investors
Registered with SEBI
Foreign Venture Capital Investor(s) Corresponding Domestic Venture Capital
Fund(s)
(1) (2)
2i Capital PCC Indian Enterprise Fund
AIF III Sub Pvt. Ltd (sponsored by UTI) UTI ‐ India Technology Venture unit
scheme
Aureos Offshore India Opportunities Fund, LLC
Aureos South Asia Fund LLC
Aureos India Fund
Avigo venture Investments Ltd Avigo India Private Equity Trust
BTS India Private Equity Fund Ltd BTS India Private Equity Fund
Footprint Ventures (Mauritius), Ltd Footprint Venture India Fund
IDFC Private Equity (Mauritius) Fund II
IDFC Private Equity (Mauritius) Fund III
IDFC Project Equity Company II (Mauritius) Ltd
IDFC Project Equity Company IV (Mauritius) Ltd
IDFC ‐ India Infrastructure Fund ‐ 3
IDFC Infrastructure Fund
IDFC Infrastructure Fund ‐ 2
Dynamic India Fund 1
Dynamic India Fund III
Dynamic India Fund V
Dynamic India Fund IV (ICICI Real Estate Fund)
India Advantage Fund 1
India Advantage Fund ‐III
India Advantage Fund IV
India Advantage Fund V
India Advantage Fund VIII
ICICI Econet Fund
ICICI Emerging Sector Trust
India Leverage Fund LLC IL&FS ORIX Trust
IL&FS Private Equity Trust
JM Financial ‐ Old Lane India Corporate Opportunities
II Ltd (previously known as JM Financial India II Ltd)
JM Financial India Fund
JM Financial Property Fund
KSK Emerging India Energy Pvt Ltd ‐ I Small is Beautiful
SEAF India International Growth Fund SEAF India Investment Trust
Ventureast Biotech Fund Ventureeast Telnet India Fund
Zephyr ‐ Peacock India I Zephyr Peacock India II Trust Source: Selected from the lists available at the SEBI website http://www.sebi.gov.in.
preferred recipients. In this, the study also found that while majority of early stage
investments are contributed by domestic investors, a large share of PIPE84 and buyout
investments are funded by foreign investors, suggesting the tendency of foreign
investors to invest in established businesses.85 Further, it was noticed that as many as
75% growth stage investments exited in less than 2 years underlying the short‐term
nature of PE/VC investments in India. PE/VC investments in India were indeed put
84 PIPE stands for Private Investment in Public Equity i.e., in already stock exchange listed companies. 85 This analysis suffers from serious classification issues.
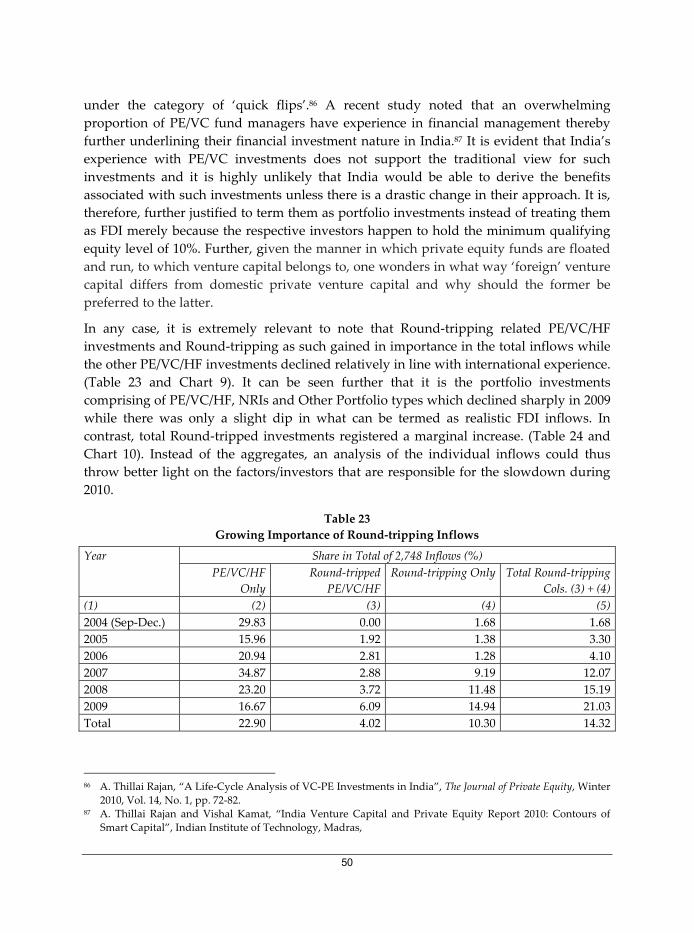
50
under the category of ‘quick flips’.86 A recent study noted that an overwhelming
proportion of PE/VC fund managers have experience in financial management thereby
further underlining their financial investment nature in India.87 It is evident that India’s
experience with PE/VC investments does not support the traditional view for such
investments and it is highly unlikely that India would be able to derive the benefits
associated with such investments unless there is a drastic change in their approach. It is,
therefore, further justified to term them as portfolio investments instead of treating them
as FDI merely because the respective investors happen to hold the minimum qualifying
equity level of 10%. Further, given the manner in which private equity funds are floated
and run, to which venture capital belongs to, one wonders in what way ‘foreign’ venture
capital differs from domestic private venture capital and why should the former be
preferred to the latter.
In any case, it is extremely relevant to note that Round‐tripping related PE/VC/HF
investments and Round‐tripping as such gained in importance in the total inflows while
the other PE/VC/HF investments declined relatively in line with international experience.
(Table 23 and Chart 9). It can be seen further that it is the portfolio investments
comprising of PE/VC/HF, NRIs and Other Portfolio types which declined sharply in 2009
while there was only a slight dip in what can be termed as realistic FDI inflows. In
contrast, total Round‐tripped investments registered a marginal increase. (Table 24 and
Chart 10). Instead of the aggregates, an analysis of the individual inflows could thus
throw better light on the factors/investors that are responsible for the slowdown during
2010.
Table 23
Growing Importance of Round‐tripping Inflows
Year Share in Total of 2,748 Inflows (%)
PE/VC/HF
Only
Round‐tripped
PE/VC/HF
Round‐tripping Only Total Round‐tripping
Cols. (3) + (4)
(1) (2) (3) (4) (5)
2004 (Sep‐Dec.) 29.83 0.00 1.68 1.68
2005 15.96 1.92 1.38 3.30
2006 20.94 2.81 1.28 4.10
2007 34.87 2.88 9.19 12.07
2008 23.20 3.72 11.48 15.19
2009 16.67 6.09 14.94 21.03
Total 22.90 4.02 10.30 14.32
86 A. Thillai Rajan, “A Life‐Cycle Analysis of VC‐PE Investments in India”, The Journal of Private Equity, Winter
2010, Vol. 14, No. 1, pp. 72‐82. 87 A. Thillai Rajan and Vishal Kamat, “India Venture Capital and Private Equity Report 2010: Contours of
Smart Capital”, Indian Institute of Technology, Madras,
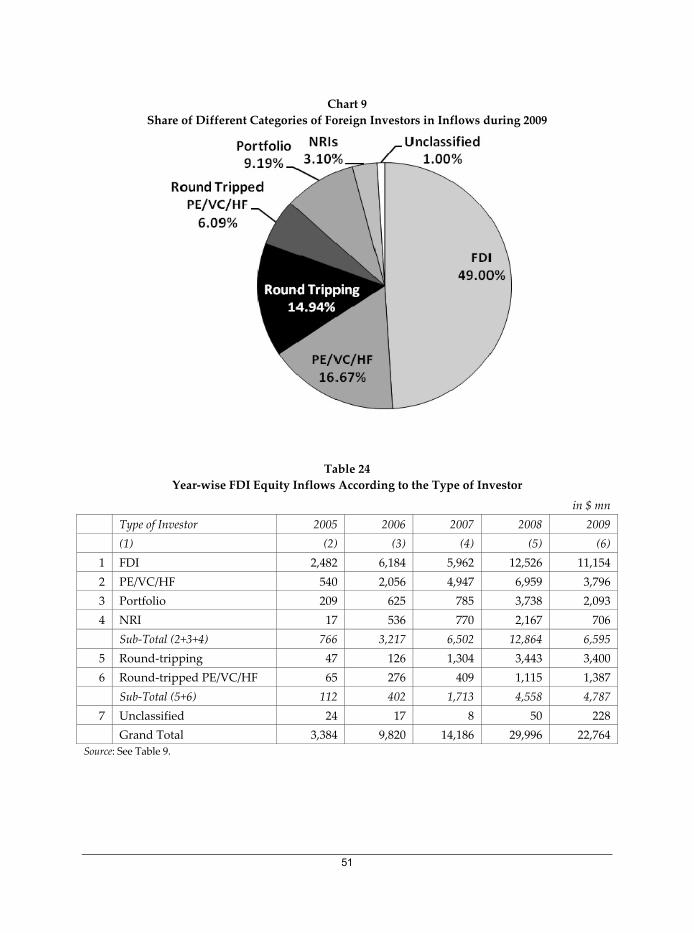
51
Chart 9
Share of Different Categories of Foreign Investors in Inflows during 2009
Table 24
Year‐wise FDI Equity Inflows According to the Type of Investor
in $ mn
Type of Investor 2005 2006 2007 2008 2009
(1) (2) (3) (4) (5) (6)
1 FDI 2,482 6,184 5,962 12,526 11,154
2 PE/VC/HF 540 2,056 4,947 6,959 3,796
3 Portfolio 209 625 785 3,738 2,093
4 NRI 17 536 770 2,167 706
Sub‐Total (2+3+4) 766 3,217 6,502 12,864 6,595
5 Round‐tripping 47 126 1,304 3,443 3,400
6 Round‐tripped PE/VC/HF 65 276 409 1,115 1,387
Sub‐Total (5+6) 112 402 1,713 4,558 4,787
7 Unclassified 24 17 8 50 228
Grand Total 3,384 9,820 14,186 29,996 22,764
Source: See Table 9.
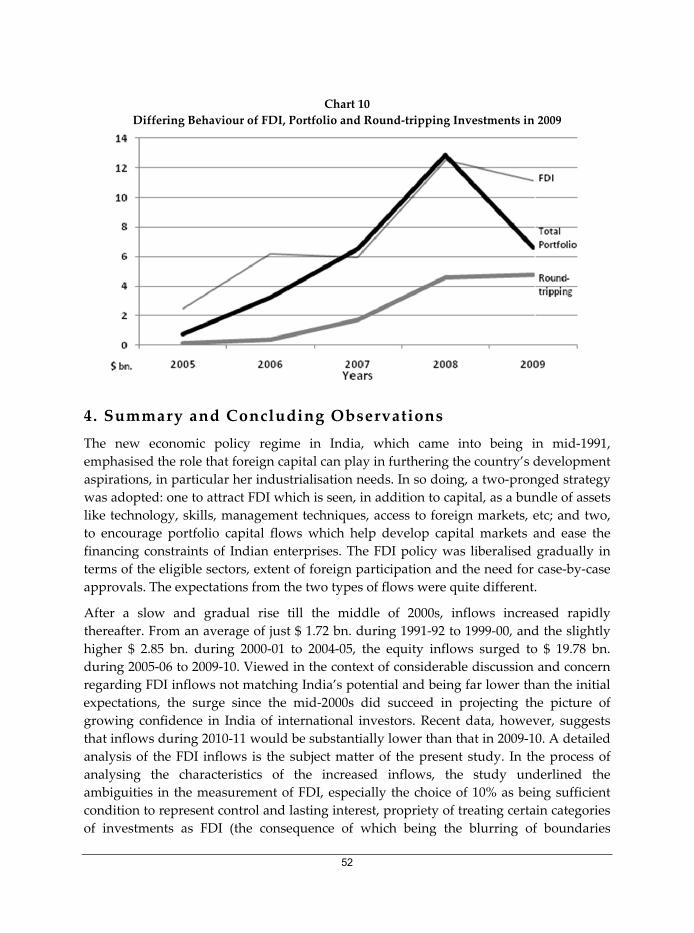
52
Chart 10
Differing Behaviour of FDI, Portfolio and Round‐tripping Investments in 2009
4. Summary and Concluding Observations
The new economic policy regime in India, which came into being in mid‐1991,
emphasised the role that foreign capital can play in furthering the country’s development
aspirations, in particular her industrialisation needs. In so doing, a two‐pronged strategy
was adopted: one to attract FDI which is seen, in addition to capital, as a bundle of assets
like technology, skills, management techniques, access to foreign markets, etc; and two,
to encourage portfolio capital flows which help develop capital markets and ease the
financing constraints of Indian enterprises. The FDI policy was liberalised gradually in
terms of the eligible sectors, extent of foreign participation and the need for case‐by‐case
approvals. The expectations from the two types of flows were quite different.
After a slow and gradual rise till the middle of 2000s, inflows increased rapidly
thereafter. From an average of just $ 1.72 bn. during 1991‐92 to 1999‐00, and the slightly
higher $ 2.85 bn. during 2000‐01 to 2004‐05, the equity inflows surged to $ 19.78 bn.
during 2005‐06 to 2009‐10. Viewed in the context of considerable discussion and concern
regarding FDI inflows not matching India’s potential and being far lower than the initial
expectations, the surge since the mid‐2000s did succeed in projecting the picture of
growing confidence in India of international investors. Recent data, however, suggests
that inflows during 2010‐11 would be substantially lower than that in 2009‐10. A detailed
analysis of the FDI inflows is the subject matter of the present study. In the process of
analysing the characteristics of the increased inflows, the study underlined the
ambiguities in the measurement of FDI, especially the choice of 10% as being sufficient
condition to represent control and lasting interest, propriety of treating certain categories
of investments as FDI (the consequence of which being the blurring of boundaries
53
between direct and portfolio investments) and adherence to the accepted international
norms by the Indian official agencies. It also raised the possibility of reported acquisition
of shares underestimating the extent of takeover of Indian businesses by foreign
companies.
Aggregate data suggest that a major contributor to the recent increase has been
reinvested capital (which is being estimated since 2000‐01 following India’s decision to
adopt international practices in reporting FDI data) which does not represent fresh
inflows. Another important component is the inflows through the acquisition route.
While the former does not represent fresh inflows, the latter generally does not add to the
existing production or services capabilities. Official data also suggest that there has been
a perceptible shift in the sectoral composition of inflows with the growing dominance of
non‐manufacturing sectors. Increasing proportion of inflows being routed through tax
shelters implies considerable revenue loss to the exchequer. Characteristics of the global
FDI flows suggest that India’s experience with FDI inflows is not specific to her. For
instance, according to UNCTAD World Investment Reports, the share of Manufacturing
sector in world FDI flows declined from 34.23% to 24.01% between 1989‐1991 and 2005‐
2007.88 The corresponding decline for developing economies was from 46.54% to 31.00%.
One the other hand, the share of services increased from 50.45% to 58.95% for the world,
whereas for developing countries the increase was from 30.78% to 56.68%. Within
services the financial sector has acquired an important place in the latter period: from
17.74% to 21.37%. In case of developing countries, the increase was far sharper: from
6.31% to 19.31%. It is also acknowledged that private equity plays a major role in global
FDI flows, especially in those involving M&As.
While these broad features of inflows are somewhat well‐known, questions are
occasionally raised about the nature of FDI flows in India which might not be strictly
equated with direct investment and which may not be able to deliver the expected
benefits. Keeping this and the widely accepted definition of FDI in view, the study
analysed the officially reported largest 2,748 cases of FDI Equity inflows, each
individually accounting for at least $ 5 mn during September 2004 to December 2009, the
period during which inflows recorded a sharp increase. The 2,748 inflows are fairly
representative in value terms of the total equity inflows through the FIPB/SIA,
Acquisition and Automatic routes as they accounted for about 88% of the total for the
period. A distinctive feature of this exercise, which to the best of our knowledge has not
been attempted so far, is the classification of the foreign investors with a view to assess
the flows from the point of their meeting the criteria and expectations from FDI. It has
been quite a challenging task which has never left one satisfied because of many
information gaps. Notwithstanding these limitations, we do hope that the exercise would
88 UNCTAD, World Investment Report, 2009. World includes South‐East Europe and CIS.
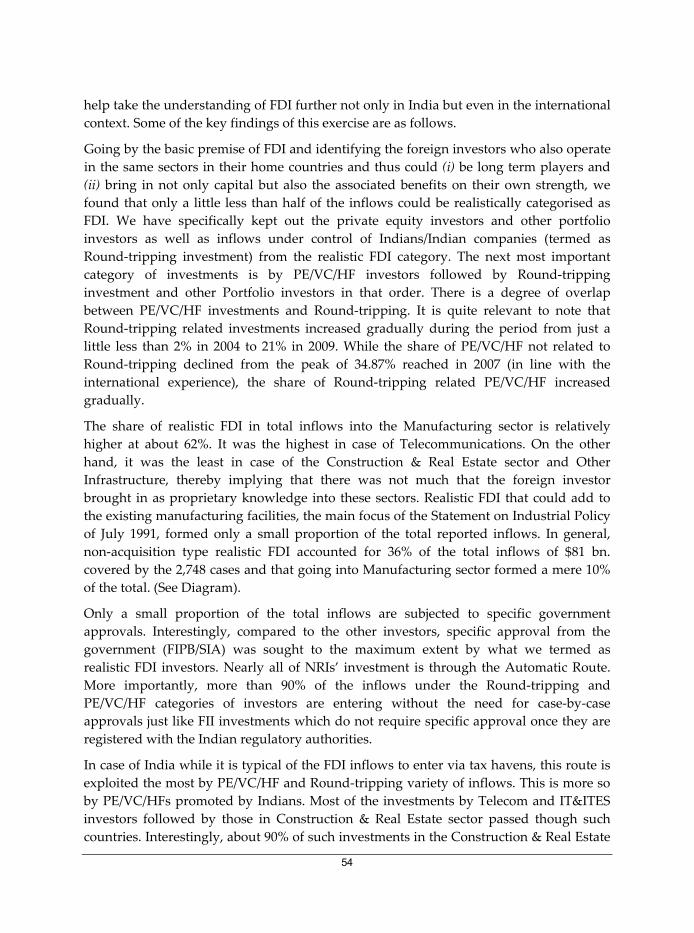
54
help take the understanding of FDI further not only in India but even in the international
context. Some of the key findings of this exercise are as follows.
Going by the basic premise of FDI and identifying the foreign investors who also operate
in the same sectors in their home countries and thus could (i) be long term players and
(ii) bring in not only capital but also the associated benefits on their own strength, we
found that only a little less than half of the inflows could be realistically categorised as
FDI. We have specifically kept out the private equity investors and other portfolio
investors as well as inflows under control of Indians/Indian companies (termed as
Round‐tripping investment) from the realistic FDI category. The next most important
category of investments is by PE/VC/HF investors followed by Round‐tripping
investment and other Portfolio investors in that order. There is a degree of overlap
between PE/VC/HF investments and Round‐tripping. It is quite relevant to note that
Round‐tripping related investments increased gradually during the period from just a
little less than 2% in 2004 to 21% in 2009. While the share of PE/VC/HF not related to
Round‐tripping declined from the peak of 34.87% reached in 2007 (in line with the
international experience), the share of Round‐tripping related PE/VC/HF increased
gradually.
The share of realistic FDI in total inflows into the Manufacturing sector is relatively
higher at about 62%. It was the highest in case of Telecommunications. On the other
hand, it was the least in case of the Construction & Real Estate sector and Other
Infrastructure, thereby implying that there was not much that the foreign investor
brought in as proprietary knowledge into these sectors. Realistic FDI that could add to
the existing manufacturing facilities, the main focus of the Statement on Industrial Policy
of July 1991, formed only a small proportion of the total reported inflows. In general,
non‐acquisition type realistic FDI accounted for 36% of the total inflows of $81 bn.
covered by the 2,748 cases and that going into Manufacturing sector formed a mere 10%
of the total. (See Diagram).
Only a small proportion of the total inflows are subjected to specific government
approvals. Interestingly, compared to the other investors, specific approval from the
government (FIPB/SIA) was sought to the maximum extent by what we termed as
realistic FDI investors. Nearly all of NRIs’ investment is through the Automatic Route.
More importantly, more than 90% of the inflows under the Round‐tripping and
PE/VC/HF categories of investors are entering without the need for case‐by‐case
approvals just like FII investments which do not require specific approval once they are
registered with the Indian regulatory authorities.
In case of India while it is typical of the FDI inflows to enter via tax havens, this route is
exploited the most by PE/VC/HF and Round‐tripping variety of inflows. This is more so
by PE/VC/HFs promoted by Indians. Most of the investments by Telecom and IT&ITES
investors followed by those in Construction & Real Estate sector passed though such
countries. Interestingly, about 90% of such investments in the Construction & Real Estate
55
Diagram
Composition of the reported Top 2,748 FDI Inflows
Figures in parentheses are percentages are calculated with respect to total Reported Inflows.
56
sector were routed through the tax havens and benefited from the automatic entry
facility. While one would not say foreign PE/VC/HF investments are wholly unwelcome,
it can be said that those investments that do not match the expectations from FDI need to
be viewed differently. Since such financial investors seek higher and quicker gains and
their preferred sector of investment is prone to speculative expectations,89 net addition to
domestic investible resources on their account could also not be guaranteed even in the
medium term. On top of that, the tax haven route that they have exploited for entry into
India ensures that the exchequer would not gain much from the profits they earn. Thus,
inflows that cannot be characterised as FDI not only have had a relatively easy passage
but they had also exploited the tax haven route to much greater extent.
4.1 Measurement and Classification (Direct or Portfolio?)
An inescapable conclusion, notwithstanding the status accorded to such investments by
the international agencies and adopted across nations, is that a good part of the FDI
flowing into India is closer to portfolio investment than to FDI having ‘long term interest’
and a ‘bundle’ of attributes. Then there is also the increasing share claimed by Round‐
tripping investments. Worse still, some part of the inflows to India does not qualify as
FDI even going by the 10% criterion. What seems to be happening in practice is that all
equity investments which are not coming through the foreign institutional investor (FII)
route are being treated as FDI irrespective of the proportion of shares held abroad and the
extent of influence of the foreign investor.90 This becomes amply clear from the Draft
Press Note on FDI Regulatory Framework. Interestingly, even important official advisory
bodies appear to be unaware of how the FDI data were being compiled. The FDI figures
made up in the above manner may help India project a healthy picture of inflows but
these do not ensure the expected benefits no better than ADRs/GDRs which are treated as
portfolio capital and external commercial borrowings. Indeed, given the possibility that
institutional investors who invest in companies listed on the Indian stock exchanges as
FIIs, subscribe to ADR/GDRs as also invest in India‐focussed companies on the London
Stock Exchange, the inflows on account of the latter could also be seen as another form of
foreign portfolio capital.91
89 Indeed, the government had imposed a three‐year lock‐in for FDI in the real estate sector. 90 Incidentally, it is reported that DIPP had clarified that FIIs cannot take more than 10% equity and that they
“will have to follow the rules applicable to portfolio investors even if they are investing through the foreign
direct investment route”.
See: “FIIs taking FDI route face 10% stake cap in local co” at http://economictimes.indiatimes.com/
articleshow/5814523.cms?prtpage=1 91 Interestingly, the Working Group on Foreign Investment suggested a new category of portfolio investors
namely, ‘Qualified Foreign Investors’ which would subsume FIIs, FVCI and NRI investments. The Working
Group also recommended that “(W)ithin the automatic route, there would be no distinction between FDI
and portfolio investment”. Ministry of Finance, Report of the Working Group on Foreign Investment, 30 July
2010, p. 77.

57
It is evident that at the global level the 10% criterion is being used as a thumb rule and
even investments which are unlikely to exhibit the characteristics of typical FDI are being
categorised as such for BOP measurement purposes. That the 10% criteria is adopted
mainly because of the stated objective of ensuring comparability across nations, and that
a suggestion to raise the limit to 20% in accordance with the International Accounting
Standards was summarily rejected makes the limit even more open to question. As a
result, various forms of financial investments which one finds difficult to unquestionably
treat as FDI are being considered as such. There is also the question of their potential
impact on the host countries about which not much is known. These are not miniscule in
size as they account for a sizeable portion of global FDI flows. Notwithstanding the fact
that such investments are accompanied by control/influence as well, their investments
cannot be distinguished from typical financial investors. Unlike typical FDI, private
equity investments come with a pre‐conceived idea of exiting the venture after certain
duration92. They do not own any proprietary technology and hence the investee
enterprises may only be directed to the appropriate sources. Private equity and other
portfolio investments do not fall under the standard motives of resource seeking,
efficiency seeking, market seeking and strategic asset seeking FDI. They may, if
necessary, be categorised as pure return seeking FDI. Given the manner in which the
sector proliferated, those who promote and run the PE firms are more like global
consultants who work for a fee. These include persons of Indian origin/nationality many
of whom cannot be distinguished from foreigners in terms of education, training and
experience. Except for the fact that capital flows from another country, one does not find
anything related to nationality about them.
India’s experience with PE/VC investments suggests that their preference for established
companies and the Construction & Real Estate sector on the one hand and the ‘quick
flips’ nature on the other make their contribution questionable.93 The way domestic
investors floated PE firms abroad (and possibly raised money abroad genuinely94), some
of the registered domestic venture capital companies having strong foreign affiliation
and many large Indian business groups and banks entering private equity business, the
distinction between ‘domestic’ and ‘foreign’ has got even further blurred. In the choice of
92 For a description of private equity, see: Kavaljit Singh, Fixing Global Finance, Madhyam, Delhi and SOMO,
Amsterdam, 2010. 93 In fact to contain the real estate bubble, to which these funds also contributed, India had to raise interest
rates. 94 It may not always be easy to find out on whose behalf the funds have invested. For instance, Rudolf Elmer, a
former employee of Julius Baer, a Swiss bank, who has passed on the details of about 2000 of the bank’s
account holders to Wikileaks explained the modus operandi as:
You are an Indian client and you want to have money in Julius Baer. You have good relationship with a
relationship manager who makes investments. The banker sets up a fund in the Cayman Islands and
asks his client to invest in that mutual fund. The relationship manager makes the decision to buy the
fund and make investments in India for the client…
See: “Leaks Reveal Cayman Black Money Trail”, Mail Today, January 19, 2011.
58
tax havens too, both have something in common. In the end, the FDI route has also
become a conduit for domestic entrepreneurs to avoid taxes and worse still in some cases
going by the multi‐layering adopted by them raise serious doubts about the origin of the
funds.95 The differences in the behaviour of realistic FDI, all Portfolio investors
(excluding Round‐tripping) and Round‐tripping came out sharply in 2009. While realistic
FDI declined marginally, portfolio investments fell sharply. On the other hand, Round‐
tripping investments increased slightly.
In 2003, while deciding on the Azadi Bachao Andolan petition, the Supreme Court justified
the tax advantage offered to foreign investors coming through the tax havens like
Mauritius in the following manner:
There are many principles in fiscal economy which, though at first blush might appear to
be evil, are tolerated in a developing economy, in the interest of long‐term development.
Deficit financing, for example, is one; treaty shopping, in our view, is another.
Despite the sound and fury of the respondents over the so‐called “abuse” of “treaty
shopping”, perhaps, it may have been intended at the time when the Indo‐Mauritius
DTAC was entered into. Whether it should continue, and, if so, for how long, is a matter
which is best left to the discretion of the executive as it is dependent upon several economic
and political considerations. This court cannot judge the legality of treaty shopping
merely because one section of thought considers it improper.96
In early 2010, the Authority for Advance Rulings (Income Tax) New Delhi, while
upholding the foreign investor’s claim of non‐liability of Tax on the sale of shares held by
E’Trade Mauritius Ltd in an Indian company, said:
Though it looks odd that the Indian tax authorities are not in a position to levy the
capital gains tax on the transfer of shares in an Indian company, this is an inevitable
effect of the peculiar provision in India‐Mauritius DTAA, the Circular issued by
CBDT and the law laid down by Supreme Court in Azadi Bachao case. Whether the
policy considerations underlying the crucial Treaty provisions and the spirit of the Circular
issued by the CBDT would still be relevant and expedient in the present day fiscal scenario is
a debatable point and it is not for us to express any view in this behalf. (emphasis added).97
95 See for instance: “ED traces key suspectʹs 2G money trail to Cyprus, Libya, Mauritius”, at
http://timesofindia.indiatimes.com/india/ED‐traces‐key‐suspects‐2G‐money‐trail‐to‐Cyprus‐Libya‐
Mauritius/articleshow/7080911.cms; “Raids reveal Mittal‐linked co got huge foreign inflows” at
http://timesofindia.indiatimes.com/india/Raids‐reveal‐Mittal‐linked‐co‐got‐huge‐foreign‐inflows‐
/articleshow/6868740.cm; and “2G scam: ED questions Unitech on fund transfers” at
http://timesofindia.indiatimes.com/india/2G‐scam‐ED‐questions‐Unitech‐on‐fund‐
transfers/articleshow/6940321.cms 96 Authority for Advance Rulings (AAR) No.826 of 2009, dated March 22 2010 available at
http://rulings.co.in/it‐rulings/uploads/pdf/1269340941_etrade.pdf. DTAC stands for Double Tax Avoidance
Convention. 97 ibid.
59
Earlier, the Comptroller and Auditor General of India in its report on direct taxes System
Appraisals for the year 2003‐04 emphasised that:
... a holistic study of DTAAs be conducted to ascertain the benefits accruing to the
nation, especially as these are not placed before Parliament. A well‐designed and
periodical cost benefit analysis would also need to be put in place.
Shortcomings in DTAAs, especially those relating to definition and operation of
permanent establishment, limitation of treaty benefits and disallowing treaty
shopping needed to be removed so as to curtail misplaced incentives and ensure that
the benefits of DTAAs are availed by bonafide assessees.98
In view of the evidence proffered above and press reports indicating the deployment of
tax havens by Indians themselves, there is a need to rethink on the issue, especially since
the economic conditions to which the Supreme Court alluded to do not exist any longer
and even the world at large has recognised the need to restrict the abuse of tax havens.99
Should this facility, which works as a tax incentive, be extended to all sectors and all
types of investors? Instead, can such tax incentives be offered directly to both domestic
and foreign investors in selected sectors?
Portfolio investment which does not come through the stock market may not be as
volatile as that which comes through it. The recent crisis has, however, shown that the
former could be less reliable as the flows, even if they cannot be withdrawn, can dwindle
and affect the economies which rely on them to meet the current account gap. On the
other hand, there is nothing which suggests that such investments by themselves
enhance the capabilities of investee companies to contribute to bridge the current account
gap. Taking advantage of the liberal FDI definition, which does not distinguish between
the nature of the investor, portfolio investors may adopt the FDI route more in the event
of capital controls being introduced on portfolio investments.
As has been mentioned earlier, the RBI is now concerned about the fall in FDI inflows
during the current financial year (2010‐11) in the context of higher level of current
account deficit and dominance of volatile portfolio capital flows. Besides the
environmentally sensitive policies pursued, it identified the sectors responsible for the
slow down as “construction, real estate, business and financial services”.100 It is evident
98 Comptroller and Auditor General of India, Report No. 13 of 2005, Direct Taxes. See the relevant chapter of the
report available at http://saiindia.gov.in/cag/file/overview‐310. 99 Apart from the controversies surrounding the financing of IPL franchisees and the leaked contents of ‘Radia
tapes’ and investigations, we did come across, in this study, companies funded by an alleged arms dealer.
Interestingly, press reports also corroborate this observation. For instance, the Times of India suggests that
the person concerned was an accused in several cases filed by the CBI for manipulation and bribery in
defence purchases and that he was not seen in India since 2006. The paper also reveals that “In India too, the
family has several companies, to which investments have come from firms in tax havens”. See: “Arms
dealer wanted in India major funder of UK Liberal Democrats“, Times of India, May 6, 2010. 100 See, RBI, Macroeconomic and Monetary Developments: Third Quarter Review, 2010‐11 Chapter III on “The
External Economy”, at http://rbidocs.rbi.org.in/rdocs/Publications/PDFs/ 04MD240111F.pdf

60
that except for IT and ITES, these services would not be directly contributing to foreign
earning earnings. We have seen in the foregoing that inflows into the Construction and
Real Estate sector are dominated by PE/VC/HF investors and Round‐tripping
investments which cannot be equated with FDI. Not long ago it was reported that “RBI,
which has been consistently cautious over the FDI flow into the realty sector, has warned
that such massive flows could lead to speculation and over‐heating of the real estate
sector”.101 RBI also seems to have wanted to “take property market out of the sectors
which allows FDI through the automatic route. It wants inflows routes such as
participatory notes and private equity contained”.102 Indeed, FDI into the sector is subject
to three‐year lock‐in. The present change in attitude seems to have been driven by the
need to meet current account deficits and the belief that FDI inflows are longer‐term
commitments. The primary role of FDI has thus been reduced to a foreign exchange
management tool and probably reflects a change in the global approach towards FDI.
The shift in the perception of FDI where the attributes other than capital are pushed to
the background can be seen from an IMF publication which when describing that FDI is
favoured over other capital flows by emerging markets, explained that:
FDI is not debt creating, is less volatile than portfolio flows, and relatively resistant
during financial crises (…). FDI has also been associated with positive spillovers
through technology transfer and training to local industry (…), and may lead to
enhanced export performance and growth (…). (emphasis added) 103
Thus, even the IMF is not sure of the developmental impact of FDI. FDI’s contribution to
enhancing host country’s export potential and thus contributing to its ability to earn
foreign exchange is also not guaranteed. No wonder, India is seeing FDI as a means of
bridging the current account gap with ‘stable’ inflows without reference to its quality.
Apart from the policies related to environment, RBI’s suggestion to address other
problem areas like procedural delays, land acquisition issues and availability of quality
infrastructure is more generic in nature and by itself may not ensure directing capital
flows to India. There is every possibility that the fall in inflows would be used to push
further opening up of the sectors which have hitherto been partially open to FDI. The
need to maintain a steady stream of foreign capital is shrinking the policy space even
when certain policies are not working to India’s advantage.
4.2 A Case for Selective Approach towards FDI
Before seeking to benefit from FDI it is essential to clearly identify the same. Thus going
back to the definitional aspect of FDI, one finds that the essential criterion followed for 101 See: “RBI raises alarm over FDI build‐up in realty”, http://economictimes.indiatimes.com/ markets/real‐
estate/realty‐trends/rbi‐raises‐alarm‐over‐fdi‐build‐up‐in‐realty/articleshow/1129254.cms 102 See: “RBI Asks Govt to ban automatic FDI in Real Estate“, http://www.indianrealtynews.com/fdi‐india/rbi‐asks‐
govt‐to‐ban‐automatic‐fdi‐in‐real‐estate.html 103 IMF, India: Selected Issues, supra note 9.

61
identifying an FDI enterprise is control/influence. While unambiguous control is
generally seen in owning majority share in equity, significant influence is expected to
exist when there is an equity share between 10% and 50%. It is also believed that one can
have control with less than 10% share and not have control even with shares higher than
10%. The primary criteria itself is a matter of debate and FDI is open to subjective
interpretation and judgment. Other items like reinvested earnings, other capital, etc. only
follow from this first level identification. The whole edifice is thus built on what is well
acknowledged as an ‘arbitrary’ cut‐off point of 10%, vaguely defined ‘lasting interest’
and ‘significant influence.104 Indeed, it is difficult to understand the full meaning of IMF
BPM6 when it says:
Because there is control or a significant degree of influence, direct investment tends
to have different motivations and to behave in different ways from other forms of
investment. As well as equity (which is associated with voting power), the direct
investor may also supply other types of finance, as well as knowhow. Direct investment
tends to involve a lasting relationship, although it may be a short‐term relationship in some
cases. Another feature of direct investment is that decisions by enterprises may be made
for the group as a whole. (emphasis added)105
On one hand, it implies that direct investment is much more than a share in equity and
involves supply of other types of finance and knowhow and decisions are made for the
group as a whole. This is more akin to investments by TNCs. However, the difficult part
in this is about the ‘lasting relationship’ of a ‘short‐term’ nature. Obviously, the lower
limit of 10% which is neutral to the nature of the foreign investor would bring far more
cross‐border investments, including cases that are typically portfolio investments, into
the ambit of FDI than a higher cut‐off point would do. And indeed, this has been the case
as India’s experience described in the foregoing had demonstrated. Foreign control by
itself may be important when it comes to ascertaining liabilities of various sorts or in
strategic sectors. This is irrespective of whether a particular company is categorised as an
FDI one or not. The two should be treated separately.
This is as far as the need to clearly identify FDI within the global and individual host
country’s capital flows before one can plan to use it to ones advantage. On the other
hand, there is considerable body of literature which does not offer unqualified
endorsement of positive impact of FDI on host countries and which implies a calibrated
approach towards it. The situation is well summed up in the following:
We know that there is a lot we still do not know about FDI and MNCs, but not
exactly what or how much. ... Few undisputed insights exist on which policy makers
can definitely rely. ‘‘The economic effects of FDI do not allow for easy
104 Supra note 33. See also: Jimmy J. Zhan, “FDI Statistics: A Critical Review and Policy Implications”, paper
prepared for the World Association of Investment Promotion Agencies (WAIPA), Geneva, October 2006. 105 IMF, Balance of Payment and International Investment Position Manual, Sixth Edition, 2009, p. 101.
62
generalizations. Empirical studies on the growth impact of FDI have come up with
conflicting results.’’106
And,
After resolving many statistical problems plaguing past macroeconomic studies and
confirming our results using two new databases on international capital flows, we
find that FDI inflows do not exert an independent influence on economic growth.
Thus, while sound economic policies may spur both growth and FDI, the results are
inconsistent with the view that FDI exerts a positive impact on growth that is
independent of other growth determinants.107
Following such evidence it is logical for adopting a selective approach towards FDI. For
instance, it is said:
The experience of many recent development successes supports our call for a more
interventionist approach towards TNCs – which policymakers and academics from
various parts of the world are embracing. Countries such as Korea, Taiwan,
Singapore and China were able to incorporate TNCs within their national projects in
their own terms and under their own conditions. Even Singapore, which actively
promoted FDI inflows, protected strategic sectors from foreign competition and
implemented different measures to promote domestic upgrading. While
international agreements may prohibit some of the measures that Korea, Taiwan and
Singapore implemented, there is still some policy space available for a more
restrictive approach to TNCs. To summarise, countries which manage their FDI are likely
to benefit more than those which are managed by their FDI. (emphasis added)108
Similarly,
... there are good reasons to believe that an industrialized strategy based on laissez
faire attitude towards TNCs may not be as successful in the long run as a more
selective, strategic approach, as seen in the examples of countries like Korea and
Taiwan.109
At one time the expectations from FDI were rather clear; and even now the most widely
accepted view is that it is much more than capital transfer. And probably that was the
reason why developing countries could be convinced of the need to attract FDI. (See Box)
106 Stephen D. Cohen, Multinational Corporations and Foreign Direct Investment: Avoiding Simplicity, Embracing
Complexity, Oxford University Press, 2007, p. 356. 107 Maria Carkovic and Ross Levine, “Does foreign direct investment accelerate economic growth?”, in
Theodore H. Moran, Edward M. Graham and Magnus Blomström, Does Foreign Direct Inevstemnt Promote
Development?”, Institute for International Economics, 2005, p. 219. 108 Eric Rugraff, Diego Sánchez‐Ancochea, Andy Sumner (eds.), Transnational Corporations and Development
Policy: Critical Perspectives, Palgrave Macmillan, 2009, pp. 305‐306. 109 Ha‐joon Chang, “Globalization, transnational corporations, and economic development: can the developing
countries pursue strategic industrial policy in a globalizing world economy?”, in Dean Baker, Gerald Epstein and
Robert Pollin (eds.), Globalization and Progressive Economic Policy, Cambridge University Press, 1998, pp. 97‐116.
63
Box
FDI comprises a package of resources …
Extracts from UNCTAD, World Investment Report: Foreign Direct Investment and the
Challenge of Development, 1999.
Most developing countries today consider FDI an important channel for obtaining access to
resources for development. However, the economic effects of FDI are almost impossible to
measure with precision. Each TNC represents a complex package of firm‐level attributes that
are dispersed in varying quantities and quality from one host country to another. These
attributes are difficult to separate and quantify. Where their presence has widespread effects,
measurement is even more difficult. ... the assessment of the development effects of FDI has
to resort either to an econometric analysis of the relationships between inward FDI and
various measures of economic performance, the results of which are often inconclusive, or to
a qualitative analysis of particular aspects of the contribution of TNCs to development,
without any attempt at measuring costs and benefits quantitatively.
FDI comprises a bundle of assets, some proprietary to the investor. The proprietary assets, the
“ownership advantages” of TNCs, can be obtained only from the firms that create them. They
can be copied or reproduced by others, but the cost of doing that can be very high,
particularly in developing countries and where advanced technologies are involved. Non‐
proprietary assets—finance, many capital goods, intermediate inputs and the like—can
usually be obtained from the market also.
The most prized proprietary asset is probably technology. Others are brand names,
specialized skills, and the ability to organize and integrate production across countries, to
establish marketing networks, or to have privileged access to the market for non‐proprietary
assets (e.g. funds, equipment). Taken together, these advantages mean that TNCs can
contribute significantly to economic development in host countries—if the host country can
induce them to transfer their advantages in appropriate forms and has the capacity to make
good use of them. (p. 25)
The development impact of FDI, however, also depends on the dynamics of the transfer of
technology and skills by TNCs: how much upgrading of local capabilities takes place over
time, how far local linkages deepen, and how closely affiliates integrate themselves in the
local learning system. TNCs may simply exploit the existing advantages of a host economy
and move on as those advantages erode. Static advantages may not automatically transmute
into dynamic advantages. This possibility looms particularly large where a host economy’s
main advantage is low‐cost unskilled labour, and the main TNC export activity is low‐
technology assembly.
The extent to which TNCs dynamically upgrade their technology and skills transfer and raise
local capabilities and linkages depends on the interaction of the trade and competition policy
regime, government policies on the operations of foreign affiliates, the corporate strategies and
resources of TNCs, and the state of development and responsiveness of local factor markets,
firms and institutions. (p. 30)
64
Even today in spite of a variety of foreign investors coming into play and with increasing
dominance of financial investors about whose impact on host countries one is not sure of,
international bodies continue to present the prospect that:
Unlike portfolio equity and bond investments, FDI decisions are made with long‐
term horizons in view. They express the intention to build productive
manufacturing facilities, exploit natural resources, or diversify export bases. Thus,
FDI flows are less likely to be liquidated or reversed in times of crisis.110 (emphasis
added)
Notwithstanding the clarity in objectives and expectations from FDI the broader
definition of FDI that has prevailed blurred the boundaries between portfolio and direct
investments. A situation has been reached when FDI is referred to for its developmental
impact even while the widely available measurement is that of BOP based FDI resulting
in a wide gap between what is meant and what is measured as FDI.111 Instead of
representing capital flow with clear developmental connotation, it has turned into
generic capital flow. Recent developments are consistent with these observations. For
instance, substantial decrease in M&As (a good part of which is financed by private
equity) and a sharp fall in ‘FDI by private equity funds’ rather than a slowdown in
greenfield operations explain most of the drop in FDI in 2008 and 2009.112 It is apparent
that the characteristics of portfolio investments got reflected in the behaviour of globally
measured FDI. Indeed a critic of UNCTAD had said:
110 World Bank, Global Development Finance, Charting a Global Recovery, I: Review, Analysis, and Outlook, 2009, p. 3. 111 In the context of rising current account deficit and falling FDI inflows, the Economic Times said in its
editorial:
ADRs do make some investible resources available to domestic industry, but is devoid of the specific
benefits associated with FDI, namely, strategic vision for business growth in the country, technological
know‐how and managerial expertise. If the government is seriously concerned about our rising current
account deficit, estimated at about 3.5% of GDP, an issue that the Reserve Bank of India has also
flagged, it needs to look for ways to increase genuine, rather than sham, FDI flows. FDI, unlike foreign
institutional investment (FII) flows that are easy‐come‐easy‐go, is not only sticky but also has huge
positive externalities in the form of ancillary industries and employment opportunities. Today, it is hard to
think of, say, Suzuki exiting India, certainly not with the ease of some foreign institutional investor. All
the more reason why the government should try to reverse the recent trend in overseas capital flows
characterised by a decline (in) direct investment and a rise in portfolio flows. (emphasis added)
“ADRs no substitute for FDI”, Economic Times, January 31, 2011.
On its part a Business Standard editorial said on January 3, 2011 that:
It is the composition of capital flows into India in recent times that is a cause of greater concern. India’s
current account deficit is being financed by short‐term capital flows which, as the Financial Stability
document of RBI has pointed out, is a cause for serious concern. Short‐term capital flows, which
increase both short‐term debt and vulnerability, are notoriously foot loose and could exit at the first
sign of trouble or better opportunity elsewhere, leaving India dangerously vulnerable. A healthy
capital inflow mix would include a greater share of FDI, which is not only more stable, but brings with it a
basket of benefits such as technology transfer, access to export markets, best management practices among others
which can have economy‐wide benefits, with the right policy mix in place. (emphasis added)
http://www.business‐standard.com/india/news/the‐external‐constraint/420434/ 112 UNCTAD, World Investment Report, 2010.
65
For, despite the eclectic nature of its presentation (where it sometimes criticizes
speculative capital), UNCTAD/WIRs leave the overall impression that all the figures
that it provides for FDI are indeed ʺgenuineʺ FDI which plays a ʺsignificantʺ role in
the development of Third World countries. This is, to say the least, highly misleading
and improper.113
While India’s FDI data did reveal some major deviations and specific features one does
not know the extent of such anomalies in respect of FDI data of other countries. It is also
necessary to underline here that a number of companies which are reported as recipients
of FDI do not appear among the foreign affiliates in India reported on the ITC‐UNCTAD
database www.investmentmap.org. The information for the database is provided by Dun
& Bradstreet—world’s leading corporate information provider.114 One is not sure about
other countries.
The aggregate FDI data reported by UNCTAD needs to be understood with many a
qualification. For instance, while UNCTAD in its “Global and Regional FDI Trends in
2010” reported that global capital flows stagnated during 2010 compared to 2009, the
details show that “(I)mproved economic performance in many parts of the world and
increased profits of foreign affiliates, especially in developing countries, lifted reinvested
earnings to nearly double their 2009 level”.115 A look at the accompanying graph clearly
suggests that actual cross‐border flows would have fallen considerably during 2010 thus
giving scope to a completely different interpretation of the global situation.
The difference between FPI and FDI having been minimised through the propagation of
a liberal BOP‐based definition, an environment of competition among countries for
113 Yash Tandon, “FDI, globalization, UNCTAD and human development”, available at
http://www.twnside.org.sg/title/fdi.htm. Mr. Tandon was former Executive Director, South Centre, Geneva. 114 In fact, it is difficult to reconcile how the number of foreign affiliates are arrived at. For instance, according
to the database, there are 59 affiliates under the category ‘Publishing, printing and reproduction of recorded
media’. But a closer examination reveals that there are no more than 33 affiliates and the higher number is
explained by the fact that offices of the same affiliate in different cities are counted as affiliates. That is how
Scholastic Corp of USA is shown to have 13 affiliates in India while in actuality only one affiliate Scholastic
India Pvt Ltd is shown with 13 entries: two each in Bangalore, Chennai, Gurgaon, Kolkata, Mumbai, Pune
and one in Delhi. Employment data is reported only against its Gurgaon office. The registered office of the
company is in Gurgaon. The rest may be branches or offices of ‘city‐based educational coordinators’.
Similarly, Cadbury UK’s some of the eight affiliates in India are either regional offices/factories/sales offices
of Cadbury India Ltd in different locations. Incidentally, some of the factories (Himachal Pradesh, Pune and
Gwalior) do not appear among the eleven. Surprisingly, Cadbury India’s starting year is reported as 1990
whereas the company started its operations in India in 1948, which fact is also confirmed by the MCA
website. On the other hand, Unilever Plc is reported to have 11 affiliates. One, however, finds only four
unique companies in the details section with Hindustan lever Ltd appearing six times and Lever India
Exports Ltd three times. The remaining are Diversey Lever and Vashisti Detergents Ltd. Surprisingly except
for Lever India Exports Ltd none of the Hindustan Unilever’s other nine subsidiaries, or its joint ventures
Hi‐Tech Surfactants Ltd or Kimberly Clark Lever Pvt Ltd. find a place among the affiliates.
Further, if we go by UNCTAD the number of foreign affiliates in China declined from 42,753 in 2004 to
25,267 whereas for India they increased from 518 to 3,891. 115 Supra note 59.
66
attracting FDI has emerged fuelled by indicators like FDI Confidence Index, Inward FDI
Attractiveness index, Inward FDI Performance Index, etc. Developing countries vie
among themselves for larger volumes of FDI. It was indeed argued against such
comparisons:
India has the potential for attracting increased volumes of FDI. She can do so with a
set of policies which are in the interests of not only foreign investors but also
domestic investors. It is though a bit farfetched to argue that FDI is a panacea for the
development problem and India should throw all doors wide open to FDI. It would also be a
folly to woo FDI if only because China attracts relatively high volumes of FDI. 116 (emphasis
added)
FDI policies need not have to be unidirectional. Just as they are liberalized, they could
also be tightened if the situation so warrants.
…it would be foolish to have either uniformly restrictive or uniformly liberal policies
towards TNCs across different industries. This also means that the same industry
may, and indeed should, become more or less open to FDI over time, depending on
the changes in various internal and external conditions that affect it.117
After almost twenty years of trying to attract FDI probably the time has come to review
India’s FDI policy, not from the view point of maximizing the inflows but from the
perspective of bridging the gaps and gaining from it.
4.3 Need for a Relevant Data System
While it may be necessary to follow the international criteria for balance of payment
purposes, a detailed break‐up of the foreign capital inflows is unavoidable for a proper
assessment of their developmental impact, the raison d’etre for FDI. Also required is a
reliable data system which enables analysis of operations of a representative set of Indian
companies, including FDI companies. Unfortunately, by switching over to the new
definition of ‘FDI companies’ and abandoning what was probably the more appropriate
category of FCRCs by the RBI, the representative character of the studies on foreign
companies in India has become even more debatable. The control aspect underlying the
definition of FCRCs more closely reflected provisions of the Companies Act. In fact,
thanks to the poor information base of the Indian corporate sector itself, today the role
116 See: V.N. Balasubramanyam and Vidya Mahambare, “Foreign Direct Investment in India”, paper presented
at a workshop on Foreign Direct Investment in Developing Countries held at the Lake District, September
13−14, 2002. This was in response to Nirupam Bajpai and Jeffrey D. Sachs, “Foreign Direct Investment in
India: Issues and Problems”, Development Discussion Paper No. 759, Harvard Institute for International
Development, March 2000 wherein it was posed:
Why is it that India, which provides the largest market after China in the developing world is unable to
attract substantial volume of FDI? Further, when it comes to comparing China and India, why can India
not match or even outpace China in attracting FDI given India’s superior conditions regarding the rule of
law, democracy, and the widely spoken English language? 117 Supra note 109.
67
and place of FDI in the economy is not known with any reasonable degree of accuracy.
Consequently, studies are often based upon small sets of foreign companies identified
from databases which have lost much of their relevance in this respect notwithstanding
the fact that they do try to cover some unlisted companies as well.118 With the importance
of financial investors and Round‐tripping investments in India’s FDI inflows, there is a
need to classify the investments according to the nature of foreign investors. Even OECD
suggested that when the Round‐tripping phenomenon becomes significant these should
be indicated as separate supplementary breakdowns.119
Both at the global level and at the national level in India considerable time and other
resources are being invested to promote FDI. To assess its contribution the need for a
proper information base on the activities of FDI companies is well accepted. It is worth
referring to UNCTAD when it said:
FDI data alone are not enough to assess the importance and impact of FDI in host
economies. They should be complemented with statistical information on the
activities of TNCs and their foreign affiliates (e.g. sales, employment, trade, research
and development (R&D)).120
It is also relevant to refer to Lipsey when he said:
One would need an unusual type of FDI data to explain the role of such an
investment and such an affiliate on the host economy, but the value of the investment
stock or the corresponding flows, and the value of assets, sales, and value added are
uninformative on the subject. Only host country data collection on establishment and
firm bases, including real inputs such as labor and physical capital, and R&D, and
financial flows such as tax payments, can begin to reveal host country impacts.121
India and probably many other countries are nowhere near having such a data system.
Important components of the reported FDI inflows like ‘reinvested’ earnings and ‘other
capital’ are simple estimates the veracity of which one cannot vouch for. It is time the
118 While many new foreign companies are not getting listed on the Indian stock exchanges, some of the
important existing ones had even got delisted and more have plans to exit. The then Finance Minister, for
instance, reported that: “Between 1997‐1998 and 2002‐2003 we have a total of 62 companies that have been
actually de‐listed. Out of these 62 companies, 41 are Indian companies and 21 are categorised as multi‐
national companies.”
Reply to Lok Sabha Starred Question No. 64 dated February 21, 2003.
Some of the prominent delisted ones are: Avery, Bosch Rexroth, Cadbury, Carrier Aircon, Digital
Globalsoft., Hoganas India, iGATE Global Solutions, ITW Signode India, Kodak, Ondeo Nalco, Otis,
Panasonic AVC, Philips, Ray Ban, Reckitt Benckiser, Sandvik, Syngenta, Tektronix, Vickers Systems,
Wartsila and Yokogawa India.
See also: http://ahmedsk00.blogspot.com/2007/06/mncs‐likely‐to‐delist‐names‐include‐i.html 119 OECD, Benchmark Definition of Foreign Direct Investment: Fourth Edition, 2008, p. 159. 120 UNCTAD, World Investment Report, 2006, p. 13. 121 Robert E. Lipsey, “What do users of FDI data want to learn from them and do the data tell them the truth?”,
paper presented at the UNCTAD Expert Meeting on Capacity Building in the Area of FDI: Data
Compilation and Policy Formulation in Developing Countries, 12‐14 December 2005.
68
Indian policymakers start making a clear distinction between different types of foreign
investors which could help them in their own assessment of the situation on the one
hand and enable assessment of benefits/costs by others, on the other.122 In the absence of
such an analysis, success of the FDI policy would only be measured in terms of attracting
larger and larger amount of inflows to achieve which, beyond a point, one has no option
but to open up more and more. And there is a limit to it. There are multiple official
agencies like RBI, Ministry of Commerce & Industry, Ministry of Finance, Foreign
Investment Implementation Authority (FIIA), FIPB, SEBI, Central Statistical Organisation
(CSO), National Manufacturing Competitiveness Council, Investment Commission,
Competition Commission, Public‐Private Partnerships with industry bodies and finally
the Ministry of Corporate Affairs itself in dealing with foreign entities. What is required
is an open mind and commonality in approach to unravel the FDI phenomenon and to
maximise the benefits from it.
122 The inflows data received by RBI regional offices being offered as proxy for state‐wise distribution of FDI
reflects poorly on the existing information base on FDI in India. As noted above, one cannot take even
UNCTAD’s reporting of foreign affiliates in the country at its face value.

69
Annexure‐A
Illustrative Cases of FDI Inflows which involve Acquisition of Companies in India
Route, Month & Year
Indian Company Foreign Investor Country Inflow (` Cr.)
R‐1208 Ambuja Cement India Ltd Holderind Investments Ltd Mauritius 810.03
A‐0407 Anchor Electricals Pvt Ltd Matsushita Electric Works Ltd Acquisition of Share
1,440.83
R‐0807 Anchor Electricals Pvt Ltd Matsushita Electrical Japan 425.67
A‐0108 Anchor Electricals Pvt Ltd Matsushita Electric Works Ltd Japan 104.99
R‐4906 Astrix Laboratories Ltd Aspen Pharmacare Holding Ltd South Africa 164.28
R‐0508 Balaji Telefilms Ltd Asian Broadcasting FZ‐LLC U.A.E. 123.25
R‐0608 Bhukhanvala Diamond Systems Pvt Ltd
Hilti Far East Pvt Ltd Singapore 23.74
A‐0507 Bombay Stock Exchange Atticus Mauritius Mauritius 160.62
A‐0507 Bombay Stock Exchange Callwell Asset Management Acquisition of Share
160.62
A‐0507 Bombay Stock Exchange Katriel Investment Ltd Acquisition of Share
160.62
F‐0607 Bombay Stock Exchange Deutsche Boerse AG Germany 200.78
F‐0607 Bombay Stock Exchange Singapore Stock Exchange Singapore 200.78
R‐0608 Centum Frequency Products Pvt Ltd
Rakon (Mauritius) Ltd. Mauritius 26.29
R‐0705 Dabur Pharma Ltd International Finance Corp U.S.A. 65.58
F‐0505 DCM Benetton India Ltd ‐ Luxembourg 22.50
F‐0505 Emergent Genetics India Pvt Ltd ‐ Cayman Island
64.80
R‐1208 Fresh & Honest Cafe Ltd Lavazza Netherlands BV Netherlands 30.00
R‐0608 Karnavati Rasayan Ltd Cabb Holding Gmbh Germany 22.20
R‐0908 MTR Foods Ltd Orkla Asia Pacific Pte Ltd Singapore 50.00
R‐0908 MTR Foods Ltd Orkla Asia Pacific Pte Ltd Singapore 50.00
R‐1006 Mysore Cements Ltd (Now Heidelberg Cement India)
Cementrum 1 BV Netherlands 359.10
A‐1006 Mysore Cements Ltd (Now Heidelberg Cement India)
Cementrum 1 BV Netherlands 203.00
A‐0307 Mysore Cements Ltd (Now Heidelberg Cement India)
Cementrum 1 BV Netherlands 77.72
A‐0708 My Home Industries Ltd CRH India ‐ 1,170.53
R‐0708 My Home Industries Ltd CRH India Investments BV Netherlands 517.36
F‐0107 Parryware Roca Pvt Ltd Roca Sanitario S A Spain 173.98
A‐0808 Parryware Roca Pvt Ltd Roca Bathroom Investments Acquisition of Share
747.39
R‐1208 Shyamtelelink Ltd Sistema Joint Stock Financial Corp
Russia 1,482.00
R‐0608 SJK Steel Plant Ltd Corporaction Sidenor Say Cia Src
Spain 79.12
F‐1008 SKF Technologies Pvt Ltd Aktiebolaget SKF Sweden 35.04
A‐0208 Sky Gourmet Catering Pvt Ltd IHC Mauritius Corp Mauritius 72.21
R‐1108 Sky Gourmet Catering Pvt Ltd IHC Mauritius Corp Mauritius 74.51
R‐0607 Solvay Specialities India Pvt Ltd Solyay Holding Netherland BV Netherlands 225.00
R‐1007 UTV Software Communication Ltd Walt Disney Co Singapore 65.45
R‐0105 Vijay Industries & Projects Ltd ‐ U.K. 47.79 Note: R: RBI Automatic Route; F: FIPB Approval; A: Acquisition Route. The latter have been included to show the
contradictory classification of the inflows from the same foreign investor in the same Indian company.
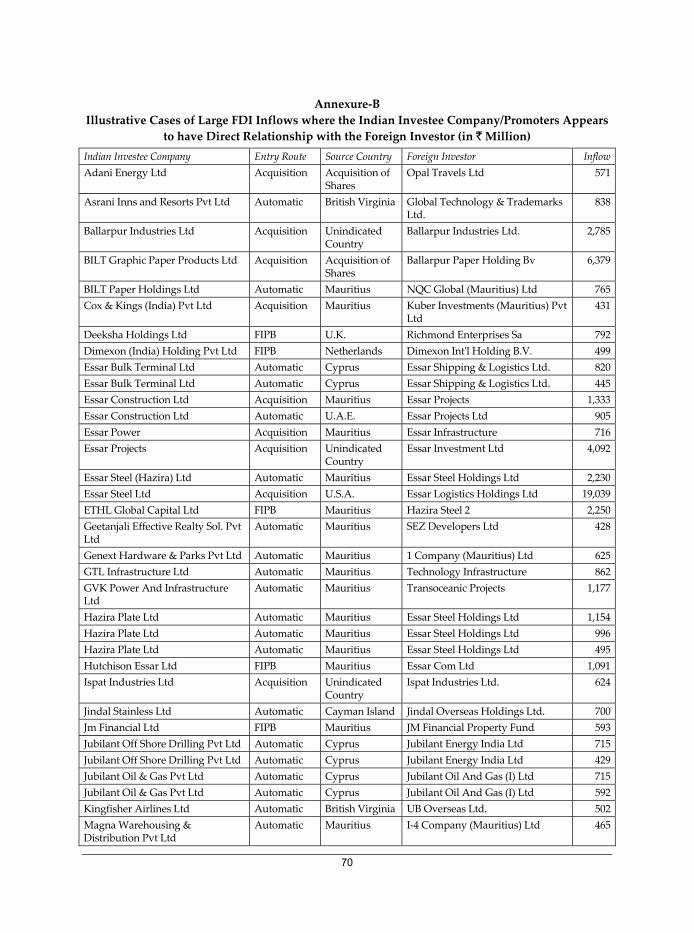
70
Annexure‐B
Illustrative Cases of Large FDI Inflows where the Indian Investee Company/Promoters Appears
to have Direct Relationship with the Foreign Investor (in ` Million)
Indian Investee Company Entry Route Source Country Foreign Investor Inflow
Adani Energy Ltd Acquisition Acquisition of Shares
Opal Travels Ltd 571
Asrani Inns and Resorts Pvt Ltd Automatic British Virginia Global Technology & Trademarks Ltd.
838
Ballarpur Industries Ltd Acquisition Unindicated Country
Ballarpur Industries Ltd. 2,785
BILT Graphic Paper Products Ltd Acquisition Acquisition of Shares
Ballarpur Paper Holding Bv 6,379
BILT Paper Holdings Ltd Automatic Mauritius NQC Global (Mauritius) Ltd 765
Cox & Kings (India) Pvt Ltd Acquisition Mauritius Kuber Investments (Mauritius) Pvt Ltd
431
Deeksha Holdings Ltd FIPB U.K. Richmond Enterprises Sa 792
Dimexon (India) Holding Pvt Ltd FIPB Netherlands Dimexon Intʹl Holding B.V. 499
Essar Bulk Terminal Ltd Automatic Cyprus Essar Shipping & Logistics Ltd. 820
Essar Bulk Terminal Ltd Automatic Cyprus Essar Shipping & Logistics Ltd. 445
Essar Construction Ltd Acquisition Mauritius Essar Projects 1,333
Essar Construction Ltd Automatic U.A.E. Essar Projects Ltd 905
Essar Power Acquisition Mauritius Essar Infrastructure 716
Essar Projects Acquisition Unindicated Country
Essar Investment Ltd 4,092
Essar Steel (Hazira) Ltd Automatic Mauritius Essar Steel Holdings Ltd 2,230
Essar Steel Ltd Acquisition U.S.A. Essar Logistics Holdings Ltd 19,039
ETHL Global Capital Ltd FIPB Mauritius Hazira Steel 2 2,250
Geetanjali Effective Realty Sol. Pvt Ltd
Automatic Mauritius SEZ Developers Ltd 428
Genext Hardware & Parks Pvt Ltd Automatic Mauritius 1 Company (Mauritius) Ltd 625
GTL Infrastructure Ltd Automatic Mauritius Technology Infrastructure 862
GVK Power And Infrastructure Ltd
Automatic Mauritius Transoceanic Projects 1,177
Hazira Plate Ltd Automatic Mauritius Essar Steel Holdings Ltd 1,154
Hazira Plate Ltd Automatic Mauritius Essar Steel Holdings Ltd 996
Hazira Plate Ltd Automatic Mauritius Essar Steel Holdings Ltd 495
Hutchison Essar Ltd FIPB Mauritius Essar Com Ltd 1,091
Ispat Industries Ltd Acquisition Unindicated Country
Ispat Industries Ltd. 624
Jindal Stainless Ltd Automatic Cayman Island Jindal Overseas Holdings Ltd. 700
Jm Financial Ltd FIPB Mauritius JM Financial Property Fund 593
Jubilant Off Shore Drilling Pvt Ltd Automatic Cyprus Jubilant Energy India Ltd 715
Jubilant Off Shore Drilling Pvt Ltd Automatic Cyprus Jubilant Energy India Ltd 429
Jubilant Oil & Gas Pvt Ltd Automatic Cyprus Jubilant Oil And Gas (I) Ltd 715
Jubilant Oil & Gas Pvt Ltd Automatic Cyprus Jubilant Oil And Gas (I) Ltd 592
Kingfisher Airlines Ltd Automatic British Virginia UB Overseas Ltd. 502
Magna Warehousing & Distribution Pvt Ltd
Automatic Mauritius I‐4 Company (Mauritius) Ltd 465
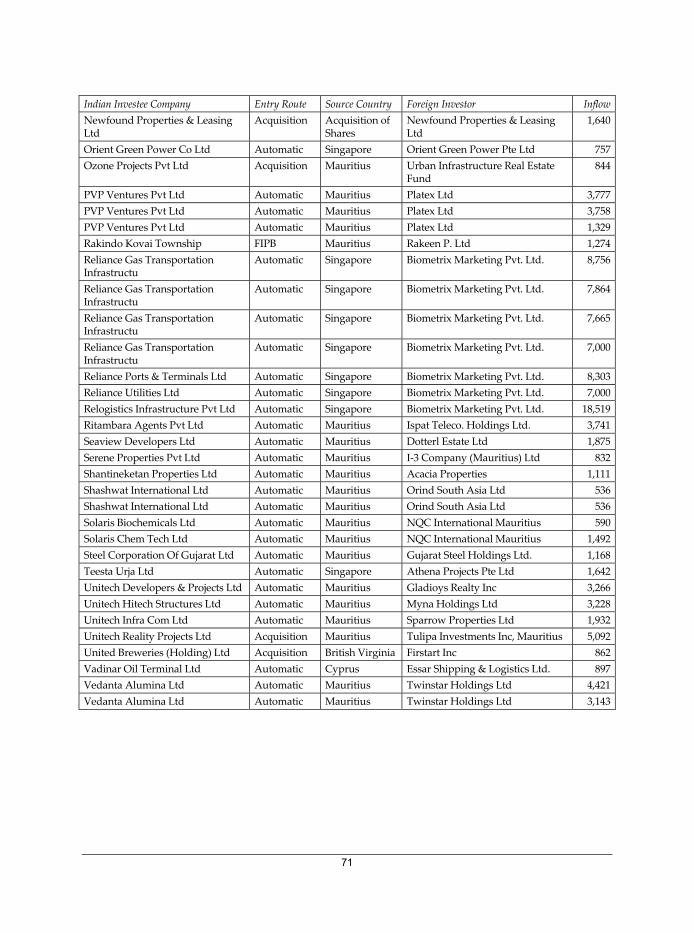
71
Indian Investee Company Entry Route Source Country Foreign Investor Inflow
Newfound Properties & Leasing Ltd
Acquisition Acquisition of Shares
Newfound Properties & Leasing Ltd
1,640
Orient Green Power Co Ltd Automatic Singapore Orient Green Power Pte Ltd 757
Ozone Projects Pvt Ltd Acquisition Mauritius Urban Infrastructure Real Estate Fund
844
PVP Ventures Pvt Ltd Automatic Mauritius Platex Ltd 3,777
PVP Ventures Pvt Ltd Automatic Mauritius Platex Ltd 3,758
PVP Ventures Pvt Ltd Automatic Mauritius Platex Ltd 1,329
Rakindo Kovai Township FIPB Mauritius Rakeen P. Ltd 1,274
Reliance Gas Transportation Infrastructu
Automatic Singapore Biometrix Marketing Pvt. Ltd. 8,756
Reliance Gas Transportation Infrastructu
Automatic Singapore Biometrix Marketing Pvt. Ltd. 7,864
Reliance Gas Transportation Infrastructu
Automatic Singapore Biometrix Marketing Pvt. Ltd. 7,665
Reliance Gas Transportation Infrastructu
Automatic Singapore Biometrix Marketing Pvt. Ltd. 7,000
Reliance Ports & Terminals Ltd Automatic Singapore Biometrix Marketing Pvt. Ltd. 8,303
Reliance Utilities Ltd Automatic Singapore Biometrix Marketing Pvt. Ltd. 7,000
Relogistics Infrastructure Pvt Ltd Automatic Singapore Biometrix Marketing Pvt. Ltd. 18,519
Ritambara Agents Pvt Ltd Automatic Mauritius Ispat Teleco. Holdings Ltd. 3,741
Seaview Developers Ltd Automatic Mauritius Dotterl Estate Ltd 1,875
Serene Properties Pvt Ltd Automatic Mauritius I‐3 Company (Mauritius) Ltd 832
Shantineketan Properties Ltd Automatic Mauritius Acacia Properties 1,111
Shashwat International Ltd Automatic Mauritius Orind South Asia Ltd 536
Shashwat International Ltd Automatic Mauritius Orind South Asia Ltd 536
Solaris Biochemicals Ltd Automatic Mauritius NQC International Mauritius 590
Solaris Chem Tech Ltd Automatic Mauritius NQC International Mauritius 1,492
Steel Corporation Of Gujarat Ltd Automatic Mauritius Gujarat Steel Holdings Ltd. 1,168
Teesta Urja Ltd Automatic Singapore Athena Projects Pte Ltd 1,642
Unitech Developers & Projects Ltd Automatic Mauritius Gladioys Realty Inc 3,266
Unitech Hitech Structures Ltd Automatic Mauritius Myna Holdings Ltd 3,228
Unitech Infra Com Ltd Automatic Mauritius Sparrow Properties Ltd 1,932
Unitech Reality Projects Ltd Acquisition Mauritius Tulipa Investments Inc, Mauritius 5,092
United Breweries (Holding) Ltd Acquisition British Virginia Firstart Inc 862
Vadinar Oil Terminal Ltd Automatic Cyprus Essar Shipping & Logistics Ltd. 897
Vedanta Alumina Ltd Automatic Mauritius Twinstar Holdings Ltd 4,421
Vedanta Alumina Ltd Automatic Mauritius Twinstar Holdings Ltd 3,143

72
Annexure‐C1
Corporate structure of Ishaan Real Estate plc.
Source: Ishaan Real Estate plc., AIM Admission Document. AIM is Alternative Investm
ent Market of the London Stock Exchan
ge an
d is significan
tly
less regulated.
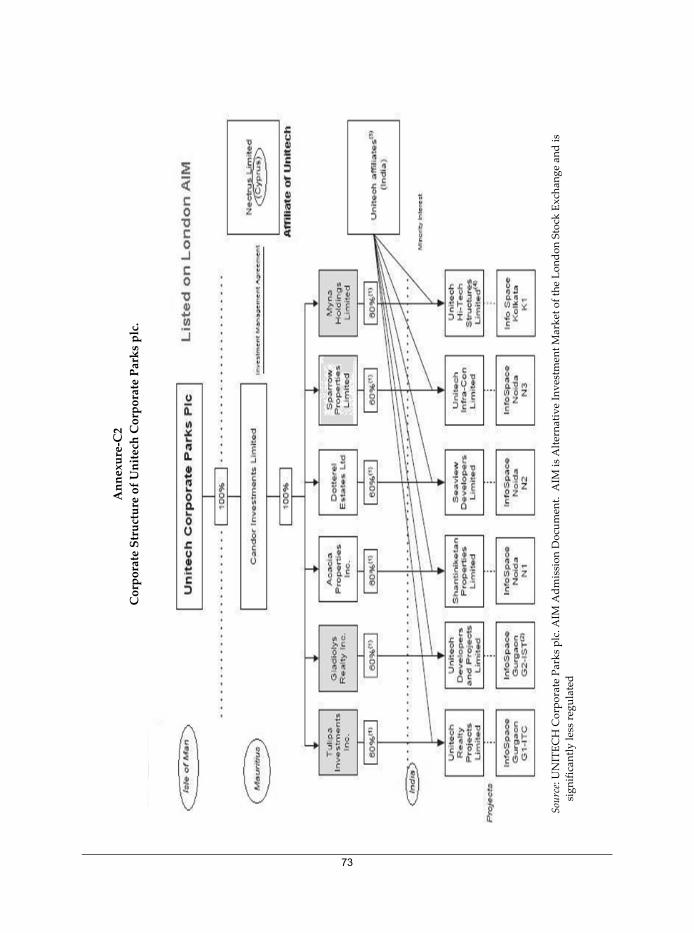
73
Annexure‐C2
Corporate Structure of Unitech Corporate Parks plc.
Source: UNITECH Corporate Parks plc. A
IM Admission Document. A
IM is Alternative Investm
ent Market of the London Stock Exchan
ge an
d is
significantly less regulated

74
Annexure‐C3 Vedanta Group’s Organisational Chart# as on February 28, 2010
Note: (1) It was explained that “We also own certain other non‐operating subsidiaries that are not material and are not
shown in the organisational chart …”. (2) Volcan Investments Ltd owns 162,250,000 Ordinary Shares, or approximately 59.88% of the issued ordinary share capital of Vedanta. Volcan is owned and controlled by the Anil Agarwal Discretionary Trust (Trust). Onclave PTC Ltd (Onclave) is the trustee of the Trust and controls all voting and investment decisions of the Trust. As a result, shares beneficially owned by Volcan may be deemed to be beneficially owned by the Trust and, in turn, by Onclave. Mr. Anil Agarwal, the Executive Chairman of Vedanta (…), may be deemed to have beneficial ownership of shares that may be owned or deemed to be beneficially owned by Onclave. (3) Shading indicates operating companies.
Source: Offering Circular dated March 26, 2010 available at http://www.vedantaresources.com/uploads/ offeringcircular42017bond.pdf

75
Annexure D
Educational Qualifications and Past Experience of Indians* Working with General Atlantic,
a Leading US‐Based PE Firm
Name Position Educational Qualifications Previous Employment
Havaldar,
Abhay
Managing
Director
1. Univ. of Bombay, Bachelor
Degree (Electrical Engineering);
2. London Business School,
Masters in Management
Partner at Draper International &
ConnectCapital
Pandit, Ranjit Managing
Director
1. University of Bombay, BE
(Elect. Engg);
2. Wharton School, MBA
Managing Director, McKinsey & Co
Rai, Raul R. Managing
Director
1. Boston University, B.A. in
Computer Science and
Economics; 2. Harvard Business
School, MBA
1. Vizzavi Ltd., London, Corporate
Strategy & Planning Director.
2. Vice President in the Communication,
Media & Technology group at Goldman
Sachs; 3. UBS: Managing Director and
Global Co‐Head of Software Investment
Banking
Sharma,
Sunish
Managing
Director
1. IIT Delhi, MTech; 2. Harvard
Business School; MBA
1. Program Associate, Bill & Melinda
Gates Foundation 2. Business Analyst,
McKinsey & Co
Agrawal,
Abhishek #
Vice President Harvard Business School, MBA;
Wharton School, BS in
Economics
1. Lazardʹs investment banking group
and 2. Lazard Technology Partners, a
venture capital firm.
Mittal,
Nishant
Vice President 1. Delhi College of Engineering;
B.E.; 2. University of California
Irvine; M.S. in Biomedical Engg;
3. Stanford Graduate School of
Business; MBA
Business Analyst, McKinsey & Co
Sharma,
Nishant
Vice President 1. IIT Delhi, M.Tech; 2. Harvard
Business School, MBA
1. Business Analyst, McKinsey & Co; 2.
Bill & Melinda Gates Foundation
Soni, Amit # Vice President 1. B.Tech, IIT Delhi; 2. Wharton
School, MBA
1. Associate Director, 3i Plc; 2. Bill &
Melinda Gates Foundation; 3. McKinsey
& Co
Ahmed, Tariq Senior
Associate
Ross School of Business,
University of Michigan, BBA
1. Morgan Stanley, Analyst; 2. AEA
Investors, Senior Associate;
3. Blue River Capital, Vice President
Mehta, Parin Senior
Associate
1. Mumbai University, BE.; 2.
Sydenham Institute of Mgt
Studies, MBA.
1. Research Analyst, McKinsey & Co; 2.
Senior Consultant, Capgemini
Consulting.
Sood, Rajat # Senior
Associate
1. IIT Delhi, B.Tech. (Elect.
Engg); 2. IIM Calcutta, MBA
Associate, McKinsey & Co
Marathe,
Nikhil
Associate 1. Karnataka University; B Com;
2. Institute of Chartered
Accountants of India
1. Merrill Lynch; 2. Morgan Stanley
Advantage Services, Associate
Jain, Pratik Analyst 1. Lucknow University, B.Com;
2. IMT Ghaziabad, MBA
1. First Global Finance; Research Analyst;
2. JPMorgan Services India, Analyst
* Identified on the basis of individuals’ names. # Based in New York and the remaining, in Mumbai.

76
The PE Firm’s Senior Management
Name Position Educational Qualifications Previous Employment
Steven A
Denning
Chairman Stanford Business School,
MBA; Naval Postgraduate
School, MS
Consultant, McKinsey & Co.
William E Ford CEO Stanford Graduate School of
Business; MBA
Morgan Stanley & Co. as an
investment banker.
John Bernstein Managing
Director
Downing College, Cambridge
University; M.A.
Partner, Advent International
Mark F.
Dzialga
Managing
Director
Columbia University
Graduate School of Business;
MBA,
Co‐head of Merger Technology Group,
Goldman Sachs Group, Inc
William O.
Grabe
Managing
Director
UCLA Graduate School of
Business; MBA, 1963 and New
York University; BS, 1958
IBM Vice President, General Manager,
Marketing and Services, IBM United
States
Abhay
Havaldar
Managing
Director
London Business School; MA,
1994 and Degree in Electrical
Engineering from University of
Bombay.
Partner, ConnectCapital
David C.
Hodgson
Managing
Director
Stanford Graduate School of
Business; MBA, 1982 and
Dartmouth College; BA
President, New England Software
Rene M. Kern Managing
Director
Wharton School and School of
the Arts & Sciences, MBA/MA
Vice President, Morgan Stanley & Co.
was a management consultant with
Bain & Company in Boston, MA
Jonathan
Korngold
Managing
Director
Harvard Business School;
MBA and Harvard University;
BA
Goldman Sachs and Company
Chris Lanning Managing
Director
University of Virginia; JD,
1995 and University of Virginia;
BA, 1991
Senior Corporate Associate, Hunton &
Williams, a Law Firm
Jeff Leng Managing
Director
Wharton School of Business,
University of Pennsylvania;
MBA
Managing Director, Warburg Pincus
Anton Levy Managing
Director
Columbia University
Graduate School of Business;
MBA
Financial Analyst,Morgan Stanley
Adrianna C.
Ma
Managing
Director
Harvard Business School;
MBA, 2000 and Massachusetts
Institute of Technology; MEng
and BS
Vice President, Morgan Stanley & Co
Marc F.
McMorris
Managing
Director
Wharton School, University of
Pennsylvania; MBA
Vice President, Goldman Sachs Group
Thomas
Murphy
Managing
Director
Stern School of Business, New
York University; MBA
Senior Accountant, Deloitte & Touche
Fernando
Marques
Oliveira
Managing
Director
BS; Fundação Getulio Vargas,
São Paulo
Director, Grupo Icatu
Ranjit Pandit Managing
Director
Wharton School, University of
Pennsylvania; MBA
Managing Director, McKinsey & Co
Drew Pearson Managing School of the Arts & Sciences, Business Analyst, McKinsey & Co

77
Name Position Educational Qualifications Previous Employment
Director University of Pennsylvania;
MA/BA, 1994 and The Wharton
School, University of
Pennsylvania; BS
Raul R. Rai Managing
Director
Harvard Business School;
MBA, 1996
Managing Director, UBS
Goldman Sachs in New York and
London, as Vice President in the
Communications, Media & Technology
group
David
Rosenstein
Managing
Director
New York University School
of Law; JD, 1993
Associate at the New York law firm of
Paul, Weiss, Rifkind, Wharton &
Garrison.
Sunish Sharma Managing
Director
Indian Institute of
Management, MBA, 1997;
Indian Institute of Cost and
Work Accountants, Cost &
Work Accountant
Engagement Manager, McKinsey & Co
Tom Tinsley Managing
Director
Stanford Graduate School of
Business; MBA, 1978 and
University of Notre Dame; BA,
1975
Chairman and CEO, Baan Company
N.V. and Director, McKinsey & Co
Philip P.
Trahanas
Managing
Director
Wharton School, University of
Pennsylvania; MBA, 1996, The
Moore School, University of
Pennsylvania
Senior Associate, Morgan Stanley
Florian
Wendelstadt
Managing
Director
EAP ‐ ESCP; Masters and Dipl
Kfm, 1993 and University of
Passau; BA, 1990
Consultant, Bain Consulting
Source: Based on the details given at the company’s website : http://www.generalatlantic.com The shaded entries are common to the first list.
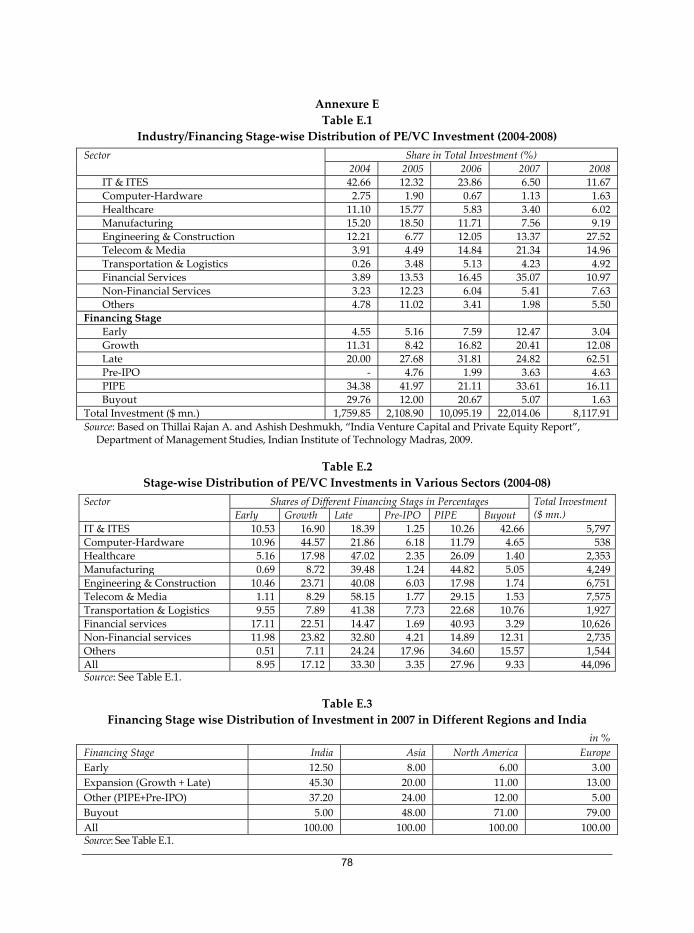
78
Annexure E
Table E.1
Industry/Financing Stage‐wise Distribution of PE/VC Investment (2004‐2008)
Sector Share in Total Investment (%)
2004 2005 2006 2007 2008
IT & ITES 42.66 12.32 23.86 6.50 11.67
Computer‐Hardware 2.75 1.90 0.67 1.13 1.63
Healthcare 11.10 15.77 5.83 3.40 6.02
Manufacturing 15.20 18.50 11.71 7.56 9.19
Engineering & Construction 12.21 6.77 12.05 13.37 27.52
Telecom & Media 3.91 4.49 14.84 21.34 14.96
Transportation & Logistics 0.26 3.48 5.13 4.23 4.92
Financial Services 3.89 13.53 16.45 35.07 10.97
Non‐Financial Services 3.23 12.23 6.04 5.41 7.63
Others 4.78 11.02 3.41 1.98 5.50
Financing Stage
Early 4.55 5.16 7.59 12.47 3.04
Growth 11.31 8.42 16.82 20.41 12.08
Late 20.00 27.68 31.81 24.82 62.51
Pre‐IPO ‐ 4.76 1.99 3.63 4.63
PIPE 34.38 41.97 21.11 33.61 16.11
Buyout 29.76 12.00 20.67 5.07 1.63
Total Investment ($ mn.) 1,759.85 2,108.90 10,095.19 22,014.06 8,117.91
Source: Based on Thillai Rajan A. and Ashish Deshmukh, “India Venture Capital and Private Equity Report”, Department of Management Studies, Indian Institute of Technology Madras, 2009.
Table E.2
Stage‐wise Distribution of PE/VC Investments in Various Sectors (2004‐08)
Sector Shares of Different Financing Stags in Percentages Total Investment($ mn.) Early Growth Late Pre‐IPO PIPE Buyout
IT & ITES 10.53 16.90 18.39 1.25 10.26 42.66 5,797
Computer‐Hardware 10.96 44.57 21.86 6.18 11.79 4.65 538
Healthcare 5.16 17.98 47.02 2.35 26.09 1.40 2,353
Manufacturing 0.69 8.72 39.48 1.24 44.82 5.05 4,249
Engineering & Construction 10.46 23.71 40.08 6.03 17.98 1.74 6,751
Telecom & Media 1.11 8.29 58.15 1.77 29.15 1.53 7,575
Transportation & Logistics 9.55 7.89 41.38 7.73 22.68 10.76 1,927
Financial services 17.11 22.51 14.47 1.69 40.93 3.29 10,626
Non‐Financial services 11.98 23.82 32.80 4.21 14.89 12.31 2,735
Others 0.51 7.11 24.24 17.96 34.60 15.57 1,544
All 8.95 17.12 33.30 3.35 27.96 9.33 44,096Source: See Table E.1.
Table E.3
Financing Stage wise Distribution of Investment in 2007 in Different Regions and India
in %
Financing Stage India Asia North America Europe
Early 12.50 8.00 6.00 3.00
Expansion (Growth + Late) 45.30 20.00 11.00 13.00
Other (PIPE+Pre‐IPO) 37.20 24.00 12.00 5.00
Buyout 5.00 48.00 71.00 79.00
All 100.00 100.00 100.00 100.00 Source: See Table E.1.
79
List of ISID Working Papers
WP2010/12 On the Sustainability of India’s Non‐Inclusive High Growth, Surajit Mazumdar
WP2010/11 Operation of FDI Caps in India and Corporate Control Mechanisms, K.S.
Chalapati Rao & Biswajit Dhar.
WP2010/10 Indian Capitalism: A Case That Doesn’t Fit?, Surajit Mazumdar.
WP2010/09 Big Business and Economic Nationalism in India, Surajit Mazumdar
WP2010/08 Aligning with both the Soviet Union and with the Pharmaceutical
Transnational’s: Dilemmas attendant on initiating Drug Production in India,
Nasir Tyabji.
WP2010/07 The Arduous Route to ensuring some Minimum Public Shareholding in Listed
Companies, K.S. Chalapati Rao.
WP2010/06 Managing Finance in Emerging Economies: The Case of India, Sunanda Sen.
WP2010/05 Social Science Research in Globalising India: Historical Development and Recent
Trends, T.S. Papola.
WP2010/04 Private Industry and the Second Five Year Plan: The Mundhra Episode as
exemplar of Capitalist Myopia, Nasir Tyabji.
WP2010/03 Trading in India’s Commodity Future Markets, Sunanda Sen and Mahua Paul.
WP2010/02 Industry and Services in Growth and Structural Change in India: Some
Unexplored Features, Surajit Mazumdar.
WP2010/01 Does the Current Global Crisis remind us of the Great Depression?, Sunanda Sen.
WP2009/02 Footwear Cluster in Kolkata: A Case of Self‐exploitative Fragmentation, Satyaki
Roy.
WP2009/01 Garments Industry in India: Lessons from Two Clusters, Satyaki Roy.
WP2008/12: Global Financial Crisis: A Classic ‘Ponzi’ Affair?, Sunanda Sen.
WP2008/11: The Analysis of Business Groups: Some Observations with reference to India,
Surajit Mazumdar.
WP2008/10: Outward FDI and Knowledge Flows: A Study of the Indian Automotive Sector,
Jaya Prakash Pradhan.
WP2008/09: South‐South Investment in Infrastructure: The Operation of Indian Firms in
Developing Countries, Jaya Prakash Pradhan.
WP2008/08 Indian Direct Investment in Developing Countries: Emerging Trends and
Development Impacts, Jaya Prakash Pradhan.
WP2008/07 Investment and Growth in India under Liberalization: Asymmetries and
Instabilities, Surajit Mazumdar.
WP2008/06 Media the Key Driver of Consumerism: Macro‐Micro Linkage and Policy
Dimension—A Case Study of FM Radio, Abhilasha Kumari.
* Already Published. Most of the working papers are downloadable from the institute’s website:
http://isidev.nic.in/ or http://isid.org.in/

Institute for Studies in Industrial Development4, Institutional Area, Vasant Kunj, New Delhi - 110 070, India
Phone: +91 11 2676 1600; Fax: +91 11 2676 1631E-mail: [email protected]; Website: http://isid.org.in
About the ISIDThe Institute for Studies in Industrial Development (ISID), successor to the Corporate Studies Group (CSG), is a national-level policy research organization in the public domain and is affi liated to the Indian Council of Social Science Research (ICSSR). Developing on the initial strength of studying India’s industrial regulations, ISID has gained varied expertise in the analysis of the issues thrown up by the changing policy environment. The Institute’s research and academic activities are organized under the following broad thematic areas:
Industrial Development: Complementarity and performance of different sectors (public, private, FDI, cooperative, SMEs, etc.); trends, structures and performance of Indian industries in the context of globalisation; locational aspects of industry in the context of balanced regional development.
Corporate Sector: Ownership structures; fi nance; mergers and acquisitions; effi cacy of regulatory systems and other means of policy intervention; trends and changes in the Indian corporate sector in the background of global developments in corporate governance, integration and competitiveness.
Trade, Investment and Technology: Trade policy reforms, WTO, composition and direction of trade, import intensity of exports, regional and bilateral trade, foreign investment, technology imports, R&D and patents.
Employment, Labour and Social Sector: Growth and structure of employment; impact of economic reforms and globalisation; trade and employment, labour regulation, social protection, health, education, etc.
Media Studies: Use of modern multimedia techniques for effective, wider and focused dissemination of social science research and promote public debates.
ISID has developed databases on various aspects of the Indian economy, particularly concerning industry and the corporate sector. It has created On-line Indexes of 175 Indian Social Science Journals (OLI) and 15 daily English Newspapers. More than one million scanned images of Press Clippings on diverse social science subjects are available online to scholars and researchers. These databases have been widely acclaimed as valuable sources of information for researchers studying India’s socio-economic development.
ISIDInstitute for Studies in Industrial Development
4, Institutional Area, Vasant Kunj New Delhi - 110 070, India
Research and Information System for Developming CountriesZone IV-B, Fourth Floor, India Habitat CentreLodhi Road, New Delhi-110 003, India
(1,1) -1- WP2011cvr.indd 23/02/2011 10:44:09(1,1) -1- WP2011cvr.indd 23/02/2011 10:44:09