Embed Size (px)
DESCRIPTION
‘India’s Leading Infrastructure Companies 2014’, the seventh edition of ‘India’s Leading Infrastructure Companies’ series, is an attempt to highlight the role of infrastructure in the Indian economy by featuring and analysing the performance of the leading companies in the sector. The publication comprises five key sub-segments - construction, oil & gas, ports, power, and telecom.
Citation preview
Contentsexecutive summary ............................................................................. 1
Insights ................................................................................................ 2
Listings ....................................................................................... L13-L14
1
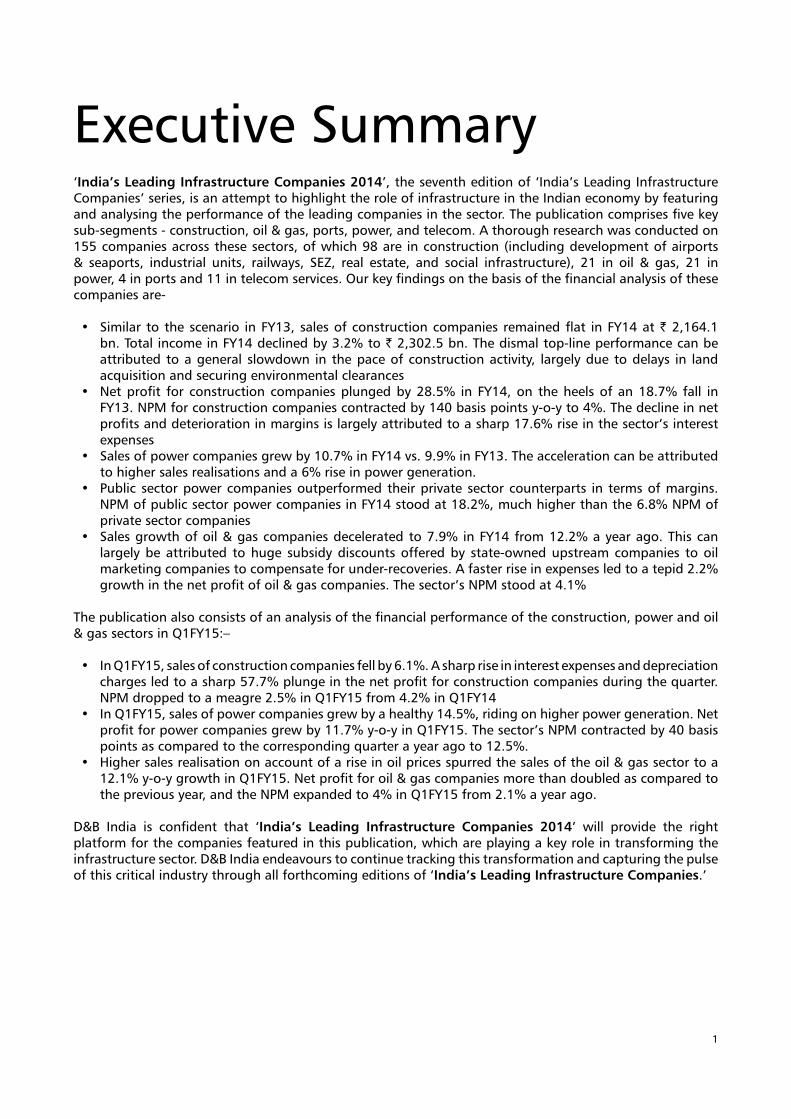
executive summary‘India’s Leading Infrastructure Companies 2014’, the seventh edition of ‘India’s Leading Infrastructure Companies’ series, is an attempt to highlight the role of infrastructure in the Indian economy by featuring and analysing the performance of the leading companies in the sector. The publication comprises five key sub-segments - construction, oil & gas, ports, power, and telecom. A thorough research was conducted on 155 companies across these sectors, of which 98 are in construction (including development of airports & seaports, industrial units, railways, seZ, real estate, and social infrastructure), 21 in oil & gas, 21 in power, 4 in ports and 11 in telecom services. Our key findings on the basis of the financial analysis of these companies are-
• Similar to thescenario inFY13,salesofconstructioncompanies remainedflat inFY14at` 2,164.1 bn.TotalincomeinFY14declinedby3.2%to` 2,302.5 bn. The dismal top-line performance can be attributed to a general slowdown in the pace of construction activity, largely due to delays in land acquisition and securing environmental clearances
• Netprofit for constructioncompaniesplungedby28.5% in FY14,on theheelsofan18.7% fall inFY13.NPMforconstructioncompaniescontractedby140basispointsy-o-yto4%.Thedeclineinnetprofitsanddeteriorationinmarginsislargelyattributedtoasharp17.6%riseinthesector’sinterestexpenses
• Salesofpowercompaniesgrewby10.7%inFY14vs.9.9%inFY13.Theaccelerationcanbeattributedtohighersalesrealisationsanda6%riseinpowergeneration.
• Publicsectorpowercompaniesoutperformedtheirprivatesectorcounterparts in termsofmargins.NPMofpublicsectorpowercompaniesinFY14stoodat18.2%,muchhigherthanthe6.8%NPMofprivate sector companies
• Salesgrowthofoil&gascompaniesdeceleratedto7.9%inFY14from12.2%ayearago.Thiscanlargely be attributed to huge subsidy discounts offered by state-owned upstream companies to oil marketingcompaniestocompensateforunder-recoveries.Afasterriseinexpensesledtoatepid2.2%growthinthenetprofitofoil&gascompanies.Thesector’sNPMstoodat4.1%
The publication also consists of an analysis of the financial performance of the construction, power and oil &gassectorsinQ1FY15:–
• InQ1FY15,salesofconstructioncompaniesfellby6.1%.Asharpriseininterestexpensesanddepreciationchargesledtoasharp57.7%plungeinthenetprofitforconstructioncompaniesduringthequarter.NPMdroppedtoameagre2.5%inQ1FY15from4.2%inQ1FY14
• InQ1FY15,salesofpowercompaniesgrewbyahealthy14.5%,ridingonhigherpowergeneration.Netprofitforpowercompaniesgrewby11.7%y-o-yinQ1FY15.Thesector’sNPMcontractedby40basispointsascomparedtothecorrespondingquarterayearagoto12.5%.
• Highersalesrealisationonaccountofariseinoilpricesspurredthesalesoftheoil&gassectortoa12.1%y-o-ygrowthinQ1FY15.Netprofitforoil&gascompaniesmorethandoubledascomparedtothepreviousyear,andtheNPMexpandedto4%inQ1FY15from2.1%ayearago.
D&B India is confident that ‘India’s Leading Infrastructure Companies 2014’ will provide the right platform for the companies featured in this publication, which are playing a key role in transforming the infrastructure sector. D&B India endeavours to continue tracking this transformation and capturing the pulse of this critical industry through all forthcoming editions of ‘India’s Leading Infrastructure Companies.’

InsIghts
3
InsIghts
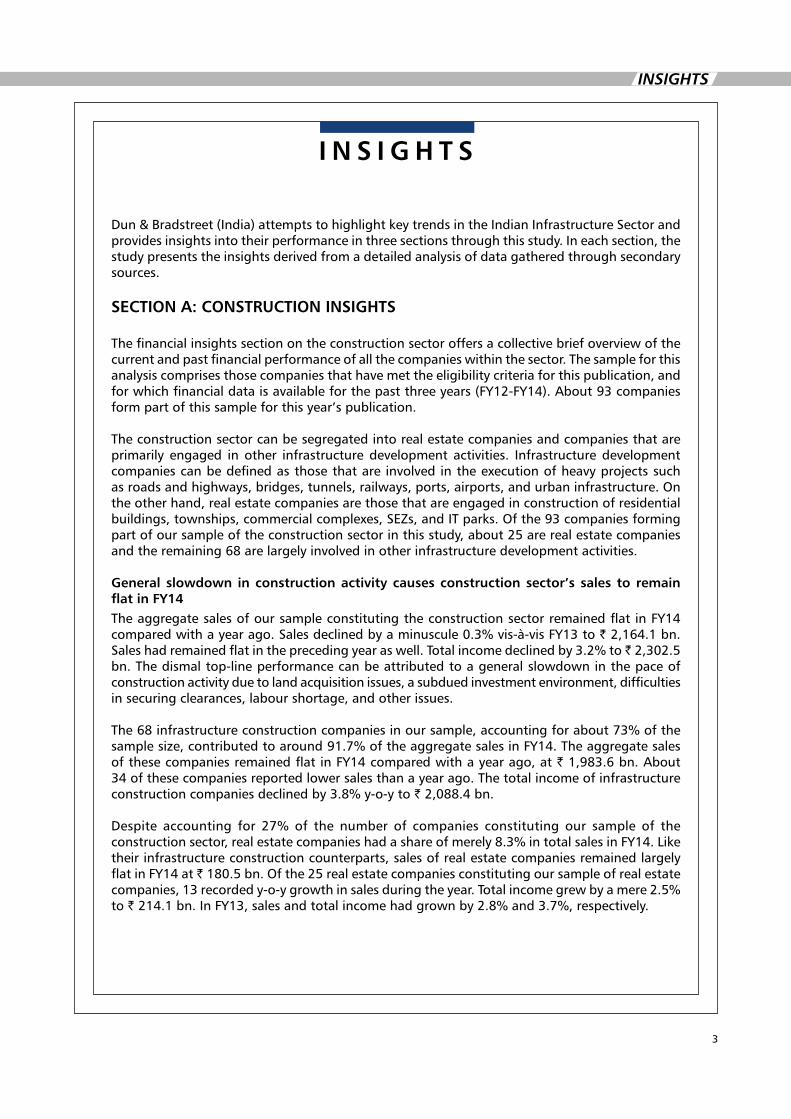
Dun & Bradstreet (India) attempts to highlight key trends in the Indian Infrastructure sector and provides insights into their performance in three sections through this study. In each section, the study presents the insights derived from a detailed analysis of data gathered through secondary sources.
sECtIOn A: COnstRUCtIOn InsIghts
The financial insights section on the construction sector offers a collective brief overview of the current and past financial performance of all the companies within the sector. The sample for this analysis comprises those companies that have met the eligibility criteria for this publication, and forwhichfinancialdataisavailableforthepastthreeyears(FY12-FY14).About93companiesform part of this sample for this year’s publication.
The construction sector can be segregated into real estate companies and companies that are primarily engaged in other infrastructure development activities. Infrastructure development companies can be defined as those that are involved in the execution of heavy projects such as roads and highways, bridges, tunnels, railways, ports, airports, and urban infrastructure. On the other hand, real estate companies are those that are engaged in construction of residential buildings, townships, commercial complexes, seZs, and IT parks. Of the 93 companies forming part of our sample of the construction sector in this study, about 25 are real estate companies and the remaining 68 are largely involved in other infrastructure development activities.
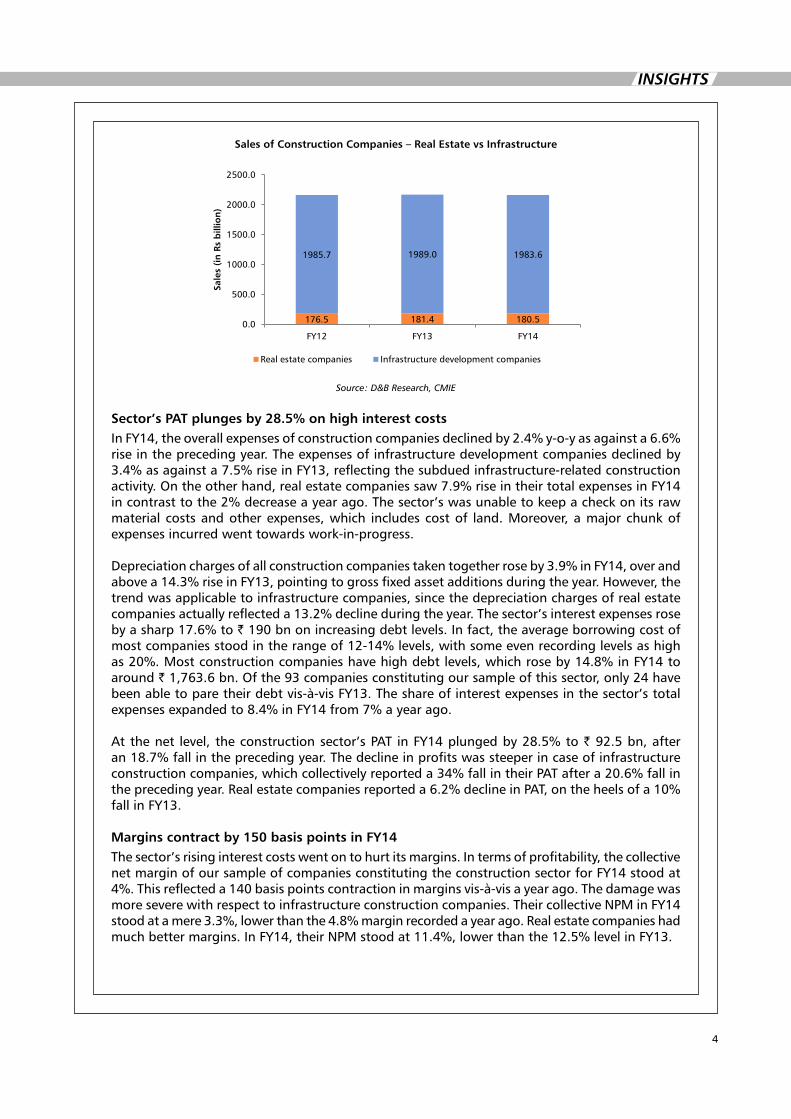
general slowdown in construction activity causes construction sector’s sales to remain flat in FY14TheaggregatesalesofoursampleconstitutingtheconstructionsectorremainedflatinFY14comparedwithayearago.Salesdeclinedbyaminuscule0.3%vis-à-visFY13to` 2,164.1 bn. Saleshadremainedflatintheprecedingyearaswell.Totalincomedeclinedby3.2%to 2,302.5 bn. The dismal top-line performance can be attributed to a general slowdown in the pace of construction activity due to land acquisition issues, a subdued investment environment, difficulties in securing clearances, labour shortage, and other issues.
The68infrastructureconstructioncompaniesinoursample,accountingforabout73%ofthesamplesize,contributedtoaround91.7%oftheaggregatesalesinFY14.TheaggregatesalesofthesecompaniesremainedflatinFY14comparedwithayearago,at` 1,983.6 bn. About 34 of these companies reported lower sales than a year ago. The total income of infrastructure constructioncompaniesdeclinedby3.8%y-o-yto` 2,088.4 bn.
Despite accounting for 27%of the number of companies constituting our sample of theconstructionsector,realestatecompanieshadashareofmerely8.3%intotalsalesinFY14.Liketheir infrastructure construction counterparts, sales of real estate companies remained largely flatinFY14at` 180.5 bn. Of the 25 real estate companies constituting our sample of real estate companies,13recordedy-o-ygrowthinsalesduringtheyear.Totalincomegrewbyamere2.5%to `214.1bn.InFY13,salesandtotalincomehadgrownby2.8%and3.7%,respectively.
I n s I g h t s
4
InsIghts
sales of Construction Companies – Real Estate vs Infrastructure
176.5 181.4 180.5
1985.7 1989.0 1983.6
0.0
500.0
1000.0
1500.0
2000.0
2500.0
FY12 FY13 FY14
Sale
s (i
n R
s b
illio
n)
Real estate companies Infrastructure development companies
Source: D&B Research, CMIE
sector’s PAt plunges by 28.5% on high interest costsInFY14,theoverallexpensesofconstructioncompaniesdeclinedby2.4%y-o-yasagainsta6.6%rise in the preceding year. The expenses of infrastructure development companies declined by 3.4%asagainsta7.5%riseinFY13,reflectingthesubduedinfrastructure-relatedconstructionactivity.Ontheotherhand,realestatecompaniessaw7.9%riseintheirtotalexpensesinFY14incontrasttothe2%decreaseayearago.Thesector’swasunabletokeepacheckonitsrawmaterial costsandotherexpenses,which includescostof land.Moreover,amajorchunkofexpenses incurred went towards work-in-progress.
Depreciationchargesofallconstructioncompaniestakentogetherroseby3.9%inFY14,overandabovea14.3%riseinFY13,pointingtogrossfixedassetadditionsduringtheyear.However,thetrend was applicable to infrastructure companies, since the depreciation charges of real estate companiesactuallyreflecteda13.2%declineduringtheyear.Thesector’sinterestexpensesrosebyasharp17.6%to` 190 bn on increasing debt levels. In fact, the average borrowing cost of mostcompaniesstoodintherangeof12-14%levels,withsomeevenrecordinglevelsashighas20%.Mostconstructioncompanieshavehighdebtlevels,whichroseby14.8%inFY14toaround `1,763.6bn.Ofthe93companiesconstitutingoursampleofthissector,only24havebeenabletoparetheirdebtvis-à-visFY13.Theshareofinterestexpensesinthesector’stotalexpensesexpandedto8.4%inFY14from7%ayearago.
Atthenet level, theconstructionsector’sPAT inFY14plungedby28.5%to` 92.5 bn, after an18.7%fallintheprecedingyear.Thedeclineinprofitswassteeperincaseofinfrastructureconstructioncompanies,whichcollectivelyreporteda34%fallintheirPATaftera20.6%fallintheprecedingyear.Realestatecompaniesreporteda6.2%declineinPAT,ontheheelsofa10%fallinFY13.
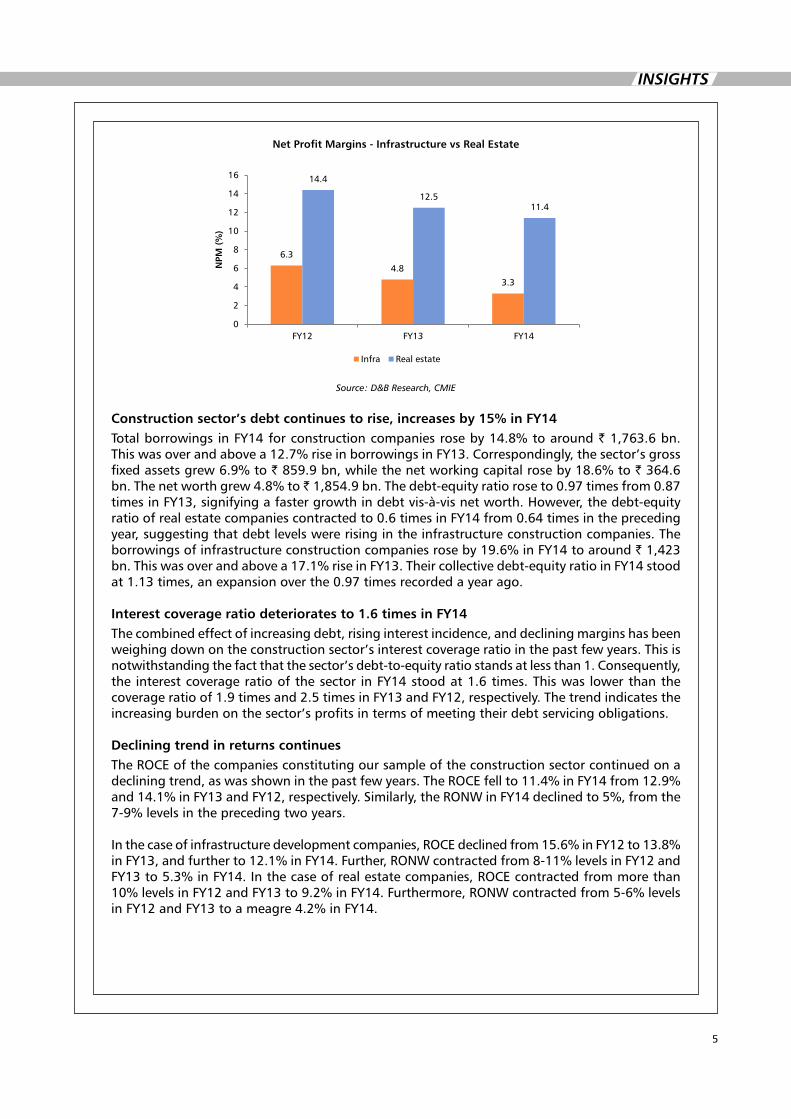
Margins contract by 150 basis points in FY14The sector’s rising interest costs went on to hurt its margins. In terms of profitability, the collective netmarginofoursampleofcompaniesconstitutingtheconstructionsectorforFY14stoodat4%.Thisreflecteda140basispointscontractioninmarginsvis-à-visayearago.Thedamagewasmoreseverewithrespecttoinfrastructureconstructioncompanies.TheircollectiveNPMinFY14stoodatamere3.3%,lowerthanthe4.8%marginrecordedayearago.Realestatecompanieshadmuchbettermargins.InFY14,theirNPMstoodat11.4%,lowerthanthe12.5%levelinFY13.
5
InsIghts
net Profit Margins - Infrastructure vs Real Estate
6.3
4.8
3.3
14.4
12.5 11.4
0
2
4
6
8
10
12
14
16
FY12 FY13 FY14
NPM
(%
)
Infra Real estate
Source: D&B Research, CMIE
Construction sector’s debt continues to rise, increases by 15% in FY14TotalborrowingsinFY14forconstructioncompaniesroseby14.8%toaround`1,763.6bn.Thiswasoverandabovea12.7%riseinborrowingsinFY13.Correspondingly,thesector’sgrossfixedassetsgrew6.9%to`859.9bn,whilethenetworkingcapitalroseby18.6%to` 364.6 bn.Thenetworthgrew4.8%to 1,854.9bn.Thedebt-equityratioroseto0.97timesfrom0.87timesinFY13,signifyingafastergrowthindebtvis-à-visnetworth.However,thedebt-equityratioofrealestatecompaniescontractedto0.6timesinFY14from0.64timesintheprecedingyear, suggesting that debt levels were rising in the infrastructure construction companies. The borrowingsofinfrastructureconstructioncompaniesroseby19.6%inFY14toaround` 1,423 bn.Thiswasoverandabovea17.1%riseinFY13.Theircollectivedebt-equityratioinFY14stoodat1.13times,anexpansionoverthe0.97timesrecordedayearago.
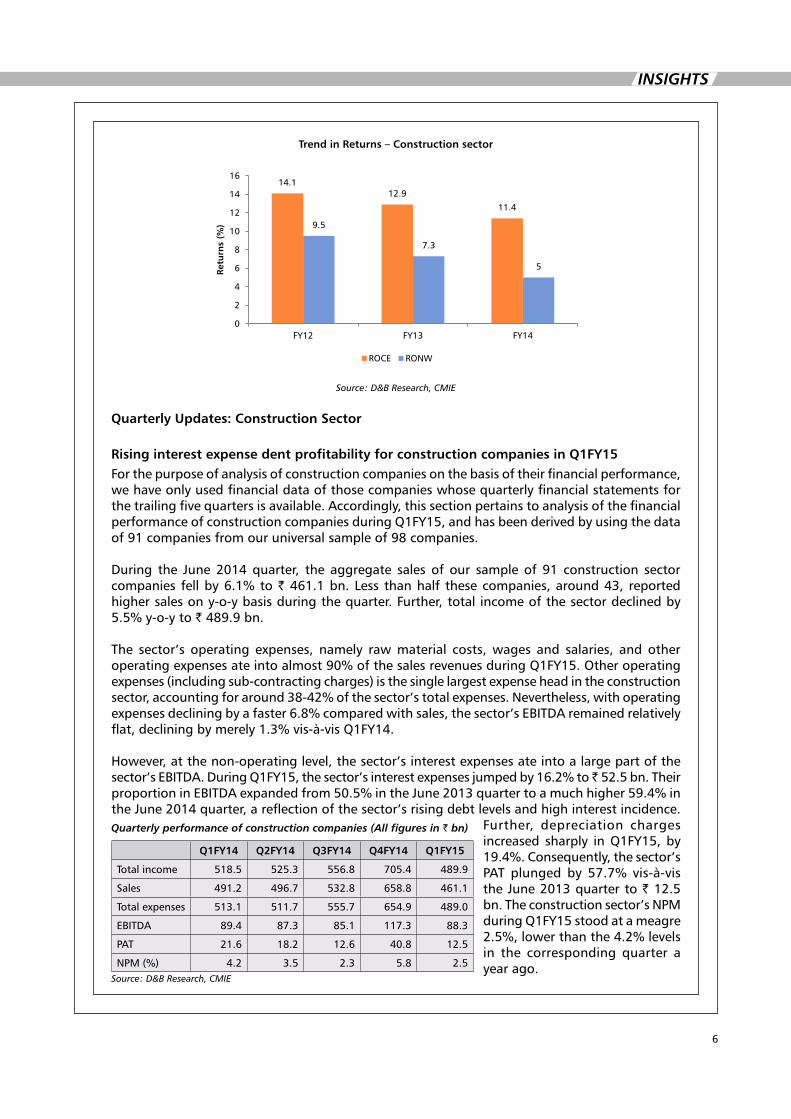
Interest coverage ratio deteriorates to 1.6 times in FY14The combined effect of increasing debt, rising interest incidence, and declining margins has been weighing down on the construction sector’s interest coverage ratio in the past few years. This is notwithstanding the fact that the sector’s debt-to-equity ratio stands at less than 1. Consequently, theinterestcoverageratioofthesector inFY14stoodat1.6times.Thiswaslowerthanthecoverageratioof1.9timesand2.5timesinFY13andFY12,respectively.Thetrendindicatestheincreasing burden on the sector’s profits in terms of meeting their debt servicing obligations. Declining trend in returns continuesThe ROCe of the companies constituting our sample of the construction sector continued on a decliningtrend,aswasshowninthepastfewyears.TheROCEfellto11.4%inFY14from12.9%and14.1%inFY13andFY12,respectively.Similarly,theRONWinFY14declinedto5%,fromthe7-9%levelsintheprecedingtwoyears.
Inthecaseofinfrastructuredevelopmentcompanies,ROCEdeclinedfrom15.6%inFY12to13.8%inFY13,andfurtherto12.1%inFY14.Further,RONWcontractedfrom8-11%levelsinFY12andFY13to5.3%inFY14.Inthecaseofrealestatecompanies,ROCEcontractedfrommorethan10%levelsinFY12andFY13to9.2%inFY14.Furthermore,RONWcontractedfrom5-6%levelsinFY12andFY13toameagre4.2%inFY14.
6
InsIghts
trend in Returns – Construction sector
14.1 12.9
11.4
9.5
7.3
5
0
2
4
6
8
10
12
14
16
FY12 FY13 FY14
Retu
rns
(%)
ROCE RONW
Source: D&B Research, CMIE
Quarterly Updates: Construction sector
Rising interest expense dent profitability for construction companies in Q1FY15Forthepurposeofanalysisofconstructioncompaniesonthebasisoftheirfinancialperformance,we have only used financial data of those companies whose quarterly financial statements for the trailing five quarters is available. Accordingly, this section pertains to analysis of the financial performanceofconstructioncompaniesduringQ1FY15,andhasbeenderivedbyusingthedataof 91 companies from our universal sample of 98 companies.
During the June 2014 quarter, the aggregate sales of our sample of 91 construction sector companies fellby6.1%to` 461.1 bn. Less than half these companies, around 43, reported highersalesony-o-ybasisduringthequarter.Further,totalincomeofthesectordeclinedby5.5%y-o-yto` 489.9 bn.
The sector’s operating expenses, namely raw material costs, wages and salaries, and other operatingexpensesateintoalmost90%ofthesalesrevenuesduringQ1FY15.Otheroperatingexpenses (including sub-contracting charges) is the single largest expense head in the construction sector,accountingforaround38-42%ofthesector’stotalexpenses.Nevertheless,withoperatingexpensesdecliningbyafaster6.8%comparedwithsales,thesector’sEBITDAremainedrelativelyflat,decliningbymerely1.3%vis-à-visQ1FY14.
However,atthenon-operatinglevel,thesector’sinterestexpensesateintoalargepartofthesector’sEBITDA.DuringQ1FY15,thesector’sinterestexpensesjumpedby16.2%to 52.5 bn. Their proportioninEBITDAexpandedfrom50.5%intheJune2013quartertoamuchhigher59.4%inthe June 2014 quarter, a reflection of the sector’s rising debt levels and high interest incidence.
Further, depreciation chargesincreased sharply inQ1FY15,by19.4%.Consequently,thesector’sPAT plunged by 57.7% vis-à-visthe June 2013 quarter to ` 12.5 bn.Theconstructionsector’sNPMduringQ1FY15stoodatameagre2.5%,lowerthanthe4.2%levelsin the corresponding quarter a year ago.
Quarterly performance of construction companies (All figures in ` bn)
Q1FY14 Q2FY14 Q3FY14 Q4FY14 Q1FY15
Total income 518.5 525.3 556.8 705.4 489.9
sales 491.2 496.7 532.8 658.8 461.1
Total expenses 513.1 511.7 555.7 654.9 489.0
eBITDA 89.4 87.3 85.1 117.3 88.3
PAT 21.6 18.2 12.6 40.8 12.5
NPM(%) 4.2 3.5 2.3 5.8 2.5Source: D&B Research, CMIE
7
InsIghts
WehaveattemptedtocapturethecurrenttrendsintheIndianpowersectorthroughoperationaland financial analysis of power companies. The sample selected for this analysis comprises power companies featured in the publication whose comparable financial information for the last three years (FY12-FY14)was available.Wehave considered18power companies featuring in thepublication for the purpose of analysis. The selected power companies operate in the generation, distribution, and transmission segments.
These 18 power companies have been classified based on ownership into privately owned and publicly owned (both central and state owned) companies to capture the dynamic nature of the power industry. Accordingly, our sample comprises ten private and eight public power companies.
Power companies bounce back to double digit growth in second half of FY14DuringFY14,thepowersectorsawaccelerationingrowthwithrespecttoIIPnumbers.TheIIPindexforelectricityshowed6%growthinFY14,overandabove4%growthinFY13.InFY12,thegrowthwas 8%. In FY14, India’s powerdeficit stood at 4.2% (8.7% in FY13) andpeakdemanddeficitwas4.5%(9%inFY13).ThegrowthinelectricitygenerationinIndiaacceleratedto6%inFY14from4%ayearago.An8.3%riseincoal-basedthermalpowergenerationwasamajorcontributortothisgrowth.India’stotalinstalledgeneratingcapacityroseby8.8%inFY14,reflectingadecelerationfromthe11.7%and15.1%growthrecordedinFY13andFY12,respectively.
The total sales of our sample of companies constituting the power sector stood at 1,530.7bninFY14,whichtranslatesinto10.6%growth,fasterthanthe9.9%growththesamplereflectedinFY13.Inthefirsthalfoftheyear,someofthelargecompaniesperformedpoorlyontherevenuefront due to a decline in power generation, which in turn can be attributed to an array of reasons such as low off-take by state distribution utilities, coal shortage at certain plants, and planned maintenanceshutdownsatcertainunits.However,inthesecondhalfofFY14,thesectorwasable to bounce back due to double-digit growth in sales by most companies. This was due to the combined effect of higher realisations and an increase in power generation. Total income of thesectorroseby7.6%,slowerthanthe11.6%growthinFY13.
Public sector power companies continue to outperform private peers in terms of topline growthPublic(governmentowned)companies,whichrepresent44%ofoursampleof18companies,accountedformorethan71%oftheaggregatesalesofoursampleofpowercompanies.DuringFY14,publiccompaniesperformedbetterthantheirprivatecounterpartsintermsofaccelerationinsalesgrowth.Theirsalesgrewby10.8%inFY14,fasterthanthe6.3%growthinFY13.Ontheotherhand,privatecompanies’salesgrewbyaslightlyslower10%comparedwithpublicsectorcompanies.However,thisgrowthratewasmuchslowerthanthesharp20%growthrecordedinFY13.Thetotalincomeofpubliccompaniesgrewby7.2%inFY14(8.6%growthinFY13),whileprivatecompaniesrecordedan8.6%growthintotalincomeinFY14(20.1%inFY13).
sECtIOn B: COMPARAtIVE AnALYsIs OF PUBLIC AnD PRIVAtE POWER COMPAnIEs
8
InsIghts
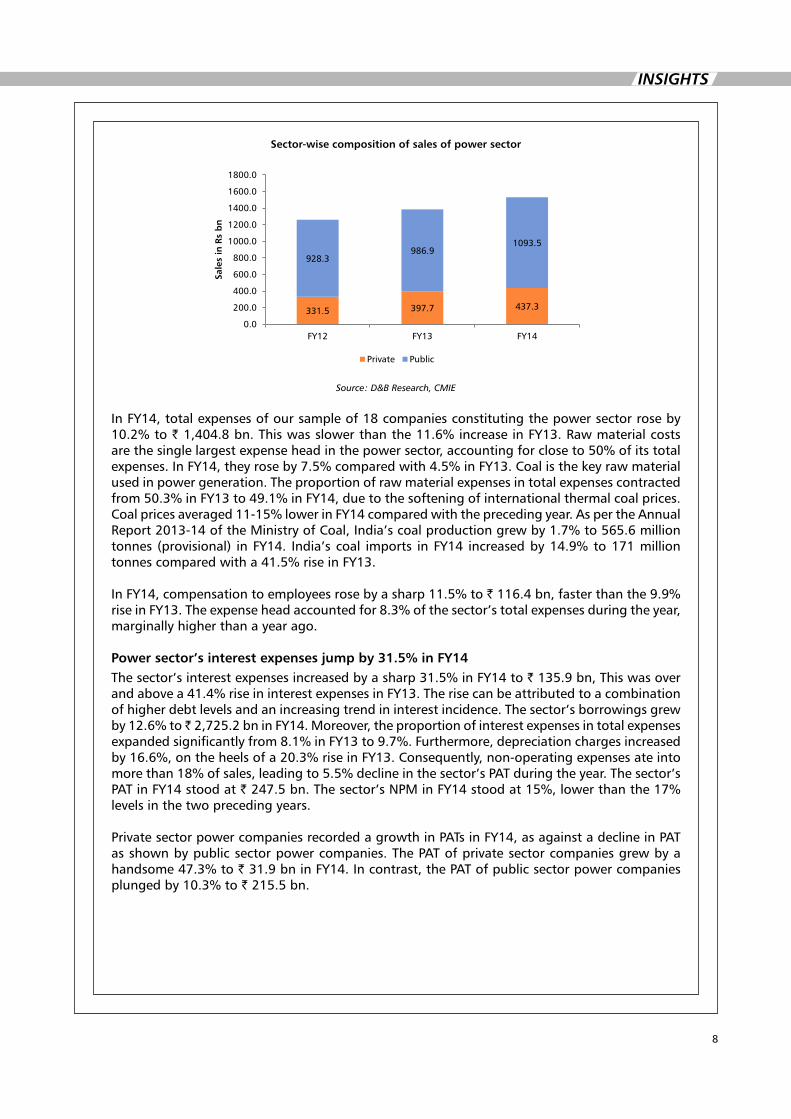
sector-wise composition of sales of power sector
331.5 397.7 437.3
928.3 986.9
1093.5
0.0
200.0
400.0
600.0
800.0
1000.0
1200.0
1400.0
1600.0
1800.0
FY12 FY13 FY14
Sale
s in
Rs
bn
Private Public
Source: D&B Research, CMIE
InFY14,totalexpensesofoursampleof18companiesconstitutingthepowersectorroseby10.2%to`1,404.8bn.Thiswasslowerthanthe11.6%increaseinFY13.Rawmaterialcostsarethesinglelargestexpenseheadinthepowersector,accountingforcloseto50%ofitstotalexpenses.InFY14,theyroseby7.5%comparedwith4.5%inFY13.Coalisthekeyrawmaterialused in power generation. The proportion of raw material expenses in total expenses contracted from50.3%inFY13to49.1%inFY14,duetothesofteningofinternationalthermalcoalprices.Coalpricesaveraged11-15%lowerinFY14comparedwiththeprecedingyear.AspertheAnnualReport2013-14oftheMinistryofCoal,India’scoalproductiongrewby1.7%to565.6milliontonnes (provisional) inFY14. India’scoal imports inFY14 increasedby14.9%to171milliontonnescomparedwitha41.5%riseinFY13.
InFY14,compensationtoemployeesrosebyasharp11.5%to`116.4bn,fasterthanthe9.9%riseinFY13.Theexpenseheadaccountedfor8.3%ofthesector’stotalexpensesduringtheyear,marginally higher than a year ago.
Power sector’s interest expenses jump by 31.5% in FY14Thesector’sinterestexpensesincreasedbyasharp31.5%inFY14to` 135.9 bn, This was over andabovea41.4%riseininterestexpensesinFY13.Therisecanbeattributedtoacombinationof higher debt levels and an increasing trend in interest incidence. The sector’s borrowings grew by12.6%to 2,725.2bninFY14.Moreover,theproportionofinterestexpensesintotalexpensesexpandedsignificantlyfrom8.1%inFY13to9.7%.Furthermore,depreciationchargesincreasedby16.6%,ontheheelsofa20.3%riseinFY13.Consequently,non-operatingexpensesateintomorethan18%ofsales,leadingto5.5%declineinthesector’sPATduringtheyear.Thesector’sPATinFY14stoodat`247.5bn.Thesector’sNPMinFY14stoodat15%,lowerthanthe17%levels in the two preceding years.
PrivatesectorpowercompaniesrecordedagrowthinPATsinFY14,asagainstadeclineinPATasshownbypublicsectorpowercompanies.ThePATofprivatesectorcompaniesgrewbyahandsome47.3%to`31.9bninFY14.Incontrast,thePATofpublicsectorpowercompaniesplungedby10.3%to` 215.5 bn.
9
InsIghts
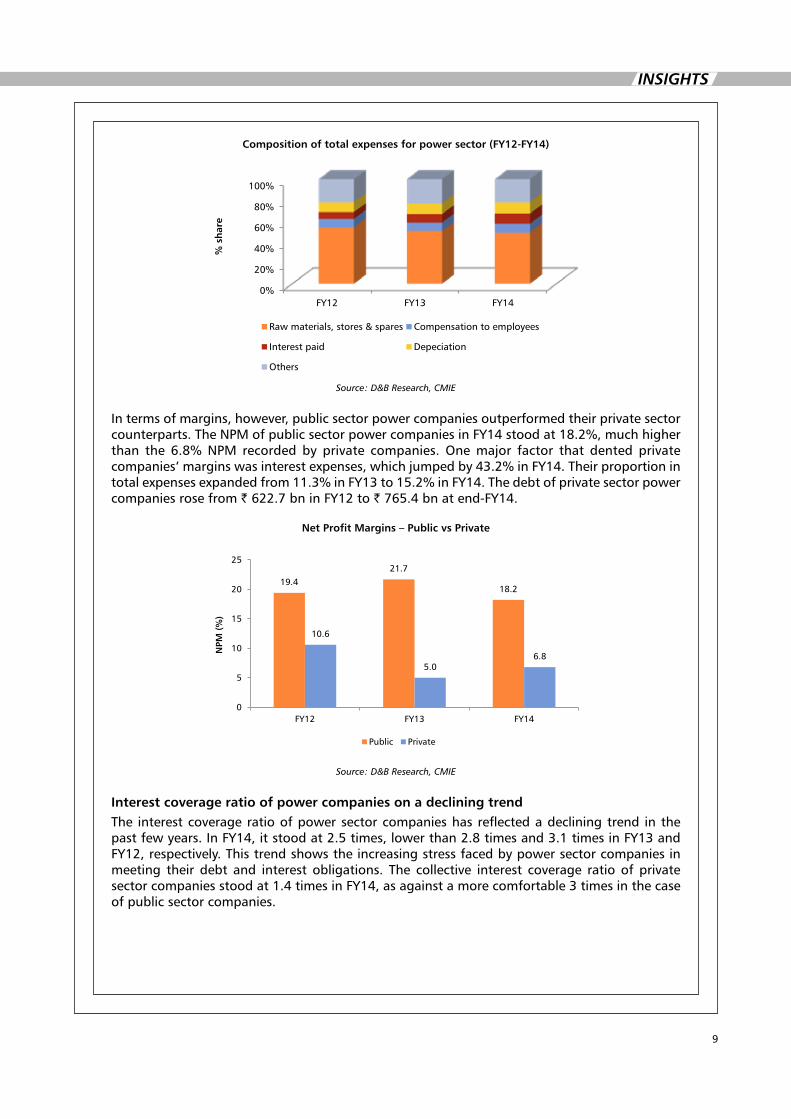
Composition of total expenses for power sector (FY12-FY14)
0%
20%
40%
60%
80%
100%
FY12 FY13 FY14
% s
har
e
Raw materials, stores & spares Compensation to employees
Interest paid Depeciation
Others
Source: D&B Research, CMIE
In terms of margins, however, public sector power companies outperformed their private sector counterparts.TheNPMofpublicsectorpowercompaniesinFY14stoodat18.2%,muchhigherthan the 6.8%NPM recordedby private companies.Onemajor factor that dented privatecompanies’marginswasinterestexpenses,whichjumpedby43.2%inFY14.Theirproportionintotalexpensesexpandedfrom11.3%inFY13to15.2%inFY14.Thedebtofprivatesectorpowercompanies rose from `622.7bninFY12to`765.4bnatend-FY14.
net Profit Margins – Public vs Private
19.4 21.7
18.2
10.6
5.0 6.8
0
5
10
15
20
25
FY12 FY13 FY14
NPM
(%
)
Public Private
Source: D&B Research, CMIE
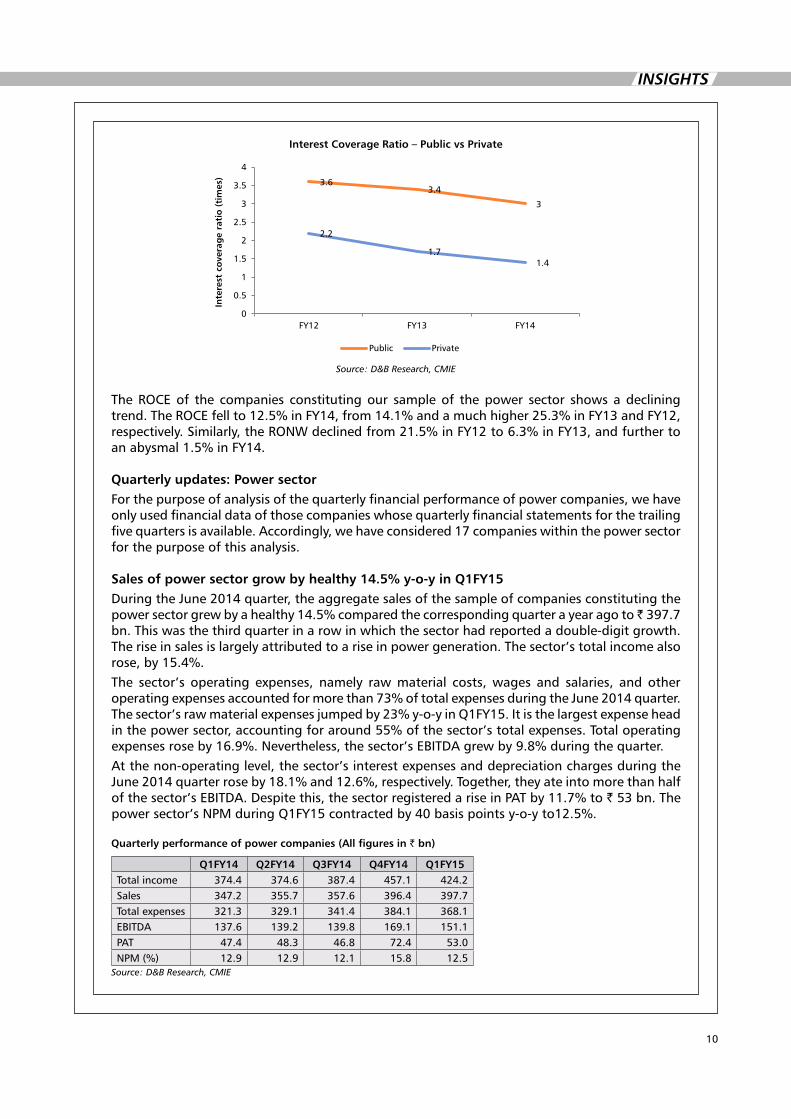
Interest coverage ratio of power companies on a declining trendThe interest coverage ratio of power sector companies has reflected a declining trend in the pastfewyears.InFY14,itstoodat2.5times,lowerthan2.8timesand3.1timesinFY13andFY12,respectively.Thistrendshowstheincreasingstressfacedbypowersectorcompaniesinmeeting their debt and interest obligations. The collective interest coverage ratio of private sectorcompaniesstoodat1.4timesinFY14,asagainstamorecomfortable3timesinthecaseof public sector companies.
10
InsIghts
Interest Coverage Ratio – Public vs Private
3.6 3.4
3
2.2
1.7 1.4
0
0.5
1
1.5
2
2.5
3
3.5
4
FY12 FY13 FY14
Inte
rest
co
vera
ge
rati
o (
tim
es)
Public Private
Source: D&B Research, CMIE
The ROCe of the companies constituting our sample of the power sector shows a declining trend.TheROCEfellto12.5%inFY14,from14.1%andamuchhigher25.3%inFY13andFY12,respectively.Similarly,theRONWdeclinedfrom21.5%inFY12to6.3%inFY13,andfurthertoanabysmal1.5%inFY14.
Quarterly updates: Power sectorForthepurposeofanalysisofthequarterlyfinancialperformanceofpowercompanies,wehaveonly used financial data of those companies whose quarterly financial statements for the trailing fivequartersisavailable.Accordingly,wehaveconsidered17companieswithinthepowersectorfor the purpose of this analysis.
sales of power sector grow by healthy 14.5% y-o-y in Q1FY15During the June 2014 quarter, the aggregate sales of the sample of companies constituting the powersectorgrewbyahealthy14.5%comparedthecorrespondingquarterayearagoto 397.7bn. This was the third quarter in a row in which the sector had reported a double-digit growth. The rise in sales is largely attributed to a rise in power generation. The sector’s total income also rose,by15.4%.The sector’s operating expenses, namely raw material costs, wages and salaries, and other operatingexpensesaccountedformorethan73%oftotalexpensesduringtheJune2014quarter.Thesector’srawmaterialexpensesjumpedby23%y-o-yinQ1FY15.Itisthelargestexpenseheadinthepowersector,accountingforaround55%ofthesector’stotalexpenses.Totaloperatingexpensesroseby16.9%.Nevertheless,thesector’sEBITDAgrewby9.8%duringthequarter.At the non-operating level, the sector’s interest expenses and depreciation charges during the June2014quarterroseby18.1%and12.6%,respectively.Together,theyateintomorethanhalfofthesector’sEBITDA.Despitethis,thesectorregisteredariseinPATby11.7%to` 53 bn. The powersector’sNPMduringQ1FY15contractedby40basispointsy-o-yto12.5%.
Quarterly performance of power companies (All figures in ` bn)
Q1FY14 Q2FY14 Q3FY14 Q4FY14 Q1FY15Total income 374.4 374.6 387.4 457.1 424.2sales 347.2 355.7 357.6 396.4 397.7Total expenses 321.3 329.1 341.4 384.1 368.1eBITDA 137.6 139.2 139.8 169.1 151.1PAT 47.4 48.3 46.8 72.4 53.0NPM(%) 12.9 12.9 12.1 15.8 12.5
Source: D&B Research, CMIE
11
InsIghts
sECtIOn C: OIL & gAs sECtOR
Dun & Bradstreet (D&B) has widened the scope of the publication to include oil & gas companies. Wehave attempted to capture the performance of this sector in termsof financials.Oil&gas companies include those involved in exploration, production, refining, transmission and distribution, and all other related activities. The sample selected for this analysis comprises those companies featured in the publication whose comparable financial information for the last three years(FY12-FY14)wasfreelyavailableinpublicdomain.Thus,fromthe21oil&gascompaniesfeaturing in the publication, we have included 19 for the purpose of analysis.
sales of oil & gas sector grows by 7.9% in FY14Thetotalsalesofoursampleofcompaniesconstitutingtheoil&gassectorgrewby7.9%to `17.6trillioninFY14.Thiswasadecelerationfromthe12.2%growthinFY13.Thegrowthwasbroad-based, with only four of the 19 companies in our sample having reported lower sales as compared to a year ago. state-owned upstream companies took a hit on sales since they had offered huge subsidy discounts to oil marketing companies to compensate for under-recoveries. Thetotalincomeofthesectorroseby7.5%,slowerthanthe12.6%growthinFY13.
DuringFY14, totalexpensesofoursampleconstitutingtheoil&gassector roseby7.4%to `17.2trillion.Rawmaterialcostsarethesinglelargestexpenseheadinthesector,accountingforcloseto50-55%ofitstotalexpenses.InFY14,sector’srawmaterialexpensesincreasedby7.6%comparedwith11.8%riseinFY13.Thesecondlargestexpensehead,purchaseoffinishedgoods(about30%oftotalexpenses),roseby7.8%.Thesector’soperatingexpenses,whichaccountedformorethan96%ofitstotalexpenses,roseby7.7%.Consequently,thesector’sEBITDAsgrewbyatepid3.1%,andtheoperatingmargincontractedfrom10.1%inFY13to9.7%inFY14.
The sector’s debt to equity ratio stands at around 0.5 times, signifying that the oil & gas sector does not rely heavily on debt in order to meet its financing needs. As a result, interest expenses donotaccountformorethan1%oftotalexpenses.InFY14,interestexpensesdeclinedby26%.Depreciationcharges,however,roseby11.3%.Provisionfortaxesalsorosesharply,by10.4%.Consequently,theoil&gassector’sPATrosebyasedate2.2%to 742.8bn,asagainstahealthy18%inFY13.Thesector’sNPMinFY14stoodat4.1%,lowerthanthe4.4%NPMinFY13.
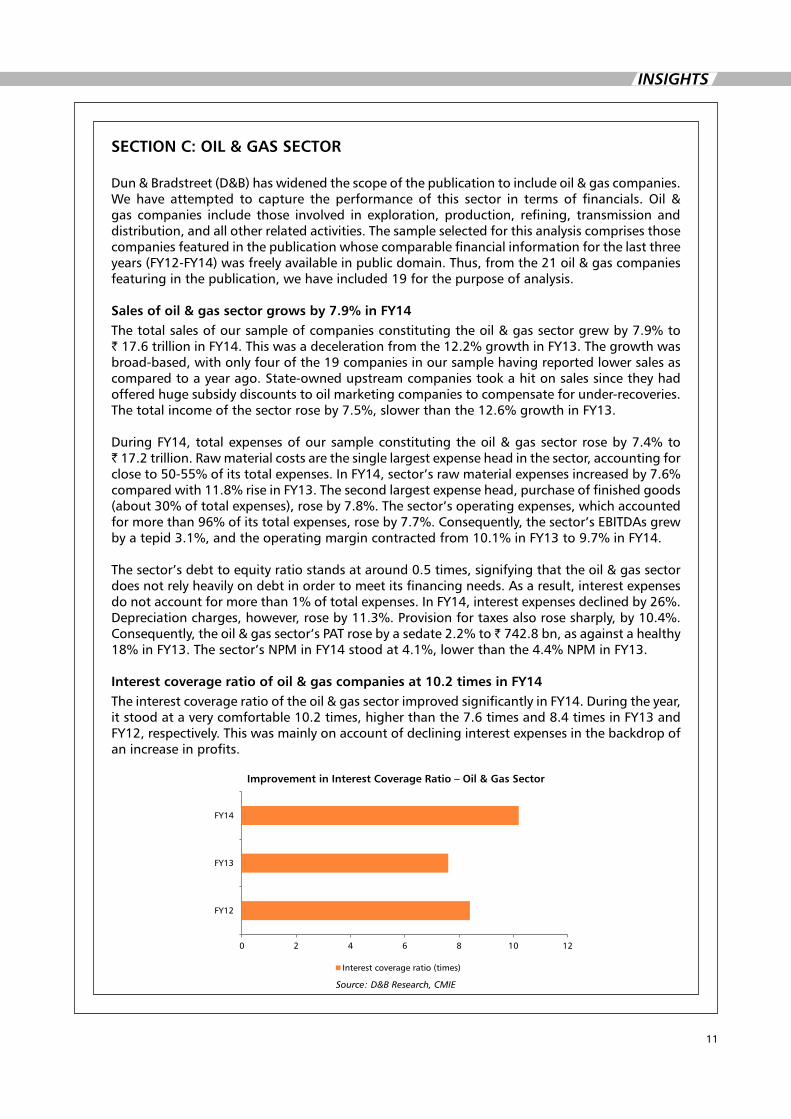
Interest coverage ratio of oil & gas companies at 10.2 times in FY14Theinterestcoverageratiooftheoil&gassectorimprovedsignificantlyinFY14.Duringtheyear,itstoodataverycomfortable10.2times,higherthanthe7.6timesand8.4timesinFY13andFY12,respectively.Thiswasmainlyonaccountofdeclininginterestexpensesinthebackdropofan increase in profits.
Improvement in Interest Coverage Ratio – Oil & gas sector
0 2 4 6 8 10 12
FY12
FY13
FY14
Interest coverage ratio (times)
Source: D&B Research, CMIE
12
InsIghts
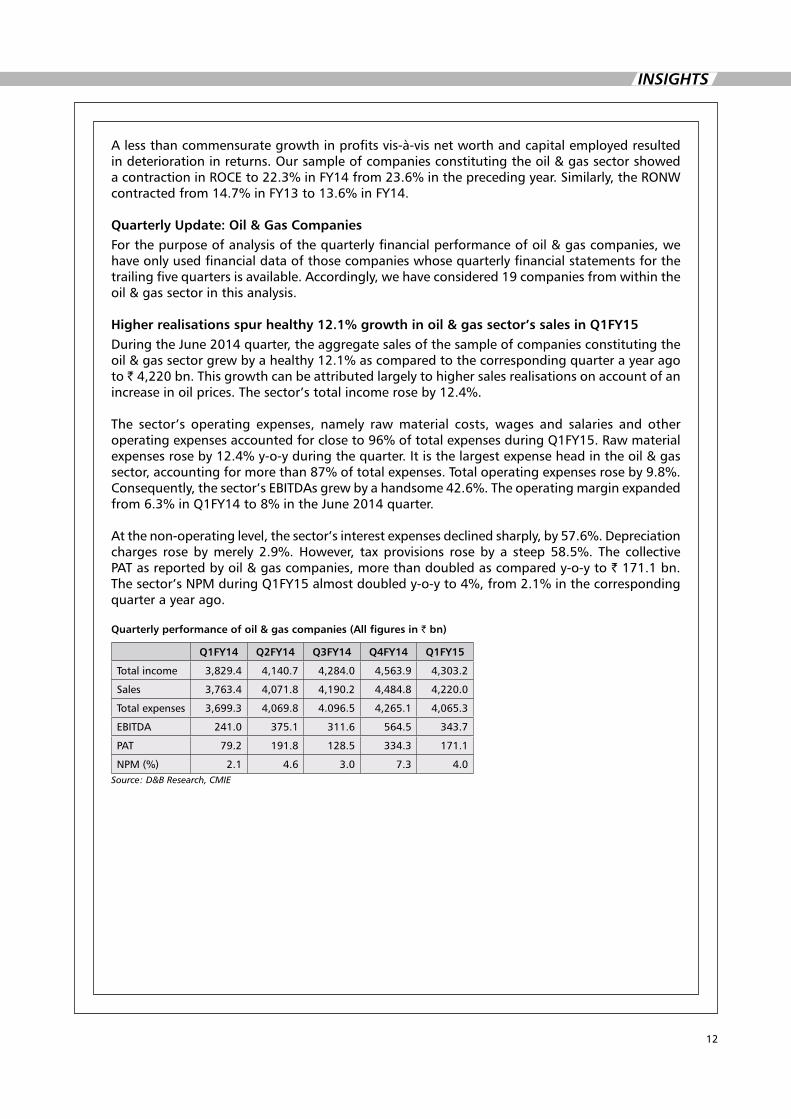
Alessthancommensurategrowthinprofitsvis-à-visnetworthandcapitalemployedresultedin deterioration in returns. Our sample of companies constituting the oil & gas sector showed acontractioninROCEto22.3%inFY14from23.6%intheprecedingyear.Similarly,theRONWcontractedfrom14.7%inFY13to13.6%inFY14.
Quarterly Update: Oil & gas CompaniesForthepurposeofanalysisofthequarterlyfinancialperformanceofoil&gascompanies,wehave only used financial data of those companies whose quarterly financial statements for the trailing five quarters is available. Accordingly, we have considered 19 companies from within the oil & gas sector in this analysis.
higher realisations spur healthy 12.1% growth in oil & gas sector’s sales in Q1FY15During the June 2014 quarter, the aggregate sales of the sample of companies constituting the oil&gassectorgrewbyahealthy12.1%ascomparedtothecorrespondingquarterayearagoto ` 4,220 bn. This growth can be attributed largely to higher sales realisations on account of an increaseinoilprices.Thesector’stotalincomeroseby12.4%.
The sector’s operating expenses, namely raw material costs, wages and salaries and other operatingexpensesaccountedforcloseto96%oftotalexpensesduringQ1FY15.Rawmaterialexpensesroseby12.4%y-o-yduringthequarter.Itisthelargestexpenseheadintheoil&gassector,accountingformorethan87%oftotalexpenses.Totaloperatingexpensesroseby9.8%.Consequently,thesector’sEBITDAsgrewbyahandsome42.6%.Theoperatingmarginexpandedfrom6.3%inQ1FY14to8%intheJune2014quarter.
Atthenon-operatinglevel,thesector’sinterestexpensesdeclinedsharply,by57.6%.Depreciationcharges rosebymerely2.9%.However, taxprovisions roseby a steep58.5%. The collectivePATasreportedbyoil&gascompanies,morethandoubledascomparedy-o-yto`171.1bn.Thesector’sNPMduringQ1FY15almostdoubledy-o-yto4%,from2.1%inthecorrespondingquarter a year ago.
Quarterly performance of oil & gas companies (All figures in ` bn)
Q1FY14 Q2FY14 Q3FY14 Q4FY14 Q1FY15
Total income 3,829.4 4,140.7 4,284.0 4,563.9 4,303.2
sales 3,763.4 4,071.8 4,190.2 4,484.8 4,220.0
Total expenses 3,699.3 4,069.8 4.096.5 4,265.1 4,065.3
eBITDA 241.0 375.1 311.6 564.5 343.7
PAT 79.2 191.8 128.5 334.3 171.1
NPM(%) 2.1 4.6 3.0 7.3 4.0Source: D&B Research, CMIE
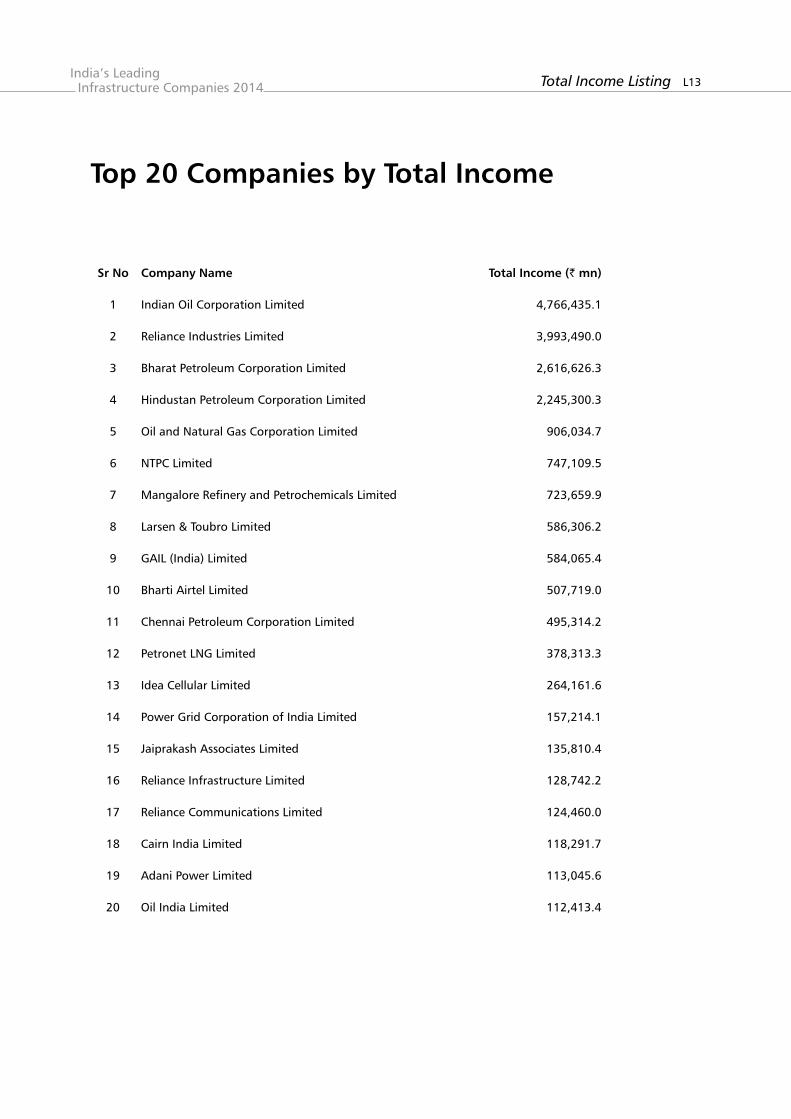
L13Total Income ListingIndia’s Leading Infrastructure Companies 2014
sr no Company name total Income (` mn)
1 Indian Oil Corporation Limited 4,766,435.1
2 Reliance Industries Limited 3,993,490.0
3 BharatPetroleumCorporationLimited 2,616,626.3
4 HindustanPetroleumCorporationLimited 2,245,300.3
5 OilandNaturalGasCorporationLimited 906,034.7
6 NTPCLimited 747,109.5
7 MangaloreRefineryandPetrochemicalsLimited 723,659.9
8 Larsen & Toubro Limited 586,306.2
9 GAIL(India)Limited 584,065.4
10 Bharti Airtel Limited 507,719.0
11 ChennaiPetroleumCorporationLimited 495,314.2
12 PetronetLNGLimited 378,313.3
13 Idea Cellular Limited 264,161.6
14 PowerGridCorporationofIndiaLimited 157,214.1
15 Jaiprakash Associates Limited 135,810.4
16 Reliance Infrastructure Limited 128,742.2
17 Reliance Communications Limited 124,460.0
18 Cairn India Limited 118,291.7
19 AdaniPowerLimited 113,045.6
20 Oil India Limited 112,413.4
top 20 Companies by total Income
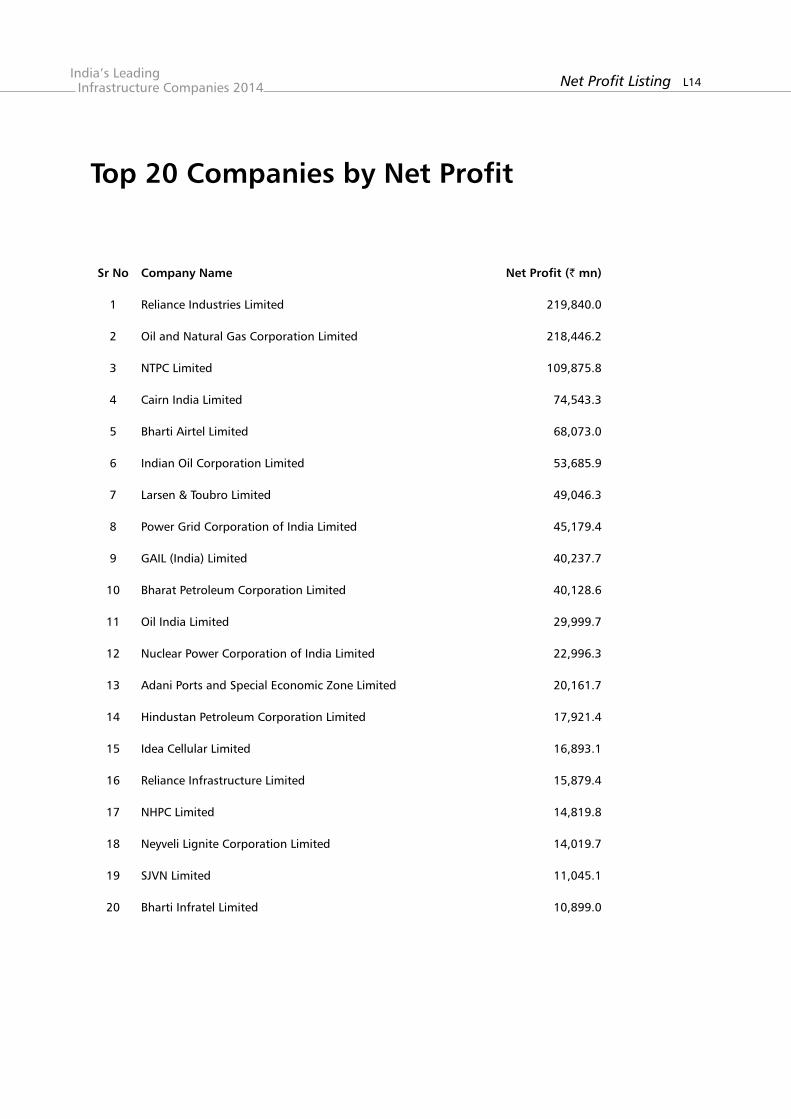
L14Net Profit ListingIndia’s Leading Infrastructure Companies 2014
sr no Company name net Profit (` mn)
1 Reliance Industries Limited 219,840.0
2 OilandNaturalGasCorporationLimited 218,446.2
3 NTPCLimited 109,875.8
4 Cairn India Limited 74,543.3
5 Bharti Airtel Limited 68,073.0
6 Indian Oil Corporation Limited 53,685.9
7 Larsen & Toubro Limited 49,046.3
8 PowerGridCorporationofIndiaLimited 45,179.4
9 GAIL(India)Limited 40,237.7
10 BharatPetroleumCorporationLimited 40,128.6
11 Oil India Limited 29,999.7
12 NuclearPowerCorporationofIndiaLimited 22,996.3
13 AdaniPortsandSpecialEconomicZoneLimited 20,161.7
14 HindustanPetroleumCorporationLimited 17,921.4
15 Idea Cellular Limited 16,893.1
16 Reliance Infrastructure Limited 15,879.4
17 NHPCLimited 14,819.8
18 NeyveliLigniteCorporationLimited 14,019.7
19 SJVNLimited 11,045.1
20 Bharti Infratel Limited 10,899.0
top 20 Companies by net Profit
India’s Leading Infrastructure Companies 2014PublishedinIndiabyDun & Bradstreet Information services India Pvt Ltd. (D&B)
Registered Office ICC Chambers, saki Vihar Road,Powai,Mumbai-400072.CIN:U74140MH1997PTC107813Tel:+912266765555,28574190/92/94Fax:+912228572060Email:[email protected]:www.dnb.co.in
new Delhi Office1stFloor,AdministrativeBuilding,Block‘E’,NSIC-TechnicalServicesCenter,OkhlaIndustrialEstatePhase-III,NewDelhi-110020.Tel:+911141497900/01Fax:+911141497902
Kolkata Office166B,S.P.MukherjeeRoad,MerlinLinks,Unit3E,3rdFloor,Kolkata-700026.Tel:+913324650204Fax:+913324650205
Chennai OfficeNewNo:28,OldNo:195,1stFloor,NorthUsmanRoad,T.Nagar,Chennai-600017.Tel:914428142265/75,42897602Fax:+914428142285
Ahmedabad Office801–8thFloor,ShapathV,Opp. Karnavati Club, S.G.HighwayAhmedabad - 380054.Tel:+917966168058/59
Bengaluru OfficeNo.7/2GajananaTowers,1stFloor,AnnaswamyMudaliarStreet,Opp.UlsoorLake,Bengaluru - 560042.Tel:+918042503500Fax:+918043503540
hyderabad Office504, 5thFloor,Babukhan’sMillenniumCentre,6-3-1099/1100,Somajiguda,Hyderabad-500082.Tel:+914066624102,66514102Fax:+914066619358
Editor PawanBindal
sub-Editor NainaAcharya,YogeshJambhale,MihirShah
Editorial team ChristopherD’Souza,AnkitKemmu,KarishmaDesai,PrashantMirgule,RohitPawar
sales head Jayesh Bahadur
sales team NittinMaheshwari,PankajSharma,SandeepParakkal,AnanditaPongurlekar,ViniBatheja, KalyanBasu,VaibhavDhote,SunenaJain,AnubhaGarg,NupurKhanna,MayankBhanu, sana Zarar, Tanya Bedi, sarita sharma, Anupam Dass, Raj Choudhury, Amanpreet Bindra, RakeshGoyal,ShipraThakur,YashaswiniChandrashekar,SindhuRavi,AishaRashyani, Vishwa Desai
Operations team NadeemKazi,AnkurSingh,SumitSakhrani,RajeshGupta,ShankarIyer,ParmeshwarMore, SaadatShaikh,NikitaSachdev
Design team MohanChilvery
All rights reservedThis publication is copyright and all rights are reserved. Apart from any fair dealing for the purpose of private study, research, criticism or review as permitted under the Copyright Act, no part may be reproduced by any process without written permission. enquiries should be addressed to the publishers.Although every effort has been made in compiling and checking the information given in this publication to ensure that it isaccurate, the authors, the publishers and their servants or agents shall not be held responsible for the continued accuracy of the information or for any errors, negligence or otherwise howsoever or for any consequence arising therefrom.
India’s Leading Infrastructure Companies 20147th editionISBN978-93-82060-54-3