Embed Size (px)
Citation preview
Individual Electrophoretic Mobilities of Liposomes and AcidicOrganelles Displaying pH Gradients Across Their Membranes
Yun Chen and Edgar A. Arriaga*
Department of Chemistry, UniVersity of Minnesota, 207 Pleasant Street Southeast,Minneapolis, Minnesota 55455
ReceiVed NoVember 14, 2006. In Final Form: February 7, 2007
This report focuses on measuring the individual electrophoretic mobilities of liposomes with different pH gradientsacross their membrane using capillary electrophoresis with laser-induced fluorescence detection (CE-LIF). The resultsfrom the individual analysis of liposomes show that, using surface electrostatic theories and the electrokinetic theoryas the first approximation,ú potential contributes more significantly to the electrophoretic mobility of liposomes thanliposomal size. For liposomes with an outer pH 7.4 (pHo 7.4) and a net negative outer surface charge, the most negativeelectrophoretic mobilities occur when the inner pH (pHi) is 6.8; at higher or lower pHi, the electrophoretic mobilitiesare less negative. The theories mentioned above cannot explain these pH-induced electrophoretic mobility shifts. Thecapacity theory, predicting an induced electrical charge on the surface of liposomes, can only explain the results atpHi > 6.8. In this report, we hypothesize that there is a flip-flop process of phospholipids, which refers to the exchangeof phospholipids between the outer and inner layers of the membrane. This flip-flop is caused by the pH gradient andmembrane instability and results in the observed electrophoretic mobility changes when pHi is <6.8. Furthermore,it is found that the mobilities of acidic organelles are consistent with the predictions of liposome models we used here.
Introduction
The electrophoretic behavior of sub-µm andµm dimensionparticles such as polystyrene latex microspheres, organic andinorganic colloids, lipoprotein particles, viruses, liposomes,biological membrane vesicles, and biological cells has beendescribed extensively.1 According to the surface electrostatictheories2,3 and the electrokinetic theory,4,5 there are fourphenomena acting on a particle experiencing an electric field:an electrical force, Stokes viscous drag, the relaxation effect,and an electrophoretic retardation force.6 However, thesephenomena are not sufficient to describe the electrophoreticbehavior of particles bound by biological membranes, e.g.,liposomes, cells, organelles.
Liposomes are widely used in the manufacturing of pharma-ceuticals, cosmetics, gene delivery products, engineering, anddrug delivery vehicles.7 Their size, membrane composition, andluminal content can be easily controlled during their preparation.Liposomes have also been used as models of organelles and tostudythepropertiesofbiologicalmembranesusingelectrophoresis.8-10
However, the electrophoretic behavior of liposomes and or-ganellescannotbeproperlyexplainedwith thesurfaceelectrostatictheories and the electrokinetic theory because these theories were
developed for spherical rigid particles. It has been proposed thatpH gradient across the liposomal membrane,11 deformation,uneven surface charge distribution, and multipole moments12
are factors that contribute to the electrophoretic mobility ofliposomes and biological vesicles. The last three phenomena areobserved only in the presence of an applied electric field. Sincethe emphasis on this study is to investigate the contribution ofpH gradient, these phenomena will only be qualitatively describedwithin the context of pH gradients.
There is a pH gradient across many biological membranes,and it plays critical roles in cell functioning. Some roles of pHgradient include modulating bilayer asymmetry,13,14 loadingvesicles with charged species (i.e., amino acid,15 peptide,15
protein16), controlling fusion processes,17 and maintainingdegradative functions in acidic organelles.18 The pH gradientacross a liposome membrane gives origin to a capacitive effectinitially proposed by Ceh et al.19Later, the Hayes group observedthat the electrophoretic mobilities of liposomes are affected bypH gradient across the liposomal membrane in the pH range7.4-8.8.20 These reports propose that the pH gradient results indifferent electrical charge states at the interior and exterior of theliposomal membrane, which in turn depend mainly on the pKavalues of the ionizable functional groups in the membrane. Undersuch circumstances, the liposomal membrane can be seen as acapacitor; the excess of electrical charge on either side of themembrane would induce the appearance of a capacitively inducedcharge at the other side of the membrane. When an inducedcharge appears at the external surface of the liposome, for instance,
* To whom correspondence should be addressed. Phone: 612-624-8024.E-mail: [email protected].
(1) Radko, S. P.; Chrambach, A.Electrophoresis2002, 23, 1957-1972.(2) Cevc, G.Biochim. Biophys. Acta1990, 1031, 311-382.(3) Dukhin, S. S.; Derjaguin, B. V.Surface and Colloid Science; John Willey
and Sons: New York, 1974.(4) Hunter, R. J.Zeta Potential in Colloid Science Principles and Applications;
Academic Press, Inc: London, 1981.(5) Overbeek, J. T. G.; Wiersema, P. H.Electrophoresis: Theory Methods
and Applications; Academic Press: New York, 1967.(6) Radko, S. P.; Stastna, M.; Chrambach, A.Anal. Chem.2002, 72, 5955-
5960.(7) Lasic, D. D.Trends Biotechnol.1998, 16, 307-321.(8) Wiedmer, S. K.; Holopainen, J. M.; Mustakangas, P.; Kinnunen, P. K.;
Riekkola, M. L.Electrophoresis2000, 21, 3191-3198.(9) Bilek, G.; Kremser, L.; Blaas, D.; Kenndler, E.J. Chromatogr., B 2006,
841, 38-51.(10) Owen, R. L.; Strasters, J. K.; Breyer, E. D.Electrophoresis2005, 26,
735-751.
(11) Pysher, M. D.; Hayes, M. A.Langmuir2004, 20, 4369-4375.(12) Pysher, M. D.; Hayes, M. A.Langmuir2005, 21, 3572-3577.(13) Hope, M. J.; Redelmeier, T. E.; Wong, K. F.; Rodrigueza, W.; Cullis, P.
R. Biochemistry1989, 28, 4181-4187.(14) Hope, M. J.; Cullis, P. R.J. Biol. Chem.1987, 262, 4360-4366.(15) Chakrabarti, A. C.Amino Acids1994, 6, 213-229.(16) Stephens, C.Curr. Biol. 1998, 8, R578-581.(17) Ramalho-Santos, J.; Pedroso De Lima, M. C.Biol. Proced. Online1999,
1, 107-113.(18) Weisz, O. A.Traffic 2003, 4, 57-64.(19) Ceh, B.; Lasic, D. D.J. Colloid Interface Sci.1997, 185, 9-18.(20) Phayre, A. N.; Farfano, H. M. V.; Hayes, M. A.Langmuir 2002, 18,
6499-6503.
5584 Langmuir2007,23, 5584-5590
10.1021/la0633233 CCC: $37.00 © 2007 American Chemical SocietyPublished on Web 04/03/2007
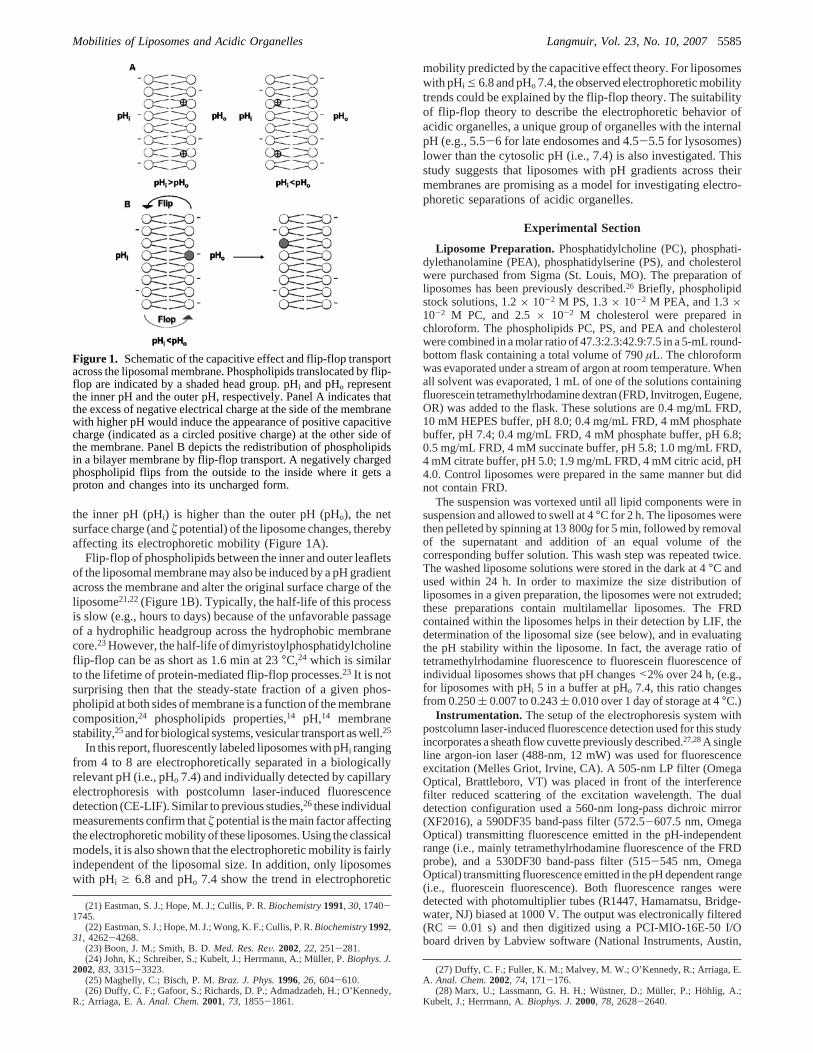
the inner pH (pHi) is higher than the outer pH (pHo), the netsurface charge (andú potential) of the liposome changes, therebyaffecting its electrophoretic mobility (Figure 1A).
Flip-flop of phospholipids between the inner and outer leafletsof the liposomal membrane may also be induced by a pH gradientacross the membrane and alter the original surface charge of theliposome21,22(Figure 1B). Typically, the half-life of this processis slow (e.g., hours to days) because of the unfavorable passageof a hydrophilic headgroup across the hydrophobic membranecore.23However, the half-life of dimyristoylphosphatidylcholineflip-flop can be as short as 1.6 min at 23°C,24 which is similarto the lifetime of protein-mediated flip-flop processes.23 It is notsurprising then that the steady-state fraction of a given phos-pholipid at both sides of membrane is a function of the membranecomposition,24 phospholipids properties,14 pH,14 membranestability,25and for biological systems, vesicular transport as well.25
In this report, fluorescently labeled liposomes with pHi rangingfrom 4 to 8 are electrophoretically separated in a biologicallyrelevant pH (i.e., pHo 7.4) and individually detected by capillaryelectrophoresis with postcolumn laser-induced fluorescencedetection (CE-LIF). Similar to previous studies,26these individualmeasurements confirm thatú potential is the main factor affectingthe electrophoretic mobility of these liposomes. Using the classicalmodels, it is also shown that the electrophoretic mobility is fairlyindependent of the liposomal size. In addition, only liposomeswith pHi g 6.8 and pHo 7.4 show the trend in electrophoretic
mobility predicted by the capacitive effect theory. For liposomeswith pHi e 6.8 and pHo 7.4, the observed electrophoretic mobilitytrends could be explained by the flip-flop theory. The suitabilityof flip-flop theory to describe the electrophoretic behavior ofacidic organelles, a unique group of organelles with the internalpH (e.g., 5.5-6 for late endosomes and 4.5-5.5 for lysosomes)lower than the cytosolic pH (i.e., 7.4) is also investigated. Thisstudy suggests that liposomes with pH gradients across theirmembranes are promising as a model for investigating electro-phoretic separations of acidic organelles.
Experimental Section
Liposome Preparation. Phosphatidylcholine (PC), phosphati-dylethanolamine (PEA), phosphatidylserine (PS), and cholesterolwere purchased from Sigma (St. Louis, MO). The preparation ofliposomes has been previously described.26 Briefly, phospholipidstock solutions, 1.2× 10⁻² M PS, 1.3× 10⁻² M PEA, and 1.3×10⁻² M PC, and 2.5× 10⁻² M cholesterol were prepared inchloroform. The phospholipids PC, PS, and PEA and cholesterolwere combined in a molar ratio of 47.3:2.3:42.9:7.5 in a 5-mL round-bottom flask containing a total volume of 790µL. The chloroformwas evaporated under a stream of argon at room temperature. Whenall solvent was evaporated, 1 mL of one of the solutions containingfluorescein tetramethylrhodamine dextran (FRD, Invitrogen, Eugene,OR) was added to the flask. These solutions are 0.4 mg/mL FRD,10 mM HEPES buffer, pH 8.0; 0.4 mg/mL FRD, 4 mM phosphatebuffer, pH 7.4; 0.4 mg/mL FRD, 4 mM phosphate buffer, pH 6.8;0.5 mg/mL FRD, 4 mM succinate buffer, pH 5.8; 1.0 mg/mL FRD,4 mM citrate buffer, pH 5.0; 1.9 mg/mL FRD, 4 mM citric acid, pH4.0. Control liposomes were prepared in the same manner but didnot contain FRD.
The suspension was vortexed until all lipid components were insuspension and allowed to swell at 4°C for 2 h. The liposomes werethen pelleted by spinning at 13 800g for 5 min, followed by removalof the supernatant and addition of an equal volume of thecorresponding buffer solution. This wash step was repeated twice.The washed liposome solutions were stored in the dark at 4°C andused within 24 h. In order to maximize the size distribution ofliposomes in a given preparation, the liposomes were not extruded;these preparations contain multilamellar liposomes. The FRDcontained within the liposomes helps in their detection by LIF, thedetermination of the liposomal size (see below), and in evaluatingthe pH stability within the liposome. In fact, the average ratio oftetramethylrhodamine fluorescence to fluorescein fluorescence ofindividual liposomes shows that pH changes<2% over 24 h, (e.g.,for liposomes with pHi 5 in a buffer at pHo 7.4, this ratio changesfrom 0.250( 0.007 to 0.243( 0.010 over 1 day of storage at 4°C.)
Instrumentation. The setup of the electrophoresis system withpostcolumn laser-induced fluorescence detection used for this studyincorporates a sheath flow cuvette previously described.27,28A singleline argon-ion laser (488-nm, 12 mW) was used for fluorescenceexcitation (Melles Griot, Irvine, CA). A 505-nm LP filter (OmegaOptical, Brattleboro, VT) was placed in front of the interferencefilter reduced scattering of the excitation wavelength. The dualdetection configuration used a 560-nm long-pass dichroic mirror(XF2016), a 590DF35 band-pass filter (572.5-607.5 nm, OmegaOptical) transmitting fluorescence emitted in the pH-independentrange (i.e., mainly tetramethylrhodamine fluorescence of the FRDprobe), and a 530DF30 band-pass filter (515-545 nm, OmegaOptical) transmitting fluorescence emitted in the pH dependent range(i.e., fluorescein fluorescence). Both fluorescence ranges weredetected with photomultiplier tubes (R1447, Hamamatsu, Bridge-water, NJ) biased at 1000 V. The output was electronically filtered(RC ) 0.01 s) and then digitized using a PCI-MIO-16E-50 I/Oboard driven by Labview software (National Instruments, Austin,
(21) Eastman, S. J.; Hope, M. J.; Cullis, P. R.Biochemistry1991, 30, 1740-1745.
(22) Eastman, S. J.; Hope, M. J.; Wong, K. F.; Cullis, P. R.Biochemistry1992,31, 4262-4268.
(23) Boon, J. M.; Smith, B. D.Med. Res. ReV. 2002, 22, 251-281.(24) John, K.; Schreiber, S.; Kubelt, J.; Herrmann, A.; Mu¨ller, P.Biophys. J.
2002, 83, 3315-3323.(25) Maghelly, C.; Bisch, P. M.Braz. J. Phys.1996, 26, 604-610.(26) Duffy, C. F.; Gafoor, S.; Richards, D. P.; Admadzadeh, H.; O’Kennedy,
R.; Arriaga, E. A.Anal. Chem.2001, 73, 1855-1861.
(27) Duffy, C. F.; Fuller, K. M.; Malvey, M. W.; O’Kennedy, R.; Arriaga, E.A. Anal. Chem.2002, 74, 171-176.
(28) Marx, U.; Lassmann, G. H. H.; Wu¨stner, D.; Muller, P.; Hohlig, A.;Kubelt, J.; Herrmann, A.Biophys. J.2000, 78, 2628-2640.
Figure 1. Schematic of the capacitive effect and flip-flop transportacross the liposomal membrane. Phospholipids translocated by flip-flop are indicated by a shaded head group. pHi and pHo representthe inner pH and the outer pH, respectively. Panel A indicates thatthe excess of negative electrical charge at the side of the membranewith higher pH would induce the appearance of positive capacitivecharge (indicated as a circled positive charge) at the other side ofthe membrane. Panel B depicts the redistribution of phospholipidsin a bilayer membrane by flip-flop transport. A negatively chargedphospholipid flips from the outside to the inside where it gets aproton and changes into its uncharged form.
Mobilities of Liposomes and Acidic Organelles Langmuir, Vol. 23, No. 10, 20075585
TX). The data acquisition rate was 100 Hz, and the data were storedas binary files. The signals from the PMTs matching the filters withranges 572.5-607.5 and 515-545 nm are referred to as the ‘redchannel’ and the ‘green channel’, respectively.
Separations were carried out using a 50-µm i.d., 150-µm o.d.35.2-cm-long poly(acryloylaminopropanol)-coated fused-silica cap-illary, The coating procedure has been previously described29 andreduced the electroosmotic flow to 1.6×10⁻⁵cm2/V‚s. The liposomalpreparation or organelle fractions were injected by siphoning for 1s at 11.0 kPa, which introduced 4 nL sample, using a previouslydescribed procedure.30 Siphoning was facilitated by a three-waysolenoid valve (General Valve, Fairfield, NJ). CE separations wereperformed at-300 V/cm in 250 mM sucrose and 10 mM HEPESfree acid adjusted to pH 7.4 with potassium hydroxide.
Prior to any analysis, the detector was optimized for sensitivityand reproducibility. The detector was aligned by continuouselectrokinetic injecting 10-10M fluorescein (Invitrogen) in CE bufferat -300 V/cm, and the limit of detection (LOD) was 5.6( 0.6zeptomole (n ) 3). In addition, the uniformity of the detector’sresponse to individual particle detection was determined bycalculating the relative standard deviation (RSD) of the fluorescenceintensities of individual 1-µm Fluoresbrite YG microspheres(Polysciences, Warrington, PA) that were introduced by continuouselectrokinetic injection. RSD was 12.3% for 324 events. This valueis slightly higher than the 10% that had been reported by themicrosphere manufacturer.
Isolation of Acidic Organelles. Nonadherent CEM/C2 cells(ATTC, Manassas, VA) were cultured in 90% RPMI-1640 medium,10% fetal bovine serum (Sigma, St. Louis, MO) at 37°C and 5%CO2, and were split by addition of new medium every 2-3 days.When needed, the cell medium was supplemented with 2 mg/mLFRD for 18 h prior to cell disruption and fractionation.
Similar to the procedure previously reported, the cells were pelletedat 1480g for 5 min and washed two times in fractionation buffer.31
Cells were counted with a Fuchs-Rosenthal hemocytometer (HausserScientific, Horsham, PA). The samples were disrupted using 40strokes in a Dounce homogenizer with (0.5-2.5)×10-3-in. clearance(Kontes, Vineland, NJ) on ice. Comparison of the number of cellsfrom a phase-contrast microscopy image indicates that∼90% of thecells were disrupted with this procedure. Whole cells, nuclei, andlarge cell debris were removed by centrifugation at 600g for 5 min,and the supernatant was removed and centrifuged a second time. Afraction containing acidic organelles was pelleted from the supernatantby centrifugation at 14 000g for 20 min and resuspended in 300µLof CE buffer.32,33All the samples were stored on ice until analyzed.
Data Analysis.The peak intensities and migration times of eachindividually detected liposome were extracted from the electro-pherograms using Pickpeaks, an in-house-written procedure thatuses Igor Pro software (Wavemetrics, Lake Oswego, OR). The useof this procedure to extract the electropherogram information hasbeen previously described.27Individual events with signal intensitieshigher than a threshold (5 times the standard deviation of thebackground) were selected for further analysis.
The apparent electrophoretic mobility (µ) for an individualliposome could be calculated from the length of the capillary, whichis also the length to the detector (L), the electric field (E), and theliposome migration time (t) using the expression,
For the purpose of the studies reported here, these mobility valueswere not corrected because the low electroosmotic flow of the coated
capillaries used in these studies does not significantly contribute tothe apparent mobilities.
In order to determine whether size orú potential is the main factordetermining the electrophoretic mobility of liposomes, we used theequations developed for colloidal particles (cf. eqs 2-4) and estimatedthe liposomal size from their fluorescent cargo (cf. eqs 5 and 6).First, we expressed electrophoretic mobility as reduced electro-phoretic mobilityµr.
whereµ is the electrophoretic mobility (cm2/V‚s),ε is the dielectricconstant of water (80.2),η is the viscosity of the CE buffer (e.g.,0.00112 Pa‚s) andT is the absolute temperature (i.e., 298.15 K).
There are two relevant theoretical scenarios for the electrophoreticbehavior of rigid nonconducting spherical particles with low andhigh electrokinetic potentials (i.e.,ú above and below 25 mV).
The electrophoretic mobility of a rigid nonconducting particle ofradiusR with low ú, in a medium of viscosityη, and permittivityε, is given as
whereκ is the reciprocal of the Debye length (EDL thickness) andf(κR) is the Henry function,6 which is a function of the ionic strength(I) of the electrolyte solution.κ is calculated according toκ ) 3.288xI (nm-1).
For a particle with highú potential, the relaxation and retardationeffects may have a dramatic effect on the electrophoretic mobilityof the particle and must be taken into account. The theoretical modelsdeveloped by Overbeek, Booth, O’Brien, and Dukhin take intoaccount the relaxation effect. The O’Brien model, in particular,describes the electrophoretic mobility of colloidal particles whosedimensions are much greater than the EDL. In this model, theelectrophoretic mobility is given as,
wherek is the Boltzmann constant (1.38× 10⁻²³ J/K), e is theelementary electrical charge (1.6× 10⁻¹⁹ C), T is the absolutetemperature,zi is the valence of the counterion,M, λ, andγ areparameters obtained from the solutions of the electrokinetic equationssubjected to boundary conditions.34 λ is related to the potential asλ ) 1 - exp(-eziú/2kT). M andγ are taken as 1 and 1.328 here.The first term in eq 4 arises from the Smoluchowski equation (eq3) with f(κR) ) 1.5 atκR . 1 (Smoluchowski limit)), which is theapproximate solution of the electrokinetic equations assuming nodistortion of the ionic cloud; the second term in eq 4 is a correctionfor retardation and relaxation. An important consequence of thenonlinearity of this equation is that the electrophoretic mobility ofparticles withκR > 3 undergoes a maximum when plotted as afunction of ú. WhenκR f 0 andκR f ∞, a linear relationshipbetween electrophoretic mobility andú potential is observed. Theseand other predictions of eq 4 were plotted using Igor Pro software.
As previously reported, the tetramethylrhodamine fluorescencemeasurement for each individual liposome indicates its FRD cargo.35
Assuming equal FRD concentrations in the original FRD solutionsused to swell the liposomes and in the lumen of the final liposomes,the volume of buffer solution entrapped in each liposome,V, canbe calculated using the fluorescence intensity,I:
wheres is the detector sensitivity andc is the concentration of FRDinside the liposome.
The value forI did not need any correction for phospholipidfluorescence because control liposomes (i.e., without FRD) do not
(29) Gelfi, C.; Curcio, M.; Righetti, P. G.; Sebastiano, R.; Citterio, A.;Ahmadzadeh, H.; Dovichi, N. J.Electrophoresis1998, 19, 1677-1682.
(30) Krylov, S. N.; Starke, D. A.; Arriaga, E. A.; Zhang, Z.; Chan, N. W.;Palcic, M. M.; Dovichi, N. J.Anal. Chem.2000, 72, 872-877.
(31) Fuller, K. M.; Arriaga, E. A.Anal. Chem.2003, 75, 2123-2130.(32) Howell, N.; Nalty, M. S.; Appel, J.Plasmid1986, 16, 77-80.(33) Bogenhagen, D.; Clayton, D. A.J. Biol. Chem.1974, 249, 7991-7995.
(34) O’Brien, R. W.J. Colloid Interface Sci.1983, 92, 204-216.(35) Chen, Y.; Arriaga, E. A.Anal. Chem.2006, 78, 820-826.
µ ) LEt
(1)
µr ) - µ2εkT/3ηe
(2)
µ ) (2εú/3η)f(κR) (3)
µr ) 3eú2kT
+ 3Mλ2(1 + λM) (1 - exp( - e|ziú|
2kT ))(γ - eúkT) (4)
V ) I/sc (5)
5586 Langmuir, Vol. 23, No. 10, 2007 Chen and Arriaga
have any fluorescent response (data not shown). The value forswasdetermined as the slope of calibration curve, which was obtainedusing an uncoated fused-silica capillary, FRD standards and thesame CE-LIF detector configuration described above. Three replicateswere run for each of five FRD solutions with different concentrationsranging from 1.1×10⁻² to 1.9×10⁻³mg/L. Using simple regressionanalysis,s is (1.28( 0.05)× 105 area-unit/mg at pH 7.4. Althoughthe fluorescence of tetramethylrhodamine is theoretically insensitiveto pH, a fluorescence correction is needed to calculates for otherpH’s. This correction is needed because fluorescein partiallycontributes to the fluorescence being detected in the tetramethyl-rhodamine channel; hence, a correction factor is provided to estimatethe relative sensitivities. On the basis of the emission spectra ofFRD at different pH, the corrected sensitivities are 1.5× 10⁴ (pH4.0), 3.4× 10⁴ (pH 5.0), 5.8× 10⁴ (pH 5.8), 1.0× 10⁵ (pH 6.8),1.5 × 105 (pH 8.0) area-unit/mg, respectively (see SupportingInformation, Figure 1S). Using the detector sensitivity, probeconcentration, and fluorescence intensity, the entrapped volume foreach liposome can be calculated.
The entrapped volume (V) can be used to estimate the radius ofa liposome if it is assumed that, in the absence of an electric field,the liposome has a spherical shape. ThisR value is a minimumbecause its actually size is expected to be larger due to its multilamellarnature. This apparent liposome radiusR is given by
The electropherograms of acidic organelles isolated from cellswere analyzed using the same procedures as liposomes. In addition,the events in both pH-dependent ‘green channel’ and pH-independent‘red channel’ that had the same migration time ((0.02 s) were selectedusing an Igor Program called Coincidence Analysis. The method todetermine the pH of individual acidic organelles corresponding tothe fluorescence intensity ratio in the two channels above has beenpreviously described.35 Briefly, simple linear regression analysiswas used to determine the relationship between the fluorescence inpH-dependent and pH-independent ranges. Multiple regressions werecarried out to establish the calibration curve underlying the pH andfluorescence intensity ratio. Regressions and statistical measurementswere performed using an open sourceR project (http://www.r-project.org).
The volume (VAO) and radius (RAO) of each dextran-containingorganelle can also be estimated using eqs 5 and 6. The concentrationof dextran molecules in the acidic organelles can be considered thesame as that in the medium surrounding the cells after treatment(i.e., 1 mg/mL≈ 6.0 × 10¹⁶ dextran molecules/mL).
Results
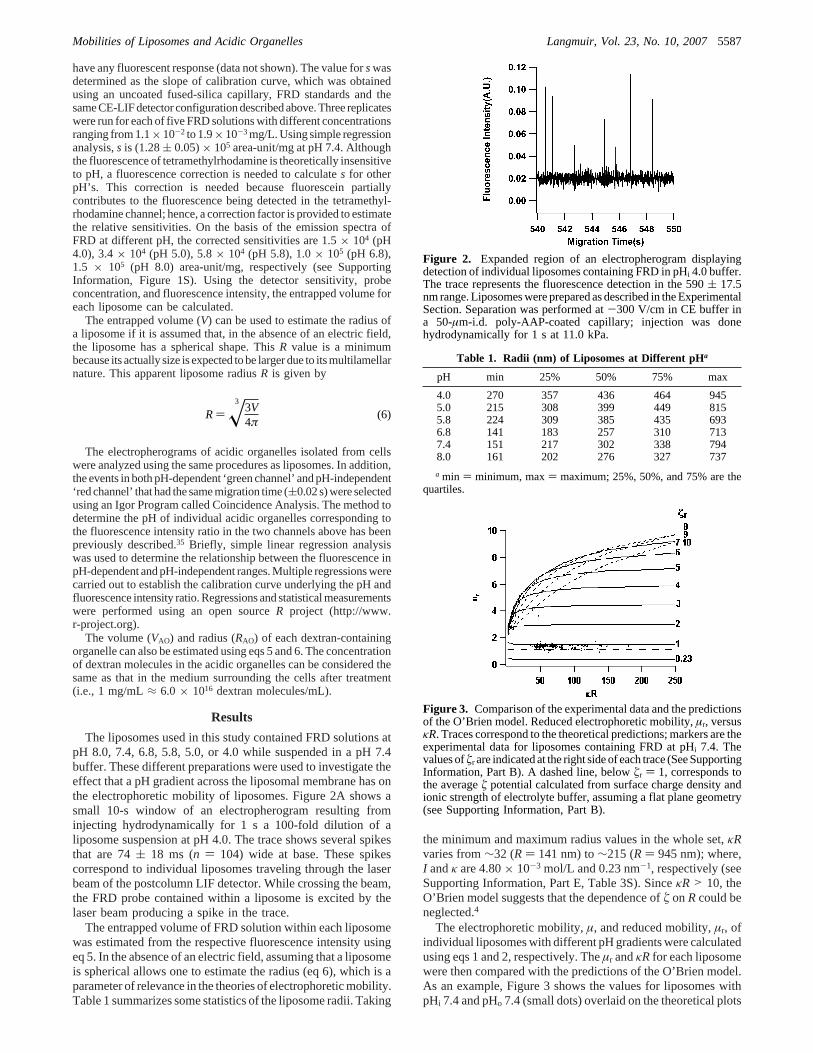
The liposomes used in this study contained FRD solutions atpH 8.0, 7.4, 6.8, 5.8, 5.0, or 4.0 while suspended in a pH 7.4buffer. These different preparations were used to investigate theeffect that a pH gradient across the liposomal membrane has onthe electrophoretic mobility of liposomes. Figure 2A shows asmall 10-s window of an electropherogram resulting frominjecting hydrodynamically for 1 s a 100-fold dilution of aliposome suspension at pH 4.0. The trace shows several spikesthat are 74( 18 ms (n ) 104) wide at base. These spikescorrespond to individual liposomes traveling through the laserbeam of the postcolumn LIF detector. While crossing the beam,the FRD probe contained within a liposome is excited by thelaser beam producing a spike in the trace.
The entrapped volume of FRD solution within each liposomewas estimated from the respective fluorescence intensity usingeq 5. In the absence of an electric field, assuming that a liposomeis spherical allows one to estimate the radius (eq 6), which is aparameter of relevance in the theories of electrophoretic mobility.Table 1 summarizes some statistics of the liposome radii. Taking
the minimum and maximum radius values in the whole set,κRvaries from∼32 (R ) 141 nm) to∼215 (R ) 945 nm); where,I andκ are 4.80× 10⁻³ mol/L and 0.23 nm-1, respectively (seeSupporting Information, Part E, Table 3S). SinceκR > 10, theO’Brien model suggests that the dependence ofú onRcould beneglected.4
The electrophoretic mobility,µ, and reduced mobility,µr, ofindividual liposomes with different pH gradients were calculatedusing eqs 1 and 2, respectively. Theµr andκR for each liposomewere then compared with the predictions of the O’Brien model.As an example, Figure 3 shows the values for liposomes withpHi 7.4 and pHo 7.4 (small dots) overlaid on the theoretical plots
Figure 2. Expanded region of an electropherogram displayingdetection of individual liposomes containing FRD in pHi 4.0 buffer.The trace represents the fluorescence detection in the 590( 17.5nm range. Liposomes were prepared as described in the ExperimentalSection. Separation was performed at-300 V/cm in CE buffer ina 50-µm-i.d. poly-AAP-coated capillary; injection was donehydrodynamically for 1 s at11.0 kPa.
Table 1. Radii (nm) of Liposomes at Different pHa
pH min 25% 50% 75% max
4.0 270 357 436 464 9455.0 215 308 399 449 8155.8 224 309 385 435 6936.8 141 183 257 310 7137.4 151 217 302 338 7948.0 161 202 276 327 737
a min ) minimum, max) maximum; 25%, 50%, and 75% are thequartiles.
Figure 3. Comparison of the experimental data and the predictionsof the O’Brien model. Reduced electrophoretic mobility,µr, versusκR. Traces correspond to the theoretical predictions; markers are theexperimental data for liposomes containing FRD at pHi 7.4. Thevalues ofúr are indicated at the right side of each trace (See SupportingInformation, Part B). A dashed line, belowúr ) 1, corresponds tothe averageú potential calculated from surface charge density andionic strength of electrolyte buffer, assuming a flat plane geometry(see Supporting Information, Part B).
R ) x33V4π
(6)
Mobilities of Liposomes and Acidic Organelles Langmuir, Vol. 23, No. 10, 20075587
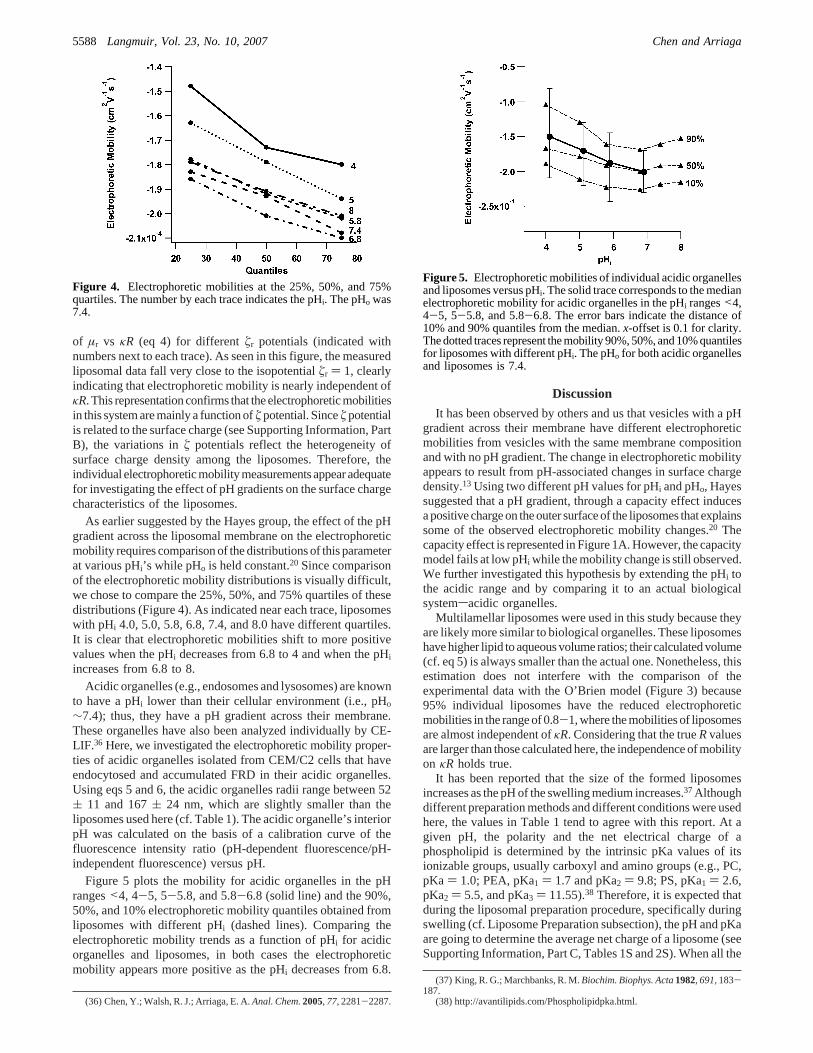
of µr vs κR (eq 4) for differentúr potentials (indicated withnumbers next to each trace). As seen in this figure, the measuredliposomal data fall very close to the isopotentialúr ) 1, clearlyindicating that electrophoretic mobility is nearly independent ofκR. This representationconfirms that theelectrophoreticmobilitiesin this system are mainly a function ofú potential. Sinceú potentialis related to the surface charge (see Supporting Information, PartB), the variations inú potentials reflect the heterogeneity ofsurface charge density among the liposomes. Therefore, theindividualelectrophoreticmobilitymeasurementsappearadequatefor investigating the effect of pH gradients on the surface chargecharacteristics of the liposomes.
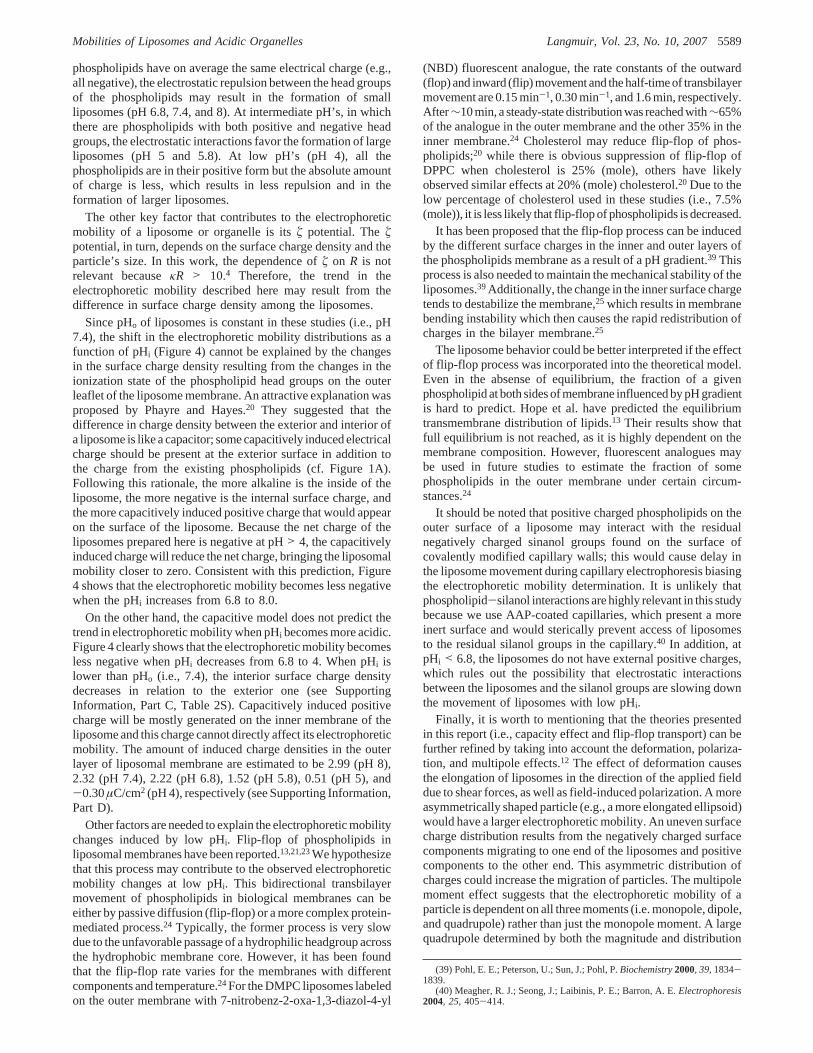
As earlier suggested by the Hayes group, the effect of the pHgradient across the liposomal membrane on the electrophoreticmobility requires comparison of the distributions of this parameterat various pHi’s while pHo is held constant.20 Since comparisonof the electrophoretic mobility distributions is visually difficult,we chose to compare the 25%, 50%, and 75% quartiles of thesedistributions (Figure 4). As indicated near each trace, liposomeswith pHi 4.0, 5.0, 5.8, 6.8, 7.4, and 8.0 have different quartiles.It is clear that electrophoretic mobilities shift to more positivevalues when the pHi decreases from 6.8 to 4 and when the pHi
increases from 6.8 to 8.Acidic organelles (e.g., endosomes and lysosomes) are known
to have a pHi lower than their cellular environment (i.e., pHo
∼7.4); thus, they have a pH gradient across their membrane.These organelles have also been analyzed individually by CE-LIF.36 Here, we investigated the electrophoretic mobility proper-ties of acidic organelles isolated from CEM/C2 cells that haveendocytosed and accumulated FRD in their acidic organelles.Using eqs 5 and 6, the acidic organelles radii range between 52( 11 and 167( 24 nm, which are slightly smaller than theliposomes used here (cf. Table 1). The acidic organelle’s interiorpH was calculated on the basis of a calibration curve of thefluorescence intensity ratio (pH-dependent fluorescence/pH-independent fluorescence) versus pH.
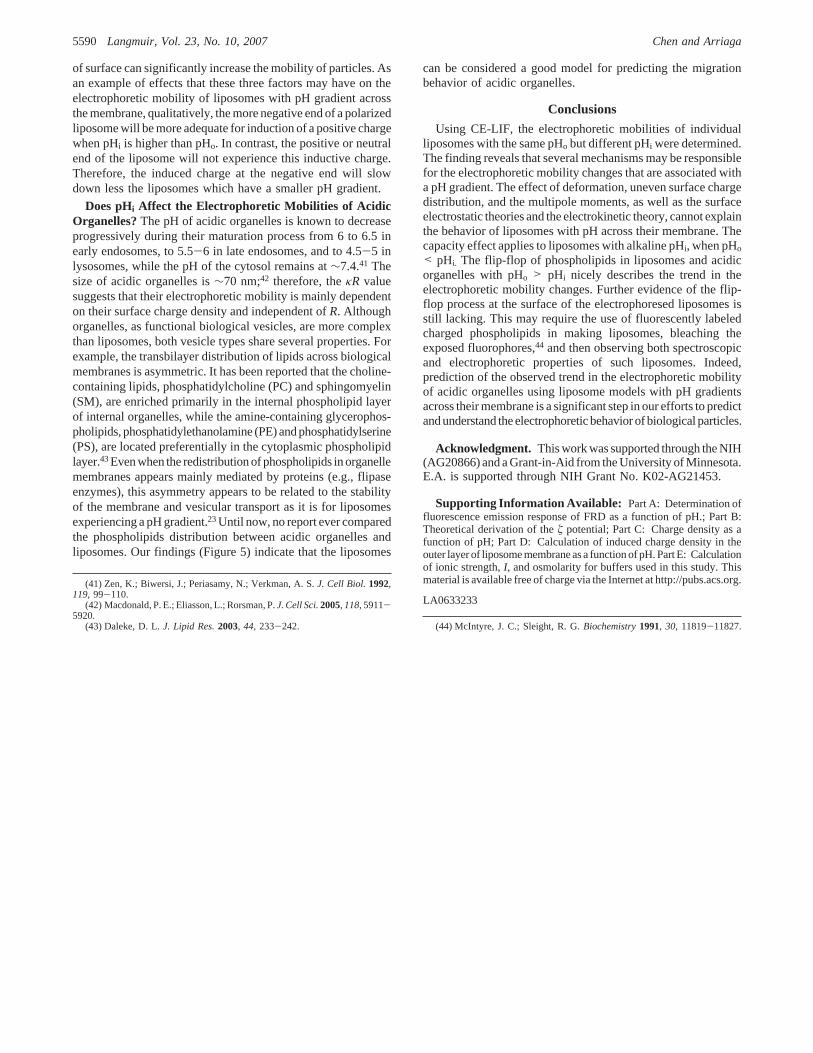
Figure 5 plots the mobility for acidic organelles in the pHranges<4, 4-5, 5-5.8, and 5.8-6.8 (solid line) and the 90%,50%, and 10% electrophoretic mobility quantiles obtained fromliposomes with different pHi (dashed lines). Comparing theelectrophoretic mobility trends as a function of pHi for acidicorganelles and liposomes, in both cases the electrophoreticmobility appears more positive as the pHi decreases from 6.8.
Discussion
It has been observed by others and us that vesicles with a pHgradient across their membrane have different electrophoreticmobilities from vesicles with the same membrane compositionand with no pH gradient. The change in electrophoretic mobilityappears to result from pH-associated changes in surface chargedensity.13 Using two different pH values for pHi and pHo, Hayessuggested that a pH gradient, through a capacity effect inducesa positive charge on the outer surface of the liposomes that explainssome of the observed electrophoretic mobility changes.20 Thecapacity effect is represented in Figure 1A. However, the capacitymodel fails at low pHi while the mobility change is still observed.We further investigated this hypothesis by extending the pHi tothe acidic range and by comparing it to an actual biologicalsystemsacidic organelles.
Multilamellar liposomes were used in this study because theyare likely more similar to biological organelles. These liposomeshavehigher lipid toaqueousvolumeratios; their calculatedvolume(cf. eq 5) is always smaller than the actual one. Nonetheless, thisestimation does not interfere with the comparison of theexperimental data with the O’Brien model (Figure 3) because95% individual liposomes have the reduced electrophoreticmobilities in the range of 0.8-1, where the mobilities of liposomesare almost independent ofκR. Considering that the trueRvaluesare larger than those calculated here, the independence of mobilityon κR holds true.
It has been reported that the size of the formed liposomesincreases as the pH of the swelling medium increases.37Althoughdifferent preparation methods and different conditions were usedhere, the values in Table 1 tend to agree with this report. At agiven pH, the polarity and the net electrical charge of aphospholipid is determined by the intrinsic pKa values of itsionizable groups, usually carboxyl and amino groups (e.g., PC,pKa ) 1.0; PEA, pKa1 ) 1.7 and pKa2 ) 9.8; PS, pKa1 ) 2.6,pKa2 ) 5.5, and pKa3 ) 11.55).38 Therefore, it is expected thatduring the liposomal preparation procedure, specifically duringswelling (cf. Liposome Preparation subsection), the pH and pKaare going to determine the average net charge of a liposome (seeSupporting Information, Part C, Tables 1S and 2S). When all the
(36) Chen, Y.; Walsh, R. J.; Arriaga, E. A.Anal. Chem.2005, 77, 2281-2287.
(37) King, R. G.; Marchbanks, R. M.Biochim. Biophys. Acta1982, 691, 183-187.
(38) http://avantilipids.com/Phospholipidpka.html.
Figure 4. Electrophoretic mobilities at the 25%, 50%, and 75%quartiles. The number by each trace indicates the pHi. The pHo was7.4.
Figure 5. Electrophoretic mobilities of individual acidic organellesand liposomes versus pHi. The solid trace corresponds to the medianelectrophoretic mobility for acidic organelles in the pHi ranges<4,4-5, 5-5.8, and 5.8-6.8. The error bars indicate the distance of10% and 90% quantiles from the median.x-offset is 0.1 for clarity.The dotted traces represent the mobility 90%, 50%, and 10% quantilesfor liposomes with different pHi. The pHo for both acidic organellesand liposomes is 7.4.
5588 Langmuir, Vol. 23, No. 10, 2007 Chen and Arriaga
phospholipids have on average the same electrical charge (e.g.,all negative), the electrostatic repulsion between the head groupsof the phospholipids may result in the formation of smallliposomes (pH 6.8, 7.4, and 8). At intermediate pH’s, in whichthere are phospholipids with both positive and negative headgroups, the electrostatic interactions favor the formation of largeliposomes (pH 5 and 5.8). At low pH’s (pH 4), all thephospholipids are in their positive form but the absolute amountof charge is less, which results in less repulsion and in theformation of larger liposomes.
The other key factor that contributes to the electrophoreticmobility of a liposome or organelle is itsú potential. Theúpotential, in turn, depends on the surface charge density and theparticle’s size. In this work, the dependence ofú on R is notrelevant becauseκR > 10.4 Therefore, the trend in theelectrophoretic mobility described here may result from thedifference in surface charge density among the liposomes.
Since pHo of liposomes is constant in these studies (i.e., pH7.4), the shift in the electrophoretic mobility distributions as afunction of pHi (Figure 4) cannot be explained by the changesin the surface charge density resulting from the changes in theionization state of the phospholipid head groups on the outerleaflet of the liposome membrane. An attractive explanation wasproposed by Phayre and Hayes.20 They suggested that thedifference in charge density between the exterior and interior ofa liposome is like a capacitor; some capacitively induced electricalcharge should be present at the exterior surface in addition tothe charge from the existing phospholipids (cf. Figure 1A).Following this rationale, the more alkaline is the inside of theliposome, the more negative is the internal surface charge, andthe more capacitively induced positive charge that would appearon the surface of the liposome. Because the net charge of theliposomes prepared here is negative at pH> 4, the capacitivelyinduced charge will reduce the net charge, bringing the liposomalmobility closer to zero. Consistent with this prediction, Figure4 shows that the electrophoretic mobility becomes less negativewhen the pHi increases from 6.8 to 8.0.
On the other hand, the capacitive model does not predict thetrend in electrophoretic mobility when pHi becomes more acidic.Figure 4 clearly shows that the electrophoretic mobility becomesless negative when pHi decreases from 6.8 to 4. When pHi islower than pHo (i.e., 7.4), the interior surface charge densitydecreases in relation to the exterior one (see SupportingInformation, Part C, Table 2S). Capacitively induced positivecharge will be mostly generated on the inner membrane of theliposome and this charge cannot directly affect its electrophoreticmobility. The amount of induced charge densities in the outerlayer of liposomal membrane are estimated to be 2.99 (pH 8),2.32 (pH 7.4), 2.22 (pH 6.8), 1.52 (pH 5.8), 0.51 (pH 5), and-0.30µC/cm2 (pH 4), respectively (see Supporting Information,Part D).
Other factors are needed to explain the electrophoretic mobilitychanges induced by low pHi. Flip-flop of phospholipids inliposomal membranes have been reported.13,21,23We hypothesizethat this process may contribute to the observed electrophoreticmobility changes at low pHi. This bidirectional transbilayermovement of phospholipids in biological membranes can beeither by passive diffusion (flip-flop) or a more complex protein-mediated process.24 Typically, the former process is very slowdue to the unfavorable passage of a hydrophilic headgroup acrossthe hydrophobic membrane core. However, it has been foundthat the flip-flop rate varies for the membranes with differentcomponents and temperature.24For the DMPC liposomes labeledon the outer membrane with 7-nitrobenz-2-oxa-1,3-diazol-4-yl
(NBD) fluorescent analogue, the rate constants of the outward(flop) and inward (flip) movement and the half-time of transbilayermovement are 0.15 min-1, 0.30 min-1, and 1.6 min, respectively.After∼10 min, a steady-state distribution was reached with∼65%of the analogue in the outer membrane and the other 35% in theinner membrane.24 Cholesterol may reduce flip-flop of phos-pholipids;20 while there is obvious suppression of flip-flop ofDPPC when cholesterol is 25% (mole), others have likelyobserved similar effects at 20% (mole) cholesterol.20 Due to thelow percentage of cholesterol used in these studies (i.e., 7.5%(mole)), it is less likely that flip-flop of phospholipids is decreased.
It has been proposed that the flip-flop process can be inducedby the different surface charges in the inner and outer layers ofthe phospholipids membrane as a result of a pH gradient.39 Thisprocess is also needed to maintain the mechanical stability of theliposomes.39Additionally, the change in the inner surface chargetends to destabilize the membrane,25 which results in membranebending instability which then causes the rapid redistribution ofcharges in the bilayer membrane.25
The liposome behavior could be better interpreted if the effectof flip-flop process was incorporated into the theoretical model.Even in the absense of equilibrium, the fraction of a givenphospholipid at both sides of membrane influenced by pH gradientis hard to predict. Hope et al. have predicted the equilibriumtransmembrane distribution of lipids.13 Their results show thatfull equilibrium is not reached, as it is highly dependent on themembrane composition. However, fluorescent analogues maybe used in future studies to estimate the fraction of somephospholipids in the outer membrane under certain circum-stances.24
It should be noted that positive charged phospholipids on theouter surface of a liposome may interact with the residualnegatively charged sinanol groups found on the surface ofcovalently modified capillary walls; this would cause delay inthe liposome movement during capillary electrophoresis biasingthe electrophoretic mobility determination. It is unlikely thatphospholipid-silanol interactions are highly relevant in this studybecause we use AAP-coated capillaries, which present a moreinert surface and would sterically prevent access of liposomesto the residual silanol groups in the capillary.40 In addition, atpHi < 6.8, the liposomes do not have external positive charges,which rules out the possibility that electrostatic interactionsbetween the liposomes and the silanol groups are slowing downthe movement of liposomes with low pHi.
Finally, it is worth to mentioning that the theories presentedin this report (i.e., capacity effect and flip-flop transport) can befurther refined by taking into account the deformation, polariza-tion, and multipole effects.12 The effect of deformation causesthe elongation of liposomes in the direction of the applied fielddue to shear forces, as well as field-induced polarization. A moreasymmetrically shaped particle (e.g., a more elongated ellipsoid)would have a larger electrophoretic mobility. An uneven surfacecharge distribution results from the negatively charged surfacecomponents migrating to one end of the liposomes and positivecomponents to the other end. This asymmetric distribution ofcharges could increase the migration of particles. The multipolemoment effect suggests that the electrophoretic mobility of aparticle is dependent on all three moments (i.e. monopole, dipole,and quadrupole) rather than just the monopole moment. A largequadrupole determined by both the magnitude and distribution
(39) Pohl, E. E.; Peterson, U.; Sun, J.; Pohl, P.Biochemistry2000, 39, 1834-1839.
(40) Meagher, R. J.; Seong, J.; Laibinis, P. E.; Barron, A. E.Electrophoresis2004, 25, 405-414.
Mobilities of Liposomes and Acidic Organelles Langmuir, Vol. 23, No. 10, 20075589
of surface can significantly increase the mobility of particles. Asan example of effects that these three factors may have on theelectrophoretic mobility of liposomes with pH gradient acrossthe membrane, qualitatively, the more negative end of a polarizedliposome will be more adequate for induction of a positive chargewhen pHi is higher than pHo. In contrast, the positive or neutralend of the liposome will not experience this inductive charge.Therefore, the induced charge at the negative end will slowdown less the liposomes which have a smaller pH gradient.
Does pHi Affect the Electrophoretic Mobilities of AcidicOrganelles?The pH of acidic organelles is known to decreaseprogressively during their maturation process from 6 to 6.5 inearly endosomes, to 5.5-6 in late endosomes, and to 4.5-5 inlysosomes, while the pH of the cytosol remains at∼7.4.41 Thesize of acidic organelles is∼70 nm;42 therefore, theκR valuesuggests that their electrophoretic mobility is mainly dependenton their surface charge density and independent ofR. Althoughorganelles, as functional biological vesicles, are more complexthan liposomes, both vesicle types share several properties. Forexample, the transbilayer distribution of lipids across biologicalmembranes is asymmetric. It has been reported that the choline-containing lipids, phosphatidylcholine (PC) and sphingomyelin(SM), are enriched primarily in the internal phospholipid layerof internal organelles, while the amine-containing glycerophos-pholipids, phosphatidylethanolamine (PE) and phosphatidylserine(PS), are located preferentially in the cytoplasmic phospholipidlayer.43Even when the redistribution of phospholipids in organellemembranes appears mainly mediated by proteins (e.g., flipaseenzymes), this asymmetry appears to be related to the stabilityof the membrane and vesicular transport as it is for liposomesexperiencing a pH gradient.23Until now, no report ever comparedthe phospholipids distribution between acidic organelles andliposomes. Our findings (Figure 5) indicate that the liposomes
can be considered a good model for predicting the migrationbehavior of acidic organelles.
Conclusions
Using CE-LIF, the electrophoretic mobilities of individualliposomes with the same pHo but different pHi were determined.The finding reveals that several mechanisms may be responsiblefor the electrophoretic mobility changes that are associated witha pH gradient. The effect of deformation, uneven surface chargedistribution, and the multipole moments, as well as the surfaceelectrostatic theories and the electrokinetic theory, cannot explainthe behavior of liposomes with pH across their membrane. Thecapacity effect applies to liposomes with alkaline pHi, when pHo
< pHi. The flip-flop of phospholipids in liposomes and acidicorganelles with pHo > pHi nicely describes the trend in theelectrophoretic mobility changes. Further evidence of the flip-flop process at the surface of the electrophoresed liposomes isstill lacking. This may require the use of fluorescently labeledcharged phospholipids in making liposomes, bleaching theexposed fluorophores,44 and then observing both spectroscopicand electrophoretic properties of such liposomes. Indeed,prediction of the observed trend in the electrophoretic mobilityof acidic organelles using liposome models with pH gradientsacross their membrane is a significant step in our efforts to predictand understand the electrophoretic behavior of biological particles.
Acknowledgment. This work was supported through the NIH(AG20866) and a Grant-in-Aid from the University of Minnesota.E.A. is supported through NIH Grant No. K02-AG21453.
Supporting Information Available: Part A: Determination offluorescence emission response of FRD as a function of pH.; Part B:Theoretical derivation of theú potential; Part C: Charge density as afunction of pH; Part D: Calculation of induced charge density in theouter layer of liposome membrane as a function of pH. Part E: Calculationof ionic strength,I, and osmolarity for buffers used in this study. Thismaterial is available free of charge via the Internet at http://pubs.acs.org.
LA0633233
(41) Zen, K.; Biwersi, J.; Periasamy, N.; Verkman, A. S.J. Cell Biol.1992,119, 99-110.
(42) Macdonald, P. E.; Eliasson, L.; Rorsman, P.J. Cell Sci.2005, 118, 5911-5920.
(43) Daleke, D. L.J. Lipid Res.2003, 44, 233-242. (44) McIntyre, J. C.; Sleight, R. G.Biochemistry1991, 30, 11819-11827.
5590 Langmuir, Vol. 23, No. 10, 2007 Chen and Arriaga