Embed Size (px)
Citation preview
DOI 10.1007/s11573-012-0581-0Z Betriebswirtsch (2012) 82:25–46
Zf B-SPECIAL ISSUE 4/2012
Inferring decision strategies from clickstreamsin decision support systems: a new process-tracingapproach using state machines
Jella Pfeiffer • Malte Probst • Wolfgang Steitz • Franz Rothlauf
Abstract: Webstores can easily gather large amounts of consumer data, including clicks on single el-ements of the user interface, navigation patterns, user profile data, and search texts. Such clickstreamdata are both interesting to merchandisers as well as to researchers in the field of decision-makingbehavior, because they describe consumer decision-behavior on websites. This paper introducesan approach that infers decision-behavior from clickstream data. The approach observes clicks onelements of a decision-support-system and triggers a set of state-machines for each click. Each state-machine represents a particular decision-strategy which a user can follow. The approach returns aset of decision strategies that best explain the observed click-behavior of a user. Results of two ex-periments show that the algorithm infers strategies accurately. In the first experiment, the approachcorrectly infers most of the pre-defined decision-strategies. The second study analyzes the behaviorof thirty-eight respondents and finds that the inferred mix of decision-strategies fits well the behaviordescribed in the literature to date. Results show that using decision-support-systems on a web siteand observing the user’s click-behavior make it possible to infer a specific decision strategy. Theproposed method is general enough to be easily applied to both research and real-world settings,along with other decision-support-systems and strategies.
© Gabler-Verlag 2012
Dr. J. Pfeiffer (�) · Dipl. Wirt.-Inf. M. Probst · Dipl. Wirt.-Inf. W. Steitz · Prof. Dr. F. RothlaufDept. of Information Systems and Business Administration, Johannes Gutenberg-Universität Mainz,Jakob-Welder-Weg 9, 55128 Mainz, GermanyE-Mail: [email protected]
Dipl. Wirt.-Inf. M. ProbstE-Mail: [email protected]
Dipl. Wirt.-Inf. W. SteitzE-Mail: [email protected]
Prof. Dr. F. RothlaufE-Mail: [email protected]
26 J. Pfeiffer et al.
Keywords: Decision support systems · Clickstream analysis · Decision strategies · State machines ·Consumer behavior
JEL Classification: C81 · M32
1 Introduction
The importance of online shopping has grown remarkably over the last decade. In 2009,every West European spent on average € 483 online and this amount is expected to grow to€ 601 in 2014 (Evans et al. 2010). In Germany, the number of online shoppers has almostdoubled since 2000: 44 % of all adults regularly buy products online today. In WesternEurope, online sales reached € 68 billion in 2009 and Forrester research forecasts it willreach € 114 billion by 2014 with an 11 % compound annual growth rate.
In contrast to traditional shopping, e-commerce allows the easy gathering of a largeamount of consumer data. Webstores can easily store information on all kinds of pro-cess data that describe consumer behavior: clicks on single elements of the user interface,navigation, user profile data, search texts, etc. This kind of data is both interesting tomerchandisers as well as to researchers in the field of decision-making behavior. Mer-chandisers can further improve their webstores and product offerings based on knowledgegained from such data. They may improve conversion rates or even influence purchasebehavior. Researchers can use this data to study how people make decisions.
The goal of this work is to introduce an algorithm that infers decision behavior fromclickstream data. Because of the diversity and large amount of clickstream data, we suggestfocusing on very specific parts of clickstreams. We focus only on clicks related to elementsof decision support systems (DSSs). We take a DSS which was programmed for onlinepurchase decisions, also called interactive information management tools (IIMTs). Thealgorithm works as follows. Clicks on elements of these IIMTs are used as input. Theseclicks can then activate different state machines, where each state machine represents acertain kind of decision strategy. By analyzing which state machines are activated, whenthey are activated and how long they are activated for, the algorithm is able to output a setof decision strategies that best explain the observed clickstream.
The paper is structured as follows. In the second section, we define the problems peopleare faced with when purchasing a product online and we describe decision strategies. Insection three, we point out how existing approaches study decision behavior based onprocess data such as the clickstreams used in our approach. In the following section, wethen present the DSS which we used in our analysis and allude to the relationship betweenDSS and decision strategies. In subsection 4.3, we describe our newly proposed algorithmand validate it in the subsequent sections five and six in two empirical studies. We finishthe paper by concluding and explaining potential future work.
2 Decision strategies and choice tasks
Decision-making behavior is typically modeled by various decision strategies. Decisionstrategies describe the process of acquiring, evaluating, and comparing choice task in-
Inferring decision strategies from clickstreams in decision . . . 27
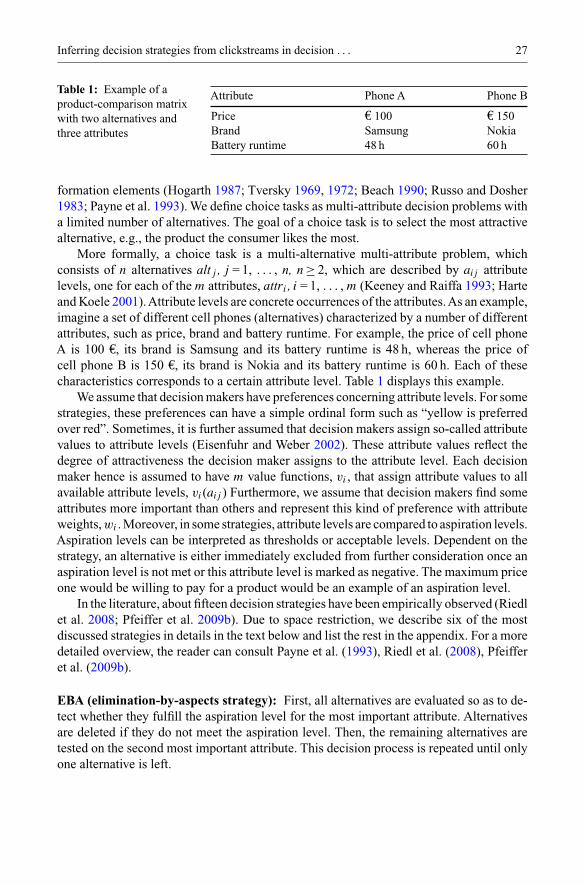
Table 1: Example of aproduct-comparison matrixwith two alternatives andthree attributes
Attribute Phone A Phone B
Price € 100 € 150Brand Samsung NokiaBattery runtime 48 h 60 h
formation elements (Hogarth 1987; Tversky 1969, 1972; Beach 1990; Russo and Dosher1983; Payne et al. 1993). We define choice tasks as multi-attribute decision problems witha limited number of alternatives. The goal of a choice task is to select the most attractivealternative, e.g., the product the consumer likes the most.
More formally, a choice task is a multi-alternative multi-attribute problem, whichconsists of n alternatives altj , j = 1, . . . , n, n ≥ 2, which are described by aij attributelevels, one for each of the m attributes, attri , i = 1, . . . , m (Keeney and Raiffa 1993; Harteand Koele 2001).Attribute levels are concrete occurrences of the attributes.As an example,imagine a set of different cell phones (alternatives) characterized by a number of differentattributes, such as price, brand and battery runtime. For example, the price of cell phoneA is 100 €, its brand is Samsung and its battery runtime is 48 h, whereas the price ofcell phone B is 150 €, its brand is Nokia and its battery runtime is 60 h. Each of thesecharacteristics corresponds to a certain attribute level. Table 1 displays this example.
We assume that decision makers have preferences concerning attribute levels. For somestrategies, these preferences can have a simple ordinal form such as “yellow is preferredover red”. Sometimes, it is further assumed that decision makers assign so-called attributevalues to attribute levels (Eisenfuhr and Weber 2002). These attribute values reflect thedegree of attractiveness the decision maker assigns to the attribute level. Each decisionmaker hence is assumed to have m value functions, vi , that assign attribute values to allavailable attribute levels, vi(aij ) Furthermore, we assume that decision makers find someattributes more important than others and represent this kind of preference with attributeweights, wi . Moreover, in some strategies, attribute levels are compared to aspiration levels.Aspiration levels can be interpreted as thresholds or acceptable levels. Dependent on thestrategy, an alternative is either immediately excluded from further consideration once anaspiration level is not met or this attribute level is marked as negative. The maximum priceone would be willing to pay for a product would be an example of an aspiration level.
In the literature, about fifteen decision strategies have been empirically observed (Riedlet al. 2008; Pfeiffer et al. 2009b). Due to space restriction, we describe six of the mostdiscussed strategies in details in the text below and list the rest in the appendix. For a moredetailed overview, the reader can consult Payne et al. (1993), Riedl et al. (2008), Pfeifferet al. (2009b).
EBA (elimination-by-aspects strategy): First, all alternatives are evaluated so as to de-tect whether they fulfill the aspiration level for the most important attribute. Alternativesare deleted if they do not meet the aspiration level. Then, the remaining alternatives aretested on the second most important attribute. This decision process is repeated until onlyone alternative is left.
28 J. Pfeiffer et al.
CONJ (conjunctive rule): The decision maker uses an alternative-wise approach wherehe or she considers a complete alternative before proceeding to the next one. The alternativewhere the aspiration levels of all the attributes are satisfied is selected. If there is no suchalternative, nothing is selected. If several alternatives satisfy all aspiration levels, one ofthem is selected at random.
LEX (lexicographic rule): The alternative with the best attribute level on the most im-portant attribute is selected. If there is a tie, the best alternatives are compared accordingto the second most important attribute and so on.
WADD (weighted additive strategy): The utility-maximizing alternative is selected. Thedecision maker therefore assigns attribute values to all attribute levels and attributes weightsto attributes. The overall utility of an alternative is the sum of all weighted attribute values.A weighted attribute value is defined as the product of an attribute value times the weightof its corresponding attribute. Attribute weight allows the decision maker to weigh someattributes higher than others.
FRQ (frequency of good and/or bad features rule): First of all, the aspiration levels ofall attributes are determined. This allows the decision maker to decide whether the attributelevel of an alternative is ‘good’ or ‘bad’. The amount of ‘good’ and/or ‘bad’ attributes foreach alternative is then counted and the highest scoring alternative is selected.
MCD (majority of confirming dimensions rule): The alternatives are compared twoat a time, using all of their attributes: the alternative with a higher number of superiorattributes is compared with the next alternative. Such pairwise comparisons are conducteduntil only one alternative is left.
Typically, it is assumed that decision makers apply one of these strategies when makinga decision (Payne et al. 1993). However, several researchers have recently found that thedecision process is sometimes separated into different stages (Russo and Leclerc 1994;Pfeiffer et al. 2009a). In the first stage, decision makers try to reduce choice task complexityby eliminating alternatives. Examples for decision strategies which eliminate alternativesare EBA and LEX. EBA and LEX belong to the group of non-compensatory strategies,which do not take all attributes into account. A low value on an attribute removes thealternative from the choice task regardless of the values of the other attributes. In thesecond stage, decision makers put more effort into comparing the remaining alternatives(Payne 1976; Olshavsky 1979; Svenson 1979; Payne et al. 1988). Hence, in the first stage,they use simple heuristics and focus on only a few attributes, while in the second stagethey consider the choice task holistically, using more effortful strategies such as WADDor EQW (see the appendix for a definition of EQW; Payne 1976; Bettman and Park 1980;Luce et al. 1997; Gilbride and Allenby 2004, 2006). WADD and EQW belong to the groupof compensatory strategies where the low value of one attribute can be compensated by ahigh value of another attribute (Payne 1976; Ford et al. 1989). Such strategies require allattribute levels to be considered. The decision maker is, in these cases, often required topossess high cognitive capabilities.
Inferring decision strategies from clickstreams in decision . . . 29
We can further distinguish between strategies that induce an attribute-wise or analternative-wise comparison of attribute levels. Attribute-wise behavior characterizes adecision maker who picks one attribute, compares its attribute levels across all alterna-tives, and then moves to the next attribute (examples are EBA and LEX). Comparing allproducts first according to their color and then according to their price is an exampleof attribute-wise processing. Alternative-wise strategies, by contrast, define the behaviorof the decision maker who sequentially evaluates alternatives according to several or allattribute levels (examples are EQW, WADD, MAJ (see the appendix for a definition ofMAJ)). Several studies have found that eliminating alternatives is easier if the alternativesare compared attribute-wise rather than alternative-wise and there is empirical evidencethat people use strategies with attribute-wise comparison in the first stage and strategieswith alternative-wise comparison in the second stage (Russo and Dosher 1983; Tversky1969; Bettman and Park 1980; Luce et al. 1997; Pfeiffer et al. 2012).
3 Inferring decision behavior
The question remains: how can we know which kind of decision strategy is being usedby the decision maker? Process-tracing techniques try to infer decision behavior fromdata which is gathered during the decision process. The data is typically recorded in theform of verbal protocols, eye movements or clickstreams. With verbal protocols, decisionmakers describe their behavior either during or after the decision process. Russo et al.(1989) criticize both simultaneous and retrospective verbal protocols. They argue thatsimultaneous protocols might interfere with the choice task and found that in retrospectiveprotocols respondents either forgot what actually happened or did not report truthfully.Besides a potential lack of validity, several other disadvantages such as the amount of timenecessary to transcribe and code statements have caused a decrease in the use of verbalprotocols (Reisen et al. 2008). Now, due to advances in the field of information technologyin recent years, much more sophisticated and automatized techniques such as eye-trackingand clickstream analyses are available. An eye tracker system is able to precisely recordfixations on attribute levels or other pieces of information (Lohse and Johnson 1996; Reisenet al. 2008). It keeps track of not only the exact position and sequence of the fixations,but also of the length of fixations. Eye tracking is of high external validity as it allowsresearchers to capture the information acquisition happening at the level of the decisionmaker’s visual system and creates a situation which is closer to a natural purchasing processthan other techniques do (Russo 1978; Russo and Dosher 1983; Russo and Leclerc 1994).However, both eye tracking and verbal protocols can only be applied in laboratory settingsand are, for instance, not suitable for anonymous online experiments and online purchasedecisions.
We therefore suggest using clickstream analysis as the main technique to analyzedecision behaviors on the Internet. Clickstream analysis is the predominant method usednot only in real-world online webstores, but also in research, with the so-called Mouselab-technique. The mouselab keeps track of information acquisition, response time and choicesby recording the mouse movements of a choice task on a computer screen (Bettman et al.1990). At the beginning of the choice task, all attribute levels are hidden behind boxes.
30 J. Pfeiffer et al.
Only by clicking or moving the cursor on each box can the respondent retrieve the attributelevel. In the original version, the box is hidden again once the cursor moves away (Payneet al. 1988). Several works which rely on the Mouselab technique and its variants havestudied the time it takes to make a decision, the number and variety of different attributelevels a decision maker considers, the average number of attribute levels per alternativeand the sequence in which information is acquired (Bettman et al. 1993; Böckenholt et al.1991; Fasolo et al. 2003; Garbarino and Edell 1997; Klein andYadav 1989). Unfortunately,the insights gained from these studies are almost always too general, describing only ifthe decision maker used an overall alternative-wise or attribute wise strategy, rather thandescribing which particular decision strategy was used. This is because the amount of timeneeded to make a decision, the quantity of attribute levels and the information acquisitionsequences constitute insufficient data for determining which decision strategy has beenapplied (Bröder and Schiffer 2003).
4 Clickstream on DSS-elements as a new process-tracing method
In this section, we describe the main contribution of this work. First, we describe a DSSconsisting of a set of IIMTs that has recently been introduced to help consumers whenmaking online purchase decisions. Then, we point to the relationship between these IIMTsand decision strategies. In the third part, we introduce our algorithm, which infers decisionstrategies by using clickstreams on these IIMTs.
4.1 IIMTs as DSS in choice tasks
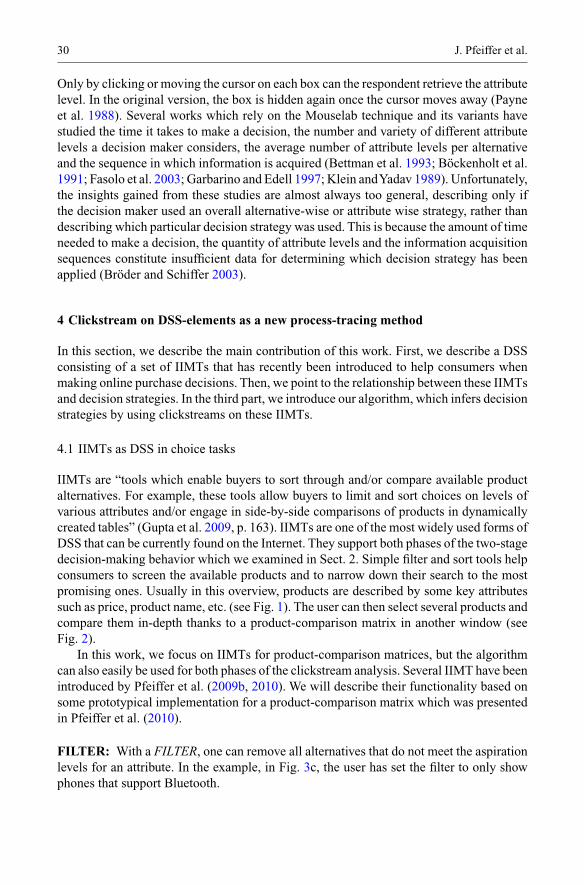
IIMTs are “tools which enable buyers to sort through and/or compare available productalternatives. For example, these tools allow buyers to limit and sort choices on levels ofvarious attributes and/or engage in side-by-side comparisons of products in dynamicallycreated tables” (Gupta et al. 2009, p. 163). IIMTs are one of the most widely used forms ofDSS that can be currently found on the Internet. They support both phases of the two-stagedecision-making behavior which we examined in Sect. 2. Simple filter and sort tools helpconsumers to screen the available products and to narrow down their search to the mostpromising ones. Usually in this overview, products are described by some key attributessuch as price, product name, etc. (see Fig. 1). The user can then select several products andcompare them in-depth thanks to a product-comparison matrix in another window (seeFig. 2).
In this work, we focus on IIMTs for product-comparison matrices, but the algorithmcan also easily be used for both phases of the clickstream analysis. Several IIMT have beenintroduced by Pfeiffer et al. (2009b, 2010). We will describe their functionality based onsome prototypical implementation for a product-comparison matrix which was presentedin Pfeiffer et al. (2010).
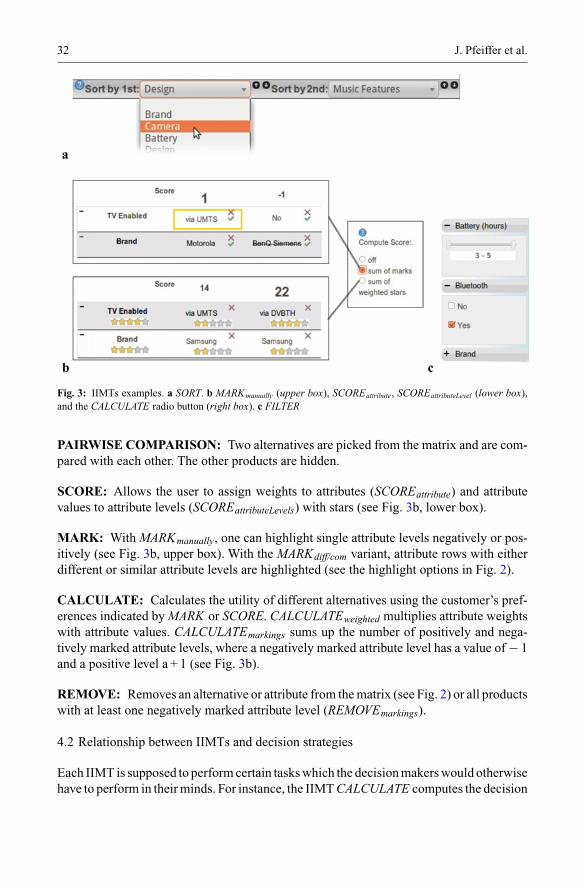
FILTER: With a FILTER, one can remove all alternatives that do not meet the aspirationlevels for an attribute. In the example, in Fig. 3c, the user has set the filter to only showphones that support Bluetooth.
Inferring decision strategies from clickstreams in decision . . . 31
Fig. 1: Screening phase with the IIMT FILTER and the possibility to SORT and choose products, whichcan then be compared in-depth in a product-comparison matrix with the IIMT PAIRWISE COMPARISON(www.cdw.com)
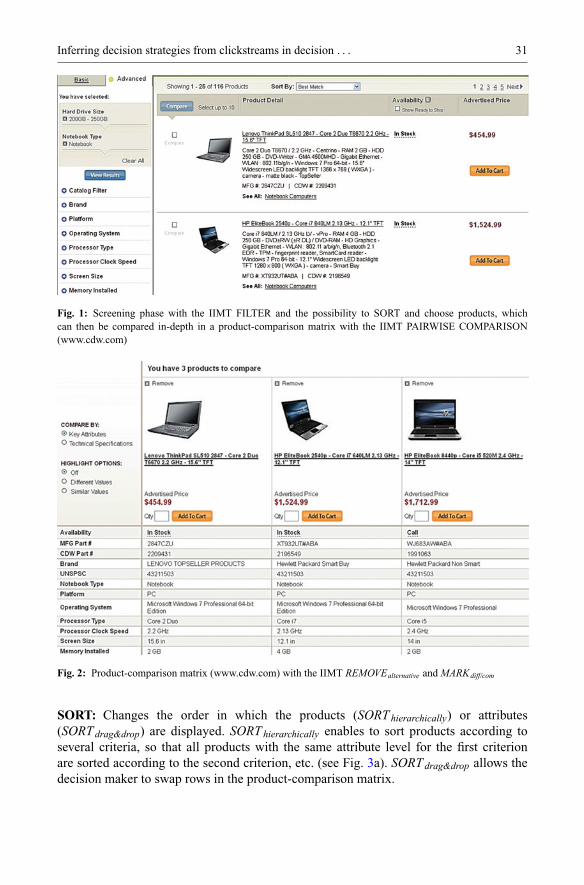
Fig. 2: Product-comparison matrix (www.cdw.com) with the IIMT REMOVEalternative and MARKdiff/com
SORT: Changes the order in which the products (SORT hierarchically) or attributes(SORT drag&drop) are displayed. SORT hierarchically enables to sort products according toseveral criteria, so that all products with the same attribute level for the first criterionare sorted according to the second criterion, etc. (see Fig. 3a). SORT drag&drop allows thedecision maker to swap rows in the product-comparison matrix.
32 J. Pfeiffer et al.
Fig. 3: IIMTs examples. a SORT. b MARKmanually (upper box), SCOREattribute, SCOREattributeLevel (lower box),and the CALCULATE radio button (right box). c FILTER
PAIRWISE COMPARISON: Two alternatives are picked from the matrix and are com-pared with each other. The other products are hidden.
SCORE: Allows the user to assign weights to attributes (SCOREattribute) and attributevalues to attribute levels (SCOREattributeLevels) with stars (see Fig. 3b, lower box).
MARK: With MARKmanually, one can highlight single attribute levels negatively or pos-itively (see Fig. 3b, upper box). With the MARKdiff/com variant, attribute rows with eitherdifferent or similar attribute levels are highlighted (see the highlight options in Fig. 2).
CALCULATE: Calculates the utility of different alternatives using the customer’s pref-erences indicated by MARK or SCORE. CALCULATEweighted multiplies attribute weightswith attribute values. CALCULATEmarkings sums up the number of positively and nega-tively marked attribute levels, where a negatively marked attribute level has a value of − 1and a positive level a + 1 (see Fig. 3b).
REMOVE: Removes an alternative or attribute from the matrix (see Fig. 2) or all productswith at least one negatively marked attribute level (REMOVEmarkings).
4.2 Relationship between IIMTs and decision strategies
Each IIMT is supposed to perform certain tasks which the decision makers would otherwisehave to perform in their minds. For instance, the IIMT CALCULATE computes the decision
Inferring decision strategies from clickstreams in decision . . . 33
maker’s utility function and thus reduces the decision maker’s cognitive burden. Further-more, whenever decision makers apply a CALCULATE, we can come to the conclusionthat they applied a strategy which calculates a utility function. Thus, the IIMTs are relatedto particular strategies. However, one IIMT does not necessarily support just one decisionstrategy. On the contrary, one IIMT can support several strategies, but it is important tounderstand that each combination of IIMTs supports exactly one strategy. For instance, inthe prototype for which we tested our algorithm, the IIMT CALCULATEweighted must beclicked once before the user can assign attribute values with SCORE. Without applyingthe IIMT CALCULATEweighted, the interface hides all the stars and thus does not providethe possibility to prompt in the preference information with SCORE (see Fig. 3b).
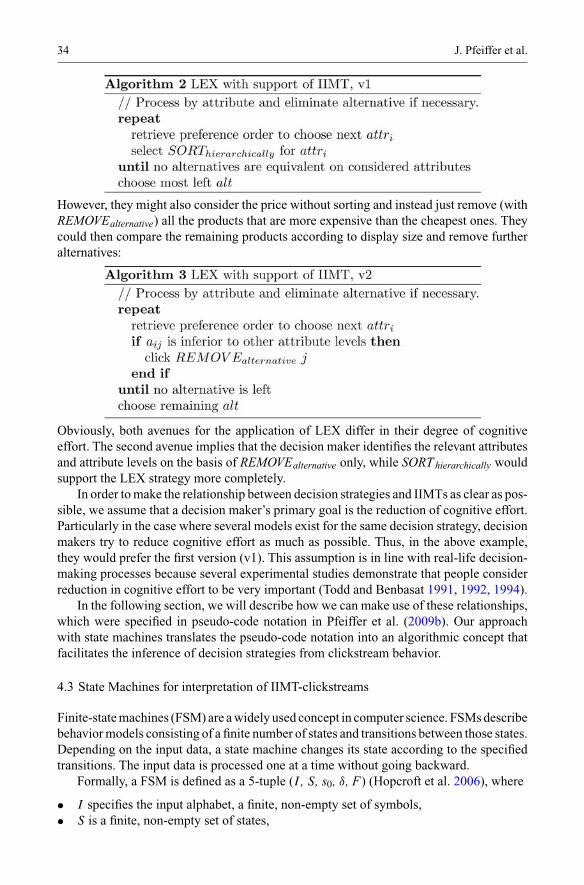
Pfeiffer et al. (2009b) introduced pseudo-code language to describe the relationshipbetween decision strategies and IIMTs. An example for such an algorithmic descriptionfor the FRQ strategy is shown below.
With CALCULATEmarkings, the user activates the possibility to mark attribute levels aseither positive or negative (see Fig. 3b, right box). The interface automatically sums upthe positive and negative marks and displays the appropriate scores for each product inthe top row. The users can thus choose the product with the highest score whenever theyare finished with the mark assignments. The relationship between decision strategies andIIMTs is sometimes ambiguous because there might be different ways to use IIMTs tosupport the same decision strategy. For LEX, for example, a decision maker might sortthe products hierarchically according to the most important attribute, for example, price(SORT ascendingly), and to the second most important attribute, for example display size(SORT descendingly). If two products share the same (cheapest) price, but one of themhas a larger display, decision makers can easily identify their preferred product once theproducts are sorted:
34 J. Pfeiffer et al.
However, they might also consider the price without sorting and instead just remove (withREMOVEalternative) all the products that are more expensive than the cheapest ones. Theycould then compare the remaining products according to display size and remove furtheralternatives:
Obviously, both avenues for the application of LEX differ in their degree of cognitiveeffort. The second avenue implies that the decision maker identifies the relevant attributesand attribute levels on the basis of REMOVEalternative only, while SORT hierarchically wouldsupport the LEX strategy more completely.
In order to make the relationship between decision strategies and IIMTs as clear as pos-sible, we assume that a decision maker’s primary goal is the reduction of cognitive effort.Particularly in the case where several models exist for the same decision strategy, decisionmakers try to reduce cognitive effort as much as possible. Thus, in the above example,they would prefer the first version (v1). This assumption is in line with real-life decision-making processes because several experimental studies demonstrate that people considerreduction in cognitive effort to be very important (Todd and Benbasat 1991, 1992, 1994).
In the following section, we will describe how we can make use of these relationships,which were specified in pseudo-code notation in Pfeiffer et al. (2009b). Our approachwith state machines translates the pseudo-code notation into an algorithmic concept thatfacilitates the inference of decision strategies from clickstream behavior.
4.3 State Machines for interpretation of IIMT-clickstreams
Finite-state machines (FSM) are a widely used concept in computer science. FSMs describebehavior models consisting of a finite number of states and transitions between those states.Depending on the input data, a state machine changes its state according to the specifiedtransitions. The input data is processed one at a time without going backward.
Formally, a FSM is defined as a 5-tuple (I , S, s0, δ, F) (Hopcroft et al. 2006), where
• I specifies the input alphabet, a finite, non-empty set of symbols,• S is a finite, non-empty set of states,
Inferring decision strategies from clickstreams in decision . . . 35
• s0 ∈ S is the initial state,• δ:S × Σ → S the transition function, which returns a state depending on the input
symbol and the current state, and• F ⊆ S is the (possibly empty) set of final states.
State machines can be used to represent processes and action/state conversions in a flexibleand coherent way. By designing state machines which reflect the relationship betweendecision strategies and IIMTs, we are able to identify patterns in the clickstream data andtrace those patterns back to the chosen strategy which led to the initial choice and use ofthe IIMT. The data analysis is performed in several steps:
1. Preprocessing: data cleansing2. Creation of activation vectors for each state machine3. Postprocessing I: cleaning activation vectors from unfinished clickstreams4. Postprocessing II: finding the dominating activation vectors.
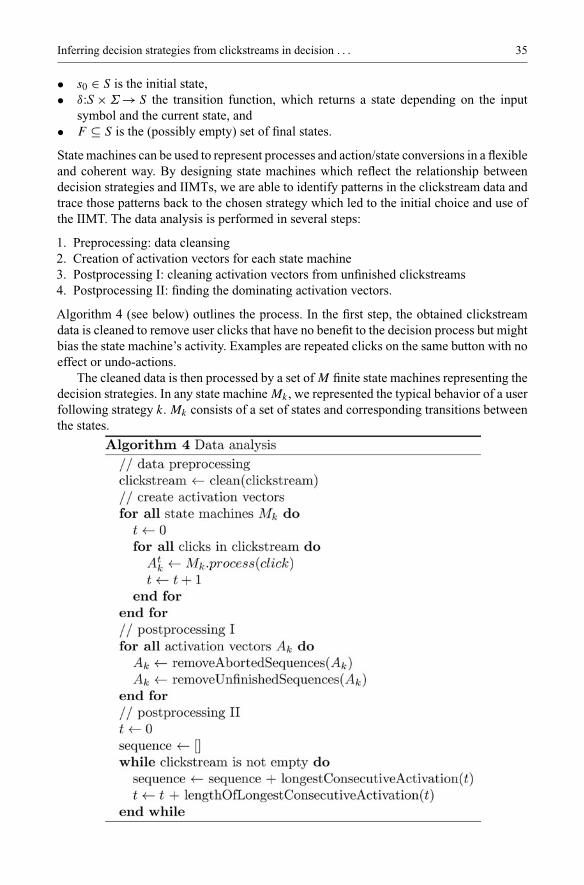
Algorithm 4 (see below) outlines the process. In the first step, the obtained clickstreamdata is cleaned to remove user clicks that have no benefit to the decision process but mightbias the state machine’s activity. Examples are repeated clicks on the same button with noeffect or undo-actions.
The cleaned data is then processed by a set of M finite state machines representing thedecision strategies. In any state machine Mk , we represented the typical behavior of a userfollowing strategy k. Mk consists of a set of states and corresponding transitions betweenthe states.
36 J. Pfeiffer et al.
MARKmanuallynegative
MARKmanuallynegative
MARKmanuallynegative
MARKmanuallynegative
MARKmanuallynegative
MARKmanuallypositive
MARKmanuallyNegative
MARKmanuallypositive
CALCULATEmarkings
CALCULATEmarkings
CALCULATEmarkings
CALCULATEmarkings
CALCULATEoff/weighted
CALCULATEoff/weighted
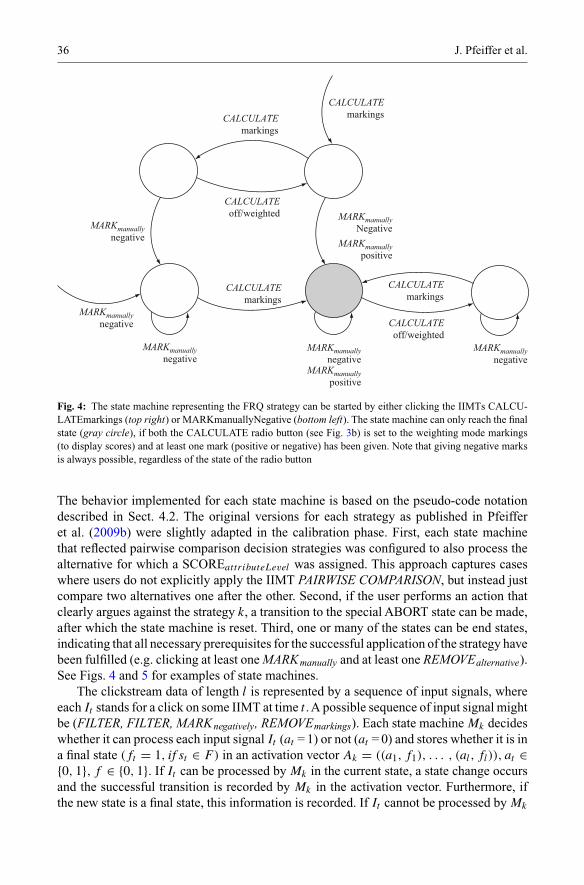
Fig. 4: The state machine representing the FRQ strategy can be started by either clicking the IIMTs CALCU-LATEmarkings (top right) or MARKmanuallyNegative (bottom left). The state machine can only reach the finalstate (gray circle), if both the CALCULATE radio button (see Fig. 3b) is set to the weighting mode markings(to display scores) and at least one mark (positive or negative) has been given. Note that giving negative marksis always possible, regardless of the state of the radio button
The behavior implemented for each state machine is based on the pseudo-code notationdescribed in Sect. 4.2. The original versions for each strategy as published in Pfeifferet al. (2009b) were slightly adapted in the calibration phase. First, each state machinethat reflected pairwise comparison decision strategies was configured to also process thealternative for which a SCOREattributeLevel was assigned. This approach captures caseswhere users do not explicitly apply the IIMT PAIRWISE COMPARISON, but instead justcompare two alternatives one after the other. Second, if the user performs an action thatclearly argues against the strategy k, a transition to the special ABORT state can be made,after which the state machine is reset. Third, one or many of the states can be end states,indicating that all necessary prerequisites for the successful application of the strategy havebeen fulfilled (e.g. clicking at least one MARKmanually and at least one REMOVEalternative).See Figs. 4 and 5 for examples of state machines.
The clickstream data of length l is represented by a sequence of input signals, whereeach It stands for a click on some IIMT at time t . A possible sequence of input signal mightbe (FILTER, FILTER, MARKnegatively, REMOVEmarkings). Each state machine Mk decideswhether it can process each input signal It (at = 1) or not (at = 0) and stores whether it is ina final state (ft = 1, if st ∈ F) in an activation vector Ak = ((a1, f1), . . . , (al, fl)), at ∈{0, 1}, f ∈ {0, 1}. If It can be processed by Mk in the current state, a state change occursand the successful transition is recorded by Mk in the activation vector. Furthermore, ifthe new state is a final state, this information is recorded. If It cannot be processed by Mk
Inferring decision strategies from clickstreams in decision . . . 37
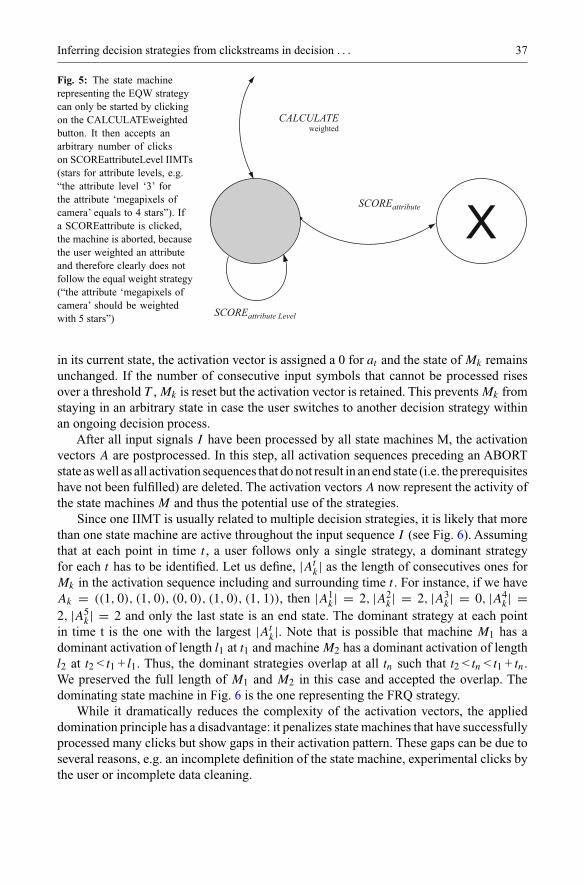
Fig. 5: The state machinerepresenting the EQW strategycan only be started by clickingon the CALCULATEweightedbutton. It then accepts anarbitrary number of clickson SCOREattributeLevel IIMTs(stars for attribute levels, e.g.“the attribute level ‘3’ forthe attribute ‘megapixels ofcamera’ equals to 4 stars”). Ifa SCOREattribute is clicked,the machine is aborted, becausethe user weighted an attributeand therefore clearly does notfollow the equal weight strategy(“the attribute ‘megapixels ofcamera’ should be weightedwith 5 stars”)
SCOREattribute Level
SCOREattribute
CALCULATEweighted
in its current state, the activation vector is assigned a 0 for at and the state of Mk remainsunchanged. If the number of consecutive input symbols that cannot be processed risesover a threshold T , Mk is reset but the activation vector is retained. This prevents Mk fromstaying in an arbitrary state in case the user switches to another decision strategy withinan ongoing decision process.
After all input signals I have been processed by all state machines M, the activationvectors A are postprocessed. In this step, all activation sequences preceding an ABORTstate as well as all activation sequences that do not result in an end state (i.e. the prerequisiteshave not been fulfilled) are deleted. The activation vectors A now represent the activity ofthe state machines M and thus the potential use of the strategies.
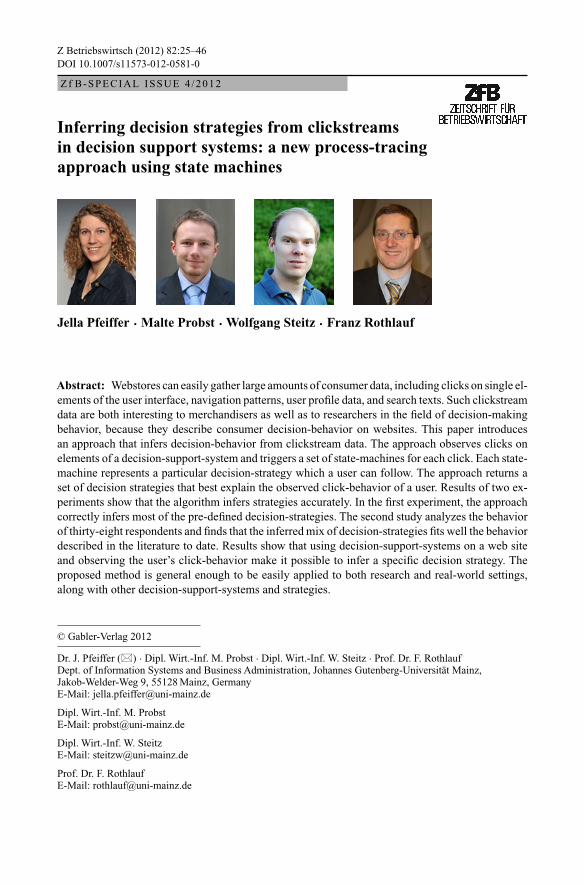
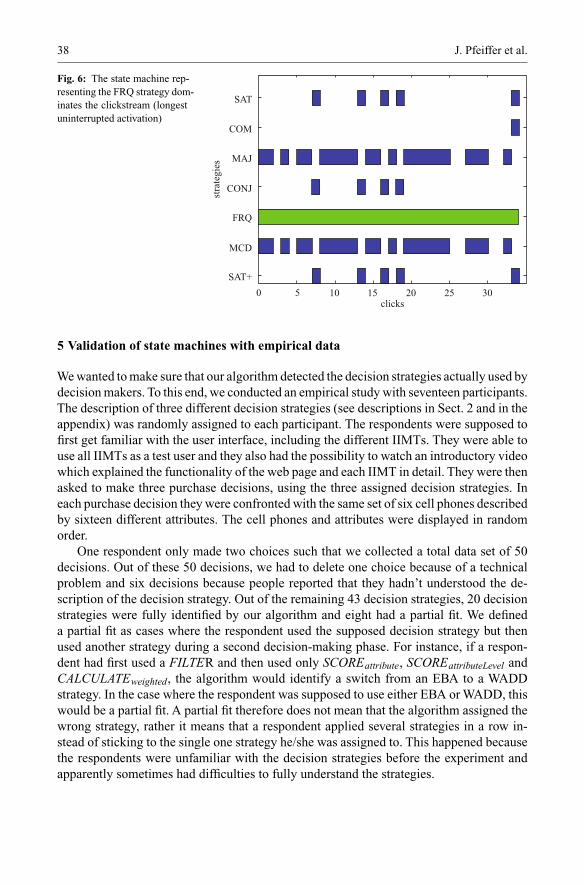
Since one IIMT is usually related to multiple decision strategies, it is likely that morethan one state machine are active throughout the input sequence I (see Fig. 6). Assumingthat at each point in time t , a user follows only a single strategy, a dominant strategyfor each t has to be identified. Let us define, |At
k| as the length of consecutives ones forMk in the activation sequence including and surrounding time t . For instance, if we haveAk = ((1, 0), (1, 0), (0, 0), (1, 0), (1, 1)), then |A1
k| = 2, |A2k| = 2, |A3
k| = 0, |A4k| =
2, |A5k| = 2 and only the last state is an end state. The dominant strategy at each point
in time t is the one with the largest |Atk|. Note that is possible that machine M1 has a
dominant activation of length l1 at t1 and machine M2 has a dominant activation of lengthl2 at t2 < t1 + l1. Thus, the dominant strategies overlap at all tn such that t2 < tn < t1 + tn.We preserved the full length of M1 and M2 in this case and accepted the overlap. Thedominating state machine in Fig. 6 is the one representing the FRQ strategy.
While it dramatically reduces the complexity of the activation vectors, the applieddomination principle has a disadvantage: it penalizes state machines that have successfullyprocessed many clicks but show gaps in their activation pattern. These gaps can be due toseveral reasons, e.g. an incomplete definition of the state machine, experimental clicks bythe user or incomplete data cleaning.
38 J. Pfeiffer et al.
Fig. 6: The state machine rep-resenting the FRQ strategy dom-inates the clickstream (longestuninterrupted activation)
0 5 10 15 20 25 30clicks
SAT
COM
MAJ
CONJ
FRQ
MCD
SAT+
stra
tegi
es
5 Validation of state machines with empirical data
We wanted to make sure that our algorithm detected the decision strategies actually used bydecision makers. To this end, we conducted an empirical study with seventeen participants.The description of three different decision strategies (see descriptions in Sect. 2 and in theappendix) was randomly assigned to each participant. The respondents were supposed tofirst get familiar with the user interface, including the different IIMTs. They were able touse all IIMTs as a test user and they also had the possibility to watch an introductory videowhich explained the functionality of the web page and each IIMT in detail. They were thenasked to make three purchase decisions, using the three assigned decision strategies. Ineach purchase decision they were confronted with the same set of six cell phones describedby sixteen different attributes. The cell phones and attributes were displayed in randomorder.
One respondent only made two choices such that we collected a total data set of 50decisions. Out of these 50 decisions, we had to delete one choice because of a technicalproblem and six decisions because people reported that they hadn’t understood the de-scription of the decision strategy. Out of the remaining 43 decision strategies, 20 decisionstrategies were fully identified by our algorithm and eight had a partial fit. We defineda partial fit as cases where the respondent used the supposed decision strategy but thenused another strategy during a second decision-making phase. For instance, if a respon-dent had first used a FILTER and then used only SCOREattribute, SCOREattributeLevel andCALCULATEweighted, the algorithm would identify a switch from an EBA to a WADDstrategy. In the case where the respondent was supposed to use either EBA or WADD, thiswould be a partial fit. A partial fit therefore does not mean that the algorithm assigned thewrong strategy, rather it means that a respondent applied several strategies in a row in-stead of sticking to the single one strategy he/she was assigned to. This happened becausethe respondents were unfamiliar with the decision strategies before the experiment andapparently sometimes had difficulties to fully understand the strategies.
Inferring decision strategies from clickstreams in decision . . . 39
The fact that respondents were unfamiliar with the decision strategies was also re-flected in 10 more choices. For these 10 choices, our algorithm classified an EBA strategyalthough respondents were supposed to use CONJ (3 cases), COM (1 case), DIS (3 cases),or SAT (3 cases). The latter four strategies are all characterized by alternative-wise pro-cessing, while EBA is characterized by attribute-wise processing. Apparently it was notclear to respondents that applying a FILTER (indicating an EBA), which removes severalalternatives at once from the matrix based on just one attribute, implies an attribute-wisecomparison of alternatives and thus is not suitable to the application of any alternative-wisestrategy.
The algorithm misclassified the remaining five choices. The five choices were inter-esting because the decision makers had understood the strategy and still deviated from theanticipated behavior. In two of these five choices, respondents were supposed to use a LEXstrategy and the algorithm misclassified these decision processes as using an EBA strat-egy because of the usage of FILTER. Instead of FILTER, the LEX-state machine expectsseveral SORT hierarchically because this is the IIMT that causes the least effort: a decisionmaker sorts the products according to the most important attribute. The product with thebest attribute level for this attribute will appear in the leftmost column in the matrix. Ifthere are ties, the decision maker sets a second sort criterion for the second most importantattribute. The best product in terms of the two most important attributes will appear in theleftmost column. For these two misclassified choices, we encountered a special case. Thetwo most important attributes for the two decision makers only had two attribute levelseach. In this case, the effort to use SORT and FILTER is the same. When using SORT, thedecision maker needs to select the most important attribute from a drop-down menu inthe IIMT SORT. When using FILTER, the decision maker clicks the checkbox of the leastpreferred of the two attribute levels. Thus, for attributes with only two possible attributelevels (for instance, Bluetooth-yes, Bluetooth-no), the effort and the outcome for FILTERand SORT is comparable.
In one other case, the decision maker was supposed to use a WADD strategy. Instead ofusing SCOREattributeLevel and SCOREattribute, which gives the user the possibility to assignup to 5 stars for each attribute and attribute level, this decision maker had very simplepreferences and thus used a simplified version of a utility function. This simplified utilityfunction was the same one that is assumed by FRQ. The decision maker used MARKmanuallyto assign either 1 or 0 points to each attribute level and summed up the score of all attributelevels for each alternative. Furthermore, the decision maker did not weigh the importanceof the attributes. Thus, in this case, the algorithm classified the behavior accurately as aFRQ strategy, which is the appropriate decision strategy describing this kind of simplifiedutility function.
In yet another case, a decision maker “misused” an IIMT. Although the decision makerwas supposed to sum up negative attribute levels with MARKmanuallyNegative, she usedMARKmanuallyPositive instead. This had no effect on the final product chosen, but was unex-pected by the state machine. More obviously distinguishing the design of the two IIMTsMARKmanuallyNegative and MARKmanuallyPositive might probably help to avoid this problemin future.
In the fifth of the five misclassified choices, a decision maker applied IIMT for SATwhich causes much more effort than the behavior anticipated by the SAT-state machine.
40 J. Pfeiffer et al.
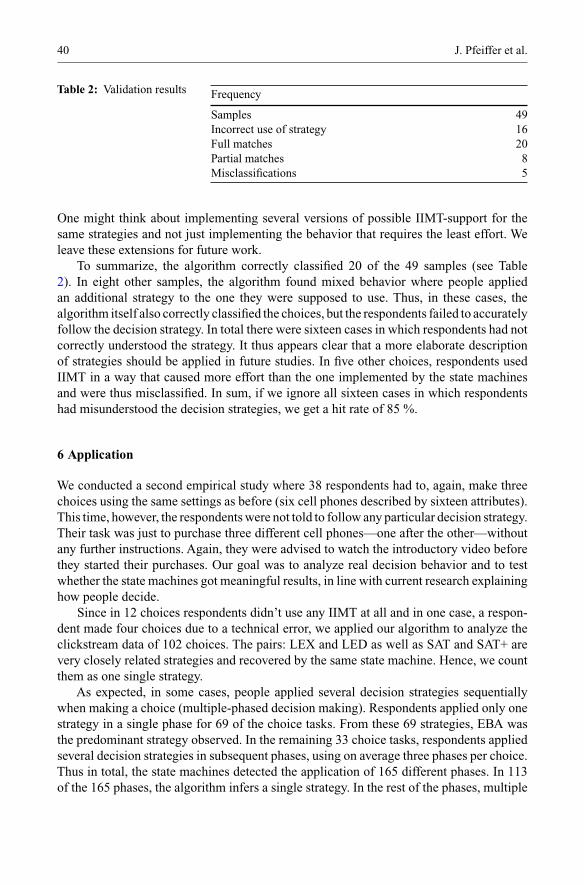
Table 2: Validation results Frequency
Samples 49Incorrect use of strategy 16Full matches 20Partial matches 8Misclassifications 5
One might think about implementing several versions of possible IIMT-support for thesame strategies and not just implementing the behavior that requires the least effort. Weleave these extensions for future work.
To summarize, the algorithm correctly classified 20 of the 49 samples (see Table2). In eight other samples, the algorithm found mixed behavior where people appliedan additional strategy to the one they were supposed to use. Thus, in these cases, thealgorithm itself also correctly classified the choices, but the respondents failed to accuratelyfollow the decision strategy. In total there were sixteen cases in which respondents had notcorrectly understood the strategy. It thus appears clear that a more elaborate descriptionof strategies should be applied in future studies. In five other choices, respondents usedIIMT in a way that caused more effort than the one implemented by the state machinesand were thus misclassified. In sum, if we ignore all sixteen cases in which respondentshad misunderstood the decision strategies, we get a hit rate of 85 %.
6 Application
We conducted a second empirical study where 38 respondents had to, again, make threechoices using the same settings as before (six cell phones described by sixteen attributes).This time, however, the respondents were not told to follow any particular decision strategy.Their task was just to purchase three different cell phones—one after the other—withoutany further instructions. Again, they were advised to watch the introductory video beforethey started their purchases. Our goal was to analyze real decision behavior and to testwhether the state machines got meaningful results, in line with current research explaininghow people decide.
Since in 12 choices respondents didn’t use any IIMT at all and in one case, a respon-dent made four choices due to a technical error, we applied our algorithm to analyze theclickstream data of 102 choices. The pairs: LEX and LED as well as SAT and SAT+ arevery closely related strategies and recovered by the same state machine. Hence, we countthem as one single strategy.
As expected, in some cases, people applied several decision strategies sequentiallywhen making a choice (multiple-phased decision making). Respondents applied only onestrategy in a single phase for 69 of the choice tasks. From these 69 strategies, EBA wasthe predominant strategy observed. In the remaining 33 choice tasks, respondents appliedseveral decision strategies in subsequent phases, using on average three phases per choice.Thus in total, the state machines detected the application of 165 different phases. In 113of the 165 phases, the algorithm infers a single strategy. In the rest of the phases, multiple
Inferring decision strategies from clickstreams in decision . . . 41
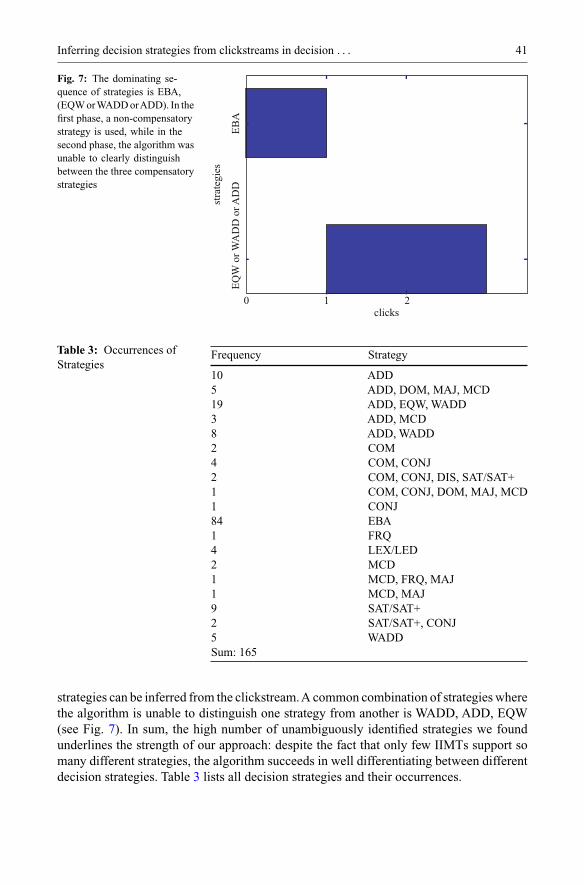
Fig. 7: The dominating se-quence of strategies is EBA,(EQW orWADD orADD). In thefirst phase, a non-compensatorystrategy is used, while in thesecond phase, the algorithm wasunable to clearly distinguishbetween the three compensatorystrategies
0 1 2clicks
EQW
or W
AD
D o
r AD
DEB
A
stra
tegi
es
Table 3: Occurrences ofStrategies
Frequency Strategy
10 ADD5 ADD, DOM, MAJ, MCD19 ADD, EQW, WADD3 ADD, MCD8 ADD, WADD2 COM4 COM, CONJ2 COM, CONJ, DIS, SAT/SAT+1 COM, CONJ, DOM, MAJ, MCD1 CONJ84 EBA1 FRQ4 LEX/LED2 MCD1 MCD, FRQ, MAJ1 MCD, MAJ9 SAT/SAT+2 SAT/SAT+, CONJ5 WADDSum: 165
strategies can be inferred from the clickstream.A common combination of strategies wherethe algorithm is unable to distinguish one strategy from another is WADD, ADD, EQW(see Fig. 7). In sum, the high number of unambiguously identified strategies we foundunderlines the strength of our approach: despite the fact that only few IIMTs support somany different strategies, the algorithm succeeds in well differentiating between differentdecision strategies. Table 3 lists all decision strategies and their occurrences.
42 J. Pfeiffer et al.
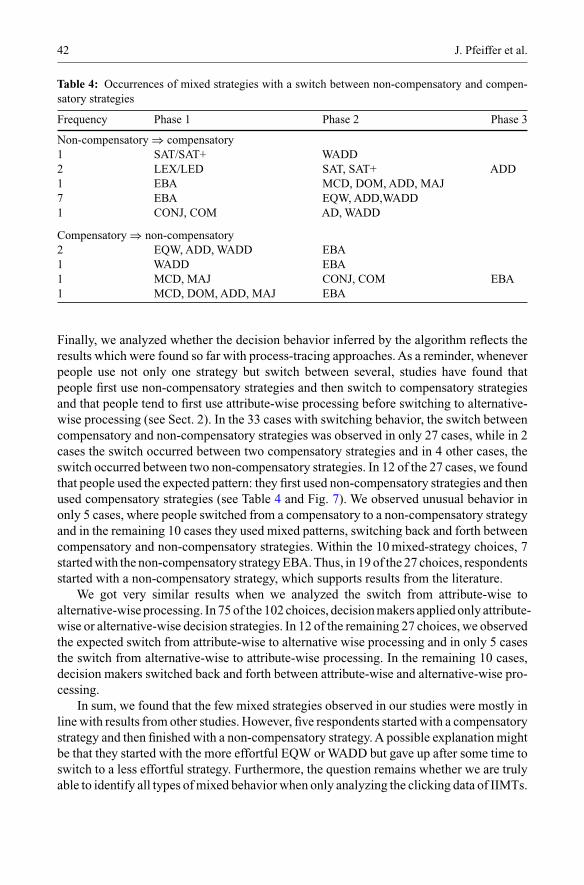
Table 4: Occurrences of mixed strategies with a switch between non-compensatory and compen-satory strategies
Frequency Phase 1 Phase 2 Phase 3
Non-compensatory ⇒ compensatory1 SAT/SAT+ WADD2 LEX/LED SAT, SAT+ ADD1 EBA MCD, DOM, ADD, MAJ7 EBA EQW, ADD,WADD1 CONJ, COM AD, WADD
Compensatory ⇒ non-compensatory2 EQW, ADD, WADD EBA1 WADD EBA1 MCD, MAJ CONJ, COM EBA1 MCD, DOM, ADD, MAJ EBA
Finally, we analyzed whether the decision behavior inferred by the algorithm reflects theresults which were found so far with process-tracing approaches. As a reminder, wheneverpeople use not only one strategy but switch between several, studies have found thatpeople first use non-compensatory strategies and then switch to compensatory strategiesand that people tend to first use attribute-wise processing before switching to alternative-wise processing (see Sect. 2). In the 33 cases with switching behavior, the switch betweencompensatory and non-compensatory strategies was observed in only 27 cases, while in 2cases the switch occurred between two compensatory strategies and in 4 other cases, theswitch occurred between two non-compensatory strategies. In 12 of the 27 cases, we foundthat people used the expected pattern: they first used non-compensatory strategies and thenused compensatory strategies (see Table 4 and Fig. 7). We observed unusual behavior inonly 5 cases, where people switched from a compensatory to a non-compensatory strategyand in the remaining 10 cases they used mixed patterns, switching back and forth betweencompensatory and non-compensatory strategies. Within the 10 mixed-strategy choices, 7started with the non-compensatory strategy EBA. Thus, in 19 of the 27 choices, respondentsstarted with a non-compensatory strategy, which supports results from the literature.
We got very similar results when we analyzed the switch from attribute-wise toalternative-wise processing. In 75 of the 102 choices, decision makers applied only attribute-wise or alternative-wise decision strategies. In 12 of the remaining 27 choices, we observedthe expected switch from attribute-wise to alternative wise processing and in only 5 casesthe switch from alternative-wise to attribute-wise processing. In the remaining 10 cases,decision makers switched back and forth between attribute-wise and alternative-wise pro-cessing.
In sum, we found that the few mixed strategies observed in our studies were mostly inline with results from other studies. However, five respondents started with a compensatorystrategy and then finished with a non-compensatory strategy. A possible explanation mightbe that they started with the more effortful EQW or WADD but gave up after some time toswitch to a less effortful strategy. Furthermore, the question remains whether we are trulyable to identify all types of mixed behavior when only analyzing the clicking data of IIMTs.
Inferring decision strategies from clickstreams in decision . . . 43
It might be that people execute some decision phase in their mind without using any IIMT.Combining our analysis with eye tracking or some other process-tracing technique couldreveal these mental processes and contribute relevant data to analyzing mixed behavior inmore detail.
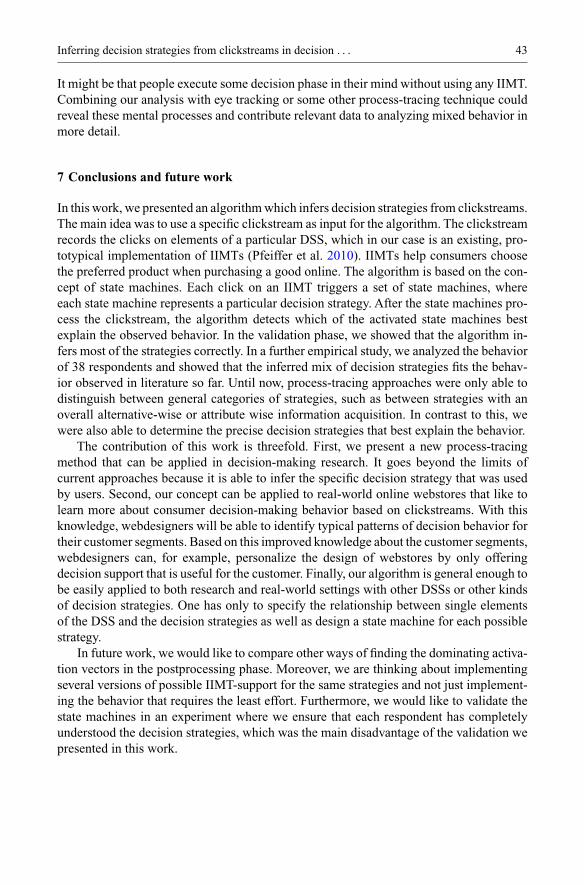
7 Conclusions and future work
In this work, we presented an algorithm which infers decision strategies from clickstreams.The main idea was to use a specific clickstream as input for the algorithm. The clickstreamrecords the clicks on elements of a particular DSS, which in our case is an existing, pro-totypical implementation of IIMTs (Pfeiffer et al. 2010). IIMTs help consumers choosethe preferred product when purchasing a good online. The algorithm is based on the con-cept of state machines. Each click on an IIMT triggers a set of state machines, whereeach state machine represents a particular decision strategy. After the state machines pro-cess the clickstream, the algorithm detects which of the activated state machines bestexplain the observed behavior. In the validation phase, we showed that the algorithm in-fers most of the strategies correctly. In a further empirical study, we analyzed the behaviorof 38 respondents and showed that the inferred mix of decision strategies fits the behav-ior observed in literature so far. Until now, process-tracing approaches were only able todistinguish between general categories of strategies, such as between strategies with anoverall alternative-wise or attribute wise information acquisition. In contrast to this, wewere also able to determine the precise decision strategies that best explain the behavior.
The contribution of this work is threefold. First, we present a new process-tracingmethod that can be applied in decision-making research. It goes beyond the limits ofcurrent approaches because it is able to infer the specific decision strategy that was usedby users. Second, our concept can be applied to real-world online webstores that like tolearn more about consumer decision-making behavior based on clickstreams. With thisknowledge, webdesigners will be able to identify typical patterns of decision behavior fortheir customer segments. Based on this improved knowledge about the customer segments,webdesigners can, for example, personalize the design of webstores by only offeringdecision support that is useful for the customer. Finally, our algorithm is general enough tobe easily applied to both research and real-world settings with other DSSs or other kindsof decision strategies. One has only to specify the relationship between single elementsof the DSS and the decision strategies as well as design a state machine for each possiblestrategy.
In future work, we would like to compare other ways of finding the dominating activa-tion vectors in the postprocessing phase. Moreover, we are thinking about implementingseveral versions of possible IIMT-support for the same strategies and not just implement-ing the behavior that requires the least effort. Furthermore, we would like to validate thestate machines in an experiment where we ensure that each respondent has completelyunderstood the decision strategies, which was the main disadvantage of the validation wepresented in this work.
44 J. Pfeiffer et al.
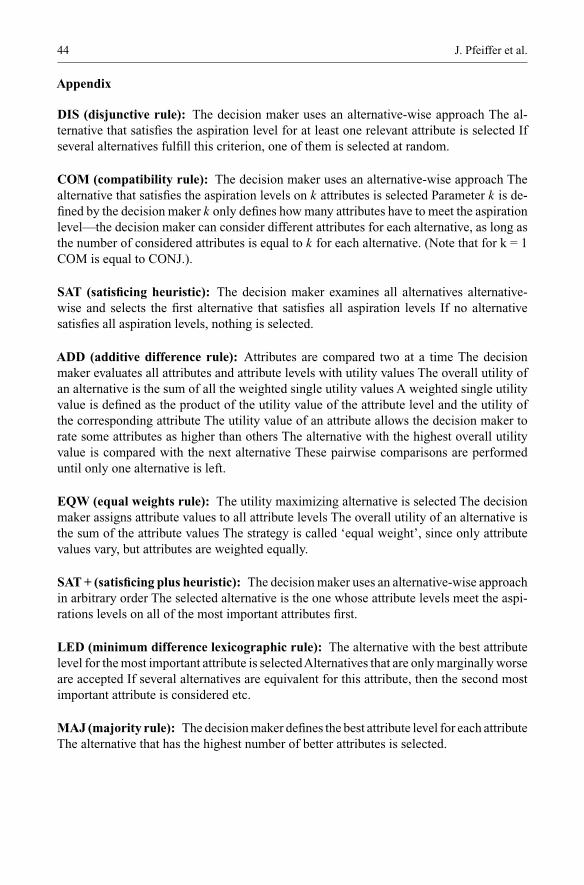
Appendix
DIS (disjunctive rule): The decision maker uses an alternative-wise approach The al-ternative that satisfies the aspiration level for at least one relevant attribute is selected Ifseveral alternatives fulfill this criterion, one of them is selected at random.
COM (compatibility rule): The decision maker uses an alternative-wise approach Thealternative that satisfies the aspiration levels on k attributes is selected Parameter k is de-fined by the decision maker k only defines how many attributes have to meet the aspirationlevel—the decision maker can consider different attributes for each alternative, as long asthe number of considered attributes is equal to k for each alternative. (Note that for k = 1COM is equal to CONJ.).
SAT (satisficing heuristic): The decision maker examines all alternatives alternative-wise and selects the first alternative that satisfies all aspiration levels If no alternativesatisfies all aspiration levels, nothing is selected.
ADD (additive difference rule): Attributes are compared two at a time The decisionmaker evaluates all attributes and attribute levels with utility values The overall utility ofan alternative is the sum of all the weighted single utility values A weighted single utilityvalue is defined as the product of the utility value of the attribute level and the utility ofthe corresponding attribute The utility value of an attribute allows the decision maker torate some attributes as higher than others The alternative with the highest overall utilityvalue is compared with the next alternative These pairwise comparisons are performeduntil only one alternative is left.
EQW (equal weights rule): The utility maximizing alternative is selected The decisionmaker assigns attribute values to all attribute levels The overall utility of an alternative isthe sum of the attribute values The strategy is called ‘equal weight’, since only attributevalues vary, but attributes are weighted equally.
SAT + (satisficing plus heuristic): The decision maker uses an alternative-wise approachin arbitrary order The selected alternative is the one whose attribute levels meet the aspi-rations levels on all of the most important attributes first.
LED (minimum difference lexicographic rule): The alternative with the best attributelevel for the most important attribute is selectedAlternatives that are only marginally worseare accepted If several alternatives are equivalent for this attribute, then the second mostimportant attribute is considered etc.
MAJ (majority rule): The decision maker defines the best attribute level for each attributeThe alternative that has the highest number of better attributes is selected.
Inferring decision strategies from clickstreams in decision . . . 45
References
Böckenholt U, Albert D, Aschenbrenner M, Schmalhofer F (1991) The effects of attractiveness,dominance, and attribute differences on information acquisition in multiattribute binary choice.Organ Behav Hum Decis Process 49(2):258–281
Beach L (1990) Image theory: decision making in personal and organizational contexts. Wiley,Chichester
Bettman J, Johnson E, Payne J (1990) A componential analysis of cognitive effort in choice. OrganBehav Hum Decis Process 45(1):111–139
Bettman J, Johnson E, Luce M, Payne J (1993) Correlation, conflict, and choice. J Exp PsycholLearn Mem Cogn 19:931–951
Bettman J, Park, C (1980) Effects of prior knowledge and experience and phase of the choice processon consumer decision processes: a protocol analysis. J Cons Res 7: 234–248
Bröder A, Schiffer S (2003) Bayesian strategy assessment in multi-attribute decision research. JBehav Decis Mak 16:193–213
Eisenfuhr F, Weber M (2002) Rationales Entscheiden. Springer, BerlinEvans PF, Camus L, Sehgal V, McGowan B (2010) Western European Online Retail Forecast,
2009 to 2014, Forrester Research. http://www.forrester.com/rb/Research/western_european_online_retail_forecast%5C%2C_2009_to/q/id/56543/t/2. Accessed 9 July 2011
Fasolo B, Misuaraca R, McClelland G (2003) Individual differences in adaptive choice strategies.Res Econ 57(3):219–233
Ford JK, Schmitt N, Schechtman SL, Hults BM, Doherty ML (1989) Process tracing methods:contributions, problems, and neglected research questions. Organ Behav Hum Decis Process43(1):75–117
Garbarino EC, Edell JA (1997) Cognitive effort, affect, and choice. J Cons Res 24(2):147–158Gilbride T, Allenby G (2004) A choice model with conjunctive, disjunctive, and compensatory
screening rules. Marketing Sci 23(3):391–406Gilbride T, Allenby, G (2006) Estimating heteroogeneous eba and economic screening rule choice
models. Marketing Sci 25(5):494–509Gupta P, Yadav MS, Varadarajan R (2009) How task-facilitative interactive tools foster buyers’ trust
in online retailers: a process view of trust development in the electronic marketplace. J Retail85(2):159–176
Harte JM, Koele P (2001) Modelling and describing human judgement processes: the multiattributeevaluation case. Think Reason 7(7):29–49
Hogarth R (1987) Judgment and choice, 2nd edn. Wiley, ChichesterHopcroft JE, Motwani R, Ullman JD (2006) Introduction to automata theory, languages, and com-
putation, 3rd edn. Addison-Wesley Longman Publishing Co, Inc, BostonKeeney R, Raiffa H (1993) Decisions with multiple objectives: preferences and value tradeoffs, 14th
edn. WileyKlein NM, Yadav MS (1989) Context effects on effort and accuracy in choice: an enquiry into
adaptive decision making. J Cons Res 15(4):411–421Lohse G, Johnson EA (1996) Comparison of two process tracing methods on choice tasks. Organ
Behav Hum Decis Process 68(1):28–43Luce MF, Bettman JR, Payne JW (1997) Choice processing in emotional difficult decisions. J Exp
Psychol Learn Mem Cogn 23(2):384–405Olshavsky R (1979) Task complexity and contingent processing in decision making: a replication
and extension. Organ Behav Hum Perform 24:300–316Payne J (1976) Task complexity and contingent processing in decision making: an information search
and protocol analysis. Organ Behav Hum Perform 16(2):366–387Payne J, Bettman J, Johnson E (1988) Adaptive strategy selection in decision making. J Exp Psychol
Learn Mem Cogn 14(3):534–552
46 J. Pfeiffer et al.
Payne J, Bettman J, Johnson E (1993) The adaptive decision maker. Cambridge University Press,Cambridge
Pfeiffer J, Duzevik D, Rothlauf F, Yamamoto K (2009a) A genetic algorithm for analyzing choicebehavior with mixed decision strategies. In: G. Raidl (ed) Proceedings of the Genetic andEvolutionary Computation Conference, Montreal, Canada ACM Press
Pfeiffer J, Riedl R, Rothlauf F (2009b) On the relationship between interactive decision aids anddecision strategies: a theoretical analysis. In: Hansen HR, Karagiannis D, Fill H-G (eds) Pro-ceedings of the 9th internationale Tagung Wirtschaftsinformatik
Pfeiffer J, Vogel F, Stumpf S, Kiltz, CA (2010) A theory-based approach for a modular systemof interactive decision aids. In: Proceedings of the 16th Americas Conference on InformationSystems (AMCIS)
Pfeiffer J, Meißner M, Brandstätter E, Riedl R, Rothlauf F (2012) The influence of context-basedcomplexity in CBC choice tasks. Technical report, University of Mainz, University of Bielefeld,University of Linz
Reisen N, Hoffrage U, Mast FW (2008) Identifying decision strategies in a consumer choice situation.Judgm Decisi Mak 3(8)641–658
Riedl R, Brandstätter E, Roithmayr F (2008) Identifying decision strategies: A process and outcome-based classification method. Behav Res Methods 20(3):795–807
Russo J, Dosher B (1983) Strategies for multiattribute binary choice. J Exp Psychol Learn MemCogn 9(4):676–696
Russo J, Johnson E, Stephens D (1989) The validity of verbal protocols. Mem Cogn 17:759–769Russo J, Leclerc F (1994) An eye-fixation analysis of choice processes for consumer nondurables.
J Consum Res 21(2):274–290Russo J (1978) Eye fixations can save the world: a critical evaluation and a comparison between
eye fixations and other information processing methodologies. In: Hunt HK (ed) Advances inConsumer Research, Vol 21. Association for Consumer Research, Ann Arbor, pp 561–570
Svenson O (1979) Process descriptions of decision making. Organ Behav Hum Perform 23:86–112Todd P, Benbasat I (1991) An experimental investigation of the impact of computer based decision
aids on decision making strategies. Inf Syst Res 2:87–115Todd P, Benbasat I (1992) An experimental investigation of the impact of computer based decision
aids on processing effort. MIS Q 16(3):373–393Todd P, Benbasat I (1994) The influence of decision aids on choice strategies und conditions of high
cognitive load. IEEE Trans Syst Man Cybern 24(4):537–547Tversky A (1969) Intransitivity of preferences. Psychol Rev 76:31–48Tversky A (1972) Elimination by aspects: a theory of choice. Psychol Rev 79:281–299