Embed Size (px)
Citation preview
Inferring Human Observer SpectralSensitivities from Video Game Data
Chatura SamarakoonDepartment of EngineeringUniversity of CambridgeCambridge, UK. CB3 [email protected]
Gehan AmaratungaDepartment of EngineeringUniversity of CambridgeCambridge, UK. CB3 [email protected]
Phillip Stanley-MarbellDepartment of EngineeringUniversity of CambridgeCambridge, UK. CB3 [email protected]
AbstractWith the use of primaries which have increasingly nar-row bandwidths in modern displays, observer metamericbreakdown is becoming a significant factor. This can leadto discrepancies in the perceived color between differentobservers. If the spectral sensitivity of a user’s eyes couldbe easily measured, next generation displays would be ableto adjust the display content to ensure that the colors areperceived as intended by a given observer.
We present a mathematical framework for calculating spec-tral sensitivities of a given human observer using a colormatching experiment that could be done on a mobile phonedisplay. This forgoes the need for expensive in-person ex-periments and allows system designers to easily calibratedisplays to match the user’s vision, in-the-wild. We showhow to use sRGB pixel values along with a simple dis-play model to calculate plausible color matching functions(CMFs) for the users of a given display device (e.g., a mo-bile phone). We evaluate the effect of different regulariza-tion functions on the shape of the calculated CMFs and theresults show that a sum of squares regularizer is able topredict smooth and qualitatively realistic CMFs.
arX
iv:2
007.
0049
0v2
[q-
bio.
QM
] 2
1 Ju
l 202
0
Introduction
Figure 1: In Specimen, the playerspick which colored blob(‘specimen’) matches thebackground color.
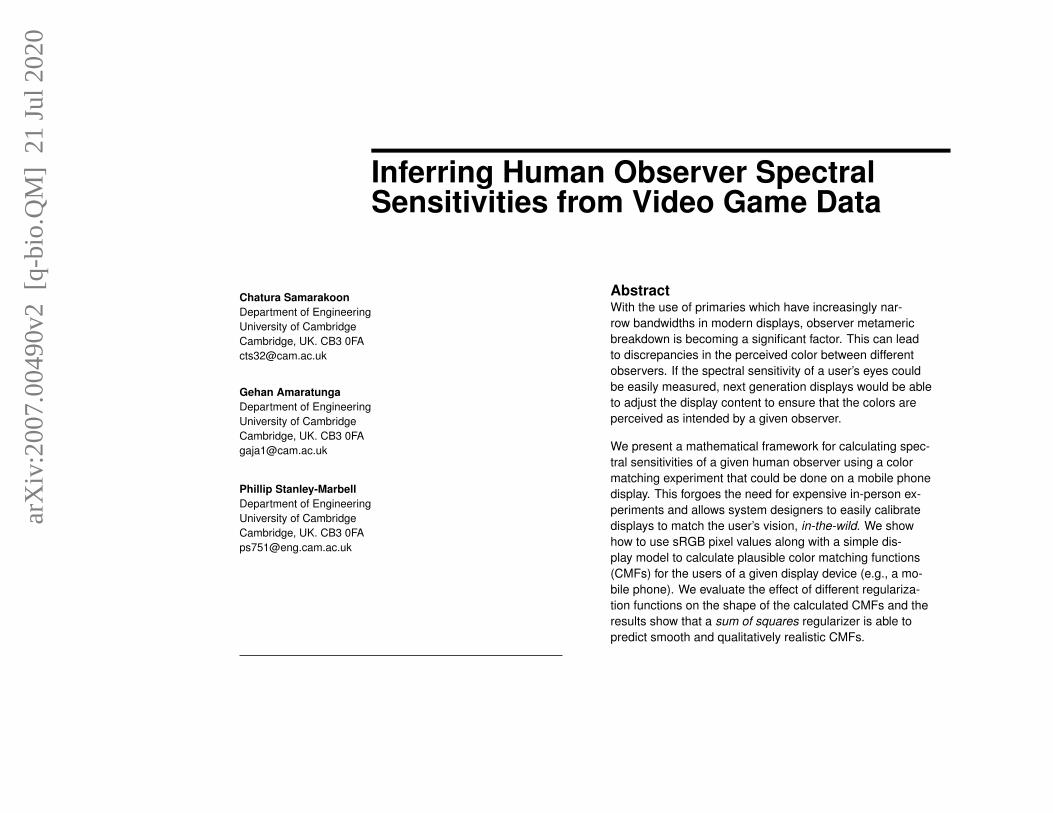
Figure 2: Traditional colormatching experiments involvechanging the intensities of long,medium, and short wavelengthprimaries till the mixture (right) isperceptually identical to themonochromatic light (left).
Figure 3: Due to the narrowemission bandwidths there islimited information at somewavelengths. (e.g., around 500nmand 580nm).
Color matching experiments have been the foundation formodern colorimetry since the pioneering work by Maxwell,Young and Helmholtz [7]. These experiments measure anindividual’s cone spectral sensitivities (also referred to ascone fundamentals). They involve presenting a human par-ticipant with two light sources and asking them to modulatethe mixture of primaries (e.g., red, green and blue) in onelight source until it visually matches a second light sourcecomprising a single wavelength (see Figure 2) [4, 16]. Fromthis, the required proportions of each of the red, green, andblue primaries to match each target wavelength can be ob-tained. The three functions for red, green, and blue com-prises the individual color matching functions (CMFs). Theyare usually given in the space of imaginary primaries X, Y,and Z to make the CMFs strictly positive. The CMFs canbe used to numerically describe perceptual color equiva-lence. They can also be converted to the cone fundamen-tals through a linear transformation. As might be expected,these in-person user studies are expensive and time con-suming to conduct.
Modern displays are using increasingly narrower primaries.They have been shown to be more prone to observer metamericbreakdown compared to displays with wideband primaries [6].Observer metameric breakdown is the process where twodifferent observers disagree on what ‘color’ a particularspectrum is. Thus far, standardization of color spaces andassociated primaries have been used as a way to ensurecolor constancy across different media (e.g., displays, printmedia, etc.). However, observer metameric breakdowncannot be as easily circumvented. One solution is to do asecondary display calibration to suit the sensitivities of theuser’s eyes. This could work for devices that primarily havea single user (e.g., mobile phones, laptops).
In this work, we explore a framework for characterizinga user’s spectral sensitivities without using an in-personexperiment and evaluate the results using the Specimendataset [12].
The Specimen datasetIn 2015, PepRally released Specimen, a color matchinggame for iOS [3]. The game involves the players pickingwhich color blob (‘specimen’) matches the background color(see Figure 1). If the player choses the correct specimenthey will be presented with a new background color. Incor-rect choices reset the bonus streak. This repeats until allthe specimens have been matched correctly. The gamekeeps a log of every choice a player makes through in-game analytics with details about the chosen color and thecorrect (background) color choice as sRGB values, andsome other bits of information like device model, time, andanonymized user ID. The game sends the anonymized datato an analytics facility using Yahoo Slurry. The aggregateanalytics dataset contains data from 41,000 players, totaling489k play sessions and 28.6 million color matches.
We present the results of the preliminary investigation wecarried out into using these RGB color matching data to ex-tract the players’ CMFs. We show that its possible to devisea numerical method to extract the CMFs.
ContributionsIn this work we present the following contributions.
1. A mathematical framework for extracting color visioncone response for a particular human observer (theso-called cone fundamentals) from data obtainedfrom a popular color matching game [3, 8] in the iOSapp store.
2. Implementation of the mathematical framework usingTensorFlowâAZs optimizer backend.
3. Demonstration that the implementation of the frame-work, applied to data from the Specimen dataset, andacross four different priors (uniform, gaussian triple,2◦ standard observer, and 10◦ standard observer),provides meaningful color matching functions.
Problem DefinitionLet Crgb = [Cr, Cg, Cb] be an incorrectly chosen color andT rgb = [Tr, Tg, Tb] be the correct target color, both in thein sRGB color space with values normalized to the range[0, 1].
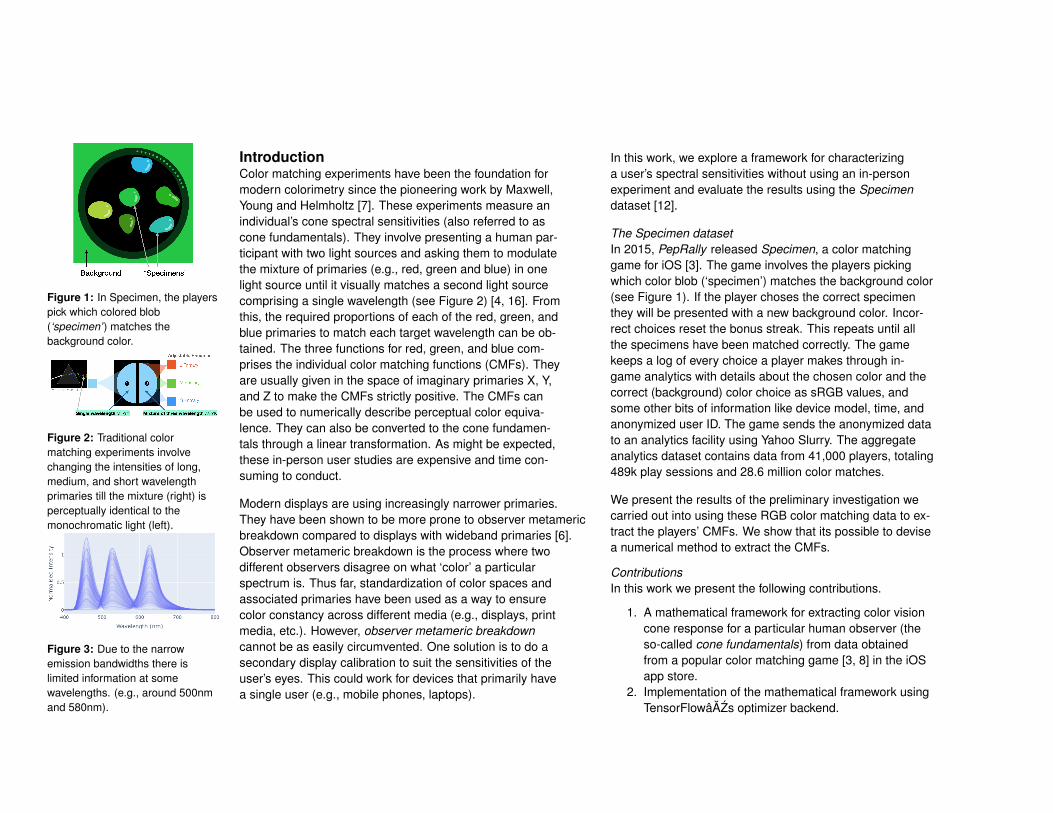
Figure 4: The shapes of the red,green and blue primary emissionsof the iPhone X display wereextracted from the white pointspectrum.
Target{R,G,B}
Target {X,Y,Z}
CMF Prior
Correction
Regularizer Function
Chosen {X,Y,Z}
Chosen {R,G,B}
Error RegularisedError
Display Spectra
Spectra to CIE XYZ
+
+
-
+
+
Opt
imiz
atio
n
Figure 5: Flow chart showing thearchitecture used to learn thespectral correction term.
Also, let P = [Pr, Pg, Pb] be the spectra for the chosen dis-play’s red, green, and blue primaries. The spectrum of thechosen color and the target color can be calculated usingthe Equations 1 and 2 respectively.
Sc =∑
k∈{r,g,b}
Pk · Ck (1)
St =∑
k∈{r,g,b}
Pk · Tk (2)
Let φstd = [xstd, ystd, zstd] be the CMFs for 2◦ or 10◦ CIEstandard observers. The CIE tristimulus values [X,Y, Z] forthe chosen spectrum Sc are calculated as,
X =
∫λ
Sc · xstd dλ (3)
Y =
∫λ
Sc · ystd dλ (4)
Z =
∫λ
Sc · zstd dλ (5)
Similarly for the target spectrum St.
Let φu be the individual CMFs for the user. Also, let δu bea correction term with the same domain as φstd such thatφu = φstd + δu. The correction term represents the devi-ation of the user’s vision from the standard observer colormatching functions.
The user adjusted tristimulus values can be calculated us-ing Equations 3 to 5 with individual CMFs, φu, instead ofthe standard CMFs, φstd. Let Φuc = [Xu
c , Yuc , Z
uc ] and
Φut = [Xut , Y
ut , Z
ut ] be these user adjusted tristimulus
values for the chosen spectrum and the target spectrumrespectively.
If Φuc = Φut this implies that the colors are perceptu-ally similar. The target is to find the correction term δu thatmakes Φuc = Φut. This can be posed as the followingminimization problem,
arg minδu
‖Φuc − Φut‖22 (6)
To prevent the correction term from causing large devia-tions, we explored numerous regularization functions. Theregularized optimization problem is given by the followingequation.
arg minδu
(‖Φuc − Φut‖22 +R(δu)) (7)
where R is a regularization function.
Equation 7 gives the optimization process using a singlecolor selection event. However, the optimum value for δushould be valid across all the color selection events for agiven user. Thus, for the optimization, we consider all theuser’s selection events in a batch and calculate the meanvalue for ‖Φuc − Φut‖22 across this batch before evalu-ating the cost function given in Equation 7. By evaluating
Equation 7, we can infer the individual CMFs from the RGBvalues of the mismatched color pairs.
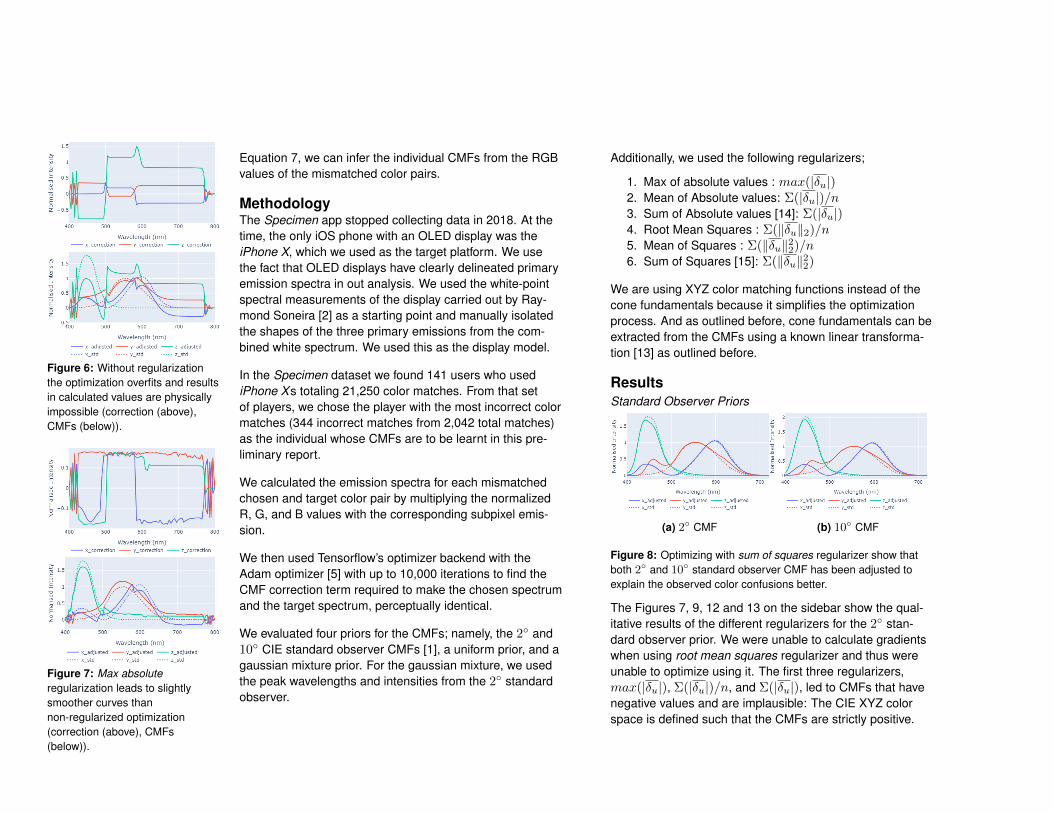
Figure 6: Without regularizationthe optimization overfits and resultsin calculated values are physicallyimpossible (correction (above),CMFs (below)).
Figure 7: Max absoluteregularization leads to slightlysmoother curves thannon-regularized optimization(correction (above), CMFs(below)).
MethodologyThe Specimen app stopped collecting data in 2018. At thetime, the only iOS phone with an OLED display was theiPhone X, which we used as the target platform. We usethe fact that OLED displays have clearly delineated primaryemission spectra in out analysis. We used the white-pointspectral measurements of the display carried out by Ray-mond Soneira [2] as a starting point and manually isolatedthe shapes of the three primary emissions from the com-bined white spectrum. We used this as the display model.
In the Specimen dataset we found 141 users who usediPhone Xs totaling 21,250 color matches. From that setof players, we chose the player with the most incorrect colormatches (344 incorrect matches from 2,042 total matches)as the individual whose CMFs are to be learnt in this pre-liminary report.
We calculated the emission spectra for each mismatchedchosen and target color pair by multiplying the normalizedR, G, and B values with the corresponding subpixel emis-sion.
We then used Tensorflow’s optimizer backend with theAdam optimizer [5] with up to 10,000 iterations to find theCMF correction term required to make the chosen spectrumand the target spectrum, perceptually identical.
We evaluated four priors for the CMFs; namely, the 2◦ and10◦ CIE standard observer CMFs [1], a uniform prior, and agaussian mixture prior. For the gaussian mixture, we usedthe peak wavelengths and intensities from the 2◦ standardobserver.
Additionally, we used the following regularizers;
1. Max of absolute values : max(|δu|)2. Mean of Absolute values: Σ(|δu|)/n3. Sum of Absolute values [14]: Σ(|δu|)4. Root Mean Squares : Σ(‖δu‖2)/n5. Mean of Squares : Σ(‖δu‖22)/n6. Sum of Squares [15]: Σ(‖δu‖22)
We are using XYZ color matching functions instead of thecone fundamentals because it simplifies the optimizationprocess. And as outlined before, cone fundamentals can beextracted from the CMFs using a known linear transforma-tion [13] as outlined before.
ResultsStandard Observer Priors
(a) 2◦ CMF (b) 10◦ CMF
Figure 8: Optimizing with sum of squares regularizer show thatboth 2◦ and 10◦ standard observer CMF has been adjusted toexplain the observed color confusions better.
The Figures 7, 9, 12 and 13 on the sidebar show the qual-itative results of the different regularizers for the 2◦ stan-dard observer prior. We were unable to calculate gradientswhen using root mean squares regularizer and thus wereunable to optimize using it. The first three regularizers,max(|δu|), Σ(|δu|)/n, and Σ(|δu|), led to CMFs that havenegative values and are implausible: The CIE XYZ colorspace is defined such that the CMFs are strictly positive.
Both Σ(‖δu‖22)/n and Σ(‖δu‖22) regularizers led to smoothCMFs with the former achieving smaller final cost.
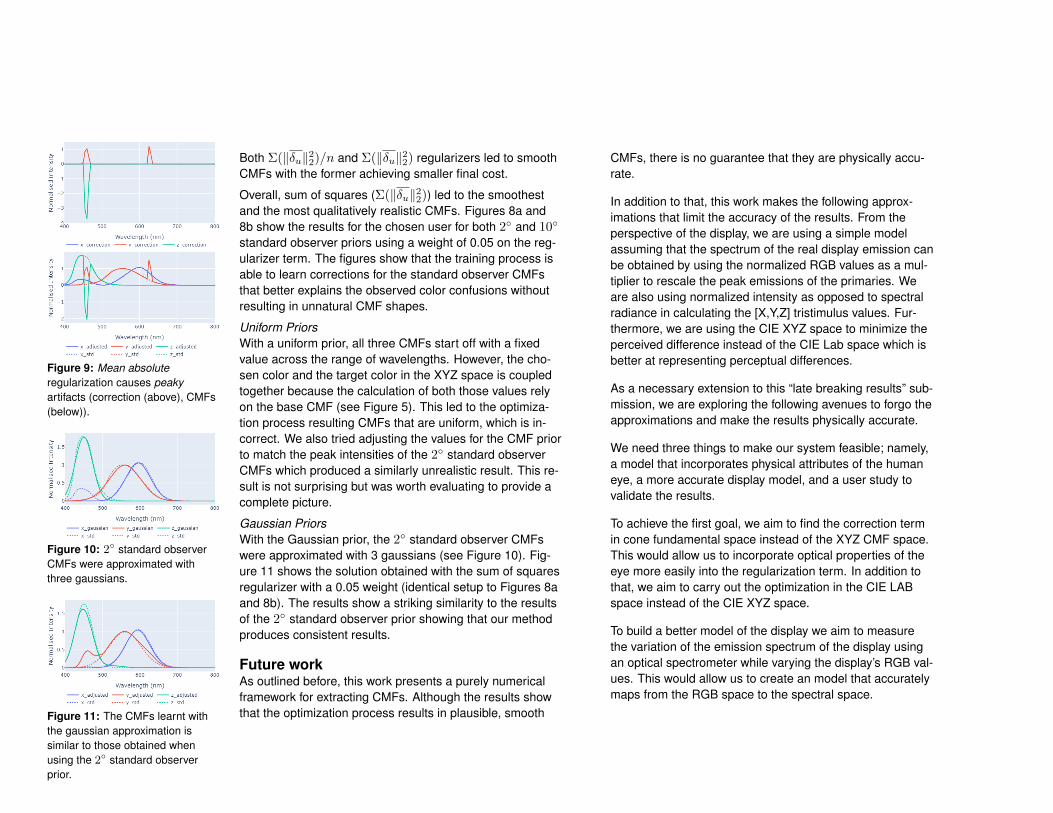
Figure 9: Mean absoluteregularization causes peakyartifacts (correction (above), CMFs(below)).
Figure 10: 2◦ standard observerCMFs were approximated withthree gaussians.
Figure 11: The CMFs learnt withthe gaussian approximation issimilar to those obtained whenusing the 2◦ standard observerprior.
Overall, sum of squares (Σ(‖δu‖22)) led to the smoothestand the most qualitatively realistic CMFs. Figures 8a and8b show the results for the chosen user for both 2◦ and 10◦
standard observer priors using a weight of 0.05 on the reg-ularizer term. The figures show that the training process isable to learn corrections for the standard observer CMFsthat better explains the observed color confusions withoutresulting in unnatural CMF shapes.
Uniform PriorsWith a uniform prior, all three CMFs start off with a fixedvalue across the range of wavelengths. However, the cho-sen color and the target color in the XYZ space is coupledtogether because the calculation of both those values relyon the base CMF (see Figure 5). This led to the optimiza-tion process resulting CMFs that are uniform, which is in-correct. We also tried adjusting the values for the CMF priorto match the peak intensities of the 2◦ standard observerCMFs which produced a similarly unrealistic result. This re-sult is not surprising but was worth evaluating to provide acomplete picture.
Gaussian PriorsWith the Gaussian prior, the 2◦ standard observer CMFswere approximated with 3 gaussians (see Figure 10). Fig-ure 11 shows the solution obtained with the sum of squaresregularizer with a 0.05 weight (identical setup to Figures 8aand 8b). The results show a striking similarity to the resultsof the 2◦ standard observer prior showing that our methodproduces consistent results.
Future workAs outlined before, this work presents a purely numericalframework for extracting CMFs. Although the results showthat the optimization process results in plausible, smooth
CMFs, there is no guarantee that they are physically accu-rate.
In addition to that, this work makes the following approx-imations that limit the accuracy of the results. From theperspective of the display, we are using a simple modelassuming that the spectrum of the real display emission canbe obtained by using the normalized RGB values as a mul-tiplier to rescale the peak emissions of the primaries. Weare also using normalized intensity as opposed to spectralradiance in calculating the [X,Y,Z] tristimulus values. Fur-thermore, we are using the CIE XYZ space to minimize theperceived difference instead of the CIE Lab space which isbetter at representing perceptual differences.
As a necessary extension to this “late breaking results” sub-mission, we are exploring the following avenues to forgo theapproximations and make the results physically accurate.
We need three things to make our system feasible; namely,a model that incorporates physical attributes of the humaneye, a more accurate display model, and a user study tovalidate the results.
To achieve the first goal, we aim to find the correction termin cone fundamental space instead of the XYZ CMF space.This would allow us to incorporate optical properties of theeye more easily into the regularization term. In addition tothat, we aim to carry out the optimization in the CIE LABspace instead of the CIE XYZ space.
To build a better model of the display we aim to measurethe variation of the emission spectrum of the display usingan optical spectrometer while varying the display’s RGB val-ues. This would allow us to create an model that accuratelymaps from the RGB space to the spectral space.
For the user study, we hope to carry out a traditional colormatching experiment to measure the users’ true CMFs.Following that we aim to have the users play a version ofthe Specimen game and predict the CMFs. We can thenuse the measured CMFs to learn the regularization neededto ensure that the calculated CMFs match the measuredCMFs. Finally, we can use this validated method to extractphysically accurate CMFs from the Specimen dataset forthe 141 players.
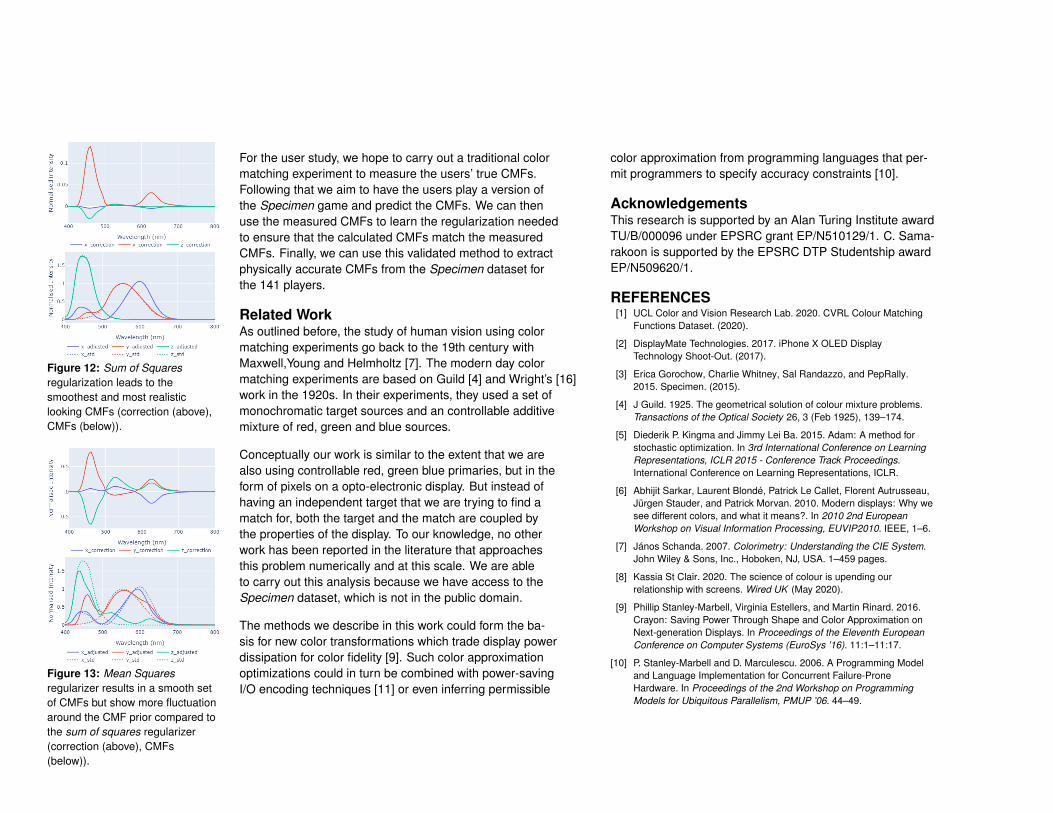
Figure 12: Sum of Squaresregularization leads to thesmoothest and most realisticlooking CMFs (correction (above),CMFs (below)).
Figure 13: Mean Squaresregularizer results in a smooth setof CMFs but show more fluctuationaround the CMF prior compared tothe sum of squares regularizer(correction (above), CMFs(below)).
Related WorkAs outlined before, the study of human vision using colormatching experiments go back to the 19th century withMaxwell,Young and Helmholtz [7]. The modern day colormatching experiments are based on Guild [4] and Wright’s [16]work in the 1920s. In their experiments, they used a set ofmonochromatic target sources and an controllable additivemixture of red, green and blue sources.
Conceptually our work is similar to the extent that we arealso using controllable red, green blue primaries, but in theform of pixels on a opto-electronic display. But instead ofhaving an independent target that we are trying to find amatch for, both the target and the match are coupled bythe properties of the display. To our knowledge, no otherwork has been reported in the literature that approachesthis problem numerically and at this scale. We are ableto carry out this analysis because we have access to theSpecimen dataset, which is not in the public domain.
The methods we describe in this work could form the ba-sis for new color transformations which trade display powerdissipation for color fidelity [9]. Such color approximationoptimizations could in turn be combined with power-savingI/O encoding techniques [11] or even inferring permissible
color approximation from programming languages that per-mit programmers to specify accuracy constraints [10].
AcknowledgementsThis research is supported by an Alan Turing Institute awardTU/B/000096 under EPSRC grant EP/N510129/1. C. Sama-rakoon is supported by the EPSRC DTP Studentship awardEP/N509620/1.
REFERENCES[1] UCL Color and Vision Research Lab. 2020. CVRL Colour Matching
Functions Dataset. (2020).
[2] DisplayMate Technologies. 2017. iPhone X OLED DisplayTechnology Shoot-Out. (2017).
[3] Erica Gorochow, Charlie Whitney, Sal Randazzo, and PepRally.2015. Specimen. (2015).
[4] J Guild. 1925. The geometrical solution of colour mixture problems.Transactions of the Optical Society 26, 3 (Feb 1925), 139–174.
[5] Diederik P. Kingma and Jimmy Lei Ba. 2015. Adam: A method forstochastic optimization. In 3rd International Conference on LearningRepresentations, ICLR 2015 - Conference Track Proceedings.International Conference on Learning Representations, ICLR.
[6] Abhijit Sarkar, Laurent Blondé, Patrick Le Callet, Florent Autrusseau,Jürgen Stauder, and Patrick Morvan. 2010. Modern displays: Why wesee different colors, and what it means?. In 2010 2nd EuropeanWorkshop on Visual Information Processing, EUVIP2010. IEEE, 1–6.
[7] János Schanda. 2007. Colorimetry: Understanding the CIE System.John Wiley & Sons, Inc., Hoboken, NJ, USA. 1–459 pages.
[8] Kassia St Clair. 2020. The science of colour is upending ourrelationship with screens. Wired UK (May 2020).
[9] Phillip Stanley-Marbell, Virginia Estellers, and Martin Rinard. 2016.Crayon: Saving Power Through Shape and Color Approximation onNext-generation Displays. In Proceedings of the Eleventh EuropeanConference on Computer Systems (EuroSys ’16). 11:1–11:17.
[10] P. Stanley-Marbell and D. Marculescu. 2006. A Programming Modeland Language Implementation for Concurrent Failure-ProneHardware. In Proceedings of the 2nd Workshop on ProgrammingModels for Ubiquitous Parallelism, PMUP ’06. 44–49.

[11] Phillip Stanley-Marbell and Martin Rinard. 2016. Reducing Serial I/OPower in Error-tolerant Applications by Efficient Lossy Encoding. InProceedings of the 53rd Annual Design Automation Conference (DAC’16). 62:1–62:6.
[12] Phillip Stanley-Marbell and Martin Rinard. 2018. Perceived-ColorApproximation Transforms for Programs that Draw. IEEE Micro 38, 4(Jul 2018), 20–29.
[13] Andrew Stockman. 2019. Cone fundamentals and CIE standards.Current Opinion in Behavioral Sciences 30 (Dec 2019), 87–93.
[14] Robert Tibshirani. 1996. Regression Shrinkage and Selection via theLasso. Journal of the Royal Statistical Society. Series B(Methodological) 58, 1 (1996), 267–288.
[15] Ralph A. Willoughby. 1979. Solutions of Ill-Posed Problems (A. N.Tikhonov and V. Y. Arsenin). SIAM Rev. 21, 2 (Apr 1979), 266–267.
[16] W. D. Wright. 1929. A re-determination of the trichromatic coefficientsof the spectral colours. Transactions of the Optical Society 30, 4(1929), 141–164.


![Student’s t Sensitivities: GreeksfortheGossetFormulaearXiv:1003.1344v2 [q-fin.PR] 16 Jul 2010 Student’st-DistributionBasedOption Sensitivities: GreeksfortheGossetFormulae Daniel](https://img.pdfslide.net/doc/110x75/5fa1f5e65b7bfb78540e321a/studentas-t-sensitivities-greeksforthegossetformulae-arxiv10031344v2-q-finpr.jpg)