Upload
others
View
23
Download
0
Embed Size (px)
Citation preview

Congressional Budget Office
66th Annual Economic Outlook ConferenceResearch Seminar in Quantitative Economics University of Michigan
November 15 2018
Yiqun Gloria ChenMacroeconomic Analysis Division
Inflation and the Phillips Curve
As developmental work for analysis for the Congress the information in this presentation is preliminary and is being circulated to stimulate discussion and critical comment
1
CBO
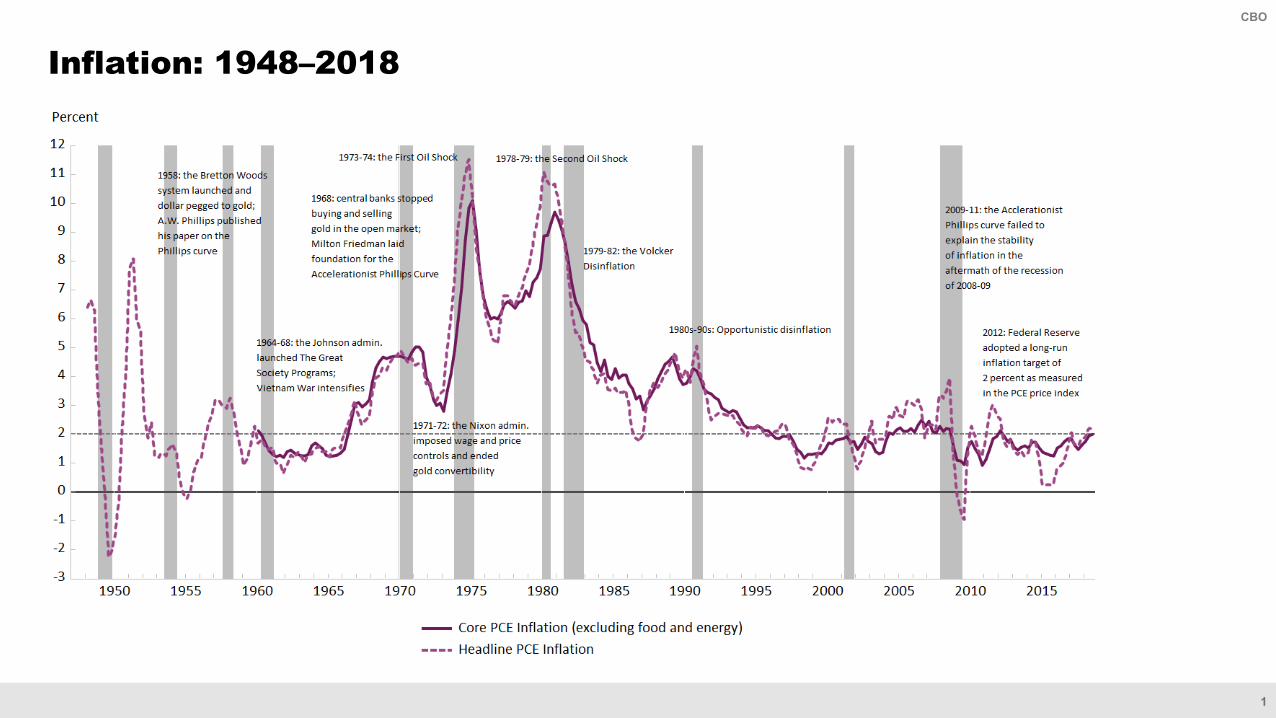
Inflation 1948ndash2018
2
CBO
Inflation Expectations 1948ndash2018
3
CBO
Unemployment 1948ndash2018
4
CBO
This flow chart shows the structure of CBOrsquos inflation model for the PCEPI as well as the spending shares for its components Those components include PCNFOOD Food amp Beverage Purchases for Off-Premises Consumption PCNENERGY Gasoline amp Other Energy Goods PCSENERGY Electricity and Gas PCDELEC Video Audio Photo amp Info Processing Equipment amp Media PCDMVAP Motor Vehicles amp Parts PCDMED Therapeutic Appliances amp Equipment PCDOTH Other Durable Goods (CBOrsquos calculation) PCNMED Pharmaceutical amp Other Medical Products PCNOTH Other Nondurable Goods (CBOrsquos calculation) PCSHOUS Housing PCSMED Health Care Services and PCSOTH Other Services (CBOrsquos calculation)
Structure of CBOrsquos Model for the Personal Consumption Expenditures (PCE) Price Index
5
CBO
120587120587119905119905= 119864119864119905119905120587120587119905119905+1 minus 120631120631 119880119880119905119905 minus 119880119880lowast + 120574120574119885119885119905119905 + 120598120598119905119905
Determinants of inflationndash 119864119864119905119905120587120587119905119905+1 Inflation expectationsndash 120573120573 119880119880119905119905 minus 119880119880lowast Unemployment gap or other measures of slack in the economyndash 120574120574119885119885119905119905 Supply-side shocks (for example relative price of imports energy etc)
Issue 1 Cyclical sensitivity of inflationndash For the price index of personal consumption expenditures (PCEPI) excluding food
and energy (ldquoXFErdquo or ldquocore-XFErdquo) 120573120573 has declined from 03~04 in the 1970s to 005~01 in the most recent decades
ndash Does inflation still respond to slack
Issue 2 The form of inflation expectationsndash ldquoAccelerationistrdquo 119864119864119905119905120587120587119905119905+1= 119860119860 119871119871 120587120587119905119905minus1 (distributed lags of inflation)ndash ldquoAnchoredrdquo 119864119864119905119905120587120587119905119905+1= 120587120587lowast (constant)ndash Combined 119864119864119905119905120587120587119905119905+1=120630120630119860119860(119871119871)120587120587119905119905minus1 + (120783120783 minus 120630120630)120587120587lowast
Expectation-Augmented Phillips Curve
6
CBO
Cyclical Sensitivity of InflationGoods Versus Services
7
CBO
Goal Understanding why the aggregate Phillips curve is so flat
Method Estimating Phillips curve equations at the component levelndash Measure of slack The unemployment gap (CBOrsquos estimate)ndash Sample 1998Q1ndash2018Q3 (stable inflation expectations)ndash Control for Relative price of imports and energy goods outliers (for example ldquocash
for clunkersrdquo)ndash Similar to Stock and Watson (2018) Struyven (2017)
Main Finding Divergence between goods and services in terms of cyclical sensitivity
ndash Services Remained largely pro-cyclicalmdashfor example shelterndash Goods Not pro-cyclical in the past two decades
Dampening the slope of the aggregate Phillips curve Exception Food prices
Phillips Curve Model at the Component Level
8
CBO
Shelter Inflation
9
CBO
Auto Inflation
10
CBO
Services Largely Pro-Cyclical
Unemployment Gap
Lagged Inflation Constant Adjusted R2
PCE Services Less Energy -014 032 191 046(000) (001) (035)
PCE Housing Services -023 058 129 080(000) (000) (024)
CPI-U Owners Equivalent of Rent -021 062 113 078(000) (000) (024)
CPI-U Rent of Primary Residence -015 067 116 084(000) (000) (026)
PCE Health Care Services -006 062 092 042(038) (000) (026)
PCE Services Less Energy Rent of Shelter amp Health care -004 035 172 038(050) (000) (028)
CPI-U Services Less Energy Services amp Rent of Shelter -015 040 188 034(001) (000) (040)
CPI-U Medical Care Services -005 070 115 034(051) (000) (045)
CPI-U Food away from Home -009 062 105 057(005) (000) (025)
CPI-U Education Services -007 093 030 081(016) (000) (029)
CPI-U Transportation Services -002 -011 320 016(087) (027) (036)
Percent of Expenditures
11
CBO
Goods Largely Not Pro-Cyclical Except Food
Unemployment Gap
Lagged Inflation Constant Adjusted R2
PCE Durable Goods 008 028 -154 027(031) (001) (024)
PCE Motor Vehicles and Parts 031 030 -021 043(005) (000) (025)
PCE Video Audio Photo amp 016 060 -395 044 Information Processing Equipment amp Media (034) (000) (087)
PCE Other Durable Goods (including Medical Equipments) -010 038 -050 027(028) (000) (019)
PCE Nondurable Goods Less Energy -014 073 039 044(005) (000) (017)
PCE Food amp Beverage Purchased for Off-Premises Consumpt -024 066 071 055(004) (000) (024)
CPI-U Food at Home -027 063 082 052(005) (000) (028)
CPI-U Alcoholic Beverages -017 034 147 016(004) (000) (026)
PCE Pharmaceutical amp Other Medical Products -002 033 202 020(088) (000) (039)
PCE Other Nondurable Goods 008 025 000 042(046) (001) (018)
CPI-U Apparel 054 014 -069 022(000) (018) (030)
Percent of Expenditures
12
CBO
Servicesndash Prices are largely determined by domestic andor local factors
Household maintenance restaurants etcndash Cannot be inventoried
Goodsndash Lots of measurement issues and noise from one-off price shocks (Stock and
Watson 2018) Measurement issue very severe for apparel recreational goods financial
services etc One-off price shocks ldquocash for clunkersrdquo (2009) federal tobacco tax hike
(2009) ndash Tend to be more heavily influenced by long-run structural forces
Globalization Abdih et al (2016) and others ldquoThe Amazon effectrdquo Goolsbee and Klenow (2018) Increasing industrial concentration
Goods Versus Services Possible Explanations
13
CBO
Services Componentsndash Generally Phillips curve equations at the component level work relatively wellndash Special case PCE health care services (policy plays a large role)
CBOrsquos model incorporates CBOrsquos projection of Medicare reimbursement rate growth
Goods Componentsndash ldquoTop-down Approachrdquo CBO currently uses core PCE inflation (from the
aggregate Phillips curve) as an input in the equations for goods components Keep track of movements in relative prices Judgment in sector-specific trends Control for relative price of imports one-off price shocks etc
Forecasting Inflation at the Component Level
14
CBO
Modeling Inflation ExpectationsBackward-Looking Versus Anchored
15
CBO
Reduced-form
120587120587119905119905= 120630120630119860119860(119871119871)120587120587119905119905minus1 + (120783120783 minus 120630120630)120587120587lowast minus 120573120573 119880119880119905119905 minus 119880119880119905119905lowast + 120574120574119885119885119905119905 + 120598120598119905119905o 119860119860(119871119871)120587120587119905119905minus1 Use four lags of past inflationo 120587120587lowast Long-run inflationldquoanchorrdquoo 119880119880119905119905 minus 119880119880119905119905lowast The unemployment gap (CBOrsquos estimate)o 119885119885119905119905 Supply-side shocks including relative prices of imports and energy goodso Sample 1998Q1ndash2018Q3
Blanchard (2016) ldquoThe Phillips Curve Back to the rsquo60srdquo ndash Shows 120630120630 declined over time and is currently very small for headline CPI
But component-level analysis implies that the measure of inflation matters
This exercise Try ten different measures of aggregate inflation
Estimating the Aggregate Phillips Curve
16
CBO
Three measures of headline inflationndash Headline CPI-U (BLS) and Headline PCEPI (BEA) ndash Chained CPI-U (BLS)
Ten Measures of Inflation
17
CBO
Seven measures of core inflationndash Approach 1 Remove the most volatile price changes
XFE CPI-U (BLS) and XFE PCEPI (BEA) Median CPI-U and 16-Trimmed-Mean CPI-U (Federal Reserve Bank of
Cleveland) Rank price changes by size each month and trim the items with price
changes that are above or below a certain threshold ldquoMedianrdquo is just extreme trimming
Trimmed-Mean PCEPI (Federal Reserve Bank of Dallas) Trimming point chosen optimally every month
ndash Approach 2 Remove the most frequent price changes Sticky CPI-U and Sticky-XFE CPI (Federal Reserve Bank of Atlanta)
Price changes every 43 months or longer (Bils and Klenow 2004)
Ten Measures of Inflation (Continued)
18
CBO
Seven Measures of Core Inflation
19
CBO
Relative weight of lagged inflation and constantldquoanchorrdquondash Overall inflation 120572120572 asymp 02 consistent with Blanchard (2016) for headline CPI
Estimation Results I
This figure plots the sum of the estimated coefficients on lagged inflation terms using recursive samples that start in 1998Q1 and end in 2012Q1 2012Q2 hellip and 2018Q1 The Phillips curve equations are ldquounrestrictedrdquo as no assumption was imposed on the value of π before the estimation Instead the intercept of the equation which in theory equals απ was estimated and then the values of α and π were calculated by assuming the long-run restriction on the estimated coefficients
20
CBO
Relative weight of lagged inflation and constantldquoanchorrdquondash Overall inflation 120572120572 asymp 02 consistent with Blanchard (2016) for headline CPIndash Core inflation 120572120572 asymp 05 particularly for non-XFE measures
Estimation Results I (Continued)
This figure plots the sum of the estimated coefficients on lagged inflation terms using recursive samples that start in 1998Q1 and end in 2012Q1 2012Q2 hellip and 2018Q1 The Phillips curve equations are ldquounrestrictedrdquo as no assumption was imposed on the value of π before the estimation Instead the intercept of the equation which in theory equals απ was estimated and then the values of α and π were calculated by assuming the long-run restriction on the estimated coefficients
21
CBO
Further analysis using survey measures of inflation expectations suggests
Inflation expectations by consumers matter more for inflation dynamics than the expectations by professional forecasters for all ten measures of inflation
ndash Consumersrsquo expectations more closely resemble those of firms (Coibion and Gorodnichenko 2015)
ndash Transmission of professional forecastersrsquo views to consumers is weak in a low-inflation environment
ndash Coibion et al (2017) Similar finding for headline CPI
Long-run inflation expectations by consumers are ldquoshock-anchoredrdquo but not ldquolevel-anchoredrdquo (Ball and Mazumder 2011)
ndash Shock-anchoring Transitory shocks not passed to expectationsndash Level-anchoring Expectations tied to a particular level
Estimation Results I (Continued)
22
CBO
Comparing measures of core inflationndash The Phillips curve fits the non-XFE measures very well
Average adj 1198771198772 of non-XFE measures = 07 Ball and Mazumder (2014) Showed this for median CPI
ndash XFEs are ldquooutliersrdquo particularly XFE CPI-U (low 120572120572 and low 1198771198772) Average adj 1198771198772 of XFE measures = 025
Possible explanationndash Fewer goods prices in the non-XFE core measures
Goods price changes are more volatile Goods price changes occur more frequently
Estimation Results II
23
CBO
CPI Components Summary Statistics and Categorization
Mean Standard Deviation
Relative Importance
(2017)
Change in Relative
Importantce 2007-2017
XFE Sticky CPIProbability
(= Median CPI) (1998-2007)
(1) (2) (3) (4) (5) (6) (7)
Core (XFE) ServicesOwners Equivalent of Rent (OER) 27 11 232 298 Y Y 52Rent of Primary Residence 32 11 79 101 Y Y 5Medical Care Services 38 13 67 233 Y Y 2Education Services 49 15 30 058 Y Y 0Transportation Services 27 18 60 -105 Y Y 5
Core (XFE) GoodsApparel -03 25 31 -189 Y N 2New Vehicles 01 23 36 -142 Y N 3Used Cars and Trucks -03 8 21 020 Y N 0Medical Care Goods 29 16 18 059 Y Y 1
Food and EnergyFood away from Home 28 09 59 019 N Y 11Food at Home 21 27 77 -201 N N 6Energy 36 202 75 078 N N 1
CategorizationSummary Statistics
Major CPI Components
The categorization of components into sticky CPI is based on Bryan and Meyer (2010) ldquoAre Some Prices in the CPI More Forward Looking Than Others We Think Sordquo Economic Commentary Federal Reserve Bank of Cleveland httpswwwfrbatlantaorg-mediadocumentsresearchinflationprojectstickypricesticky-price-cpi-supplemental-readingpdf The probabilities of a componentrsquos being the median CPI are based on the ldquorevised methodologyrdquo that split the OER into four regional components For more detail see httpswwwclevelandfedorgenour-researchindicators-and-datamedian-cpirevised-methodologyaspx
Percent of Expenditures
24
CBO
The slope of the Phillips curve Flat but steeper for CPIs than PCEPIsndash 120573120573 = 005∿01 for PCEPIs but = 01∿02 for CPIsndash Why Shelter the most cyclically sensitive component has a much larger weight in CPI than in PCEPI
Estimation Results III
This figure plots the sum of the estimated coefficients on lagged inflation terms using recursive samples that start in 1998Q1 and end in 2012Q1 2012Q2 hellip and 2018Q1 The Phillips curve equations are ldquounrestrictedrdquo as no assumption was imposed on the value of π before the estimation Instead the intercept of the equation which in theory equals απ was estimated and then the values of α and π were calculated by assuming the long-run restriction on the estimated coefficients
25
CBO
The slope of the Phillips curve Flat but steeper for CPIs than PCEPIsndash 120573120573 = 005∿01 for PCEPIs but = 01∿02 for CPIsndash Why Shelter the most cyclically sensitive component has a much larger weight in CPI than in PCEPI
Estimation Results III (Continued)
This figure plots the sum of the estimated coefficients on lagged inflation terms using recursive samples that start in 1998Q1 and end in 2012Q1 2012Q2 hellip and 2018Q1 The Phillips curve equations are ldquounrestrictedrdquo as no assumption was imposed on the value of π before the estimation Instead an intercept of the equation which in theory equals απ was estimated and then the value of α and π were calculated by assuming the long-run restriction on the estimated coefficients
26
CBO
Reviewing the Findings
27
CBO
Phillips-curve analysis at the component level provides insight intondash Cyclical sensitivity of aggregate inflation
For most service components and food inflation process is pro-cyclical For most non-food good components inflation process is not pro-cyclical
Need better understanding and models for goods price inflationndash Difference in the behaviors of various inflation measures
CPI is more cyclically sensitive than PCEPI because shelter has larger share in CPI
Non-XFE measures of core inflation better capture movements in trend inflation because they contain fewer noisy goods components
The aggregate Phillips curve has shifted away from ldquoaccelerationistrdquo toward an ldquoanchoredrdquo form but the process appears incomplete
ndash Need better understanding of the formation process of inflation expectations particularly those of consumers and firms
Conclusions
28
CBO
Abdih Yasser Ravi Balakrishnan and Baoping Shang ldquoWhat Is Keeping US Core Inflation Low Insights From a Bottom-Up Approachrdquo International Monetary Fund 2016
Ball Laurence and Sandeep Mazumder ldquoInflation Dynamics and the Great Recessionrdquo Brookings Papers on Economic Activity (2011) 337ndash406
Blanchard Olivier ldquoThe Phillips Curve Back to the rsquo60s American Economic Review 1065 (2016) 31ndash34
Bils Mark and Peter J Klenow ldquoSome Evidence on the Importance of Sticky Pricesrdquo Journal of Political Economy 1125 (2004) 947ndash985
Coibion Olivier and Yuriy Gorodnichenko ldquoIs the Phillips Curve Alive and Well After All Inflation Expectations and the Missing Disinflationrdquo American Economic Journal Macroeconomics 71 (2015) 197ndash232
References
29
CBO
Coibion Olivier Yuriy Gorodnichenko and Rupal Kamdar ldquoThe Formation of Expectations Inflation and the Phillips Curverdquo No w23304 National Bureau of Economic Research 2017
Goolsbee Austan D and Peter J Klenow ldquoInternet Rising Prices Falling Measuring Inflation in a World of E-Commercerdquo AEA Papers and Proceedings Vol 108 2018
Stock J and Mark Watson ldquoSlack and Cyclically Sensitive Inflationrdquo ECB Forum on Central Banking Sintra Portugal 2018
Struyven Dann ldquoWhich Prices Still Respond to Slackrdquo Goldman Sachs Economics Research (October 31 2017)
References (Continued)
| Current vintage data | |||||||||||||||||||||||||||
| Dec-16 | Jan-17 | Feb-17 | Mar-17 | Apr-17 | May-17 | Jun-17 | Jul-17 | Aug-17 | Sep-17 | Oct-17 | Nov-17 | Dec-17 | |||||||||||||||
| Rose at 0-2 rate | 314 | 179 | 190 | 266 | 178 | 158 | 181 | 206 | 275 | 165 | 181 | 224 | 251 | ||||||||||||||
| Rose at 2-3 rate | 82 | 137 | 111 | 171 | 191 | 280 | 111 | 130 | 116 | 216 | 88 | 97 | 39 | ||||||||||||||
| Rose at 3-5 rate | 240 | 198 | 253 | 80 | 126 | 136 | 209 | 161 | 241 | 125 | 231 | 258 | 177 | ||||||||||||||
| Rose at 5-10 rate | 100 | 122 | 57 | 70 | 71 | 85 | 91 | 60 | 51 | 114 | 50 | 122 | 81 | ||||||||||||||
| Rose faster than 10 rate | 67 | 137 | 108 | 27 | 151 | 55 | 75 | 116 | 65 | 97 | 159 | 82 | 134 | ||||||||||||||
| 227 | 281 | 387 | 282 | 286 | 334 | 328 | 253 | 283 | 291 | 218 | 317 | ||||||||||||||||
| 212 | 172 | 215455310712 | 218771897151 | ||||||||||||||||||||||||
| 140 | 194 | 153949709569 | 74785941399 | ||||||||||||||||||||||||
| 177 | 157 | 175371335238 | 221799519999 | ||||||||||||||||||||||||
| 83 | 82 | 74591464835 | 84429446757 | ||||||||||||||||||||||||
| 90 | 94 | 92689863883 | 125100452725 | ||||||||||||||||||||||||
| 298 | 301 | 287942315763 | 275112741969 | ||||||||||||||||||||||||
| 2017Q1 | 2017Q2 | 2017Q3 | 2017Q4 | ||||||||||||||||||||||||
| Fell | 2983 | 3008 | 2879 | 2751 | |||||||||||||||||||||||
| Rose at 0-2 rate | 2118 | 1723 | 2155 | 2188 | |||||||||||||||||||||||
| Rose at 2-3 rate | 1396 | 1938 | 1539 | 748 | |||||||||||||||||||||||
| Rose at 3-5 rate | 1769 | 1573 | 1754 | 2218 | |||||||||||||||||||||||
| Rose at 5-10 rate | 829 | 821 | 746 | 844 | |||||||||||||||||||||||
| Rose faster than 10 rate | 905 | 937 | 927 | 1251 |
| Major Sectors | CPI | PCEPI | ||||
| Housing | 426 | 183 | ||||
| Health Care | 85 | 231 | ||||
| Food and Beverages | 146 | 137 | ||||
| Transportation | 153 | 90 | ||||
| Recreation | 57 | 89 | ||||
| Education and Communication | 70 | 46 | ||||
| Apparel | 30 | 29 | ||||
| Financial Services | 02 | 47 | ||||
| Other | 30 | 147 | ||||
| Total | 100 | 100 | ||||
| Data December 2016 |
| Naiumlve Phillips-Curve-Style Models (Sample 1998-2017) | |||||||||||||
| 8 | 9 | 10 | 11 | ||||||||||
| Variables | Constant | Lagged Inflation | Unemployment Gap | Adjusted R2 | Order of AR | Order of Lagged Rucgap | |||||||
| Owners Equivalent of Rent | 118 | 062 | -022 | 078 | 1 | 1 | |||||||
| (48) | (79) | -(40) | |||||||||||
| Rent of Primary Residence | 141 | 060 | -018 | 084 | 1 | 4 | |||||||
| (48) | (74) | -(33) | |||||||||||
| Medical Care Services | 131 | 067 | -007 | 032 | 2 | ||||||||
| (27) | (58) | -(09) | |||||||||||
| Education Services | 023 | 095 | -009 | 078 | 4 | 2 | |||||||
| (07) | (149) | -(16) | |||||||||||
| Transportation Services | 26 | 01 | -00 | 018 | 1 | 3 | |||||||
| (59) | (05) | -(02) | |||||||||||
| Apparel | -060 | 027 | 043 | 016 | 4 | 0 | |||||||
| -(19) | (15) | (23) | |||||||||||
| New Vehicles | -046 | 003 | 065 | 018 | 1 | 0 | |||||||
| -(17) | (03) | (39) | |||||||||||
| Used Cars and Trucks | -001 | 031 | 092 | 028 | 2 | 4 | |||||||
| -(00) | (35) | (19) | |||||||||||
| Medical Care Goods | 23 | 02 | -01 | 023 | 3 | ||||||||
| (51) | (14) | -(08) | |||||||||||
| Food away from Home | 116 | 060 | -008 | 050 | 1 | 2 | |||||||
| (40) | (62) | -(15) | |||||||||||
| Food at Home | 105 | 063 | -009 | 059 | 1 | ||||||||
| (37) | (86) | -(07) | |||||||||||
| Energy | 983 | -022 | -061 | 048 | 1 | ||||||||
| (48) | -(22) | -(06) | |||||||||||
| Unemployment Gap | Lagged Inflation | Constant | Adjusted R2 | Obs | Durbin-Watson Statistic | Order of Lagged Inflation | Order of Lagged Unemployment Gap | |||||||||||
| Services | ||||||||||||||||||
| Owners Equivalent of Rent | -021 | 062 | 113 | 078 | 83 | 171 | 1 | 1 | ||||||||||
| 000 | 000 | 024 | ||||||||||||||||
| Rent of Primary Residence | -015 | 067 | 116 | 084 | 83 | 217 | 1 | 5 | ||||||||||
| 000 | 000 | 026 | ||||||||||||||||
| Food away from Home | -008 | 061 | 108 | 057 | 83 | 251 | 2 | 2 | ||||||||||
| 007 | 000 | 025 | ||||||||||||||||
| Medical Care Services | -005 | 070 | 115 | 034 | 83 | 201 | 2 | 0 | ||||||||||
| 051 | 000 | 045 | ||||||||||||||||
| Education Services | -007 | 093 | 030 | 081 | 83 | 202 | 4 | 2 | ||||||||||
| 016 | 000 | 029 | ||||||||||||||||
| Transportation Services | -002 | -011 | 320 | 016 | 83 | 198 | 2 | 3 | ||||||||||
| 087 | 027 | 036 | ||||||||||||||||
| Goods | ||||||||||||||||||
| Apparel | 050 | 010 | -054 | 008 | 83 | 192 | 4 | 0 | ||||||||||
| 001 | 039 | 032 | ||||||||||||||||
| New Vehicles | 038 | 002 | -034 | 034 | 83 | 186 | 1 | 0 | ||||||||||
| 001 | 084 | 023 | ||||||||||||||||
| Used Cars and Trucks | 038 | 018 | -019 | 034 | 83 | 174 | 2 | 4 | ||||||||||
| 047 | 013 | 082 | ||||||||||||||||
| Food at Home | -005 | 065 | 103 | 057 | 83 | 237 | 1 | 0 | ||||||||||
| 072 | 000 | 027 | ||||||||||||||||
| Medical Care Goods | -005 | 046 | 169 | 056 | 83 | 196 | 3 | 0 | ||||||||||
| 053 | 000 | 028 | ||||||||||||||||
| Controlling Inflnm + Inflne | ||||||||||||||||||
| Unemployment Gap | Lagged Inflation | Constant | Adjusted R2 | Observations | Durbin-Watson Statistic | Order of Lagged Inflation | Order of Lagged Unemployment Gap | |||||||||||
| Owners Equivalent of Rent (OER) | -0212 | 0633 | 1120 | 077 | 80 | 179 | 1 | 1 | ||||||||||
| (0058) | (0082) | (0260) | ||||||||||||||||
| Rent of Primary Residence | -0171 | 0604 | 1395 | 084 | 80 | 201 | 1 | 5 | ||||||||||
| (0056) | (0085) | (0308) | ||||||||||||||||
| Medical Care Services | -0070 | 0693 | 1191 | 031 | 80 | 205 | 2 | 0 | ||||||||||
| (0083) | (0123) | (0514) | ||||||||||||||||
| Education Services | -0087 | 0947 | 0296 | 078 | 80 | 204 | 4 | 2 | ||||||||||
| (0055) | (0067) | (0354) | ||||||||||||||||
| Transportation Services | -0035 | 0154 | 2284 | 019 | 80 | 203 | 2 | 3 | ||||||||||
| (0130) | (0160) | (0485) | ||||||||||||||||
| Apparel | 0416 | 0305 | -0594 | 015 | 80 | 187 | 4 | 0 | ||||||||||
| (0187) | (0178) | (0327) | ||||||||||||||||
| New Vehicles | 0655 | 0021 | -0494 | 017 | 80 | 200 | 1 | 0 | ||||||||||
| (0169) | (0112) | (0287) | ||||||||||||||||
| Used Cars and Trucks | 0410 | 0215 | -0860 | 038 | 80 | 185 | 2 | 4 | ||||||||||
| (0535) | (0114) | (0902) | ||||||||||||||||
| Medical Care Goods | -0082 | 0202 | 2251 | 022 | 80 | 192 | 3 | 0 | ||||||||||
| (0105) | (0141) | (0458) | ||||||||||||||||
| Food away from Home | -0086 | 0613 | 1159 | 059 | 80 | 236 | 2 | 2 | ||||||||||
| (0132) | (0074) | (0302) | ||||||||||||||||
| Food at Home | -0065 | 0751 | 0781 | 053 | 80 | 216 | 1 | 0 | ||||||||||
| (0049) | (0116) | (0340) | ||||||||||||||||
| Energy | -0735 | 0068 | 2120 | 096 | 80 | 134 | 2 | 0 | ||||||||||
| (0311) | (0035) | (0651) | ||||||||||||||||
| Controlling Inflnm | ||||||||||||||||||
| Unemployment Gap | Lagged Inflation | Constant | Adjusted R2 | Observations | Durbin-Watson Statistic | Order of Lagged Inflation | Order of Lagged Unemployment Gap | |||||||||||
| Core (XFE) Services | ||||||||||||||||||
| Owners Equivalent of Rent (OER) | -0212 | 0632 | 1129 | 078 | 80 | 180 | 1 | 1 | ||||||||||
| (0058) | (0081) | (0257) | ||||||||||||||||
| Rent of Primary Residence | -0171 | 0605 | 1393 | 084 | 80 | 201 | 1 | 5 | ||||||||||
| (0055) | (0084) | (0302) | ||||||||||||||||
| Medical Care Services | -0068 | 0696 | 1189 | 032 | 80 | 205 | 2 | 0 | ||||||||||
| (0082) | (0122) | (0511) | ||||||||||||||||
| Education Services | -0087 | 0943 | 0287 | 078 | 80 | 201 | 4 | 2 | ||||||||||
| (0055) | (0067) | (0353) | ||||||||||||||||
| Transportation Services | -0030 | 0076 | 2602 | 017 | 80 | 202 | 2 | 3 | ||||||||||
| (0131) | (0152) | (0440) | ||||||||||||||||
| Apparel | 0426 | 0292 | -0544 | 016 | 80 | 189 | 4 | 0 | ||||||||||
| (0186) | (0176) | (0315) | ||||||||||||||||
| New Vehicles | 0658 | 0023 | -0436 | 017 | 80 | 196 | 1 | 0 | ||||||||||
| (0168) | (0112) | (0272) | ||||||||||||||||
| Used Cars and Trucks | 0399 | 0190 | -0322 | 036 | 80 | 171 | 2 | 4 | ||||||||||
| (0543) | (0115) | (0861) | ||||||||||||||||
| Medical Care Goods | -0080 | 0203 | 2289 | 022 | 80 | 193 | 3 | 0 | ||||||||||
| (0104) | (0140) | (0453) | ||||||||||||||||
| Food away from Home | -0090 | 0628 | 1038 | 059 | 80 | 237 | 2 | 2 | ||||||||||
| (0132) | (0073) | (0282) | ||||||||||||||||
| Food at Home | -0064 | 0754 | 0741 | 053 | 80 | 216 | 1 | 0 | ||||||||||
| (0049) | (0116) | (0338) | ||||||||||||||||
| Energy | -0678 | -0305 | 10270 | 049 | 80 | 198 | 2 | 0 | ||||||||||
| (1085) | (0114) | (2053) |
| Major CPI Components | Summary Statistics | Categorization | |||||||||||||||
| Mean | Standard Deviation | Relative Importance (2017) | Change in Relative Importantce 2007-2017 | XFE | Sticky CPI | Probability (= Median CPI) (1998-2007) | |||||||||||
| 1 | 2 | 3 | 4 | 5 | 6 | 7 | |||||||||||
| Core (XFE) Services | |||||||||||||||||
| Owners Equivalent of Rent (OER) | 27 | 11 | 232 | 298 | Y | Y | 52 | ||||||||||
| Rent of Primary Residence | 32 | 11 | 79 | 101 | Y | Y | 5 | ||||||||||
| Medical Care Services | 38 | 13 | 67 | 233 | Y | Y | 2 | ||||||||||
| Education Services | 49 | 15 | 30 | 058 | Y | Y | 0 | ||||||||||
| Transportation Services | 27 | 18 | 60 | -105 | Y | Y | 5 | ||||||||||
| Core (XFE) Goods | |||||||||||||||||
| Apparel | -03 | 25 | 31 | -189 | Y | N | 2 | ||||||||||
| New Vehicles | 01 | 23 | 36 | -142 | Y | N | 3 | ||||||||||
| Used Cars and Trucks | -03 | 8 | 21 | 020 | Y | N | 0 | ||||||||||
| Medical Care Goods | 29 | 16 | 18 | 059 | Y | Y | 1 | ||||||||||
| Food and Energy | |||||||||||||||||
| Food away from Home | 28 | 09 | 59 | 019 | N | Y | 11 | ||||||||||
| Food at Home | 21 | 27 | 77 | -201 | N | N | 6 | ||||||||||
| Energy | 36 | 202 | 75 | 078 | N | N | 1 | ||||||||||
| Unemployment Gap | Lagged Inflation | Constant | Adjusted R2 | Observations | Durbin-Watson Statistic | |||||||||
| PCE Services Less Energy | -014 | 032 | 191 | 046 | 83 | 185 | ||||||||
| (000) | (001) | (035) | ||||||||||||
| PCE Housing Services | -023 | 058 | 129 | 080 | 83 | 208 | ||||||||
| (000) | (000) | (024) | ||||||||||||
| CPI-U Owners Equivalent of Rent | -021 | 062 | 113 | 078 | 83 | 171 | ||||||||
| (000) | (000) | (024) | ||||||||||||
| CPI-U Rent of Primary Residence | -015 | 067 | 116 | 084 | 83 | 217 | ||||||||
| (000) | (000) | (026) | ||||||||||||
| PCE Health Care Services | -006 | 062 | 092 | 042 | 83 | 207 | ||||||||
| (038) | (000) | (026) | ||||||||||||
| PCE Services Less Energy Rent of Shelter amp Health care | -004 | 035 | 172 | 038 | 83 | 226 | ||||||||
| (050) | (000) | (028) | ||||||||||||
| CPI-U Services Less Energy Services amp Rent of Shelter | -015 | 040 | 188 | 034 | 83 | 218 | ||||||||
| (001) | (000) | (040) | ||||||||||||
| CPI-U Medical Care Services | -005 | 070 | 115 | 034 | 83 | 201 | ||||||||
| (051) | (000) | (045) | ||||||||||||
| CPI-U Food away from Home | -009 | 062 | 105 | 057 | 83 | 264 | ||||||||
| (005) | (000) | (025) | ||||||||||||
| CPI-U Education Services | -007 | 093 | 030 | 081 | 83 | 202 | ||||||||
| (016) | (000) | (029) | ||||||||||||
| CPI-U Transportation Services | -002 | -011 | 320 | 016 | 83 | 198 | ||||||||
| (087) | (027) | (036) | ||||||||||||
| Unemployment Gap | Lagged Inflation | Constant | Adjusted R2 | Observations | Durbin-Watson Statistic | |||||||||
| PCE Durable Goods | 008 | 028 | -154 | 027 | 83 | 183 | ||||||||
| (031) | (001) | (024) | ||||||||||||
| PCE Motor Vehicles and Parts | 031 | 030 | -021 | 043 | 83 | 178 | ||||||||
| (005) | (000) | (025) | ||||||||||||
| PCE Video Audio Photo amp | 016 | 060 | -395 | 044 | 83 | 222 | ||||||||
| Information Processing Equipment amp Media | (034) | (000) | (087) | |||||||||||
| PCE Other Durable Goods (including Medical Equipments) | -010 | 038 | -050 | 027 | 83 | 188 | ||||||||
| (028) | (000) | (019) | ||||||||||||
| PCE Nondurable Goods Less Energy | -014 | 073 | 039 | 044 | 83 | 203 | ||||||||
| (005) | (000) | (017) | ||||||||||||
| PCE Food amp Beverage Purchased for Off-Premises Consumption | -024 | 066 | 071 | 055 | 83 | 226 | ||||||||
| (004) | (000) | (024) | ||||||||||||
| CPI-U Food at Home | -027 | 063 | 082 | 052 | 83 | 216 | ||||||||
| (005) | (000) | (028) | ||||||||||||
| CPI-U Alcoholic Beverages | -017 | 034 | 147 | 016 | 83 | 209 | ||||||||
| (004) | (000) | (026) | ||||||||||||
| PCE Pharmaceutical amp Other Medical Products | -002 | 033 | 202 | 020 | 83 | 173 | ||||||||
| (088) | (000) | (039) | ||||||||||||
| PCE Other Nondurable Goods | 008 | 025 | 000 | 042 | 83 | 179 | ||||||||
| (046) | (001) | (018) | ||||||||||||
| CPI-U Apparel | 054 | 014 | -069 | 022 | 83 | 191 | ||||||||
| (000) | (018) | (030) | ||||||||||||
| Current vintage data | |||||||||||||||||||||||||||
| Dec-16 | Jan-17 | Feb-17 | Mar-17 | Apr-17 | May-17 | Jun-17 | Jul-17 | Aug-17 | Sep-17 | Oct-17 | Nov-17 | Dec-17 | |||||||||||||||
| Rose at 0-2 rate | 314 | 179 | 190 | 266 | 178 | 158 | 181 | 206 | 275 | 165 | 181 | 224 | 251 | ||||||||||||||
| Rose at 2-3 rate | 82 | 137 | 111 | 171 | 191 | 280 | 111 | 130 | 116 | 216 | 88 | 97 | 39 | ||||||||||||||
| Rose at 3-5 rate | 240 | 198 | 253 | 80 | 126 | 136 | 209 | 161 | 241 | 125 | 231 | 258 | 177 | ||||||||||||||
| Rose at 5-10 rate | 100 | 122 | 57 | 70 | 71 | 85 | 91 | 60 | 51 | 114 | 50 | 122 | 81 | ||||||||||||||
| Rose faster than 10 rate | 67 | 137 | 108 | 27 | 151 | 55 | 75 | 116 | 65 | 97 | 159 | 82 | 134 | ||||||||||||||
| 227 | 281 | 387 | 282 | 286 | 334 | 328 | 253 | 283 | 291 | 218 | 317 | ||||||||||||||||
| 212 | 172 | 215455310712 | 218771897151 | ||||||||||||||||||||||||
| 140 | 194 | 153949709569 | 74785941399 | ||||||||||||||||||||||||
| 177 | 157 | 175371335238 | 221799519999 | ||||||||||||||||||||||||
| 83 | 82 | 74591464835 | 84429446757 | ||||||||||||||||||||||||
| 90 | 94 | 92689863883 | 125100452725 | ||||||||||||||||||||||||
| 298 | 301 | 287942315763 | 275112741969 | ||||||||||||||||||||||||
| 2017Q1 | 2017Q2 | 2017Q3 | 2017Q4 | ||||||||||||||||||||||||
| Fell | 2983 | 3008 | 2879 | 2751 | |||||||||||||||||||||||
| Rose at 0-2 rate | 2118 | 1723 | 2155 | 2188 | |||||||||||||||||||||||
| Rose at 2-3 rate | 1396 | 1938 | 1539 | 748 | |||||||||||||||||||||||
| Rose at 3-5 rate | 1769 | 1573 | 1754 | 2218 | |||||||||||||||||||||||
| Rose at 5-10 rate | 829 | 821 | 746 | 844 | |||||||||||||||||||||||
| Rose faster than 10 rate | 905 | 937 | 927 | 1251 |
| Major Sectors | CPI | PCEPI | ||||
| Housing | 426 | 183 | ||||
| Health Care | 85 | 231 | ||||
| Food and Beverages | 146 | 137 | ||||
| Transportation | 153 | 90 | ||||
| Recreation | 57 | 89 | ||||
| Education and Communication | 70 | 46 | ||||
| Apparel | 30 | 29 | ||||
| Financial Services | 02 | 47 | ||||
| Other | 30 | 147 | ||||
| Total | 100 | 100 | ||||
| Data December 2016 |
| Naiumlve Phillips-Curve-Style Models (Sample 1998-2017) | |||||||||||||
| 8 | 9 | 10 | 11 | ||||||||||
| Variables | Constant | Lagged Inflation | Unemployment Gap | Adjusted R2 | Order of AR | Order of Lagged Rucgap | |||||||
| Owners Equivalent of Rent | 118 | 062 | -022 | 078 | 1 | 1 | |||||||
| (48) | (79) | -(40) | |||||||||||
| Rent of Primary Residence | 141 | 060 | -018 | 084 | 1 | 4 | |||||||
| (48) | (74) | -(33) | |||||||||||
| Medical Care Services | 131 | 067 | -007 | 032 | 2 | ||||||||
| (27) | (58) | -(09) | |||||||||||
| Education Services | 023 | 095 | -009 | 078 | 4 | 2 | |||||||
| (07) | (149) | -(16) | |||||||||||
| Transportation Services | 26 | 01 | -00 | 018 | 1 | 3 | |||||||
| (59) | (05) | -(02) | |||||||||||
| Apparel | -060 | 027 | 043 | 016 | 4 | 0 | |||||||
| -(19) | (15) | (23) | |||||||||||
| New Vehicles | -046 | 003 | 065 | 018 | 1 | 0 | |||||||
| -(17) | (03) | (39) | |||||||||||
| Used Cars and Trucks | -001 | 031 | 092 | 028 | 2 | 4 | |||||||
| -(00) | (35) | (19) | |||||||||||
| Medical Care Goods | 23 | 02 | -01 | 023 | 3 | ||||||||
| (51) | (14) | -(08) | |||||||||||
| Food away from Home | 116 | 060 | -008 | 050 | 1 | 2 | |||||||
| (40) | (62) | -(15) | |||||||||||
| Food at Home | 105 | 063 | -009 | 059 | 1 | ||||||||
| (37) | (86) | -(07) | |||||||||||
| Energy | 983 | -022 | -061 | 048 | 1 | ||||||||
| (48) | -(22) | -(06) | |||||||||||
| Unemployment Gap | Lagged Inflation | Constant | Adjusted R2 | Obs | Durbin-Watson Statistic | Order of Lagged Inflation | Order of Lagged Unemployment Gap | |||||||||||
| Services | ||||||||||||||||||
| Owners Equivalent of Rent | -021 | 062 | 113 | 078 | 83 | 171 | 1 | 1 | ||||||||||
| 000 | 000 | 024 | ||||||||||||||||
| Rent of Primary Residence | -015 | 067 | 116 | 084 | 83 | 217 | 1 | 5 | ||||||||||
| 000 | 000 | 026 | ||||||||||||||||
| Food away from Home | -008 | 061 | 108 | 057 | 83 | 251 | 2 | 2 | ||||||||||
| 007 | 000 | 025 | ||||||||||||||||
| Medical Care Services | -005 | 070 | 115 | 034 | 83 | 201 | 2 | 0 | ||||||||||
| 051 | 000 | 045 | ||||||||||||||||
| Education Services | -007 | 093 | 030 | 081 | 83 | 202 | 4 | 2 | ||||||||||
| 016 | 000 | 029 | ||||||||||||||||
| Transportation Services | -002 | -011 | 320 | 016 | 83 | 198 | 2 | 3 | ||||||||||
| 087 | 027 | 036 | ||||||||||||||||
| Goods | ||||||||||||||||||
| Apparel | 050 | 010 | -054 | 008 | 83 | 192 | 4 | 0 | ||||||||||
| 001 | 039 | 032 | ||||||||||||||||
| New Vehicles | 038 | 002 | -034 | 034 | 83 | 186 | 1 | 0 | ||||||||||
| 001 | 084 | 023 | ||||||||||||||||
| Used Cars and Trucks | 038 | 018 | -019 | 034 | 83 | 174 | 2 | 4 | ||||||||||
| 047 | 013 | 082 | ||||||||||||||||
| Food at Home | -005 | 065 | 103 | 057 | 83 | 237 | 1 | 0 | ||||||||||
| 072 | 000 | 027 | ||||||||||||||||
| Medical Care Goods | -005 | 046 | 169 | 056 | 83 | 196 | 3 | 0 | ||||||||||
| 053 | 000 | 028 | ||||||||||||||||
| Controlling Inflnm + Inflne | ||||||||||||||||||
| Unemployment Gap | Lagged Inflation | Constant | Adjusted R2 | Observations | Durbin-Watson Statistic | Order of Lagged Inflation | Order of Lagged Unemployment Gap | |||||||||||
| Owners Equivalent of Rent (OER) | -0212 | 0633 | 1120 | 077 | 80 | 179 | 1 | 1 | ||||||||||
| (0058) | (0082) | (0260) | ||||||||||||||||
| Rent of Primary Residence | -0171 | 0604 | 1395 | 084 | 80 | 201 | 1 | 5 | ||||||||||
| (0056) | (0085) | (0308) | ||||||||||||||||
| Medical Care Services | -0070 | 0693 | 1191 | 031 | 80 | 205 | 2 | 0 | ||||||||||
| (0083) | (0123) | (0514) | ||||||||||||||||
| Education Services | -0087 | 0947 | 0296 | 078 | 80 | 204 | 4 | 2 | ||||||||||
| (0055) | (0067) | (0354) | ||||||||||||||||
| Transportation Services | -0035 | 0154 | 2284 | 019 | 80 | 203 | 2 | 3 | ||||||||||
| (0130) | (0160) | (0485) | ||||||||||||||||
| Apparel | 0416 | 0305 | -0594 | 015 | 80 | 187 | 4 | 0 | ||||||||||
| (0187) | (0178) | (0327) | ||||||||||||||||
| New Vehicles | 0655 | 0021 | -0494 | 017 | 80 | 200 | 1 | 0 | ||||||||||
| (0169) | (0112) | (0287) | ||||||||||||||||
| Used Cars and Trucks | 0410 | 0215 | -0860 | 038 | 80 | 185 | 2 | 4 | ||||||||||
| (0535) | (0114) | (0902) | ||||||||||||||||
| Medical Care Goods | -0082 | 0202 | 2251 | 022 | 80 | 192 | 3 | 0 | ||||||||||
| (0105) | (0141) | (0458) | ||||||||||||||||
| Food away from Home | -0086 | 0613 | 1159 | 059 | 80 | 236 | 2 | 2 | ||||||||||
| (0132) | (0074) | (0302) | ||||||||||||||||
| Food at Home | -0065 | 0751 | 0781 | 053 | 80 | 216 | 1 | 0 | ||||||||||
| (0049) | (0116) | (0340) | ||||||||||||||||
| Energy | -0735 | 0068 | 2120 | 096 | 80 | 134 | 2 | 0 | ||||||||||
| (0311) | (0035) | (0651) | ||||||||||||||||
| Controlling Inflnm | ||||||||||||||||||
| Unemployment Gap | Lagged Inflation | Constant | Adjusted R2 | Observations | Durbin-Watson Statistic | Order of Lagged Inflation | Order of Lagged Unemployment Gap | |||||||||||
| Core (XFE) Services | ||||||||||||||||||
| Owners Equivalent of Rent (OER) | -0212 | 0632 | 1129 | 078 | 80 | 180 | 1 | 1 | ||||||||||
| (0058) | (0081) | (0257) | ||||||||||||||||
| Rent of Primary Residence | -0171 | 0605 | 1393 | 084 | 80 | 201 | 1 | 5 | ||||||||||
| (0055) | (0084) | (0302) | ||||||||||||||||
| Medical Care Services | -0068 | 0696 | 1189 | 032 | 80 | 205 | 2 | 0 | ||||||||||
| (0082) | (0122) | (0511) | ||||||||||||||||
| Education Services | -0087 | 0943 | 0287 | 078 | 80 | 201 | 4 | 2 | ||||||||||
| (0055) | (0067) | (0353) | ||||||||||||||||
| Transportation Services | -0030 | 0076 | 2602 | 017 | 80 | 202 | 2 | 3 | ||||||||||
| (0131) | (0152) | (0440) | ||||||||||||||||
| Apparel | 0426 | 0292 | -0544 | 016 | 80 | 189 | 4 | 0 | ||||||||||
| (0186) | (0176) | (0315) | ||||||||||||||||
| New Vehicles | 0658 | 0023 | -0436 | 017 | 80 | 196 | 1 | 0 | ||||||||||
| (0168) | (0112) | (0272) | ||||||||||||||||
| Used Cars and Trucks | 0399 | 0190 | -0322 | 036 | 80 | 171 | 2 | 4 | ||||||||||
| (0543) | (0115) | (0861) | ||||||||||||||||
| Medical Care Goods | -0080 | 0203 | 2289 | 022 | 80 | 193 | 3 | 0 | ||||||||||
| (0104) | (0140) | (0453) | ||||||||||||||||
| Food away from Home | -0090 | 0628 | 1038 | 059 | 80 | 237 | 2 | 2 | ||||||||||
| (0132) | (0073) | (0282) | ||||||||||||||||
| Food at Home | -0064 | 0754 | 0741 | 053 | 80 | 216 | 1 | 0 | ||||||||||
| (0049) | (0116) | (0338) | ||||||||||||||||
| Energy | -0678 | -0305 | 10270 | 049 | 80 | 198 | 2 | 0 | ||||||||||
| (1085) | (0114) | (2053) |
| Major CPI Components | Summary Statistics | Categorization | |||||||||||||||
| Mean | Standard Deviation | Relative Importance (2017Q4) | Change in Relative Importantce | CPI Excluding Food and Energy | Sticky CPI | Probability (= Median CPI) (1998-2007) | |||||||||||
| 1 | 2 | 3 | 4 | 5 | 6 | 7 | |||||||||||
| Core (XFE) Services | |||||||||||||||||
| Owners Equivalent of Rent (OER) | 27 | 11 | 232 | 298 | Y | Y | 52 | ||||||||||
| Rent of Primary Residence | 32 | 11 | 79 | 101 | Y | Y | 5 | ||||||||||
| Medical Care Services | 38 | 13 | 67 | 233 | Y | Y | 2 | ||||||||||
| Education Services | 49 | 15 | 30 | 058 | Y | Y | 0 | ||||||||||
| Transportation Services | 27 | 18 | 60 | -105 | Y | Y | 5 | ||||||||||
| Core (XFE) Goods | |||||||||||||||||
| Apparel | -03 | 25 | 31 | -189 | Y | N | 2 | ||||||||||
| New Vehicles | 01 | 23 | 36 | -142 | Y | N | 3 | ||||||||||
| Used Cars and Trucks | -03 | 8 | 21 | 020 | Y | N | 0 | ||||||||||
| Medical Care Goods | 29 | 16 | 18 | 059 | Y | Y | 1 | ||||||||||
| Food and Energy | |||||||||||||||||
| Food away from Home | 28 | 09 | 59 | 019 | N | Y | 11 | ||||||||||
| Food at Home | 21 | 27 | 77 | -201 | N | N | 6 | ||||||||||
| Energy | 36 | 202 | 75 | 078 | N | N | 1 | ||||||||||
| Unemployment Gap | Lagged Inflation | Constant | Adjusted R2 | Observations | Durbin-Watson Statistic | |||||||||
| PCE Services Less Energy | -014 | 032 | 191 | 046 | 83 | 185 | ||||||||
| (000) | (001) | (035) | ||||||||||||
| PCE Housing Services | -023 | 058 | 129 | 080 | 83 | 208 | ||||||||
| (000) | (000) | (024) | ||||||||||||
| CPI-U Owners Equivalent of Rent | -021 | 062 | 113 | 078 | 83 | 171 | ||||||||
| (000) | (000) | (024) | ||||||||||||
| CPI-U Rent of Primary Residence | -015 | 067 | 116 | 084 | 83 | 217 | ||||||||
| (000) | (000) | (026) | ||||||||||||
| PCE Health Care Services | -006 | 062 | 092 | 042 | 83 | 207 | ||||||||
| (038) | (000) | (026) | ||||||||||||
| PCE Services Less Energy Rent of Shelter amp Health care | -004 | 035 | 172 | 038 | 83 | 226 | ||||||||
| (050) | (000) | (028) | ||||||||||||
| CPI-U Services Less Energy Services amp Rent of Shelter | -015 | 040 | 188 | 034 | 83 | 218 | ||||||||
| (001) | (000) | (040) | ||||||||||||
| CPI-U Medical Care Services | -005 | 070 | 115 | 034 | 83 | 201 | ||||||||
| (051) | (000) | (045) | ||||||||||||
| CPI-U Food away from Home | -009 | 062 | 105 | 057 | 83 | 264 | ||||||||
| (005) | (000) | (025) | ||||||||||||
| CPI-U Education Services | -007 | 093 | 030 | 081 | 83 | 202 | ||||||||
| (016) | (000) | (029) | ||||||||||||
| CPI-U Transportation Services | -002 | -011 | 320 | 016 | 83 | 198 | ||||||||
| (087) | (027) | (036) | ||||||||||||
| Unemployment Gap | Lagged Inflation | Constant | Adjusted R2 | Observations | Durbin-Watson Statistic | |||||||||
| PCE Durable Goods | 008 | 028 | -154 | 027 | 83 | 183 | ||||||||
| (031) | (001) | (024) | ||||||||||||
| PCE Motor Vehicles and Parts | 031 | 030 | -021 | 043 | 83 | 178 | ||||||||
| (005) | (000) | (025) | ||||||||||||
| PCE Video Audio Photo amp | 016 | 060 | -395 | 044 | 83 | 222 | ||||||||
| Information Processing Equipment amp Media | (034) | (000) | (087) | |||||||||||
| PCE Other Durable Goods (including Medical Equipments) | -010 | 038 | -050 | 027 | 83 | 188 | ||||||||
| (028) | (000) | (019) | ||||||||||||
| PCE Nondurable Goods Less Energy | -014 | 073 | 039 | 044 | 83 | 203 | ||||||||
| (005) | (000) | (017) | ||||||||||||
| PCE Food amp Beverage Purchased for Off-Premises Consumption | -024 | 066 | 071 | 055 | 83 | 226 | ||||||||
| (004) | (000) | (024) | ||||||||||||
| CPI-U Food at Home | -027 | 063 | 082 | 052 | 83 | 216 | ||||||||
| (005) | (000) | (028) | ||||||||||||
| CPI-U Alcoholic Beverages | -017 | 034 | 147 | 016 | 83 | 209 | ||||||||
| (004) | (000) | (026) | ||||||||||||
| PCE Pharmaceutical amp Other Medical Products | -002 | 033 | 202 | 020 | 83 | 173 | ||||||||
| (088) | (000) | (039) | ||||||||||||
| PCE Other Nondurable Goods | 008 | 025 | 000 | 042 | 83 | 179 | ||||||||
| (046) | (001) | (018) | ||||||||||||
| CPI-U Apparel | 054 | 014 | -069 | 022 | 83 | 191 | ||||||||
| (000) | (018) | (030) | ||||||||||||
1
CBO
Inflation 1948ndash2018
2
CBO
Inflation Expectations 1948ndash2018
3
CBO
Unemployment 1948ndash2018
4
CBO
This flow chart shows the structure of CBOrsquos inflation model for the PCEPI as well as the spending shares for its components Those components include PCNFOOD Food amp Beverage Purchases for Off-Premises Consumption PCNENERGY Gasoline amp Other Energy Goods PCSENERGY Electricity and Gas PCDELEC Video Audio Photo amp Info Processing Equipment amp Media PCDMVAP Motor Vehicles amp Parts PCDMED Therapeutic Appliances amp Equipment PCDOTH Other Durable Goods (CBOrsquos calculation) PCNMED Pharmaceutical amp Other Medical Products PCNOTH Other Nondurable Goods (CBOrsquos calculation) PCSHOUS Housing PCSMED Health Care Services and PCSOTH Other Services (CBOrsquos calculation)
Structure of CBOrsquos Model for the Personal Consumption Expenditures (PCE) Price Index
5
CBO
120587120587119905119905= 119864119864119905119905120587120587119905119905+1 minus 120631120631 119880119880119905119905 minus 119880119880lowast + 120574120574119885119885119905119905 + 120598120598119905119905
Determinants of inflationndash 119864119864119905119905120587120587119905119905+1 Inflation expectationsndash 120573120573 119880119880119905119905 minus 119880119880lowast Unemployment gap or other measures of slack in the economyndash 120574120574119885119885119905119905 Supply-side shocks (for example relative price of imports energy etc)
Issue 1 Cyclical sensitivity of inflationndash For the price index of personal consumption expenditures (PCEPI) excluding food
and energy (ldquoXFErdquo or ldquocore-XFErdquo) 120573120573 has declined from 03~04 in the 1970s to 005~01 in the most recent decades
ndash Does inflation still respond to slack
Issue 2 The form of inflation expectationsndash ldquoAccelerationistrdquo 119864119864119905119905120587120587119905119905+1= 119860119860 119871119871 120587120587119905119905minus1 (distributed lags of inflation)ndash ldquoAnchoredrdquo 119864119864119905119905120587120587119905119905+1= 120587120587lowast (constant)ndash Combined 119864119864119905119905120587120587119905119905+1=120630120630119860119860(119871119871)120587120587119905119905minus1 + (120783120783 minus 120630120630)120587120587lowast
Expectation-Augmented Phillips Curve
6
CBO
Cyclical Sensitivity of InflationGoods Versus Services
7
CBO
Goal Understanding why the aggregate Phillips curve is so flat
Method Estimating Phillips curve equations at the component levelndash Measure of slack The unemployment gap (CBOrsquos estimate)ndash Sample 1998Q1ndash2018Q3 (stable inflation expectations)ndash Control for Relative price of imports and energy goods outliers (for example ldquocash
for clunkersrdquo)ndash Similar to Stock and Watson (2018) Struyven (2017)
Main Finding Divergence between goods and services in terms of cyclical sensitivity
ndash Services Remained largely pro-cyclicalmdashfor example shelterndash Goods Not pro-cyclical in the past two decades
Dampening the slope of the aggregate Phillips curve Exception Food prices
Phillips Curve Model at the Component Level
8
CBO
Shelter Inflation
9
CBO
Auto Inflation
10
CBO
Services Largely Pro-Cyclical
Unemployment Gap
Lagged Inflation Constant Adjusted R2
PCE Services Less Energy -014 032 191 046(000) (001) (035)
PCE Housing Services -023 058 129 080(000) (000) (024)
CPI-U Owners Equivalent of Rent -021 062 113 078(000) (000) (024)
CPI-U Rent of Primary Residence -015 067 116 084(000) (000) (026)
PCE Health Care Services -006 062 092 042(038) (000) (026)
PCE Services Less Energy Rent of Shelter amp Health care -004 035 172 038(050) (000) (028)
CPI-U Services Less Energy Services amp Rent of Shelter -015 040 188 034(001) (000) (040)
CPI-U Medical Care Services -005 070 115 034(051) (000) (045)
CPI-U Food away from Home -009 062 105 057(005) (000) (025)
CPI-U Education Services -007 093 030 081(016) (000) (029)
CPI-U Transportation Services -002 -011 320 016(087) (027) (036)
Percent of Expenditures
11
CBO
Goods Largely Not Pro-Cyclical Except Food
Unemployment Gap
Lagged Inflation Constant Adjusted R2
PCE Durable Goods 008 028 -154 027(031) (001) (024)
PCE Motor Vehicles and Parts 031 030 -021 043(005) (000) (025)
PCE Video Audio Photo amp 016 060 -395 044 Information Processing Equipment amp Media (034) (000) (087)
PCE Other Durable Goods (including Medical Equipments) -010 038 -050 027(028) (000) (019)
PCE Nondurable Goods Less Energy -014 073 039 044(005) (000) (017)
PCE Food amp Beverage Purchased for Off-Premises Consumpt -024 066 071 055(004) (000) (024)
CPI-U Food at Home -027 063 082 052(005) (000) (028)
CPI-U Alcoholic Beverages -017 034 147 016(004) (000) (026)
PCE Pharmaceutical amp Other Medical Products -002 033 202 020(088) (000) (039)
PCE Other Nondurable Goods 008 025 000 042(046) (001) (018)
CPI-U Apparel 054 014 -069 022(000) (018) (030)
Percent of Expenditures
12
CBO
Servicesndash Prices are largely determined by domestic andor local factors
Household maintenance restaurants etcndash Cannot be inventoried
Goodsndash Lots of measurement issues and noise from one-off price shocks (Stock and
Watson 2018) Measurement issue very severe for apparel recreational goods financial
services etc One-off price shocks ldquocash for clunkersrdquo (2009) federal tobacco tax hike
(2009) ndash Tend to be more heavily influenced by long-run structural forces
Globalization Abdih et al (2016) and others ldquoThe Amazon effectrdquo Goolsbee and Klenow (2018) Increasing industrial concentration
Goods Versus Services Possible Explanations
13
CBO
Services Componentsndash Generally Phillips curve equations at the component level work relatively wellndash Special case PCE health care services (policy plays a large role)
CBOrsquos model incorporates CBOrsquos projection of Medicare reimbursement rate growth
Goods Componentsndash ldquoTop-down Approachrdquo CBO currently uses core PCE inflation (from the
aggregate Phillips curve) as an input in the equations for goods components Keep track of movements in relative prices Judgment in sector-specific trends Control for relative price of imports one-off price shocks etc
Forecasting Inflation at the Component Level
14
CBO
Modeling Inflation ExpectationsBackward-Looking Versus Anchored
15
CBO
Reduced-form
120587120587119905119905= 120630120630119860119860(119871119871)120587120587119905119905minus1 + (120783120783 minus 120630120630)120587120587lowast minus 120573120573 119880119880119905119905 minus 119880119880119905119905lowast + 120574120574119885119885119905119905 + 120598120598119905119905o 119860119860(119871119871)120587120587119905119905minus1 Use four lags of past inflationo 120587120587lowast Long-run inflationldquoanchorrdquoo 119880119880119905119905 minus 119880119880119905119905lowast The unemployment gap (CBOrsquos estimate)o 119885119885119905119905 Supply-side shocks including relative prices of imports and energy goodso Sample 1998Q1ndash2018Q3
Blanchard (2016) ldquoThe Phillips Curve Back to the rsquo60srdquo ndash Shows 120630120630 declined over time and is currently very small for headline CPI
But component-level analysis implies that the measure of inflation matters
This exercise Try ten different measures of aggregate inflation
Estimating the Aggregate Phillips Curve
16
CBO
Three measures of headline inflationndash Headline CPI-U (BLS) and Headline PCEPI (BEA) ndash Chained CPI-U (BLS)
Ten Measures of Inflation
17
CBO
Seven measures of core inflationndash Approach 1 Remove the most volatile price changes
XFE CPI-U (BLS) and XFE PCEPI (BEA) Median CPI-U and 16-Trimmed-Mean CPI-U (Federal Reserve Bank of
Cleveland) Rank price changes by size each month and trim the items with price
changes that are above or below a certain threshold ldquoMedianrdquo is just extreme trimming
Trimmed-Mean PCEPI (Federal Reserve Bank of Dallas) Trimming point chosen optimally every month
ndash Approach 2 Remove the most frequent price changes Sticky CPI-U and Sticky-XFE CPI (Federal Reserve Bank of Atlanta)
Price changes every 43 months or longer (Bils and Klenow 2004)
Ten Measures of Inflation (Continued)
18
CBO
Seven Measures of Core Inflation
19
CBO
Relative weight of lagged inflation and constantldquoanchorrdquondash Overall inflation 120572120572 asymp 02 consistent with Blanchard (2016) for headline CPI
Estimation Results I
This figure plots the sum of the estimated coefficients on lagged inflation terms using recursive samples that start in 1998Q1 and end in 2012Q1 2012Q2 hellip and 2018Q1 The Phillips curve equations are ldquounrestrictedrdquo as no assumption was imposed on the value of π before the estimation Instead the intercept of the equation which in theory equals απ was estimated and then the values of α and π were calculated by assuming the long-run restriction on the estimated coefficients
20
CBO
Relative weight of lagged inflation and constantldquoanchorrdquondash Overall inflation 120572120572 asymp 02 consistent with Blanchard (2016) for headline CPIndash Core inflation 120572120572 asymp 05 particularly for non-XFE measures
Estimation Results I (Continued)
This figure plots the sum of the estimated coefficients on lagged inflation terms using recursive samples that start in 1998Q1 and end in 2012Q1 2012Q2 hellip and 2018Q1 The Phillips curve equations are ldquounrestrictedrdquo as no assumption was imposed on the value of π before the estimation Instead the intercept of the equation which in theory equals απ was estimated and then the values of α and π were calculated by assuming the long-run restriction on the estimated coefficients
21
CBO
Further analysis using survey measures of inflation expectations suggests
Inflation expectations by consumers matter more for inflation dynamics than the expectations by professional forecasters for all ten measures of inflation
ndash Consumersrsquo expectations more closely resemble those of firms (Coibion and Gorodnichenko 2015)
ndash Transmission of professional forecastersrsquo views to consumers is weak in a low-inflation environment
ndash Coibion et al (2017) Similar finding for headline CPI
Long-run inflation expectations by consumers are ldquoshock-anchoredrdquo but not ldquolevel-anchoredrdquo (Ball and Mazumder 2011)
ndash Shock-anchoring Transitory shocks not passed to expectationsndash Level-anchoring Expectations tied to a particular level
Estimation Results I (Continued)
22
CBO
Comparing measures of core inflationndash The Phillips curve fits the non-XFE measures very well
Average adj 1198771198772 of non-XFE measures = 07 Ball and Mazumder (2014) Showed this for median CPI
ndash XFEs are ldquooutliersrdquo particularly XFE CPI-U (low 120572120572 and low 1198771198772) Average adj 1198771198772 of XFE measures = 025
Possible explanationndash Fewer goods prices in the non-XFE core measures
Goods price changes are more volatile Goods price changes occur more frequently
Estimation Results II
23
CBO
CPI Components Summary Statistics and Categorization
Mean Standard Deviation
Relative Importance
(2017)
Change in Relative
Importantce 2007-2017
XFE Sticky CPIProbability
(= Median CPI) (1998-2007)
(1) (2) (3) (4) (5) (6) (7)
Core (XFE) ServicesOwners Equivalent of Rent (OER) 27 11 232 298 Y Y 52Rent of Primary Residence 32 11 79 101 Y Y 5Medical Care Services 38 13 67 233 Y Y 2Education Services 49 15 30 058 Y Y 0Transportation Services 27 18 60 -105 Y Y 5
Core (XFE) GoodsApparel -03 25 31 -189 Y N 2New Vehicles 01 23 36 -142 Y N 3Used Cars and Trucks -03 8 21 020 Y N 0Medical Care Goods 29 16 18 059 Y Y 1
Food and EnergyFood away from Home 28 09 59 019 N Y 11Food at Home 21 27 77 -201 N N 6Energy 36 202 75 078 N N 1
CategorizationSummary Statistics
Major CPI Components
The categorization of components into sticky CPI is based on Bryan and Meyer (2010) ldquoAre Some Prices in the CPI More Forward Looking Than Others We Think Sordquo Economic Commentary Federal Reserve Bank of Cleveland httpswwwfrbatlantaorg-mediadocumentsresearchinflationprojectstickypricesticky-price-cpi-supplemental-readingpdf The probabilities of a componentrsquos being the median CPI are based on the ldquorevised methodologyrdquo that split the OER into four regional components For more detail see httpswwwclevelandfedorgenour-researchindicators-and-datamedian-cpirevised-methodologyaspx
Percent of Expenditures
24
CBO
The slope of the Phillips curve Flat but steeper for CPIs than PCEPIsndash 120573120573 = 005∿01 for PCEPIs but = 01∿02 for CPIsndash Why Shelter the most cyclically sensitive component has a much larger weight in CPI than in PCEPI
Estimation Results III
This figure plots the sum of the estimated coefficients on lagged inflation terms using recursive samples that start in 1998Q1 and end in 2012Q1 2012Q2 hellip and 2018Q1 The Phillips curve equations are ldquounrestrictedrdquo as no assumption was imposed on the value of π before the estimation Instead the intercept of the equation which in theory equals απ was estimated and then the values of α and π were calculated by assuming the long-run restriction on the estimated coefficients
25
CBO
The slope of the Phillips curve Flat but steeper for CPIs than PCEPIsndash 120573120573 = 005∿01 for PCEPIs but = 01∿02 for CPIsndash Why Shelter the most cyclically sensitive component has a much larger weight in CPI than in PCEPI
Estimation Results III (Continued)
This figure plots the sum of the estimated coefficients on lagged inflation terms using recursive samples that start in 1998Q1 and end in 2012Q1 2012Q2 hellip and 2018Q1 The Phillips curve equations are ldquounrestrictedrdquo as no assumption was imposed on the value of π before the estimation Instead an intercept of the equation which in theory equals απ was estimated and then the value of α and π were calculated by assuming the long-run restriction on the estimated coefficients
26
CBO
Reviewing the Findings
27
CBO
Phillips-curve analysis at the component level provides insight intondash Cyclical sensitivity of aggregate inflation
For most service components and food inflation process is pro-cyclical For most non-food good components inflation process is not pro-cyclical
Need better understanding and models for goods price inflationndash Difference in the behaviors of various inflation measures
CPI is more cyclically sensitive than PCEPI because shelter has larger share in CPI
Non-XFE measures of core inflation better capture movements in trend inflation because they contain fewer noisy goods components
The aggregate Phillips curve has shifted away from ldquoaccelerationistrdquo toward an ldquoanchoredrdquo form but the process appears incomplete
ndash Need better understanding of the formation process of inflation expectations particularly those of consumers and firms
Conclusions
28
CBO
Abdih Yasser Ravi Balakrishnan and Baoping Shang ldquoWhat Is Keeping US Core Inflation Low Insights From a Bottom-Up Approachrdquo International Monetary Fund 2016
Ball Laurence and Sandeep Mazumder ldquoInflation Dynamics and the Great Recessionrdquo Brookings Papers on Economic Activity (2011) 337ndash406
Blanchard Olivier ldquoThe Phillips Curve Back to the rsquo60s American Economic Review 1065 (2016) 31ndash34
Bils Mark and Peter J Klenow ldquoSome Evidence on the Importance of Sticky Pricesrdquo Journal of Political Economy 1125 (2004) 947ndash985
Coibion Olivier and Yuriy Gorodnichenko ldquoIs the Phillips Curve Alive and Well After All Inflation Expectations and the Missing Disinflationrdquo American Economic Journal Macroeconomics 71 (2015) 197ndash232
References
29
CBO
Coibion Olivier Yuriy Gorodnichenko and Rupal Kamdar ldquoThe Formation of Expectations Inflation and the Phillips Curverdquo No w23304 National Bureau of Economic Research 2017
Goolsbee Austan D and Peter J Klenow ldquoInternet Rising Prices Falling Measuring Inflation in a World of E-Commercerdquo AEA Papers and Proceedings Vol 108 2018
Stock J and Mark Watson ldquoSlack and Cyclically Sensitive Inflationrdquo ECB Forum on Central Banking Sintra Portugal 2018
Struyven Dann ldquoWhich Prices Still Respond to Slackrdquo Goldman Sachs Economics Research (October 31 2017)
References (Continued)
| Current vintage data | |||||||||||||||||||||||||||
| Dec-16 | Jan-17 | Feb-17 | Mar-17 | Apr-17 | May-17 | Jun-17 | Jul-17 | Aug-17 | Sep-17 | Oct-17 | Nov-17 | Dec-17 | |||||||||||||||
| Rose at 0-2 rate | 314 | 179 | 190 | 266 | 178 | 158 | 181 | 206 | 275 | 165 | 181 | 224 | 251 | ||||||||||||||
| Rose at 2-3 rate | 82 | 137 | 111 | 171 | 191 | 280 | 111 | 130 | 116 | 216 | 88 | 97 | 39 | ||||||||||||||
| Rose at 3-5 rate | 240 | 198 | 253 | 80 | 126 | 136 | 209 | 161 | 241 | 125 | 231 | 258 | 177 | ||||||||||||||
| Rose at 5-10 rate | 100 | 122 | 57 | 70 | 71 | 85 | 91 | 60 | 51 | 114 | 50 | 122 | 81 | ||||||||||||||
| Rose faster than 10 rate | 67 | 137 | 108 | 27 | 151 | 55 | 75 | 116 | 65 | 97 | 159 | 82 | 134 | ||||||||||||||
| 227 | 281 | 387 | 282 | 286 | 334 | 328 | 253 | 283 | 291 | 218 | 317 | ||||||||||||||||
| 212 | 172 | 215455310712 | 218771897151 | ||||||||||||||||||||||||
| 140 | 194 | 153949709569 | 74785941399 | ||||||||||||||||||||||||
| 177 | 157 | 175371335238 | 221799519999 | ||||||||||||||||||||||||
| 83 | 82 | 74591464835 | 84429446757 | ||||||||||||||||||||||||
| 90 | 94 | 92689863883 | 125100452725 | ||||||||||||||||||||||||
| 298 | 301 | 287942315763 | 275112741969 | ||||||||||||||||||||||||
| 2017Q1 | 2017Q2 | 2017Q3 | 2017Q4 | ||||||||||||||||||||||||
| Fell | 2983 | 3008 | 2879 | 2751 | |||||||||||||||||||||||
| Rose at 0-2 rate | 2118 | 1723 | 2155 | 2188 | |||||||||||||||||||||||
| Rose at 2-3 rate | 1396 | 1938 | 1539 | 748 | |||||||||||||||||||||||
| Rose at 3-5 rate | 1769 | 1573 | 1754 | 2218 | |||||||||||||||||||||||
| Rose at 5-10 rate | 829 | 821 | 746 | 844 | |||||||||||||||||||||||
| Rose faster than 10 rate | 905 | 937 | 927 | 1251 |
| Major Sectors | CPI | PCEPI | ||||
| Housing | 426 | 183 | ||||
| Health Care | 85 | 231 | ||||
| Food and Beverages | 146 | 137 | ||||
| Transportation | 153 | 90 | ||||
| Recreation | 57 | 89 | ||||
| Education and Communication | 70 | 46 | ||||
| Apparel | 30 | 29 | ||||
| Financial Services | 02 | 47 | ||||
| Other | 30 | 147 | ||||
| Total | 100 | 100 | ||||
| Data December 2016 |
| Naiumlve Phillips-Curve-Style Models (Sample 1998-2017) | |||||||||||||
| 8 | 9 | 10 | 11 | ||||||||||
| Variables | Constant | Lagged Inflation | Unemployment Gap | Adjusted R2 | Order of AR | Order of Lagged Rucgap | |||||||
| Owners Equivalent of Rent | 118 | 062 | -022 | 078 | 1 | 1 | |||||||
| (48) | (79) | -(40) | |||||||||||
| Rent of Primary Residence | 141 | 060 | -018 | 084 | 1 | 4 | |||||||
| (48) | (74) | -(33) | |||||||||||
| Medical Care Services | 131 | 067 | -007 | 032 | 2 | ||||||||
| (27) | (58) | -(09) | |||||||||||
| Education Services | 023 | 095 | -009 | 078 | 4 | 2 | |||||||
| (07) | (149) | -(16) | |||||||||||
| Transportation Services | 26 | 01 | -00 | 018 | 1 | 3 | |||||||
| (59) | (05) | -(02) | |||||||||||
| Apparel | -060 | 027 | 043 | 016 | 4 | 0 | |||||||
| -(19) | (15) | (23) | |||||||||||
| New Vehicles | -046 | 003 | 065 | 018 | 1 | 0 | |||||||
| -(17) | (03) | (39) | |||||||||||
| Used Cars and Trucks | -001 | 031 | 092 | 028 | 2 | 4 | |||||||
| -(00) | (35) | (19) | |||||||||||
| Medical Care Goods | 23 | 02 | -01 | 023 | 3 | ||||||||
| (51) | (14) | -(08) | |||||||||||
| Food away from Home | 116 | 060 | -008 | 050 | 1 | 2 | |||||||
| (40) | (62) | -(15) | |||||||||||
| Food at Home | 105 | 063 | -009 | 059 | 1 | ||||||||
| (37) | (86) | -(07) | |||||||||||
| Energy | 983 | -022 | -061 | 048 | 1 | ||||||||
| (48) | -(22) | -(06) | |||||||||||
| Unemployment Gap | Lagged Inflation | Constant | Adjusted R2 | Obs | Durbin-Watson Statistic | Order of Lagged Inflation | Order of Lagged Unemployment Gap | |||||||||||
| Services | ||||||||||||||||||
| Owners Equivalent of Rent | -021 | 062 | 113 | 078 | 83 | 171 | 1 | 1 | ||||||||||
| 000 | 000 | 024 | ||||||||||||||||
| Rent of Primary Residence | -015 | 067 | 116 | 084 | 83 | 217 | 1 | 5 | ||||||||||
| 000 | 000 | 026 | ||||||||||||||||
| Food away from Home | -008 | 061 | 108 | 057 | 83 | 251 | 2 | 2 | ||||||||||
| 007 | 000 | 025 | ||||||||||||||||
| Medical Care Services | -005 | 070 | 115 | 034 | 83 | 201 | 2 | 0 | ||||||||||
| 051 | 000 | 045 | ||||||||||||||||
| Education Services | -007 | 093 | 030 | 081 | 83 | 202 | 4 | 2 | ||||||||||
| 016 | 000 | 029 | ||||||||||||||||
| Transportation Services | -002 | -011 | 320 | 016 | 83 | 198 | 2 | 3 | ||||||||||
| 087 | 027 | 036 | ||||||||||||||||
| Goods | ||||||||||||||||||
| Apparel | 050 | 010 | -054 | 008 | 83 | 192 | 4 | 0 | ||||||||||
| 001 | 039 | 032 | ||||||||||||||||
| New Vehicles | 038 | 002 | -034 | 034 | 83 | 186 | 1 | 0 | ||||||||||
| 001 | 084 | 023 | ||||||||||||||||
| Used Cars and Trucks | 038 | 018 | -019 | 034 | 83 | 174 | 2 | 4 | ||||||||||
| 047 | 013 | 082 | ||||||||||||||||
| Food at Home | -005 | 065 | 103 | 057 | 83 | 237 | 1 | 0 | ||||||||||
| 072 | 000 | 027 | ||||||||||||||||
| Medical Care Goods | -005 | 046 | 169 | 056 | 83 | 196 | 3 | 0 | ||||||||||
| 053 | 000 | 028 | ||||||||||||||||
| Controlling Inflnm + Inflne | ||||||||||||||||||
| Unemployment Gap | Lagged Inflation | Constant | Adjusted R2 | Observations | Durbin-Watson Statistic | Order of Lagged Inflation | Order of Lagged Unemployment Gap | |||||||||||
| Owners Equivalent of Rent (OER) | -0212 | 0633 | 1120 | 077 | 80 | 179 | 1 | 1 | ||||||||||
| (0058) | (0082) | (0260) | ||||||||||||||||
| Rent of Primary Residence | -0171 | 0604 | 1395 | 084 | 80 | 201 | 1 | 5 | ||||||||||
| (0056) | (0085) | (0308) | ||||||||||||||||
| Medical Care Services | -0070 | 0693 | 1191 | 031 | 80 | 205 | 2 | 0 | ||||||||||
| (0083) | (0123) | (0514) | ||||||||||||||||
| Education Services | -0087 | 0947 | 0296 | 078 | 80 | 204 | 4 | 2 | ||||||||||
| (0055) | (0067) | (0354) | ||||||||||||||||
| Transportation Services | -0035 | 0154 | 2284 | 019 | 80 | 203 | 2 | 3 | ||||||||||
| (0130) | (0160) | (0485) | ||||||||||||||||
| Apparel | 0416 | 0305 | -0594 | 015 | 80 | 187 | 4 | 0 | ||||||||||
| (0187) | (0178) | (0327) | ||||||||||||||||
| New Vehicles | 0655 | 0021 | -0494 | 017 | 80 | 200 | 1 | 0 | ||||||||||
| (0169) | (0112) | (0287) | ||||||||||||||||
| Used Cars and Trucks | 0410 | 0215 | -0860 | 038 | 80 | 185 | 2 | 4 | ||||||||||
| (0535) | (0114) | (0902) | ||||||||||||||||
| Medical Care Goods | -0082 | 0202 | 2251 | 022 | 80 | 192 | 3 | 0 | ||||||||||
| (0105) | (0141) | (0458) | ||||||||||||||||
| Food away from Home | -0086 | 0613 | 1159 | 059 | 80 | 236 | 2 | 2 | ||||||||||
| (0132) | (0074) | (0302) | ||||||||||||||||
| Food at Home | -0065 | 0751 | 0781 | 053 | 80 | 216 | 1 | 0 | ||||||||||
| (0049) | (0116) | (0340) | ||||||||||||||||
| Energy | -0735 | 0068 | 2120 | 096 | 80 | 134 | 2 | 0 | ||||||||||
| (0311) | (0035) | (0651) | ||||||||||||||||
| Controlling Inflnm | ||||||||||||||||||
| Unemployment Gap | Lagged Inflation | Constant | Adjusted R2 | Observations | Durbin-Watson Statistic | Order of Lagged Inflation | Order of Lagged Unemployment Gap | |||||||||||
| Core (XFE) Services | ||||||||||||||||||
| Owners Equivalent of Rent (OER) | -0212 | 0632 | 1129 | 078 | 80 | 180 | 1 | 1 | ||||||||||
| (0058) | (0081) | (0257) | ||||||||||||||||
| Rent of Primary Residence | -0171 | 0605 | 1393 | 084 | 80 | 201 | 1 | 5 | ||||||||||
| (0055) | (0084) | (0302) | ||||||||||||||||
| Medical Care Services | -0068 | 0696 | 1189 | 032 | 80 | 205 | 2 | 0 | ||||||||||
| (0082) | (0122) | (0511) | ||||||||||||||||
| Education Services | -0087 | 0943 | 0287 | 078 | 80 | 201 | 4 | 2 | ||||||||||
| (0055) | (0067) | (0353) | ||||||||||||||||
| Transportation Services | -0030 | 0076 | 2602 | 017 | 80 | 202 | 2 | 3 | ||||||||||
| (0131) | (0152) | (0440) | ||||||||||||||||
| Apparel | 0426 | 0292 | -0544 | 016 | 80 | 189 | 4 | 0 | ||||||||||
| (0186) | (0176) | (0315) | ||||||||||||||||
| New Vehicles | 0658 | 0023 | -0436 | 017 | 80 | 196 | 1 | 0 | ||||||||||
| (0168) | (0112) | (0272) | ||||||||||||||||
| Used Cars and Trucks | 0399 | 0190 | -0322 | 036 | 80 | 171 | 2 | 4 | ||||||||||
| (0543) | (0115) | (0861) | ||||||||||||||||
| Medical Care Goods | -0080 | 0203 | 2289 | 022 | 80 | 193 | 3 | 0 | ||||||||||
| (0104) | (0140) | (0453) | ||||||||||||||||
| Food away from Home | -0090 | 0628 | 1038 | 059 | 80 | 237 | 2 | 2 | ||||||||||
| (0132) | (0073) | (0282) | ||||||||||||||||
| Food at Home | -0064 | 0754 | 0741 | 053 | 80 | 216 | 1 | 0 | ||||||||||
| (0049) | (0116) | (0338) | ||||||||||||||||
| Energy | -0678 | -0305 | 10270 | 049 | 80 | 198 | 2 | 0 | ||||||||||
| (1085) | (0114) | (2053) |
| Major CPI Components | Summary Statistics | Categorization | |||||||||||||||
| Mean | Standard Deviation | Relative Importance (2017) | Change in Relative Importantce 2007-2017 | XFE | Sticky CPI | Probability (= Median CPI) (1998-2007) | |||||||||||
| 1 | 2 | 3 | 4 | 5 | 6 | 7 | |||||||||||
| Core (XFE) Services | |||||||||||||||||
| Owners Equivalent of Rent (OER) | 27 | 11 | 232 | 298 | Y | Y | 52 | ||||||||||
| Rent of Primary Residence | 32 | 11 | 79 | 101 | Y | Y | 5 | ||||||||||
| Medical Care Services | 38 | 13 | 67 | 233 | Y | Y | 2 | ||||||||||
| Education Services | 49 | 15 | 30 | 058 | Y | Y | 0 | ||||||||||
| Transportation Services | 27 | 18 | 60 | -105 | Y | Y | 5 | ||||||||||
| Core (XFE) Goods | |||||||||||||||||
| Apparel | -03 | 25 | 31 | -189 | Y | N | 2 | ||||||||||
| New Vehicles | 01 | 23 | 36 | -142 | Y | N | 3 | ||||||||||
| Used Cars and Trucks | -03 | 8 | 21 | 020 | Y | N | 0 | ||||||||||
| Medical Care Goods | 29 | 16 | 18 | 059 | Y | Y | 1 | ||||||||||
| Food and Energy | |||||||||||||||||
| Food away from Home | 28 | 09 | 59 | 019 | N | Y | 11 | ||||||||||
| Food at Home | 21 | 27 | 77 | -201 | N | N | 6 | ||||||||||
| Energy | 36 | 202 | 75 | 078 | N | N | 1 | ||||||||||
| Unemployment Gap | Lagged Inflation | Constant | Adjusted R2 | Observations | Durbin-Watson Statistic | |||||||||
| PCE Services Less Energy | -014 | 032 | 191 | 046 | 83 | 185 | ||||||||
| (000) | (001) | (035) | ||||||||||||
| PCE Housing Services | -023 | 058 | 129 | 080 | 83 | 208 | ||||||||
| (000) | (000) | (024) | ||||||||||||
| CPI-U Owners Equivalent of Rent | -021 | 062 | 113 | 078 | 83 | 171 | ||||||||
| (000) | (000) | (024) | ||||||||||||
| CPI-U Rent of Primary Residence | -015 | 067 | 116 | 084 | 83 | 217 | ||||||||
| (000) | (000) | (026) | ||||||||||||
| PCE Health Care Services | -006 | 062 | 092 | 042 | 83 | 207 | ||||||||
| (038) | (000) | (026) | ||||||||||||
| PCE Services Less Energy Rent of Shelter amp Health care | -004 | 035 | 172 | 038 | 83 | 226 | ||||||||
| (050) | (000) | (028) | ||||||||||||
| CPI-U Services Less Energy Services amp Rent of Shelter | -015 | 040 | 188 | 034 | 83 | 218 | ||||||||
| (001) | (000) | (040) | ||||||||||||
| CPI-U Medical Care Services | -005 | 070 | 115 | 034 | 83 | 201 | ||||||||
| (051) | (000) | (045) | ||||||||||||
| CPI-U Food away from Home | -009 | 062 | 105 | 057 | 83 | 264 | ||||||||
| (005) | (000) | (025) | ||||||||||||
| CPI-U Education Services | -007 | 093 | 030 | 081 | 83 | 202 | ||||||||
| (016) | (000) | (029) | ||||||||||||
| CPI-U Transportation Services | -002 | -011 | 320 | 016 | 83 | 198 | ||||||||
| (087) | (027) | (036) | ||||||||||||
| Unemployment Gap | Lagged Inflation | Constant | Adjusted R2 | Observations | Durbin-Watson Statistic | |||||||||
| PCE Durable Goods | 008 | 028 | -154 | 027 | 83 | 183 | ||||||||
| (031) | (001) | (024) | ||||||||||||
| PCE Motor Vehicles and Parts | 031 | 030 | -021 | 043 | 83 | 178 | ||||||||
| (005) | (000) | (025) | ||||||||||||
| PCE Video Audio Photo amp | 016 | 060 | -395 | 044 | 83 | 222 | ||||||||
| Information Processing Equipment amp Media | (034) | (000) | (087) | |||||||||||
| PCE Other Durable Goods (including Medical Equipments) | -010 | 038 | -050 | 027 | 83 | 188 | ||||||||
| (028) | (000) | (019) | ||||||||||||
| PCE Nondurable Goods Less Energy | -014 | 073 | 039 | 044 | 83 | 203 | ||||||||
| (005) | (000) | (017) | ||||||||||||
| PCE Food amp Beverage Purchased for Off-Premises Consumption | -024 | 066 | 071 | 055 | 83 | 226 | ||||||||
| (004) | (000) | (024) | ||||||||||||
| CPI-U Food at Home | -027 | 063 | 082 | 052 | 83 | 216 | ||||||||
| (005) | (000) | (028) | ||||||||||||
| CPI-U Alcoholic Beverages | -017 | 034 | 147 | 016 | 83 | 209 | ||||||||
| (004) | (000) | (026) | ||||||||||||
| PCE Pharmaceutical amp Other Medical Products | -002 | 033 | 202 | 020 | 83 | 173 | ||||||||
| (088) | (000) | (039) | ||||||||||||
| PCE Other Nondurable Goods | 008 | 025 | 000 | 042 | 83 | 179 | ||||||||
| (046) | (001) | (018) | ||||||||||||
| CPI-U Apparel | 054 | 014 | -069 | 022 | 83 | 191 | ||||||||
| (000) | (018) | (030) | ||||||||||||
| Current vintage data | |||||||||||||||||||||||||||
| Dec-16 | Jan-17 | Feb-17 | Mar-17 | Apr-17 | May-17 | Jun-17 | Jul-17 | Aug-17 | Sep-17 | Oct-17 | Nov-17 | Dec-17 | |||||||||||||||
| Rose at 0-2 rate | 314 | 179 | 190 | 266 | 178 | 158 | 181 | 206 | 275 | 165 | 181 | 224 | 251 | ||||||||||||||
| Rose at 2-3 rate | 82 | 137 | 111 | 171 | 191 | 280 | 111 | 130 | 116 | 216 | 88 | 97 | 39 | ||||||||||||||
| Rose at 3-5 rate | 240 | 198 | 253 | 80 | 126 | 136 | 209 | 161 | 241 | 125 | 231 | 258 | 177 | ||||||||||||||
| Rose at 5-10 rate | 100 | 122 | 57 | 70 | 71 | 85 | 91 | 60 | 51 | 114 | 50 | 122 | 81 | ||||||||||||||
| Rose faster than 10 rate | 67 | 137 | 108 | 27 | 151 | 55 | 75 | 116 | 65 | 97 | 159 | 82 | 134 | ||||||||||||||
| 227 | 281 | 387 | 282 | 286 | 334 | 328 | 253 | 283 | 291 | 218 | 317 | ||||||||||||||||
| 212 | 172 | 215455310712 | 218771897151 | ||||||||||||||||||||||||
| 140 | 194 | 153949709569 | 74785941399 | ||||||||||||||||||||||||
| 177 | 157 | 175371335238 | 221799519999 | ||||||||||||||||||||||||
| 83 | 82 | 74591464835 | 84429446757 | ||||||||||||||||||||||||
| 90 | 94 | 92689863883 | 125100452725 | ||||||||||||||||||||||||
| 298 | 301 | 287942315763 | 275112741969 | ||||||||||||||||||||||||
| 2017Q1 | 2017Q2 | 2017Q3 | 2017Q4 | ||||||||||||||||||||||||
| Fell | 2983 | 3008 | 2879 | 2751 | |||||||||||||||||||||||
| Rose at 0-2 rate | 2118 | 1723 | 2155 | 2188 | |||||||||||||||||||||||
| Rose at 2-3 rate | 1396 | 1938 | 1539 | 748 | |||||||||||||||||||||||
| Rose at 3-5 rate | 1769 | 1573 | 1754 | 2218 | |||||||||||||||||||||||
| Rose at 5-10 rate | 829 | 821 | 746 | 844 | |||||||||||||||||||||||
| Rose faster than 10 rate | 905 | 937 | 927 | 1251 |
| Major Sectors | CPI | PCEPI | ||||
| Housing | 426 | 183 | ||||
| Health Care | 85 | 231 | ||||
| Food and Beverages | 146 | 137 | ||||
| Transportation | 153 | 90 | ||||
| Recreation | 57 | 89 | ||||
| Education and Communication | 70 | 46 | ||||
| Apparel | 30 | 29 | ||||
| Financial Services | 02 | 47 | ||||
| Other | 30 | 147 | ||||
| Total | 100 | 100 | ||||
| Data December 2016 |
| Naiumlve Phillips-Curve-Style Models (Sample 1998-2017) | |||||||||||||
| 8 | 9 | 10 | 11 | ||||||||||
| Variables | Constant | Lagged Inflation | Unemployment Gap | Adjusted R2 | Order of AR | Order of Lagged Rucgap | |||||||
| Owners Equivalent of Rent | 118 | 062 | -022 | 078 | 1 | 1 | |||||||
| (48) | (79) | -(40) | |||||||||||
| Rent of Primary Residence | 141 | 060 | -018 | 084 | 1 | 4 | |||||||
| (48) | (74) | -(33) | |||||||||||
| Medical Care Services | 131 | 067 | -007 | 032 | 2 | ||||||||
| (27) | (58) | -(09) | |||||||||||
| Education Services | 023 | 095 | -009 | 078 | 4 | 2 | |||||||
| (07) | (149) | -(16) | |||||||||||
| Transportation Services | 26 | 01 | -00 | 018 | 1 | 3 | |||||||
| (59) | (05) | -(02) | |||||||||||
| Apparel | -060 | 027 | 043 | 016 | 4 | 0 | |||||||
| -(19) | (15) | (23) | |||||||||||
| New Vehicles | -046 | 003 | 065 | 018 | 1 | 0 | |||||||
| -(17) | (03) | (39) | |||||||||||
| Used Cars and Trucks | -001 | 031 | 092 | 028 | 2 | 4 | |||||||
| -(00) | (35) | (19) | |||||||||||
| Medical Care Goods | 23 | 02 | -01 | 023 | 3 | ||||||||
| (51) | (14) | -(08) | |||||||||||
| Food away from Home | 116 | 060 | -008 | 050 | 1 | 2 | |||||||
| (40) | (62) | -(15) | |||||||||||
| Food at Home | 105 | 063 | -009 | 059 | 1 | ||||||||
| (37) | (86) | -(07) | |||||||||||
| Energy | 983 | -022 | -061 | 048 | 1 | ||||||||
| (48) | -(22) | -(06) | |||||||||||
| Unemployment Gap | Lagged Inflation | Constant | Adjusted R2 | Obs | Durbin-Watson Statistic | Order of Lagged Inflation | Order of Lagged Unemployment Gap | |||||||||||
| Services | ||||||||||||||||||
| Owners Equivalent of Rent | -021 | 062 | 113 | 078 | 83 | 171 | 1 | 1 | ||||||||||
| 000 | 000 | 024 | ||||||||||||||||
| Rent of Primary Residence | -015 | 067 | 116 | 084 | 83 | 217 | 1 | 5 | ||||||||||
| 000 | 000 | 026 | ||||||||||||||||
| Food away from Home | -008 | 061 | 108 | 057 | 83 | 251 | 2 | 2 | ||||||||||
| 007 | 000 | 025 | ||||||||||||||||
| Medical Care Services | -005 | 070 | 115 | 034 | 83 | 201 | 2 | 0 | ||||||||||
| 051 | 000 | 045 | ||||||||||||||||
| Education Services | -007 | 093 | 030 | 081 | 83 | 202 | 4 | 2 | ||||||||||
| 016 | 000 | 029 | ||||||||||||||||
| Transportation Services | -002 | -011 | 320 | 016 | 83 | 198 | 2 | 3 | ||||||||||
| 087 | 027 | 036 | ||||||||||||||||
| Goods | ||||||||||||||||||
| Apparel | 050 | 010 | -054 | 008 | 83 | 192 | 4 | 0 | ||||||||||
| 001 | 039 | 032 | ||||||||||||||||
| New Vehicles | 038 | 002 | -034 | 034 | 83 | 186 | 1 | 0 | ||||||||||
| 001 | 084 | 023 | ||||||||||||||||
| Used Cars and Trucks | 038 | 018 | -019 | 034 | 83 | 174 | 2 | 4 | ||||||||||
| 047 | 013 | 082 | ||||||||||||||||
| Food at Home | -005 | 065 | 103 | 057 | 83 | 237 | 1 | 0 | ||||||||||
| 072 | 000 | 027 | ||||||||||||||||
| Medical Care Goods | -005 | 046 | 169 | 056 | 83 | 196 | 3 | 0 | ||||||||||
| 053 | 000 | 028 | ||||||||||||||||
| Controlling Inflnm + Inflne | ||||||||||||||||||
| Unemployment Gap | Lagged Inflation | Constant | Adjusted R2 | Observations | Durbin-Watson Statistic | Order of Lagged Inflation | Order of Lagged Unemployment Gap | |||||||||||
| Owners Equivalent of Rent (OER) | -0212 | 0633 | 1120 | 077 | 80 | 179 | 1 | 1 | ||||||||||
| (0058) | (0082) | (0260) | ||||||||||||||||
| Rent of Primary Residence | -0171 | 0604 | 1395 | 084 | 80 | 201 | 1 | 5 | ||||||||||
| (0056) | (0085) | (0308) | ||||||||||||||||
| Medical Care Services | -0070 | 0693 | 1191 | 031 | 80 | 205 | 2 | 0 | ||||||||||
| (0083) | (0123) | (0514) | ||||||||||||||||
| Education Services | -0087 | 0947 | 0296 | 078 | 80 | 204 | 4 | 2 | ||||||||||
| (0055) | (0067) | (0354) | ||||||||||||||||
| Transportation Services | -0035 | 0154 | 2284 | 019 | 80 | 203 | 2 | 3 | ||||||||||
| (0130) | (0160) | (0485) | ||||||||||||||||
| Apparel | 0416 | 0305 | -0594 | 015 | 80 | 187 | 4 | 0 | ||||||||||
| (0187) | (0178) | (0327) | ||||||||||||||||
| New Vehicles | 0655 | 0021 | -0494 | 017 | 80 | 200 | 1 | 0 | ||||||||||
| (0169) | (0112) | (0287) | ||||||||||||||||
| Used Cars and Trucks | 0410 | 0215 | -0860 | 038 | 80 | 185 | 2 | 4 | ||||||||||
| (0535) | (0114) | (0902) | ||||||||||||||||
| Medical Care Goods | -0082 | 0202 | 2251 | 022 | 80 | 192 | 3 | 0 | ||||||||||
| (0105) | (0141) | (0458) | ||||||||||||||||
| Food away from Home | -0086 | 0613 | 1159 | 059 | 80 | 236 | 2 | 2 | ||||||||||
| (0132) | (0074) | (0302) | ||||||||||||||||
| Food at Home | -0065 | 0751 | 0781 | 053 | 80 | 216 | 1 | 0 | ||||||||||
| (0049) | (0116) | (0340) | ||||||||||||||||
| Energy | -0735 | 0068 | 2120 | 096 | 80 | 134 | 2 | 0 | ||||||||||
| (0311) | (0035) | (0651) | ||||||||||||||||
| Controlling Inflnm | ||||||||||||||||||
| Unemployment Gap | Lagged Inflation | Constant | Adjusted R2 | Observations | Durbin-Watson Statistic | Order of Lagged Inflation | Order of Lagged Unemployment Gap | |||||||||||
| Core (XFE) Services | ||||||||||||||||||
| Owners Equivalent of Rent (OER) | -0212 | 0632 | 1129 | 078 | 80 | 180 | 1 | 1 | ||||||||||
| (0058) | (0081) | (0257) | ||||||||||||||||
| Rent of Primary Residence | -0171 | 0605 | 1393 | 084 | 80 | 201 | 1 | 5 | ||||||||||
| (0055) | (0084) | (0302) | ||||||||||||||||
| Medical Care Services | -0068 | 0696 | 1189 | 032 | 80 | 205 | 2 | 0 | ||||||||||
| (0082) | (0122) | (0511) | ||||||||||||||||
| Education Services | -0087 | 0943 | 0287 | 078 | 80 | 201 | 4 | 2 | ||||||||||
| (0055) | (0067) | (0353) | ||||||||||||||||
| Transportation Services | -0030 | 0076 | 2602 | 017 | 80 | 202 | 2 | 3 | ||||||||||
| (0131) | (0152) | (0440) | ||||||||||||||||
| Apparel | 0426 | 0292 | -0544 | 016 | 80 | 189 | 4 | 0 | ||||||||||
| (0186) | (0176) | (0315) | ||||||||||||||||
| New Vehicles | 0658 | 0023 | -0436 | 017 | 80 | 196 | 1 | 0 | ||||||||||
| (0168) | (0112) | (0272) | ||||||||||||||||
| Used Cars and Trucks | 0399 | 0190 | -0322 | 036 | 80 | 171 | 2 | 4 | ||||||||||
| (0543) | (0115) | (0861) | ||||||||||||||||
| Medical Care Goods | -0080 | 0203 | 2289 | 022 | 80 | 193 | 3 | 0 | ||||||||||
| (0104) | (0140) | (0453) | ||||||||||||||||
| Food away from Home | -0090 | 0628 | 1038 | 059 | 80 | 237 | 2 | 2 | ||||||||||
| (0132) | (0073) | (0282) | ||||||||||||||||
| Food at Home | -0064 | 0754 | 0741 | 053 | 80 | 216 | 1 | 0 | ||||||||||
| (0049) | (0116) | (0338) | ||||||||||||||||
| Energy | -0678 | -0305 | 10270 | 049 | 80 | 198 | 2 | 0 | ||||||||||
| (1085) | (0114) | (2053) |
| Major CPI Components | Summary Statistics | Categorization | |||||||||||||||
| Mean | Standard Deviation | Relative Importance (2017Q4) | Change in Relative Importantce | CPI Excluding Food and Energy | Sticky CPI | Probability (= Median CPI) (1998-2007) | |||||||||||
| 1 | 2 | 3 | 4 | 5 | 6 | 7 | |||||||||||
| Core (XFE) Services | |||||||||||||||||
| Owners Equivalent of Rent (OER) | 27 | 11 | 232 | 298 | Y | Y | 52 | ||||||||||
| Rent of Primary Residence | 32 | 11 | 79 | 101 | Y | Y | 5 | ||||||||||
| Medical Care Services | 38 | 13 | 67 | 233 | Y | Y | 2 | ||||||||||
| Education Services | 49 | 15 | 30 | 058 | Y | Y | 0 | ||||||||||
| Transportation Services | 27 | 18 | 60 | -105 | Y | Y | 5 | ||||||||||
| Core (XFE) Goods | |||||||||||||||||
| Apparel | -03 | 25 | 31 | -189 | Y | N | 2 | ||||||||||
| New Vehicles | 01 | 23 | 36 | -142 | Y | N | 3 | ||||||||||
| Used Cars and Trucks | -03 | 8 | 21 | 020 | Y | N | 0 | ||||||||||
| Medical Care Goods | 29 | 16 | 18 | 059 | Y | Y | 1 | ||||||||||
| Food and Energy | |||||||||||||||||
| Food away from Home | 28 | 09 | 59 | 019 | N | Y | 11 | ||||||||||
| Food at Home | 21 | 27 | 77 | -201 | N | N | 6 | ||||||||||
| Energy | 36 | 202 | 75 | 078 | N | N | 1 | ||||||||||
| Unemployment Gap | Lagged Inflation | Constant | Adjusted R2 | Observations | Durbin-Watson Statistic | |||||||||
| PCE Services Less Energy | -014 | 032 | 191 | 046 | 83 | 185 | ||||||||
| (000) | (001) | (035) | ||||||||||||
| PCE Housing Services | -023 | 058 | 129 | 080 | 83 | 208 | ||||||||
| (000) | (000) | (024) | ||||||||||||
| CPI-U Owners Equivalent of Rent | -021 | 062 | 113 | 078 | 83 | 171 | ||||||||
| (000) | (000) | (024) | ||||||||||||
| CPI-U Rent of Primary Residence | -015 | 067 | 116 | 084 | 83 | 217 | ||||||||
| (000) | (000) | (026) | ||||||||||||
| PCE Health Care Services | -006 | 062 | 092 | 042 | 83 | 207 | ||||||||
| (038) | (000) | (026) | ||||||||||||
| PCE Services Less Energy Rent of Shelter amp Health care | -004 | 035 | 172 | 038 | 83 | 226 | ||||||||
| (050) | (000) | (028) | ||||||||||||
| CPI-U Services Less Energy Services amp Rent of Shelter | -015 | 040 | 188 | 034 | 83 | 218 | ||||||||
| (001) | (000) | (040) | ||||||||||||
| CPI-U Medical Care Services | -005 | 070 | 115 | 034 | 83 | 201 | ||||||||
| (051) | (000) | (045) | ||||||||||||
| CPI-U Food away from Home | -009 | 062 | 105 | 057 | 83 | 264 | ||||||||
| (005) | (000) | (025) | ||||||||||||
| CPI-U Education Services | -007 | 093 | 030 | 081 | 83 | 202 | ||||||||
| (016) | (000) | (029) | ||||||||||||
| CPI-U Transportation Services | -002 | -011 | 320 | 016 | 83 | 198 | ||||||||
| (087) | (027) | (036) | ||||||||||||
| Unemployment Gap | Lagged Inflation | Constant | Adjusted R2 | Observations | Durbin-Watson Statistic | |||||||||
| PCE Durable Goods | 008 | 028 | -154 | 027 | 83 | 183 | ||||||||
| (031) | (001) | (024) | ||||||||||||
| PCE Motor Vehicles and Parts | 031 | 030 | -021 | 043 | 83 | 178 | ||||||||
| (005) | (000) | (025) | ||||||||||||
| PCE Video Audio Photo amp | 016 | 060 | -395 | 044 | 83 | 222 | ||||||||
| Information Processing Equipment amp Media | (034) | (000) | (087) | |||||||||||
| PCE Other Durable Goods (including Medical Equipments) | -010 | 038 | -050 | 027 | 83 | 188 | ||||||||
| (028) | (000) | (019) | ||||||||||||
| PCE Nondurable Goods Less Energy | -014 | 073 | 039 | 044 | 83 | 203 | ||||||||
| (005) | (000) | (017) | ||||||||||||
| PCE Food amp Beverage Purchased for Off-Premises Consumption | -024 | 066 | 071 | 055 | 83 | 226 | ||||||||
| (004) | (000) | (024) | ||||||||||||
| CPI-U Food at Home | -027 | 063 | 082 | 052 | 83 | 216 | ||||||||
| (005) | (000) | (028) | ||||||||||||
| CPI-U Alcoholic Beverages | -017 | 034 | 147 | 016 | 83 | 209 | ||||||||
| (004) | (000) | (026) | ||||||||||||
| PCE Pharmaceutical amp Other Medical Products | -002 | 033 | 202 | 020 | 83 | 173 | ||||||||
| (088) | (000) | (039) | ||||||||||||
| PCE Other Nondurable Goods | 008 | 025 | 000 | 042 | 83 | 179 | ||||||||
| (046) | (001) | (018) | ||||||||||||
| CPI-U Apparel | 054 | 014 | -069 | 022 | 83 | 191 | ||||||||
| (000) | (018) | (030) | ||||||||||||
| Current vintage data | |||||||||||||||||||||||||||
| Dec-16 | Jan-17 | Feb-17 | Mar-17 | Apr-17 | May-17 | Jun-17 | Jul-17 | Aug-17 | Sep-17 | Oct-17 | Nov-17 | Dec-17 | |||||||||||||||
| Rose at 0-2 rate | 314 | 179 | 190 | 266 | 178 | 158 | 181 | 206 | 275 | 165 | 181 | 224 | 251 | ||||||||||||||
| Rose at 2-3 rate | 82 | 137 | 111 | 171 | 191 | 280 | 111 | 130 | 116 | 216 | 88 | 97 | 39 | ||||||||||||||
| Rose at 3-5 rate | 240 | 198 | 253 | 80 | 126 | 136 | 209 | 161 | 241 | 125 | 231 | 258 | 177 | ||||||||||||||
| Rose at 5-10 rate | 100 | 122 | 57 | 70 | 71 | 85 | 91 | 60 | 51 | 114 | 50 | 122 | 81 | ||||||||||||||
| Rose faster than 10 rate | 67 | 137 | 108 | 27 | 151 | 55 | 75 | 116 | 65 | 97 | 159 | 82 | 134 | ||||||||||||||
| 227 | 281 | 387 | 282 | 286 | 334 | 328 | 253 | 283 | 291 | 218 | 317 | ||||||||||||||||
| 212 | 172 | 215455310712 | 218771897151 | ||||||||||||||||||||||||
| 140 | 194 | 153949709569 | 74785941399 | ||||||||||||||||||||||||
| 177 | 157 | 175371335238 | 221799519999 | ||||||||||||||||||||||||
| 83 | 82 | 74591464835 | 84429446757 | ||||||||||||||||||||||||
| 90 | 94 | 92689863883 | 125100452725 | ||||||||||||||||||||||||
| 298 | 301 | 287942315763 | 275112741969 | ||||||||||||||||||||||||
| 2017Q1 | 2017Q2 | 2017Q3 | 2017Q4 | ||||||||||||||||||||||||
| Fell | 2983 | 3008 | 2879 | 2751 | |||||||||||||||||||||||
| Rose at 0-2 rate | 2118 | 1723 | 2155 | 2188 | |||||||||||||||||||||||
| Rose at 2-3 rate | 1396 | 1938 | 1539 | 748 | |||||||||||||||||||||||
| Rose at 3-5 rate | 1769 | 1573 | 1754 | 2218 | |||||||||||||||||||||||
| Rose at 5-10 rate | 829 | 821 | 746 | 844 | |||||||||||||||||||||||
| Rose faster than 10 rate | 905 | 937 | 927 | 1251 |
| Major Sectors | CPI | PCEPI | ||||
| Housing | 426 | 183 | ||||
| Health Care | 85 | 231 | ||||
| Food and Beverages | 146 | 137 | ||||
| Transportation | 153 | 90 | ||||
| Recreation | 57 | 89 | ||||
| Education and Communication | 70 | 46 | ||||
| Apparel | 30 | 29 | ||||
| Financial Services | 02 | 47 | ||||
| Other | 30 | 147 | ||||
| Total | 100 | 100 | ||||
| Data December 2016 |
| Naiumlve Phillips-Curve-Style Models (Sample 1998-2017) | |||||||||||||
| 8 | 9 | 10 | 11 | ||||||||||
| Variables | Constant | Lagged Inflation | Unemployment Gap | Adjusted R2 | Order of AR | Order of Lagged Rucgap | |||||||
| Owners Equivalent of Rent | 118 | 062 | -022 | 078 | 1 | 1 | |||||||
| (48) | (79) | -(40) | |||||||||||
| Rent of Primary Residence | 141 | 060 | -018 | 084 | 1 | 4 | |||||||
| (48) | (74) | -(33) | |||||||||||
| Medical Care Services | 131 | 067 | -007 | 032 | 2 | ||||||||
| (27) | (58) | -(09) | |||||||||||
| Education Services | 023 | 095 | -009 | 078 | 4 | 2 | |||||||
| (07) | (149) | -(16) | |||||||||||
| Transportation Services | 26 | 01 | -00 | 018 | 1 | 3 | |||||||
| (59) | (05) | -(02) | |||||||||||
| Apparel | -060 | 027 | 043 | 016 | 4 | 0 | |||||||
| -(19) | (15) | (23) | |||||||||||
| New Vehicles | -046 | 003 | 065 | 018 | 1 | 0 | |||||||
| -(17) | (03) | (39) | |||||||||||
| Used Cars and Trucks | -001 | 031 | 092 | 028 | 2 | 4 | |||||||
| -(00) | (35) | (19) | |||||||||||
| Medical Care Goods | 23 | 02 | -01 | 023 | 3 | ||||||||
| (51) | (14) | -(08) | |||||||||||
| Food away from Home | 116 | 060 | -008 | 050 | 1 | 2 | |||||||
| (40) | (62) | -(15) | |||||||||||
| Food at Home | 105 | 063 | -009 | 059 | 1 | ||||||||
| (37) | (86) | -(07) | |||||||||||
| Energy | 983 | -022 | -061 | 048 | 1 | ||||||||
| (48) | -(22) | -(06) | |||||||||||
| Unemployment Gap | Lagged Inflation | Constant | Adjusted R2 | Obs | Durbin-Watson Statistic | Order of Lagged Inflation | Order of Lagged Unemployment Gap | |||||||||||
| Services | ||||||||||||||||||
| Owners Equivalent of Rent | -021 | 062 | 113 | 078 | 83 | 171 | 1 | 1 | ||||||||||
| 000 | 000 | 024 | ||||||||||||||||
| Rent of Primary Residence | -015 | 067 | 116 | 084 | 83 | 217 | 1 | 5 | ||||||||||
| 000 | 000 | 026 | ||||||||||||||||
| Food away from Home | -008 | 061 | 108 | 057 | 83 | 251 | 2 | 2 | ||||||||||
| 007 | 000 | 025 | ||||||||||||||||
| Medical Care Services | -005 | 070 | 115 | 034 | 83 | 201 | 2 | 0 | ||||||||||
| 051 | 000 | 045 | ||||||||||||||||
| Education Services | -007 | 093 | 030 | 081 | 83 | 202 | 4 | 2 | ||||||||||
| 016 | 000 | 029 | ||||||||||||||||
| Transportation Services | -002 | -011 | 320 | 016 | 83 | 198 | 2 | 3 | ||||||||||
| 087 | 027 | 036 | ||||||||||||||||
| Goods | ||||||||||||||||||
| Apparel | 050 | 010 | -054 | 008 | 83 | 192 | 4 | 0 | ||||||||||
| 001 | 039 | 032 | ||||||||||||||||
| New Vehicles | 038 | 002 | -034 | 034 | 83 | 186 | 1 | 0 | ||||||||||
| 001 | 084 | 023 | ||||||||||||||||
| Used Cars and Trucks | 038 | 018 | -019 | 034 | 83 | 174 | 2 | 4 | ||||||||||
| 047 | 013 | 082 | ||||||||||||||||
| Food at Home | -005 | 065 | 103 | 057 | 83 | 237 | 1 | 0 | ||||||||||
| 072 | 000 | 027 | ||||||||||||||||
| Medical Care Goods | -005 | 046 | 169 | 056 | 83 | 196 | 3 | 0 | ||||||||||
| 053 | 000 | 028 | ||||||||||||||||
| Controlling Inflnm + Inflne | ||||||||||||||||||
| Unemployment Gap | Lagged Inflation | Constant | Adjusted R2 | Observations | Durbin-Watson Statistic | Order of Lagged Inflation | Order of Lagged Unemployment Gap | |||||||||||
| Owners Equivalent of Rent (OER) | -0212 | 0633 | 1120 | 077 | 80 | 179 | 1 | 1 | ||||||||||
| (0058) | (0082) | (0260) | ||||||||||||||||
| Rent of Primary Residence | -0171 | 0604 | 1395 | 084 | 80 | 201 | 1 | 5 | ||||||||||
| (0056) | (0085) | (0308) | ||||||||||||||||
| Medical Care Services | -0070 | 0693 | 1191 | 031 | 80 | 205 | 2 | 0 | ||||||||||
| (0083) | (0123) | (0514) | ||||||||||||||||
| Education Services | -0087 | 0947 | 0296 | 078 | 80 | 204 | 4 | 2 | ||||||||||
| (0055) | (0067) | (0354) | ||||||||||||||||
| Transportation Services | -0035 | 0154 | 2284 | 019 | 80 | 203 | 2 | 3 | ||||||||||
| (0130) | (0160) | (0485) | ||||||||||||||||
| Apparel | 0416 | 0305 | -0594 | 015 | 80 | 187 | 4 | 0 | ||||||||||
| (0187) | (0178) | (0327) | ||||||||||||||||
| New Vehicles | 0655 | 0021 | -0494 | 017 | 80 | 200 | 1 | 0 | ||||||||||
| (0169) | (0112) | (0287) | ||||||||||||||||
| Used Cars and Trucks | 0410 | 0215 | -0860 | 038 | 80 | 185 | 2 | 4 | ||||||||||
| (0535) | (0114) | (0902) | ||||||||||||||||
| Medical Care Goods | -0082 | 0202 | 2251 | 022 | 80 | 192 | 3 | 0 | ||||||||||
| (0105) | (0141) | (0458) | ||||||||||||||||
| Food away from Home | -0086 | 0613 | 1159 | 059 | 80 | 236 | 2 | 2 | ||||||||||
| (0132) | (0074) | (0302) | ||||||||||||||||
| Food at Home | -0065 | 0751 | 0781 | 053 | 80 | 216 | 1 | 0 | ||||||||||
| (0049) | (0116) | (0340) | ||||||||||||||||
| Energy | -0735 | 0068 | 2120 | 096 | 80 | 134 | 2 | 0 | ||||||||||
| (0311) | (0035) | (0651) | ||||||||||||||||
| Controlling Inflnm | ||||||||||||||||||
| Unemployment Gap | Lagged Inflation | Constant | Adjusted R2 | Observations | Durbin-Watson Statistic | Order of Lagged Inflation | Order of Lagged Unemployment Gap | |||||||||||
| Core (XFE) Services | ||||||||||||||||||
| Owners Equivalent of Rent (OER) | -0212 | 0632 | 1129 | 078 | 80 | 180 | 1 | 1 | ||||||||||
| (0058) | (0081) | (0257) | ||||||||||||||||
| Rent of Primary Residence | -0171 | 0605 | 1393 | 084 | 80 | 201 | 1 | 5 | ||||||||||
| (0055) | (0084) | (0302) | ||||||||||||||||
| Medical Care Services | -0068 | 0696 | 1189 | 032 | 80 | 205 | 2 | 0 | ||||||||||
| (0082) | (0122) | (0511) | ||||||||||||||||
| Education Services | -0087 | 0943 | 0287 | 078 | 80 | 201 | 4 | 2 | ||||||||||
| (0055) | (0067) | (0353) | ||||||||||||||||
| Transportation Services | -0030 | 0076 | 2602 | 017 | 80 | 202 | 2 | 3 | ||||||||||
| (0131) | (0152) | (0440) | ||||||||||||||||
| Apparel | 0426 | 0292 | -0544 | 016 | 80 | 189 | 4 | 0 | ||||||||||
| (0186) | (0176) | (0315) | ||||||||||||||||
| New Vehicles | 0658 | 0023 | -0436 | 017 | 80 | 196 | 1 | 0 | ||||||||||
| (0168) | (0112) | (0272) | ||||||||||||||||
| Used Cars and Trucks | 0399 | 0190 | -0322 | 036 | 80 | 171 | 2 | 4 | ||||||||||
| (0543) | (0115) | (0861) | ||||||||||||||||
| Medical Care Goods | -0080 | 0203 | 2289 | 022 | 80 | 193 | 3 | 0 | ||||||||||
| (0104) | (0140) | (0453) | ||||||||||||||||
| Food away from Home | -0090 | 0628 | 1038 | 059 | 80 | 237 | 2 | 2 | ||||||||||
| (0132) | (0073) | (0282) | ||||||||||||||||
| Food at Home | -0064 | 0754 | 0741 | 053 | 80 | 216 | 1 | 0 | ||||||||||
| (0049) | (0116) | (0338) | ||||||||||||||||
| Energy | -0678 | -0305 | 10270 | 049 | 80 | 198 | 2 | 0 | ||||||||||
| (1085) | (0114) | (2053) |
| Major CPI Components | Summary Statistics | Categorization | |||||||||||||||
| Mean | Standard Deviation | Relative Importance (2017Q4) | Change in Relative Importantce | CPI Excluding Food and Energy | Sticky CPI | Probability (= Median CPI) (1998-2007) | |||||||||||
| 1 | 2 | 3 | 4 | 5 | 6 | 7 | |||||||||||
| Core (XFE) Services | |||||||||||||||||
| Owners Equivalent of Rent (OER) | 27 | 11 | 232 | 298 | Y | Y | 52 | ||||||||||
| Rent of Primary Residence | 32 | 11 | 79 | 101 | Y | Y | 5 | ||||||||||
| Medical Care Services | 38 | 13 | 67 | 233 | Y | Y | 2 | ||||||||||
| Education Services | 49 | 15 | 30 | 058 | Y | Y | 0 | ||||||||||
| Transportation Services | 27 | 18 | 60 | -105 | Y | Y | 5 | ||||||||||
| Core (XFE) Goods | |||||||||||||||||
| Apparel | -03 | 25 | 31 | -189 | Y | N | 2 | ||||||||||
| New Vehicles | 01 | 23 | 36 | -142 | Y | N | 3 | ||||||||||
| Used Cars and Trucks | -03 | 8 | 21 | 020 | Y | N | 0 | ||||||||||
| Medical Care Goods | 29 | 16 | 18 | 059 | Y | Y | 1 | ||||||||||
| Food and Energy | |||||||||||||||||
| Food away from Home | 28 | 09 | 59 | 019 | N | Y | 11 | ||||||||||
| Food at Home | 21 | 27 | 77 | -201 | N | N | 6 | ||||||||||
| Energy | 36 | 202 | 75 | 078 | N | N | 1 | ||||||||||
| Unemployment Gap | Lagged Inflation | Constant | Adjusted R2 | Observations | Durbin-Watson Statistic | |||||||||
| PCE Services Less Energy | -014 | 032 | 191 | 046 | 83 | 185 | ||||||||
| (000) | (001) | (035) | ||||||||||||
| PCE Housing Services | -023 | 058 | 129 | 080 | 83 | 208 | ||||||||
| (000) | (000) | (024) | ||||||||||||
| CPI-U Owners Equivalent of Rent | -021 | 062 | 113 | 078 | 83 | 171 | ||||||||
| (000) | (000) | (024) | ||||||||||||
| CPI-U Rent of Primary Residence | -015 | 067 | 116 | 084 | 83 | 217 | ||||||||
| (000) | (000) | (026) | ||||||||||||
| PCE Health Care Services | -006 | 062 | 092 | 042 | 83 | 207 | ||||||||
| (038) | (000) | (026) | ||||||||||||
| PCE Services Less Energy Rent of Shelter amp Health care | -004 | 035 | 172 | 038 | 83 | 226 | ||||||||
| (050) | (000) | (028) | ||||||||||||
| CPI-U Services Less Energy Services amp Rent of Shelter | -015 | 040 | 188 | 034 | 83 | 218 | ||||||||
| (001) | (000) | (040) | ||||||||||||
| CPI-U Medical Care Services | -005 | 070 | 115 | 034 | 83 | 201 | ||||||||
| (051) | (000) | (045) | ||||||||||||
| CPI-U Food away from Home | -009 | 062 | 105 | 057 | 83 | 264 | ||||||||
| (005) | (000) | (025) | ||||||||||||
| CPI-U Education Services | -007 | 093 | 030 | 081 | 83 | 202 | ||||||||
| (016) | (000) | (029) | ||||||||||||
| CPI-U Transportation Services | -002 | -011 | 320 | 016 | 83 | 198 | ||||||||
| (087) | (027) | (036) | ||||||||||||
| Unemployment Gap | Lagged Inflation | Constant | Adjusted R2 | Observations | Durbin-Watson Statistic | |||||||||
| PCE Durable Goods | 008 | 028 | -154 | 027 | 83 | 183 | ||||||||
| (031) | (001) | (024) | ||||||||||||
| PCE Motor Vehicles and Parts | 031 | 030 | -021 | 043 | 83 | 178 | ||||||||
| (005) | (000) | (025) | ||||||||||||
| PCE Video Audio Photo amp | 016 | 060 | -395 | 044 | 83 | 222 | ||||||||
| Information Processing Equipment amp Media | (034) | (000) | (087) | |||||||||||
| PCE Other Durable Goods (including Medical Equipments) | -010 | 038 | -050 | 027 | 83 | 188 | ||||||||
| (028) | (000) | (019) | ||||||||||||
| PCE Nondurable Goods Less Energy | -014 | 073 | 039 | 044 | 83 | 203 | ||||||||
| (005) | (000) | (017) | ||||||||||||
| PCE Food amp Beverage Purchased for Off-Premises Consumption | -024 | 066 | 071 | 055 | 83 | 226 | ||||||||
| (004) | (000) | (024) | ||||||||||||
| CPI-U Food at Home | -027 | 063 | 082 | 052 | 83 | 216 | ||||||||
| (005) | (000) | (028) | ||||||||||||
| CPI-U Alcoholic Beverages | -017 | 034 | 147 | 016 | 83 | 209 | ||||||||
| (004) | (000) | (026) | ||||||||||||
| PCE Pharmaceutical amp Other Medical Products | -002 | 033 | 202 | 020 | 83 | 173 | ||||||||
| (088) | (000) | (039) | ||||||||||||
| PCE Other Nondurable Goods | 008 | 025 | 000 | 042 | 83 | 179 | ||||||||
| (046) | (001) | (018) | ||||||||||||
| CPI-U Apparel | 054 | 014 | -069 | 022 | 83 | 191 | ||||||||
| (000) | (018) | (030) | ||||||||||||
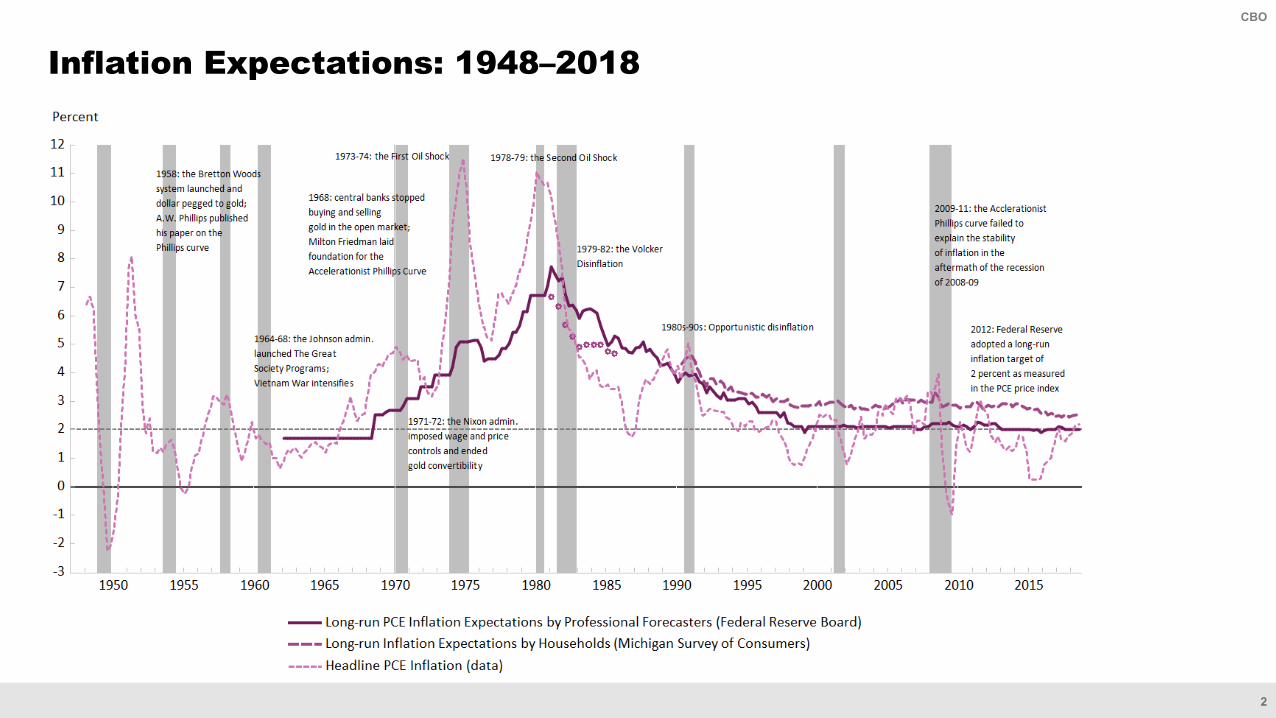
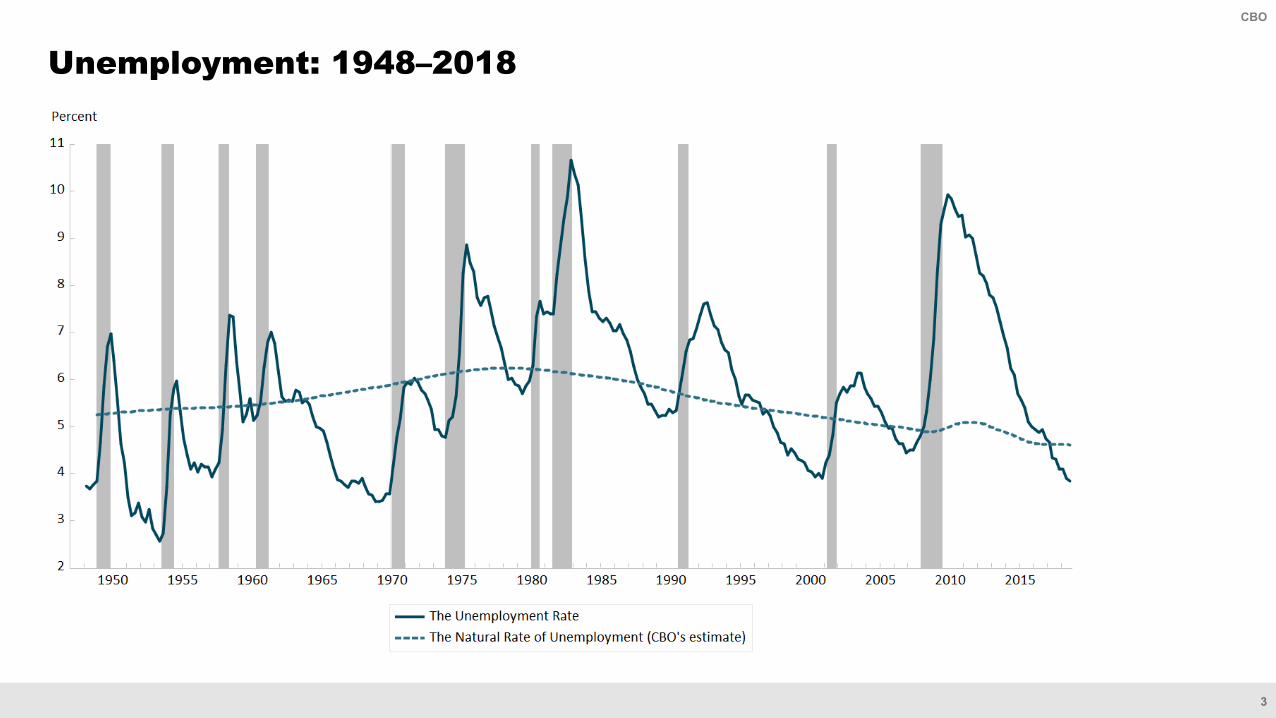
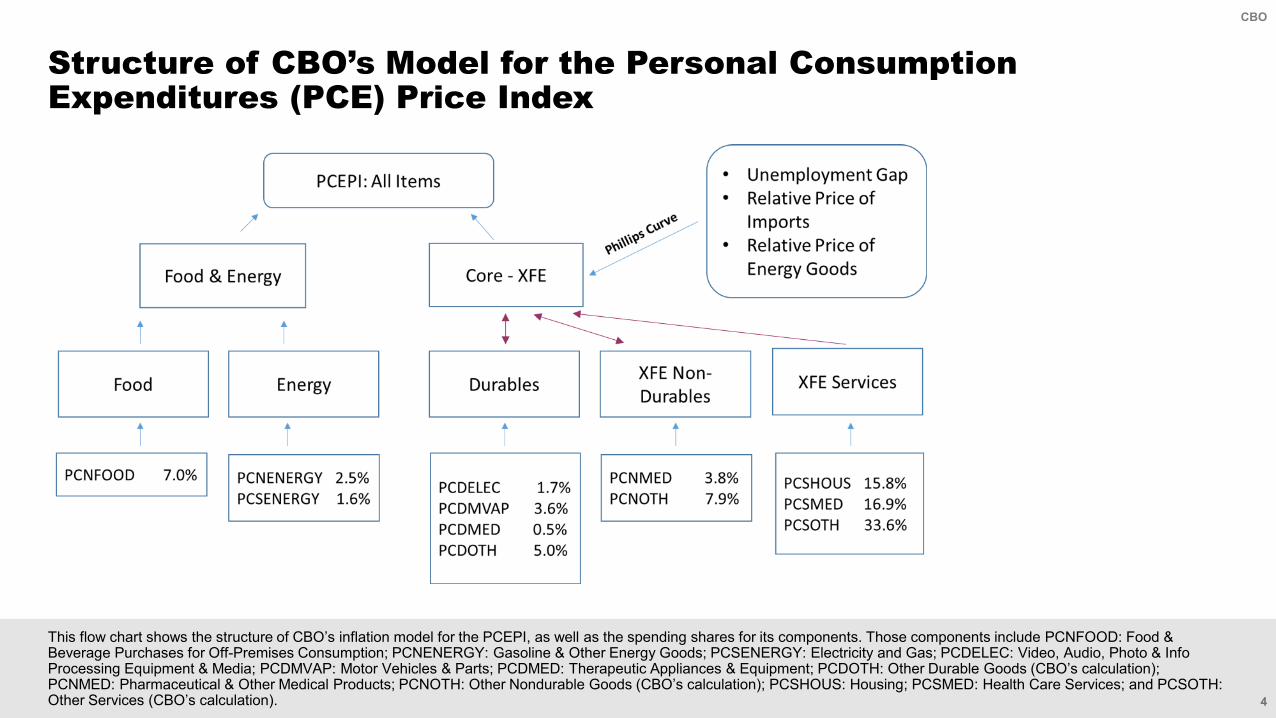
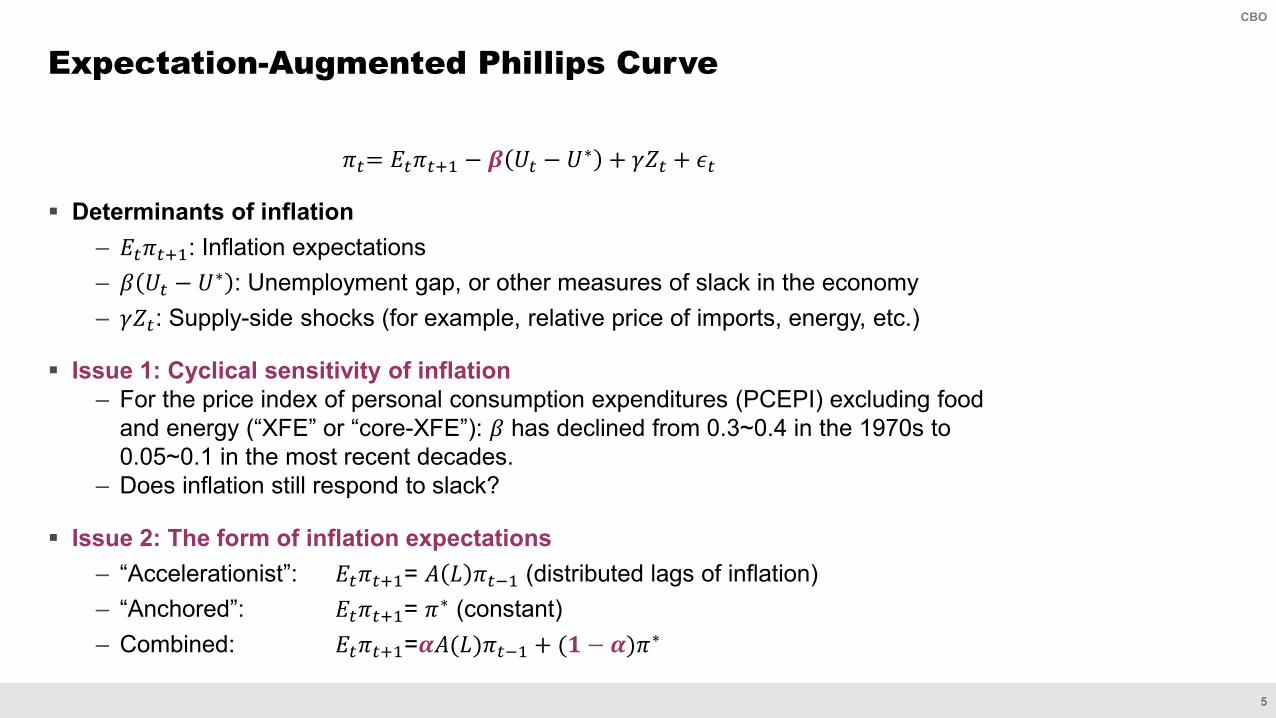
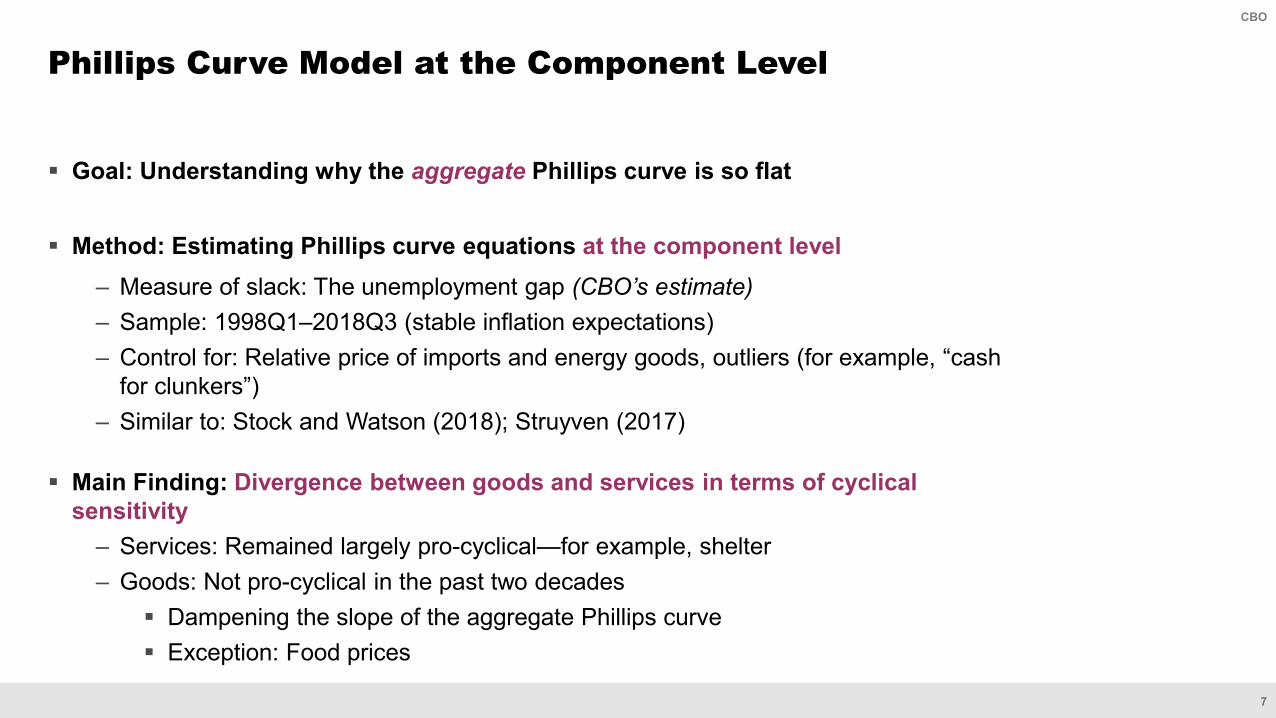
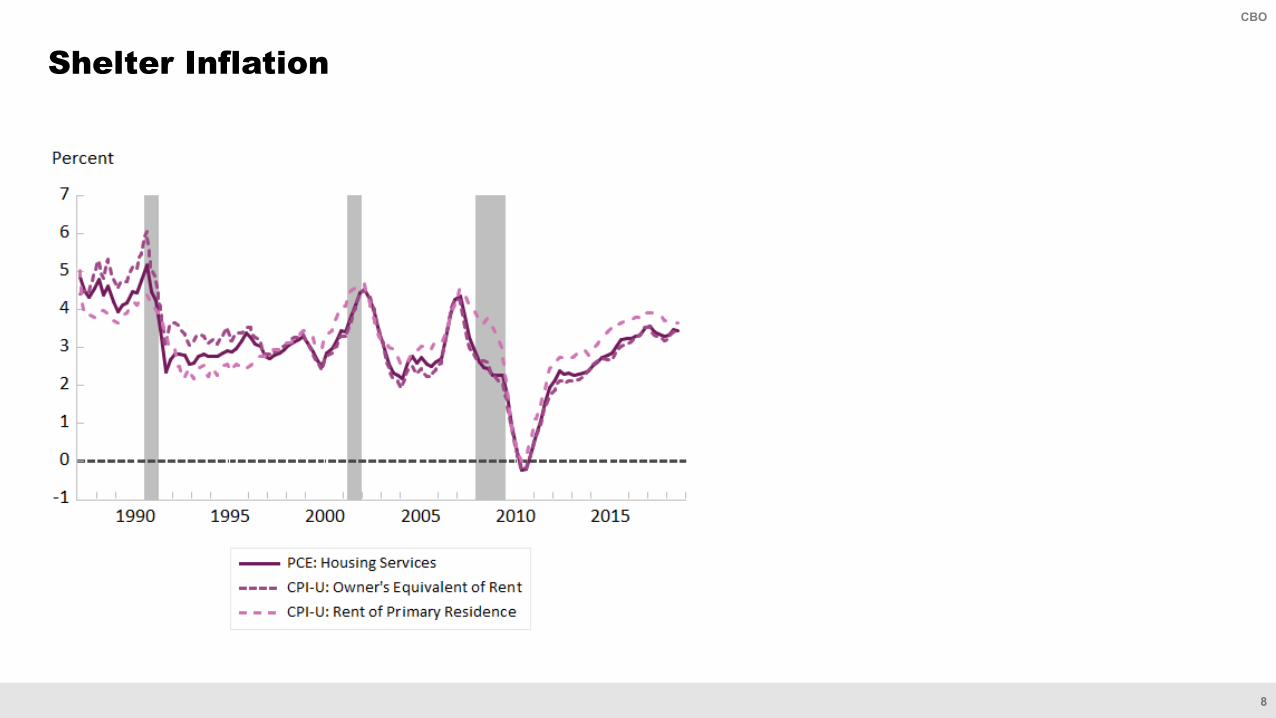
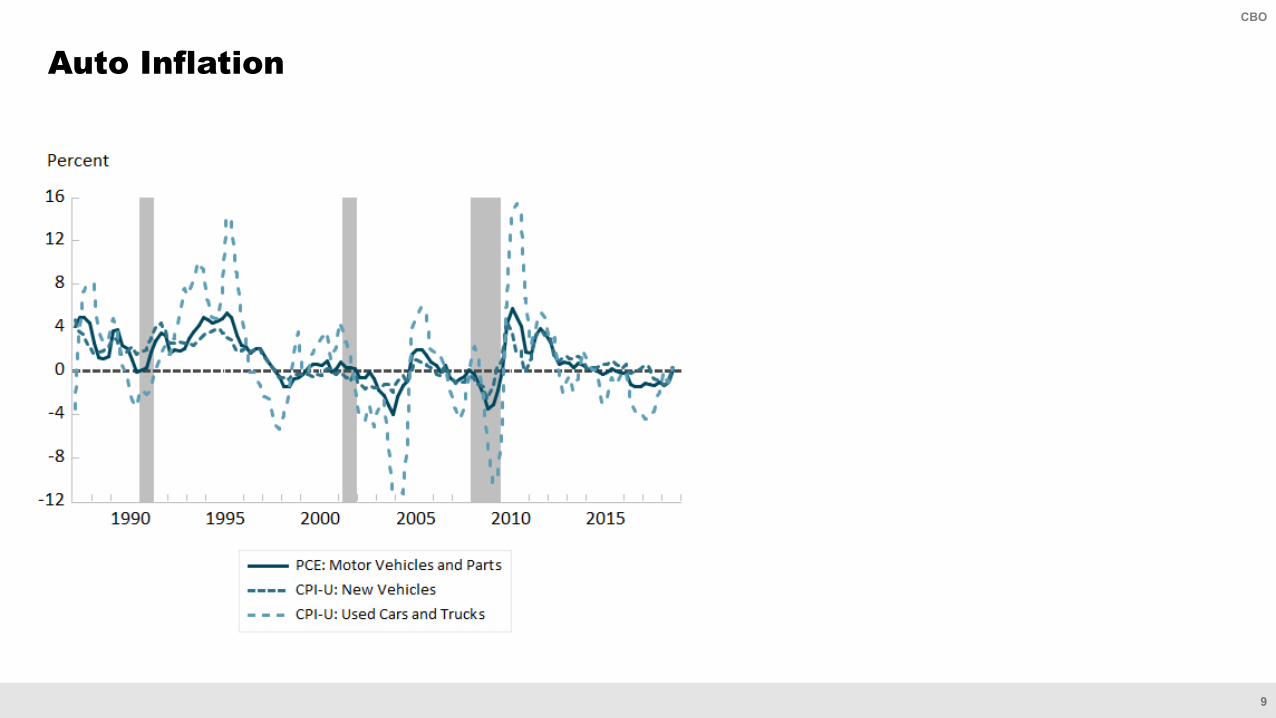
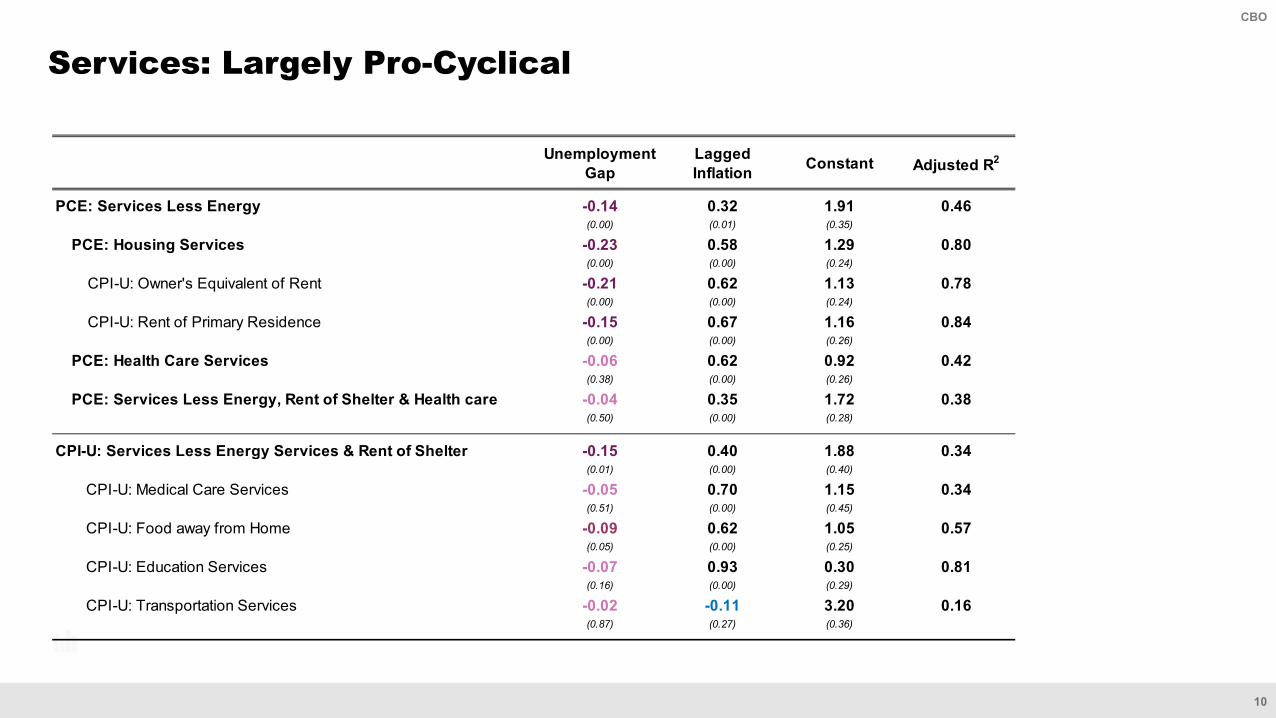
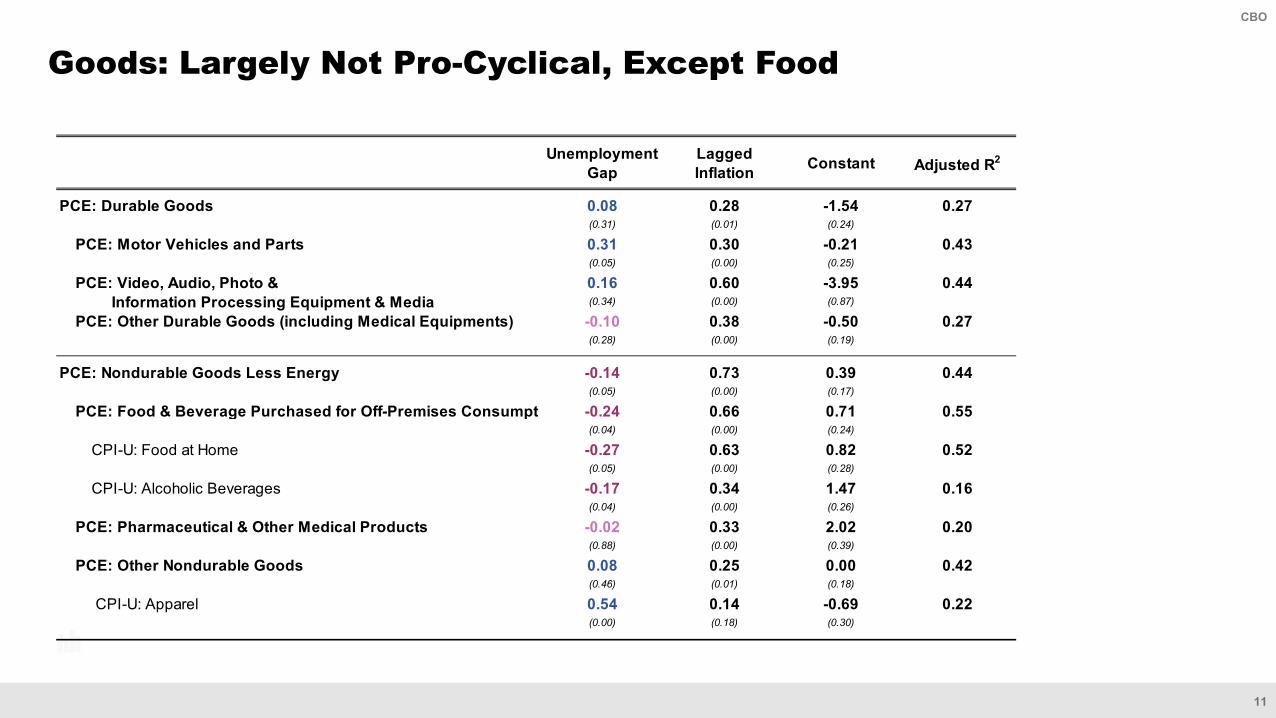
11
CBO
Goods Largely Not Pro-Cyclical Except Food
Unemployment Gap
Lagged Inflation Constant Adjusted R2
PCE Durable Goods 008 028 -154 027(031) (001) (024)
PCE Motor Vehicles and Parts 031 030 -021 043(005) (000) (025)
PCE Video Audio Photo amp 016 060 -395 044 Information Processing Equipment amp Media (034) (000) (087)
PCE Other Durable Goods (including Medical Equipments) -010 038 -050 027(028) (000) (019)
PCE Nondurable Goods Less Energy -014 073 039 044(005) (000) (017)
PCE Food amp Beverage Purchased for Off-Premises Consumpt -024 066 071 055(004) (000) (024)
CPI-U Food at Home -027 063 082 052(005) (000) (028)
CPI-U Alcoholic Beverages -017 034 147 016(004) (000) (026)
PCE Pharmaceutical amp Other Medical Products -002 033 202 020(088) (000) (039)
PCE Other Nondurable Goods 008 025 000 042(046) (001) (018)
CPI-U Apparel 054 014 -069 022(000) (018) (030)
Percent of Expenditures
12
CBO
Servicesndash Prices are largely determined by domestic andor local factors
Household maintenance restaurants etcndash Cannot be inventoried
Goodsndash Lots of measurement issues and noise from one-off price shocks (Stock and
Watson 2018) Measurement issue very severe for apparel recreational goods financial
services etc One-off price shocks ldquocash for clunkersrdquo (2009) federal tobacco tax hike
(2009) ndash Tend to be more heavily influenced by long-run structural forces
Globalization Abdih et al (2016) and others ldquoThe Amazon effectrdquo Goolsbee and Klenow (2018) Increasing industrial concentration
Goods Versus Services Possible Explanations
13
CBO
Services Componentsndash Generally Phillips curve equations at the component level work relatively wellndash Special case PCE health care services (policy plays a large role)
CBOrsquos model incorporates CBOrsquos projection of Medicare reimbursement rate growth
Goods Componentsndash ldquoTop-down Approachrdquo CBO currently uses core PCE inflation (from the
aggregate Phillips curve) as an input in the equations for goods components Keep track of movements in relative prices Judgment in sector-specific trends Control for relative price of imports one-off price shocks etc
Forecasting Inflation at the Component Level
14
CBO
Modeling Inflation ExpectationsBackward-Looking Versus Anchored
15
CBO
Reduced-form
120587120587119905119905= 120630120630119860119860(119871119871)120587120587119905119905minus1 + (120783120783 minus 120630120630)120587120587lowast minus 120573120573 119880119880119905119905 minus 119880119880119905119905lowast + 120574120574119885119885119905119905 + 120598120598119905119905o 119860119860(119871119871)120587120587119905119905minus1 Use four lags of past inflationo 120587120587lowast Long-run inflationldquoanchorrdquoo 119880119880119905119905 minus 119880119880119905119905lowast The unemployment gap (CBOrsquos estimate)o 119885119885119905119905 Supply-side shocks including relative prices of imports and energy goodso Sample 1998Q1ndash2018Q3
Blanchard (2016) ldquoThe Phillips Curve Back to the rsquo60srdquo ndash Shows 120630120630 declined over time and is currently very small for headline CPI
But component-level analysis implies that the measure of inflation matters
This exercise Try ten different measures of aggregate inflation
Estimating the Aggregate Phillips Curve
16
CBO
Three measures of headline inflationndash Headline CPI-U (BLS) and Headline PCEPI (BEA) ndash Chained CPI-U (BLS)
Ten Measures of Inflation
17
CBO
Seven measures of core inflationndash Approach 1 Remove the most volatile price changes
XFE CPI-U (BLS) and XFE PCEPI (BEA) Median CPI-U and 16-Trimmed-Mean CPI-U (Federal Reserve Bank of
Cleveland) Rank price changes by size each month and trim the items with price
changes that are above or below a certain threshold ldquoMedianrdquo is just extreme trimming
Trimmed-Mean PCEPI (Federal Reserve Bank of Dallas) Trimming point chosen optimally every month
ndash Approach 2 Remove the most frequent price changes Sticky CPI-U and Sticky-XFE CPI (Federal Reserve Bank of Atlanta)
Price changes every 43 months or longer (Bils and Klenow 2004)
Ten Measures of Inflation (Continued)
18
CBO
Seven Measures of Core Inflation
19
CBO
Relative weight of lagged inflation and constantldquoanchorrdquondash Overall inflation 120572120572 asymp 02 consistent with Blanchard (2016) for headline CPI
Estimation Results I
This figure plots the sum of the estimated coefficients on lagged inflation terms using recursive samples that start in 1998Q1 and end in 2012Q1 2012Q2 hellip and 2018Q1 The Phillips curve equations are ldquounrestrictedrdquo as no assumption was imposed on the value of π before the estimation Instead the intercept of the equation which in theory equals απ was estimated and then the values of α and π were calculated by assuming the long-run restriction on the estimated coefficients
20
CBO
Relative weight of lagged inflation and constantldquoanchorrdquondash Overall inflation 120572120572 asymp 02 consistent with Blanchard (2016) for headline CPIndash Core inflation 120572120572 asymp 05 particularly for non-XFE measures
Estimation Results I (Continued)
This figure plots the sum of the estimated coefficients on lagged inflation terms using recursive samples that start in 1998Q1 and end in 2012Q1 2012Q2 hellip and 2018Q1 The Phillips curve equations are ldquounrestrictedrdquo as no assumption was imposed on the value of π before the estimation Instead the intercept of the equation which in theory equals απ was estimated and then the values of α and π were calculated by assuming the long-run restriction on the estimated coefficients
21
CBO
Further analysis using survey measures of inflation expectations suggests
Inflation expectations by consumers matter more for inflation dynamics than the expectations by professional forecasters for all ten measures of inflation
ndash Consumersrsquo expectations more closely resemble those of firms (Coibion and Gorodnichenko 2015)
ndash Transmission of professional forecastersrsquo views to consumers is weak in a low-inflation environment
ndash Coibion et al (2017) Similar finding for headline CPI
Long-run inflation expectations by consumers are ldquoshock-anchoredrdquo but not ldquolevel-anchoredrdquo (Ball and Mazumder 2011)
ndash Shock-anchoring Transitory shocks not passed to expectationsndash Level-anchoring Expectations tied to a particular level
Estimation Results I (Continued)
22
CBO
Comparing measures of core inflationndash The Phillips curve fits the non-XFE measures very well
Average adj 1198771198772 of non-XFE measures = 07 Ball and Mazumder (2014) Showed this for median CPI
ndash XFEs are ldquooutliersrdquo particularly XFE CPI-U (low 120572120572 and low 1198771198772) Average adj 1198771198772 of XFE measures = 025
Possible explanationndash Fewer goods prices in the non-XFE core measures
Goods price changes are more volatile Goods price changes occur more frequently
Estimation Results II
23
CBO
CPI Components Summary Statistics and Categorization
Mean Standard Deviation
Relative Importance
(2017)
Change in Relative
Importantce 2007-2017
XFE Sticky CPIProbability
(= Median CPI) (1998-2007)
(1) (2) (3) (4) (5) (6) (7)
Core (XFE) ServicesOwners Equivalent of Rent (OER) 27 11 232 298 Y Y 52Rent of Primary Residence 32 11 79 101 Y Y 5Medical Care Services 38 13 67 233 Y Y 2Education Services 49 15 30 058 Y Y 0Transportation Services 27 18 60 -105 Y Y 5
Core (XFE) GoodsApparel -03 25 31 -189 Y N 2New Vehicles 01 23 36 -142 Y N 3Used Cars and Trucks -03 8 21 020 Y N 0Medical Care Goods 29 16 18 059 Y Y 1
Food and EnergyFood away from Home 28 09 59 019 N Y 11Food at Home 21 27 77 -201 N N 6Energy 36 202 75 078 N N 1
CategorizationSummary Statistics
Major CPI Components
The categorization of components into sticky CPI is based on Bryan and Meyer (2010) ldquoAre Some Prices in the CPI More Forward Looking Than Others We Think Sordquo Economic Commentary Federal Reserve Bank of Cleveland httpswwwfrbatlantaorg-mediadocumentsresearchinflationprojectstickypricesticky-price-cpi-supplemental-readingpdf The probabilities of a componentrsquos being the median CPI are based on the ldquorevised methodologyrdquo that split the OER into four regional components For more detail see httpswwwclevelandfedorgenour-researchindicators-and-datamedian-cpirevised-methodologyaspx
Percent of Expenditures
24
CBO
The slope of the Phillips curve Flat but steeper for CPIs than PCEPIsndash 120573120573 = 005∿01 for PCEPIs but = 01∿02 for CPIsndash Why Shelter the most cyclically sensitive component has a much larger weight in CPI than in PCEPI
Estimation Results III
This figure plots the sum of the estimated coefficients on lagged inflation terms using recursive samples that start in 1998Q1 and end in 2012Q1 2012Q2 hellip and 2018Q1 The Phillips curve equations are ldquounrestrictedrdquo as no assumption was imposed on the value of π before the estimation Instead the intercept of the equation which in theory equals απ was estimated and then the values of α and π were calculated by assuming the long-run restriction on the estimated coefficients
25
CBO
The slope of the Phillips curve Flat but steeper for CPIs than PCEPIsndash 120573120573 = 005∿01 for PCEPIs but = 01∿02 for CPIsndash Why Shelter the most cyclically sensitive component has a much larger weight in CPI than in PCEPI
Estimation Results III (Continued)
This figure plots the sum of the estimated coefficients on lagged inflation terms using recursive samples that start in 1998Q1 and end in 2012Q1 2012Q2 hellip and 2018Q1 The Phillips curve equations are ldquounrestrictedrdquo as no assumption was imposed on the value of π before the estimation Instead an intercept of the equation which in theory equals απ was estimated and then the value of α and π were calculated by assuming the long-run restriction on the estimated coefficients
26
CBO
Reviewing the Findings
27
CBO
Phillips-curve analysis at the component level provides insight intondash Cyclical sensitivity of aggregate inflation
For most service components and food inflation process is pro-cyclical For most non-food good components inflation process is not pro-cyclical
Need better understanding and models for goods price inflationndash Difference in the behaviors of various inflation measures
CPI is more cyclically sensitive than PCEPI because shelter has larger share in CPI
Non-XFE measures of core inflation better capture movements in trend inflation because they contain fewer noisy goods components
The aggregate Phillips curve has shifted away from ldquoaccelerationistrdquo toward an ldquoanchoredrdquo form but the process appears incomplete
ndash Need better understanding of the formation process of inflation expectations particularly those of consumers and firms
Conclusions
28
CBO
Abdih Yasser Ravi Balakrishnan and Baoping Shang ldquoWhat Is Keeping US Core Inflation Low Insights From a Bottom-Up Approachrdquo International Monetary Fund 2016
Ball Laurence and Sandeep Mazumder ldquoInflation Dynamics and the Great Recessionrdquo Brookings Papers on Economic Activity (2011) 337ndash406
Blanchard Olivier ldquoThe Phillips Curve Back to the rsquo60s American Economic Review 1065 (2016) 31ndash34
Bils Mark and Peter J Klenow ldquoSome Evidence on the Importance of Sticky Pricesrdquo Journal of Political Economy 1125 (2004) 947ndash985
Coibion Olivier and Yuriy Gorodnichenko ldquoIs the Phillips Curve Alive and Well After All Inflation Expectations and the Missing Disinflationrdquo American Economic Journal Macroeconomics 71 (2015) 197ndash232
References
29
CBO
Coibion Olivier Yuriy Gorodnichenko and Rupal Kamdar ldquoThe Formation of Expectations Inflation and the Phillips Curverdquo No w23304 National Bureau of Economic Research 2017
Goolsbee Austan D and Peter J Klenow ldquoInternet Rising Prices Falling Measuring Inflation in a World of E-Commercerdquo AEA Papers and Proceedings Vol 108 2018
Stock J and Mark Watson ldquoSlack and Cyclically Sensitive Inflationrdquo ECB Forum on Central Banking Sintra Portugal 2018
Struyven Dann ldquoWhich Prices Still Respond to Slackrdquo Goldman Sachs Economics Research (October 31 2017)
References (Continued)
| Current vintage data | |||||||||||||||||||||||||||
| Dec-16 | Jan-17 | Feb-17 | Mar-17 | Apr-17 | May-17 | Jun-17 | Jul-17 | Aug-17 | Sep-17 | Oct-17 | Nov-17 | Dec-17 | |||||||||||||||
| Rose at 0-2 rate | 314 | 179 | 190 | 266 | 178 | 158 | 181 | 206 | 275 | 165 | 181 | 224 | 251 | ||||||||||||||
| Rose at 2-3 rate | 82 | 137 | 111 | 171 | 191 | 280 | 111 | 130 | 116 | 216 | 88 | 97 | 39 | ||||||||||||||
| Rose at 3-5 rate | 240 | 198 | 253 | 80 | 126 | 136 | 209 | 161 | 241 | 125 | 231 | 258 | 177 | ||||||||||||||
| Rose at 5-10 rate | 100 | 122 | 57 | 70 | 71 | 85 | 91 | 60 | 51 | 114 | 50 | 122 | 81 | ||||||||||||||
| Rose faster than 10 rate | 67 | 137 | 108 | 27 | 151 | 55 | 75 | 116 | 65 | 97 | 159 | 82 | 134 | ||||||||||||||
| 227 | 281 | 387 | 282 | 286 | 334 | 328 | 253 | 283 | 291 | 218 | 317 | ||||||||||||||||
| 212 | 172 | 215455310712 | 218771897151 | ||||||||||||||||||||||||
| 140 | 194 | 153949709569 | 74785941399 | ||||||||||||||||||||||||
| 177 | 157 | 175371335238 | 221799519999 | ||||||||||||||||||||||||
| 83 | 82 | 74591464835 | 84429446757 | ||||||||||||||||||||||||
| 90 | 94 | 92689863883 | 125100452725 | ||||||||||||||||||||||||
| 298 | 301 | 287942315763 | 275112741969 | ||||||||||||||||||||||||
| 2017Q1 | 2017Q2 | 2017Q3 | 2017Q4 | ||||||||||||||||||||||||
| Fell | 2983 | 3008 | 2879 | 2751 | |||||||||||||||||||||||
| Rose at 0-2 rate | 2118 | 1723 | 2155 | 2188 | |||||||||||||||||||||||
| Rose at 2-3 rate | 1396 | 1938 | 1539 | 748 | |||||||||||||||||||||||
| Rose at 3-5 rate | 1769 | 1573 | 1754 | 2218 | |||||||||||||||||||||||
| Rose at 5-10 rate | 829 | 821 | 746 | 844 | |||||||||||||||||||||||
| Rose faster than 10 rate | 905 | 937 | 927 | 1251 |
| Major Sectors | CPI | PCEPI | ||||
| Housing | 426 | 183 | ||||
| Health Care | 85 | 231 | ||||
| Food and Beverages | 146 | 137 | ||||
| Transportation | 153 | 90 | ||||
| Recreation | 57 | 89 | ||||
| Education and Communication | 70 | 46 | ||||
| Apparel | 30 | 29 | ||||
| Financial Services | 02 | 47 | ||||
| Other | 30 | 147 | ||||
| Total | 100 | 100 | ||||
| Data December 2016 |
| Naiumlve Phillips-Curve-Style Models (Sample 1998-2017) | |||||||||||||
| 8 | 9 | 10 | 11 | ||||||||||
| Variables | Constant | Lagged Inflation | Unemployment Gap | Adjusted R2 | Order of AR | Order of Lagged Rucgap | |||||||
| Owners Equivalent of Rent | 118 | 062 | -022 | 078 | 1 | 1 | |||||||
| (48) | (79) | -(40) | |||||||||||
| Rent of Primary Residence | 141 | 060 | -018 | 084 | 1 | 4 | |||||||
| (48) | (74) | -(33) | |||||||||||
| Medical Care Services | 131 | 067 | -007 | 032 | 2 | ||||||||
| (27) | (58) | -(09) | |||||||||||
| Education Services | 023 | 095 | -009 | 078 | 4 | 2 | |||||||
| (07) | (149) | -(16) | |||||||||||
| Transportation Services | 26 | 01 | -00 | 018 | 1 | 3 | |||||||
| (59) | (05) | -(02) | |||||||||||
| Apparel | -060 | 027 | 043 | 016 | 4 | 0 | |||||||
| -(19) | (15) | (23) | |||||||||||
| New Vehicles | -046 | 003 | 065 | 018 | 1 | 0 | |||||||
| -(17) | (03) | (39) | |||||||||||
| Used Cars and Trucks | -001 | 031 | 092 | 028 | 2 | 4 | |||||||
| -(00) | (35) | (19) | |||||||||||
| Medical Care Goods | 23 | 02 | -01 | 023 | 3 | ||||||||
| (51) | (14) | -(08) | |||||||||||
| Food away from Home | 116 | 060 | -008 | 050 | 1 | 2 | |||||||
| (40) | (62) | -(15) | |||||||||||
| Food at Home | 105 | 063 | -009 | 059 | 1 | ||||||||
| (37) | (86) | -(07) | |||||||||||
| Energy | 983 | -022 | -061 | 048 | 1 | ||||||||
| (48) | -(22) | -(06) | |||||||||||
| Unemployment Gap | Lagged Inflation | Constant | Adjusted R2 | Obs | Durbin-Watson Statistic | Order of Lagged Inflation | Order of Lagged Unemployment Gap | |||||||||||
| Services | ||||||||||||||||||
| Owners Equivalent of Rent | -021 | 062 | 113 | 078 | 83 | 171 | 1 | 1 | ||||||||||
| 000 | 000 | 024 | ||||||||||||||||
| Rent of Primary Residence | -015 | 067 | 116 | 084 | 83 | 217 | 1 | 5 | ||||||||||
| 000 | 000 | 026 | ||||||||||||||||
| Food away from Home | -008 | 061 | 108 | 057 | 83 | 251 | 2 | 2 | ||||||||||
| 007 | 000 | 025 | ||||||||||||||||
| Medical Care Services | -005 | 070 | 115 | 034 | 83 | 201 | 2 | 0 | ||||||||||
| 051 | 000 | 045 | ||||||||||||||||
| Education Services | -007 | 093 | 030 | 081 | 83 | 202 | 4 | 2 | ||||||||||
| 016 | 000 | 029 | ||||||||||||||||
| Transportation Services | -002 | -011 | 320 | 016 | 83 | 198 | 2 | 3 | ||||||||||
| 087 | 027 | 036 | ||||||||||||||||
| Goods | ||||||||||||||||||
| Apparel | 050 | 010 | -054 | 008 | 83 | 192 | 4 | 0 | ||||||||||
| 001 | 039 | 032 | ||||||||||||||||
| New Vehicles | 038 | 002 | -034 | 034 | 83 | 186 | 1 | 0 | ||||||||||
| 001 | 084 | 023 | ||||||||||||||||
| Used Cars and Trucks | 038 | 018 | -019 | 034 | 83 | 174 | 2 | 4 | ||||||||||
| 047 | 013 | 082 | ||||||||||||||||
| Food at Home | -005 | 065 | 103 | 057 | 83 | 237 | 1 | 0 | ||||||||||
| 072 | 000 | 027 | ||||||||||||||||
| Medical Care Goods | -005 | 046 | 169 | 056 | 83 | 196 | 3 | 0 | ||||||||||
| 053 | 000 | 028 | ||||||||||||||||
| Controlling Inflnm + Inflne | ||||||||||||||||||
| Unemployment Gap | Lagged Inflation | Constant | Adjusted R2 | Observations | Durbin-Watson Statistic | Order of Lagged Inflation | Order of Lagged Unemployment Gap | |||||||||||
| Owners Equivalent of Rent (OER) | -0212 | 0633 | 1120 | 077 | 80 | 179 | 1 | 1 | ||||||||||
| (0058) | (0082) | (0260) | ||||||||||||||||
| Rent of Primary Residence | -0171 | 0604 | 1395 | 084 | 80 | 201 | 1 | 5 | ||||||||||
| (0056) | (0085) | (0308) | ||||||||||||||||
| Medical Care Services | -0070 | 0693 | 1191 | 031 | 80 | 205 | 2 | 0 | ||||||||||
| (0083) | (0123) | (0514) | ||||||||||||||||
| Education Services | -0087 | 0947 | 0296 | 078 | 80 | 204 | 4 | 2 | ||||||||||
| (0055) | (0067) | (0354) | ||||||||||||||||
| Transportation Services | -0035 | 0154 | 2284 | 019 | 80 | 203 | 2 | 3 | ||||||||||
| (0130) | (0160) | (0485) | ||||||||||||||||
| Apparel | 0416 | 0305 | -0594 | 015 | 80 | 187 | 4 | 0 | ||||||||||
| (0187) | (0178) | (0327) | ||||||||||||||||
| New Vehicles | 0655 | 0021 | -0494 | 017 | 80 | 200 | 1 | 0 | ||||||||||
| (0169) | (0112) | (0287) | ||||||||||||||||
| Used Cars and Trucks | 0410 | 0215 | -0860 | 038 | 80 | 185 | 2 | 4 | ||||||||||
| (0535) | (0114) | (0902) | ||||||||||||||||
| Medical Care Goods | -0082 | 0202 | 2251 | 022 | 80 | 192 | 3 | 0 | ||||||||||
| (0105) | (0141) | (0458) | ||||||||||||||||
| Food away from Home | -0086 | 0613 | 1159 | 059 | 80 | 236 | 2 | 2 | ||||||||||
| (0132) | (0074) | (0302) | ||||||||||||||||
| Food at Home | -0065 | 0751 | 0781 | 053 | 80 | 216 | 1 | 0 | ||||||||||
| (0049) | (0116) | (0340) | ||||||||||||||||
| Energy | -0735 | 0068 | 2120 | 096 | 80 | 134 | 2 | 0 | ||||||||||
| (0311) | (0035) | (0651) | ||||||||||||||||
| Controlling Inflnm | ||||||||||||||||||
| Unemployment Gap | Lagged Inflation | Constant | Adjusted R2 | Observations | Durbin-Watson Statistic | Order of Lagged Inflation | Order of Lagged Unemployment Gap | |||||||||||
| Core (XFE) Services | ||||||||||||||||||
| Owners Equivalent of Rent (OER) | -0212 | 0632 | 1129 | 078 | 80 | 180 | 1 | 1 | ||||||||||
| (0058) | (0081) | (0257) | ||||||||||||||||
| Rent of Primary Residence | -0171 | 0605 | 1393 | 084 | 80 | 201 | 1 | 5 | ||||||||||
| (0055) | (0084) | (0302) | ||||||||||||||||
| Medical Care Services | -0068 | 0696 | 1189 | 032 | 80 | 205 | 2 | 0 | ||||||||||
| (0082) | (0122) | (0511) | ||||||||||||||||
| Education Services | -0087 | 0943 | 0287 | 078 | 80 | 201 | 4 | 2 | ||||||||||
| (0055) | (0067) | (0353) | ||||||||||||||||
| Transportation Services | -0030 | 0076 | 2602 | 017 | 80 | 202 | 2 | 3 | ||||||||||
| (0131) | (0152) | (0440) | ||||||||||||||||
| Apparel | 0426 | 0292 | -0544 | 016 | 80 | 189 | 4 | 0 | ||||||||||
| (0186) | (0176) | (0315) | ||||||||||||||||
| New Vehicles | 0658 | 0023 | -0436 | 017 | 80 | 196 | 1 | 0 | ||||||||||
| (0168) | (0112) | (0272) | ||||||||||||||||
| Used Cars and Trucks | 0399 | 0190 | -0322 | 036 | 80 | 171 | 2 | 4 | ||||||||||
| (0543) | (0115) | (0861) | ||||||||||||||||
| Medical Care Goods | -0080 | 0203 | 2289 | 022 | 80 | 193 | 3 | 0 | ||||||||||
| (0104) | (0140) | (0453) | ||||||||||||||||
| Food away from Home | -0090 | 0628 | 1038 | 059 | 80 | 237 | 2 | 2 | ||||||||||
| (0132) | (0073) | (0282) | ||||||||||||||||
| Food at Home | -0064 | 0754 | 0741 | 053 | 80 | 216 | 1 | 0 | ||||||||||
| (0049) | (0116) | (0338) | ||||||||||||||||
| Energy | -0678 | -0305 | 10270 | 049 | 80 | 198 | 2 | 0 | ||||||||||
| (1085) | (0114) | (2053) |
| Major CPI Components | Summary Statistics | Categorization | |||||||||||||||
| Mean | Standard Deviation | Relative Importance (2017) | Change in Relative Importantce 2007-2017 | XFE | Sticky CPI | Probability (= Median CPI) (1998-2007) | |||||||||||
| 1 | 2 | 3 | 4 | 5 | 6 | 7 | |||||||||||
| Core (XFE) Services | |||||||||||||||||
| Owners Equivalent of Rent (OER) | 27 | 11 | 232 | 298 | Y | Y | 52 | ||||||||||
| Rent of Primary Residence | 32 | 11 | 79 | 101 | Y | Y | 5 | ||||||||||
| Medical Care Services | 38 | 13 | 67 | 233 | Y | Y | 2 | ||||||||||
| Education Services | 49 | 15 | 30 | 058 | Y | Y | 0 | ||||||||||
| Transportation Services | 27 | 18 | 60 | -105 | Y | Y | 5 | ||||||||||
| Core (XFE) Goods | |||||||||||||||||
| Apparel | -03 | 25 | 31 | -189 | Y | N | 2 | ||||||||||
| New Vehicles | 01 | 23 | 36 | -142 | Y | N | 3 | ||||||||||
| Used Cars and Trucks | -03 | 8 | 21 | 020 | Y | N | 0 | ||||||||||
| Medical Care Goods | 29 | 16 | 18 | 059 | Y | Y | 1 | ||||||||||
| Food and Energy | |||||||||||||||||
| Food away from Home | 28 | 09 | 59 | 019 | N | Y | 11 | ||||||||||
| Food at Home | 21 | 27 | 77 | -201 | N | N | 6 | ||||||||||
| Energy | 36 | 202 | 75 | 078 | N | N | 1 | ||||||||||
| Unemployment Gap | Lagged Inflation | Constant | Adjusted R2 | Observations | Durbin-Watson Statistic | |||||||||
| PCE Services Less Energy | -014 | 032 | 191 | 046 | 83 | 185 | ||||||||
| (000) | (001) | (035) | ||||||||||||
| PCE Housing Services | -023 | 058 | 129 | 080 | 83 | 208 | ||||||||
| (000) | (000) | (024) | ||||||||||||
| CPI-U Owners Equivalent of Rent | -021 | 062 | 113 | 078 | 83 | 171 | ||||||||
| (000) | (000) | (024) | ||||||||||||
| CPI-U Rent of Primary Residence | -015 | 067 | 116 | 084 | 83 | 217 | ||||||||
| (000) | (000) | (026) | ||||||||||||
| PCE Health Care Services | -006 | 062 | 092 | 042 | 83 | 207 | ||||||||
| (038) | (000) | (026) | ||||||||||||
| PCE Services Less Energy Rent of Shelter amp Health care | -004 | 035 | 172 | 038 | 83 | 226 | ||||||||
| (050) | (000) | (028) | ||||||||||||
| CPI-U Services Less Energy Services amp Rent of Shelter | -015 | 040 | 188 | 034 | 83 | 218 | ||||||||
| (001) | (000) | (040) | ||||||||||||
| CPI-U Medical Care Services | -005 | 070 | 115 | 034 | 83 | 201 | ||||||||
| (051) | (000) | (045) | ||||||||||||
| CPI-U Food away from Home | -009 | 062 | 105 | 057 | 83 | 264 | ||||||||
| (005) | (000) | (025) | ||||||||||||
| CPI-U Education Services | -007 | 093 | 030 | 081 | 83 | 202 | ||||||||
| (016) | (000) | (029) | ||||||||||||
| CPI-U Transportation Services | -002 | -011 | 320 | 016 | 83 | 198 | ||||||||
| (087) | (027) | (036) | ||||||||||||
| Unemployment Gap | Lagged Inflation | Constant | Adjusted R2 | Observations | Durbin-Watson Statistic | |||||||||
| PCE Durable Goods | 008 | 028 | -154 | 027 | 83 | 183 | ||||||||
| (031) | (001) | (024) | ||||||||||||
| PCE Motor Vehicles and Parts | 031 | 030 | -021 | 043 | 83 | 178 | ||||||||
| (005) | (000) | (025) | ||||||||||||
| PCE Video Audio Photo amp | 016 | 060 | -395 | 044 | 83 | 222 | ||||||||
| Information Processing Equipment amp Media | (034) | (000) | (087) | |||||||||||
| PCE Other Durable Goods (including Medical Equipments) | -010 | 038 | -050 | 027 | 83 | 188 | ||||||||
| (028) | (000) | (019) | ||||||||||||
| PCE Nondurable Goods Less Energy | -014 | 073 | 039 | 044 | 83 | 203 | ||||||||
| (005) | (000) | (017) | ||||||||||||
| PCE Food amp Beverage Purchased for Off-Premises Consumption | -024 | 066 | 071 | 055 | 83 | 226 | ||||||||
| (004) | (000) | (024) | ||||||||||||
| CPI-U Food at Home | -027 | 063 | 082 | 052 | 83 | 216 | ||||||||
| (005) | (000) | (028) | ||||||||||||
| CPI-U Alcoholic Beverages | -017 | 034 | 147 | 016 | 83 | 209 | ||||||||
| (004) | (000) | (026) | ||||||||||||
| PCE Pharmaceutical amp Other Medical Products | -002 | 033 | 202 | 020 | 83 | 173 | ||||||||
| (088) | (000) | (039) | ||||||||||||
| PCE Other Nondurable Goods | 008 | 025 | 000 | 042 | 83 | 179 | ||||||||
| (046) | (001) | (018) | ||||||||||||
| CPI-U Apparel | 054 | 014 | -069 | 022 | 83 | 191 | ||||||||
| (000) | (018) | (030) | ||||||||||||
| Current vintage data | |||||||||||||||||||||||||||
| Dec-16 | Jan-17 | Feb-17 | Mar-17 | Apr-17 | May-17 | Jun-17 | Jul-17 | Aug-17 | Sep-17 | Oct-17 | Nov-17 | Dec-17 | |||||||||||||||
| Rose at 0-2 rate | 314 | 179 | 190 | 266 | 178 | 158 | 181 | 206 | 275 | 165 | 181 | 224 | 251 | ||||||||||||||
| Rose at 2-3 rate | 82 | 137 | 111 | 171 | 191 | 280 | 111 | 130 | 116 | 216 | 88 | 97 | 39 | ||||||||||||||
| Rose at 3-5 rate | 240 | 198 | 253 | 80 | 126 | 136 | 209 | 161 | 241 | 125 | 231 | 258 | 177 | ||||||||||||||
| Rose at 5-10 rate | 100 | 122 | 57 | 70 | 71 | 85 | 91 | 60 | 51 | 114 | 50 | 122 | 81 | ||||||||||||||
| Rose faster than 10 rate | 67 | 137 | 108 | 27 | 151 | 55 | 75 | 116 | 65 | 97 | 159 | 82 | 134 | ||||||||||||||
| 227 | 281 | 387 | 282 | 286 | 334 | 328 | 253 | 283 | 291 | 218 | 317 | ||||||||||||||||
| 212 | 172 | 215455310712 | 218771897151 | ||||||||||||||||||||||||
| 140 | 194 | 153949709569 | 74785941399 | ||||||||||||||||||||||||
| 177 | 157 | 175371335238 | 221799519999 | ||||||||||||||||||||||||
| 83 | 82 | 74591464835 | 84429446757 | ||||||||||||||||||||||||
| 90 | 94 | 92689863883 | 125100452725 | ||||||||||||||||||||||||
| 298 | 301 | 287942315763 | 275112741969 | ||||||||||||||||||||||||
| 2017Q1 | 2017Q2 | 2017Q3 | 2017Q4 | ||||||||||||||||||||||||
| Fell | 2983 | 3008 | 2879 | 2751 | |||||||||||||||||||||||
| Rose at 0-2 rate | 2118 | 1723 | 2155 | 2188 | |||||||||||||||||||||||
| Rose at 2-3 rate | 1396 | 1938 | 1539 | 748 | |||||||||||||||||||||||
| Rose at 3-5 rate | 1769 | 1573 | 1754 | 2218 | |||||||||||||||||||||||
| Rose at 5-10 rate | 829 | 821 | 746 | 844 | |||||||||||||||||||||||
| Rose faster than 10 rate | 905 | 937 | 927 | 1251 |
| Major Sectors | CPI | PCEPI | ||||
| Housing | 426 | 183 | ||||
| Health Care | 85 | 231 | ||||
| Food and Beverages | 146 | 137 | ||||
| Transportation | 153 | 90 | ||||
| Recreation | 57 | 89 | ||||
| Education and Communication | 70 | 46 | ||||
| Apparel | 30 | 29 | ||||
| Financial Services | 02 | 47 | ||||
| Other | 30 | 147 | ||||
| Total | 100 | 100 | ||||
| Data December 2016 |
| Naiumlve Phillips-Curve-Style Models (Sample 1998-2017) | |||||||||||||
| 8 | 9 | 10 | 11 | ||||||||||
| Variables | Constant | Lagged Inflation | Unemployment Gap | Adjusted R2 | Order of AR | Order of Lagged Rucgap | |||||||
| Owners Equivalent of Rent | 118 | 062 | -022 | 078 | 1 | 1 | |||||||
| (48) | (79) | -(40) | |||||||||||
| Rent of Primary Residence | 141 | 060 | -018 | 084 | 1 | 4 | |||||||
| (48) | (74) | -(33) | |||||||||||
| Medical Care Services | 131 | 067 | -007 | 032 | 2 | ||||||||
| (27) | (58) | -(09) | |||||||||||
| Education Services | 023 | 095 | -009 | 078 | 4 | 2 | |||||||
| (07) | (149) | -(16) | |||||||||||
| Transportation Services | 26 | 01 | -00 | 018 | 1 | 3 | |||||||
| (59) | (05) | -(02) | |||||||||||
| Apparel | -060 | 027 | 043 | 016 | 4 | 0 | |||||||
| -(19) | (15) | (23) | |||||||||||
| New Vehicles | -046 | 003 | 065 | 018 | 1 | 0 | |||||||
| -(17) | (03) | (39) | |||||||||||
| Used Cars and Trucks | -001 | 031 | 092 | 028 | 2 | 4 | |||||||
| -(00) | (35) | (19) | |||||||||||
| Medical Care Goods | 23 | 02 | -01 | 023 | 3 | ||||||||
| (51) | (14) | -(08) | |||||||||||
| Food away from Home | 116 | 060 | -008 | 050 | 1 | 2 | |||||||
| (40) | (62) | -(15) | |||||||||||
| Food at Home | 105 | 063 | -009 | 059 | 1 | ||||||||
| (37) | (86) | -(07) | |||||||||||
| Energy | 983 | -022 | -061 | 048 | 1 | ||||||||
| (48) | -(22) | -(06) | |||||||||||
| Unemployment Gap | Lagged Inflation | Constant | Adjusted R2 | Obs | Durbin-Watson Statistic | Order of Lagged Inflation | Order of Lagged Unemployment Gap | |||||||||||
| Services | ||||||||||||||||||
| Owners Equivalent of Rent | -021 | 062 | 113 | 078 | 83 | 171 | 1 | 1 | ||||||||||
| 000 | 000 | 024 | ||||||||||||||||
| Rent of Primary Residence | -015 | 067 | 116 | 084 | 83 | 217 | 1 | 5 | ||||||||||
| 000 | 000 | 026 | ||||||||||||||||
| Food away from Home | -008 | 061 | 108 | 057 | 83 | 251 | 2 | 2 | ||||||||||
| 007 | 000 | 025 | ||||||||||||||||
| Medical Care Services | -005 | 070 | 115 | 034 | 83 | 201 | 2 | 0 | ||||||||||
| 051 | 000 | 045 | ||||||||||||||||
| Education Services | -007 | 093 | 030 | 081 | 83 | 202 | 4 | 2 | ||||||||||
| 016 | 000 | 029 | ||||||||||||||||
| Transportation Services | -002 | -011 | 320 | 016 | 83 | 198 | 2 | 3 | ||||||||||
| 087 | 027 | 036 | ||||||||||||||||
| Goods | ||||||||||||||||||
| Apparel | 050 | 010 | -054 | 008 | 83 | 192 | 4 | 0 | ||||||||||
| 001 | 039 | 032 | ||||||||||||||||
| New Vehicles | 038 | 002 | -034 | 034 | 83 | 186 | 1 | 0 | ||||||||||
| 001 | 084 | 023 | ||||||||||||||||
| Used Cars and Trucks | 038 | 018 | -019 | 034 | 83 | 174 | 2 | 4 | ||||||||||
| 047 | 013 | 082 | ||||||||||||||||
| Food at Home | -005 | 065 | 103 | 057 | 83 | 237 | 1 | 0 | ||||||||||
| 072 | 000 | 027 | ||||||||||||||||
| Medical Care Goods | -005 | 046 | 169 | 056 | 83 | 196 | 3 | 0 | ||||||||||
| 053 | 000 | 028 | ||||||||||||||||
| Controlling Inflnm + Inflne | ||||||||||||||||||
| Unemployment Gap | Lagged Inflation | Constant | Adjusted R2 | Observations | Durbin-Watson Statistic | Order of Lagged Inflation | Order of Lagged Unemployment Gap | |||||||||||
| Owners Equivalent of Rent (OER) | -0212 | 0633 | 1120 | 077 | 80 | 179 | 1 | 1 | ||||||||||
| (0058) | (0082) | (0260) | ||||||||||||||||
| Rent of Primary Residence | -0171 | 0604 | 1395 | 084 | 80 | 201 | 1 | 5 | ||||||||||
| (0056) | (0085) | (0308) | ||||||||||||||||
| Medical Care Services | -0070 | 0693 | 1191 | 031 | 80 | 205 | 2 | 0 | ||||||||||
| (0083) | (0123) | (0514) | ||||||||||||||||
| Education Services | -0087 | 0947 | 0296 | 078 | 80 | 204 | 4 | 2 | ||||||||||
| (0055) | (0067) | (0354) | ||||||||||||||||
| Transportation Services | -0035 | 0154 | 2284 | 019 | 80 | 203 | 2 | 3 | ||||||||||
| (0130) | (0160) | (0485) | ||||||||||||||||
| Apparel | 0416 | 0305 | -0594 | 015 | 80 | 187 | 4 | 0 | ||||||||||
| (0187) | (0178) | (0327) | ||||||||||||||||
| New Vehicles | 0655 | 0021 | -0494 | 017 | 80 | 200 | 1 | 0 | ||||||||||
| (0169) | (0112) | (0287) | ||||||||||||||||
| Used Cars and Trucks | 0410 | 0215 | -0860 | 038 | 80 | 185 | 2 | 4 | ||||||||||
| (0535) | (0114) | (0902) | ||||||||||||||||
| Medical Care Goods | -0082 | 0202 | 2251 | 022 | 80 | 192 | 3 | 0 | ||||||||||
| (0105) | (0141) | (0458) | ||||||||||||||||
| Food away from Home | -0086 | 0613 | 1159 | 059 | 80 | 236 | 2 | 2 | ||||||||||
| (0132) | (0074) | (0302) | ||||||||||||||||
| Food at Home | -0065 | 0751 | 0781 | 053 | 80 | 216 | 1 | 0 | ||||||||||
| (0049) | (0116) | (0340) | ||||||||||||||||
| Energy | -0735 | 0068 | 2120 | 096 | 80 | 134 | 2 | 0 | ||||||||||
| (0311) | (0035) | (0651) | ||||||||||||||||
| Controlling Inflnm | ||||||||||||||||||
| Unemployment Gap | Lagged Inflation | Constant | Adjusted R2 | Observations | Durbin-Watson Statistic | Order of Lagged Inflation | Order of Lagged Unemployment Gap | |||||||||||
| Core (XFE) Services | ||||||||||||||||||
| Owners Equivalent of Rent (OER) | -0212 | 0632 | 1129 | 078 | 80 | 180 | 1 | 1 | ||||||||||
| (0058) | (0081) | (0257) | ||||||||||||||||
| Rent of Primary Residence | -0171 | 0605 | 1393 | 084 | 80 | 201 | 1 | 5 | ||||||||||
| (0055) | (0084) | (0302) | ||||||||||||||||
| Medical Care Services | -0068 | 0696 | 1189 | 032 | 80 | 205 | 2 | 0 | ||||||||||
| (0082) | (0122) | (0511) | ||||||||||||||||
| Education Services | -0087 | 0943 | 0287 | 078 | 80 | 201 | 4 | 2 | ||||||||||
| (0055) | (0067) | (0353) | ||||||||||||||||
| Transportation Services | -0030 | 0076 | 2602 | 017 | 80 | 202 | 2 | 3 | ||||||||||
| (0131) | (0152) | (0440) | ||||||||||||||||
| Apparel | 0426 | 0292 | -0544 | 016 | 80 | 189 | 4 | 0 | ||||||||||
| (0186) | (0176) | (0315) | ||||||||||||||||
| New Vehicles | 0658 | 0023 | -0436 | 017 | 80 | 196 | 1 | 0 | ||||||||||
| (0168) | (0112) | (0272) | ||||||||||||||||
| Used Cars and Trucks | 0399 | 0190 | -0322 | 036 | 80 | 171 | 2 | 4 | ||||||||||
| (0543) | (0115) | (0861) | ||||||||||||||||
| Medical Care Goods | -0080 | 0203 | 2289 | 022 | 80 | 193 | 3 | 0 | ||||||||||
| (0104) | (0140) | (0453) | ||||||||||||||||
| Food away from Home | -0090 | 0628 | 1038 | 059 | 80 | 237 | 2 | 2 | ||||||||||
| (0132) | (0073) | (0282) | ||||||||||||||||
| Food at Home | -0064 | 0754 | 0741 | 053 | 80 | 216 | 1 | 0 | ||||||||||
| (0049) | (0116) | (0338) | ||||||||||||||||
| Energy | -0678 | -0305 | 10270 | 049 | 80 | 198 | 2 | 0 | ||||||||||
| (1085) | (0114) | (2053) |
| Major CPI Components | Summary Statistics | Categorization | |||||||||||||||
| Mean | Standard Deviation | Relative Importance (2017Q4) | Change in Relative Importantce | CPI Excluding Food and Energy | Sticky CPI | Probability (= Median CPI) (1998-2007) | |||||||||||
| 1 | 2 | 3 | 4 | 5 | 6 | 7 | |||||||||||
| Core (XFE) Services | |||||||||||||||||
| Owners Equivalent of Rent (OER) | 27 | 11 | 232 | 298 | Y | Y | 52 | ||||||||||
| Rent of Primary Residence | 32 | 11 | 79 | 101 | Y | Y | 5 | ||||||||||
| Medical Care Services | 38 | 13 | 67 | 233 | Y | Y | 2 | ||||||||||
| Education Services | 49 | 15 | 30 | 058 | Y | Y | 0 | ||||||||||
| Transportation Services | 27 | 18 | 60 | -105 | Y | Y | 5 | ||||||||||
| Core (XFE) Goods | |||||||||||||||||
| Apparel | -03 | 25 | 31 | -189 | Y | N | 2 | ||||||||||
| New Vehicles | 01 | 23 | 36 | -142 | Y | N | 3 | ||||||||||
| Used Cars and Trucks | -03 | 8 | 21 | 020 | Y | N | 0 | ||||||||||
| Medical Care Goods | 29 | 16 | 18 | 059 | Y | Y | 1 | ||||||||||
| Food and Energy | |||||||||||||||||
| Food away from Home | 28 | 09 | 59 | 019 | N | Y | 11 | ||||||||||
| Food at Home | 21 | 27 | 77 | -201 | N | N | 6 | ||||||||||
| Energy | 36 | 202 | 75 | 078 | N | N | 1 | ||||||||||
| Unemployment Gap | Lagged Inflation | Constant | Adjusted R2 | Observations | Durbin-Watson Statistic | |||||||||
| PCE Services Less Energy | -014 | 032 | 191 | 046 | 83 | 185 | ||||||||
| (000) | (001) | (035) | ||||||||||||
| PCE Housing Services | -023 | 058 | 129 | 080 | 83 | 208 | ||||||||
| (000) | (000) | (024) | ||||||||||||
| CPI-U Owners Equivalent of Rent | -021 | 062 | 113 | 078 | 83 | 171 | ||||||||
| (000) | (000) | (024) | ||||||||||||
| CPI-U Rent of Primary Residence | -015 | 067 | 116 | 084 | 83 | 217 | ||||||||
| (000) | (000) | (026) | ||||||||||||
| PCE Health Care Services | -006 | 062 | 092 | 042 | 83 | 207 | ||||||||
| (038) | (000) | (026) | ||||||||||||
| PCE Services Less Energy Rent of Shelter amp Health care | -004 | 035 | 172 | 038 | 83 | 226 | ||||||||
| (050) | (000) | (028) | ||||||||||||
| CPI-U Services Less Energy Services amp Rent of Shelter | -015 | 040 | 188 | 034 | 83 | 218 | ||||||||
| (001) | (000) | (040) | ||||||||||||
| CPI-U Medical Care Services | -005 | 070 | 115 | 034 | 83 | 201 | ||||||||
| (051) | (000) | (045) | ||||||||||||
| CPI-U Food away from Home | -009 | 062 | 105 | 057 | 83 | 264 | ||||||||
| (005) | (000) | (025) | ||||||||||||
| CPI-U Education Services | -007 | 093 | 030 | 081 | 83 | 202 | ||||||||
| (016) | (000) | (029) | ||||||||||||
| CPI-U Transportation Services | -002 | -011 | 320 | 016 | 83 | 198 | ||||||||
| (087) | (027) | (036) | ||||||||||||
| Unemployment Gap | Lagged Inflation | Constant | Adjusted R2 | Observations | Durbin-Watson Statistic | |||||||||
| PCE Durable Goods | 008 | 028 | -154 | 027 | 83 | 183 | ||||||||
| (031) | (001) | (024) | ||||||||||||
| PCE Motor Vehicles and Parts | 031 | 030 | -021 | 043 | 83 | 178 | ||||||||
| (005) | (000) | (025) | ||||||||||||
| PCE Video Audio Photo amp | 016 | 060 | -395 | 044 | 83 | 222 | ||||||||
| Information Processing Equipment amp Media | (034) | (000) | (087) | |||||||||||
| PCE Other Durable Goods (including Medical Equipments) | -010 | 038 | -050 | 027 | 83 | 188 | ||||||||
| (028) | (000) | (019) | ||||||||||||
| PCE Nondurable Goods Less Energy | -014 | 073 | 039 | 044 | 83 | 203 | ||||||||
| (005) | (000) | (017) | ||||||||||||
| PCE Food amp Beverage Purchased for Off-Premises Consumption | -024 | 066 | 071 | 055 | 83 | 226 | ||||||||
| (004) | (000) | (024) | ||||||||||||
| CPI-U Food at Home | -027 | 063 | 082 | 052 | 83 | 216 | ||||||||
| (005) | (000) | (028) | ||||||||||||
| CPI-U Alcoholic Beverages | -017 | 034 | 147 | 016 | 83 | 209 | ||||||||
| (004) | (000) | (026) | ||||||||||||
| PCE Pharmaceutical amp Other Medical Products | -002 | 033 | 202 | 020 | 83 | 173 | ||||||||
| (088) | (000) | (039) | ||||||||||||
| PCE Other Nondurable Goods | 008 | 025 | 000 | 042 | 83 | 179 | ||||||||
| (046) | (001) | (018) | ||||||||||||
| CPI-U Apparel | 054 | 014 | -069 | 022 | 83 | 191 | ||||||||
| (000) | (018) | (030) | ||||||||||||
12
CBO
Servicesndash Prices are largely determined by domestic andor local factors
Household maintenance restaurants etcndash Cannot be inventoried
Goodsndash Lots of measurement issues and noise from one-off price shocks (Stock and
Watson 2018) Measurement issue very severe for apparel recreational goods financial
services etc One-off price shocks ldquocash for clunkersrdquo (2009) federal tobacco tax hike
(2009) ndash Tend to be more heavily influenced by long-run structural forces
Globalization Abdih et al (2016) and others ldquoThe Amazon effectrdquo Goolsbee and Klenow (2018) Increasing industrial concentration
Goods Versus Services Possible Explanations
13
CBO
Services Componentsndash Generally Phillips curve equations at the component level work relatively wellndash Special case PCE health care services (policy plays a large role)
CBOrsquos model incorporates CBOrsquos projection of Medicare reimbursement rate growth
Goods Componentsndash ldquoTop-down Approachrdquo CBO currently uses core PCE inflation (from the
aggregate Phillips curve) as an input in the equations for goods components Keep track of movements in relative prices Judgment in sector-specific trends Control for relative price of imports one-off price shocks etc
Forecasting Inflation at the Component Level
14
CBO
Modeling Inflation ExpectationsBackward-Looking Versus Anchored
15
CBO
Reduced-form
120587120587119905119905= 120630120630119860119860(119871119871)120587120587119905119905minus1 + (120783120783 minus 120630120630)120587120587lowast minus 120573120573 119880119880119905119905 minus 119880119880119905119905lowast + 120574120574119885119885119905119905 + 120598120598119905119905o 119860119860(119871119871)120587120587119905119905minus1 Use four lags of past inflationo 120587120587lowast Long-run inflationldquoanchorrdquoo 119880119880119905119905 minus 119880119880119905119905lowast The unemployment gap (CBOrsquos estimate)o 119885119885119905119905 Supply-side shocks including relative prices of imports and energy goodso Sample 1998Q1ndash2018Q3
Blanchard (2016) ldquoThe Phillips Curve Back to the rsquo60srdquo ndash Shows 120630120630 declined over time and is currently very small for headline CPI
But component-level analysis implies that the measure of inflation matters
This exercise Try ten different measures of aggregate inflation
Estimating the Aggregate Phillips Curve
16
CBO
Three measures of headline inflationndash Headline CPI-U (BLS) and Headline PCEPI (BEA) ndash Chained CPI-U (BLS)
Ten Measures of Inflation
17
CBO
Seven measures of core inflationndash Approach 1 Remove the most volatile price changes
XFE CPI-U (BLS) and XFE PCEPI (BEA) Median CPI-U and 16-Trimmed-Mean CPI-U (Federal Reserve Bank of
Cleveland) Rank price changes by size each month and trim the items with price
changes that are above or below a certain threshold ldquoMedianrdquo is just extreme trimming
Trimmed-Mean PCEPI (Federal Reserve Bank of Dallas) Trimming point chosen optimally every month
ndash Approach 2 Remove the most frequent price changes Sticky CPI-U and Sticky-XFE CPI (Federal Reserve Bank of Atlanta)
Price changes every 43 months or longer (Bils and Klenow 2004)
Ten Measures of Inflation (Continued)
18
CBO
Seven Measures of Core Inflation
19
CBO
Relative weight of lagged inflation and constantldquoanchorrdquondash Overall inflation 120572120572 asymp 02 consistent with Blanchard (2016) for headline CPI
Estimation Results I
This figure plots the sum of the estimated coefficients on lagged inflation terms using recursive samples that start in 1998Q1 and end in 2012Q1 2012Q2 hellip and 2018Q1 The Phillips curve equations are ldquounrestrictedrdquo as no assumption was imposed on the value of π before the estimation Instead the intercept of the equation which in theory equals απ was estimated and then the values of α and π were calculated by assuming the long-run restriction on the estimated coefficients
20
CBO
Relative weight of lagged inflation and constantldquoanchorrdquondash Overall inflation 120572120572 asymp 02 consistent with Blanchard (2016) for headline CPIndash Core inflation 120572120572 asymp 05 particularly for non-XFE measures
Estimation Results I (Continued)
This figure plots the sum of the estimated coefficients on lagged inflation terms using recursive samples that start in 1998Q1 and end in 2012Q1 2012Q2 hellip and 2018Q1 The Phillips curve equations are ldquounrestrictedrdquo as no assumption was imposed on the value of π before the estimation Instead the intercept of the equation which in theory equals απ was estimated and then the values of α and π were calculated by assuming the long-run restriction on the estimated coefficients
21
CBO
Further analysis using survey measures of inflation expectations suggests
Inflation expectations by consumers matter more for inflation dynamics than the expectations by professional forecasters for all ten measures of inflation
ndash Consumersrsquo expectations more closely resemble those of firms (Coibion and Gorodnichenko 2015)
ndash Transmission of professional forecastersrsquo views to consumers is weak in a low-inflation environment
ndash Coibion et al (2017) Similar finding for headline CPI
Long-run inflation expectations by consumers are ldquoshock-anchoredrdquo but not ldquolevel-anchoredrdquo (Ball and Mazumder 2011)
ndash Shock-anchoring Transitory shocks not passed to expectationsndash Level-anchoring Expectations tied to a particular level
Estimation Results I (Continued)
22
CBO
Comparing measures of core inflationndash The Phillips curve fits the non-XFE measures very well
Average adj 1198771198772 of non-XFE measures = 07 Ball and Mazumder (2014) Showed this for median CPI
ndash XFEs are ldquooutliersrdquo particularly XFE CPI-U (low 120572120572 and low 1198771198772) Average adj 1198771198772 of XFE measures = 025
Possible explanationndash Fewer goods prices in the non-XFE core measures
Goods price changes are more volatile Goods price changes occur more frequently
Estimation Results II
23
CBO
CPI Components Summary Statistics and Categorization
Mean Standard Deviation
Relative Importance
(2017)
Change in Relative
Importantce 2007-2017
XFE Sticky CPIProbability
(= Median CPI) (1998-2007)
(1) (2) (3) (4) (5) (6) (7)
Core (XFE) ServicesOwners Equivalent of Rent (OER) 27 11 232 298 Y Y 52Rent of Primary Residence 32 11 79 101 Y Y 5Medical Care Services 38 13 67 233 Y Y 2Education Services 49 15 30 058 Y Y 0Transportation Services 27 18 60 -105 Y Y 5
Core (XFE) GoodsApparel -03 25 31 -189 Y N 2New Vehicles 01 23 36 -142 Y N 3Used Cars and Trucks -03 8 21 020 Y N 0Medical Care Goods 29 16 18 059 Y Y 1
Food and EnergyFood away from Home 28 09 59 019 N Y 11Food at Home 21 27 77 -201 N N 6Energy 36 202 75 078 N N 1
CategorizationSummary Statistics
Major CPI Components
The categorization of components into sticky CPI is based on Bryan and Meyer (2010) ldquoAre Some Prices in the CPI More Forward Looking Than Others We Think Sordquo Economic Commentary Federal Reserve Bank of Cleveland httpswwwfrbatlantaorg-mediadocumentsresearchinflationprojectstickypricesticky-price-cpi-supplemental-readingpdf The probabilities of a componentrsquos being the median CPI are based on the ldquorevised methodologyrdquo that split the OER into four regional components For more detail see httpswwwclevelandfedorgenour-researchindicators-and-datamedian-cpirevised-methodologyaspx
Percent of Expenditures
24
CBO
The slope of the Phillips curve Flat but steeper for CPIs than PCEPIsndash 120573120573 = 005∿01 for PCEPIs but = 01∿02 for CPIsndash Why Shelter the most cyclically sensitive component has a much larger weight in CPI than in PCEPI
Estimation Results III
This figure plots the sum of the estimated coefficients on lagged inflation terms using recursive samples that start in 1998Q1 and end in 2012Q1 2012Q2 hellip and 2018Q1 The Phillips curve equations are ldquounrestrictedrdquo as no assumption was imposed on the value of π before the estimation Instead the intercept of the equation which in theory equals απ was estimated and then the values of α and π were calculated by assuming the long-run restriction on the estimated coefficients
25
CBO
The slope of the Phillips curve Flat but steeper for CPIs than PCEPIsndash 120573120573 = 005∿01 for PCEPIs but = 01∿02 for CPIsndash Why Shelter the most cyclically sensitive component has a much larger weight in CPI than in PCEPI
Estimation Results III (Continued)
This figure plots the sum of the estimated coefficients on lagged inflation terms using recursive samples that start in 1998Q1 and end in 2012Q1 2012Q2 hellip and 2018Q1 The Phillips curve equations are ldquounrestrictedrdquo as no assumption was imposed on the value of π before the estimation Instead an intercept of the equation which in theory equals απ was estimated and then the value of α and π were calculated by assuming the long-run restriction on the estimated coefficients
26
CBO
Reviewing the Findings
27
CBO
Phillips-curve analysis at the component level provides insight intondash Cyclical sensitivity of aggregate inflation
For most service components and food inflation process is pro-cyclical For most non-food good components inflation process is not pro-cyclical
Need better understanding and models for goods price inflationndash Difference in the behaviors of various inflation measures
CPI is more cyclically sensitive than PCEPI because shelter has larger share in CPI
Non-XFE measures of core inflation better capture movements in trend inflation because they contain fewer noisy goods components
The aggregate Phillips curve has shifted away from ldquoaccelerationistrdquo toward an ldquoanchoredrdquo form but the process appears incomplete
ndash Need better understanding of the formation process of inflation expectations particularly those of consumers and firms
Conclusions
28
CBO
Abdih Yasser Ravi Balakrishnan and Baoping Shang ldquoWhat Is Keeping US Core Inflation Low Insights From a Bottom-Up Approachrdquo International Monetary Fund 2016
Ball Laurence and Sandeep Mazumder ldquoInflation Dynamics and the Great Recessionrdquo Brookings Papers on Economic Activity (2011) 337ndash406
Blanchard Olivier ldquoThe Phillips Curve Back to the rsquo60s American Economic Review 1065 (2016) 31ndash34
Bils Mark and Peter J Klenow ldquoSome Evidence on the Importance of Sticky Pricesrdquo Journal of Political Economy 1125 (2004) 947ndash985
Coibion Olivier and Yuriy Gorodnichenko ldquoIs the Phillips Curve Alive and Well After All Inflation Expectations and the Missing Disinflationrdquo American Economic Journal Macroeconomics 71 (2015) 197ndash232
References
29
CBO
Coibion Olivier Yuriy Gorodnichenko and Rupal Kamdar ldquoThe Formation of Expectations Inflation and the Phillips Curverdquo No w23304 National Bureau of Economic Research 2017
Goolsbee Austan D and Peter J Klenow ldquoInternet Rising Prices Falling Measuring Inflation in a World of E-Commercerdquo AEA Papers and Proceedings Vol 108 2018
Stock J and Mark Watson ldquoSlack and Cyclically Sensitive Inflationrdquo ECB Forum on Central Banking Sintra Portugal 2018
Struyven Dann ldquoWhich Prices Still Respond to Slackrdquo Goldman Sachs Economics Research (October 31 2017)
References (Continued)
| Current vintage data | |||||||||||||||||||||||||||
| Dec-16 | Jan-17 | Feb-17 | Mar-17 | Apr-17 | May-17 | Jun-17 | Jul-17 | Aug-17 | Sep-17 | Oct-17 | Nov-17 | Dec-17 | |||||||||||||||
| Rose at 0-2 rate | 314 | 179 | 190 | 266 | 178 | 158 | 181 | 206 | 275 | 165 | 181 | 224 | 251 | ||||||||||||||
| Rose at 2-3 rate | 82 | 137 | 111 | 171 | 191 | 280 | 111 | 130 | 116 | 216 | 88 | 97 | 39 | ||||||||||||||
| Rose at 3-5 rate | 240 | 198 | 253 | 80 | 126 | 136 | 209 | 161 | 241 | 125 | 231 | 258 | 177 | ||||||||||||||
| Rose at 5-10 rate | 100 | 122 | 57 | 70 | 71 | 85 | 91 | 60 | 51 | 114 | 50 | 122 | 81 | ||||||||||||||
| Rose faster than 10 rate | 67 | 137 | 108 | 27 | 151 | 55 | 75 | 116 | 65 | 97 | 159 | 82 | 134 | ||||||||||||||
| 227 | 281 | 387 | 282 | 286 | 334 | 328 | 253 | 283 | 291 | 218 | 317 | ||||||||||||||||
| 212 | 172 | 215455310712 | 218771897151 | ||||||||||||||||||||||||
| 140 | 194 | 153949709569 | 74785941399 | ||||||||||||||||||||||||
| 177 | 157 | 175371335238 | 221799519999 | ||||||||||||||||||||||||
| 83 | 82 | 74591464835 | 84429446757 | ||||||||||||||||||||||||
| 90 | 94 | 92689863883 | 125100452725 | ||||||||||||||||||||||||
| 298 | 301 | 287942315763 | 275112741969 | ||||||||||||||||||||||||
| 2017Q1 | 2017Q2 | 2017Q3 | 2017Q4 | ||||||||||||||||||||||||
| Fell | 2983 | 3008 | 2879 | 2751 | |||||||||||||||||||||||
| Rose at 0-2 rate | 2118 | 1723 | 2155 | 2188 | |||||||||||||||||||||||
| Rose at 2-3 rate | 1396 | 1938 | 1539 | 748 | |||||||||||||||||||||||
| Rose at 3-5 rate | 1769 | 1573 | 1754 | 2218 | |||||||||||||||||||||||
| Rose at 5-10 rate | 829 | 821 | 746 | 844 | |||||||||||||||||||||||
| Rose faster than 10 rate | 905 | 937 | 927 | 1251 |
| Major Sectors | CPI | PCEPI | ||||
| Housing | 426 | 183 | ||||
| Health Care | 85 | 231 | ||||
| Food and Beverages | 146 | 137 | ||||
| Transportation | 153 | 90 | ||||
| Recreation | 57 | 89 | ||||
| Education and Communication | 70 | 46 | ||||
| Apparel | 30 | 29 | ||||
| Financial Services | 02 | 47 | ||||
| Other | 30 | 147 | ||||
| Total | 100 | 100 | ||||
| Data December 2016 |
| Naiumlve Phillips-Curve-Style Models (Sample 1998-2017) | |||||||||||||
| 8 | 9 | 10 | 11 | ||||||||||
| Variables | Constant | Lagged Inflation | Unemployment Gap | Adjusted R2 | Order of AR | Order of Lagged Rucgap | |||||||
| Owners Equivalent of Rent | 118 | 062 | -022 | 078 | 1 | 1 | |||||||
| (48) | (79) | -(40) | |||||||||||
| Rent of Primary Residence | 141 | 060 | -018 | 084 | 1 | 4 | |||||||
| (48) | (74) | -(33) | |||||||||||
| Medical Care Services | 131 | 067 | -007 | 032 | 2 | ||||||||
| (27) | (58) | -(09) | |||||||||||
| Education Services | 023 | 095 | -009 | 078 | 4 | 2 | |||||||
| (07) | (149) | -(16) | |||||||||||
| Transportation Services | 26 | 01 | -00 | 018 | 1 | 3 | |||||||
| (59) | (05) | -(02) | |||||||||||
| Apparel | -060 | 027 | 043 | 016 | 4 | 0 | |||||||
| -(19) | (15) | (23) | |||||||||||
| New Vehicles | -046 | 003 | 065 | 018 | 1 | 0 | |||||||
| -(17) | (03) | (39) | |||||||||||
| Used Cars and Trucks | -001 | 031 | 092 | 028 | 2 | 4 | |||||||
| -(00) | (35) | (19) | |||||||||||
| Medical Care Goods | 23 | 02 | -01 | 023 | 3 | ||||||||
| (51) | (14) | -(08) | |||||||||||
| Food away from Home | 116 | 060 | -008 | 050 | 1 | 2 | |||||||
| (40) | (62) | -(15) | |||||||||||
| Food at Home | 105 | 063 | -009 | 059 | 1 | ||||||||
| (37) | (86) | -(07) | |||||||||||
| Energy | 983 | -022 | -061 | 048 | 1 | ||||||||
| (48) | -(22) | -(06) | |||||||||||
| Unemployment Gap | Lagged Inflation | Constant | Adjusted R2 | Obs | Durbin-Watson Statistic | Order of Lagged Inflation | Order of Lagged Unemployment Gap | |||||||||||
| Services | ||||||||||||||||||
| Owners Equivalent of Rent | -021 | 062 | 113 | 078 | 83 | 171 | 1 | 1 | ||||||||||
| 000 | 000 | 024 | ||||||||||||||||
| Rent of Primary Residence | -015 | 067 | 116 | 084 | 83 | 217 | 1 | 5 | ||||||||||
| 000 | 000 | 026 | ||||||||||||||||
| Food away from Home | -008 | 061 | 108 | 057 | 83 | 251 | 2 | 2 | ||||||||||
| 007 | 000 | 025 | ||||||||||||||||
| Medical Care Services | -005 | 070 | 115 | 034 | 83 | 201 | 2 | 0 | ||||||||||
| 051 | 000 | 045 | ||||||||||||||||
| Education Services | -007 | 093 | 030 | 081 | 83 | 202 | 4 | 2 | ||||||||||
| 016 | 000 | 029 | ||||||||||||||||
| Transportation Services | -002 | -011 | 320 | 016 | 83 | 198 | 2 | 3 | ||||||||||
| 087 | 027 | 036 | ||||||||||||||||
| Goods | ||||||||||||||||||
| Apparel | 050 | 010 | -054 | 008 | 83 | 192 | 4 | 0 | ||||||||||
| 001 | 039 | 032 | ||||||||||||||||
| New Vehicles | 038 | 002 | -034 | 034 | 83 | 186 | 1 | 0 | ||||||||||
| 001 | 084 | 023 | ||||||||||||||||
| Used Cars and Trucks | 038 | 018 | -019 | 034 | 83 | 174 | 2 | 4 | ||||||||||
| 047 | 013 | 082 | ||||||||||||||||
| Food at Home | -005 | 065 | 103 | 057 | 83 | 237 | 1 | 0 | ||||||||||
| 072 | 000 | 027 | ||||||||||||||||
| Medical Care Goods | -005 | 046 | 169 | 056 | 83 | 196 | 3 | 0 | ||||||||||
| 053 | 000 | 028 | ||||||||||||||||
| Controlling Inflnm + Inflne | ||||||||||||||||||
| Unemployment Gap | Lagged Inflation | Constant | Adjusted R2 | Observations | Durbin-Watson Statistic | Order of Lagged Inflation | Order of Lagged Unemployment Gap | |||||||||||
| Owners Equivalent of Rent (OER) | -0212 | 0633 | 1120 | 077 | 80 | 179 | 1 | 1 | ||||||||||
| (0058) | (0082) | (0260) | ||||||||||||||||
| Rent of Primary Residence | -0171 | 0604 | 1395 | 084 | 80 | 201 | 1 | 5 | ||||||||||
| (0056) | (0085) | (0308) | ||||||||||||||||
| Medical Care Services | -0070 | 0693 | 1191 | 031 | 80 | 205 | 2 | 0 | ||||||||||
| (0083) | (0123) | (0514) | ||||||||||||||||
| Education Services | -0087 | 0947 | 0296 | 078 | 80 | 204 | 4 | 2 | ||||||||||
| (0055) | (0067) | (0354) | ||||||||||||||||
| Transportation Services | -0035 | 0154 | 2284 | 019 | 80 | 203 | 2 | 3 | ||||||||||
| (0130) | (0160) | (0485) | ||||||||||||||||
| Apparel | 0416 | 0305 | -0594 | 015 | 80 | 187 | 4 | 0 | ||||||||||
| (0187) | (0178) | (0327) | ||||||||||||||||
| New Vehicles | 0655 | 0021 | -0494 | 017 | 80 | 200 | 1 | 0 | ||||||||||
| (0169) | (0112) | (0287) | ||||||||||||||||
| Used Cars and Trucks | 0410 | 0215 | -0860 | 038 | 80 | 185 | 2 | 4 | ||||||||||
| (0535) | (0114) | (0902) | ||||||||||||||||
| Medical Care Goods | -0082 | 0202 | 2251 | 022 | 80 | 192 | 3 | 0 | ||||||||||
| (0105) | (0141) | (0458) | ||||||||||||||||
| Food away from Home | -0086 | 0613 | 1159 | 059 | 80 | 236 | 2 | 2 | ||||||||||
| (0132) | (0074) | (0302) | ||||||||||||||||
| Food at Home | -0065 | 0751 | 0781 | 053 | 80 | 216 | 1 | 0 | ||||||||||
| (0049) | (0116) | (0340) | ||||||||||||||||
| Energy | -0735 | 0068 | 2120 | 096 | 80 | 134 | 2 | 0 | ||||||||||
| (0311) | (0035) | (0651) | ||||||||||||||||
| Controlling Inflnm | ||||||||||||||||||
| Unemployment Gap | Lagged Inflation | Constant | Adjusted R2 | Observations | Durbin-Watson Statistic | Order of Lagged Inflation | Order of Lagged Unemployment Gap | |||||||||||
| Core (XFE) Services | ||||||||||||||||||
| Owners Equivalent of Rent (OER) | -0212 | 0632 | 1129 | 078 | 80 | 180 | 1 | 1 | ||||||||||
| (0058) | (0081) | (0257) | ||||||||||||||||
| Rent of Primary Residence | -0171 | 0605 | 1393 | 084 | 80 | 201 | 1 | 5 | ||||||||||
| (0055) | (0084) | (0302) | ||||||||||||||||
| Medical Care Services | -0068 | 0696 | 1189 | 032 | 80 | 205 | 2 | 0 | ||||||||||
| (0082) | (0122) | (0511) | ||||||||||||||||
| Education Services | -0087 | 0943 | 0287 | 078 | 80 | 201 | 4 | 2 | ||||||||||
| (0055) | (0067) | (0353) | ||||||||||||||||
| Transportation Services | -0030 | 0076 | 2602 | 017 | 80 | 202 | 2 | 3 | ||||||||||
| (0131) | (0152) | (0440) | ||||||||||||||||
| Apparel | 0426 | 0292 | -0544 | 016 | 80 | 189 | 4 | 0 | ||||||||||
| (0186) | (0176) | (0315) | ||||||||||||||||
| New Vehicles | 0658 | 0023 | -0436 | 017 | 80 | 196 | 1 | 0 | ||||||||||
| (0168) | (0112) | (0272) | ||||||||||||||||
| Used Cars and Trucks | 0399 | 0190 | -0322 | 036 | 80 | 171 | 2 | 4 | ||||||||||
| (0543) | (0115) | (0861) | ||||||||||||||||
| Medical Care Goods | -0080 | 0203 | 2289 | 022 | 80 | 193 | 3 | 0 | ||||||||||
| (0104) | (0140) | (0453) | ||||||||||||||||
| Food away from Home | -0090 | 0628 | 1038 | 059 | 80 | 237 | 2 | 2 | ||||||||||
| (0132) | (0073) | (0282) | ||||||||||||||||
| Food at Home | -0064 | 0754 | 0741 | 053 | 80 | 216 | 1 | 0 | ||||||||||
| (0049) | (0116) | (0338) | ||||||||||||||||
| Energy | -0678 | -0305 | 10270 | 049 | 80 | 198 | 2 | 0 | ||||||||||
| (1085) | (0114) | (2053) |
| Major CPI Components | Summary Statistics | Categorization | |||||||||||||||
| Mean | Standard Deviation | Relative Importance (2017) | Change in Relative Importantce 2007-2017 | XFE | Sticky CPI | Probability (= Median CPI) (1998-2007) | |||||||||||
| 1 | 2 | 3 | 4 | 5 | 6 | 7 | |||||||||||
| Core (XFE) Services | |||||||||||||||||
| Owners Equivalent of Rent (OER) | 27 | 11 | 232 | 298 | Y | Y | 52 | ||||||||||
| Rent of Primary Residence | 32 | 11 | 79 | 101 | Y | Y | 5 | ||||||||||
| Medical Care Services | 38 | 13 | 67 | 233 | Y | Y | 2 | ||||||||||
| Education Services | 49 | 15 | 30 | 058 | Y | Y | 0 | ||||||||||
| Transportation Services | 27 | 18 | 60 | -105 | Y | Y | 5 | ||||||||||
| Core (XFE) Goods | |||||||||||||||||
| Apparel | -03 | 25 | 31 | -189 | Y | N | 2 | ||||||||||
| New Vehicles | 01 | 23 | 36 | -142 | Y | N | 3 | ||||||||||
| Used Cars and Trucks | -03 | 8 | 21 | 020 | Y | N | 0 | ||||||||||
| Medical Care Goods | 29 | 16 | 18 | 059 | Y | Y | 1 | ||||||||||
| Food and Energy | |||||||||||||||||
| Food away from Home | 28 | 09 | 59 | 019 | N | Y | 11 | ||||||||||
| Food at Home | 21 | 27 | 77 | -201 | N | N | 6 | ||||||||||
| Energy | 36 | 202 | 75 | 078 | N | N | 1 | ||||||||||
| Unemployment Gap | Lagged Inflation | Constant | Adjusted R2 | Observations | Durbin-Watson Statistic | |||||||||
| PCE Services Less Energy | -014 | 032 | 191 | 046 | 83 | 185 | ||||||||
| (000) | (001) | (035) | ||||||||||||
| PCE Housing Services | -023 | 058 | 129 | 080 | 83 | 208 | ||||||||
| (000) | (000) | (024) | ||||||||||||
| CPI-U Owners Equivalent of Rent | -021 | 062 | 113 | 078 | 83 | 171 | ||||||||
| (000) | (000) | (024) | ||||||||||||
| CPI-U Rent of Primary Residence | -015 | 067 | 116 | 084 | 83 | 217 | ||||||||
| (000) | (000) | (026) | ||||||||||||
| PCE Health Care Services | -006 | 062 | 092 | 042 | 83 | 207 | ||||||||
| (038) | (000) | (026) | ||||||||||||
| PCE Services Less Energy Rent of Shelter amp Health care | -004 | 035 | 172 | 038 | 83 | 226 | ||||||||
| (050) | (000) | (028) | ||||||||||||
| CPI-U Services Less Energy Services amp Rent of Shelter | -015 | 040 | 188 | 034 | 83 | 218 | ||||||||
| (001) | (000) | (040) | ||||||||||||
| CPI-U Medical Care Services | -005 | 070 | 115 | 034 | 83 | 201 | ||||||||
| (051) | (000) | (045) | ||||||||||||
| CPI-U Food away from Home | -009 | 062 | 105 | 057 | 83 | 264 | ||||||||
| (005) | (000) | (025) | ||||||||||||
| CPI-U Education Services | -007 | 093 | 030 | 081 | 83 | 202 | ||||||||
| (016) | (000) | (029) | ||||||||||||
| CPI-U Transportation Services | -002 | -011 | 320 | 016 | 83 | 198 | ||||||||
| (087) | (027) | (036) | ||||||||||||
| Unemployment Gap | Lagged Inflation | Constant | Adjusted R2 | Observations | Durbin-Watson Statistic | |||||||||
| PCE Durable Goods | 008 | 028 | -154 | 027 | 83 | 183 | ||||||||
| (031) | (001) | (024) | ||||||||||||
| PCE Motor Vehicles and Parts | 031 | 030 | -021 | 043 | 83 | 178 | ||||||||
| (005) | (000) | (025) | ||||||||||||
| PCE Video Audio Photo amp | 016 | 060 | -395 | 044 | 83 | 222 | ||||||||
| Information Processing Equipment amp Media | (034) | (000) | (087) | |||||||||||
| PCE Other Durable Goods (including Medical Equipments) | -010 | 038 | -050 | 027 | 83 | 188 | ||||||||
| (028) | (000) | (019) | ||||||||||||
| PCE Nondurable Goods Less Energy | -014 | 073 | 039 | 044 | 83 | 203 | ||||||||
| (005) | (000) | (017) | ||||||||||||
| PCE Food amp Beverage Purchased for Off-Premises Consumption | -024 | 066 | 071 | 055 | 83 | 226 | ||||||||
| (004) | (000) | (024) | ||||||||||||
| CPI-U Food at Home | -027 | 063 | 082 | 052 | 83 | 216 | ||||||||
| (005) | (000) | (028) | ||||||||||||
| CPI-U Alcoholic Beverages | -017 | 034 | 147 | 016 | 83 | 209 | ||||||||
| (004) | (000) | (026) | ||||||||||||
| PCE Pharmaceutical amp Other Medical Products | -002 | 033 | 202 | 020 | 83 | 173 | ||||||||
| (088) | (000) | (039) | ||||||||||||
| PCE Other Nondurable Goods | 008 | 025 | 000 | 042 | 83 | 179 | ||||||||
| (046) | (001) | (018) | ||||||||||||
| CPI-U Apparel | 054 | 014 | -069 | 022 | 83 | 191 | ||||||||
| (000) | (018) | (030) | ||||||||||||
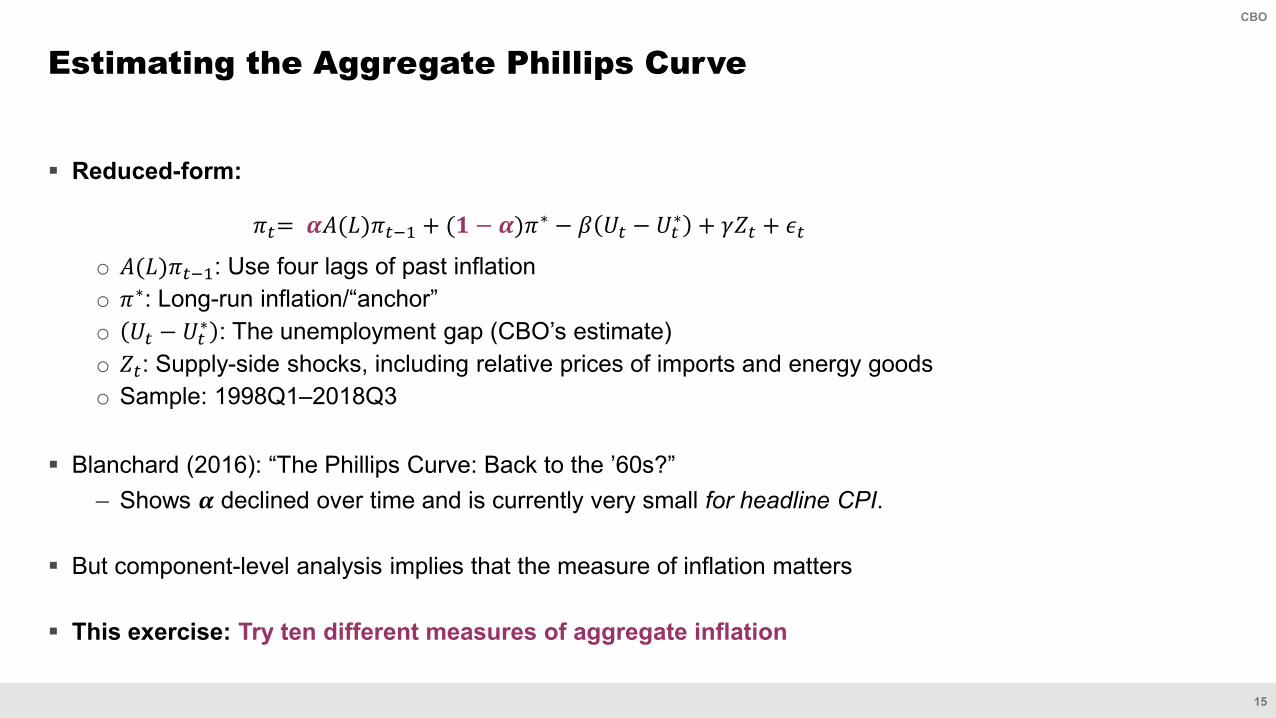
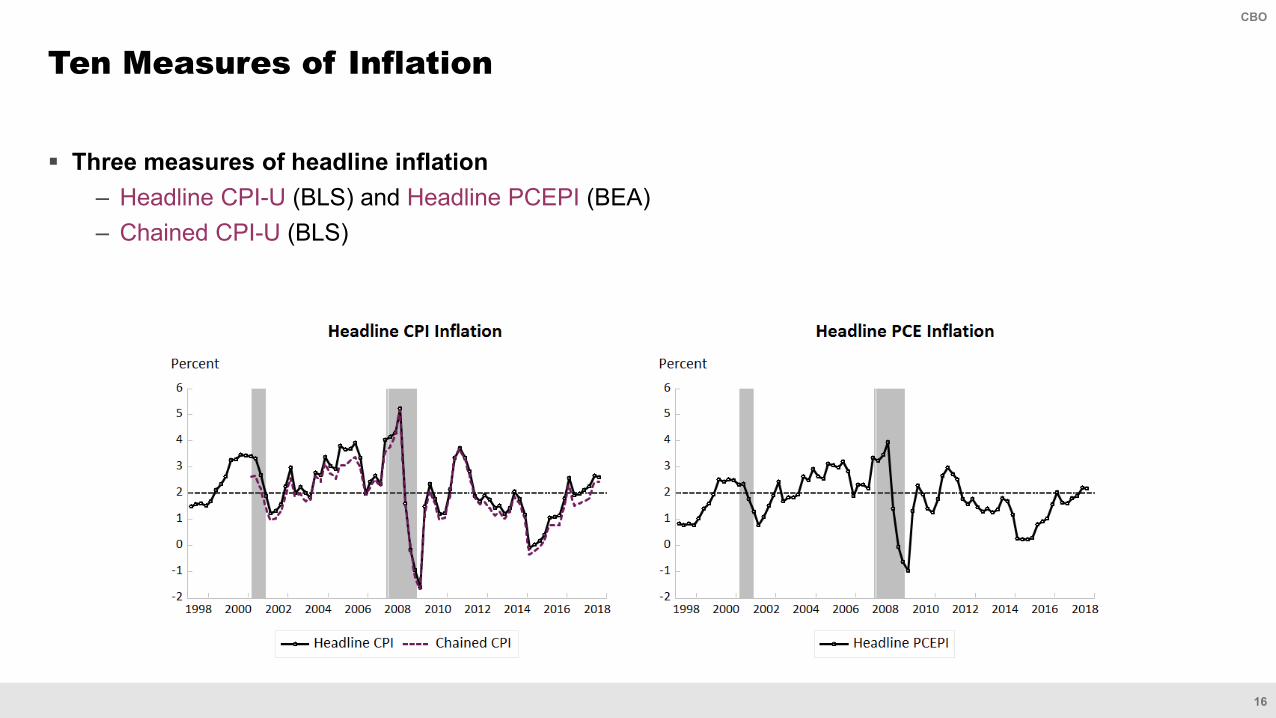
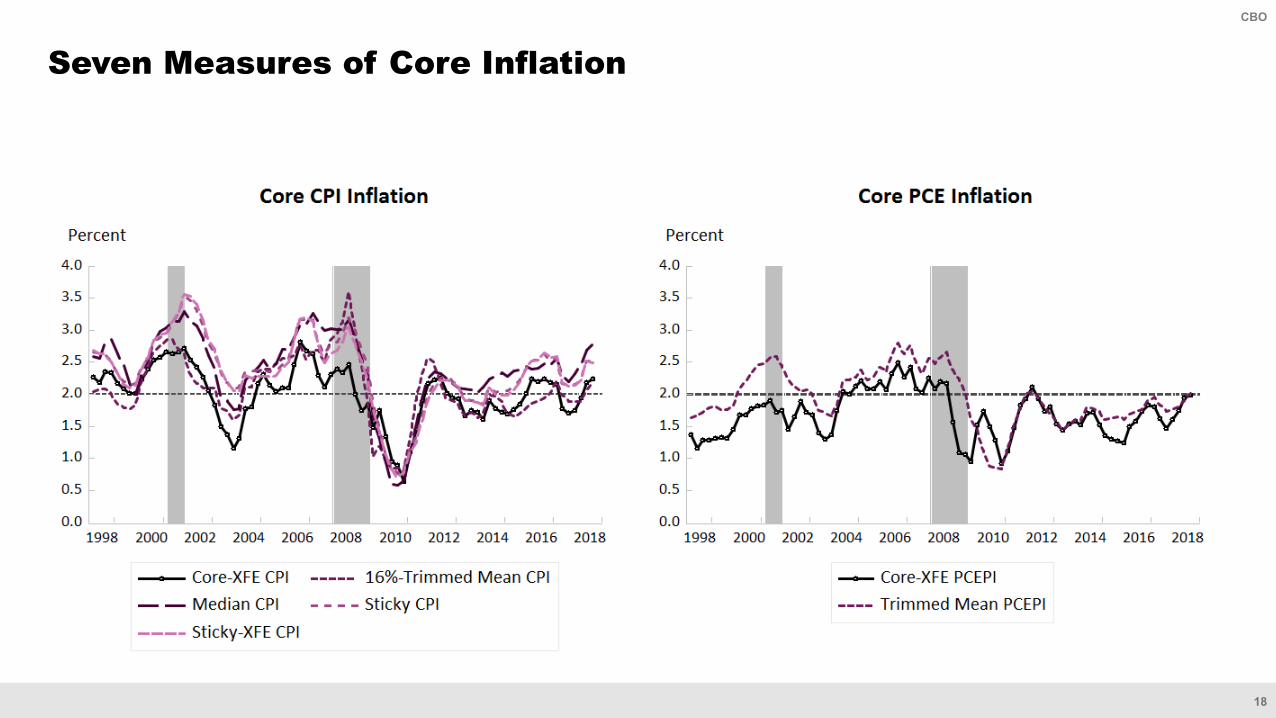
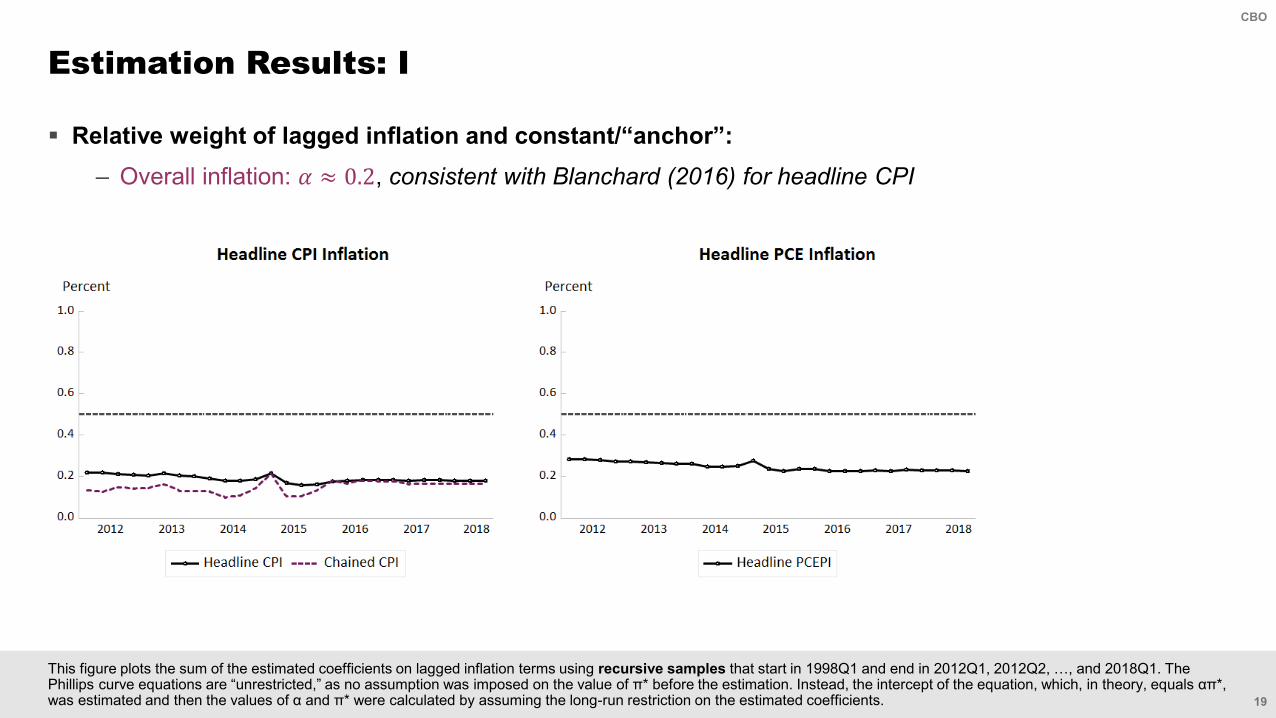
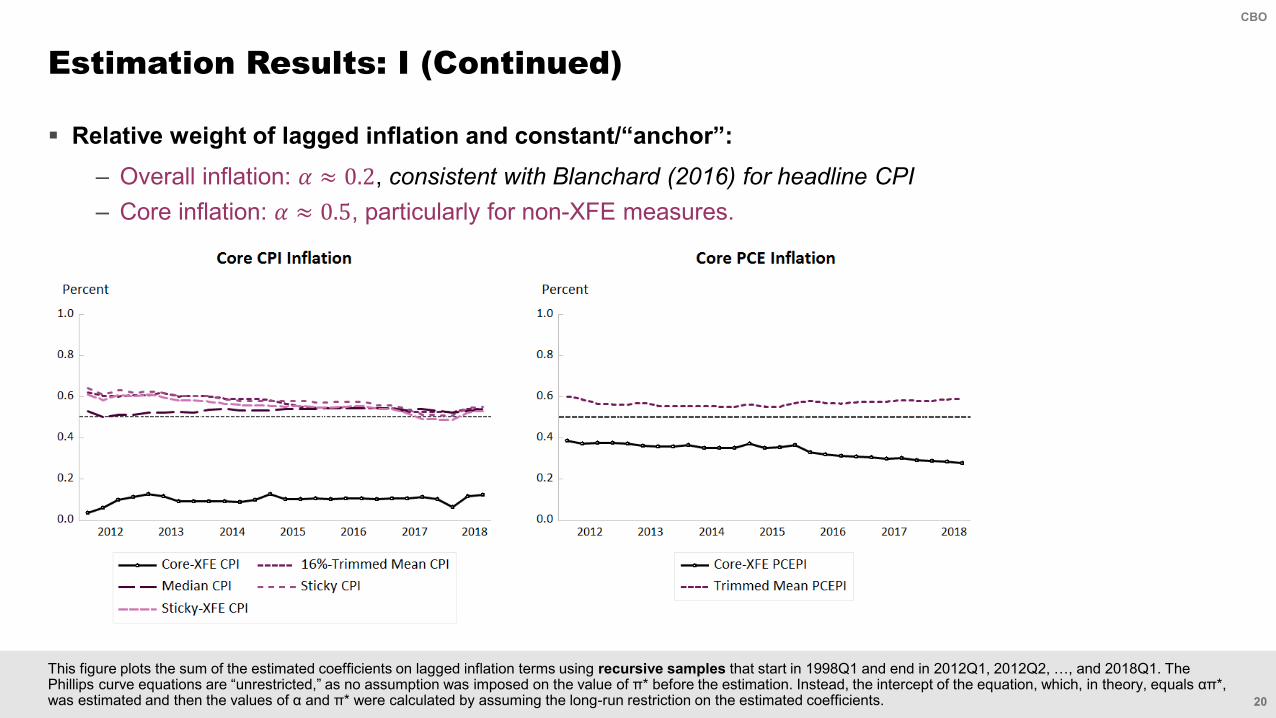
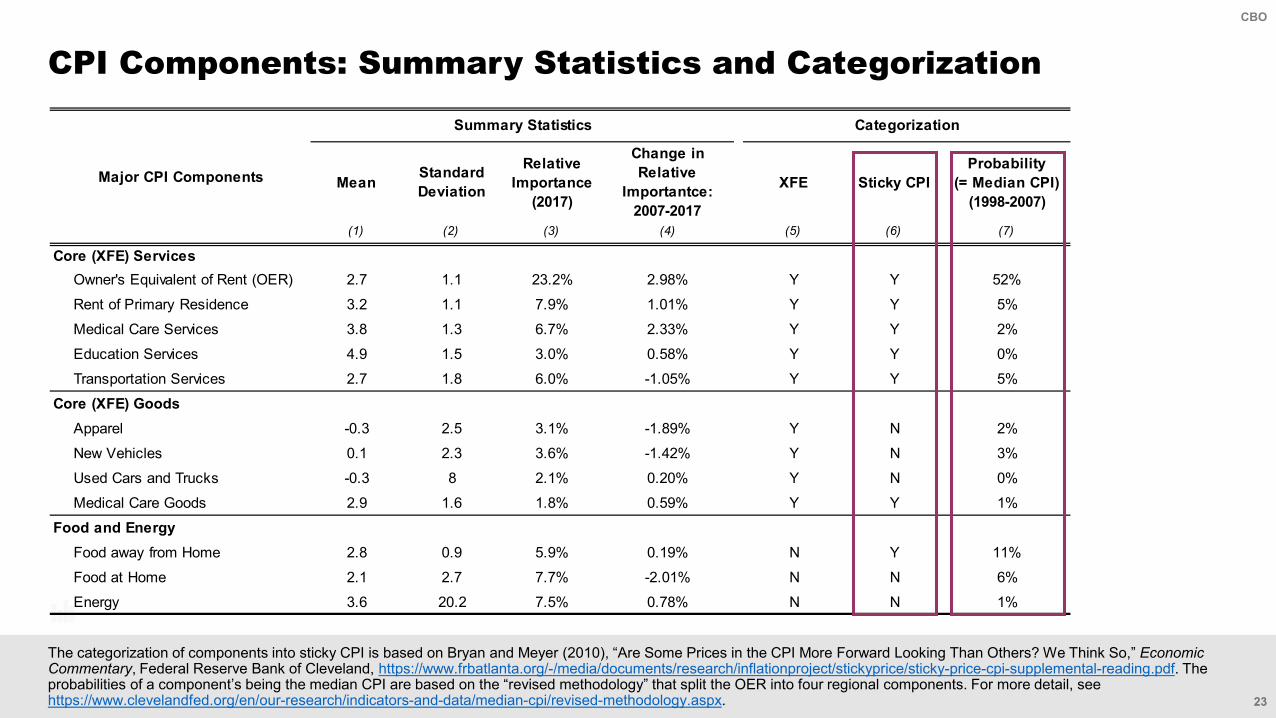
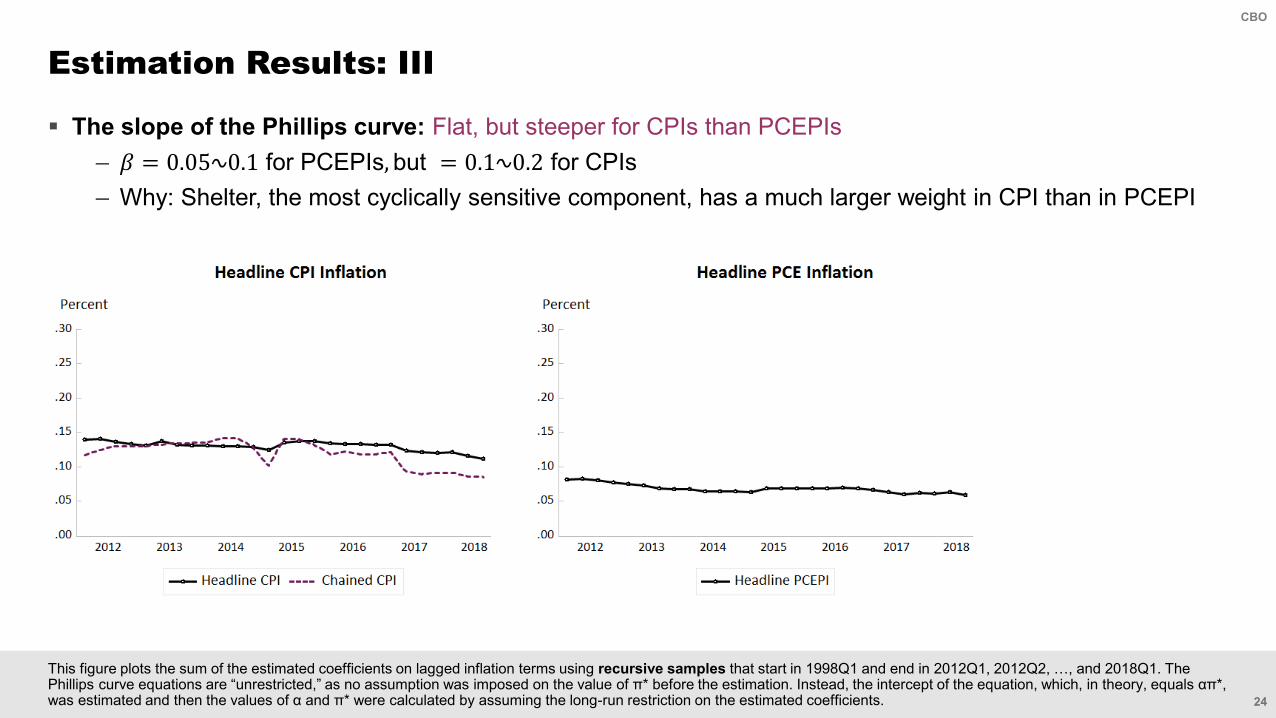
24
CBO
The slope of the Phillips curve Flat but steeper for CPIs than PCEPIsndash 120573120573 = 005∿01 for PCEPIs but = 01∿02 for CPIsndash Why Shelter the most cyclically sensitive component has a much larger weight in CPI than in PCEPI
Estimation Results III
This figure plots the sum of the estimated coefficients on lagged inflation terms using recursive samples that start in 1998Q1 and end in 2012Q1 2012Q2 hellip and 2018Q1 The Phillips curve equations are ldquounrestrictedrdquo as no assumption was imposed on the value of π before the estimation Instead the intercept of the equation which in theory equals απ was estimated and then the values of α and π were calculated by assuming the long-run restriction on the estimated coefficients
25
CBO
The slope of the Phillips curve Flat but steeper for CPIs than PCEPIsndash 120573120573 = 005∿01 for PCEPIs but = 01∿02 for CPIsndash Why Shelter the most cyclically sensitive component has a much larger weight in CPI than in PCEPI
Estimation Results III (Continued)
This figure plots the sum of the estimated coefficients on lagged inflation terms using recursive samples that start in 1998Q1 and end in 2012Q1 2012Q2 hellip and 2018Q1 The Phillips curve equations are ldquounrestrictedrdquo as no assumption was imposed on the value of π before the estimation Instead an intercept of the equation which in theory equals απ was estimated and then the value of α and π were calculated by assuming the long-run restriction on the estimated coefficients
26
CBO
Reviewing the Findings
27
CBO
Phillips-curve analysis at the component level provides insight intondash Cyclical sensitivity of aggregate inflation
For most service components and food inflation process is pro-cyclical For most non-food good components inflation process is not pro-cyclical
Need better understanding and models for goods price inflationndash Difference in the behaviors of various inflation measures
CPI is more cyclically sensitive than PCEPI because shelter has larger share in CPI
Non-XFE measures of core inflation better capture movements in trend inflation because they contain fewer noisy goods components
The aggregate Phillips curve has shifted away from ldquoaccelerationistrdquo toward an ldquoanchoredrdquo form but the process appears incomplete
ndash Need better understanding of the formation process of inflation expectations particularly those of consumers and firms
Conclusions
28
CBO
Abdih Yasser Ravi Balakrishnan and Baoping Shang ldquoWhat Is Keeping US Core Inflation Low Insights From a Bottom-Up Approachrdquo International Monetary Fund 2016
Ball Laurence and Sandeep Mazumder ldquoInflation Dynamics and the Great Recessionrdquo Brookings Papers on Economic Activity (2011) 337ndash406
Blanchard Olivier ldquoThe Phillips Curve Back to the rsquo60s American Economic Review 1065 (2016) 31ndash34
Bils Mark and Peter J Klenow ldquoSome Evidence on the Importance of Sticky Pricesrdquo Journal of Political Economy 1125 (2004) 947ndash985
Coibion Olivier and Yuriy Gorodnichenko ldquoIs the Phillips Curve Alive and Well After All Inflation Expectations and the Missing Disinflationrdquo American Economic Journal Macroeconomics 71 (2015) 197ndash232
References
29
CBO
Coibion Olivier Yuriy Gorodnichenko and Rupal Kamdar ldquoThe Formation of Expectations Inflation and the Phillips Curverdquo No w23304 National Bureau of Economic Research 2017
Goolsbee Austan D and Peter J Klenow ldquoInternet Rising Prices Falling Measuring Inflation in a World of E-Commercerdquo AEA Papers and Proceedings Vol 108 2018
Stock J and Mark Watson ldquoSlack and Cyclically Sensitive Inflationrdquo ECB Forum on Central Banking Sintra Portugal 2018
Struyven Dann ldquoWhich Prices Still Respond to Slackrdquo Goldman Sachs Economics Research (October 31 2017)
References (Continued)
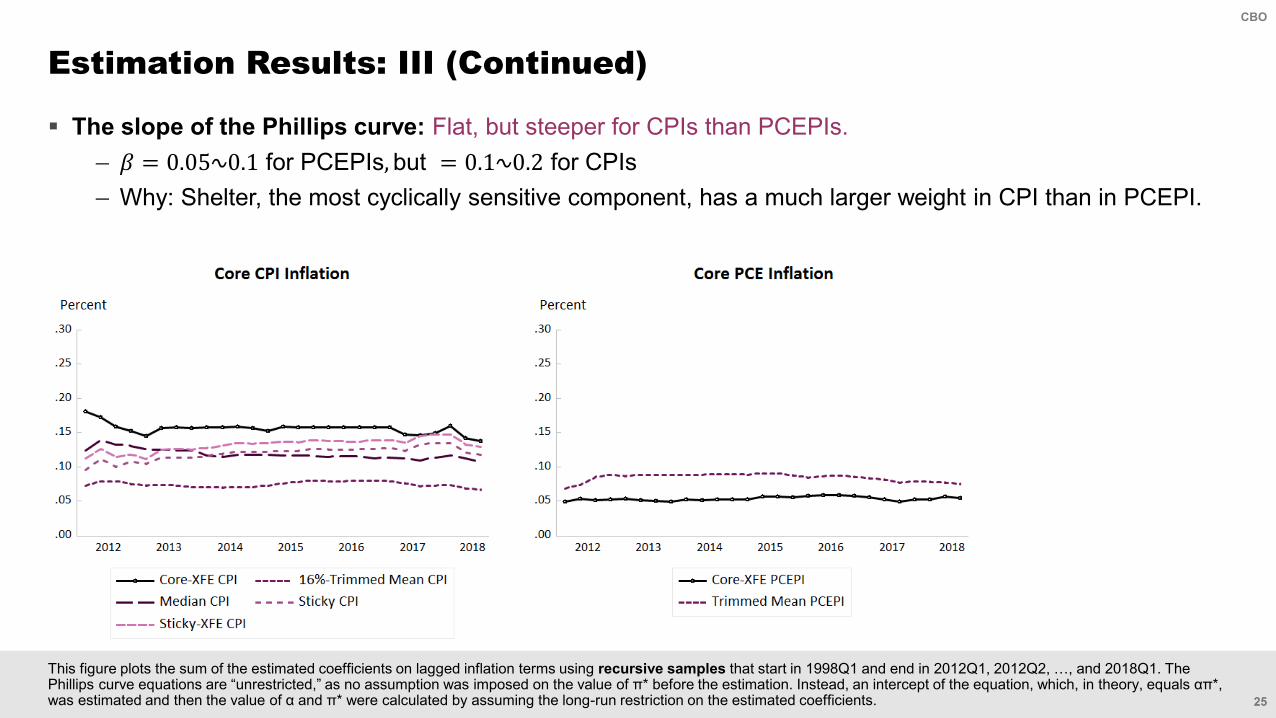
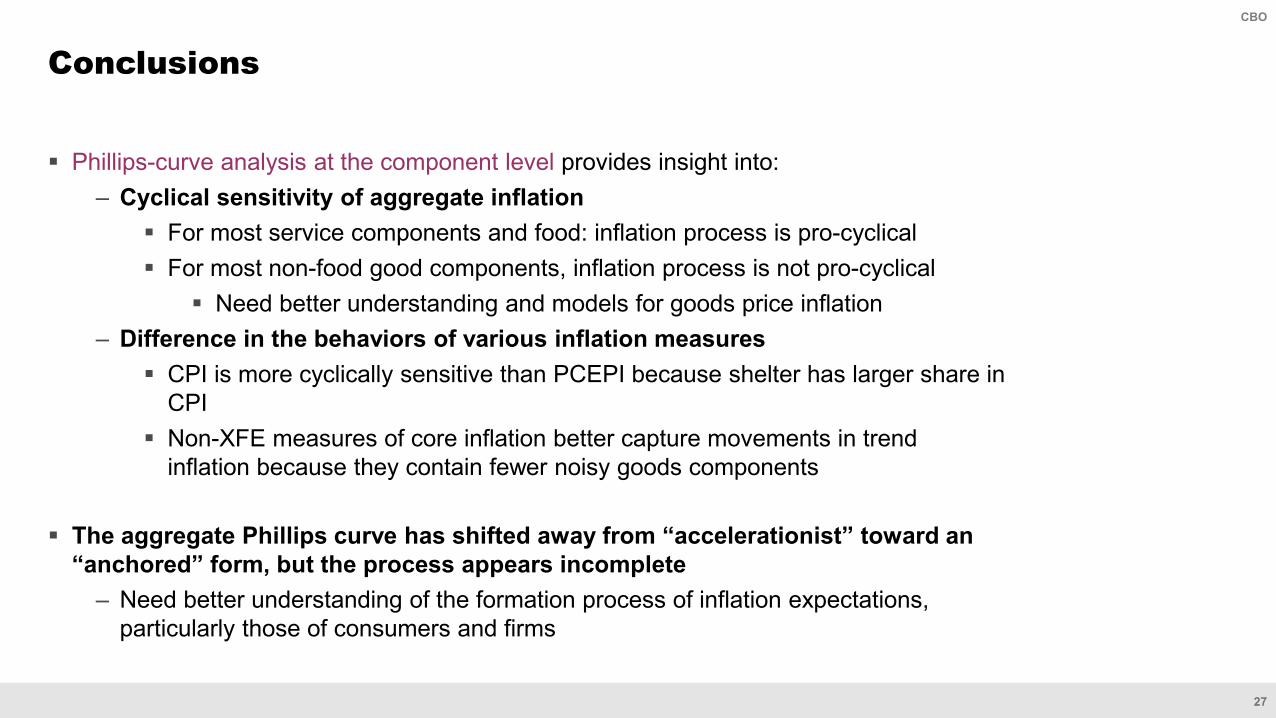