Embed Size (px)
Citation preview
B32
INFLUENCE OF MACROECONOMIC VARIABLES ON
STOCK PRICE INDEX: EVIDENCE FROM MALAYSIA
BY
ANG SIN YIN
LEE YING EN
LEONG YEW WAI
LIM CHEE HERNG
ONG BAO SHENG
A research project submitted in partial fulfillment of the
requirement for the degree of
BACHELOR OF FINANCE (HONS)
UNIVERSITI TUNKU ABDUL RAHMAN
FACULTY OF BUSINESS AND FINANCE
DEPARTMENT OF FINANCE
APRIL 2017
Influence of Macroeconomic Variables on Stock Price Index: Evidence from Malaysia
Undergraduate Research Project ii Faculty of Business and Finance
Copyright @ 2017
ALL RIGHTS RESERVED. No part of this paper may be reproduced, stored in a
retrieval system, or transmitted in any form or by any means, graphic, electronic,
mechanical, photocopying, recording, scanning, or otherwise, without the prior
consent of the authors.
Influence of Macroeconomic Variables on Stock Price Index: Evidence from Malaysia
Undergraduate Research Project iii Faculty of Business and Finance
DECLARATION
We hereby declare that:
(1) This undergraduate research project is the end result of our own work and that
due acknowledgement has been given in the references to ALL sources of
information be they printed, electronic, or personal.
(2) No portion of this research project has been submitted in support of any
application for any other degree or qualification of this or any other university,
or other institutes of learning.
(3) Equal contribution has been made by each group member in completing the
research project.
(4) The word count of this research report is 19813 words.
Name of Student: Student ID: Signature:
1. ANG SIN YIN 1303233 __________________
2. LEE YING EN 1401540 __________________
3. LEONG YEW WAI 1304109 __________________
4. LIM CHEE HERNG 1402491 __________________
5. ONG BAO SHENG 1304042 __________________
Date: _______________________
Influence of Macroeconomic Variables on Stock Price Index: Evidence from Malaysia
Undergraduate Research Project iv Faculty of Business and Finance
ACKNOWLEDGEMENT
First and foremost, we would like to express our deepest gratitude to our supervisor,
Encik Aminuddin Bin Ahmad for his support and inspiration throughout this research
project and also for his efforts in overseeing the whole progress of our project. We
really appreciate his dedication and the faith that he had given us especially when we
faced difficulties. We also would like to draw sincere thanks to lectures who shared
their valuable information with us.
Besides, we would like to thank our second examiner, Cik Hartini Binti Ab Aziz, for
her constructive criticisms on our work before the final submission. With her advice
and willingness to point out our weaknesses and certain details that we had carelessly
overlooked, we have rectified the errors that we made during presentation as well as in
the report.
Apart from that, we appreciate for the infrastructures and facilities provided by
Universiti Tunku Abdul Rahman (UTAR). With the Bloomberg Terminal subscribed
by UTAR library, we are able to acquire data, news, journal articles and information
required in conducting our research.
Finally, credit is also given to our families and friends for their understanding and
encouragement. And most importantly, thanks to our group members who strive
together to accomplish this research paper. Their dedications are gratefully
acknowledged, together with the sincere apologies to those we have inadvertently
failed to mention.
Influence of Macroeconomic Variables on Stock Price Index: Evidence from Malaysia
Undergraduate Research Project v Faculty of Business and Finance
TABLE OF CONTENTS
Page
Copyright ...................................................................................................................... ii
Declaration ................................................................................................................... iii
Acknowledgement ....................................................................................................... iv
Table of Contents .......................................................................................................... v
List of Tables ............................................................................................................... xi
List of Figures ............................................................................................................. xii
List of Abbreviations ................................................................................................. xiii
List of Appendices ..................................................................................................... xvi
Preface....................................................................................................................... xvii
Abstract .................................................................................................................... xviii
CHAPTER 1 RESEARCH OVERVIEW ................................................................ 1
1.0 Introduction ........................................................................................ 1
1.1 Background ........................................................................................ 1
1.1.1 Background of Malaysia Economy ...................................... 1
1.1.2 Background of Malaysia Stock Market ................................ 2
1.2 Problem Statement ............................................................................. 3
1.3 Research Question .............................................................................. 5
1.4 Research Objectives ........................................................................... 5
Influence of Macroeconomic Variables on Stock Price Index: Evidence from Malaysia
Undergraduate Research Project vi Faculty of Business and Finance
1.4.1 General Objectives ............................................................... 5
1.4.2 Specific Objectives ............................................................... 5
1.5 Hypotheses of the Study ..................................................................... 6
1.5.1 Real Interest Rate .................................................................. 6
1.5.2 Real Effective Exchange Rate .............................................. 6
1.5.3 Inflation Rate ........................................................................ 6
1.5.4 GDP Growth Rate ................................................................. 6
1.6 Significance of Study ......................................................................... 7
1.7 Chapter Layout ................................................................................... 7
1.8 Conclusion .......................................................................................... 8
CHAPTER 2 LITERATURE REVIEW .................................................................. 9
2.0 Introduction ........................................................................................ 9
2.1 Review of Literature........................................................................... 9
2.1.1 Stock Index ........................................................................... 9
2.1.2 Real Interest Rate ................................................................ 11
2.1.3 Real Effective Exchange Rate ............................................ 14
2.1.4 Inflation Rate ...................................................................... 16
2.1.5 GDP Growth Rate ............................................................... 18
2.2 Review of Relevant Theories ............................................................ 20
2.2.1 Arbitrage Pricing Theory .................................................... 20
2.2.2 Gordon Growth Model ....................................................... 21
2.2.3 Purchasing Power Parity (PPP) .......................................... 22
2.2.4 Fisher Effect Hypothesis .................................................... 23
Influence of Macroeconomic Variables on Stock Price Index: Evidence from Malaysia
Undergraduate Research Project vii Faculty of Business and Finance
2.2.5 Demand Following Hypothesis .......................................... 24
2.3 Proposed Theoretical Framework .................................................... 25
2.4 Conclusion ........................................................................................ 25
CHAPTER 3 METHODOLOGY .......................................................................... 26
3.0 Introduction ...................................................................................... 26
3.1 Research Design ............................................................................... 26
3.2 Data Collection Method ................................................................... 26
3.2.1 Secondary Data ................................................................... 27
3.3 Data Processing ................................................................................ 28
3.4 Econometric Regression Model ....................................................... 29
3.4.1 Econometric Function......................................................... 29
3.4.2 Econometric Model ............................................................ 29
3.4.3 Multiple Linear Regression Model (MLRM) ..................... 29
3.5 Data Analysis ................................................................................... 30
3.5.1 E-views 7 ............................................................................ 30
3.5.2 Ordinary Least Square (OLS) ............................................. 30
3.5.3 Diagnostic Checking ........................................................... 31
3.5.3.1 Normality Test ................................................... 31
3.5.3.2 Multicollinearity ............................................... 32
3.5.3.3 Heteroscedasticity .............................................. 33
3.5.3.4 Autocorrelation .................................................. 34
3.5.3.5 Model Specification ........................................... 36
3.5.3.6 T-test ................................................................... 36
Influence of Macroeconomic Variables on Stock Price Index: Evidence from Malaysia
Undergraduate Research Project viii Faculty of Business and Finance
3.5.3.7 F-test ................................................................... 37
3.6 Conclusion ........................................................................................ 38
CHAPTER 4 DATA ANALYSIS ......................................................................... 39
4.0 Introduction ...................................................................................... 39
4.1 Ordinary Least Square Model .......................................................... 39
4.1.1 Estimation of the Econometric Model ................................ 39
4.1.1.1 Interpretation of Slope Coefficients .................. 40
4.1.1.2 Interpretation of Goodness of Fit ...................... 41
4.2 Normality Test.................................................................................. 41
4.2.1 Jarque-Bera Normality Test ............................................... 41
4.3 Diagnostic Checking ........................................................................ 42
4.3.1 Multicollinearity Test ......................................................... 42
4.3.1.1 High R2 but few Significant T-ratio .................. 42
4.3.1.2 High Pairwise Correlation Among X’s ............. 43
4.3.1.3 Variance Inflation Factor and Tolerance Fator ... 43
4.3.2 Heteroscedasticity Test ...................................................... 44
4.3.3 Autocorrelation Test ........................................................... 45
4.3.4 Regression Specification Test ........................................... 46
4.4 Hypothesis Testing ........................................................................... 47
4.4.1 Overall Model’s Sgnificance .............................................. 47
4.4.2 Individual Partial Regression Coefficient ........................... 48
4.4.2.1 Real Interest Rate ...............................................48
4.4.2.2 Real Effective Exchange Rate ........................... 49
Influence of Macroeconomic Variables on Stock Price Index: Evidence from Malaysia
Undergraduate Research Project ix Faculty of Business and Finance
4.4.2.3 Inflation Rate ...................................................... 50
4.4.2.4 GDP Growth Rate ............................................... 51
4.5 Conclusion ........................................................................................ 52
CHAPTER 5 DISCUSSION, CONCLUSION AND IMPLICATIONS ............... 53
5.0 Introduction ...................................................................................... 53
5.1 Summary of Statistical Analysis ...................................................... 53
5.2 Discussion of Major Findings .......................................................... 54
5.2.1 Real Interest Rate ................................................................ 54
5.2.2 Real Effective Exchange Rate ............................................ 55
5.2.3 Inflation Rate ...................................................................... 56
5.2.4 GDP Growth Rate ............................................................... 56
5.3 Implication of the Study ................................................................... 57
5.3.1 Real Interest Rate ................................................................ 57
5.3.2 Real Effective Exchange Rate ............................................ 59
5.3.3 Inflation Rate ...................................................................... 59
5.3.4 GDP Growth Rate ............................................................... 60
5.4 Limitation ......................................................................................... 61
5.4.1 Use of Annual Data ............................................................ 62
5.4.2 Stock Index Restrictions ..................................................... 62
5.5 Recommendation .............................................................................. 63
5.5.1 Behavioural Finance ........................................................... 63
5.5.2 Negative Shock ................................................................... 63
5.5.3 Industrial Production Index (IPI) ........................................ 64
Influence of Macroeconomic Variables on Stock Price Index: Evidence from Malaysia
Undergraduate Research Project x Faculty of Business and Finance
5.5.4 Include Qualitative Variables ............................................. 65
5.6 Conclusion ........................................................................................ 65
REFERENCES ........................................................................................................... 67
APPENDICES ............................................................................................................ 77
Influence of Macroeconomic Variables on Stock Price Index: Evidence from Malaysia
Undergraduate Research Project xi Faculty of Business and Finance
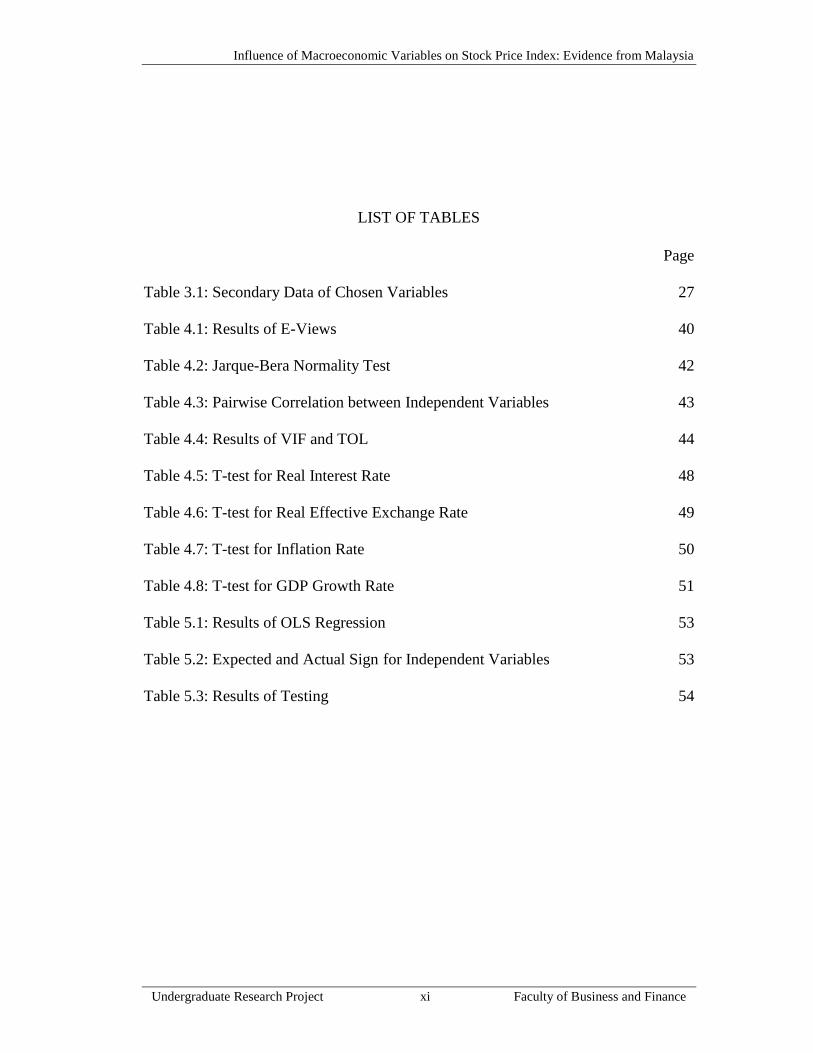
LIST OF TABLES
Page
Table 3.1: Secondary Data of Chosen Variables 27
Table 4.1: Results of E-Views 40
Table 4.2: Jarque-Bera Normality Test 42
Table 4.3: Pairwise Correlation between Independent Variables 43
Table 4.4: Results of VIF and TOL 44
Table 4.5: T-test for Real Interest Rate 48
Table 4.6: T-test for Real Effective Exchange Rate 49
Table 4.7: T-test for Inflation Rate 50
Table 4.8: T-test for GDP Growth Rate 51
Table 5.1: Results of OLS Regression 53
Table 5.2: Expected and Actual Sign for Independent Variables 53
Table 5.3: Results of Testing 54
Influence of Macroeconomic Variables on Stock Price Index: Evidence from Malaysia
Undergraduate Research Project xii Faculty of Business and Finance
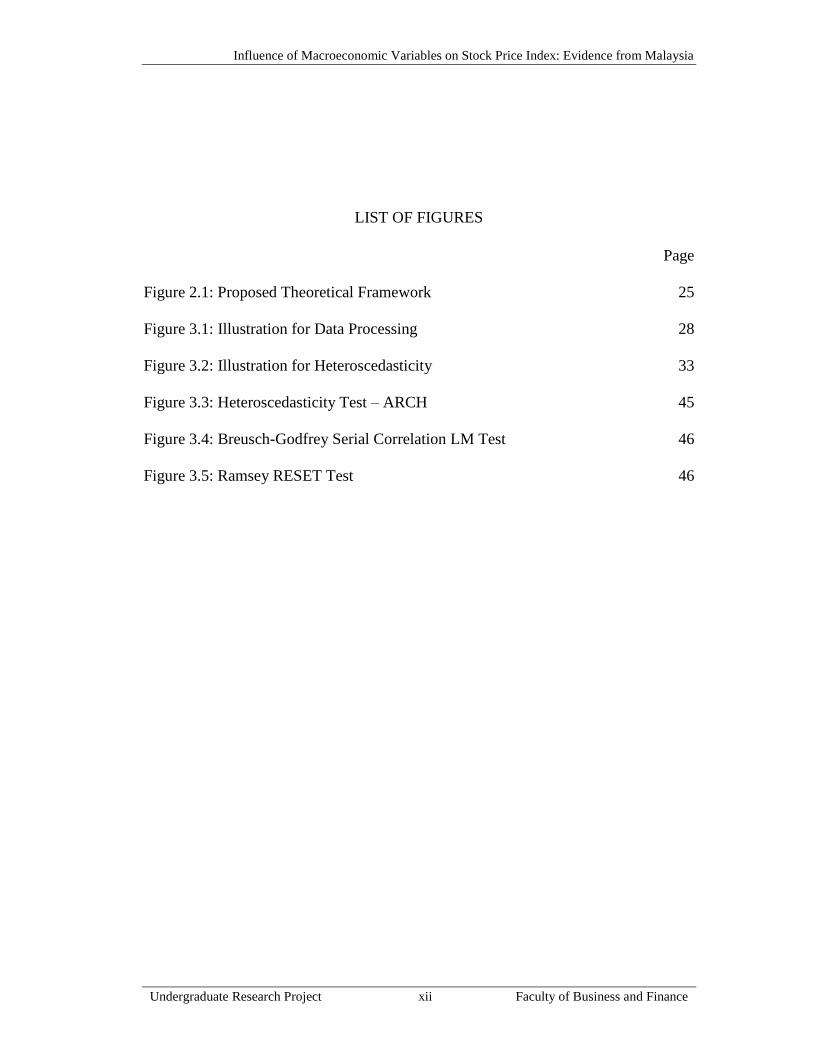
LIST OF FIGURES
Page
Figure 2.1: Proposed Theoretical Framework 25
Figure 3.1: Illustration for Data Processing 28
Figure 3.2: Illustration for Heteroscedasticity 33
Figure 3.3: Heteroscedasticity Test – ARCH 45
Figure 3.4: Breusch-Godfrey Serial Correlation LM Test 46
Figure 3.5: Ramsey RESET Test 46
Influence of Macroeconomic Variables on Stock Price Index: Evidence from Malaysia
Undergraduate Research Project xiii Faculty of Business and Finance
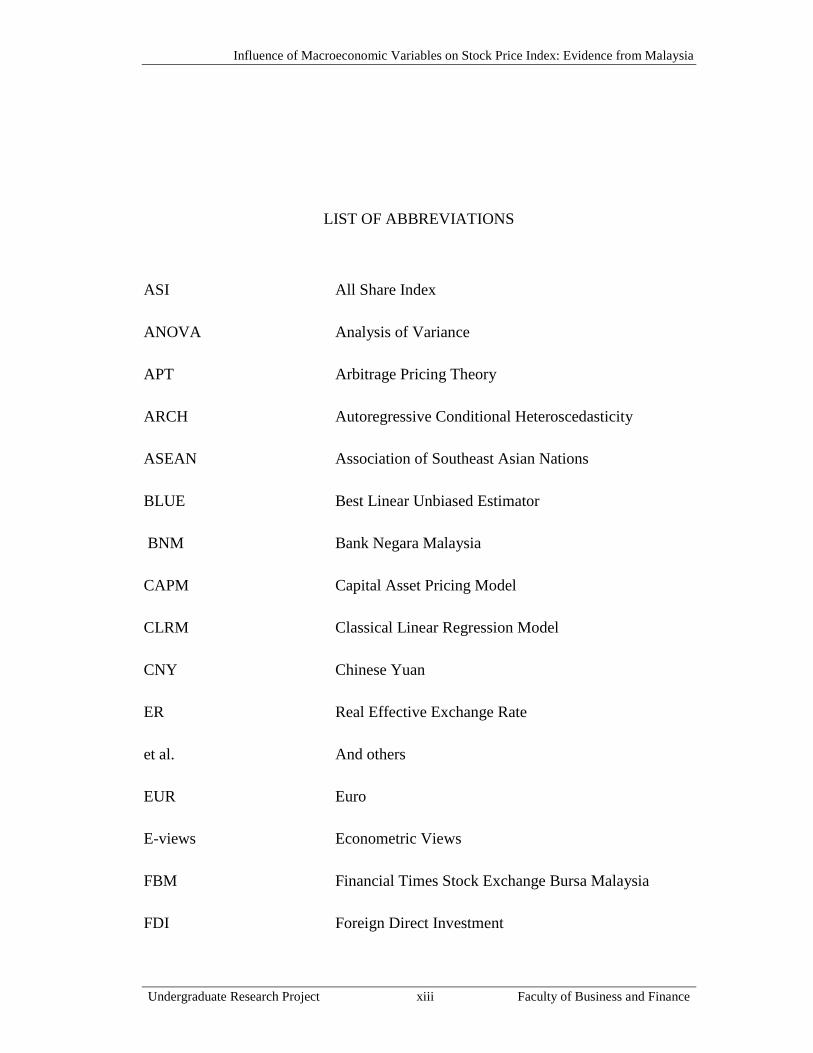
LIST OF ABBREVIATIONS
ASI All Share Index
ANOVA Analysis of Variance
APT Arbitrage Pricing Theory
ARCH Autoregressive Conditional Heteroscedasticity
ASEAN Association of Southeast Asian Nations
BLUE Best Linear Unbiased Estimator
BNM Bank Negara Malaysia
CAPM Capital Asset Pricing Model
CLRM Classical Linear Regression Model
CNY Chinese Yuan
ER Real Effective Exchange Rate
et al. And others
EUR Euro
E-views Econometric Views
FBM Financial Times Stock Exchange Bursa Malaysia
FDI Foreign Direct Investment
Influence of Macroeconomic Variables on Stock Price Index: Evidence from Malaysia
Undergraduate Research Project xiv Faculty of Business and Finance
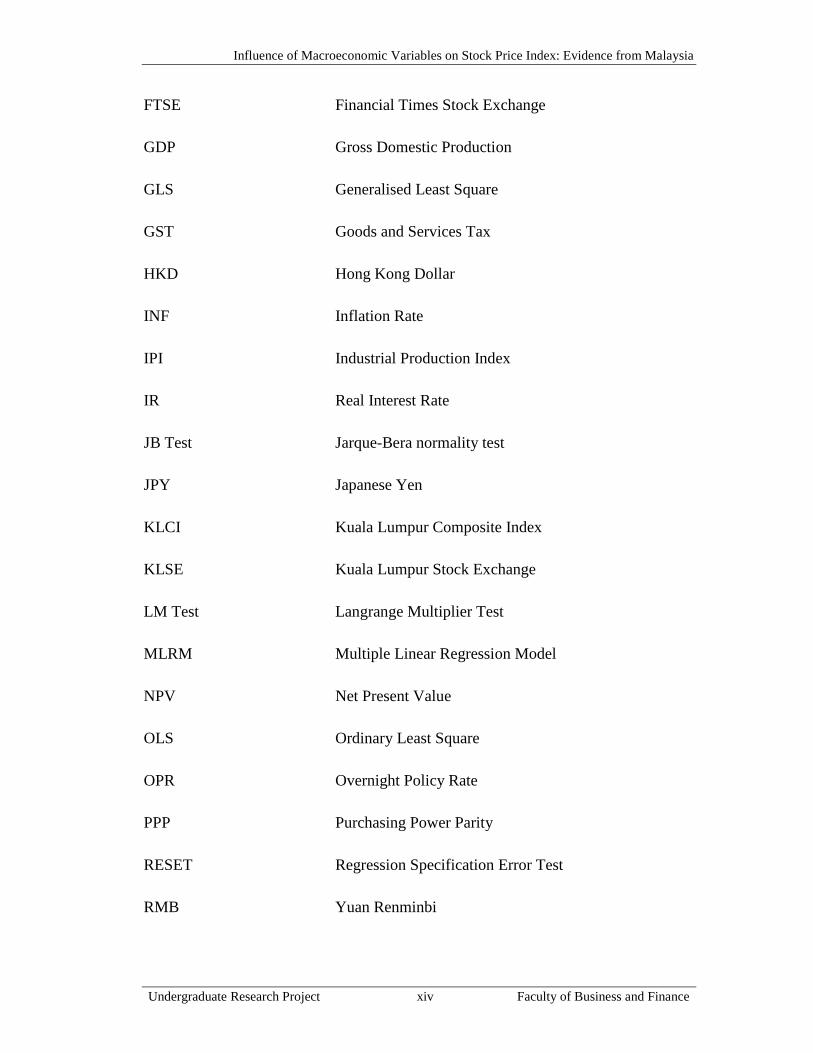
FTSE Financial Times Stock Exchange
GDP Gross Domestic Production
GLS Generalised Least Square
GST Goods and Services Tax
HKD Hong Kong Dollar
INF Inflation Rate
IPI Industrial Production Index
IR Real Interest Rate
JB Test Jarque-Bera normality test
JPY Japanese Yen
KLCI Kuala Lumpur Composite Index
KLSE Kuala Lumpur Stock Exchange
LM Test Langrange Multiplier Test
MLRM Multiple Linear Regression Model
NPV Net Present Value
OLS Ordinary Least Square
OPR Overnight Policy Rate
PPP Purchasing Power Parity
RESET Regression Specification Error Test
RMB Yuan Renminbi
Influence of Macroeconomic Variables on Stock Price Index: Evidence from Malaysia
Undergraduate Research Project xv Faculty of Business and Finance
TOL Tolerance Factor
TPP Trans-Pacific Partnership
US United States
USD United States Dollar
UTAR Universiti Tunku Abdul Rahman
VIF Variance Inflation Factor
WLS Weighted Least Square
Influence of Macroeconomic Variables on Stock Price Index: Evidence from Malaysia
Undergraduate Research Project xvi Faculty of Business and Finance
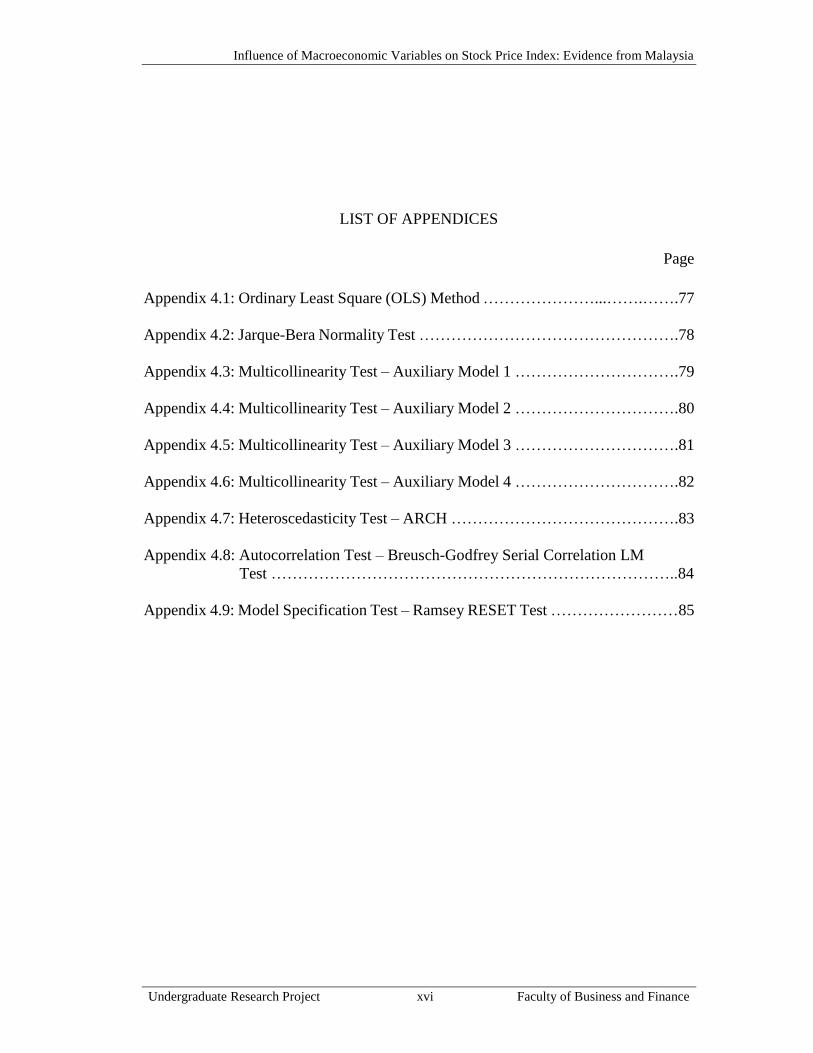
LIST OF APPENDICES
Page
Appendix 4.1: Ordinary Least Square (OLS) Method …………………...…….…….77
Appendix 4.2: Jarque-Bera Normality Test ………………………………………….78
Appendix 4.3: Multicollinearity Test – Auxiliary Model 1 ………………………….79
Appendix 4.4: Multicollinearity Test – Auxiliary Model 2 ………………………….80
Appendix 4.5: Multicollinearity Test – Auxiliary Model 3 ………………………….81
Appendix 4.6: Multicollinearity Test – Auxiliary Model 4 ………………………….82
Appendix 4.7: Heteroscedasticity Test – ARCH …………………………………….83
Appendix 4.8: Autocorrelation Test – Breusch-Godfrey Serial Correlation LM
Test …………………………………………………………………..84
Appendix 4.9: Model Specification Test – Ramsey RESET Test ……………………85

Influence of Macroeconomic Variables on Stock Price Index: Evidence from Malaysia
Undergraduate Research Project xvii Faculty of Business and Finance
PREFACE
Stock price index is indicative of stock market performance of a nation at large. That
being said, market participants are often concerned with how stock price index can be
affected by economy indicators at macro-level. Although many studies had been
conducted on this topic; however, studies in the case of Malaysia are still lacking and
results are somewhat inconclusive.
By employing multi-regression model, this research intends to discover how Malaysia
stock price index is influenced by macroeconomic variables. This research could
provide useful information or guidelines to several parties such as policymakers, firms,
investors, and researchers who want to gain more understanding and knowledge about
Malaysian stock market performance.
Influence of Macroeconomic Variables on Stock Price Index: Evidence from Malaysia
Undergraduate Research Project xviii Faculty of Business and Finance
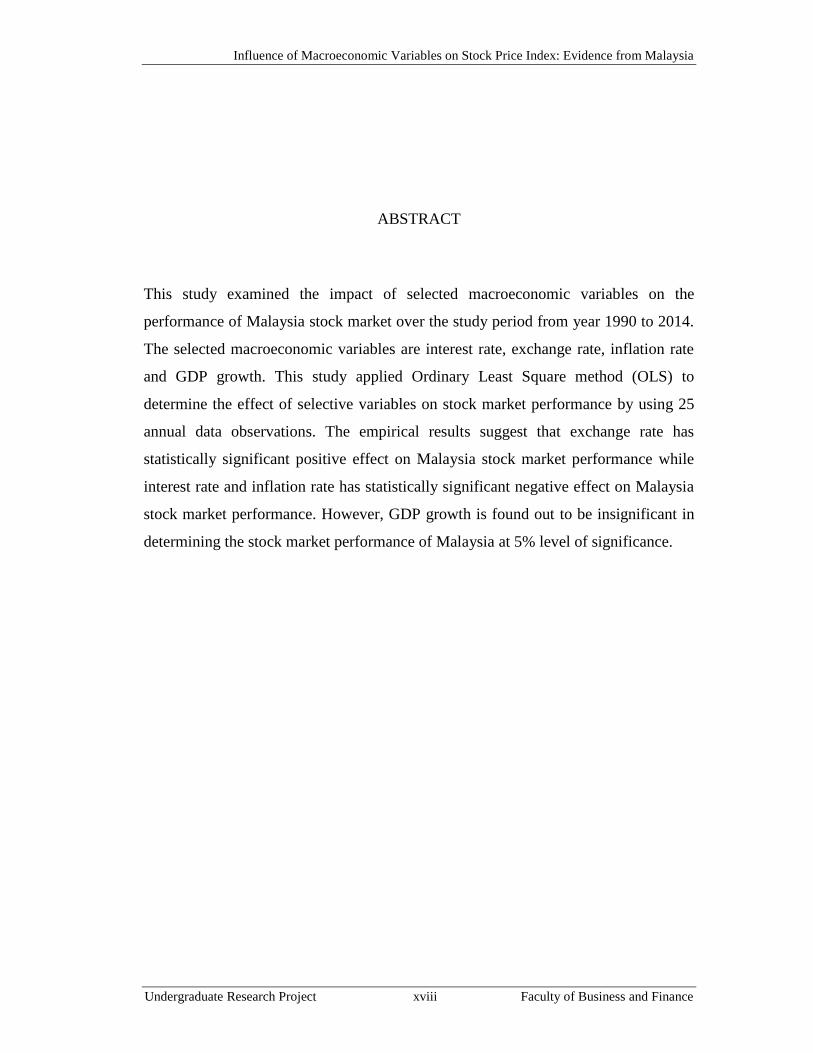
ABSTRACT
This study examined the impact of selected macroeconomic variables on the
performance of Malaysia stock market over the study period from year 1990 to 2014.
The selected macroeconomic variables are interest rate, exchange rate, inflation rate
and GDP growth. This study applied Ordinary Least Square method (OLS) to
determine the effect of selective variables on stock market performance by using 25
annual data observations. The empirical results suggest that exchange rate has
statistically significant positive effect on Malaysia stock market performance while
interest rate and inflation rate has statistically significant negative effect on Malaysia
stock market performance. However, GDP growth is found out to be insignificant in
determining the stock market performance of Malaysia at 5% level of significance.
Influence of Macroeconomic Variables on Stock Price Index: Evidence from Malaysia
Undergraduate Research Project Page 1 of 85 Faculty of Business and Finance
CHAPTER 1: RESEARCH OVERVIEW
1.0 Introduction
Chapter one introduces the outline of the research. The major concerns of this chapter,
which are research background, problem statements, objectives, hypotheses and
significant of the study will be included. The main objective of this research is to
investigate the relationship between macroeconomics variables and stock market in
Malaysia. The macroeconomics variables that have been chosen are interest rate,
inflation, exchange rate and GDP growth. Layouts of the following chapters as well as
the conclusion are presented at the end of this chapter.
1.1 Background
1.1.1 Background of Malaysia Economy
Since 1957, Malaysia’s economic relied heavily on primary sectors such as
forestry, mining, agriculture, and fishing. It then subsequently experienced
economic transformation and became more dependent on manufacturing,
construction, and services. However, in 1991, Malaysia liberalized its financial and
economic by attracting foreign direct investment (FDI) into Islamic finance,
financial services, and high-tech industry. These economic and financial plans did
not only increase the productivity and employment rate, but also enhanced
Malaysian economic growth (Bekhet & Mugableh, 2012). During the last three
decades, Malaysia had suffered the Asian financial crisis of 1997-1998 and Global
Financial Crisis in 2009. Nevertheless, the nation recovered rapidly and continued
to grow steadily. Today, Malaysia is a major exporter of electronic products,
petroleum products, chemical products, and palm oil products (MATRADE, 2017).
Influence of Macroeconomic Variables on Stock Price Index: Evidence from Malaysia
Undergraduate Research Project Page 2 of 85 Faculty of Business and Finance
Malaysian government introduced Goods and Services Tax (GST) in 2015 and
removed fuel subsidies in 2014 in order to increase national revenue. Moreover,
the Ringgit fluctuated from 3.15 to 4.48 to the US dollar in the recent five years
from 2012 to 2016 (Bank Negara Malaysia, n.d.). To encourage the steady growth
of domestic economy, Bank Negara Malaysia (BNM) cut the Overnight Policy
Rate (OPR) by 0.25% to 3% in July 2016. Another action of BNM to protect the
value of Ringgit is to impose the regulation that exporters must convert 75% of
export proceeds into ringgit (Nambiar, 2017). Therefore, this research studies the
effects of the several determinants on the stock price performance in Malaysia so
that each party can plan the strategies and make wise decision to overcome the
conflict.
1.1.2 Background of Malaysia Stock Market
Bursa Malaysia is the national stock exchange of Malaysia. Being an important
exchange holding company in Association of Southeast Asian Nations (ASEAN),
it provides a comprehensive, wide range of investment opportunities as well as an
attractive platform to global investors. Bursa Malaysia was previously known as
Kuala Lumpur Stock Exchange (KLSE). The renamed action which was launched
on 14 April 2004 aimed to attract customer and market orientation in order to
improve its competitive position in universal trade market (Bank Negara Malaysia,
n.d.).
The Kuala Lumpur Composite Index (KLCI) received international recognition as
one of the best references in Asia Pacific stock market. In year 1995, the KLCI
rose from 70 to 100 constituents. However, Bursa Malaysia made improvement to
the KLCI. On 6 July 2009, the KLCI had been separated into two new indices.
One of them is FTSE Bursa Malaysia KLCI, which consists of 30 most actively
companies listed on the main board of Bursa Malaysia. The other index, which
includes 70 companies, was named as FTSE Bursa Malaysia Mid 70 Index.
Influence of Macroeconomic Variables on Stock Price Index: Evidence from Malaysia
Undergraduate Research Project Page 3 of 85 Faculty of Business and Finance
Meanwhile, the KLCI was replaced by the FTSE Bursa Malaysia KLCI. The
objective to enhance the KLCI was to ensure that it is able to reflect how the
Malaysian economy fluctuates from time to time (Azevedo, Karim, Gregoriou &
Rhodes, 2014).
In addition, FTSE Bursa Malaysia KLCI is a heading capitalization-weighted stock
index as well as a stock market barometer. This is because the whole performance
of the listed shares on Malaysia Stock Exchange can be represented by the KLCI.
In order to expand the influencing of market globalization, Bursa Malaysia had
integrated KLCI with an internationally recognized index calculation methods. This
enhancement will increase transparency as well as offer the equity market with a
benchmark index that can be invested and traded (Zakaria & Shamsuddin, 2012b).
According to Bloomberg, FTSE Bursa Malaysia KLCI had experienced major
fluctuation in recent years. The stock market returns ranged from a lowest of -46.96%
in 1997 to a highest of 37.15% in 2007 (Knoema, 2016). The changes in the trend
of stock market had brought many insights to the researchers relevant to the
financial sector. Many theories and hypotheses are proposed during these times to
explain the phenomena regarding the stock market performance.
1.2 Problem Statement
In recent times, stock market has become a popular issue discussed by many
researchers. Stock market comprises of corporate capital and ownership, which is
essential to reflect economy condition of a country. In details, it acts as a crucial tool
to indicate performance and serve as a barometer of the country financial
competitiveness, while providing guidelines for implementation of monetary policy.
There are many relevant studies suggested different opinions regarding the stock
market performance and its determinants, however their results are ambiguous. For
instance, Naik and Padhi (2012) concluded that interest rate had not much effect on

Influence of Macroeconomic Variables on Stock Price Index: Evidence from Malaysia
Undergraduate Research Project Page 4 of 85 Faculty of Business and Finance
stock price in Euro, but Amarasinghe (2015) indicates that interest rate volatility shows
significant impact on the stock return.
Moreover, the effects of each macroeconomic variable on stock market vary across
different time period and country. For instance, Joseph and Eric (2010) concluded that
inflation may stimulate economic performance in term of short run, but this idea is
rejected by Kimani and Mutuku (2013), who revealed that inflation and stock prices
are negatively related. The identification of relationship between macroeconomic
variables and stock market performance in Malaysia is essential for policy makers to
implement appropriate monetary policy that is favourable to the Malaysia economy.
In addition, many studies in this relevant topic are outdated due to the ongoing current
events. The results suggested by old studies are no longer suitable to apply for current
economy condition nowadays. For example, Jones and Kaul (1996) stated that changes
in oil prices have a detrimental effect on real stock returns in the United States, Canada,
Japan, and the United Kingdom, however the result was only applicable for post-war
period.
Current event such as sharp depreciation of Ringgit Malaysia and Brexit vote have
significant contribution to the fluctuation of stock market performance in recent years.
So far there are insufficient studies that have contributed to the literature in this field
which focus on these current emerging financial events. Sathyanarayana and Gargesha
(2016) concluded that stock market may become more volatile due to the Brexit event
in the short run. Hence, this study aims to tackle the issues stated above by investigating
is there any relationship between stock market in Malaysia and the selected
macroeconomic variables.
Influence of Macroeconomic Variables on Stock Price Index: Evidence from Malaysia
Undergraduate Research Project Page 5 of 85 Faculty of Business and Finance
1.3 Research Question
1. How Malaysia stock market react towards macroeconomic variables?
2. Does exchange rate significantly affect Malaysia stock market performance?
3. Does inflation rate significantly affect Malaysia stock market performance?
4. Does interest rate significantly affect Malaysia stock market performance?
5. Does gross domestic product (GDP) growth rate significantly affect stock market
performance in Malaysia?
1.4 Research Objectives
1.4.1 General Objectives
The primary objective of this research is to study the reaction of Malaysia stock
market performance towards macroeconomic variables from year 1990 to 2014.
1.4.2 Specific Objectives
Objective 1: To investigate how stock market react towards macroeconomic
variables.
Objective 2: To examine if there is a long run relationship between interest rate
and stock market performance.
Objective 3: To study if exchange rate affects stock market performance.
Objective 4: To explore the influence of inflation rate toward stock market
performance.
Objective 5: To observe how GDP growth rate affects stock market performance.
Influence of Macroeconomic Variables on Stock Price Index: Evidence from Malaysia
Undergraduate Research Project Page 6 of 85 Faculty of Business and Finance
1.5 Hypotheses of the Study
1.5.1 Real Interest Rate
H0 = Interest rate has no significant relationship with stock market performance.
H1 = Interest rate has a significant relationship with stock market performance.
1.5.2 Real Effective Exchange Rate
H0 = Exchange rate has no significant relationship with stock market performance.
H1 = Exchange rate has a significant relationship with stock market performance.
1.5.3 Inflation Rate
H0 = Inflation rate has no significant relationship with stock market performance.
H1 = Inflation rate has a significant relationship with stock market performance.
1.5.4 GDP Growth Rate
H0 = GDP growth rate has no significant relationship with stock market
performance.
H1 = GDP growth rate has a significant relationship with stock market performance.
Influence of Macroeconomic Variables on Stock Price Index: Evidence from Malaysia
Undergraduate Research Project Page 7 of 85 Faculty of Business and Finance
1.6 Significance of Study
This study aims to investigate the relationship of macroeconomic variables and stock
market performance in Malaysia. Data and variables included are interest rate,
exchange rate, inflation rate, GDP growth rate and KLCI index from year 1990 to 2014.
The main contribution of this study is that it focuses on the findings from previous
studies within the latest 7 years (2010- 2016). Although previous studies on this topic
are extensive, many of them are obsolete as they are conducted and published long time
ago. Today’s world is experiencing an increase in globalization and global financial
integration, causing information to expire and gets replaced very quickly. Hence,
including these updated studies can better capture latest trend of stock market which
evolves over time due to continuous stock market development. Consequently,
policymakers could discover the consistency of result of this study with other latest
studies. They are able to look into updated implications from issues and discussions
included in literature review.
This research is also be able to benefit active stock trader and investors. To elaborate,
economic condition is one of the criteria in fundamental analysis on stock trading.
Therefore, they need to have knowledge on several major economic indicators and how
are they going to affect stock price movement. A change in variables may cause good
or bad effect on firms’ profitability, thereby causing a change in stock price.
1.7 Chapter Layout
Chapter 1 is an introductory chapter and mainly focus on the research overview. It starts
to highlight an introduction and background of this research. After that, problem
statements, research objectives, questions, hypotheses and significance of study are
continued to be presented. Lastly, a conclusion will be drawn as a brief outline.
Influence of Macroeconomic Variables on Stock Price Index: Evidence from Malaysia
Undergraduate Research Project Page 8 of 85 Faculty of Business and Finance
Chapter 2 is the literature review on previous research papers that are relevant to stock
market index. The relationship between dependent variable and selected independent
macroeconomic variables will be studied in this chapter. Moreover, the theoretical
models and the proposed conceptual framework are being further discussed.
Chapter 3 investigates the methodology of this research. It begins with research design,
followed by data collection method and data processing. Furthermore, research analysis
methods will be explained and applied on the econometrics model in this chapter.
Chapter 4 analyses the reliability of the empirical results. Diagnostic checking as well
as hypothesis testing that had been discussed in chapter 3 will be carried out. Value of
parameters and goodness of fit will be interpreted. Next chapter will further discuss the
major findings based on the expected sign and actual sign of this study.
Chapter 5 is the last chapter that summarizes statistical analyses and the major findings
of this paper. Additionally, this chapter provides implications, limitations and
recommendations for future research. This chapter ends with an overall conclusion.
1.8 Conclusion
In this chapter, the background of economy and stock market in Malaysia has been
discussed. Next, the research questions and objective of this study have been presented
in this chapter. The hypotheses and significance of the study have been clearly
addressed. The review on empirical studies regarding the link of stock market and
macroeconomic variables will be discussed in the following chapter.
Influence of Macroeconomic Variables on Stock Price Index: Evidence from Malaysia
Undergraduate Research Project Page 9 of 85 Faculty of Business and Finance
CHAPTER 2: LITERATURE REVIEW
2.0 Introduction
In this chapter, results from previous studies about relationship between dependent and
independent variables will be reviewed. The purpose of this chapter is to give a clearer
picture in the related area of study by presenting different opinions suggested by
different researchers. Independent variables include inflation rate, real effective
exchange rate, gross domestic product (GDP) growth rate and real interest rate in
Malaysia. Relevant theories in this study are such as Fisher effect, Gordon-growth
model, arbitrage pricing theory, purchasing power parity and growth driven finance,
where their respective linkages with the independent variables will be explained.
2.1 Review of Literature
2.1.1 Stock Index
Studies carried out on the linkage between stock index and macroeconomics
variables have been extensive. However, responds of stock market towards
macroeconomic variables vary across different countries and periods. Peiró (2016)
concluded that macroeconomic variables, long term interest rates would clearly
affect stock price in the European countries which are United Kingdom, Germany
and France. Interestingly, he found out that over two sub periods, each
macroeconomic variable would give different extent of impact toward stock price
and level of dependence are not same over time. This is consistent with findings
by Aloui and Ben Aïssa (2016) and Ooi, Arsad and Tan (2014). Also, when Peiró
(2016) compared his study with results run on U.S., he discovered these
Influence of Macroeconomic Variables on Stock Price Index: Evidence from Malaysia
Undergraduate Research Project Page 10 of 85 Faculty of Business and Finance
macroeconomic variables give different impact towards U.S. stock markets than
his study on European countries over the period of 1969–2012.
In addition, Ooi, Arsad and Tan (2014) found that some actual sign of relationship
has changed after the financial crisis in 2008. In their study, money supply, real
exchange rate, 3-month Treasury bill, and industrial production index were
employed as macroeconomic variables. They confirmed that after the financial
crisis in 2008, industrial production had shifted from negative to positive impact
to Malaysia stock prices. In other words, although macroeconomic variables may
appear to be useful to forecast stock prices, however, their respective relationship
with stock prices could shift at some point of time. This idea is also supported by
Çakmakl and Van Dijk (2016). They claimed that investigating stocks prices with
a limited number of individual macroeconomic variables over a certain period is
difficult to generate accurate results.
Bhargava (2014) stated that stock prices are affected by macroeconomic variables
due to the information in the stock market is disseminated via certain
macroeconomic variables. As a result, this leads to stock price volatility in short
run. Chee and Shiok (2015) mentioned that macroeconomic variables have impact
towards stock market performance in Malaysia. They found that selected variables
such as interest rate and money supply have positive effects on Malaysia’s share
prices while inflation has negative effect on Malaysia’s share prices in long-run.
Garza-Garcia and Yue (2010) claimed that despite high degree of speculation and
immaturity, the results of the used approach indicates that stock market in China
still responded to a change in macroeconomic activities in the long term. Inflation
had a negative relationship while short term interest rate, money supply, and
exchange rate had positively impacted Chinese stock prices. This is consistent with
the results by Bekhet and Matar (2013) who conveyed that the existences of
positive correlation between stock price index and exchange rate in long run.
Influence of Macroeconomic Variables on Stock Price Index: Evidence from Malaysia
Undergraduate Research Project Page 11 of 85 Faculty of Business and Finance
Singh (2010) emphasized that variables such as exchange rate and wholesale price
index could not affect stock price in India. The other study revealed that exchange
rate had negative correlation while gold price had positive correlation with stock
price. Meanwhile, stock value had no significant relationship with foreign
exchange reserve and inflation rate (Sharma & Mahendru, 2011).
Relationship between stock price and macroeconomic variables exist in emerging
financial markets such as Romania, where the variable with the largest influence
on the prices of the stock exchange assets is GDP (Sabau-Popa, Bolos, Scarlat,
Delca & Bradea, 2014). As for South Africa, stock index shows a significant
connection with all the macroeconomic variables which are inflation, exchange
rate as well as money supply. Shawtari, Salem, Hussain, Hawariyuni and Thabet
Omer (2016) stated that money supply had a positive relationship while inflation
had a negative relationship with stock price. Therefore, stock price index can shed
some light on the reaction of share market to macroeconomic variables for
emerging markets (Bekhet & Matar, 2013).
Some researchers attempted to study stock prices and macroeconomic activities
using crude oil prices and interest rate. Patel (2011) concluded that interest rate did
not affect stock price to large extent in Euro nations. The variables are more likely
to move independently in the long run. Besides, the influence of crude oil prices
had reduced seriously. Other than that, the sensitivity of each country stock price
was different in the post-Euro period.
2.1.2 Real Interest Rate
Interest rate is the cost of capital or the income demanded by investors for the
loaned funds over a specific period. Normally, central bank uses the interest rate
as a monetary policy tool to control the money supply and investment.
Amarasinghe (2015) indicated that interest rate volatility shows significant and
Influence of Macroeconomic Variables on Stock Price Index: Evidence from Malaysia
Undergraduate Research Project Page 12 of 85 Faculty of Business and Finance
negative impact on the stock return. This finding is consistent with Izgi and Duran
(2016). Pirovano (2012) explained that some companies will borrow heavily in
order to finance huge projects. Interest rate is equivalent to cost of borrowing.
Therefore, as interest rate rises, production costs increases alongside, which
subsequently leads to a reduction in expected future cash flow and stock price.
Other than that, Kasman, Vardar and Tunc (2011) stated that there is a negative
and significant correlation between interest rate and bank stock return. Mugambi
and Okech (2016) also agreed with it and pointed out two inferences. First, when
interest rates (returns on government assets) increase and become more attractive
to investors, they may close out their position in stock market, leading to a
reduction in stock prices. Secondly, banks are forced to offer more favourable
deposits rate to public to compete with higher Treasury bill rate. Banks’
profitability will be adversely affected by the increment of interest rate expense
and then deliver the undesirable message to investors. As a result, the demand for
stock in bank sector will drop along with their prices.
Additionally, Moya-Martínez, Ferrer-Lapeña, and Escribano-Sotos (2015) stated
that firms are benefited by dropping of interest rate. They also noticed that the
linkage between industry return and volatility of interest rate can only be detected
at longer horizons and some industries. From the general perspective, investors
with long term horizons such as mutual funds or pension funds companies will
choose to weigh more upon interest rate when making investment decisions than
investors with short term horizons such as speculative traders. Muktadir-Al-Mukit
(2013) and Pallegedara (2012) supported these ideas by claiming that interest rate
has significant and negative influence on share price in long run.
However, Kishor and Marfatia (2013) notice an interesting finding which is the
dropping of Federal Fund Rate during the 2008 financial crisis caused the
European and the US stock market returns to decrease. The phenomenal of
economic downturn and the unexpected interest rate cut affect the investors’
Influence of Macroeconomic Variables on Stock Price Index: Evidence from Malaysia
Undergraduate Research Project Page 13 of 85 Faculty of Business and Finance
confidence level. A significant and positive correlation between interest rate and
stock market in the short run is also identified by Ferrer, Bolos and Benitez (2016).
The researchers explained the bursting of dot-com bubble, the September 11
attacks in the US, the geopolitical tensions of the Middle East, and the dramatic
decline of interest rates to lowest level in 40 years were happened within the
analysis period. In conclusion, stock price and interest rate will move in the same
direction when the level of economic uncertainty is high.
Interestingly, there are a few studies which delivered the opinion that relationship
between interest rate and stock price will not remain constant over time.
Korkeamaki (2011) find that although changes in interest rate have negative and
significant impact before the introduction of the Euro, after 1990 it turned to be
insignificant. It is related to the argument that if the market in the home-currency
interest rate is deeper, it may allow companies to manage their interest rate risk
wisely. The author observed that countries with the limited development of local
corporate bond markets in the pre-Euro era will have higher interest rate sensitivity.
Apart from that, Peiro (2016) suggested a conclusion that initially interest rate was
the main factor to influence stock market movement, but recently this variable
become less importance in European countries. The responses may vary over time
due to the stage of business cycle, time-varying financial integration and the time-
variation in risk premium of stock itself (Kishor & Marfatia, 2013).
Although most of the researchers believe that interest rate is a significant variable
to stock price, Addo and Sunzuoye (2013) argued that interest rate is weak to
predict the stock market movement. The research conducted by Naik and Padhi
(2012) also indicates that the short term interest rate cannot explain the variation
of stock prices. Moreover, the impacts of interest rate on stock price differ across
industries. For instance, the stock performance of real estate, food and beverages,
utilities and banking are highly correlated with interest rate. On the contrary,
interest rate has limited influence to the stock market movement of health care,
Influence of Macroeconomic Variables on Stock Price Index: Evidence from Malaysia
Undergraduate Research Project Page 14 of 85 Faculty of Business and Finance
construction, chemicals and paper, industrials and financial services (Moya-
Martinez et al., 2015).
2.1.3 Real Effective Exchange Rate
Exchange rate is described as the currency’s value of a country expressed in terms
of another (Veli & Seref, 2015). Most of the researches used causality test to
examine whether there is causality exists between stock market performance and
exchange rate. Ho and Huang (2015) and Ali, Anwar and Ziaei (2013) focused on
the global financial crisis to examine the causal relation of stock market index and
exchange rate in BRIC countries. Both have provided the same overall results as
they found exchange rate has causal effect to stock market index except for China.
The exchange rate is only permitted to move in a tightly band in China. Moreover,
Tudor and Popescu-Dutaa (2012) and Barakat, Elgazzar and Hanafy (2016) tested
the Ganger causality and showed that exchange rate changes can influence the
stock market performance in the emerging financial markets. This outcome results
in the exchange rate has a great impact towards the volatility of stock market.
Tudor and Popescu-Dutaa (2012) said that Granger causality test cannot be used
to forecast the sign of correlation between the exchange rate and stock market
index even though it can illustrate the direction of causality. Therefore, the
researchers should implement the correlation test to examine the relationship.
Tian and Ma (2010) mentioned that the effect of real effective exchange rate of
RMB on the stock market performance is co-integrated after China liberalized its
financial market. They also found that exchange rate has positive impact on stock
market index. When exchange rate of RMB against the US dollar (CNY/USD) and
HK dollar (CNY/HKD) increases one percent, the Shanghai A Share index will
also increase by 32 and 38 percent respectively. When exchange rate rises by one
percent, on average, Ghana stock returns will increase by 0.052 percent (Kuwornu,
2012). The depreciation of the exchange rate discouraged export but supports
Influence of Macroeconomic Variables on Stock Price Index: Evidence from Malaysia
Undergraduate Research Project Page 15 of 85 Faculty of Business and Finance
import, by declining in economic activities as well as stock returns. Hence, the
study has demonstrated the stock return seems to be in direct proportion to the
foreign exchange rate. Furthermore, Bello (2013) measured the exchange rate for
quotations expressed in a direct term. For one example, when foreign exchange
rate (USD/EUR) goes down, home stock market (US) will go down too. It shows
that the exchange rate and home share prices have significant positively
relationship. On the other hand, due to large capital flows into the United States
and imports from Japan decline, the Japanese yen depreciates lead to the foreign
exchange rate (USD/JPY) goes down but the US stock market inversely rises. So,
it can be found out that the exchange rate was negatively correlated to the share
prices index. The results from findings can be concluded that the euro, pound and
Chinese yuan are directly and positively correlated with the US stock market but
the yen is adversely related.
Maku and Atanda (2010) investigated the long term role of exchange rate in
explaining Nigerian stock returns. They found that Nigerian Stock Exchange (NSE)
share index forms a cointegration relationship with changes in the long-run
exchange rate. This is also supported by the Onasanya, Olanrewaju and Femi (2012)
and mentioned that exchange rate has significant long run and short run impact on
the Nigeria share prices index. They also revealed that not only the exchange rate
is in statistically negative correlated with the average stock market performance,
but also it is unidirectional. It means that only average share prices granger cause
exchange rate. Apart from that, Jamil and Ullah (2013) showed that real effective
exchange rate has short term effect on the stock market returns in Pakistan. It
indicated that an increase in exchange rate will depreciate the Pakistani rupee, as
well as decreases the returns of stock index and vice versa. Furthermore, real
effective exchange rate should be retained in a profitable area towards stock market
stability. Thus, it can be concluded as changes in the exchange rate will adversely
influence changes in the stock market returns. In line with this, Tsai (2012) studied
the linkage between stock price index of six Asian countries and exchange rate
under different market conditions. The results produced a negative relationship
Influence of Macroeconomic Variables on Stock Price Index: Evidence from Malaysia
Undergraduate Research Project Page 16 of 85 Faculty of Business and Finance
between equity market and foreign exchange market. Therefore, it can be
concluded that according to the conditions of market, the relationship can change.
Singh (2010) and Zubair (2013) found that the relationship of exchange rate
towards stock market index is not correlated, which denotes that exchange rate is
not the main reason for resulting in the equity market fluctuations. This is
supported by Zia and Rahman (2011), there is non-existence link between two
variables. They also stated that the share prices index and foreign exchange rate do
not move together in both long run and short run. In short, stock market movement
cannot be predicted or forecasted by exchange rate.
2.1.4 Inflation Rate
Inflation is defined as a continuous growth in the general price level of common
goods and services in a country (Hossain, 2012). According Kasidi and
Mwakanemela (2013), high inflation rate would bring downfall to an economic
growth through several means, such as lowering purchasing power of a nation’s
currency. Moreover, the study also stated that even moderate levels of inflation
can adversely affect direct and indirect investment, as well as consumption
decisions of a nation. However, Hossain (2012) argued that dropping inflation may
cause lost in output or production in a country and thus increase rates of
unemployment. In the line with this, Joseph and Eric (2010) concluded that
inflation may stimulate economic performance in term of short run by
expansionary macroeconomic policies; however, inflation can be harmful to a
country’s economic growth in long run. They explained that rising inflation rate
increases welfare cost on society, causing intermediation more costly, and thus
slows down financial development. As a result, as nation export prices become
higher, their international competitiveness are reduced and finally adversely affect
the balance of payment of the country. Therefore, economic growth of the country
is distorted by inflation in term of long run.
Influence of Macroeconomic Variables on Stock Price Index: Evidence from Malaysia
Undergraduate Research Project Page 17 of 85 Faculty of Business and Finance
Limpanithiwat and Rungsombudpornkul (2010) stated that historical stock prices
have a close relationship with inflation. The study explained that stock prices rise
according to inflation rate, as they have a positive relationship but in an indirect
way. In details, this theory explains that inflation rate can influence stock prices
through corporate income taxation, cost depreciation and taxation of nominal
capital gains. Inflation rate can affect company performance and their income thus
bringing indirect impact to their stock price. Besides, Taofik and Omosola (2013)
had proved that inflation has a positive and significant effect on stock indexes, with
a strong co-integration relationship between them. They stated that inflation would
encourage flow of investment and influences direction of stock returns and stock
prices, which is same as the theory proposed by Fisherian hypothesis. Furthermore,
Chakravarty and Mitra (2013) found that inflation influences stock price in a
positive way. Unexpected inflation can increase the company equity value if they
are net debtor, while dropping inflation caused by monetary policy will reduce
stock price, as investors have less fund to buy stocks or goods. Both effects suggest
that inflation and stock price have a positive correlation.
Conversely, Kimani and Mutuku (2013) revealed that inflation and stock prices
are negatively related. The journal established that rising inflation affects
negatively on the general performance of the securities exchange, including stock
returns and stock prices. In a major emerging market, Ali (2011) proposed that
high inflation rate would either pressure company future incomes, or increasing
nominal discount rates, which resulted in a decrease in present value of future
profits. Both effects would bring adverse impact to the corporate profits and
reducing both stock return and stock price. In addition, Eita (2012) also supported
the theory by stating that rising inflation could cause prediction of future economic
slowdown, which resulted in stock price depression. In details, increasing interest
rate caused by inflation would make cash flow worth less after being discounted,
and thus reducing the investment, stock returns and finally stock prices. Therefore,
the study concluded that rising inflation is associated with reduces in stock prices,
which is opposes the generalised Fisher hypothesis. Furthermore, Caroline, Rosle,
Influence of Macroeconomic Variables on Stock Price Index: Evidence from Malaysia
Undergraduate Research Project Page 18 of 85 Faculty of Business and Finance
Vivin, and Victoria (2011) also confirmed the negative linkage between inflation
and stock price, but only in term of long run. The study showed both expected and
unexpected inflation in Malaysia influences adversely to the stock prices in the
long run, but there is no effect in short run. Interestingly, Irum, Fiyaz and Junid
(2014) suggested that inflation is affected negatively by pressure of stock prices,
but not in the opposite direction. In details, the study stated that inflation has no
effect to the stock price but rising stock prices can lower inflation rate in a one
direction relationship.
There is also study that generalised the effect of inflation on stock price based on
country. Vanita (2014) revealed that inflation and stock price have a positive
relationship in India and China, but negative relationship in Russia and Brazil.
However, the journal established that inflation and stock price have only
contemporaneous relationship and insignificant integrated in term of long run,
which is opposed the theory proposed by Caroline, Rosle, Vivin, and Victoria
(2011) above. In addition, Tangjitprom (2012) and Bai (2014) both suggested that
stock price index affected by inflation is very limited. The effect of inflation is
insignificant to changes in stock price, but it plays a major role in macro economy.
2.1.5 GDP Growth Rate
GDP is one of the main indicators which measures the overall health of a nation’s
economy. Oskooe (2010) reveals that stock prices are positively affected by real
GDP in long run. As GDP increases, this would in turn raise firm’s expected future
cash flow as well as profit, thus leading to an increase in stock price. Athanasios
and Antonios (2012) found positive link between economic growth and general
stock index. Economic growth, which is equivalent to expansion of economic
activities, will increase firms’ business opportunities and profitability. Boubakari
and Jin (2010) found a positive relationship between economic growth and stock
market. They discovered a strong and positive relationship particularly at countries
Influence of Macroeconomic Variables on Stock Price Index: Evidence from Malaysia
Undergraduate Research Project Page 19 of 85 Faculty of Business and Finance
where stock markets are more liquid and active. Similar result is observed from
Rahman and Salahuddin (2010), who obtained positive relationship between
economy growth and stock market index in an efficient stock market because
transaction cost in an efficient stock market is lower. In return, this increases the
portion of funds that can be channeled and invested into other productive
instruments. Hsing (2011) found that economic growth will affect stock price
positively. The concept of this is that a growth in economy will cause equity
market to develop by having more companies getting listed and an increase in
market capitalization. Olusegun, Oluwatoyin and Fagbeminiyi (2011) exhibit a
positive relationship exists between GDP and all-share index. They discovered that
apart from domestic macroeconomic variables, global factors from foreign
countries will have influence on local GDP too, which subsequently affect local
stock price index. Alexius and Spang (2015) showed that stock prices, domestic
GDP, and foreign GDP have a long run equilibrium relationship.
Conversely, Senturk, Ozkan and Akbas (2014) concluded that there was no long
run relationship between economic growth and stock price, which was possibly
caused by an imbalance of allocation of resources in financial market development
and real economy production. Maghanga and Quisenberry (2015) found
inconclusive relationship between economic growth and stock price. This trend is
often seen when stock market are not efficient and less-developed. Nkechukwu,
Onyeagb, Okoh (2015) studied how stock market is correlated with GDP in both
long and short run. They found significant but negative relationship in long run,
whereas in short run GDP is not significant to affect stock price. Al-Tamimi,
Alwan and Abdel Rahman (2011) studied GDP on bank and non-bank firms using
both internal and external factor that could influence stock price. Internal factors
are firms underlying qualities such as earning-per-share (EPS) and dividend-per-
share (DPS), while external factors are made up of macroeconomic variables such
as GDP. The result showed GDP was significant for firms from banking sector,
but insignificant for non-bank groups. Zakaria and Shamsuddin (2012a) concluded
GDP to be insignificant to influence stock market.
Influence of Macroeconomic Variables on Stock Price Index: Evidence from Malaysia
Undergraduate Research Project Page 20 of 85 Faculty of Business and Finance
There are also studies which show bi-directional relationship between these two
variables. Ishioro (2013) stated a bi-directional causality between economic
growth and stock market. Kyophilavong, Uddin and Shahbaz (2014) confirms that
stock price and economic growth have long run positive relationship and on top of
that, a bi-directional relationship is observed. In other words, while economic
growth promotes financial development, at the same time, financial development
causes economy to grow.
2.2 Review of Relevant Theories
2.2.1 Arbitrage Pricing Theory
The Arbitrage Pricing Theory (APT) was originally introduced by Stephen A Ross
in 1976, who attempted to explain that return on any stock is linearly related to a
set of systematic factors and risk free rate (Geambasu, Jianu, Herteliu & Geambasu,
2014). Investing Answers (2016) stated that in APT, the expected returns can be
explained in two ways; influences of macroeconomic or security-specific variable
and sensitivity of the asset to those influences. APT agrees that systematic risk can
be minimized by large and well diversified portfolios. However, it cannot be
eliminated since common economic factor can influence the entire stock prices in
market, which cannot solve by diversification. Arbitrageurs usually apply APT
model to search for arbitrage opportunity, in which the asset’s price will have a
difference with the theoretical price found by the model.
The following equation indicates linear combination of risk- free rate return and
systematic risk return (Shaji, 2012):
E(rj) = rf + bj1RP1 + bj2RP2 + bj3RP3 + bj4RP4 + ... + bjnRPn+ ɛj
Where E(rj) = expected rate of return for asset.
Influence of Macroeconomic Variables on Stock Price Index: Evidence from Malaysia
Undergraduate Research Project Page 21 of 85 Faculty of Business and Finance
rf = risk-free rate.
bj = the sensitivity of the asset's return to specific factor.
RP = the risk premium in specific factor.
ɛj= error term.
APT is often considered as an alternative to the capital asset pricing model
(CAPM). However, APT is a more powerful tool than CAPM because APT holds
less strict assumption requirements than CAPM. Furthermore, APT takes into
account both multi-period and single period cases whereas CAPM takes into
account only single period. Although CAPM has better prediction of stock price in
short term, however, results of APT are more accurate in medium and long term
compare to CAPM. These have made APT generally acceptable by researchers and
investors.
2.2.2 Gordon Growth Model
This model calculates the stock price by adding up all the expected future dividend
payments and discounted back to their present values. In simple words, it measures
a stock according to the net present value (NPV) of its expected future dividends.
One of the assumptions is that dividends growth rate must be constant. This model
is useful for mature corporate with stable dividend policy (Cancino, 2011).
However, in reality, future cash flow of dividend remains as an uncertainty.
Therefore, the assumption of constant growth rate is necessary.
𝐏𝟎 =𝐃𝟏
𝐤 − 𝐠
Where 𝑃0 = Stock price
𝐷1 = Dividend payment in the next period
𝑘 = Required rate of return
𝑔 = Dividend growth rate
When interest rate increases, investors will seek for better return in stock market.
Therefore, required rate of return for investors will increase and this leads to a fall
Influence of Macroeconomic Variables on Stock Price Index: Evidence from Malaysia
Undergraduate Research Project Page 22 of 85 Faculty of Business and Finance
in stock price. The model is easier to be understood because it values a stock
without considering market conditions. Thus, it can be used to compare different
sizes of companies from different industries. The Gordon Growth Model does not
include the non-dividend factors like the ownership of intangible assets, brand
loyalty, and customer retention which can increase the firm’s value (Tarver, 2015).
2.2.3 Purchasing Power Parity (PPP)
PPP indicates that the exchange rate between two currencies is dependent on the
proportion of the unit’s purchasing power. PPP exchange rate is frequently used to
reduce the misleading in comparisons of living standards internationally.
According to Ocal (2013), PPP theory plays as a main role in understanding the
behaviour of exchange rates. It can be viewed as when the purchasing powers of
two countries are equivalent, the currency exchange rate is in balance. The Law of
One Price means that without any transaction costs and other factors, the prices of
basket of goods should be the same and fixed even though in different markets.
Even if the Law of One Price applies to all goods in each country, the weighted
difference will lead to absolute PPP. Manzur and Chan (2010) proposed that
absolute PPP suggests the prices should be an international arbitrage. This means
that when expressed the currency in a common term, the spot exchange rate will be
identical between two different countries.
Absolute PPP can be showed as:
So = 𝐏𝟏
𝐏𝟐
Where So = Spot exchange rate
P1 = Price of the product in domestic currency
P2 = Price of the product in foreign currency
However, Al-Zyoud (2015) mentioned that most commodity trading is a
differentiated product, not a substitute good. Hence, this will lead to different
Influence of Macroeconomic Variables on Stock Price Index: Evidence from Malaysia
Undergraduate Research Project Page 23 of 85 Faculty of Business and Finance
consumption across countries. This is incompatible with the absolute PPP theory
so that the dynamic version of absolute PPP, which is relative PPP should be
applied. The idea of relative PPP is a relationship between the relative variation in
price levels of products in two nations over a time period and the foreign exchange
rate change over that period. Simply, it means the exchange rate changes will be
equivalent to differential rate of inflation (Manzur & Chan, 2010).
Relative PPP can be presented as:
StA/B = So
A/B x [ (𝟏+ 𝝅𝑨)
(𝟏+ 𝝅𝑩) ]
Where StA/B = Future exchange rate
SoA/B = Spot exchange rate
𝝅𝑨 = Inflation rate for domestic country
𝝅𝑩 = Inflation rate for foreign country
In conclusion, purchasing power parity theory is suitable for employing in the long
term instead of short term. If PPP theory indeed holds, it becomes a main
underlying cause for predicting the foreign exchange rate movement.
2.2.4 Fisher Effect Hypothesis
Fisher effect hypothesis was introduced in 1930 to explain the relationship between
inflation and interest rate. Dragos (2014) stated that the nominal interest rate is
equal to the sum of expected inflation and real interest rate, with the assumption
that inflation is independent to real interest rate. In details, this theory suggested a
direct relationship between nominal interest rate and expected inflation. Besides,
Dragos (2014) also proved that stock return should compensate the expected and
unexpected changes in inflation, as stocks act as claims against real assets. In the
line with this, the study of Bai (2014) had supported this statement by illustrating
the positive correlation between stock return and inflation rate. It claimed that
nominal interest rate would rise corresponding to inflation rate, while real interest
rate is usually at a fixed value.
Influence of Macroeconomic Variables on Stock Price Index: Evidence from Malaysia
Undergraduate Research Project Page 24 of 85 Faculty of Business and Finance
Taofik and Omosola (2013) and Chakravarty and Mitra (2013) suggested that fisher
effect hypothesis hold in the stock market. In other words, investors would be well
compensated when inflation and nominal interest rate move in the same direction.
However, Ali (2011) and Eita (2012) proposed that fisher effect does not hold in
the stock market. They argued that higher interest rate caused by inflation would
lower stock return after the returns are being discounted.
2.2.5 Demand Following Hypothesis
Demand following hypothesis proposes that economy growth generates demand for
different financial instruments, causing financial market to develop. A well-
developed financial market plays a big role in encouraging the flow of fund from
savers to lenders. As a result, savers with extra fund during good economic times
will channel fund into productive investment such as stock market, thus pushing up
stock price. Karimo and Ogbonna (2017) stated that when government insert money
through expenditure into the economy, this will increase aggregate demand and
income of the public. Subsequently, financial market will react and develop. This
results in a more effective and efficient financial market at large, including stock
market. An effective stock market is particularly important because, as supported
by Boubakari and Jin (2010), GDP and stock price is strongly correlated in a highly
liquid and active stock market. Also, Rahman and Salahuddin (2010) claimed a
well-developed stock market with lower transaction cost is an essential factor for
GDP and stock price to correlate well and have positive relationship. Tang (2013)
also supported this idea where economic growth will bring effect to stock price
changes.
Influence of Macroeconomic Variables on Stock Price Index: Evidence from Malaysia
Undergraduate Research Project Page 25 of 85 Faculty of Business and Finance
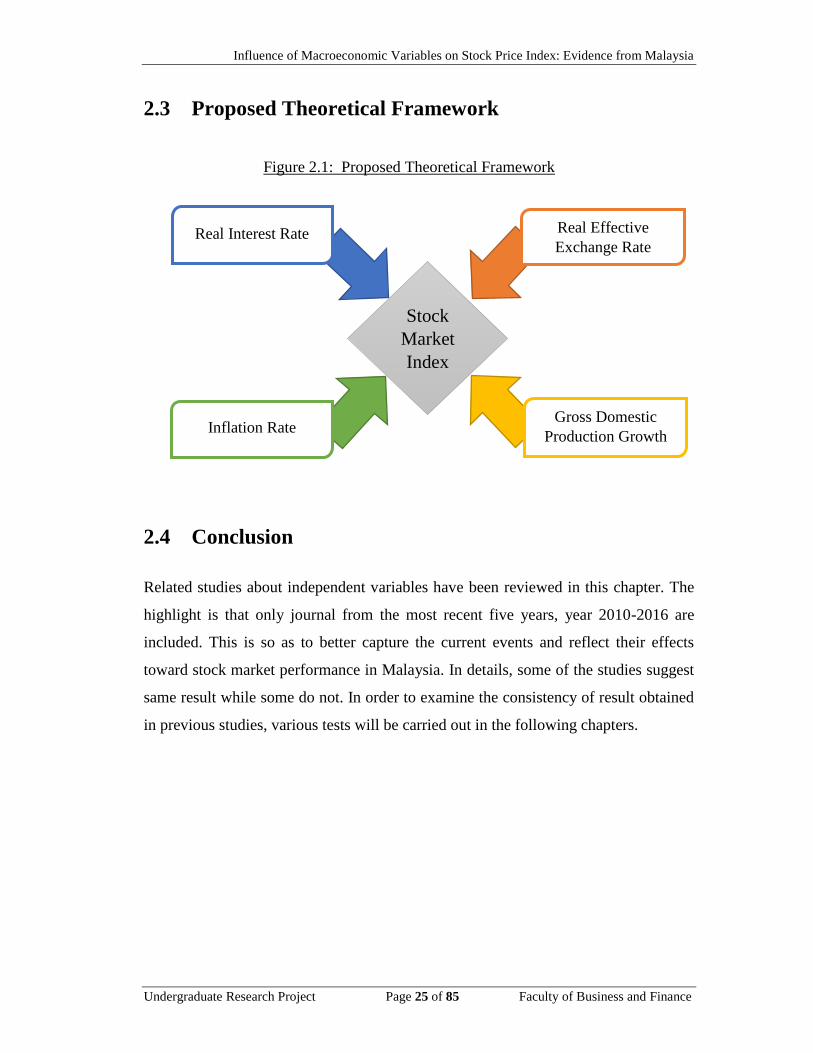
Stock
Market
Index
2.3 Proposed Theoretical Framework
Figure 2.1: Proposed Theoretical Framework
2.4 Conclusion
Related studies about independent variables have been reviewed in this chapter. The
highlight is that only journal from the most recent five years, year 2010-2016 are
included. This is so as to better capture the current events and reflect their effects
toward stock market performance in Malaysia. In details, some of the studies suggest
same result while some do not. In order to examine the consistency of result obtained
in previous studies, various tests will be carried out in the following chapters.
Real Interest Rate Real Effective
Exchange Rate
Gross Domestic
Production Growth Inflation Rate
Influence of Macroeconomic Variables on Stock Price Index: Evidence from Malaysia
Undergraduate Research Project Page 26 of 85 Faculty of Business and Finance
CHAPTER 3: METHODOLOGY
3.0 Introduction
Macroeconomics variables including interest rate, inflation rate, exchange rate and
gross domestic product (GDP) growth rate are the four independent variables used to
study against stock index price (KLCI) in this research. 25 annual data for each of the
variables from 1990 to 2014 are collected. Data are obtained from World Bank database
and Bloomberg terminal. Procedures of data processing and analysing are also clarified
in this chapter.
3.1 Research Design
This research studies on quantitative data, whereby data are in numerical form, for
instance, percentage, index, and descriptive statistics. Variables that are included in this
model are as follows: one dependent variable (stock market index) and four
macroeconomic variables (inflation rate, exchange rate, interest rate and GDP).
3.2 Data Collection Method
Secondary data is applied in this research. Data is collected from Bloomberg Terminal
accessed through UTAR Library. This study uses time series data which is based on
yearly basis from year 1990 to 2014 in Malaysia.
Influence of Macroeconomic Variables on Stock Price Index: Evidence from Malaysia
Undergraduate Research Project Page 27 of 85 Faculty of Business and Finance
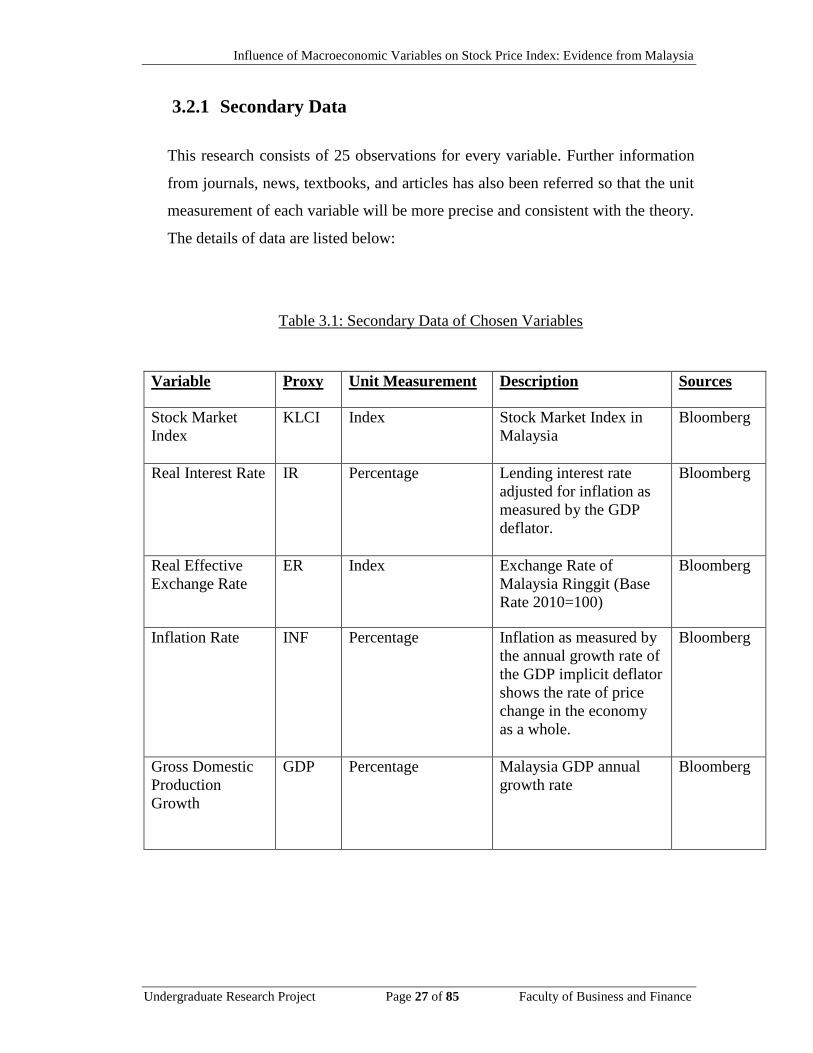
3.2.1 Secondary Data
This research consists of 25 observations for every variable. Further information
from journals, news, textbooks, and articles has also been referred so that the unit
measurement of each variable will be more precise and consistent with the theory.
The details of data are listed below:
Table 3.1: Secondary Data of Chosen Variables
Variable Proxy Unit Measurement Description Sources
Stock Market
Index
KLCI Index Stock Market Index in
Malaysia
Bloomberg
Real Interest Rate IR Percentage Lending interest rate
adjusted for inflation as
measured by the GDP
deflator.
Bloomberg
Real Effective
Exchange Rate
ER Index Exchange Rate of
Malaysia Ringgit (Base
Rate 2010=100)
Bloomberg
Inflation Rate INF Percentage Inflation as measured by
the annual growth rate of
the GDP implicit deflator
shows the rate of price
change in the economy
as a whole.
Bloomberg
Gross Domestic
Production
Growth
GDP Percentage Malaysia GDP annual
growth rate
Bloomberg
Influence of Macroeconomic Variables on Stock Price Index: Evidence from Malaysia
Undergraduate Research Project Page 28 of 85 Faculty of Business and Finance
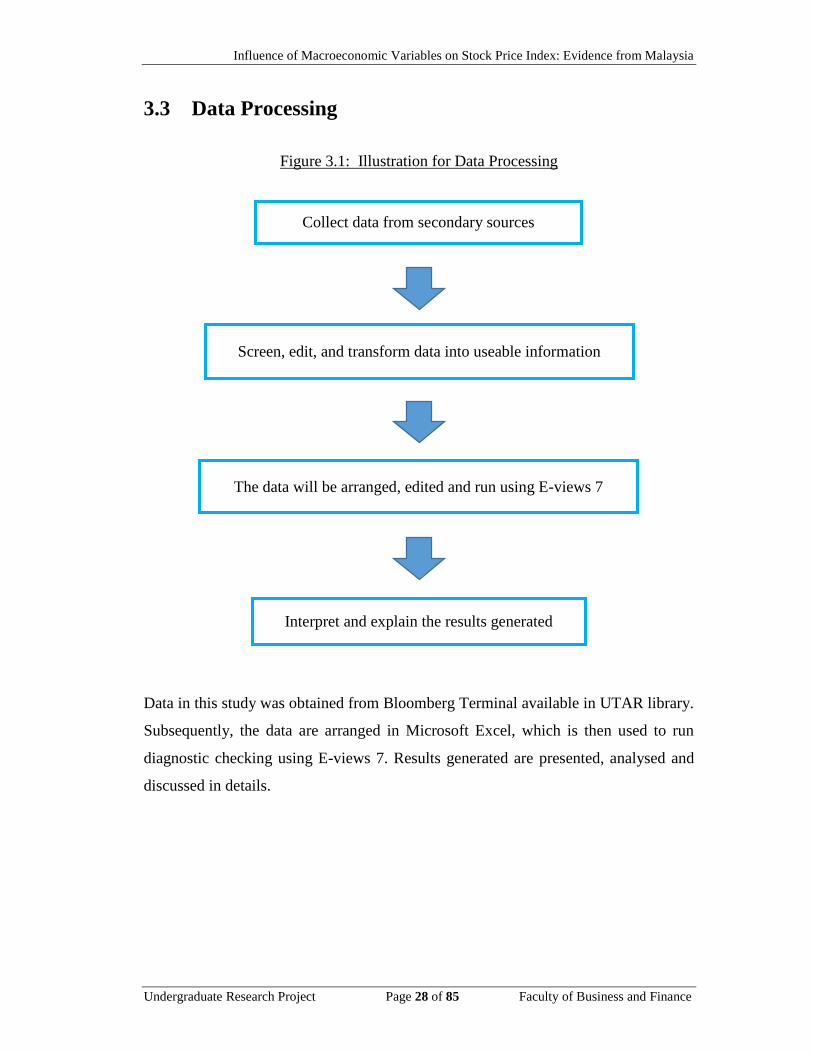
3.3 Data Processing
Figure 3.1: Illustration for Data Processing
Data in this study was obtained from Bloomberg Terminal available in UTAR library.
Subsequently, the data are arranged in Microsoft Excel, which is then used to run
diagnostic checking using E-views 7. Results generated are presented, analysed and
discussed in details.
Collect data from secondary sources
Screen, edit, and transform data into useable information
Interpret and explain the results generated
The data will be arranged, edited and run using E-views 7
Influence of Macroeconomic Variables on Stock Price Index: Evidence from Malaysia
Undergraduate Research Project Page 29 of 85 Faculty of Business and Finance
3.4 Econometric Regression Model
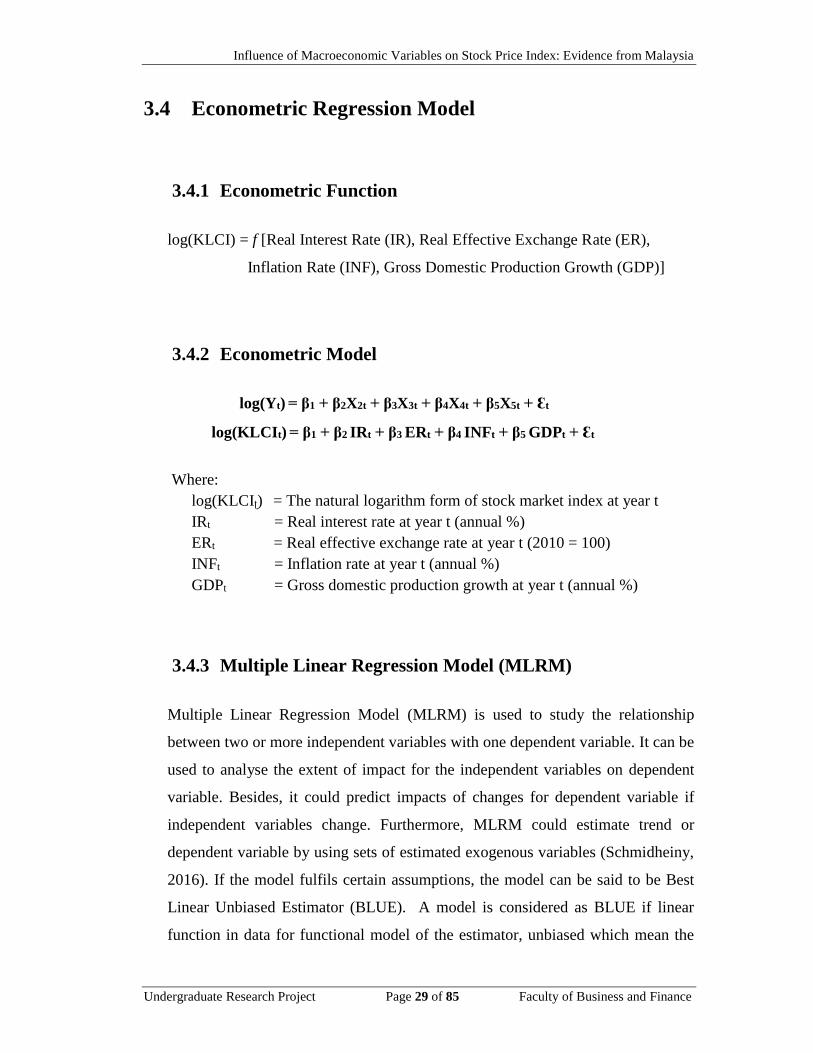
3.4.1 Econometric Function
log(KLCI) = f [Real Interest Rate (IR), Real Effective Exchange Rate (ER),
Inflation Rate (INF), Gross Domestic Production Growth (GDP)]
3.4.2 Econometric Model
log(Yt) = β1 + β2X2t + β3X3t + β4X4t + β5X5t + Ɛt
log(KLCIt) = β1 + β2 IRt + β3 ERt + β4 INFt + β5 GDPt + Ɛt
Where:
log(KLCIʈ) = The natural logarithm form of stock market index at year t
IRt = Real interest rate at year t (annual %)
ERt = Real effective exchange rate at year t (2010 = 100)
INFt = Inflation rate at year t (annual %)
GDPt = Gross domestic production growth at year t (annual %)
3.4.3 Multiple Linear Regression Model (MLRM)
Multiple Linear Regression Model (MLRM) is used to study the relationship
between two or more independent variables with one dependent variable. It can be
used to analyse the extent of impact for the independent variables on dependent
variable. Besides, it could predict impacts of changes for dependent variable if
independent variables change. Furthermore, MLRM could estimate trend or
dependent variable by using sets of estimated exogenous variables (Schmidheiny,
2016). If the model fulfils certain assumptions, the model can be said to be Best
Linear Unbiased Estimator (BLUE). A model is considered as BLUE if linear
function in data for functional model of the estimator, unbiased which mean the
Influence of Macroeconomic Variables on Stock Price Index: Evidence from Malaysia
Undergraduate Research Project Page 30 of 85 Faculty of Business and Finance
expected value is similar to the true value and efficient estimator which carry a
minimum of variance.
3.5 Data Analysis
3.5.1 E-views 7
E-views 7 is a spreadsheet software which has some similarity to the commonly
used Microsoft Excel. It provides various types of data analysis including
simulation, macroeconomic forecasting, financial analysis, scientific data analysis
and evaluation and so on. Furthermore, E-views 7 can be used for manipulating
time series data and even large cross-section projects. It operates faster than its
competitors in terms of calculation time and ease of use. Therefore, Ordinary Least
Square (OLS) model in this research is run by E-views 7. The outcome of the OLS
can be applied to check the significance of the variables and model using t-statistics
hypothesis test (T-test) and F-statistics overall fitness test (F-test). Besides, the
Jarque-Bera normality test (JB test) will be carried out to investigate the normality
distribution of the error term of the model. E-views 7 also functions to detect the
econometric problems by running Multicollinearity correlation table,
Heteroscedasticity (ARCH) test, Autocorrelation (White) test and Ramsey-RESET
test. The remedial test will be applied appropriately to solve the problems.
3.5.2 Ordinary Least Square (OLS)
Ordinary Least Square (OLS) is a formula to estimate the parameters in linear
regression method. It is one of the most powerful and famous technique for
regression analysis. The reason is the calculation for method of OLS is much easier
than the substitution method, Maximum Likelihood and the two methods generally
Influence of Macroeconomic Variables on Stock Price Index: Evidence from Malaysia
Undergraduate Research Project Page 31 of 85 Faculty of Business and Finance
produce almost the same results. Besides, OLS includes some attractive statistical
properties under some assumptions which lead to a well-known and widely used
method. It could help to analyse the data and constitutes the basis for some method,
for instance, Analysis of Variance (Hutcheson, 2011).
3.5.3 Diagnostic Checking
3.5.3.1 Normality test
Most of the parametric tests such as T-test and regression are holding the
assumption of normally distributed. Therefore, diagnose the normal distribution of
the model must not be ignored. While normality assumption assumes that
disturbances or error terms of the model are normally distributed. Since error terms
are the variable that have been omitted, it is important that the impact of these
omitted variables is small and at best random. If this assumption does not hold,
this leads inaccurate results and draw misleading interpretations. There are two
ways to check normality; graphical method by using graphs to visualize the
distribution and normality test.
When dealing with small sample size data, it is vital to determine for a possible
violation of the normality assumption. It is because normality tests often not
sensitive enough at low sample sizes or very sensitive to large sample sizes.
Therefore, comparison for both results of visual method and normality test is
necessary in order to make sure the model is normally distributed.
Jarque-Bera test is an assessment for normality checking. This test require to
compute the skewness (a measure of symmetry where a normal distribution will
be zero) and kurtosis (a measure of how tall or squatty the normal distribution
Influence of Macroeconomic Variables on Stock Price Index: Evidence from Malaysia
Undergraduate Research Project Page 32 of 85 Faculty of Business and Finance
where a normal distribution will be three) measures of the OLS residuals first.
After that, the values will be used in computing Jarque-Bera statistic value.
3.5.3.2 Multicollinearity
Multicollinearity happens when two or more independent variables are highly
correlated. Consequently, independent variables cannot accurately reflect to us
their respective contributions towards the dependent variable.
Multicollinearity is often caused by the following reasons:
Data collection method
Over-defined model
Model specification
Constraints on models or in the population
There is no test, but there are signals to warn us about this problem in our model.
The first signal is a high R-square value but insignificant t values. Next, one can
detect multicollinearity by using Variance Inflation Factor (VIF), given the
formula VIF = 1/ 1-r²23. A VIF value less than 10 normally suggests no
multicollinearity exists in the model. Furthermore, this problem can be detected by
looking at pair wise correlation variables. When pair-wise correlation coefficient,
between two independent variables exceed 0.80, this suggests that
multicollinearity exists.
The presence of multicollinearity in the model does not violate assumptions for
OLS, hence OLS estimates are still BLUE. However, OLS estimators will have
large variances and covariances, making it difficult to obtain accurate estimation.
Consequently, standard errors are higher, leading to a wider confidence interval.
Subsequently, higher chances arise to not reject a false hypothesis (type 2 error).
As a result, one of more t ratio might be statistically insignificant. Lastly, OLS
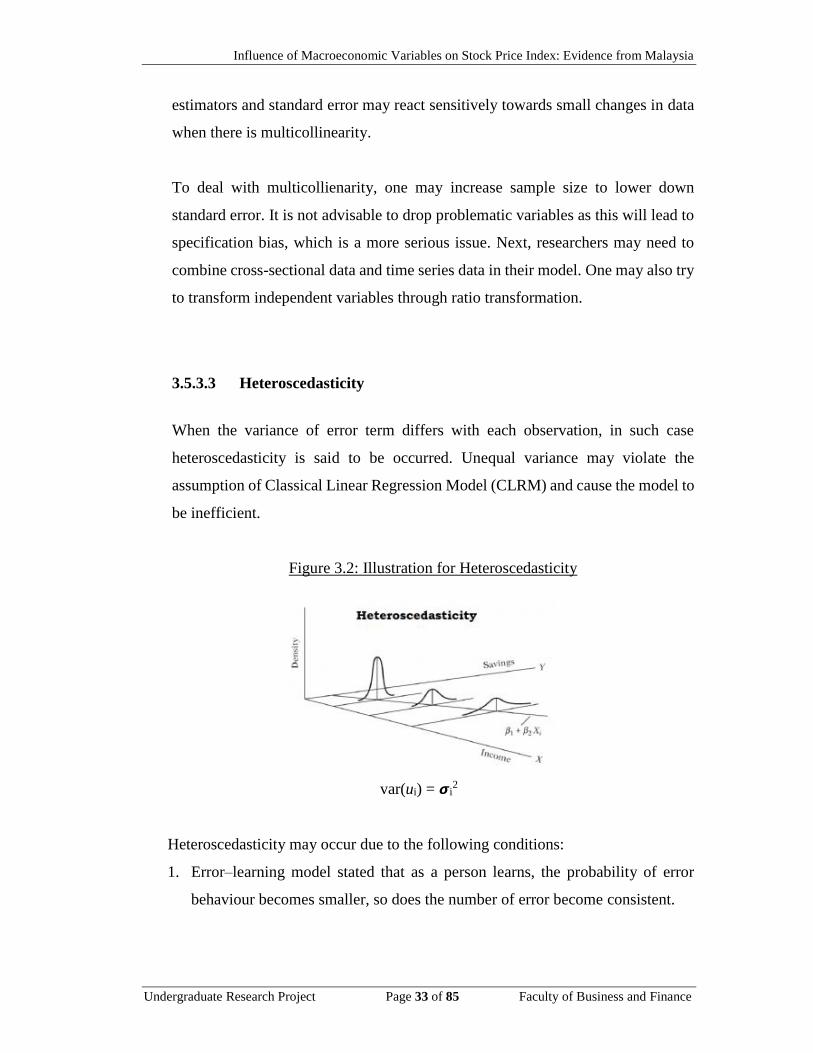
Influence of Macroeconomic Variables on Stock Price Index: Evidence from Malaysia
Undergraduate Research Project Page 33 of 85 Faculty of Business and Finance
estimators and standard error may react sensitively towards small changes in data
when there is multicollinearity.
To deal with multicollienarity, one may increase sample size to lower down
standard error. It is not advisable to drop problematic variables as this will lead to
specification bias, which is a more serious issue. Next, researchers may need to
combine cross-sectional data and time series data in their model. One may also try
to transform independent variables through ratio transformation.
3.5.3.3 Heteroscedasticity
When the variance of error term differs with each observation, in such case
heteroscedasticity is said to be occurred. Unequal variance may violate the
assumption of Classical Linear Regression Model (CLRM) and cause the model to
be inefficient.
Figure 3.2: Illustration for Heteroscedasticity
var(ui) = 𝞼i2
Heteroscedasticity may occur due to the following conditions:
1. Error–learning model stated that as a person learns, the probability of error
behaviour becomes smaller, so does the number of error become consistent.
Influence of Macroeconomic Variables on Stock Price Index: Evidence from Malaysia
Undergraduate Research Project Page 34 of 85 Faculty of Business and Finance
2. According to common human behaviour, as their income increase, the choices
of disposition of the income also increase.
3. Variance of data can be decreased when the data collection method improves.
4. Outlier observation can dramatically increase the variance in a sample size.
Although unequal variance violates the homoscedasticity assumption of CLRM,
the estimator of OLS is still unbiased. However, it affects the minimum variance
property and thus cause the estimator of OLS becomes inefficient. As a result, the
results of t statistic and f statistic would become unreliable.
There are both formal and informal ways to detect heteroscedasticity. Informal
ways include graphical method and nature of problems, while formal tests that can
be carried out include Park Test, Glesjer Test, Breusch-Pagan Test, White Test and
Autoregressive Conditional Heteroscedasticity (ARCH) Test. When
heteroscedasticity is detected, Generalised Least Square (GLS) or Weighted Least
Square (WLS) can be used to solve the problem.
3.5.3.4 Autocorrelation
Autocorrelation problem in a model is most probably found in time series data and
it happens when error terms are related to each other. Autocorrelation can be
categorized into two types which are pure serial correlation and impure serial
correlation. The former occurs in a truly specified equation while the latter is
caused by a model specification bias.
Generally, there are three reasons which lead to autocorrelation occurred in a
model. First is omitting relevant independent variables. The error term will take
into account when the model excludes an important explanatory variable. Second
factor is the wrong functional form of explained variable and explanatory variables.
Measurement errors is the third reason that may cause serially correlated. For
Influence of Macroeconomic Variables on Stock Price Index: Evidence from Malaysia
Undergraduate Research Project Page 35 of 85 Faculty of Business and Finance
instance, if a variable is measured wrongly, the incorrect information will be
captured by the error term.
The existence of autocorrelation does not fulfil the assumptions of CLRM which
states that no relationship of error terms, thus, resulting in some consequences.
Specifically, the OLS estimators are still unbiased and consistent even if there is
autocorrelation. However, the OLS estimators are no longer BLUE due to their
inefficiency. Therefore, it cannot minimize the estimated variances of coefficient
and then causes OLS estimators are underestimated the standard errors.
Consequently, the estimated parameters may become biased and discordant,
leading hypothesis testing to become unreliable.
Apart from that, autocorrelation problem can be detected by three ways which are
Durbin-Watson Test, Durbin’s h Test (for the lagged dependent variable) and
Breusch-Godfrey LM Test. Furthermore, if diagnostic checking shows that there
is an autocorrelation problem, then researcher can follow some remedial measures
to overcome it. Firstly, identify the model’s autocorrelation problem whether is
purely related or not. If the first step is fulfilled, secondly, GLS method can be
applied to transform the original model into a new model which does not have the
problem of autocorrelation. Lastly, for large sample size, Newey-West method
could be applied to correct the standard errors of OLS estimators for
autocorrelation.
Influence of Macroeconomic Variables on Stock Price Index: Evidence from Malaysia
Undergraduate Research Project Page 36 of 85 Faculty of Business and Finance
3.5.3.5 Model Specification
Based on the assumption of CLRM, the regression model must be correctly
specified to avoid biased and inconsistent results. Model specification problem
exists due to the following reasons:
i. Omission of a relevant variable
ii. Inclusion of unnecessary or irrelevant variable
iii. Incorrect specification of the stochastic error term
iv. Adopting the wrong functional form
v. Errors of measurement
In order to ensure model is correctly specified, researchers should choose the
relevant independent variables that consistent with theory. Second, they have to
confirm the selected independent variables are uncorrelated with error term. Third,
researchers need to choose an appropriate form of variables to make sure that data
of variable has stationary pattern. Lastly, they should confirm the estimated
parameter value is stable.
Model specification bias can be detected by using Regression Specification Error
Test (RESET) which is developed by Ramsey in 1969. The significant level, α is
0.10. By using E-views software to conduct Ramsey RESET test, probability value
can be obtained. If probability value is less than α, reject H0. Otherwise, do not
reject H0.
3.5.3.6 T-test
T-test was introduced by William Sealy Gosset in 1908 (Paret, 2012). It represents
one of the hypothesis testing used to analyse average of two groups of samples by
statistical examination. In details, t-test can examine how much population mean
significantly differs from hypothesized mean of other population.
Influence of Macroeconomic Variables on Stock Price Index: Evidence from Malaysia
Undergraduate Research Project Page 37 of 85 Faculty of Business and Finance
The formula is shown as below:
In t-test, t-statistic, the degree of freedom and t-distribution are used to determine
difference of two samples in term of means. The calculation of test statistic
includes ratio, which numerator consist of mean difference of two populations,
while denominator includes difference between standard error of the samples. The
denominator aims to measure the dispersion and variability of the samples, which
can be calculated by divide the sample variance by sample size, and the square root
the sum of two samples.
3.5.3.7 F-test
F-test was introduced by George W. Snedecor in 1920 (Frost, 2016). The main
function of F-test is to determine the overall significance of MLRM. F-test is
actually calculated as ratio, where variation between samples means act as
numerator, while variation within the samples act as denominator. It is also known
as one-way ANOVA. The p-value of the f-test can be calculated by E-views to
decide whether reject the null hypothesis or not. If p-value is smaller than
significant level, null-hypothesis will be rejected. Hence, regression model is said
to be significant at the significance level. R-squared obtained from F-test also
provides an insight of robustness of the relationship between dependent and
independent variables.
Influence of Macroeconomic Variables on Stock Price Index: Evidence from Malaysia
Undergraduate Research Project Page 38 of 85 Faculty of Business and Finance
3.6 Conclusion
This chapter explains the methodologies and tests which will be used to investigate the
relationship between the four macroeconomic variables and stock price movement. It
also explains some of the purpose, features, rules and procedure for empirical tests
which will be carried out in the following chapter. Data will be run using OLS Method.
Several tests such as T-Test, F-Test, and Normality Test will be applied. Also,
diagnostic checking include multicollinearity, heteroscedasticity, autocorrelation,
model specification will also be tested in this research.
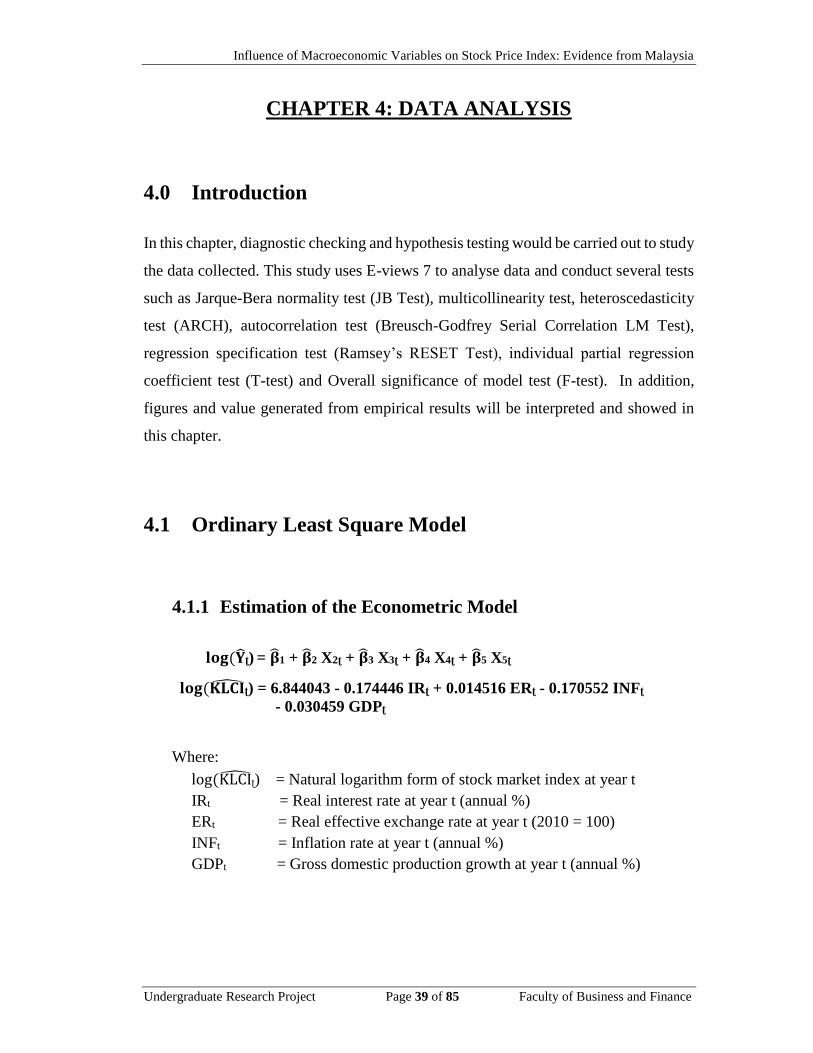
Influence of Macroeconomic Variables on Stock Price Index: Evidence from Malaysia
Undergraduate Research Project Page 39 of 85 Faculty of Business and Finance
CHAPTER 4: DATA ANALYSIS
4.0 Introduction
In this chapter, diagnostic checking and hypothesis testing would be carried out to study
the data collected. This study uses E-views 7 to analyse data and conduct several tests
such as Jarque-Bera normality test (JB Test), multicollinearity test, heteroscedasticity
test (ARCH), autocorrelation test (Breusch-Godfrey Serial Correlation LM Test),
regression specification test (Ramsey’s RESET Test), individual partial regression
coefficient test (T-test) and Overall significance of model test (F-test). In addition,
figures and value generated from empirical results will be interpreted and showed in
this chapter.
4.1 Ordinary Least Square Model
4.1.1 Estimation of the Econometric Model
𝐥𝐨𝐠(��ʈ) = ��1 + ��2 X2ʈ + ��3 X3ʈ + ��4 X4ʈ + ��5 X5ʈ
𝐥𝐨𝐠(𝐊𝐋𝐂��ʈ) = 6.844043 - 0.174446 IRʈ + 0.014516 ERʈ - 0.170552 INFʈ
- 0.030459 GDPʈ
Where:
log (KLCIʈ) = Natural logarithm form of stock market index at year t
IRt = Real interest rate at year t (annual %)
ERt = Real effective exchange rate at year t (2010 = 100)
INFt = Inflation rate at year t (annual %)
GDPt = Gross domestic production growth at year t (annual %)
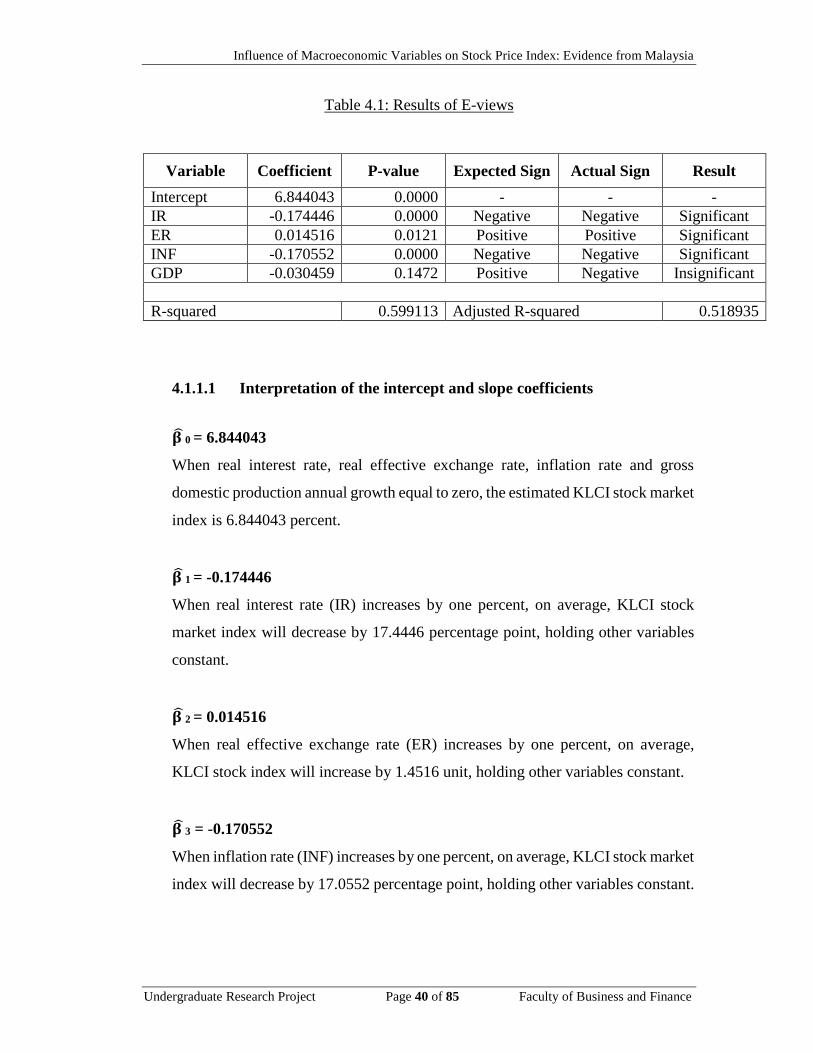
Influence of Macroeconomic Variables on Stock Price Index: Evidence from Malaysia
Undergraduate Research Project Page 40 of 85 Faculty of Business and Finance
Table 4.1: Results of E-views
Variable Coefficient P-value Expected Sign Actual Sign Result
Intercept 6.844043 0.0000 - - -
IR -0.174446 0.0000 Negative Negative Significant
ER 0.014516 0.0121 Positive Positive Significant
INF -0.170552 0.0000 Negative Negative Significant
GDP -0.030459 0.1472 Positive Negative Insignificant
R-squared 0.599113 Adjusted R-squared 0.518935
4.1.1.1 Interpretation of the intercept and slope coefficients
𝛃 0 = 6.844043
When real interest rate, real effective exchange rate, inflation rate and gross
domestic production annual growth equal to zero, the estimated KLCI stock market
index is 6.844043 percent.
𝛃 1 = -0.174446
When real interest rate (IR) increases by one percent, on average, KLCI stock
market index will decrease by 17.4446 percentage point, holding other variables
constant.
𝛃 2 = 0.014516
When real effective exchange rate (ER) increases by one percent, on average,
KLCI stock index will increase by 1.4516 unit, holding other variables constant.
𝛃 3 = -0.170552
When inflation rate (INF) increases by one percent, on average, KLCI stock market
index will decrease by 17.0552 percentage point, holding other variables constant.
Influence of Macroeconomic Variables on Stock Price Index: Evidence from Malaysia
Undergraduate Research Project Page 41 of 85 Faculty of Business and Finance
𝛃 4 = -0.030459
When gross domestic production annual growth (GDP) increases by one percent,
on average, KLCI stock market index will decrease by 3.0459 percentage point,
holding other variables constant.
4.1.1.2 Interpretation of the goodness of fit
R-squared R2 = 0.599113
There is 59.9113% of the total variation in the KLCI stock market index can be
explained by the total variation in real interest rate, real effective exchange rate,
inflation rate, gross domestic production annual growth.
Adjusted R-squared ��2 = 0.518935
There is 51.8935% of the total variation in the KLCI stock market index can be
explained by the total variation in real interest rate, real effective exchange rate,
inflation rate, gross domestic production annual growth, after taking into account
the degrees of freedom.
4.2 Normality Test
4.2.1 Jarque-Bera Normality Test (JB Test)
Hypothesis
H0: The error term in the model is normally distributed.
H1: The error term in the model is not normally distributed.
Significance level
α = 0.05
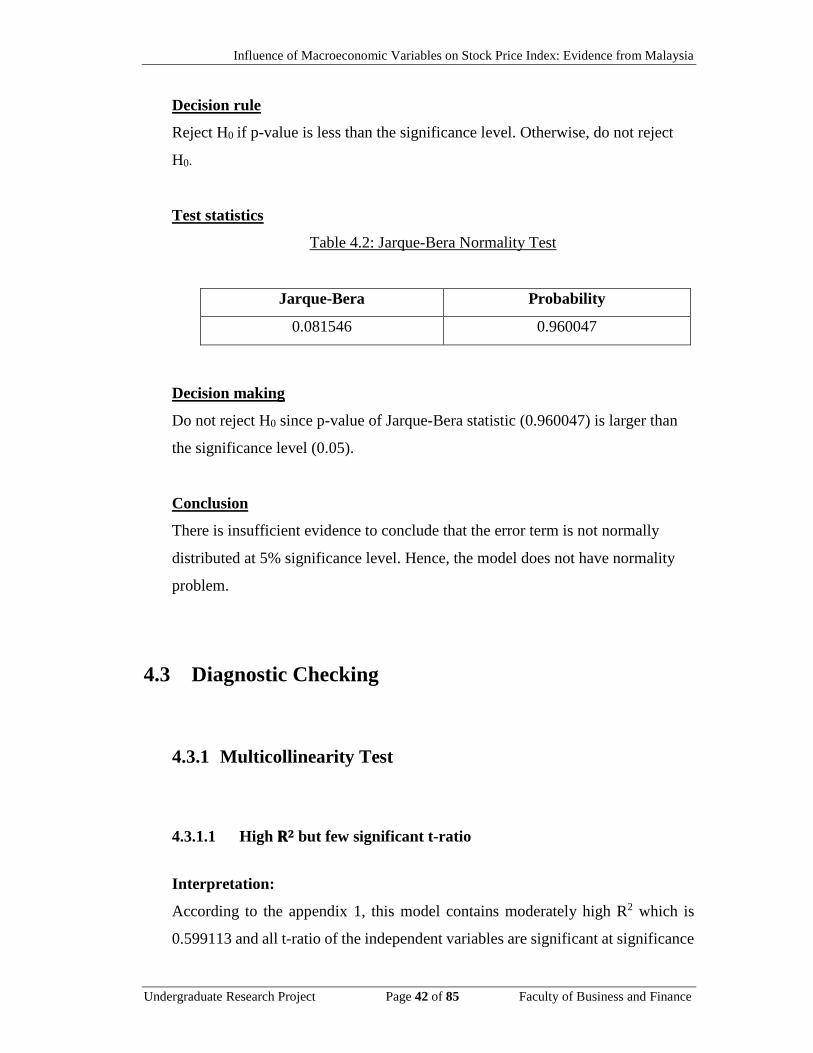
Influence of Macroeconomic Variables on Stock Price Index: Evidence from Malaysia
Undergraduate Research Project Page 42 of 85 Faculty of Business and Finance
Decision rule
Reject H0 if p-value is less than the significance level. Otherwise, do not reject
H0.
Test statistics
Table 4.2: Jarque-Bera Normality Test
Jarque-Bera Probability
0.081546 0.960047
Decision making
Do not reject H0 since p-value of Jarque-Bera statistic (0.960047) is larger than
the significance level (0.05).
Conclusion
There is insufficient evidence to conclude that the error term is not normally
distributed at 5% significance level. Hence, the model does not have normality
problem.
4.3 Diagnostic Checking
4.3.1 Multicollinearity Test
4.3.1.1 High 𝐑𝟐 but few significant t-ratio
Interpretation:
According to the appendix 1, this model contains moderately high R2 which is
0.599113 and all t-ratio of the independent variables are significant at significance
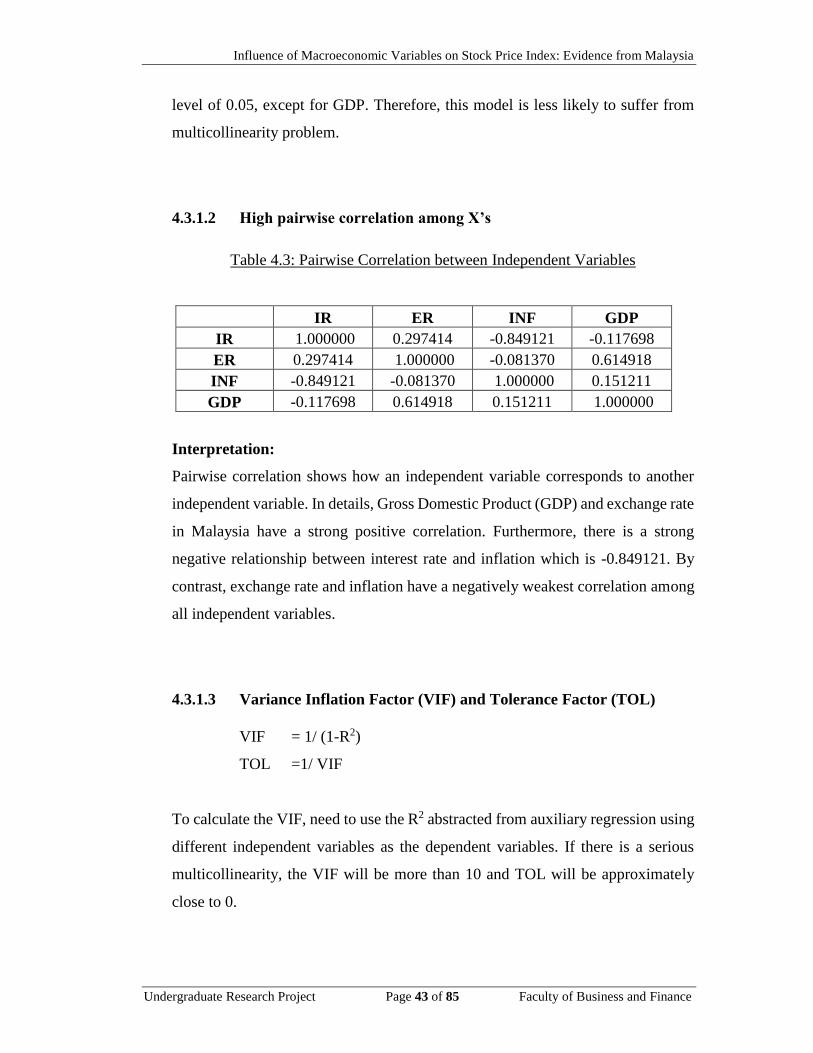
Influence of Macroeconomic Variables on Stock Price Index: Evidence from Malaysia
Undergraduate Research Project Page 43 of 85 Faculty of Business and Finance
level of 0.05, except for GDP. Therefore, this model is less likely to suffer from
multicollinearity problem.
4.3.1.2 High pairwise correlation among X’s
Table 4.3: Pairwise Correlation between Independent Variables
IR ER INF GDP
IR 1.000000 0.297414 -0.849121 -0.117698
ER 0.297414 1.000000 -0.081370 0.614918
INF -0.849121 -0.081370 1.000000 0.151211
GDP -0.117698 0.614918 0.151211 1.000000
Interpretation:
Pairwise correlation shows how an independent variable corresponds to another
independent variable. In details, Gross Domestic Product (GDP) and exchange rate
in Malaysia have a strong positive correlation. Furthermore, there is a strong
negative relationship between interest rate and inflation which is -0.849121. By
contrast, exchange rate and inflation have a negatively weakest correlation among
all independent variables.
4.3.1.3 Variance Inflation Factor (VIF) and Tolerance Factor (TOL)
VIF = 1/ (1-R2)
TOL =1/ VIF
To calculate the VIF, need to use the R2 abstracted from auxiliary regression using
different independent variables as the dependent variables. If there is a serious
multicollinearity, the VIF will be more than 10 and TOL will be approximately
close to 0.
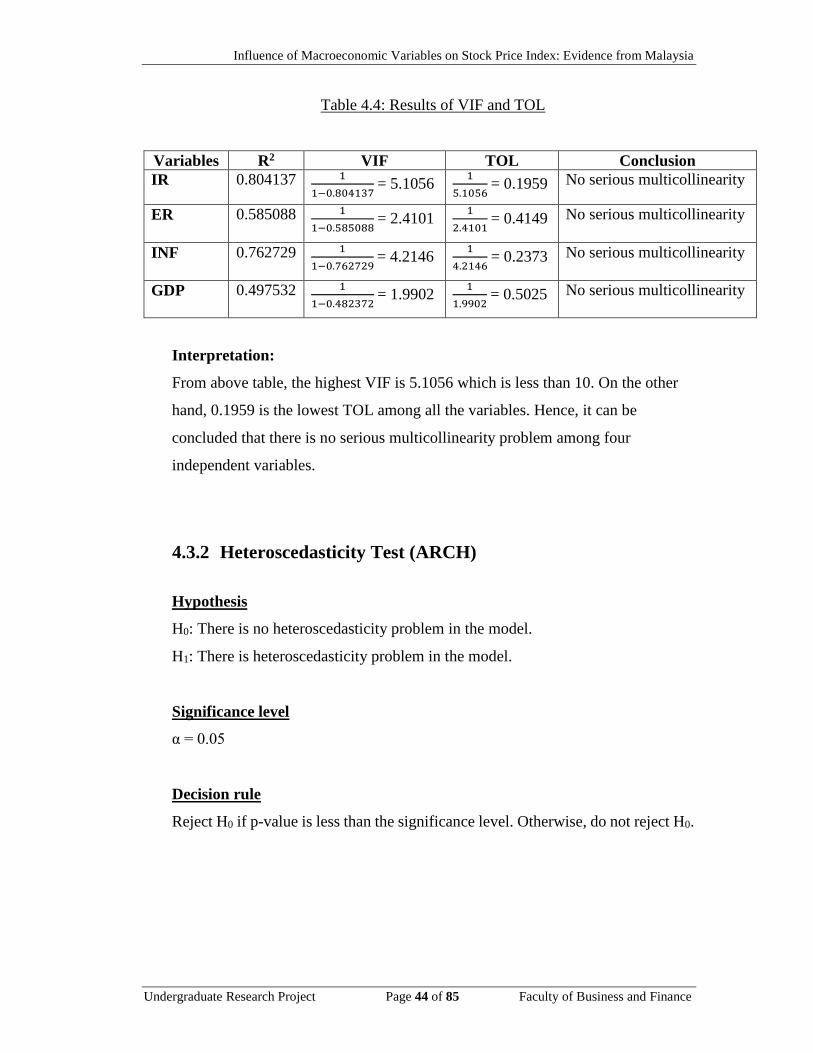
Influence of Macroeconomic Variables on Stock Price Index: Evidence from Malaysia
Undergraduate Research Project Page 44 of 85 Faculty of Business and Finance
Table 4.4: Results of VIF and TOL
Variables R2 VIF TOL Conclusion
IR 0.804137 1
1−0.804137 = 5.1056
1
5.1056 = 0.1959 No serious multicollinearity
ER 0.585088 1
1−0.585088 = 2.4101
1
2.4101 = 0.4149 No serious multicollinearity
INF 0.762729 1
1−0.762729 = 4.2146
1
4.2146 = 0.2373 No serious multicollinearity
GDP 0.497532 1
1−0.482372 = 1.9902
1
1.9902 = 0.5025 No serious multicollinearity
Interpretation:
From above table, the highest VIF is 5.1056 which is less than 10. On the other
hand, 0.1959 is the lowest TOL among all the variables. Hence, it can be
concluded that there is no serious multicollinearity problem among four
independent variables.
4.3.2 Heteroscedasticity Test (ARCH)
Hypothesis
H0: There is no heteroscedasticity problem in the model.
H1: There is heteroscedasticity problem in the model.
Significance level
α = 0.05
Decision rule
Reject H0 if p-value is less than the significance level. Otherwise, do not reject H0.
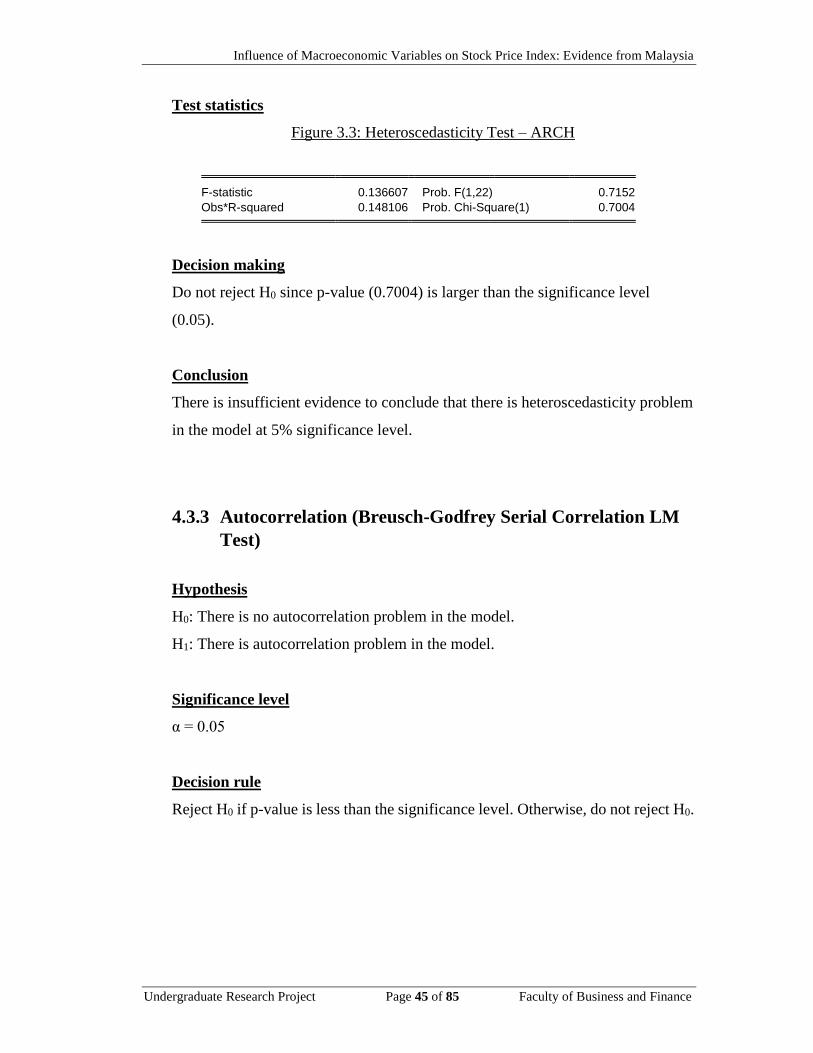
Influence of Macroeconomic Variables on Stock Price Index: Evidence from Malaysia
Undergraduate Research Project Page 45 of 85 Faculty of Business and Finance
Test statistics
Figure 3.3: Heteroscedasticity Test – ARCH
Decision making
Do not reject H0 since p-value (0.7004) is larger than the significance level
(0.05).
Conclusion
There is insufficient evidence to conclude that there is heteroscedasticity problem
in the model at 5% significance level.
4.3.3 Autocorrelation (Breusch-Godfrey Serial Correlation LM
Test)
Hypothesis
H0: There is no autocorrelation problem in the model.
H1: There is autocorrelation problem in the model.
Significance level
α = 0.05
Decision rule
Reject H0 if p-value is less than the significance level. Otherwise, do not reject H0.
F-statistic 0.136607 Prob. F(1,22) 0.7152
Obs*R-squared 0.148106 Prob. Chi-Square(1) 0.7004
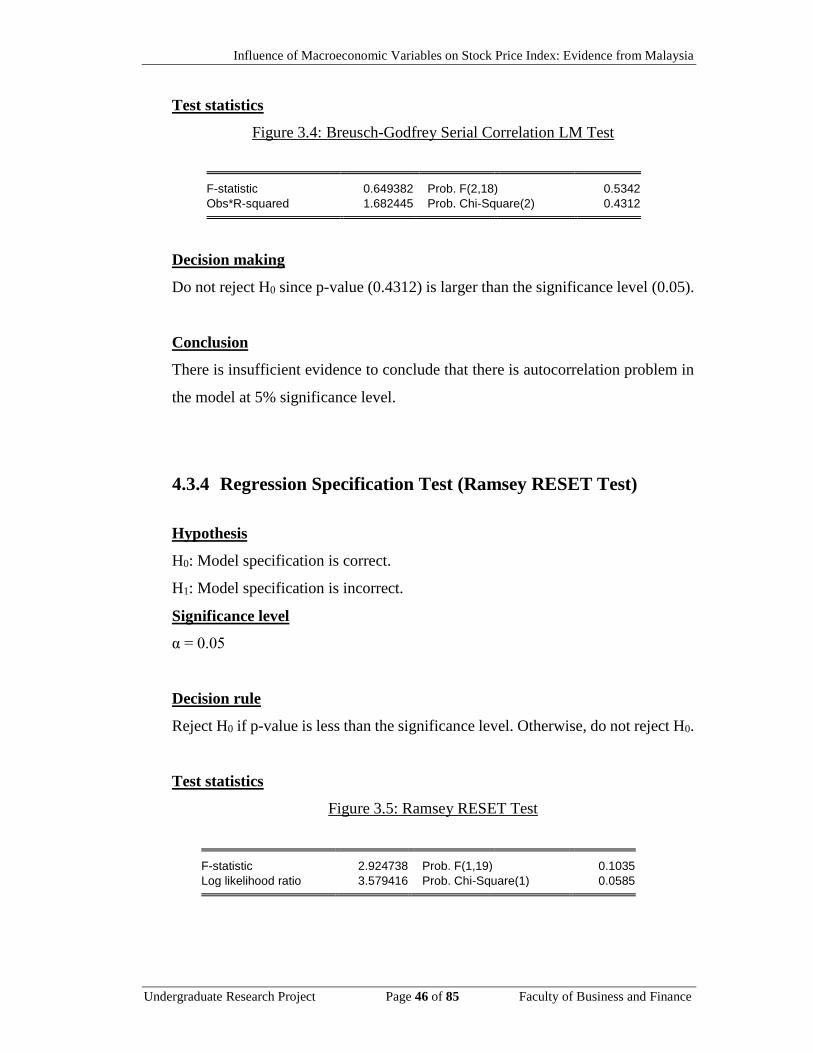
Influence of Macroeconomic Variables on Stock Price Index: Evidence from Malaysia
Undergraduate Research Project Page 46 of 85 Faculty of Business and Finance
Test statistics
Figure 3.4: Breusch-Godfrey Serial Correlation LM Test
Decision making
Do not reject H0 since p-value (0.4312) is larger than the significance level (0.05).
Conclusion
There is insufficient evidence to conclude that there is autocorrelation problem in
the model at 5% significance level.
4.3.4 Regression Specification Test (Ramsey RESET Test)
Hypothesis
H0: Model specification is correct.
H1: Model specification is incorrect.
Significance level
α = 0.05
Decision rule
Reject H0 if p-value is less than the significance level. Otherwise, do not reject H0.
Test statistics
Figure 3.5: Ramsey RESET Test
F-statistic 0.649382 Prob. F(2,18) 0.5342
Obs*R-squared 1.682445 Prob. Chi-Square(2) 0.4312
F-statistic 2.924738 Prob. F(1,19) 0.1035
Log likelihood ratio 3.579416 Prob. Chi-Square(1) 0.0585
Influence of Macroeconomic Variables on Stock Price Index: Evidence from Malaysia
Undergraduate Research Project Page 47 of 85 Faculty of Business and Finance
Decision making
Do not reject H0 since p-value (0.1035) is larger than the significance level (0.05).
Conclusion
There is insufficient evidence to conclude that the model specification is incorrect
at 5% significance level.
4.4 Hypothesis Testing
4.4.1 Hypothesis testing for overall model’s significance (F-test)
Hypothesis
H0: β1=β2=β3=β4=0
H1: At least one of the βi is different from zero, where i = 1,2,3,4
Significance level
α = 0.05
Decision rule
Reject H0 if p-value is less than the significance level. Otherwise, do not reject H0.
Test statistics
p-value (F-statistic) = 0.000749
Decision making
Reject H0 since p-value (0.000749) is less than the significance level (0.05).
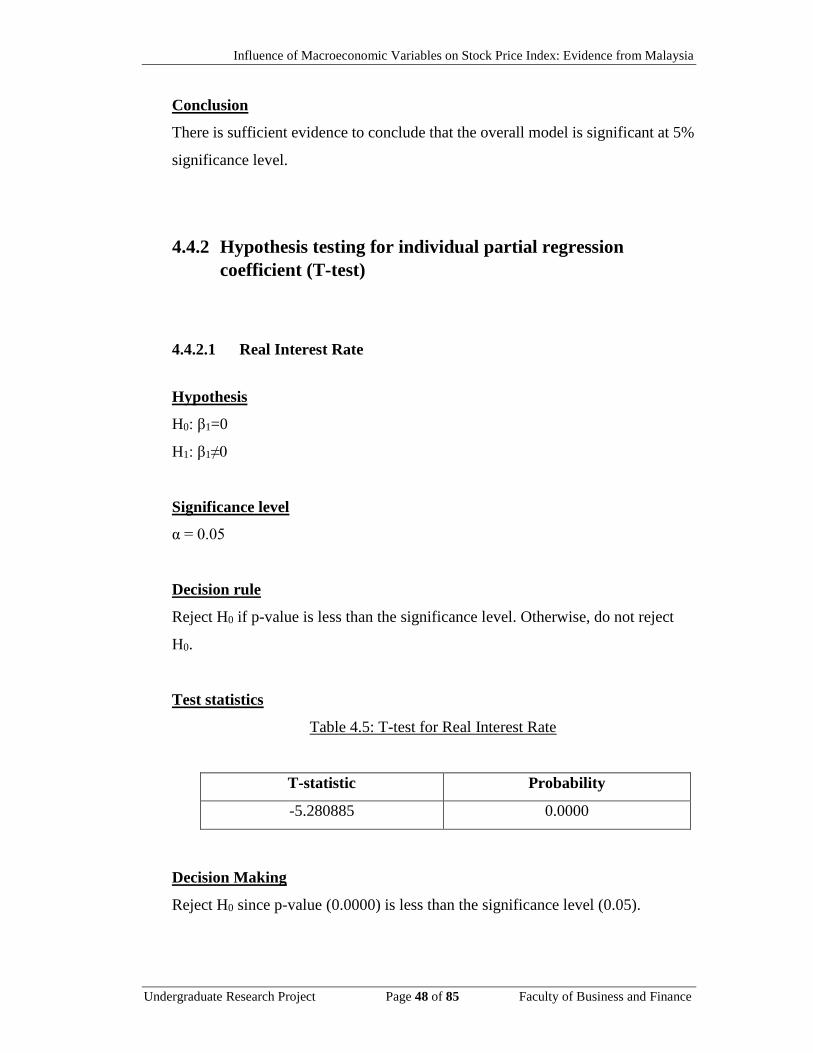
Influence of Macroeconomic Variables on Stock Price Index: Evidence from Malaysia
Undergraduate Research Project Page 48 of 85 Faculty of Business and Finance
Conclusion
There is sufficient evidence to conclude that the overall model is significant at 5%
significance level.
4.4.2 Hypothesis testing for individual partial regression
coefficient (T-test)
4.4.2.1 Real Interest Rate
Hypothesis
H0: β1=0
H1: β1≠0
Significance level
α = 0.05
Decision rule
Reject H0 if p-value is less than the significance level. Otherwise, do not reject
H0.
Test statistics
Table 4.5: T-test for Real Interest Rate
T-statistic Probability
-5.280885 0.0000
Decision Making
Reject H0 since p-value (0.0000) is less than the significance level (0.05).
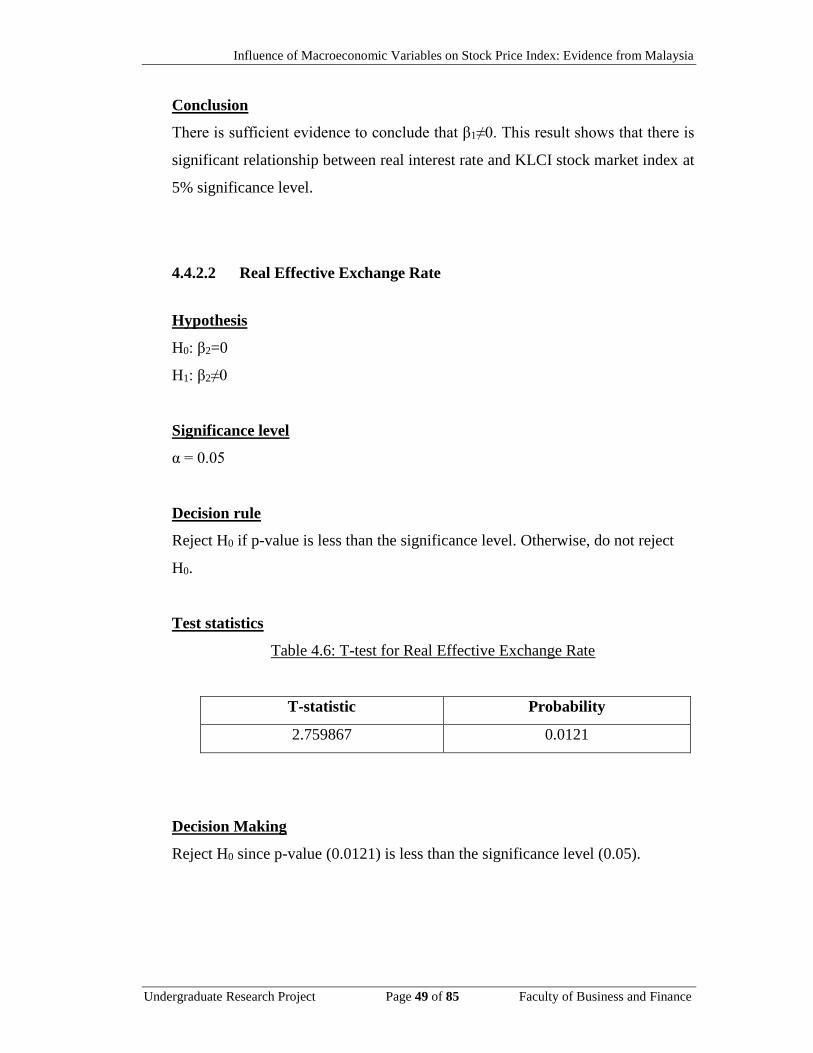
Influence of Macroeconomic Variables on Stock Price Index: Evidence from Malaysia
Undergraduate Research Project Page 49 of 85 Faculty of Business and Finance
Conclusion
There is sufficient evidence to conclude that β1≠0. This result shows that there is
significant relationship between real interest rate and KLCI stock market index at
5% significance level.
4.4.2.2 Real Effective Exchange Rate
Hypothesis
H0: β2=0
H1: β2≠0
Significance level
α = 0.05
Decision rule
Reject H0 if p-value is less than the significance level. Otherwise, do not reject
H0.
Test statistics
Table 4.6: T-test for Real Effective Exchange Rate
T-statistic Probability
2.759867 0.0121
Decision Making
Reject H0 since p-value (0.0121) is less than the significance level (0.05).
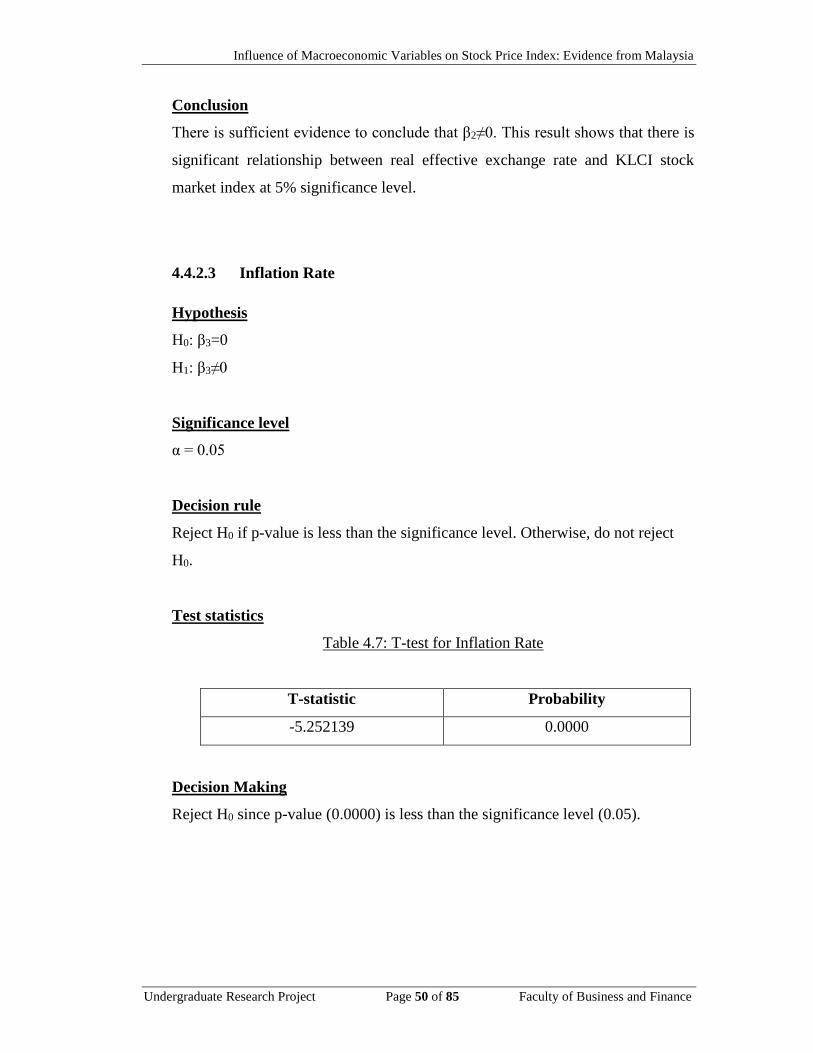
Influence of Macroeconomic Variables on Stock Price Index: Evidence from Malaysia
Undergraduate Research Project Page 50 of 85 Faculty of Business and Finance
Conclusion
There is sufficient evidence to conclude that β2≠0. This result shows that there is
significant relationship between real effective exchange rate and KLCI stock
market index at 5% significance level.
4.4.2.3 Inflation Rate
Hypothesis
H0: β3=0
H1: β3≠0
Significance level
α = 0.05
Decision rule
Reject H0 if p-value is less than the significance level. Otherwise, do not reject
H0.
Test statistics
Table 4.7: T-test for Inflation Rate
T-statistic Probability
-5.252139 0.0000
Decision Making
Reject H0 since p-value (0.0000) is less than the significance level (0.05).
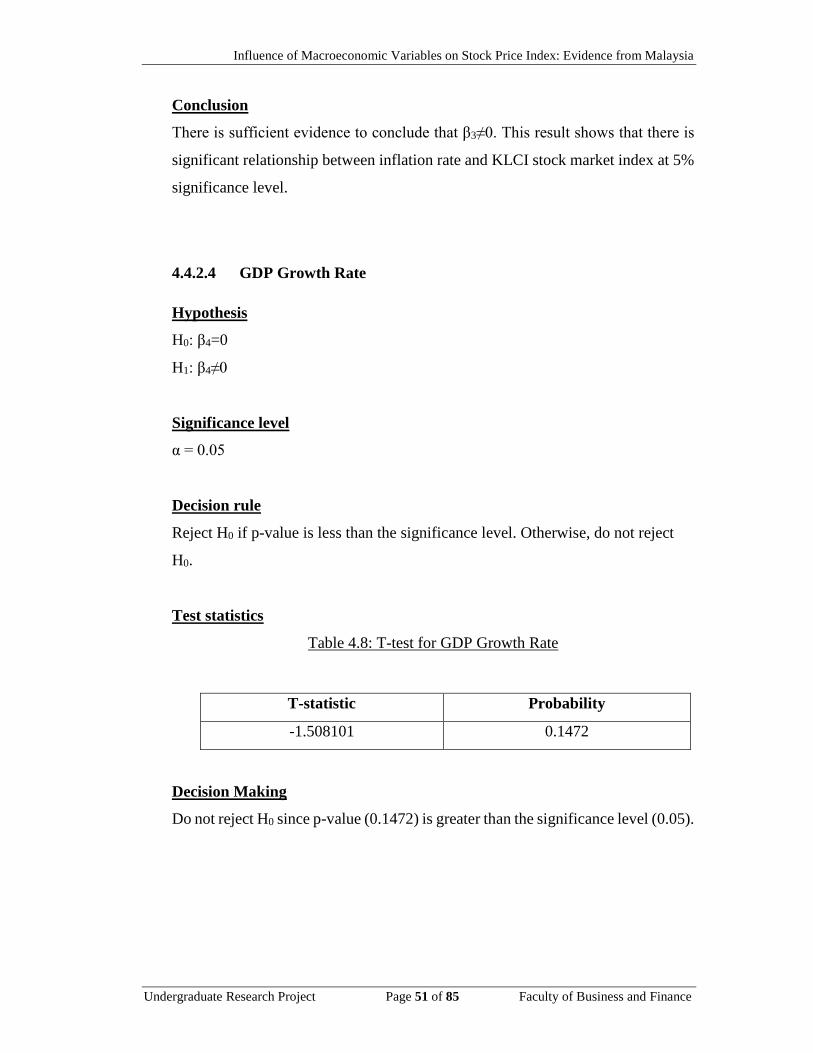
Influence of Macroeconomic Variables on Stock Price Index: Evidence from Malaysia
Undergraduate Research Project Page 51 of 85 Faculty of Business and Finance
Conclusion
There is sufficient evidence to conclude that β3≠0. This result shows that there is
significant relationship between inflation rate and KLCI stock market index at 5%
significance level.
4.4.2.4 GDP Growth Rate
Hypothesis
H0: β4=0
H1: β4≠0
Significance level
α = 0.05
Decision rule
Reject H0 if p-value is less than the significance level. Otherwise, do not reject
H0.
Test statistics
Table 4.8: T-test for GDP Growth Rate
T-statistic Probability
-1.508101 0.1472
Decision Making
Do not reject H0 since p-value (0.1472) is greater than the significance level (0.05).
Influence of Macroeconomic Variables on Stock Price Index: Evidence from Malaysia
Undergraduate Research Project Page 52 of 85 Faculty of Business and Finance
Conclusion
There is sufficient evidence to conclude that β4=0. This result shows that there is
insignificant relationship between gross domestic product annual growth and
KLCI stock market index at 5% significance level.
4.5 Conclusion
Data collected for this research had been analysed and examined by five diagnostic
checking as well as two hypothesis testing. The whole empirical results from the
methodologies are significant. However, one of the independent variables, GDP
showed a conflict result with expected sign. The results had been fully and clearly
presented in table form. The detailed major findings shall be presented in the next
chapter.
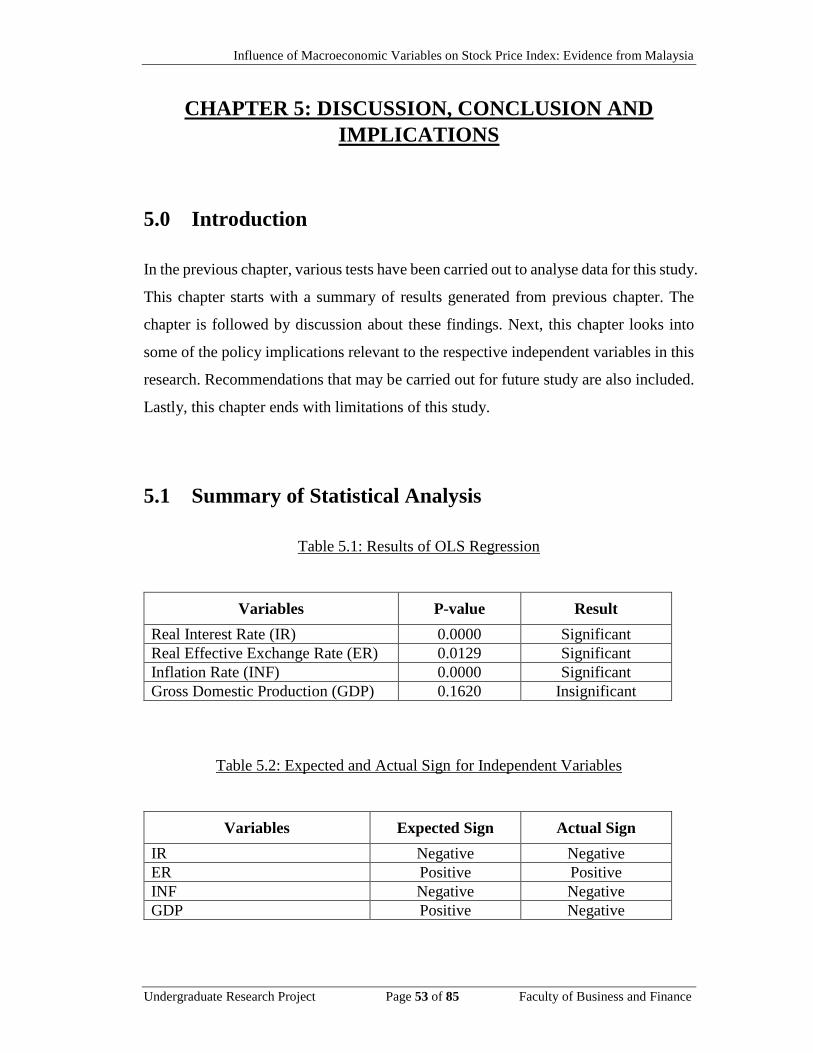
Influence of Macroeconomic Variables on Stock Price Index: Evidence from Malaysia
Undergraduate Research Project Page 53 of 85 Faculty of Business and Finance
CHAPTER 5: DISCUSSION, CONCLUSION AND
IMPLICATIONS
5.0 Introduction
In the previous chapter, various tests have been carried out to analyse data for this study.
This chapter starts with a summary of results generated from previous chapter. The
chapter is followed by discussion about these findings. Next, this chapter looks into
some of the policy implications relevant to the respective independent variables in this
research. Recommendations that may be carried out for future study are also included.
Lastly, this chapter ends with limitations of this study.
5.1 Summary of Statistical Analysis
Table 5.1: Results of OLS Regression
Variables P-value Result
Real Interest Rate (IR) 0.0000 Significant
Real Effective Exchange Rate (ER) 0.0129 Significant
Inflation Rate (INF) 0.0000 Significant
Gross Domestic Production (GDP) 0.1620 Insignificant
Table 5.2: Expected and Actual Sign for Independent Variables
Variables Expected Sign Actual Sign
IR Negative Negative
ER Positive Positive
INF Negative Negative
GDP Positive Negative
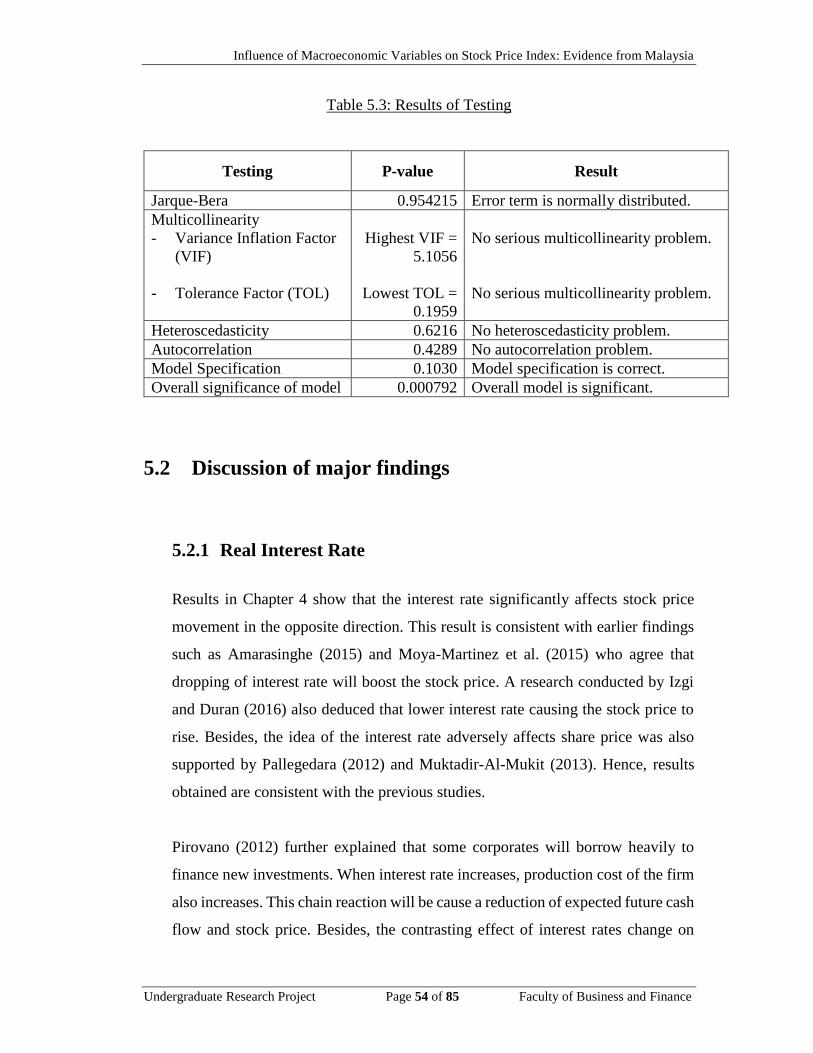
Influence of Macroeconomic Variables on Stock Price Index: Evidence from Malaysia
Undergraduate Research Project Page 54 of 85 Faculty of Business and Finance
Table 5.3: Results of Testing
Testing P-value Result
Jarque-Bera 0.954215 Error term is normally distributed.
Multicollinearity
- Variance Inflation Factor
(VIF)
- Tolerance Factor (TOL)
Highest VIF =
5.1056
Lowest TOL =
0.1959
No serious multicollinearity problem.
No serious multicollinearity problem.
Heteroscedasticity 0.6216 No heteroscedasticity problem.
Autocorrelation 0.4289 No autocorrelation problem.
Model Specification 0.1030 Model specification is correct.
Overall significance of model 0.000792 Overall model is significant.
5.2 Discussion of major findings
5.2.1 Real Interest Rate
Results in Chapter 4 show that the interest rate significantly affects stock price
movement in the opposite direction. This result is consistent with earlier findings
such as Amarasinghe (2015) and Moya-Martinez et al. (2015) who agree that
dropping of interest rate will boost the stock price. A research conducted by Izgi
and Duran (2016) also deduced that lower interest rate causing the stock price to
rise. Besides, the idea of the interest rate adversely affects share price was also
supported by Pallegedara (2012) and Muktadir-Al-Mukit (2013). Hence, results
obtained are consistent with the previous studies.
Pirovano (2012) further explained that some corporates will borrow heavily to
finance new investments. When interest rate increases, production cost of the firm
also increases. This chain reaction will be cause a reduction of expected future cash
flow and stock price. Besides, the contrasting effect of interest rates change on
Influence of Macroeconomic Variables on Stock Price Index: Evidence from Malaysia
Undergraduate Research Project Page 55 of 85 Faculty of Business and Finance
stock returns has also been found in the latest study done by Assefa, Esqueda, and
Mollick (2017).
5.2.2 Real Effective Exchange Rate
In this research, there is a positive link between real effective exchange rate and
stock market index in Malaysia. The findings are consistent with the research by
Tian and Ma (2010) who found that stock market and exchange rate were
positively correlated. The depreciation of domestic currency will influence the
stock price positively. Other than that, Bello (2013) also reported that local
currency will appreciate when import to domestic increased but exports to foreign
country declined. In this scenario, it will decrease the value of foreign exchange as
well as lower the local stock market. This result is further supported by Kuwornu
(2012) and examined that the stock prices may change positively with a drop in
exchange rate. In line with this, change in foreign currency will lower the cost of
imported inputs, which increases the local economic activities and hence stock
returns.
According to Barakat, Elgazzar and Hanafy (2016), exchange rate has the largest
and positive coefficient in the equity market performance. An increase in domestic
currency value will cause people to have more money to invest in the equity market.
This will lead to a rise in stock trading activity as demand for stock market
increases, hence this pushes up the stock returns. Thus, the positive relationship
exists in between the exchange rate and stock market index. Furthermore,
Najafzadeh, Monjazeb and Mamipour (2016) stated that when the exchange rate
increases by one unit, on average, the stock returns will increase too, holding other
variables constant. It indicates that increasing the volatility in the foreign exchange
market will cause investors to lose their confidence to invest in forex market.
Hence, the stock market will become the alternate choice for the investors in order
Influence of Macroeconomic Variables on Stock Price Index: Evidence from Malaysia
Undergraduate Research Project Page 56 of 85 Faculty of Business and Finance
to reduce the foreign exchange risk, avoid losses and earn profits. This will also
result in an increase in liquidity to the stock market and stock prices.
5.2.3 Inflation Rate
As mentioned in Chapter 2, Fisher effect hypothesis suggested that nominal
interest rate equal to the sum of real interest rate and expected inflation. Taofik and
Omosola (2013), Chakravarty and Mitra (2013) and Limpanithiwat and
Rungsombudpornkul (2010) suggested that inflation has a positive relationship
with the stock return, directly and indirectly. Hossain (2012) further explained that
decreasing interest rate will worsen unemployment rate, and lower down the stock
return.
Result of this study indicates a negative relationship between inflation and
Malaysia stock returns. The results are consistent with the theory proposed by
Kimani and Mutuku (2013), Ali (2011) and Eita (2012). Besides, Caroline, Rosle,
Vivin, and Victoria (2011) also confirmed the negative relationship between
expected or unexpected inflation and stock price appeared in the long run. The
results generated from this study suggested that inflation in Malaysia will
adversely affect the stock market KLCI in terms of stock price and stock returns.
5.2.4 GDP Growth Rate
Result from Chapter 4 show that GDP growth rate does not have long term
relationship with stock market performance. This is consistent with findings from
several researchers from literature review. Although this finding is different from
priori, which expects GDP to be significant, this finding may be explained by
looking at how stock price is driven. Stock price is a discounting mechanism of an
enterprise value (Almeida, 2016). In other words, stock price is derived from the
Influence of Macroeconomic Variables on Stock Price Index: Evidence from Malaysia
Undergraduate Research Project Page 57 of 85 Faculty of Business and Finance
firm’s value plus its future cash flows being discounted to present value. In this
context, a growth in firm business value is a more important to influence the stock
index than an increase in economic growth rate.
Al-Tamimi, Alwan and Abdel Rahman (2011) studied how stock price is
influenced by internal and external factors. Internal factors are company
fundamentals such as earning-per-share (EPS) and dividend-per-share (DPS),
while external factors are macroeconomic variables. They discovered that EPS,
which belongs to internal factor, is the most important factor in influencing stock
price movement as compared to external factor such as GDP and interest rate.
Meanwhile, GDP tells us more on consumer spending and government expenditure
and limited information about forces affecting firm valuation (Almeida, 2016). In
other words, a well-performing economy does not necessarily guarantee investor
higher returns in the stock market. In short, stock price is directly affected by the
fundamentals such as, which subsequently drive cash flow. This leads to an
increase in profit and eventually pushes up stock price.
5.3 Implication of the Study
5.3.1 Real Interest Rate
Central bank should always control interest rate at appropriate level to ensure
steady and healthy growth for stock market. This will be very supportive to the
monetary purposes of the government when the intention of investor to participate
in stock market increase (Bekhet & Mugableh, 2012). On the other hand, the
dropping of interest rate may increase the money supply in the market. Hence, the
public will have extra fund to inject to the stock market and push up the stock price.
However, the lowering of interest rate cannot be overdone. This is because a lower
interest rate leads to a lower borrowing cost. Subsequently this will lead to
Influence of Macroeconomic Variables on Stock Price Index: Evidence from Malaysia
Undergraduate Research Project Page 58 of 85 Faculty of Business and Finance
excessive money supply and eventually causing inflation. Therefore, governments
are advised to maintain the optimal interest rate at optimal level to encourage a
stable economic condition (Chirchir, 2014). When this happens, firms operate
under good economic environment has higher chance to perform better, resulting
in higher stock price.
Moreover, investors and portfolio managers are advised to consider the time- and
investment horizon-dependence of the interest rate-stock market nexus in their
investment decisions and diversification and risk management strategies (Ferrer,
Bolós & Benítez, 2016). For instance, investors will be able response to the market
quickly when the announcement of rising or dropping OPR is released by Central
Bank. They can make decision on whether to buy, hold or sell the stock in order to
protect or increase their portfolio value. Therefore, investors can reallocate their
asset among different financial products such as government bond, mutual fund
and real estate (Kasman, Vardar & Tunç, 2011).
Furthermore, firms should manage their cash flows wisely to lower the exposure
of interest rate risk. Finance department in corporate firms have to implement a
financial plan to ensure the company always has sufficient cash for daily operation.
They have to manage budgets to ensure firms do not need to borrow fund especially
when interest rate is unfavourable to them (Nangka, Pangemanan & Pandowo,
2013). When the interest rate is high, this equals to an increase in borrowing cost.
Consequently, this will decrease profit of the corporate and convey a signal of
losing competitiveness to the shareholders. Then, those disappointed shareholders
will choose to sell off their position in the stock market and lead to the declining
of stock price.
Influence of Macroeconomic Variables on Stock Price Index: Evidence from Malaysia
Undergraduate Research Project Page 59 of 85 Faculty of Business and Finance
5.3.2 Real Effective Exchange Rate
Policy makers should develop a policy which is correlated to the impact of equity
market volatility and its effect on the economic development. Therefore, policy
makers must have a better understanding of the nature of the linkage between share
prices index and the foreign exchange rate in order to deploying a rational and
effective policy. Their overestimation or underestimation of this relationship
would give them a false signal and would not achieve their desired policy targets
(Olufeagba, 2016).
Apart from that, government or monetary committee should maintain foreign
exchange rate in order to motivate and encourage foreign investors to invest in
Malaysia (Najaf & Najaf, 2016). Foreign investments have brought a large capital
flows into domestic equity market and stimulated economy growth as well as its
stock market. Additionally, increasing aggregate demand in stock market will push
up stock prices. Furthermore, government should also strengthen the rules and
regulations as well as provide appropriate monitoring in foreign exchange market
to prevent insider abuse problem (Zubair, 2013). This will continuously result in
exchange rate fluctuations, thus, affecting volatility of stock market.
Investors cannot control the fluctuation of the foreign exchange rate. Therefore,
similar to the policy makers, investors should concern and take the true relationship
between the financial markets and macroeconomic into consideration (Barakat,
Elgazzar & Hanafy, 2016). Having sufficient knowledge and a clear understanding
on their relationship is essential for investors to make the best investment decisions.
5.3.3 Inflation Rate
In this study, stock market return is said to be adversely affected by inflation. The
implication of this study is that to help policy makers to achieve stable and
Influence of Macroeconomic Variables on Stock Price Index: Evidence from Malaysia
Undergraduate Research Project Page 60 of 85 Faculty of Business and Finance
improving stock market. Therefore, policy makers can plan the policy aimed to
lower or maintain the stability of inflation rate in Malaysia. Caroline, Rosle, Vivin,
and Victoria (2011) suggested that government can review and enhance the
monetary policy in order to keep consistent with low inflation profile. Besides,
government also can plan appropriate fiscal policy to achieve desired inflation rate
in the nation (Bai, 2014). In addition, Eita (2012) stated that growth in economic
activity can benefit stock market. Monetary policy can be tightened to maintain
low inflation rate in order to protect stock market returns (Irum, Fiyaz & Junid,
2014). Moreover, Kasidi and Mwakanemela (2013) indicated that inflation rate
should always be maintained at single digit, while Kimani and Mutuku (2013)
suggested adjusting monetary and fiscal policy in order to gain highest confidence
from the investing community.
According to Joseph and Eric (2010), policy makers are advised to draft monetary
policy by selecting an optimal or suitable target for inflation indicator. After that,
they can plan and design the most appropriate and critical policies to realize the
target consequently. For example, they can focus on policies regarding prudent
public expenditure management and stricken adherence to public procurement
rules. Furthermore, proactive and efficient local revenue mobilization should be
planned to accelerate growth in private sector. These steps can reduce and keep
inflation at lower level in order to maintain stability of stock market.
5.3.4 GDP Growth Rate
According to Gajdka and Pietraszewski (2016), one may naturally think that real
economy growth leads to stock return. However, in their studies, they found no
correlation between stock return and economy growth for developed nations and
some emerging markets. The study further explained that this result can be caused
by a number of reasons. For example, big firms which has operation in
international markets are exposed to more set of challenges, such as economy
Influence of Macroeconomic Variables on Stock Price Index: Evidence from Malaysia
Undergraduate Research Project Page 61 of 85 Faculty of Business and Finance
stability and condition of foreign nation. Another reason as suggested by these
author is earnings gained by firm would be diluted through the giving of employee
stock options. Next, at times firm will be under pressure to grow at all cost, thus
resulting in negative NPV investment. As a result, this would lower future
profitability and hence, lowering down stock price.
Nkechukwu, Onyeagb, Okoh (2015) claimed it is difficult to predict stock market
prices based on macroeconomic factors. Investors should not make their trading
decisions solely based on the announcement of macroeconomic variables. This is
due to the fact stock price movement are not only influenced by macroeconomic
factors, but also by some other intervening factors. Firms should focus on
improving profit and to improve firm performance. As a result, this would increase
firm value, thus attracting more investor, which eventually pushing up stock price.
Zakaria and Shamsuddin (2012a) stated an insignificant GDP towards stock
market performance is justifiable for emerging market. This could be caused by
dominance of non-institutional investors and the existence of information
asymmetry problem among investors. These factors could contribute to a weak
relationship between stock market and macroeconomic variables in the emerging
market, particularly in Malaysia. Meanwhile, Al-Tamimi, Alwan and Abdel
Rahman (2011) studied how stock market is influenced by internal and external
factors. They discovered that EPS, which belongs to internal factor, is the most
important factor in influencing stock price movement as compared to external
factor such as GDP and interest rate.
5.4 Limitation
There are some limitations that may affect and disturb the accuracy of results in this
research. Therefore, results obtained may not fully reflect the relationship between
macroeconomic variables and stock market performance. The researchers who refer to
this study have to be alert of the limitations mentioned below.
Influence of Macroeconomic Variables on Stock Price Index: Evidence from Malaysia
Undergraduate Research Project Page 62 of 85 Faculty of Business and Finance
5.4.1 Use of Annual Data
Data for variables employed in this research are collected in annual basis. However,
variables such as exchange rate and stock price index fluctuate daily. As a result,
results generated using monthly data might be different with those results
generated using annual data. In short, frequency of annual data might not fully
capture the how these variables affect the volatility of stock price compared to
variables collected in higher frequency data such as monthly or quarterly data.
5.4.2 Stock Index Restrictions
This research adopted FBMKLCI as benchmark to capture stock price volatility in
Malaysia. There are total of 807 listed companies in Malaysia as of 4 March 2017.
However, FBMKLCI only included top 30 listed companies in Malaysia which is
insufficient enough to represent the majority of these companies. Besides, these
807 companies comprises of many sectors such as manufacturing, technology and
plantation. Each sector might have different sensitivity to different macroeconomic
variables.
Researchers should be alert to these limitations when adopting the information in
this study. In short, potential users should refer to these limitations which can be
raise for future study purpose.
Influence of Macroeconomic Variables on Stock Price Index: Evidence from Malaysia
Undergraduate Research Project Page 63 of 85 Faculty of Business and Finance
5.5 Recommendation
5.5.1 Behavioural Finance
Many classical finance theories are drawn with assumptions that investors trade
rationally. However, in real world practice, investors may not always be rational
while trading stock. According to behavioural finance, psychological and
emotional factors could influence investment decision to a large extent (Birau,
2012). One of the famous examples in behavioural finance is herd instinct
(Moldovan, 2010). According to this theory, investors tend to follow the majority
or made trading decisions based on conclusion drawn from single source or small
sample data.
Psychological factor and human sentiment will violate stock market efficiency.
Consequently, market prices tend to move differently from the fundamental values
of organisation and this will lead to mispricing of stock prices. Therefore,
researcher may consider including qualitative variables which are relevant to
behavioural finance to better reflect a change in stock market performance.
5.5.2 Negative Shock
Negative shock can be one of the factors that affect the volatility of stock market
performance. It may influence the stock market performance directly and indirectly
through chain reactions (Arabi, 2016). For example, according Hisyam (2016)
Malaysia stock market reacted negatively to Donald Trump won the United States
President Election on November 2016. On that particular day, FTSE Bursa
Malaysia KLCI closed at 1,642.45 points and dropped by 1.28 percent.
Influence of Macroeconomic Variables on Stock Price Index: Evidence from Malaysia
Undergraduate Research Project Page 64 of 85 Faculty of Business and Finance
In this context, the victory of Trump became a shock in Malaysia due to the
uncertainty of the changes in U.S trade policy. Trump has made changes to several
policies in order to foster prosperity of U.S economy. Some of the changes include
the withdrawal from Trans-Pacific Partnership (TPP) Agreement and impose
higher tariffs on imports. When higher tariff is imposed, cost of imported goods
for U.S will be higher. If this happens, this would adversely affect Malaysian
exporters and hence lower down the stock market index due to a lower firm
performance (Surendra, 2016). Researchers can focus on this latest event, or
include any other relevant major events to better examine the impacts of negative
shock on the stock market index.
5.5.3 Industrial Production Index (IPI)
IPI measures the real output of the manufacturing, mining, and electric and gas
utilities industries. When IPI index increases, this shows that companies in that
industry are well-performed and has higher output. This index will be in monthly
basis and it reveals the industrial output of a nation. Peiro (2016) made an
interesting discovery whereby there is a visible change over time in the relative
importance of IPI and interest rates in European countries such as France, Germany
and the United Kingdom.
The author noticed that IPI had become a much more important element to
influence the stock performance at the expense of interest rate in recent years. At
the same time, Aromolaran, Taiwo, Adekoya and Malomo (2016) found significant
long run relationship with the performance of All Share Index (ASI) in Nigeria.
Thus, further research can be carried out to investigate whether there is a change
over time in the relative importance of IPI index towards stock market in
developing countries such as Malaysia.
Influence of Macroeconomic Variables on Stock Price Index: Evidence from Malaysia
Undergraduate Research Project Page 65 of 85 Faculty of Business and Finance
5.5.4 Include Qualitative Variables
Qualitative factor such as investors behaviour also play a big role in affecting stock
index price. Qualitative data may include factor such as investors’ feeling,
behaviour and personal characteristic which cannot be captured by quantitative
data (Madrigal & McClain, 2012). By including qualitative data, researchers could
include qualitative data without being constrained by numerical form. This allow
future study to better capture factors that drive stock market performance.
5.6 Conclusion
This study examines the effect of macroeconomic variables toward stock market
performance in Malaysia. The findings confirmed that three independent variables,
namely inflation rate, exchange rate, interest rate have long run significant relationship
with KLCI index, while GDP growth rate does not significantly affect stock market
performance in long run. To conclude, this paper has achieved its main objective, which
is to examine the effect of macroeconomic factors toward Malaysian stock market
performance from 1990 to 2014 in annual basis. Results and findings from this study
could provide relevant information and better insights for governments, policymakers,
researchers, academician and investors regarding this topic and area of study. Lastly,
future study can be conducted by referring to limitation and recommendation of this
research for further improvement.
This study is beneficial to our future career as we have gained knowledge about stock
market in Malaysia. Stock market is a fast-paced, high return investment which comes
with high risk. Therefore, stock market players should equip themselves with strong
foundation of relevant knowledge instead of trading blindly following tips. As we have
learnt how stock market is influenced by macroeconomic variables used in this study,
it is important that we keep track of changes in these variables and more importantly,
to process these information correctly for own advantages. Subsequently, we decide

Influence of Macroeconomic Variables on Stock Price Index: Evidence from Malaysia
Undergraduate Research Project Page 66 of 85 Faculty of Business and Finance
whether to buy, hold or sell the existing stock on hand to maximize gain during
favorable times, or to minimize loss during bad times. Lastly, we should bear in mind
relationship proposed by theories may not necessary be consistent with empirical result
all the time.
Influence of Macroeconomic Variables on Stock Price Index: Evidence from Malaysia
Undergraduate Research Project Page 67 of 85 Faculty of Business and Finance
REFERENCES
Addo, A., & Sunzuoye, F. (2013). The impact of treasury bill rate and interest rate on
the stock market returns: Case of Ghana stock exchange. European
Journal of Business and Economics, 8(2), 15-24.
Alexius, A., & Spang, D. (2015). Stock prices and GDP in the long run. Retrieved from
http://www2.ne.su.se/paper/wp15_05.pdf
Ali, G., Anwar M. A., & Ziaei, S. M. (2013). A bivariate causality test between
exchange rates and equity markets in BRIC countries. Middle-East Journal
of Scientific Research, 13(2), 213-219.
Ali, M. (2011). Inflation, output, and stock prices: Evidence from Brazil. Journal of
Applied Business Research, 18(1), 84-92.
Almeida, R. M. (2016). Decision drivers: Stock prices versus GDP. Massachusetts
Financial Services. Retrieved from https://www.mfs.com/content/dam/mfs-
enterprise/pdfs/thought-leadership/us/mfse_gdp_wp.pdf
Aloui, R., & Ben Aïssa, M. S. (2016). Relationship between oil, stock prices and
exchange rates: A vine copula based GARCH method. The North American
Journal of Economics and Finance, 37, 458-471.
Al-Tamimi, H. A. H., Alwan, A. A., & Abdel Rahman, A. A. (2011). Factors
affecting stock prices in the UAE financial markets. Journal of
Transnational Management, 16(1), 1-18.
Al-Zyoud, H. (2015). An empirical test of purchasing power parity theory for
Canadian dollar-US dollar exchange rates. International Journal of
Economics and Finance, 7(3), 233-240.
Amarasinghe, A. (2015). Dynamic relationship between interest rate and stock price:
Empirical evidence from Colombo stock exchange. International Journal of
Business and Social Science, 6(4), 92-97.
Anderson, C. (2010). Presenting and evaluating qualitative research. American
Journal of Pharmaceutical Education, 74(8), 1-7.
Arabi, K. A. M. (2016). Modeling factors influencing stock prices: Empirical
evidence from Khartoum stock market. International Journal of Research in
Economics and Social Sciences, 6(10), 84-99.
Influence of Macroeconomic Variables on Stock Price Index: Evidence from Malaysia
Undergraduate Research Project Page 68 of 85 Faculty of Business and Finance
Aromolaran, A. D., Taiwo, A., Adekoya, A., & Malomo, E. (2016). Index of
industrial production an economic index of significant effect on Nigeria
stock exchange all share index. Journal of Economics and Finance, 7(1), 31-
36.
Assefa, T. A., Esqueda, O. A., & Mollick, A. V. (2017). Stock returns and interest
rates around the world: A panel data approach. Journal of Economics and
Business, 89, 20-35.
Athanasios, V., & Antonios, A. (2012). Stock market development and economic
growth an empirical analysis for Greece. American Journal of Economics and
Business Administration, 4(2), 135-143.
Azevedo, A., Karim, M., Gregoriou, A., & Rhodes, M. (2014). Stock price and
volume effects associated with changes in the composition of the FTSE
Bursa Malaysian KLCI. Journal of International Financial Markets,
Institutions and Money, 28, 20-35.
Bai, Z. (2014). Study on the impact of inflation on the stock market in China.
International Journal of Business and Social Science, 5(7), 261-271.
Bank Negara Malaysia. (n.d.). Exchange rates. Retrieved from
http://www.bnm.gov.my/index.php?ch=statistic&pg=stats_exchangerate
&lang=en&StartMth=1&StartYr=2012&EndMth=12&EndYr=2016&sess
_time=1200&pricetype=Mid&unit=rm
Barakat, M. R., Elgazzar, S. H., & Hanafy, K. M. (2016). Impact of macroeconomic
variables on stock markets: Evidence from emerging markets. International
Journal of Economics and Finance, 8(1), 195-207.
Barna, F., & Mura, P. O. (2010). Capital market development and economic growth:
The case of Romania. Annals of the University of Petrosani, Economics,
10(2), 31-42.
Bekhet, H. A., & Matar, A. (2013). Co-integration and causality analysis between
stock market prices and their determinates in Jordan. Economic Modelling, 35,
508-514.
Bekhet, H. A., & Mugableh, M. I. (2012). Investigating equilibrium relationship
between macroeconomic variables and Malaysian stock market index
through bounds tests approach. International Journal of Economics and
Finance, 4(10), 69-81.
Bello, Z. (2013). The association between exchange rates and stock returns.
Investment Management and Financial Innovations, 10(3), 40-45.
Influence of Macroeconomic Variables on Stock Price Index: Evidence from Malaysia
Undergraduate Research Project Page 69 of 85 Faculty of Business and Finance
Bhargava, A. (2014). Firms’ fundamentals, macroeconomic variables and quarterly
stock prices in the US. Journal of Econometrics, 183(2), 241-250.
Birau, F. R. (2012). The impact of behavioral finance on stock markets. Annals
Economy Series, 3, 45-50.
Boubakari, A., & Jin, D. (2010). The role of stock market development in economic
growth: Evidence from some Euronext countries. International Journal of
Financial Research, 1(1), 14-20.
Bursa Malaysia. (n.d.). Corporate history. Retrieved from
http://www.bursamalaysia.com/corporate/about-us/corporate-history/
Çakmaklı, C., & Van Dijk, D. (2016). Getting the most out of macroeconomic
information for predicting excess stock returns. International Journal of
Forecasting, 32(3), 650-668.
Cancino, E. E. M. (2011). Empirical study of proxies used to measure growth in the
Gordon Model. Unpublished master’s thesis, University of North Carolina,
Wilmington, United States.
Caroline, G., Rosle, M., Vivin, V. C., & Victoria, C. (2011). The relationship between
inflation and stock market: Evidence from Malaysia, United States and China.
International Journal of Economics and Management Sciences, 1(2), 01-16.
Chakravarty, S., & Mitra, A. (2013). Stock prices and inflation: Relationship revisited.
World Journal of Modelling and Simulation, 9(3), 201-215.
Chee, R. J. C., & Shiok, Y. L. (2015). Malaysian stock price and macroeconomic
variables: Autoregressive distributed lag (ARDL) bounds test. Kajian
Malaysia, 33(1), 85-103.
Chirchir, D. (2014). The relationship between share prices and interest rates:
Evidence from Kenya. Journal of Finance and Investment Analysis, 3(2), 91-
98.
Dragos, S. O. (2014). The Fisher effect: Evidence from the Romanian stock market.
International Journal of Academic Research in Business and Social
Sciences, 4(5), 637-644.
Eita, H. J. (2012). Modelling macroeconomic determinants of stock market prices:
Evidence from Namibia. Journal of Applied Business Research, 28(5), 167-
177.
Influence of Macroeconomic Variables on Stock Price Index: Evidence from Malaysia
Undergraduate Research Project Page 70 of 85 Faculty of Business and Finance
Ferrer, R., Bolos, V. J., & Benítez, R. (2016). Interest rate changes and stock returns:
A European multi-country study with wavelets. International Review of
Economics and Finance, 44, 1-12.
Frost, J. (2016, May 18). Understanding Analysis of Variance (ANOVA) and the F-
test. [Blog post]. Retrieved February 10, 2017, from
http://blog.minitab.com/blog/adventures-in-statistics-2/understanding-
analysis-of-variance-anova-and-the-f-test
Gajdka, J., & Pietraszewski, P. (2016). Economic growth and stock prices: Evidence
from central and eastern European countries. Studia Prawno-ekonomiczne, 98,
179-196.
Garza-Garcia, J. G., & Yue, Y. (2010). International determinants of stock market
performance in China: A cointegration approach. Retrieved from
http://www2.uwe.ac.uk/faculties/BBS/BUS/Research/CGF/CGF%20Work
ing%20Paper03%2010.pdf
Geambasu, C., Jianu, I., Herteliu, C., & Geambasu, L. (2014). Macroeconomic
influence on shares’ return study case: Arbitrage Pricing Theory (APT)
applied on Bucharest stock exchange. Economic Computation and Economic
Cybernetics Studies and Research, 48(2), 1-18.
Hisyam, A. (2016, November 9). Bursa tumbles to three-month low following
Trump presidency win. New Straits Times. Retrieved February 17, 2017,
from https://www.nst.com.my/news/2016/11/187237/bursa-tumbles-three-
month-low-following-trump-presidency-win
Ho, L. C., & Huang, C. H. (2015). The nonlinear relationships between stock
indexes and exchange rates. Japan and the World Economy, 33, 20-27.
Hossain, M. E. (2012). Inflation and economic growth in Bangladesh. Journal of Arts,
Science & Commerce, 3(4), 85-92.
Hsing, Y. (2011). Effects of macroeconomic variables on the stock market: The case
of the Czech Republic. Theoretical and Applied Economics, 18(7), 53-64.
Hutcheson, G. D. (2011). Ordinary least squares regression. The SAGE dictionary of
Quantitative Management Research, 224-228.
Irum, M., Fiyaz, N., & Junid, M. (2014). Stock prices and inflation: A case study of
Pakistan. Journal of Asian Business Strategy, 4(12), 217-223.
Investing Answers. (2016). Arbitrage pricing theory (APT). Retrieved from
http://www.investinganswers.com/financial-dictionary/stock-
valuation/arbitrage-pricing-theory-apt-2544
Influence of Macroeconomic Variables on Stock Price Index: Evidence from Malaysia
Undergraduate Research Project Page 71 of 85 Faculty of Business and Finance
Ishioro, B. O. (2013). Stock market development and economic growth: Evidence from
Zimbabwe. Economic Thought and Practice, 22(2), 343-360.
Izgi, B., & Duran, A. (2016). 3D extreme value analysis for stock return, interest rate
and speed of mean reversion. Journal of Computational and Applied
Mathematics, 297, 51-64.
Jamil, M., & Ullah, N. (2013). Impact of foreign exchange rate on stock prices.
Journal of Business and Management, 7(3), 45-51.
Jones, C. M., & Kaul, G. (1996). Oil and the stock markets. The Journal of Finance, 2,
463-491.
Joseph, M. F., & Eric, F. O. (2010). When is inflation harmful? Estimating the
threshold effect for Ghana. American Journal of Economics and Business
Administration, 2(3), 232-239.
Karimo, T. M., & Ogbonna, O. E. (2017). Financial deepening and economic growth
Nexus in Nigeria: Supply-leading or demand-following? Economies, 5(4), 1-18.
Kasidi, F., & Mwakanemela, K. (2013). Impact of inflation on economic growth: A
case study of Tanzania. Asian Journal of Empirical Research, 3(4), 363-380.
Kasman, S., Vardar, G., & Tunc, G. (2011). The impact of interest rate and
exchange rate volatility on banks’ stock returns and volatility: Evidence
from Turkey. Economic Modelling, 28(3), 1328-1334.
Kia, A. (2015). Islamic economics rules and the stock market: Evidence from the
United States. International Journal of Business, 20(3), 181-201.
Kimani, D. K., & Mutuku, C. M. (2013). Inflation dynamics on the overall stock market
performance: The case of Nairobi securities exchange in Kenya. Economics and
Finance Review, 2(11), 1-11.
Kishor, N. K., & Marfatia, H. A. (2013). The time-varying response of foreign stock
markets to U.S. monetary policy surprises: Evidence from the federal funds
futures market. Journal of International Financial Markets, Institutions and
Money, 24, 1-24.
Knoema. (2016). Global financial development. Retrieved from
https://knoema.com/WBGFD2015Nov/global-financial-
development?tsId=1006230
Korkeamäki, T. (2011). Interest rate sensitivity of the European stock markets
before and after the euro introduction. Journal of International Financial
Markets, Institutions and Money, 21(5), 811-831.
Influence of Macroeconomic Variables on Stock Price Index: Evidence from Malaysia
Undergraduate Research Project Page 72 of 85 Faculty of Business and Finance
Kuwornu, J. K. M. (2012). Effect of macroeconomic variables on the Ghanaian
stock market returns: A co-integration analysis. Agris on-line Papers in
Economics and Informatics, 4(2), 15-26.
Kyophilavong, P., Uddin, G. S., & Shahbaz, M. (2014). The nexus between financial
development and economic growth in Laos. Retrieved from
http://www.ipag.fr/fr/accueil/la-recherche/publications-WP.html
Limpanithiwat, K., & Rungsombudpornkul, L. (2010). Relationship between inflation
and stock prices in Thailand. Unpublished master’s thesis, University of Umeå,
Umeå, Sweden.
Madrigal, D., & McClain, B. (2012). Strengths and weaknesses of quantitative and
qualitative research. Retrieved from
http://www.uxmatters.com/mt/archives/2012/09/strengths-and-
weaknesses-of-quantitative-and-qualitative-research.php
Maghanga, M., & Quisenberry, W. (2015). The role of Uganda securities exchange
in the economic growth of Uganda: An econometric analysis. International
Journal of Econometrics and Financial Management, 3(3), 131-141.
Maku, O. E., & Atanda, A. A. (2010). Determinants of stock market performance in
Nigeria: Long-run analysis. Journal of Management and Organizational
Behaviour, 1(3), 1-16.
Manzur, M., & Chan, F. (2010). Exchange rate volatility and purchasing power
parity: Does euro make any difference? International Journal of Banking and
Finance, 7(1), 99-118.
MATRADE. (2017). Top 10 major export products, 2017. Retrieved from
http://www.matrade.gov.my/en/28-malaysian-exporters/trade-
statistics/3789-top-10- major-export-products-2017
Moldovan, S. (2010). Investor psychology and the herd effect on the financial
markets. Young Economists Journal, 8, 21-26.
Moya-Martínez, P., Ferrer-Lapena, R., & Escribano-Sotos, F. (2015). Interest rate
changes and stock returns in Spain: A wavelet analysis. BRQ Business
Research Quarterly, 18(2), 95-110.
Mugambi, M., & Okech, T. C. (2016). Effect of macroeconomic variables on stock
returns of listed commercial banks in Kenya. International Journal of
Economics, Commerce and Management United Kingdom, 4(6), 390-418.
Influence of Macroeconomic Variables on Stock Price Index: Evidence from Malaysia
Undergraduate Research Project Page 73 of 85 Faculty of Business and Finance
Muktadir-Al-Mukit, D. (2013). The effects of interest rates volatility on stock
returns: Evidence from Bangladesh. International Journal of Management and
Business Research, 3(3), 269-279.
Naik, P. K., & Padhi, P. (2012). The impact of macroeconomic fundamentals on
stock prices revisited: Evidence from Indian data. Eurasian Journal of
Business and Economics, 2012(510), 25-44.
Najaf, R., & Najaf, K. (2016). A study of exchange rates movement and stock
market volatility. International Journal of Research – Granthaalayah, 4(1),
70-79.
Najafzadeh, B., Monjazed, M., & Mamipour, S. (2016). The analysis of real
exchange rate volatility and stock exchange return with PANEL-GARCH
Approach (Case study: D8 countries). Iranian Economic Review, 20(4),
525-550.
Nambiar, S. (2017, January 20). Malaysia’s economy that was. East Asia Forum.
Retrieved March 2, 2017, from
http://www.eastasiaforum.org/2017/01/20/malaysias-economy-
that%20was/
Nangka, M. I. F., Pangemanan, S. S., & Pandowo, M. (2013). Comparative analysis
of stock exchange performance with macroeconomic indicators between
Indonesia and Malaysia. Jurnal Riset Ekonomi, Manajemen, Bisnis Dan
Akuntansi, 1(4), 2325-2334.
Nkechukwu, G., Onyeagba, J., & Okoh, J. (2015). Macroeconomic variables and
stock market prices in Nigeria: A cointegration and vector error correction
model tests. International Journal of Science and Research, 4(6), 717-724.
Ocal, O. (2013). Purchasing power parity in the case of Romania: Evidence from
structural breaks. International Journal of Economics and Financial Issues,
3(4), 973-976.
Olufeagba, O. (2016). Essays on the currency effect on stock market relationships and
stock return forecast. Helsinki, Finland: Hanken School of Economics.
Olusegun, O., Oluwatoyin, M., & Fagbeminiyi, F. (2011). Nigerian stock exchange
and economic development. Manager, (14), 14-38.
Onasanya, Olanrewaju, K., & Femi, J. A. (2012). Does macroeconomic variables
have effect on stock market movement in Nigeria? Journal of Economics and
Sustainable Development, 3(10), 192-202.
Influence of Macroeconomic Variables on Stock Price Index: Evidence from Malaysia
Undergraduate Research Project Page 74 of 85 Faculty of Business and Finance
Ooi, P. C., Arsad, Z., & Tan, B. H. (2014). Dynamics relationship between
stock prices and economic variables in Malaysia. AIP Conference
Proceedings, 1605(1), 822-827.
Oskooe, S. A. P. (2010). Emerging stock market performance and economic growth.
American Journal of Applied Sciences, 7(2), 265-269.
Pallegedara, A. (2012). Dynamic relationships between stock market performance and
short term interest rate - empirical evidence from Sri Lanka. Retrieved
from http://dx.doi.org/10.2139/ssrn.2156150
Paret, M. (2012, May 24). Guinness, t-tests & proving a pint really does taste better
in Ireland. [Blog post]. Retrieved February 10, 2017, from
http://blog.minitab.com/blog/michelle-paret/guinness-t-tests-and-proving-a-
pint-really-does-taste-better-in-ireland
Patel, C. B. (2011). Equity prices and macroeconomic fundamentals: International
evidence. CFA Institute. Retrieved from
http://www.cfapubs.org/doi/full/10.2469/dig.v41.n3.5
Peiró, A. (2016). Stock prices and macroeconomic factors: Some European
evidence. International Review of Economics & Finance, 41, 287-294.
Pirovano, M. (2012). Monetary policy and stock prices in small open economies:
Empirical evidence for the new EU member states. Economic Systems, 36(3),
372-390.
Rahman, M. M., & Salahuddin, M. (2010). The determinants of economic growth in
Pakistan: Does stock market development play a major role? Economic Issues,
15(2), 69-86.
Reddy, K. & Fu, M. (2014). Does Shariah compliant stocks perform better than the
conventional stocks? A comparative study of stocks listed on the Australian
Stock Exchange. Asian Journal of Finance & Accounting, 6(2), 155-170.
Sabau-Popa, D. C., Bolos, M. I., Scarlat, E., Delca, C., & Bradea, I.-A. (2014).
Effects of the macroeconomic variables on stock prices of the Bucharest
Stock Exchange (BSE). Economic Computation & Economic Cybernetics
Studies & Research, 48(4), 98-108.
Sathyanarayana, S., & Gargesha, S. (2016). Impact of Brexit referendum on Indian
stock market. International Journal of Management & Social Sciences, 5(1),
104-121.
Schmidheiny, K. (2016). The multiple linear regression model. Retrieved from
http://kurt.schmidheiny.name/teaching/ols2up.pdf
Influence of Macroeconomic Variables on Stock Price Index: Evidence from Malaysia
Undergraduate Research Project Page 75 of 85 Faculty of Business and Finance
Senturk, M., Ozkan, G. S., & Akbas, Y. E. (2014). The relationship between
economic growth and stock returns: An example from Turkey. Dogus
University Journal, 15(2), 155-164.
Shaji, P. N. (2012). Arbitrage Pricing theory and return generating process: A
macroeconomic approach to Indian stock market. Unpublished doctoral
dissertation, Cochin University of Science and Technology, Kerala, India.
Sharma, G. D., & Mahendru, M. (2011). Impact of macro-economic variables on
stock prices in India. Global Journal of Management and Business Research,
10(7), 1-18.
Shawtari, F. A., Salem, M. A., Hussain, H. I., Hawariyuni, W., & Thabet Omer, A.
(2016). Long run relationship between macroeconomic indicators and stock
price: The case of South Africa. The Journal of Internet Banking and
Commerce, 21(2), 1-16.
Singh, D. (2010). Causal relationship between macro-economic variables and stock
market: A case study for India. Pakistan Journal of Social Sciences, 30(2),
263-274.
Surendra, E. (2016, November 10). How a Trump presidency will affect Malaysia.
iMoney.my Learning Centre. Retrieved from February 17, 2017,
https://www.imoney.my/articles/donald-trump-us-president-malaysia
Tang, C. F. (2013). The linkage between stock price and economic growth in Australia:
A chicken-and-egg paradox? Ekonomska Istraživanja – Economic Research,
26(2), 99-116.
Tangjitprom, N. (2012). Macroeconomic factors of emerging stock market: The
evidence from Thailand. International Journal of Financial Research, 3(2),
105-114.
Taofik, M. I., & Omosola, M. A. (2013). The relationship between stock return and
inflation in Nigeria. European Scientific Journal, 9(4), 146-157.
Tarver, E. (2015). What are the advantages and disadvantages of the Gordon
Growth Model? Investopedia. Retrieved 7 March 2017, from
http://www.investopedia.com/ask/answers/032415/what-are-advantages-
and-disadvantages-gordon-growth-model.asp
Tian, G. G., & Ma, S. (2010). The relationship between stock returns and the foreign
exchange rate: The ARDL approach. Journal of the Asia Pacific Economy,
15(4), 490-508.
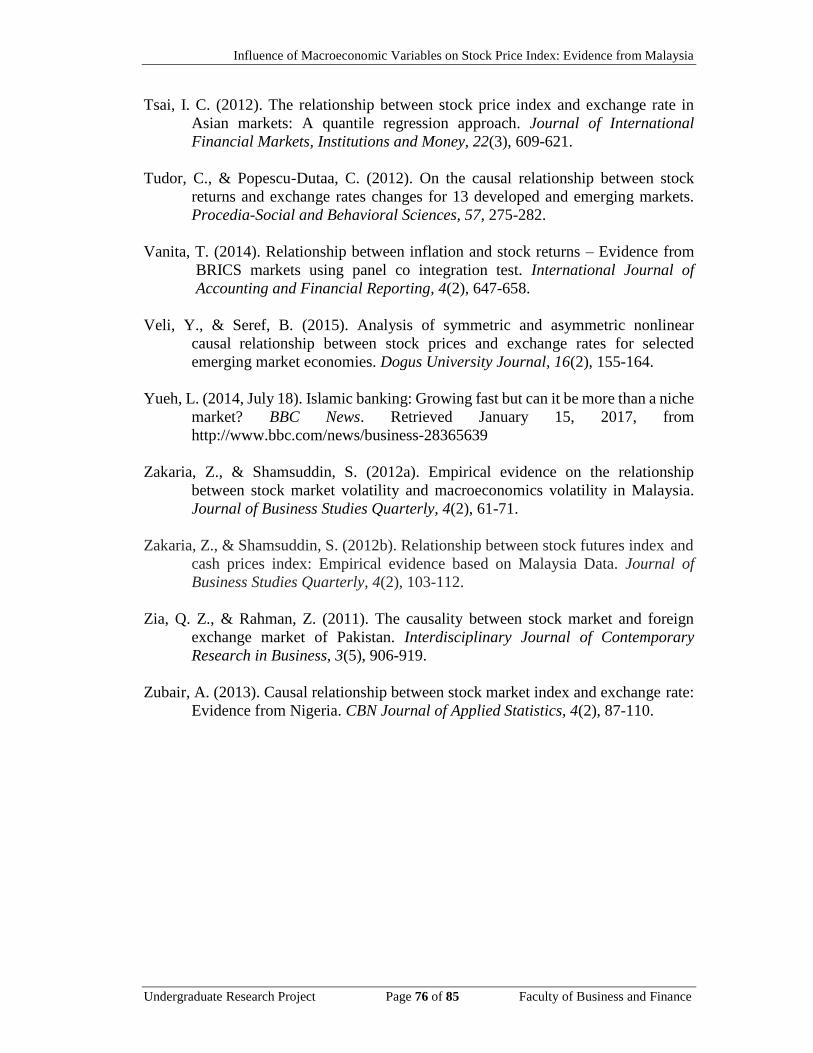
Influence of Macroeconomic Variables on Stock Price Index: Evidence from Malaysia
Undergraduate Research Project Page 76 of 85 Faculty of Business and Finance
Tsai, I. C. (2012). The relationship between stock price index and exchange rate in
Asian markets: A quantile regression approach. Journal of International
Financial Markets, Institutions and Money, 22(3), 609-621.
Tudor, C., & Popescu-Dutaa, C. (2012). On the causal relationship between stock
returns and exchange rates changes for 13 developed and emerging markets.
Procedia-Social and Behavioral Sciences, 57, 275-282.
Vanita, T. (2014). Relationship between inflation and stock returns – Evidence from
BRICS markets using panel co integration test. International Journal of
Accounting and Financial Reporting, 4(2), 647-658.
Veli, Y., & Seref, B. (2015). Analysis of symmetric and asymmetric nonlinear
causal relationship between stock prices and exchange rates for selected
emerging market economies. Dogus University Journal, 16(2), 155-164.
Yueh, L. (2014, July 18). Islamic banking: Growing fast but can it be more than a niche
market? BBC News. Retrieved January 15, 2017, from
http://www.bbc.com/news/business-28365639
Zakaria, Z., & Shamsuddin, S. (2012a). Empirical evidence on the relationship
between stock market volatility and macroeconomics volatility in Malaysia.
Journal of Business Studies Quarterly, 4(2), 61-71.
Zakaria, Z., & Shamsuddin, S. (2012b). Relationship between stock futures index and
cash prices index: Empirical evidence based on Malaysia Data. Journal of
Business Studies Quarterly, 4(2), 103-112.
Zia, Q. Z., & Rahman, Z. (2011). The causality between stock market and foreign
exchange market of Pakistan. Interdisciplinary Journal of Contemporary
Research in Business, 3(5), 906-919.
Zubair, A. (2013). Causal relationship between stock market index and exchange rate:
Evidence from Nigeria. CBN Journal of Applied Statistics, 4(2), 87-110.
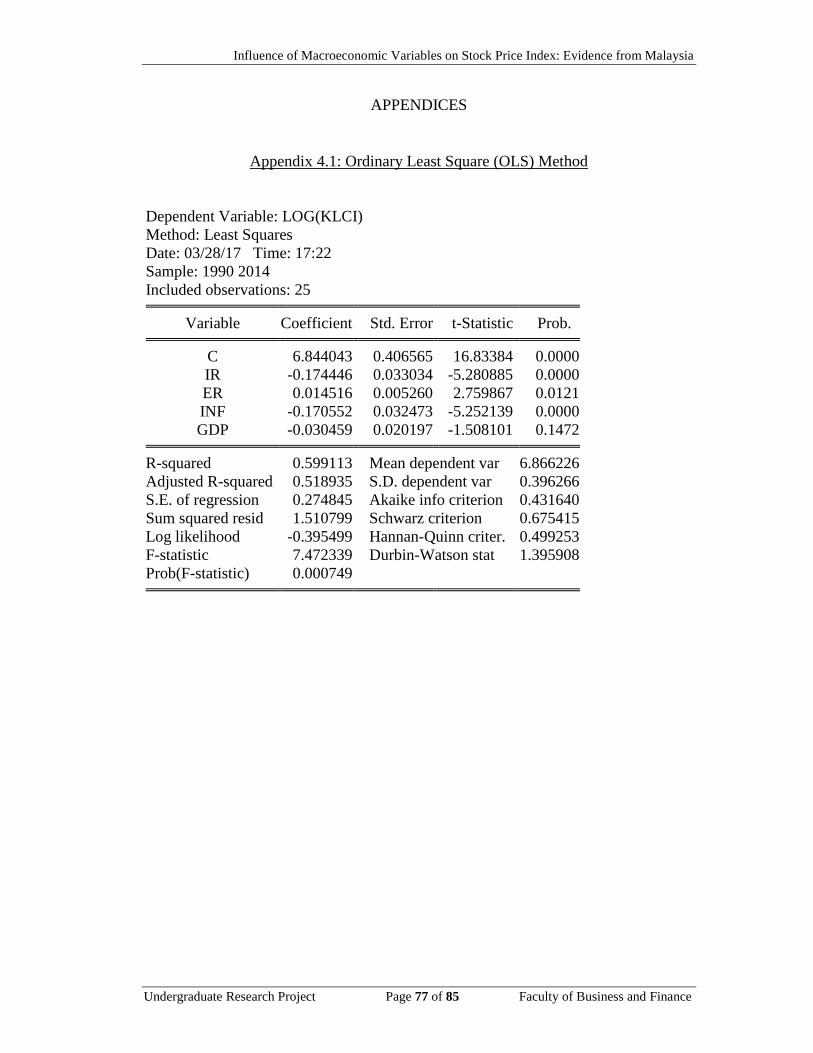
Influence of Macroeconomic Variables on Stock Price Index: Evidence from Malaysia
Undergraduate Research Project Page 77 of 85 Faculty of Business and Finance
APPENDICES
Appendix 4.1: Ordinary Least Square (OLS) Method
Dependent Variable: LOG(KLCI)
Method: Least Squares
Date: 03/28/17 Time: 17:22
Sample: 1990 2014
Included observations: 25
Variable Coefficient Std. Error t-Statistic Prob.
C 6.844043 0.406565 16.83384 0.0000
IR -0.174446 0.033034 -5.280885 0.0000
ER 0.014516 0.005260 2.759867 0.0121
INF -0.170552 0.032473 -5.252139 0.0000
GDP -0.030459 0.020197 -1.508101 0.1472
R-squared 0.599113 Mean dependent var 6.866226
Adjusted R-squared 0.518935 S.D. dependent var 0.396266
S.E. of regression 0.274845 Akaike info criterion 0.431640
Sum squared resid 1.510799 Schwarz criterion 0.675415
Log likelihood -0.395499 Hannan-Quinn criter. 0.499253
F-statistic 7.472339 Durbin-Watson stat 1.395908
Prob(F-statistic) 0.000749
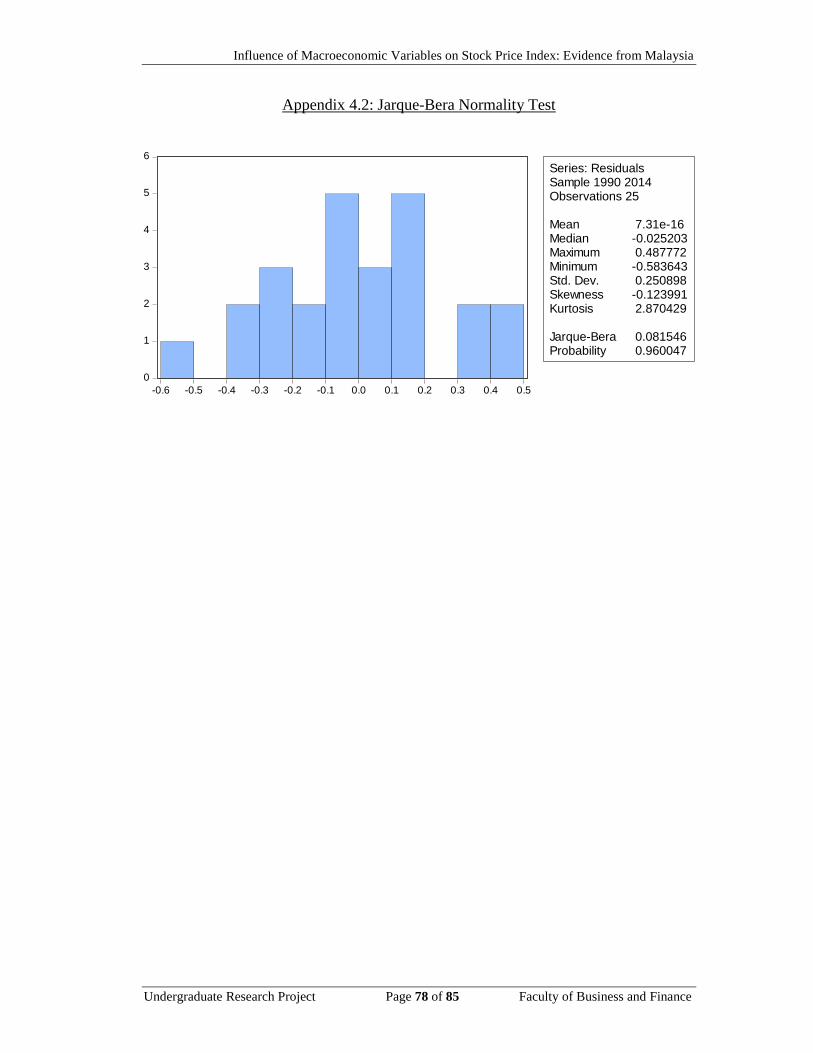
Influence of Macroeconomic Variables on Stock Price Index: Evidence from Malaysia
Undergraduate Research Project Page 78 of 85 Faculty of Business and Finance
Appendix 4.2: Jarque-Bera Normality Test
0
1
2
3
4
5
6
-0.6 -0.5 -0.4 -0.3 -0.2 -0.1 0.0 0.1 0.2 0.3 0.4 0.5
Series: ResidualsSample 1990 2014Observations 25
Mean 7.31e-16Median -0.025203Maximum 0.487772Minimum -0.583643Std. Dev. 0.250898Skewness -0.123991Kurtosis 2.870429
Jarque-Bera 0.081546Probability 0.960047

Influence of Macroeconomic Variables on Stock Price Index: Evidence from Malaysia
Undergraduate Research Project Page 79 of 85 Faculty of Business and Finance
Appendix 4.3: Multicollinearity Test – Auxiliary Model 1
Dependent Variable: IR
Method: Least Squares
Date: 03/28/17 Time: 17:25
Sample: 1990 2014
Included observations: 25
Variable Coefficient Std. Error t-Statistic Prob.
C -0.691677 2.681503 -0.257944 0.7990
ER 0.086869 0.029118 2.983376 0.0071
INF -0.848138 0.108454 -7.820260 0.0000
GDP -0.224911 0.124063 -1.812884 0.0842
R-squared 0.804137 Mean dependent var 3.553470
Adjusted R-squared 0.776156 S.D. dependent var 3.837529
S.E. of regression 1.815616 Akaike info criterion 4.176374
Sum squared resid 69.22571 Schwarz criterion 4.371394
Log likelihood -48.20467 Hannan-Quinn criter. 4.230464
F-statistic 28.73922 Durbin-Watson stat 0.227360
Prob(F-statistic) 0.000000
Influence of Macroeconomic Variables on Stock Price Index: Evidence from Malaysia
Undergraduate Research Project Page 80 of 85 Faculty of Business and Finance
Appendix 4.4: Multicollinearity Test – Auxiliary Model 2
Dependent Variable: ER
Method: Least Squares
Date: 03/28/17 Time: 17:25
Sample: 1990 2014
Included observations: 25
Variable Coefficient Std. Error t-Statistic Prob.
C 64.52286 9.289058 6.946114 0.0000
IR 3.426656 1.148583 2.983376 0.0071
INF 2.321183 1.248440 1.859267 0.0771
GDP 2.675759 0.601015 4.452071 0.0002
R-squared 0.585088 Mean dependent var 101.5144
Adjusted R-squared 0.525815 S.D. dependent var 16.55969
S.E. of regression 11.40318 Akaike info criterion 7.851308
Sum squared resid 2730.683 Schwarz criterion 8.046328
Log likelihood -94.14135 Hannan-Quinn criter. 7.905399
F-statistic 9.871056 Durbin-Watson stat 0.670918
Prob(F-statistic) 0.000290

Influence of Macroeconomic Variables on Stock Price Index: Evidence from Malaysia
Undergraduate Research Project Page 81 of 85 Faculty of Business and Finance
Appendix 4.5: Multicollinearity Test – Auxiliary Model 3
Dependent Variable: INF
Method: Least Squares
Date: 03/28/17 Time: 17:26
Sample: 1990 2014
Included observations: 25
Variable Coefficient Std. Error t-Statistic Prob.
C 1.477845 2.713016 0.544724 0.5917
IR -0.877676 0.112231 -7.820260 0.0000
ER 0.060894 0.032752 1.859267 0.0771
GDP -0.122532 0.133062 -0.920867 0.3676
R-squared 0.762729 Mean dependent var 3.809183
Adjusted R-squared 0.728834 S.D. dependent var 3.546827
S.E. of regression 1.846962 Akaike info criterion 4.210608
Sum squared resid 71.63664 Schwarz criterion 4.405628
Log likelihood -48.63260 Hannan-Quinn criter. 4.264698
F-statistic 22.50218 Durbin-Watson stat 0.518299
Prob(F-statistic) 0.000001

Influence of Macroeconomic Variables on Stock Price Index: Evidence from Malaysia
Undergraduate Research Project Page 82 of 85 Faculty of Business and Finance
Appendix 4.6: Multicollinearity Test – Auxiliary Model 4
Dependent Variable: GDP
Method: Least Squares
Date: 03/28/17 Time: 17:26
Sample: 1990 2014
Included observations: 25
Variable Coefficient Std. Error t-Statistic Prob.
C -9.107124 3.917540 -2.324705 0.0302
IR -0.601676 0.331889 -1.812884 0.0842
ER 0.181466 0.040760 4.452071 0.0002
INF -0.316762 0.343982 -0.920867 0.3676
R-squared 0.497532 Mean dependent var 5.969600
Adjusted R-squared 0.425750 S.D. dependent var 3.918765
S.E. of regression 2.969611 Akaike info criterion 5.160386
Sum squared resid 185.1904 Schwarz criterion 5.355406
Log likelihood -60.50482 Hannan-Quinn criter. 5.214476
F-statistic 6.931226 Durbin-Watson stat 1.901410
Prob(F-statistic) 0.002024
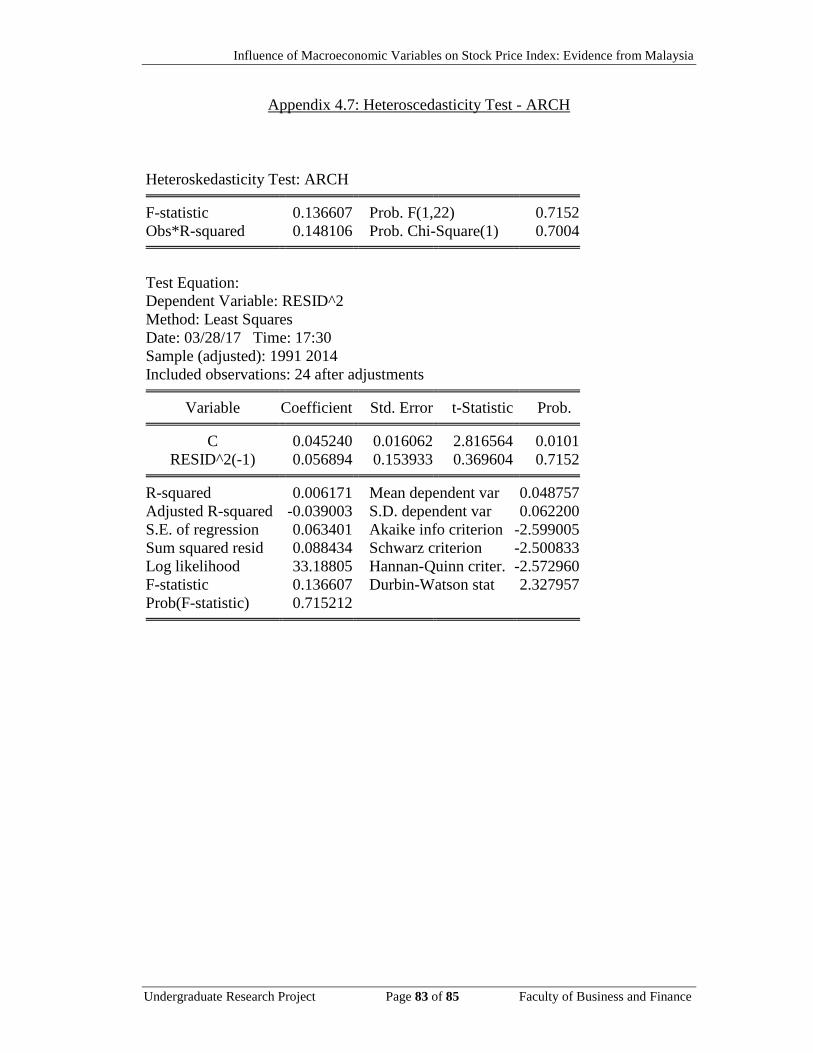
Influence of Macroeconomic Variables on Stock Price Index: Evidence from Malaysia
Undergraduate Research Project Page 83 of 85 Faculty of Business and Finance
Appendix 4.7: Heteroscedasticity Test - ARCH
Heteroskedasticity Test: ARCH
F-statistic 0.136607 Prob. F(1,22) 0.7152
Obs*R-squared 0.148106 Prob. Chi-Square(1) 0.7004
Test Equation:
Dependent Variable: RESID^2
Method: Least Squares
Date: 03/28/17 Time: 17:30
Sample (adjusted): 1991 2014
Included observations: 24 after adjustments
Variable Coefficient Std. Error t-Statistic Prob.
C 0.045240 0.016062 2.816564 0.0101
RESID^2(-1) 0.056894 0.153933 0.369604 0.7152
R-squared 0.006171 Mean dependent var 0.048757
Adjusted R-squared -0.039003 S.D. dependent var 0.062200
S.E. of regression 0.063401 Akaike info criterion -2.599005
Sum squared resid 0.088434 Schwarz criterion -2.500833
Log likelihood 33.18805 Hannan-Quinn criter. -2.572960
F-statistic 0.136607 Durbin-Watson stat 2.327957
Prob(F-statistic) 0.715212
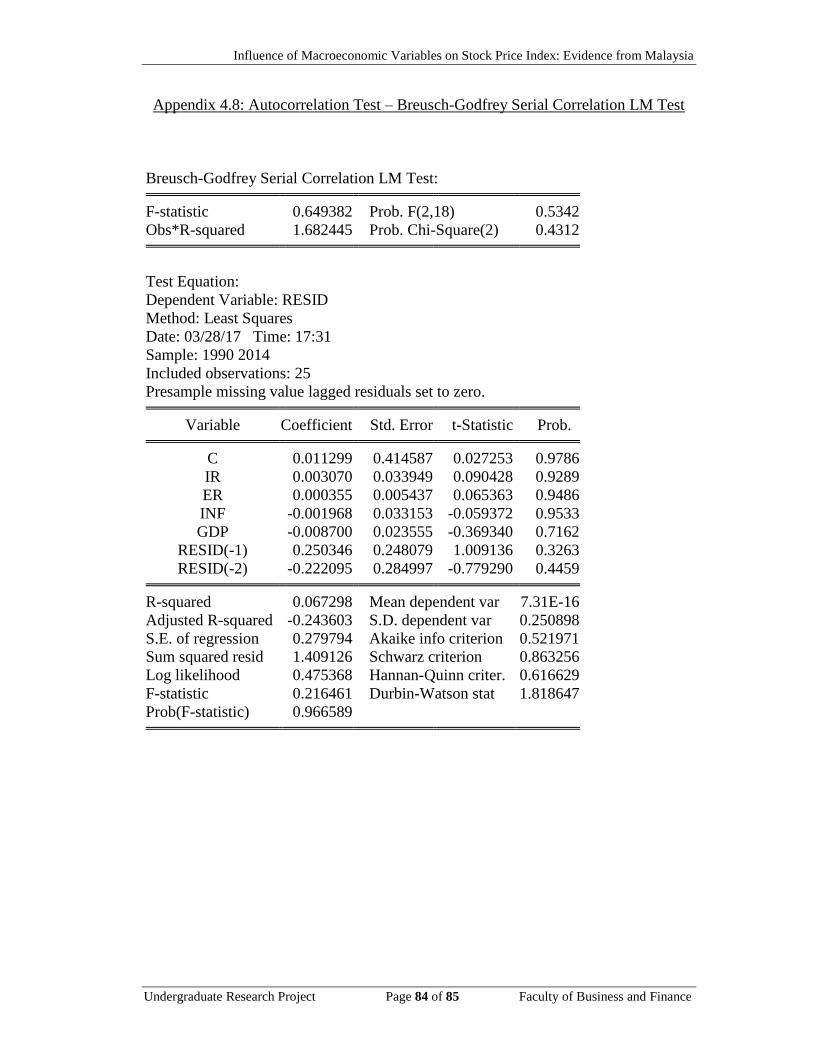
Influence of Macroeconomic Variables on Stock Price Index: Evidence from Malaysia
Undergraduate Research Project Page 84 of 85 Faculty of Business and Finance
Appendix 4.8: Autocorrelation Test – Breusch-Godfrey Serial Correlation LM Test
Breusch-Godfrey Serial Correlation LM Test:
F-statistic 0.649382 Prob. F(2,18) 0.5342
Obs*R-squared 1.682445 Prob. Chi-Square(2) 0.4312
Test Equation:
Dependent Variable: RESID
Method: Least Squares
Date: 03/28/17 Time: 17:31
Sample: 1990 2014
Included observations: 25
Presample missing value lagged residuals set to zero.
Variable Coefficient Std. Error t-Statistic Prob.
C 0.011299 0.414587 0.027253 0.9786
IR 0.003070 0.033949 0.090428 0.9289
ER 0.000355 0.005437 0.065363 0.9486
INF -0.001968 0.033153 -0.059372 0.9533
GDP -0.008700 0.023555 -0.369340 0.7162
RESID(-1) 0.250346 0.248079 1.009136 0.3263
RESID(-2) -0.222095 0.284997 -0.779290 0.4459
R-squared 0.067298 Mean dependent var 7.31E-16
Adjusted R-squared -0.243603 S.D. dependent var 0.250898
S.E. of regression 0.279794 Akaike info criterion 0.521971
Sum squared resid 1.409126 Schwarz criterion 0.863256
Log likelihood 0.475368 Hannan-Quinn criter. 0.616629
F-statistic 0.216461 Durbin-Watson stat 1.818647
Prob(F-statistic) 0.966589
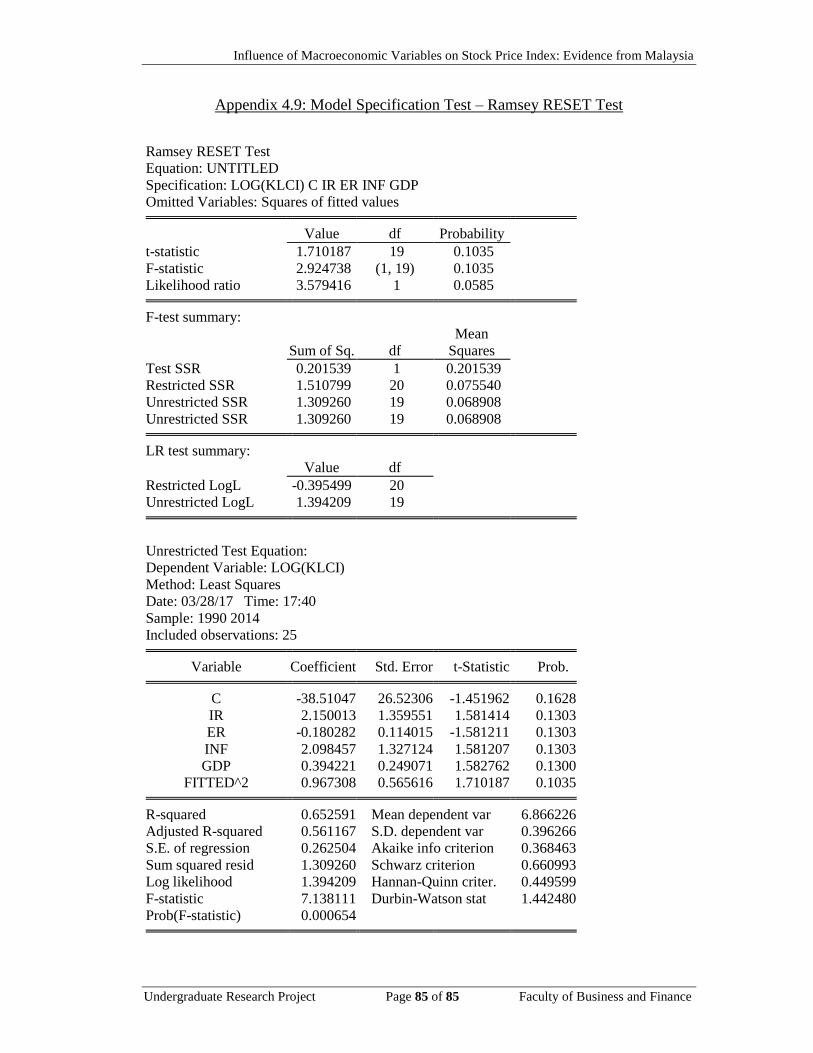
Influence of Macroeconomic Variables on Stock Price Index: Evidence from Malaysia
Undergraduate Research Project Page 85 of 85 Faculty of Business and Finance
Appendix 4.9: Model Specification Test – Ramsey RESET Test
Ramsey RESET Test
Equation: UNTITLED
Specification: LOG(KLCI) C IR ER INF GDP
Omitted Variables: Squares of fitted values
Value df Probability
t-statistic 1.710187 19 0.1035
F-statistic 2.924738 (1, 19) 0.1035
Likelihood ratio 3.579416 1 0.0585
F-test summary:
Sum of Sq. df
Mean
Squares
Test SSR 0.201539 1 0.201539
Restricted SSR 1.510799 20 0.075540
Unrestricted SSR 1.309260 19 0.068908
Unrestricted SSR 1.309260 19 0.068908
LR test summary:
Value df
Restricted LogL -0.395499 20
Unrestricted LogL 1.394209 19
Unrestricted Test Equation:
Dependent Variable: LOG(KLCI)
Method: Least Squares
Date: 03/28/17 Time: 17:40
Sample: 1990 2014
Included observations: 25
Variable Coefficient Std. Error t-Statistic Prob.
C -38.51047 26.52306 -1.451962 0.1628
IR 2.150013 1.359551 1.581414 0.1303
ER -0.180282 0.114015 -1.581211 0.1303
INF 2.098457 1.327124 1.581207 0.1303
GDP 0.394221 0.249071 1.582762 0.1300
FITTED^2 0.967308 0.565616 1.710187 0.1035
R-squared 0.652591 Mean dependent var 6.866226
Adjusted R-squared 0.561167 S.D. dependent var 0.396266
S.E. of regression 0.262504 Akaike info criterion 0.368463
Sum squared resid 1.309260 Schwarz criterion 0.660993
Log likelihood 1.394209 Hannan-Quinn criter. 0.449599
F-statistic 7.138111 Durbin-Watson stat 1.442480
Prob(F-statistic) 0.000654