Embed Size (px)
Citation preview
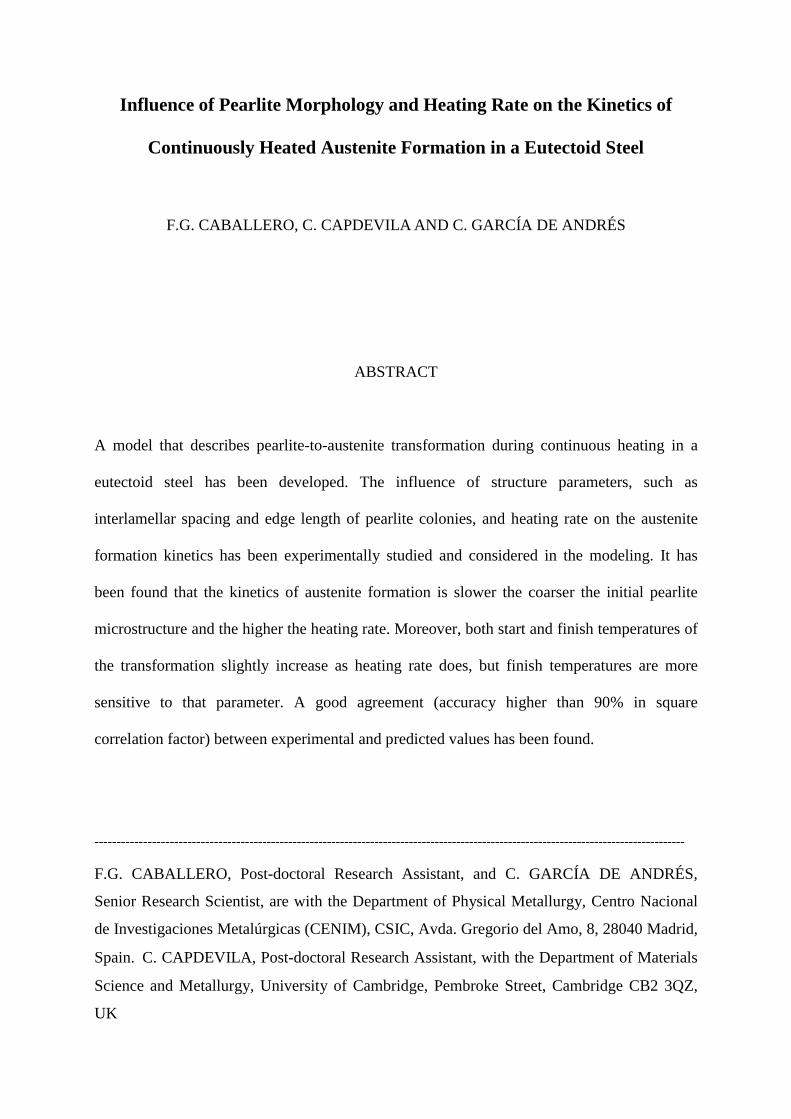
Influence of Pearlite Morphology and Heating Rate on the Kinetics of
Continuously Heated Austenite Formation in a Eutectoid Steel
F.G. CABALLERO, C. CAPDEVILA AND C. GARCÍA DE ANDRÉS
ABSTRACT
A model that describes pearlite-to-austenite transformation during continuous heating in a
eutectoid steel has been developed. The influence of structure parameters, such as
interlamellar spacing and edge length of pearlite colonies, and heating rate on the austenite
formation kinetics has been experimentally studied and considered in the modeling. It has
been found that the kinetics of austenite formation is slower the coarser the initial pearlite
microstructure and the higher the heating rate. Moreover, both start and finish temperatures of
the transformation slightly increase as heating rate does, but finish temperatures are more
sensitive to that parameter. A good agreement (accuracy higher than 90% in square
correlation factor) between experimental and predicted values has been found.
----------------------------------------------------------------------------------------------------------------------------------------
F.G. CABALLERO, Post-doctoral Research Assistant, and C. GARCÍA DE ANDRÉS,
Senior Research Scientist, are with the Department of Physical Metallurgy, Centro Nacional
de Investigaciones Metalúrgicas (CENIM), CSIC, Avda. Gregorio del Amo, 8, 28040 Madrid,
Spain. C. CAPDEVILA, Post-doctoral Research Assistant, with the Department of Materials
Science and Metallurgy, University of Cambridge, Pembroke Street, Cambridge CB2 3QZ,
UK
I. INTRODUCTION
MOST commercial processes rely to some extent on heat treatments, which cause the steel to
revert to the austenitic condition. This includes the processes involved in the manufacture of
wrought steels and in the fabrication of steel components by welding. It is useful, therefore, to
be able to model quantitatively the transformation of an ambient temperature steel
microstructure into austenite[1].
The microstructure from which austenite may form can be infinitely varied (ferrite,
martensite, carbide and various morphologies and aggregates of each, e.g. pearlite, bainite).
Many variables are therefore needed to describe the kinetics of austenite formation. Factors
such as particle size, the distribution and chemistry of individual phases, homogeneity, the
presence of non-metallic inclusions, should all be important.[2-5] Thus, in the case of formation
of austenite from pearlite one of the most relevant structural factor to be considered is the
interlamellar spacing of pearlite.[6]
In fully pearlitic steel, austenite nucleates heterogeneously at the junctions between
pearlite colonies. This is in spite of the relatively large amount of interlamellar surfaces
available within the pearlite colonies, which seem to be much less effective as sites for the
nucleation of austenite.[7] The rate of growth of the austenite is controlled primarily by the
rate of carbon diffusion in the austenite between adjacent pearlitic cementite lamellae, but
may also be influenced by boundary diffusion of substitutional alloying elements at low
temperature.[3]
Models of specific metallurgical approaches exist for isothermal austenite formation
from different initial microstructures.[3,7-13] However, none of these is likely to be of general
applicability, except perhaps at slow heating rates consistent with the achievement of
equilibrium. In this work a model is presented for the austenite formation during continuous
heating in a eutectoid steel with a fully pearlitic initial microstructure. The influence of the
parameters such as interlamellar spacing of pearlite, edge length of pearlite colonies and
heating rate on transformation kinetics has been considered in the model. Results of modeling
have been experimentally validated at three different heating rates and for three different
morphologies of pearlite.
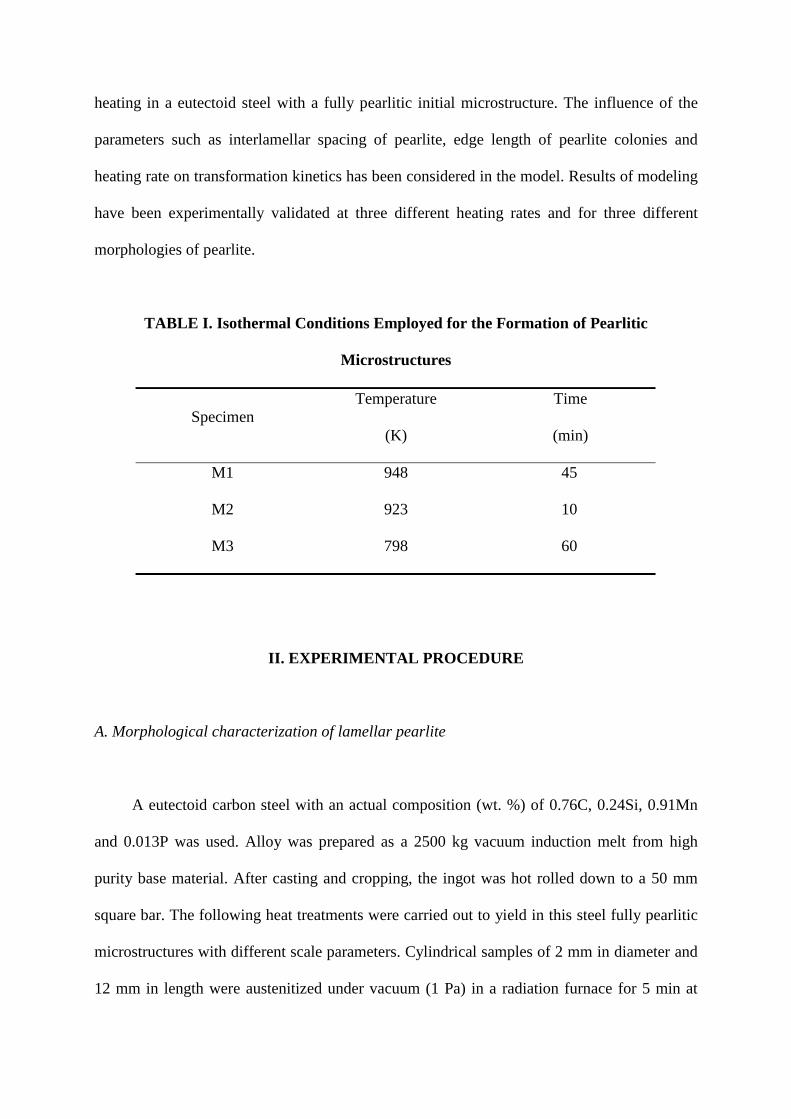
TABLE I. Isothermal Conditions Employed for the Formation of Pearlitic
Microstructures
SpecimenTemperature
(K)
Time
(min)
M1 948 45
M2 923 10
M3 798 60
II. EXPERIMENTAL PROCEDURE
A. Morphological characterization of lamellar pearlite
A eutectoid carbon steel with an actual composition (wt. %) of 0.76C, 0.24Si, 0.91Mn
and 0.013P was used. Alloy was prepared as a 2500 kg vacuum induction melt from high
purity base material. After casting and cropping, the ingot was hot rolled down to a 50 mm
square bar. The following heat treatments were carried out to yield in this steel fully pearlitic
microstructures with different scale parameters. Cylindrical samples of 2 mm in diameter and
12 mm in length were austenitized under vacuum (1 Pa) in a radiation furnace for 5 min at
1273 K, isothermally transformed at one of three different temperatures and subsequently
cooled rapidly to room temperature. Table I lists all the temperatures and holding times used
for the isothermal formation of pearlite with different morphological parameters in this steel.
Specimens were ground and polished using standardized techniques and finished on
0.25 µm diamond paste for metallographic examination. 2pct-Nital etching solution was used
to reveal the microstructure by optical microscopy. Micrographs in Figure 1 confirm that 100
% transformation to pearlite occurs at all the heat treatments performed. An etching solution
of picric acid in isopropyl alcohol with several drops of Vilella’s reagent was also used to
reveal pearlite in specimens M1 and M2 on a JEOL JXA-820 scanning electron microscope
(SEM) (Figures 2.a and b). Pearlite in specimen M3 was characterized by transmission
electron microscopy (TEM). For this, 3 mm diameter cylindrical samples were sliced into 100
µm thick discs and subsequently ground down to foils of 50 µm thickness on wet 800 grit
silicon carbide paper. These foils were finally electropolished at room temperature until
perforation occurred, using a twin-jet electropolisher set (E. A. Fischione Inst. Mfg – Model
110) at a voltage of 100 V. The electrolyte consisted of 5 % perchloric acid, 15 % glycerol
and 80 % methanol. The foils were examined in a JEOL JEM-200 CX transmission electron
microscope at an operating voltage of 200 kV. (Figure 2.c).
Two parameters, the mean true interlamellar spacing (σo) and the area per unit volume
of the pearlite colonies interface (PPvS ), are used to fully characterize the obtained lamellar
microstructures.[8] The values of σo were derived from electron micrographs according to
Underwood’s intersection procedure. Underwood[14] recommends determining the mean
random spacing σr first to estimate the mean true spacing σo. For this purpose, a circular test
grid of diameter dc is superimposed on an electron micrograph. The number n of intersections
of lamellae of carbide with the test grid is counted. This procedure is repeated on at least fifty
fields chosen randomly. Then, the mean random spacing σr is calculated from:
nMd c
rπ
σ = [1]
where M is the magnification of the micrograph.
Saltykov[15] has shown that, for pearlite with a constant spacing within each colony, the
mean true spacing σo is related to the mean random spacing σr by:
2r
oσσ = [2]
A pearlite nodule is composed of multiple colonies; each colony has parallel lamellae,
which are orientated differently with respect to lamellae in adjacent colonies as Figure 3.a
illustrates. The values of PPvS were derived from scanning electron micrographs at low
magnification (Figure 3.b) by counting the number of intersections (n') of the pearlite colony
boundaries with a circular test grid of diameter d'c as reported by Roosz et al.[8] This
procedure is repeated on at least fifty fields chosen randomly. Then, the area per unit volume
of the pearlite colonies interface is:
c
PPv d
MnS'
'2π
= [3]
where M is the magnification of the micrograph.
Approximating the pearlite colony by a truncated octahedron (Figure 4) the edge length
of the pearlite colonies ( Pa ) is calculated from the area per unit volume PPvS with the
following expression[16]:
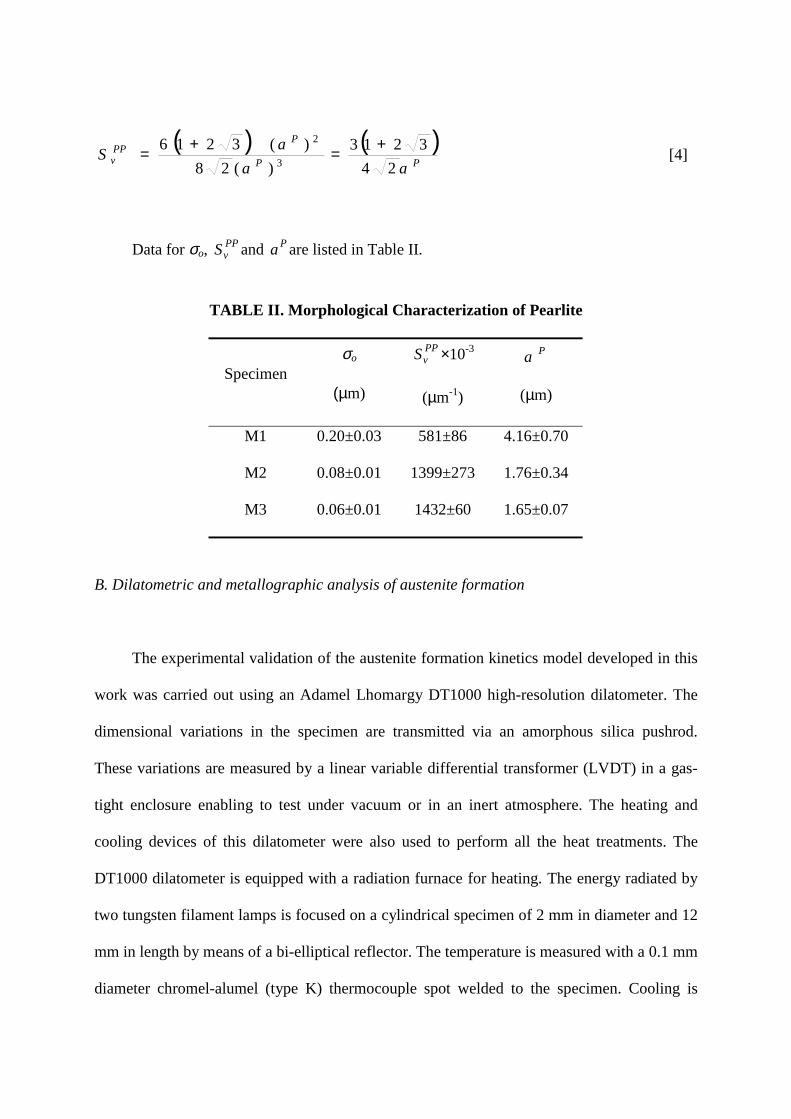
( ) ( )PP
PPPv aa
aS24
3213)(28
)(32163
2 +=+= [4]
Data for σo, PPvS and Pa are listed in Table II.
TABLE II. Morphological Characterization of Pearlite
Specimenσo
(µm)
PPvS ×10-3
(µm-1)
Pa
(µm)
M1 0.20±0.03 581±86 4.16±0.70
M2 0.08±0.01 1399±273 1.76±0.34
M3 0.06±0.01 1432±60 1.65±0.07
B. Dilatometric and metallographic analysis of austenite formation
The experimental validation of the austenite formation kinetics model developed in this
work was carried out using an Adamel Lhomargy DT1000 high-resolution dilatometer. The
dimensional variations in the specimen are transmitted via an amorphous silica pushrod.
These variations are measured by a linear variable differential transformer (LVDT) in a gas-
tight enclosure enabling to test under vacuum or in an inert atmosphere. The heating and
cooling devices of this dilatometer were also used to perform all the heat treatments. The
DT1000 dilatometer is equipped with a radiation furnace for heating. The energy radiated by
two tungsten filament lamps is focused on a cylindrical specimen of 2 mm in diameter and 12
mm in length by means of a bi-elliptical reflector. The temperature is measured with a 0.1 mm
diameter chromel-alumel (type K) thermocouple spot welded to the specimen. Cooling is
carried out by blowing a jet of helium gas directly onto the specimen surface. The helium
flow rate during cooling is controlled by a proportional servovalve. The high efficiency of
heat transmission and the very low thermal inertia of the system ensure that the heating and
cooling rates ranging from 0.003 Ks-1 to 200 Ks-1 remain constant.
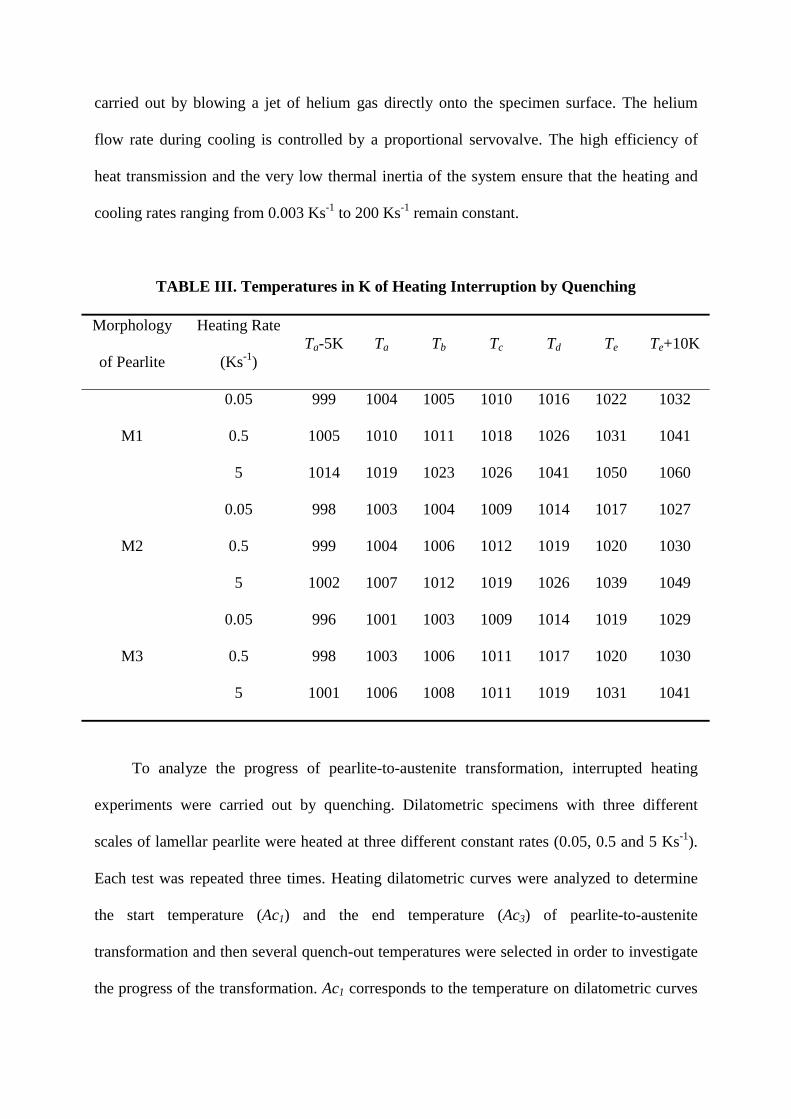
TABLE III. Temperatures in K of Heating Interruption by Quenching
Morphology
of Pearlite
Heating Rate
(Ks-1)Ta-5K Ta Tb Tc Td Te Te+10K
0.05 999 1004 1005 1010 1016 1022 1032
M1 0.5 1005 1010 1011 1018 1026 1031 1041
5 1014 1019 1023 1026 1041 1050 1060
0.05 998 1003 1004 1009 1014 1017 1027
M2 0.5 999 1004 1006 1012 1019 1020 1030
5 1002 1007 1012 1019 1026 1039 1049
0.05 996 1001 1003 1009 1014 1019 1029
M3 0.5 998 1003 1006 1011 1017 1020 1030
5 1001 1006 1008 1011 1019 1031 1041
To analyze the progress of pearlite-to-austenite transformation, interrupted heating
experiments were carried out by quenching. Dilatometric specimens with three different
scales of lamellar pearlite were heated at three different constant rates (0.05, 0.5 and 5 Ks-1).
Each test was repeated three times. Heating dilatometric curves were analyzed to determine
the start temperature (Ac1) and the end temperature (Ac3) of pearlite-to-austenite
transformation and then several quench-out temperatures were selected in order to investigate
the progress of the transformation. Ac1 corresponds to the temperature on dilatometric curves
at which expansion deviates from a linear relation during heating and the sample starts to
shrink due to austenite formation, whereas Ac3 is the temperature at which expansion begins
again to depend linearly on temperature once sample is fully austenitized; Figure 5 shows the
selected quench-out temperatures on a dilatometric curve. They were defined as follows: Ta-5
K being Ta=Ac1; Tb, Tc, and Td, are the temperatures at the maximum, inflexion point and
minimum, respectively, of the heating dilatometric curve; Te=Ac3 and Te+10 K. All these
temperatures, at which heating was interrupted by quenching for each morphology of pearlite
and for each heating rate, are listed in Table III. The temperature reading presented in Table
III correspond to the average values of three individual tests.
Austenite, which is formed inside pearlite, transforms to martensite during quenching.
Thus, the progress of pearlite-to-austenite transformation is determined throughout the
evolution of the volume fraction of martensite. Specimens from interrupted heating
experiments were polished in the usual way for metallographic examination. Le Pera’s
reagent[17] was used to reveal martensite formed during quenching. The quantitative
measurement of martensite volume fraction was determined by point counting.[14]
Figure 6 shows microscopic evidences of how the pearlite-to-austenite reaction occurs
for the three morphologies of pearlite and for a heating rate of 5 Ks-1 throughout micrographs
from interrupted heating samples at the start, intermediate and finish stages of the
reaustenitization process. Le Pera’s reagent[17] reveals pearlite as a darker phase in the
microstructure, whereas martensite formed during quenching appears as lighter regions in the
micrographs. Microstructures in Figs. 6(a), (d) and (g) are formed mainly of pearlite and some
grains of martensite. At these quench-out temperatures, the pearlite-to-austenite
transformation starts, and those temperatures are considered the transformation start
temperature, Ts, of the three different morphologies of pearlite. Figures 6(b), (e) and (h) show
an intermediate stage of the reaction. Finally, Figs. 6(c), (f) and (i) represent microstructures
formed mainly of martensite. At this stage, the transformation pearlite-to-austenite has
reached completion and those quench-out temperatures are considered the transformation
finish temperature, Tf, of the three different morphologies of pearlite.
III. RESULTS AND DISCUSSION
A. Modeling of continuously heated austenite formation kinetics
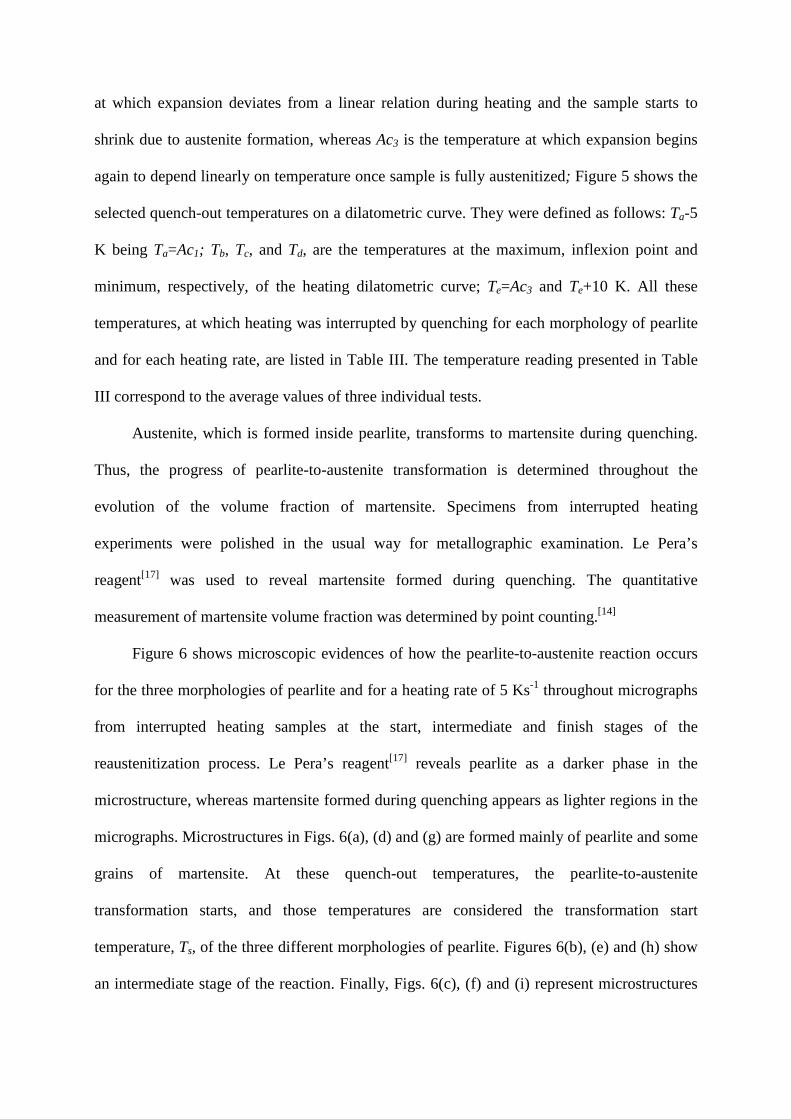
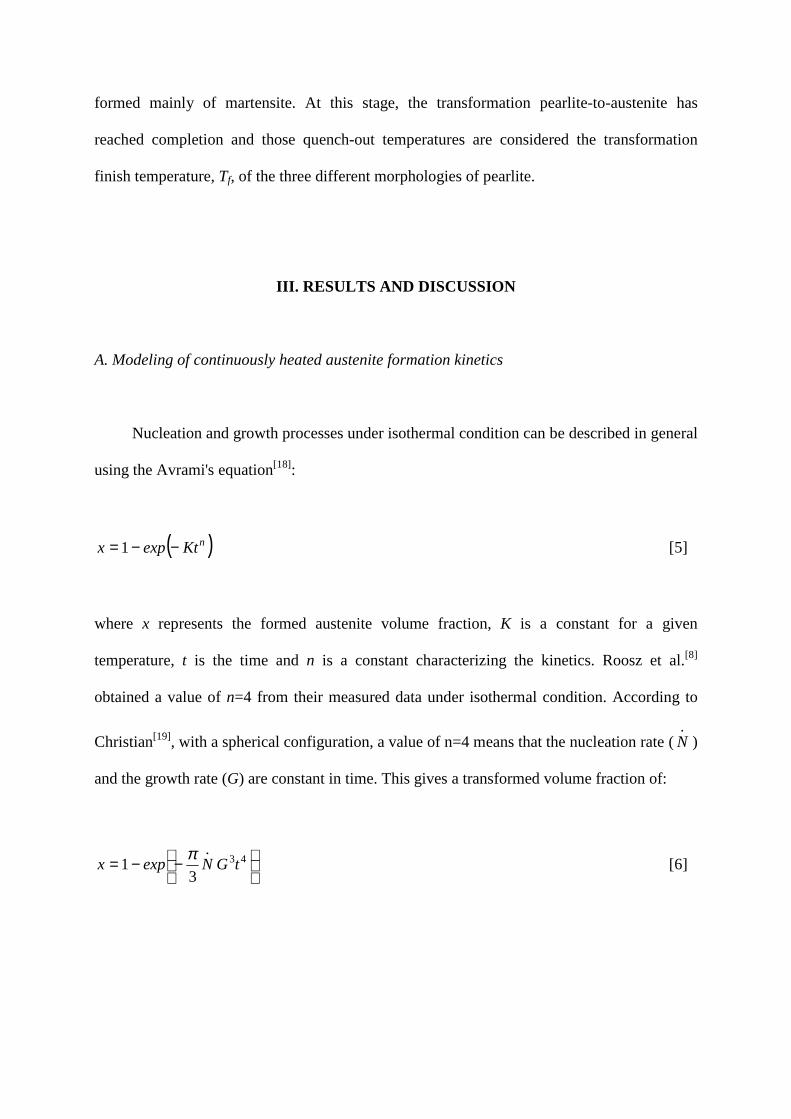
Nucleation and growth processes under isothermal condition can be described in general
using the Avrami's equation[18]:
( )nKtexpx −−= 1 [5]
where x represents the formed austenite volume fraction, K is a constant for a given
temperature, t is the time and n is a constant characterizing the kinetics. Roosz et al.[8]
obtained a value of n=4 from their measured data under isothermal condition. According to
Christian[19], with a spherical configuration, a value of n=4 means that the nucleation rate (•
N )
and the growth rate (G) are constant in time. This gives a transformed volume fraction of:
−−=
• 43
31 tGNexpx π [6]
Roosz et al.[8] proposed the following temperature and structure dependence of
nucleation and growth rates as a function of the reciprocal value of overheating (∆T = T-Ac1)
since their experimental •
N and G values vs ∆T were able to approximate by a straight line,
∆−=
•
TkQfN N
N exp [7]
∆−
=Tk
QfG G
G exp [8]
where QN and QG are the activation energies of nucleation and growth, respectively, k is
Boltzmann’s constant, and fN and fG are the functions representing the influence of the
structure and heating rate on the nucleation and growth rates, respectively. The activation
energies of nucleation and growth, QN and QG, were determined experimentally by Roosz et
al.[8] in a eutectoid steel (QN = 3.5×10⁻²² J/atom and QG = 4.1×10⁻²² J/atom).
Figure 7 shows the three different ferrite/cementite interface sites for austenite
nucleation in fully pearlitic steels: A) the interface of ferrite and cementite platelets, B) the
surfaces of the pearlite colony, and C) the triple points of the pearlite colony intersections.
Several authors[7-9] reported that the nucleation of austenite inside pearlite takes place
preferentially at the points of intersection of cementite with the edges of the pearlite colony
(type C).
Approximating the pearlite colony as a truncated octahedron, the number of nucleation
sites per unit volume (type C) is calculated as follows[16]:
( ) ( ) !σσ
σ233 )(
1
224
36
28
336
Po
P
P
P
o
P
C aa
a
a
a
N ≈=
= [9]
where aP is the edge length of the pearlite colony and σo is the interlamellar spacing.
Bearing in mind that the rate of nucleation increases as the pearlite interlamellar spacing
decreases and the edge length of the pearlite colony increases[20], and considering that the
heating rate (•
T ) might influence on the nucleation rate, the function fN in equation [7] is
assumed to have the following general form:
( ) ••
= TrC
p
mo
nP
NN NTaKf )(σ
[10]
where KN, n, m, p and r are empirical parameters. These parameters were adjusted by
multidimensional least squares in order to obtain good fit between theory and the
experimental austenite volume fraction curves.
Different cases of structure and heating rate dependence for n, m, p and r were
investigated and it was found out that the measured values of austenite volume fraction as a
function of temperature can be best described with n=6, m=1, p=21 and r=
31 .
Austenite nuclei in pearlite grow when carbon atoms are transported by diffusion to the
ferrite/austenite boundary from the austenite/cementite boundary through the austenite and
from the ferrite/cementite boundary through the ferrite, resulting in a transformation of the
ferrite lattice to an austenite lattice.[10] As in the case of the reverse transformation (austenite-
to-pearlite transformation)[21-23], the growth rate of austenite is believed to be controlled by
either volume diffusion of carbon or by boundary diffusion of substitutional alloying elements
such as manganese.[3-24]
If the growth rate of austenite is controlled by the bulk diffusion of atoms in austenite
ahead of the interface, the diffusion of carbon may play a more important role than that of
substitutional alloying elements. Diffusivity of manganese in austenite is far smaller than that
of carbon. As a result, the manganese may not diffuse a long distance during the reaction.
However, as described by Porter[25], when temperature decreases, boundary diffusion of
substitutional alloying elements is the dominant mechanism in the diffusion process. In that
case, the partitioning of manganese is substantial during the growth of austenite and boundary
diffusion of manganese may control the growth rate of pearlite.
The function fG in equation [8] representing the structure dependence on the growth rate
can be expressed as follows:
iGG Kf!σ
1= [11]
where KG is a empirical constant, i=1 if the growth rate of austenite is controlled by volume
diffusion of carbon and i=2 if the growth rate of austenite is controlled by boundary diffusion
of substitutional alloying elements[8].
Substituting equations [10] and [11] in equations [7] and [8], respectively:
( )
∆−
×=
•
••
TNTaN
T
Co
P 38.25exp)(105.1 3216
12
σin ( )s1/mm3 [12]
∆−×= −
TG i
7.29exp1101 10
!σin ( )mm/s [13]
KN and KG empirical constants were adjusted from the experimental austenite volume
fraction results.
The difficulties in treating non-isothermal reactions are meanly due to the independent
variations of growth and nucleation rates with temperature, described in equations [12] and
[13]. The problem is only undertaken when the rate of transformation depends exclusively on
the state of the assembly and not on the thermal path by which the state is reached.[19]
Reactions of this type are called isokinetic. Avrami defined an isokinetic reaction by the
condition that the nucleation and growth rates are proportional to each other (i.e. they have the
same temperature variation). This leads to the concept of additivity and Scheil's rule.[26]
Since Avrami's condition for an isokinetic reaction is not satisfied for the current
experimental study, a general equation to describe the non-isothermal overall pearlite-to-
austenite transformation in pearlitic steel was derived integrating the Avrami's equation over
the whole temperature range where the transformation takes place.[27] In this sense, we have
taken logarithms in equation [6] and then it was differentiated,
dttGNx
dxx
lnd 33
34
111 •
=−
=
−π [14]
If we consider a constant rate for the heating condition, time can be expressed as
follows:
••
∆==T
TtT
dTdt [15]
and substituting into equation [14]:
dTT
TGNx
dx4
33
34
1
∆=− •
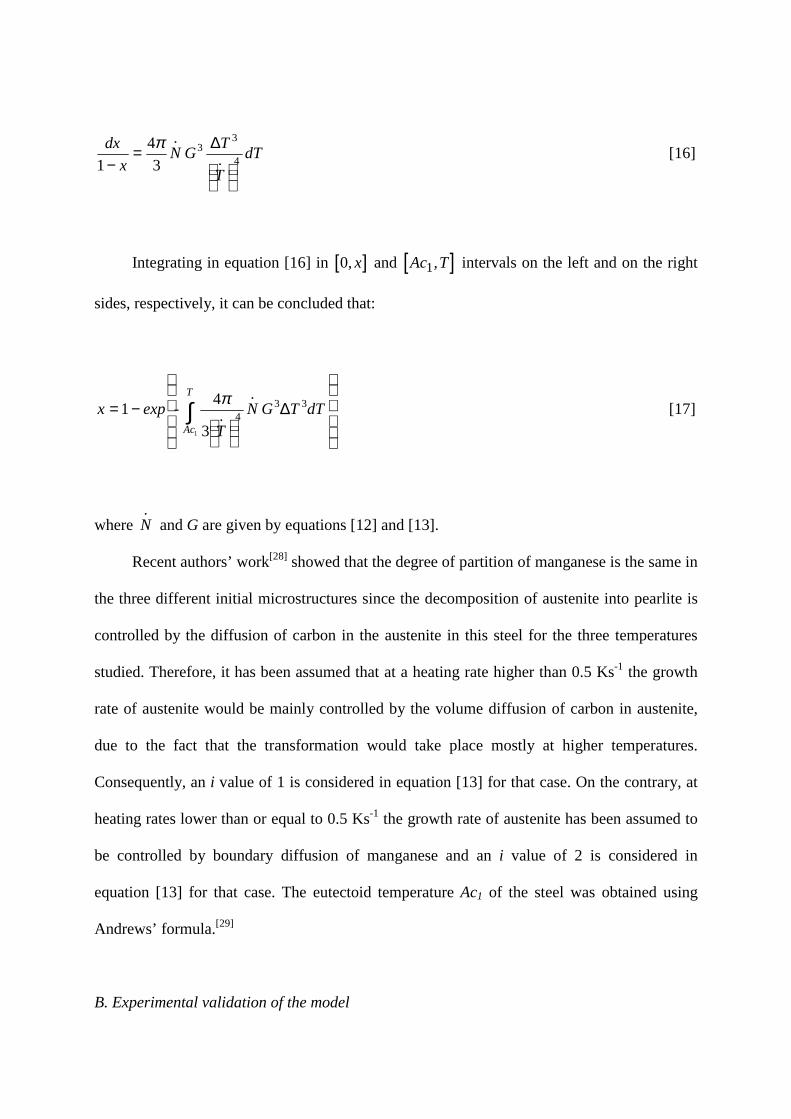
•π [16]
Integrating in equation [16] in [ ]0, x and [ ]Ac T1, intervals on the left and on the right
sides, respectively, it can be concluded that:
∆
−= ∫
•
•
T
Ac
dTTGNT
-expx1
334
3
41 π [17]
where •
N and G are given by equations [12] and [13].
Recent authors’ work[28] showed that the degree of partition of manganese is the same in
the three different initial microstructures since the decomposition of austenite into pearlite is
controlled by the diffusion of carbon in the austenite in this steel for the three temperatures
studied. Therefore, it has been assumed that at a heating rate higher than 0.5 Ks-1 the growth
rate of austenite would be mainly controlled by the volume diffusion of carbon in austenite,
due to the fact that the transformation would take place mostly at higher temperatures.
Consequently, an i value of 1 is considered in equation [13] for that case. On the contrary, at
heating rates lower than or equal to 0.5 Ks-1 the growth rate of austenite has been assumed to
be controlled by boundary diffusion of manganese and an i value of 2 is considered in
equation [13] for that case. The eutectoid temperature Ac1 of the steel was obtained using
Andrews’ formula.[29]
B. Experimental validation of the model
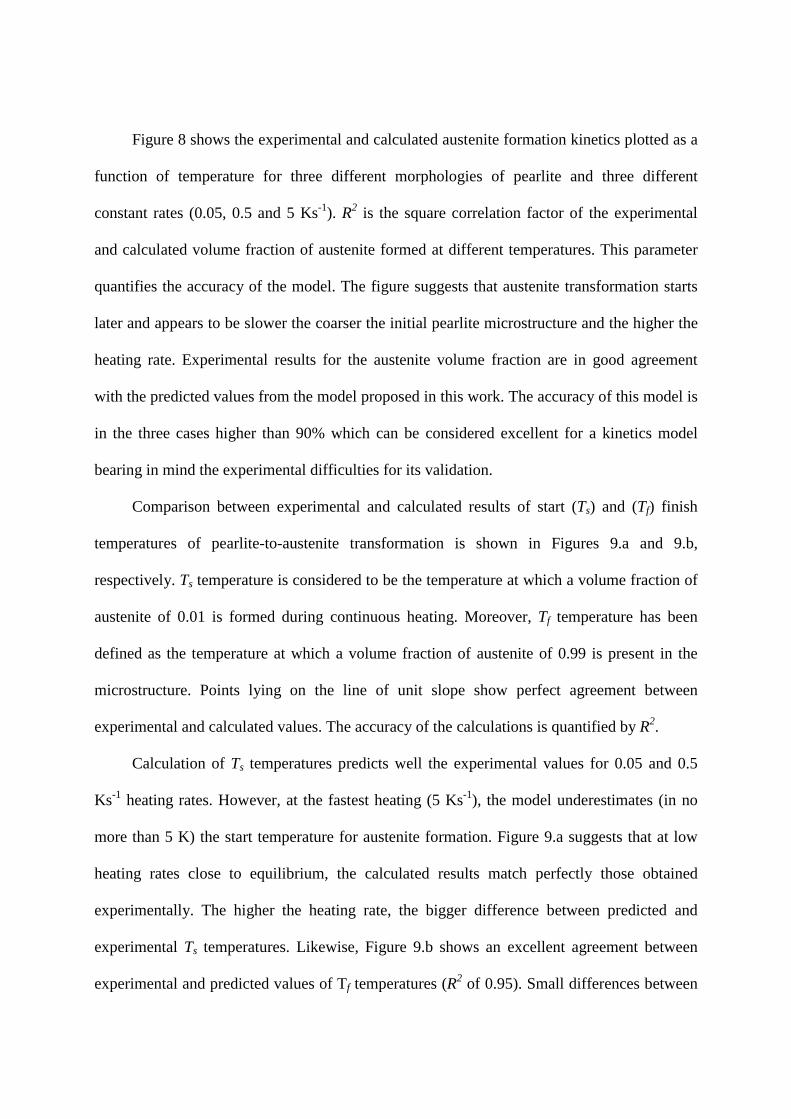
Figure 8 shows the experimental and calculated austenite formation kinetics plotted as a
function of temperature for three different morphologies of pearlite and three different
constant rates (0.05, 0.5 and 5 Ks-1). R2 is the square correlation factor of the experimental
and calculated volume fraction of austenite formed at different temperatures. This parameter
quantifies the accuracy of the model. The figure suggests that austenite transformation starts
later and appears to be slower the coarser the initial pearlite microstructure and the higher the
heating rate. Experimental results for the austenite volume fraction are in good agreement
with the predicted values from the model proposed in this work. The accuracy of this model is
in the three cases higher than 90% which can be considered excellent for a kinetics model
bearing in mind the experimental difficulties for its validation.
Comparison between experimental and calculated results of start (Ts) and (Tf) finish
temperatures of pearlite-to-austenite transformation is shown in Figures 9.a and 9.b,
respectively. Ts temperature is considered to be the temperature at which a volume fraction of
austenite of 0.01 is formed during continuous heating. Moreover, Tf temperature has been
defined as the temperature at which a volume fraction of austenite of 0.99 is present in the
microstructure. Points lying on the line of unit slope show perfect agreement between
experimental and calculated values. The accuracy of the calculations is quantified by R2.
Calculation of Ts temperatures predicts well the experimental values for 0.05 and 0.5
Ks-1 heating rates. However, at the fastest heating (5 Ks-1), the model underestimates (in no
more than 5 K) the start temperature for austenite formation. Figure 9.a suggests that at low
heating rates close to equilibrium, the calculated results match perfectly those obtained
experimentally. The higher the heating rate, the bigger difference between predicted and
experimental Ts temperatures. Likewise, Figure 9.b shows an excellent agreement between
experimental and predicted values of Tf temperatures (R2 of 0.95). Small differences between
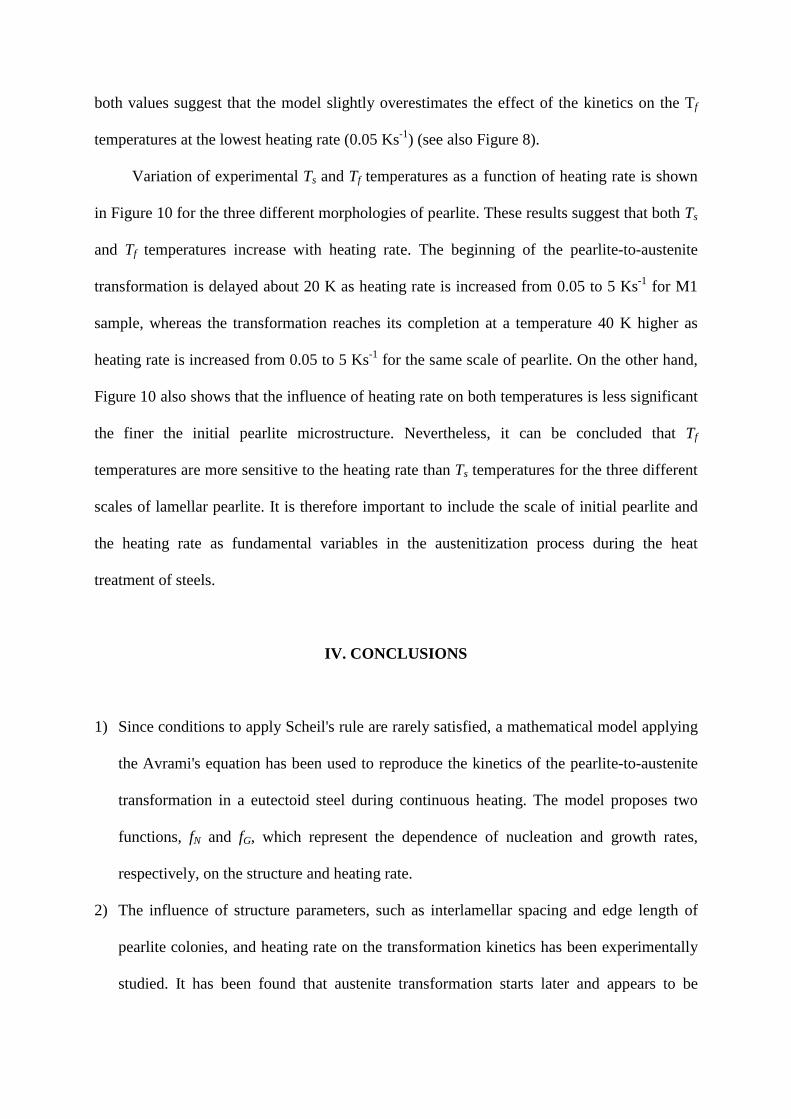
both values suggest that the model slightly overestimates the effect of the kinetics on the Tf
temperatures at the lowest heating rate (0.05 Ks-1) (see also Figure 8).
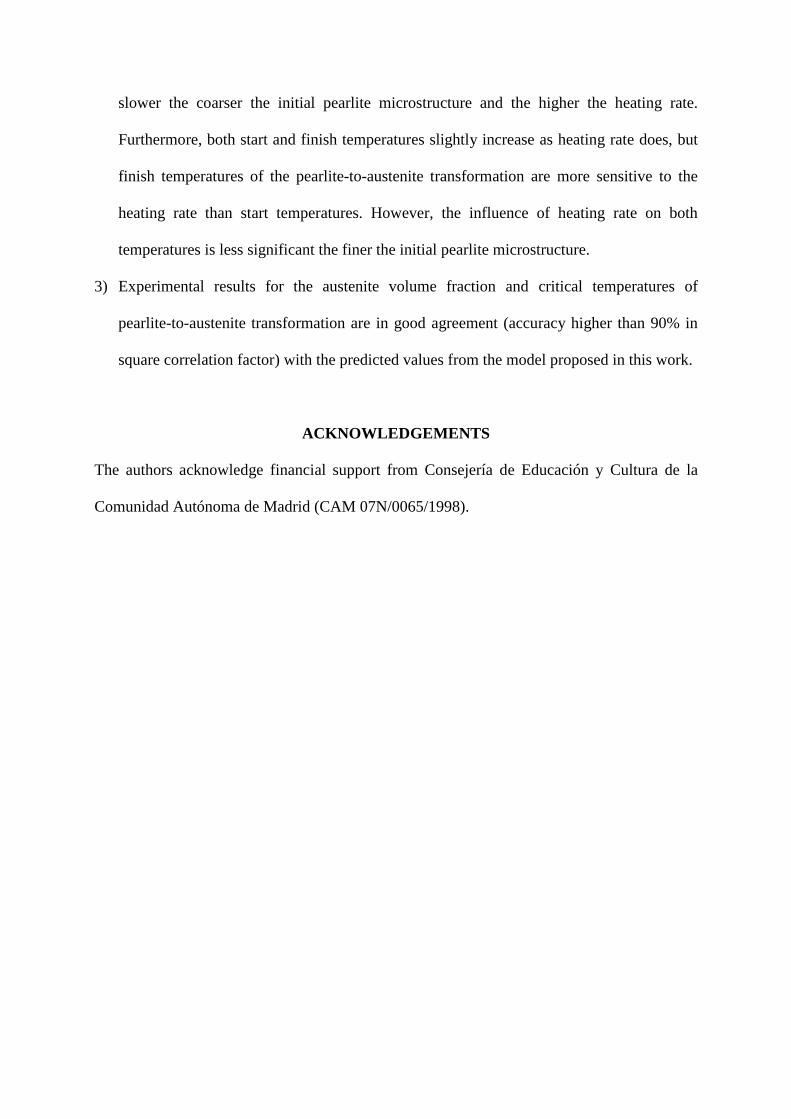
Variation of experimental Ts and Tf temperatures as a function of heating rate is shown
in Figure 10 for the three different morphologies of pearlite. These results suggest that both Ts
and Tf temperatures increase with heating rate. The beginning of the pearlite-to-austenite
transformation is delayed about 20 K as heating rate is increased from 0.05 to 5 Ks-1 for M1
sample, whereas the transformation reaches its completion at a temperature 40 K higher as
heating rate is increased from 0.05 to 5 Ks-1 for the same scale of pearlite. On the other hand,
Figure 10 also shows that the influence of heating rate on both temperatures is less significant
the finer the initial pearlite microstructure. Nevertheless, it can be concluded that Tf
temperatures are more sensitive to the heating rate than Ts temperatures for the three different
scales of lamellar pearlite. It is therefore important to include the scale of initial pearlite and
the heating rate as fundamental variables in the austenitization process during the heat
treatment of steels.
IV. CONCLUSIONS
1) Since conditions to apply Scheil's rule are rarely satisfied, a mathematical model applying
the Avrami's equation has been used to reproduce the kinetics of the pearlite-to-austenite
transformation in a eutectoid steel during continuous heating. The model proposes two
functions, fN and fG, which represent the dependence of nucleation and growth rates,
respectively, on the structure and heating rate.
2) The influence of structure parameters, such as interlamellar spacing and edge length of
pearlite colonies, and heating rate on the transformation kinetics has been experimentally
studied. It has been found that austenite transformation starts later and appears to be
slower the coarser the initial pearlite microstructure and the higher the heating rate.
Furthermore, both start and finish temperatures slightly increase as heating rate does, but
finish temperatures of the pearlite-to-austenite transformation are more sensitive to the
heating rate than start temperatures. However, the influence of heating rate on both
temperatures is less significant the finer the initial pearlite microstructure.
3) Experimental results for the austenite volume fraction and critical temperatures of
pearlite-to-austenite transformation are in good agreement (accuracy higher than 90% in
square correlation factor) with the predicted values from the model proposed in this work.
ACKNOWLEDGEMENTS
The authors acknowledge financial support from Consejería de Educación y Cultura de la
Comunidad Autónoma de Madrid (CAM 07N/0065/1998).
REFERENCES
1. H.K.D.H. Bhadeshia, and L.E. Svensson: Mathematical Modelling of Weld Phenomena,
The Institute of Materials, London, 1993, p. 109.
2. C.I. García, and A.J. DeArdo: Met. Trans. A. 1981, vol. 12A, pp. 521-530.
3. G.R. Speich, V.A. Demarest and R.L. Miller: Met. Trans. A. 1981, vol. 12A, pp. 1419-
1428.
4. M.M. Souza, J.R.C. Guimaraes and K.K. Chawla: Met. Trans. A. 1982, vol. 13A, pp. 575-
579.
5. Xue-Ling Cai, A.J. Garrat-Reed and W.S. Owen: Met. Trans. A. 1985, vol. 16A, pp. 543-
557.
6. C. García de Andrés, F.G. Caballero and C. Capdevila: Scripta Mater., 1998, vol. 38, pp.
1835-1842.
7. G.R. Speich and A. Szirmae: Trans. TMS-AIME, 1969, vol. 245, pp. 1063-1074.
8. A. Roosz, Z. Gacsi and E. G. Fuchs: Acta Metall., 1983, vol. 31, pp. 509-517.
9. R.R. Judd and H. W. Paxton: Trans. TMS-AIME, 1968, vol. 242, pp. 206-215.
10. M. Hillert, K. Nilsson and L.E. Torndahl: J. Iron and Steel Inst., 1971, vol. 209, pp. 49-
66.
11. D.P. Datta, and A.M. Gokhale: Metall. Trans. A. 1981, vol. 12A, pp. 443-450.
12. E. Navara and R. Harrysson: Scripta Metall., 1984, vol. 18, pp. 605-610.
13. S.F. Dirnfeld, B.M. Korevaar and F. Van’t Spijker: Metall. Trans., 1974, vol. 5, pp. 1437-
1444.
14. E.E. Underwood: Quantitative Stereology, Addison-Wesley Publishing Co., Reading,
1970, pp. 73-75.
15. S.A. Saltykov: Stereometric Metallography, 2nd ed., Metallurgizdat, Moscow, 1958, pp.
267-701.
16. R.T. De Hoff, and F.H. Rhines: Quantitative Stereology, McGraw-Hill, New York, 1968,
p. 93.
17. F.S. Le Pera: J. of Metals, 1980, vol. 32, pp. 38-39.
18. M. Avrami: J. Chem. Phys., 1940, vol. 8, pp. 212-.
19. J.W. Christian: The Theory of Transformations in Metals and Alloys, Pergamon Press,
Oxford, 1975, p. 19.
20. G.A. Roberts and R.F. Mehl, Trans. ASM, 1943, vol. 31, pp. 613-650.
21. C. Zener: Trans. AIME, 1946, vol. 167, pp. 550-595.
22. M. Hillert: Jernkont. Ann., 1957, vol. 141, pp. 757-764.
23. M. Hillert: The Mechanism of Phase Transformation in Crystalline Solids, Institute of
Metals, London, 1969, p. 231.
24. E. Navara, B. Bengtsson, and K.E. Easterling: Materials Science and Technology, 1986,
vol. 2, pp. 1196-1201.
25. D.A. Porter and K.E. Easterling: Phase Transformations in Metals and Alloy, 2nd ed.,
Chapman and Hall, London, 1992, p. 101.
26. R. G. Kamat, E.B. Hawbolt, L.C. Brown, and J.K. Brimacombe: Metall. Trans. A., 1992,
vol. 23A, pp. 2469-2482.
27. C. García de Andrés, F.G. Caballero, C. Capdevila and H.K.D.H. Bhadeshia: Scripta
Mater., 1998, vol. 39, pp. 791-796.
28. F.G. Caballero, C. Capdevila and C. García de Andrés: Scripta Mater., 2000, vol. 42, pp.
537-542.
29. K.W. Andrews: JISI, 1965, vol. 203, pp. 721-727.
Fig. 1 Optical micrographs of the three different morphologies of pearlite considered in this
study (Table I): (a) M1; (b) M2; (c) M3.
Fig. 2 Electron micrographs of the three different morphologies of pearlite considered in
this study (Table I): (a) M1 (SEM); (b) M2 (SEM); (c) M3 (TEM).
Fig. 3 (a) Scheme and (b) Typical example of scanning electron micrograph used to
quantify the area per unit volume of the pearlite colonies interface, PPvS .
Fig. 4 Truncated octahedron.
Fig. 5 Temperatures selected from heating dilatometric curves to investigate the progress of
pearlite-to-austenite transformation.
Fig. 6 Optical micrographs corresponding to the start (Ts), intermediate (Ti) and finish (Tf)
temperatures of the reaustenitization process. (a) Ts, M1; (b) Ti, M1; (c) Tf, M1; (d) Ts, M2; (e)
Ti, M2; (f) Tf, M2; (g) Ts, M3; (h) Ti, M3; (i) Tf, M3; Heating rate of 5 K/s.
Fig. 7 Scheme of the ferrite/cementite interface sites for austenite nucleation in fully
pearlitic steel.
Fig. 8 Experimental and calculated kinetics results for the formation of austenite inside
pearlite under continuous heating conditions in eutectoid steel.

Fig. 9 Comparison of experimental and calculated (a) start (Ts) and (b) finish (Tf)
temperatures of pearlite-to-austenite transformation in a eutectoid steel.
Fig. 10 Experimental variation in (a) start (Ts) and (b) finish (Tf) temperatures of pearlite-to-
austenite transformation as function of heating rate.
Fig. 1 Optical micrographs of the three different morphologies of pearlite considered in this
study (Table I): (a) M1; (b) M2; (c) M3.
Fig. 2 Electron micrographs of the three different morphologies of pearlite considered in
this study (Table I): (a) M1 (SEM); (b) M2 (SEM); (c) M3 (TEM).
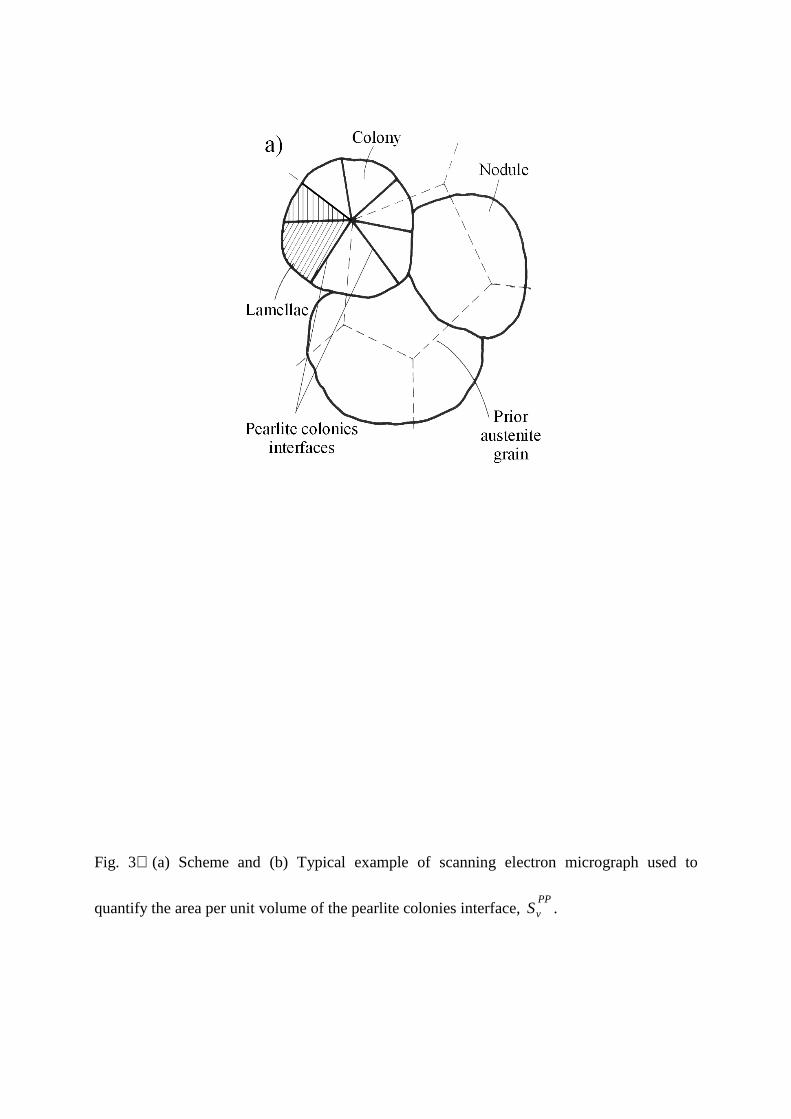
Fig. 3 (a) Scheme and (b) Typical example of scanning electron micrograph used to
quantify the area per unit volume of the pearlite colonies interface, PPvS .
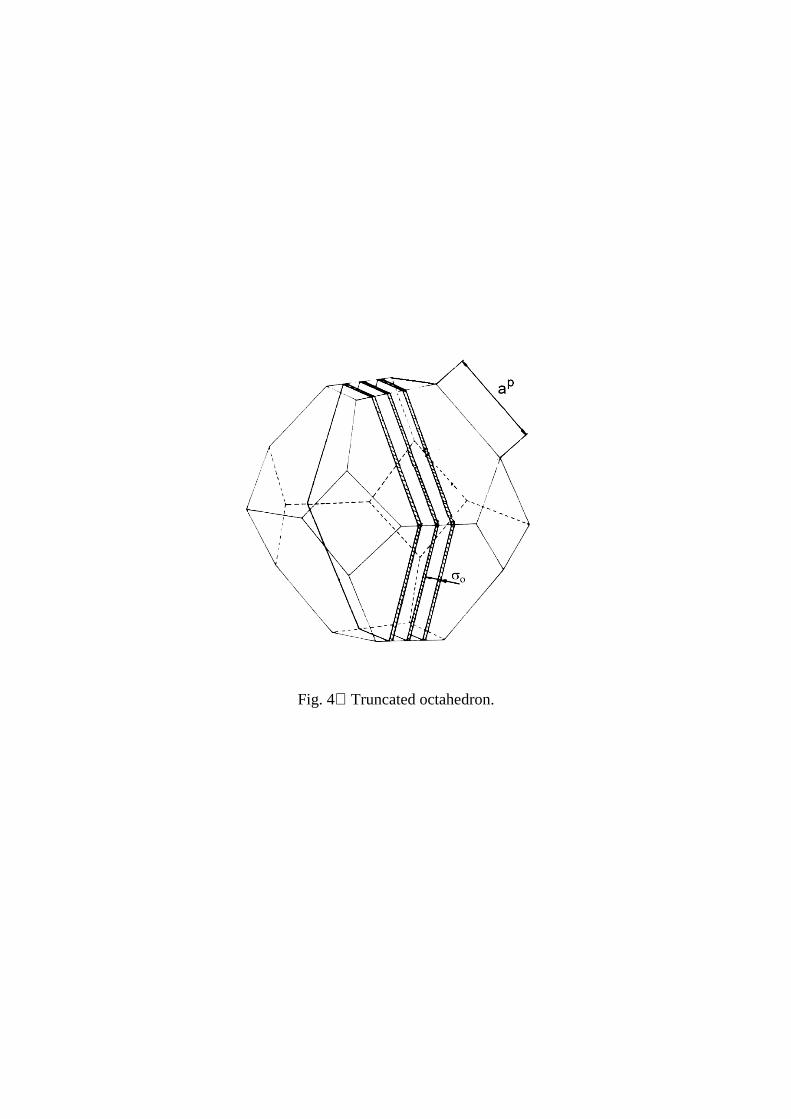
Fig. 4 Truncated octahedron.
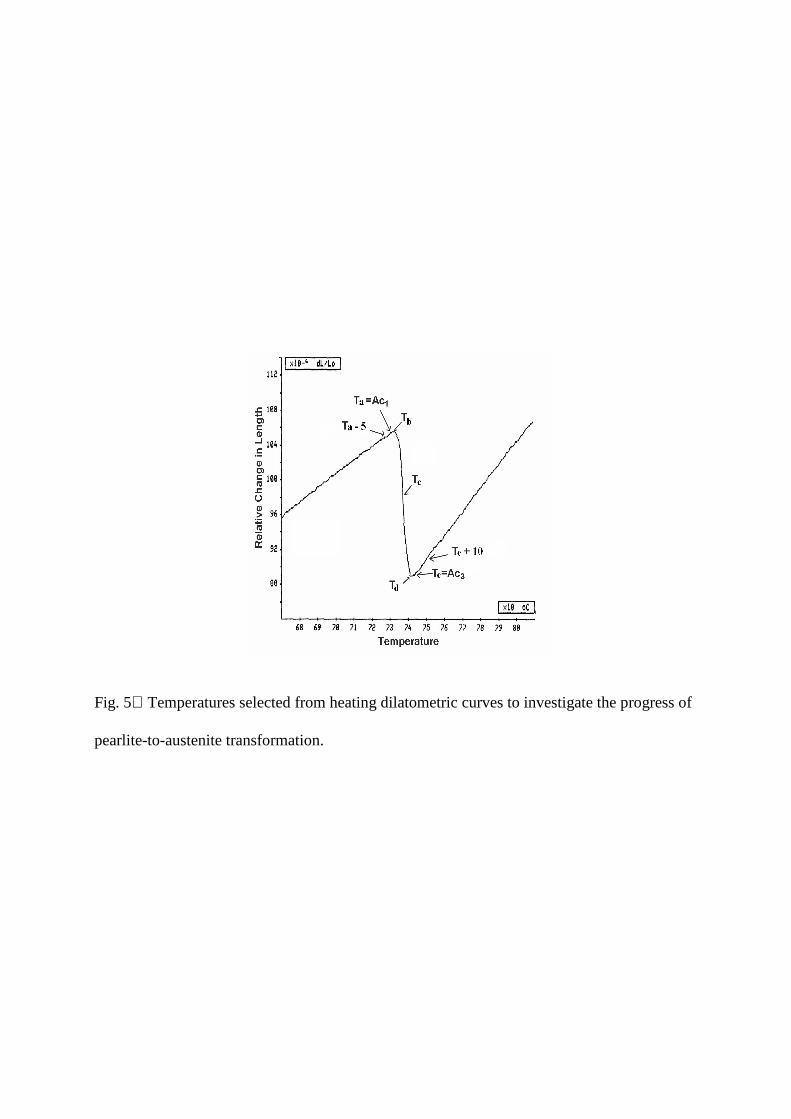
Fig. 5 Temperatures selected from heating dilatometric curves to investigate the progress of
pearlite-to-austenite transformation.
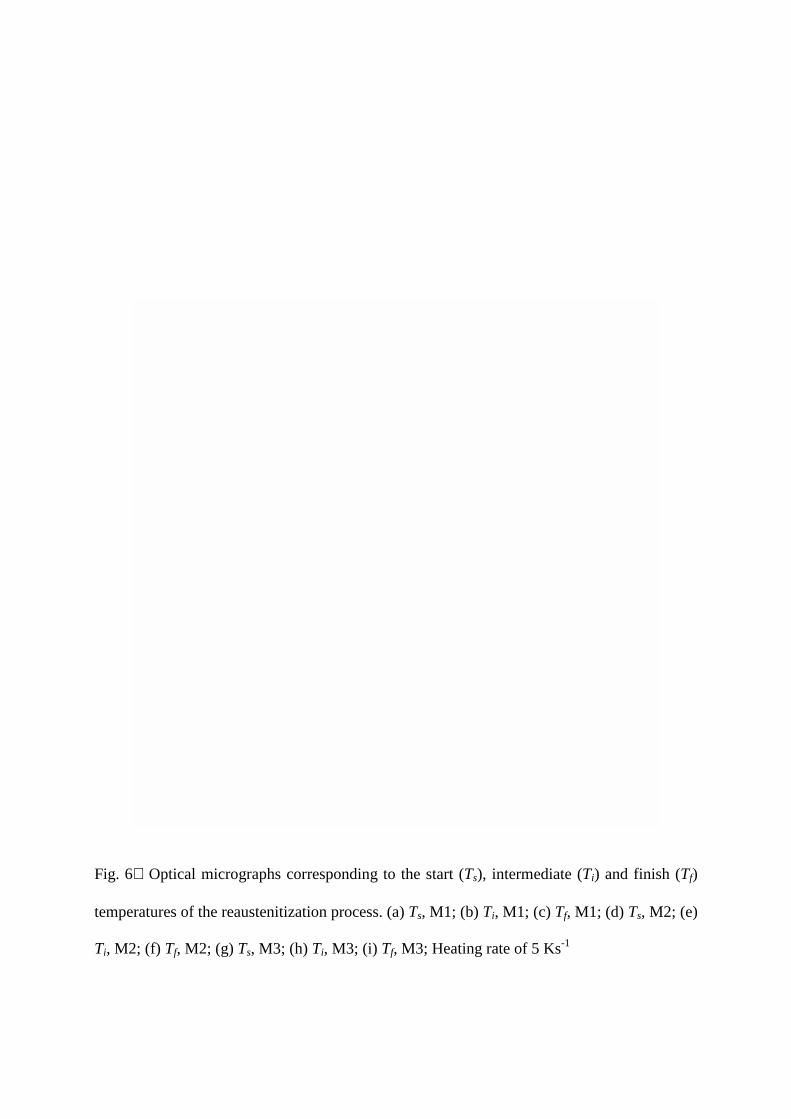
Fig. 6 Optical micrographs corresponding to the start (Ts), intermediate (Ti) and finish (Tf)
temperatures of the reaustenitization process. (a) Ts, M1; (b) Ti, M1; (c) Tf, M1; (d) Ts, M2; (e)
Ti, M2; (f) Tf, M2; (g) Ts, M3; (h) Ti, M3; (i) Tf, M3; Heating rate of 5 Ks-1
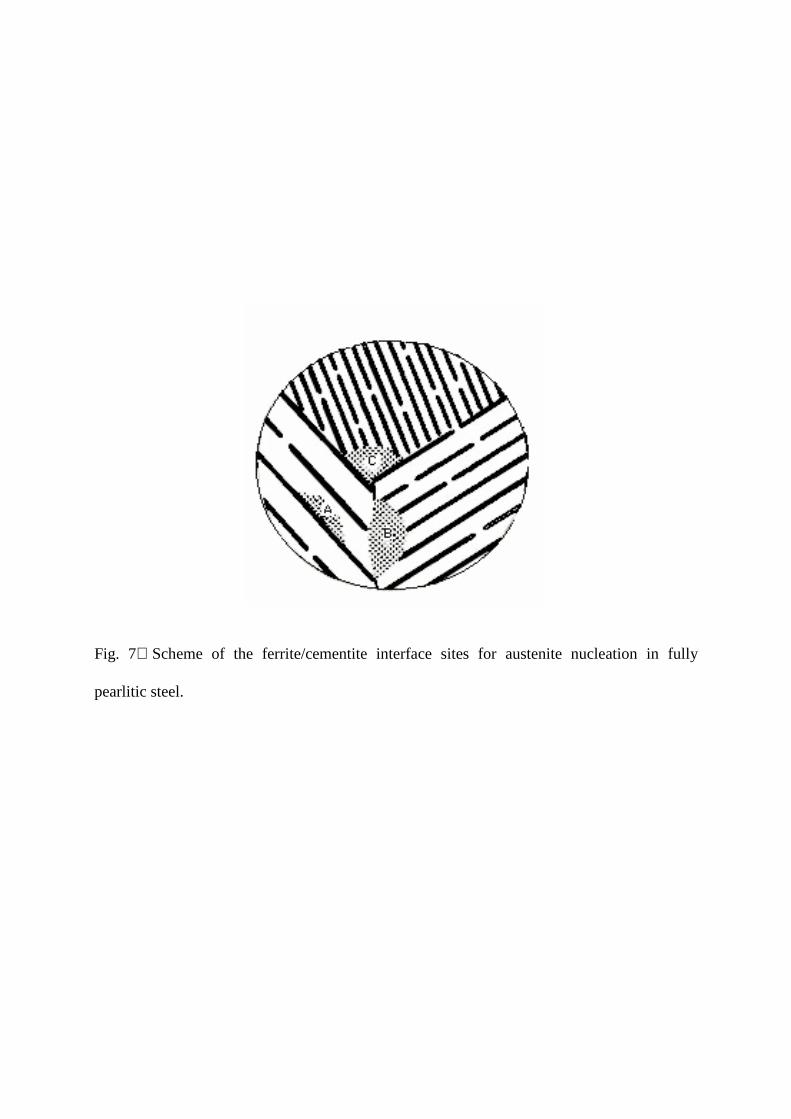
Fig. 7 Scheme of the ferrite/cementite interface sites for austenite nucleation in fully
pearlitic steel.
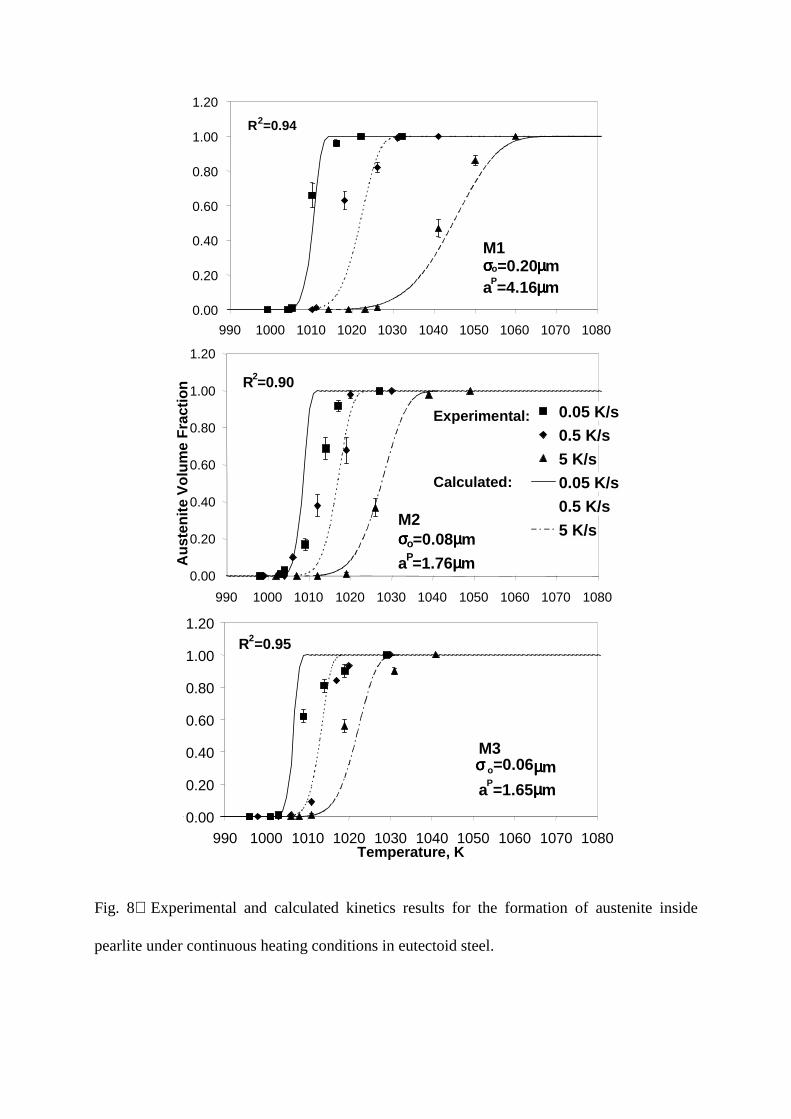
Fig. 8 Experimental and calculated kinetics results for the formation of austenite inside
pearlite under continuous heating conditions in eutectoid steel.
0.00
0.20
0.40
0.60
0.80
1.00
1.20
990 1000 1010 1020 1030 1040 1050 1060 1070 1080
M1σσσσo=0.20 µµµµmaP=4.16 µµµµm
R2=0.94
0.00
0.20
0.40
0.60
0.80
1.00
1.20
990 1000 1010 1020 1030 1040 1050 1060 1070 1080
Aus
teni
te V
olum
e Fr
actio
n
µµµµ
0.05 K/s0.5 K/s5 K/s0.05 K/s0.5 K/s5 K/sM2
σσσσo=0.08 maP=1.76 µµµµm
Calculated:
Experimental:
R2=0.90
0.00
0.20
0.40
0.60
0.80
1.00
1.20
990 1000 1010 1020 1030 1040 1050 1060 1070 1080Temperature, K
M3σσσσ o=0.06 µµµµmaP=1.65 µµµµm
R2=0.95

Fig. 9 Comparison of experimental and calculated (a) start (Ts) and (b) finish (Tf)
temperatures of pearlite-to-austenite transformation in a eutectoid steel.
1000
1010
1020
1030
1040
1050
1060
1070
1000 1010 1020 1030 1040 1050 1060 1070Experimental T f temperature, K
Cal
cula
ted
Tf
tem
pera
ture
, K
0.05 K/s
0.5 K/s
5 K/s
(b)
R2=0.95
1000
1010
1020
1030
1000 1010 1020 1030Experimental T s temperature, K
Cal
cula
ted
Ts
tem
pera
ture
, K
0.05 K/s
0.5 K/s
5 K/s
(a)
R2=0.95
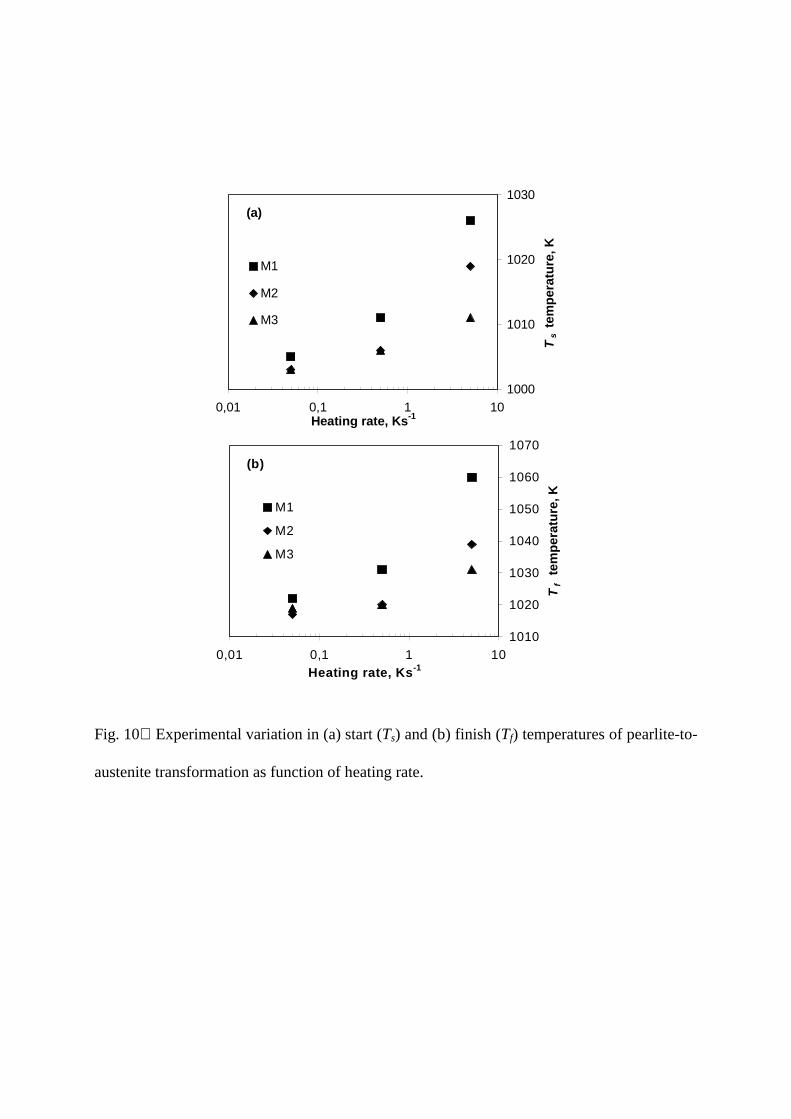
Fig. 10 Experimental variation in (a) start (Ts) and (b) finish (Tf) temperatures of pearlite-to-
austenite transformation as function of heating rate.
1000
1010
1020
1030
0,01 0,1 1 10Heating rate, Ks-1
Ts te
mpe
ratu
re, K
M1
M2
M3
(a)
1010
1020
1030
1040
1050
1060
1070
0,01 0,1 1 10Heating rate, Ks-1
Tf
tem
pera
ture
, K
M1
M2
M3
(b)