Embed Size (px)
Citation preview
Policy Research Working Paper 8328
Informal Sector Heterogeneity and Income Inequality
Evidence from the Democratic Republic of Congo
Franck M. AdohoDjeneba Doumbia
Poverty and Equity Global Practice GroupFebruary 2018
WPS8328P
ublic
Dis
clos
ure
Aut
horiz
edP
ublic
Dis
clos
ure
Aut
horiz
edP
ublic
Dis
clos
ure
Aut
horiz
edP
ublic
Dis
clos
ure
Aut
horiz
ed
Produced by the Research Support Team
Abstract
The Policy Research Working Paper Series disseminates the findings of work in progress to encourage the exchange of ideas about development issues. An objective of the series is to get the findings out quickly, even if the presentations are less than fully polished. The papers carry the names of the authors and should be cited accordingly. The findings, interpretations, and conclusions expressed in this paper are entirely those of the authors. They do not necessarily represent the views of the International Bank for Reconstruction and Development/World Bank and its affiliated organizations, or those of the Executive Directors of the World Bank or the governments they represent.
Policy Research Working Paper 8328
This paper is a product of the Poverty and Equity Global Practice Group. It is part of a larger effort by the World Bank to provide open access to its research and make a contribution to development policy discussions around the world. Policy Research Working Papers are also posted on the Web at http://econ.worldbank.org. The authors may be contacted at [email protected]; [email protected].
This paper uses 1–2–3 survey data on the Democratic Republic of Congo to analyze heterogeneity in the informal sector. It empirically identifies three types of entrepreneurs in the sector. The first group of entrepreneurs—top per-formers—is growth oriented and enjoys greater access to capital. The second group—constrained gazelles—includes entrepreneurs who share many characteristics, especially management skills, with the top performers, but operate with less capital. The third group—survivalists—comprises firms struggling to grow. Based on logit and fixed effect
ordinary least squares models, the results presented in this paper show that poverty and income inequality are more common among constrained gazelles and survivalists. The paper also shows that income inequality is explained mainly by educational disparities and lack of credit access among entrepreneurs. Additionally, the outcomes of a Blinder-Oax-aca decomposition show that the performance of firms is a key factor in explaining differences in income. Examining the drivers of performance, the paper finds that human capital and managerial skills are important engines of performance.
Informal Sector Heterogeneity and Income Inequality:
Evidence from the Democratic Republic of Congo1
Franck M. Adoho
World Bank
Djeneba Doumbia
Paris School of Economics
World Bank
Keywords: Informal sector, income inequality, firm performance.
JEL classification: 017; 012; D21.
1 The authors gratefully acknowledge the comments of Jean-Bernard Chatelain, Kathleen Beegle, Jean-Louis
Combes, Chadi Bou Habib, Tidiane Kinda, Aly Sanoh, Clarence Tsimpo Nkengne, Pierella Paci, Philippe de
Vreyer, Romeo Gansey as well as participants to the 12th Doctorissimes of University Paris 1 Pantheon-Sorbonne,
the International Monetary Fund African Department Seminar, and the 57th Conference of the Canadian Association
for Economic Science.
2
1. Introduction
In 2012, the urban informal sector represented 81.5 percent of employment in the Democratic
Republic of Congo (World Bank 2016). This large proportion highlights the sector’s critical
importance for job creation and income growth in the country. The sector is also vital for the
achievement of the twin goals of poverty reduction and shared prosperity, as it tends to offer
opportunities to the most vulnerable, namely, the poorest, women, and youth. While the informal
sector is defined in various ways in the literature, it is generally said to encompass economic
activities that are not subject to taxes and other regulations (De Soto 1989; Loayza 1996). This
paper defines enterprises in the informal sector as enterprises without formal accounting books
and national identification numbers as firms. This definition seems more appropriate because it
allows for comparability with studies in other developing countries.
Many aspects of the informal economy have been studied. Earlier studies have focused on
explaining the reasons underlying the emergence of the informal economy, the productivity of
the informal sector, and why firms remain informal. For instance, Johnson, Kaufmann, and
Shleifer (1997) and Johnson, Kaufmann, and Zoido-Lobatón (1998) argue that the most striking
factors explaining the emergence of informal firms are rigid labor regulations, high registration
costs, bribery, and constraints in the delivery of public goods and services. Using data on Latin
America, Loayza (1996) finds that the size of the informal sector is negatively correlated with
the quality of government institutions and positively correlated with proxies for tax burden and
labor market restrictions. Still, little attention has been paid to heterogeneity in the informal
sector and even less to inequality within and between the various categories of informal firms.
Understanding this heterogeneity and income inequality is crucial to the design of appropriate
policies.
This paper contributes to the empirical literature by analyzing heterogeneity in the informal
sector in the Democratic Republic of Congo and the implications for the performance of firms
and income inequality. Relying on a representative sample of informal firms derived from the 1-
2-3 survey in the country, the paper identifies three distinct groups of informal entrepreneurs: top
performers, constrained gazelles, and survivalists. The first group of entrepreneurs is growth
oriented and enjoys a greater access to capital. The second group includes entrepreneurs who
share many characteristics, especially management skills, with the top performers, but operate
with less capital. The survivalists, entrepreneurs who are struggling to grow, represent the third
group. Furthermore, the paper makes three other major contributions. First, it analyzes poverty
and income inequality among these three distinct categories of firms. Second, using a Blinder-
Oaxaca decomposition, it explains income differences across the three groups. Third, it examines
the drivers of performance and profitability among informal firms.
The results highlight a striking heterogeneity among informal firms. Poverty rates are higher
among survivalists and constrained gazelles than among top performers. Income inequality,
which is more common among constrained gazelles and survivalists, is mainly explained by
3
performance gaps, educational disparities, and a lack of credit access. The characteristics of
entrepreneurs, such as age, educational attainment, and managerial skills, are important drivers
of the quality of the performance of firms.
The rest of the paper is structured as follows. Section 2 reviews the literature on the informal
sector. Section 3 describes the data and descriptive statistics. Section 4 explains the identification
strategy. Section 5 compares various characteristics associated with these groups. Section 6
investigates urban poverty and inequality among informal firms. Section 7 analyzes the drivers
of the performance of firms. Section 8 provides concluding remarks and policy
recommendations.
2. Informal sector heterogeneity and inequality: Literature review
The distinction between the formal sector and the informal sector has been studied by various
authors over the last four decades. Hart (1973) relies on the distinction between wage and
nonwage (self-employment) activities to distinguish the two sectors (see also ILO 1972). Since
then, the debate about the nature of the diversity of formal and informal firms has shifted
appreciably. Now, specific attributes and issues in the informal sector tend to vary depending on
the region.
In Latin America and in economically dynamic parts of Southeast Asia, discussions about the
informal sector focus on whether most informal entrepreneurs would prefer to remain in the
informal sector or possess more secure jobs in the formal sector (Maloney 2004). In Africa,
interest has centered on the division between a rather small group of successful firms and a much
larger group of firms that struggle to survive. The available evidence tends to confirm that Sub-
Saharan Africa is characterized by a dual industrial structure characterized by large numbers of
small firms, small numbers of large firms, and few small and medium enterprises (Fafchamps
1994).
Rogerson (1996) recognizes a conceptual distinction between two groups of informal enterprises.
The first group consists of survivalist firms. These are involved in activities initiated by people
unable to secure regular wage employment or access to an economic sector of their choice. These
firms are characterized by poverty and must struggle to survive. The second group includes
microenterprises or growth enterprises that are small. Using empirical data on Costa Rica and
Malaysia, Fields (1990) defines the growth-oriented entrepreneurs who can afford financial and
human capital as the “upper-tier informal sector.”
The International Labour Organization (ILO 2002) stresses the importance of recognizing the
diversity of the workers in the informal economy because these workers have varied needs. In
this vein, Nichter and Goldmark (2009) defend their argument that practitioners should be clear
about their goals and avoid focusing interventions on the broad-based expansion of micro- and
small enterprises. These enterprises are heterogeneous, and the class possesses numerous
4
segments, such as latent gazelles and survivalist middle-size enterprises, making the
establishment of common, effective programs across groups difficult. Whereas all such
enterprises require assistance through interventions, the latent gazelles are more likely than
survivalists to need significantly varied types of assistance.
The empirical literature highlights many features of the heterogeneity in the informal sector,
including involuntary wage labor, queuing for formal employment, and voluntary self-
employment. These are similar in many ways to the characteristics of the entrepreneurial small
firm sector in developed countries (Grimm, Lay, Roubaud and Vaillant 2011). Fields (2004)
differentiates between rationed upper-tier activities, which are based on methods of production
and types of jobs that are similar to those of formal firms, and a lower tier, which is concentrated
on easy entry activities and corresponding to the residual subsistence sector in the dualistic view
(Bosch and Maloney 2010). However, Cunningham and Maloney (2001), using data on Mexico,
argue that there is strong heterogeneity among small firms that is of the same nature as the
heterogeneity in developed countries, whereby small firms that have reached their optimal long-
run size coexist with profitable starting firms and start-up firms that will fail.
The key policy implication of the existence of distinct groups of entrepreneurs is that these
groups call for distinct policy approaches: a directed business development method for top
performers and a more widespread program to help improve employability and reduce poverty
among the survivalists (Berner, Gomez, and Knorringa 2012).
Using a sample of informal entrepreneurs in seven West African countries, Grimm, Knorringa,
and Lay (2012) in addition to the groups of top performers and survivalists, empirically identify
a third segment of informal entrepreneurs, constrained gazelles. These entrepreneurs show
characteristics—managerial abilities and motivation—similar to those of growth-oriented
entrepreneurs. The authors mostly find a larger share of constrained gazelles in more dynamic
economies. They also show that the size of the group of constrained gazelles relative to the group
of survivalists is correlated with structural characteristics, such as the urbanization rate, the share
of agriculture in the economy, and the size of the public and formal private sectors of the
respective countries.
Gindling and Newhouse (2014) investigate heterogeneity among the self-employed, using the
international Income Distribution Database (I2D2) on almost 100 developing countries. Unlike
Grimm, Knorringa and Lay (2012), this paper uses two different measures of success (a) whether
the self-employed worker is an employer and (b) whether the self-employed worker belongs to a
family with per capita consumption above the $2 per day poverty line. The paper relies on the
methodology developed in Grimm, Knorringa and Lay (2012) to identify self-employed with a
high potential to become successful. Results show that one-third of the unsuccessful
entrepreneurs have the potential to become successful.
5
Using qualitative information, performance-based measures and employment growth, Diao et al.
(2016) identified a group of firms in the Micro, Small and Middle-Sized Enterprises (MSME)
sector in Tanzania– the so-called “in-between”. These firms operate mainly in the sectors of
manufacturing and trade services, employ approximately the same number of employees as
compared to those in the formal sector and have significant potential for future growth.
Few studies have specifically investigated inequality in the informal sector. Most that do have
focused only on the causality between rising inequality and the size of the informal economy at
the macroeconomic level (Chong and Gradstein 2004; Winkelried 2005).
Classifying firms in the informal sector and recognizing the sector’s role as a setting
environment for profitable activity may contribute to economic growth (AfDB 2013).
Accounting for more than half the labor force in Sub-Saharan Africa, the informal sector
represents prospects for better living standards among many people. Nonetheless, there is
evidence that registering with tax authorities (formalization) increases the profits of firms with
two to five workers and the middle third of capital stock (the midsize group), while leading to
losses among smaller and larger informal firms (McKenzie and Sakho 2010). Discovering how
to reduce inequality and poverty between and within the three distinct categories of informal
firms—top performers, constrained gazelles, and survivalists—is thus an important policy
matter. It could enhance the productivity of firms and help governments coordinate strategies and
policies to support the formalization of the sector.
3. Data and descriptive statistics
3.1. 1-2-3 survey
The empirical investigation reported in this paper relies on survey data from the 1-2-3 survey
collected in the Democratic Republic of Congo in 2012. The 1-2-3 survey was conducted by the
National Institute of Statistics, in partnership with other actors, including Afristat and the World
Bank.2 The 1-2-3 survey is a representative, multilayer survey that covers three nested surveys,
three phases involving separate statistical populations: individuals, informal production units,
and households.
Phase 1 provides detailed information on employment, unemployment, and household and
individual sociodemographic characteristics. It includes a household module, an individual
questionnaire for individuals ages 5 or above, and a community questionnaire. Phase 2 is a
specific survey covering the heads of informal production units. This informal sector survey
collects information on the characteristics of firm owners, production units, economic
performance, business requirements (costs, investment), and employees. This phase is important
as it allows measuring the Congolese informal economy. Phase 3 is a survey on household
2 See INS. http://www.ins-rdc.org/sites/default/files/Rapport%20enquete%20123.pdf.
6
expenditures that involves interviews among a subsample of the informal production units
identified in phase 1. The paper focuses on a representative subsample of 4,504 informal firms.
Table A1 in the appendix defines the variables used in the paper.
3.2. Characteristics of the informal sector in DRC
The informal sector in the Democratic Republic of Congo is heterogeneous in many ways.
Differences are noticeable across the individual characteristics of the owners of informal firms
(reason for the creation of the firm, educational attainment), but also across the distribution of
consumption3 and capital.
Most people who have created informal enterprises have done so because they lack alternative
employment opportunities. Many entrepreneurs started their businesses because they could not
find jobs in the formal wage sector. Of entrepreneurs who have created their own businesses
because of the lack of jobs in large firms, 63 percent have received secondary education, 65
percent are men while only 35 percent are women (appendix A, figure A.1). The informal sector
is dominated by women entrepreneurs, who own approximately 64 percent of all informal firms.
This reinforces the finding that, in many developing countries, women manage the majority of
small and medium enterprises because they lack access to alternative opportunities (Rubio 1991).
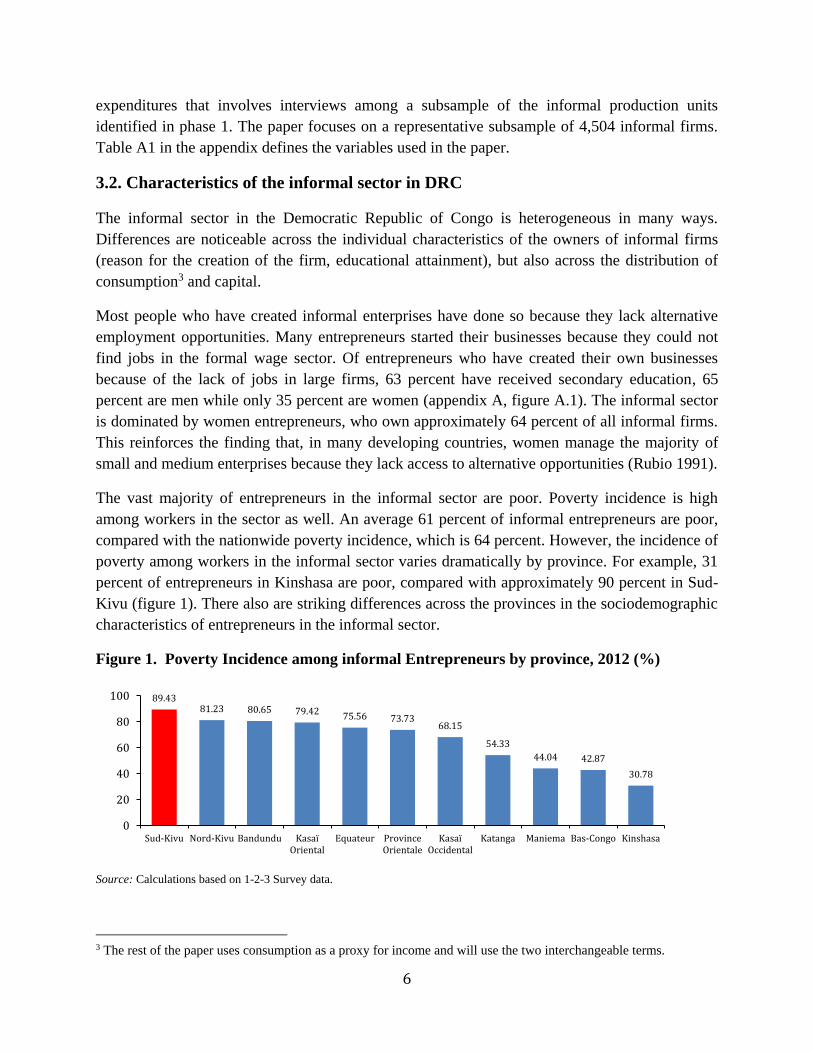
The vast majority of entrepreneurs in the informal sector are poor. Poverty incidence is high
among workers in the sector as well. An average 61 percent of informal entrepreneurs are poor,
compared with the nationwide poverty incidence, which is 64 percent. However, the incidence of
poverty among workers in the informal sector varies dramatically by province. For example, 31
percent of entrepreneurs in Kinshasa are poor, compared with approximately 90 percent in Sud-
Kivu (figure 1). There also are striking differences across the provinces in the sociodemographic
characteristics of entrepreneurs in the informal sector.
Figure 1. Poverty Incidence among informal Entrepreneurs by province, 2012 (%)
Source: Calculations based on 1-2-3 Survey data.
3 The rest of the paper uses consumption as a proxy for income and will use the two interchangeable terms.
89.4381.23 80.65 79.42
75.56 73.7368.15
54.33
44.04 42.87
30.78
0
20
40
60
80
100
Sud-Kivu Nord-Kivu Bandundu KasaïOriental
Equateur ProvinceOrientale
KasaïOccidental
Katanga Maniema Bas-Congo Kinshasa
7
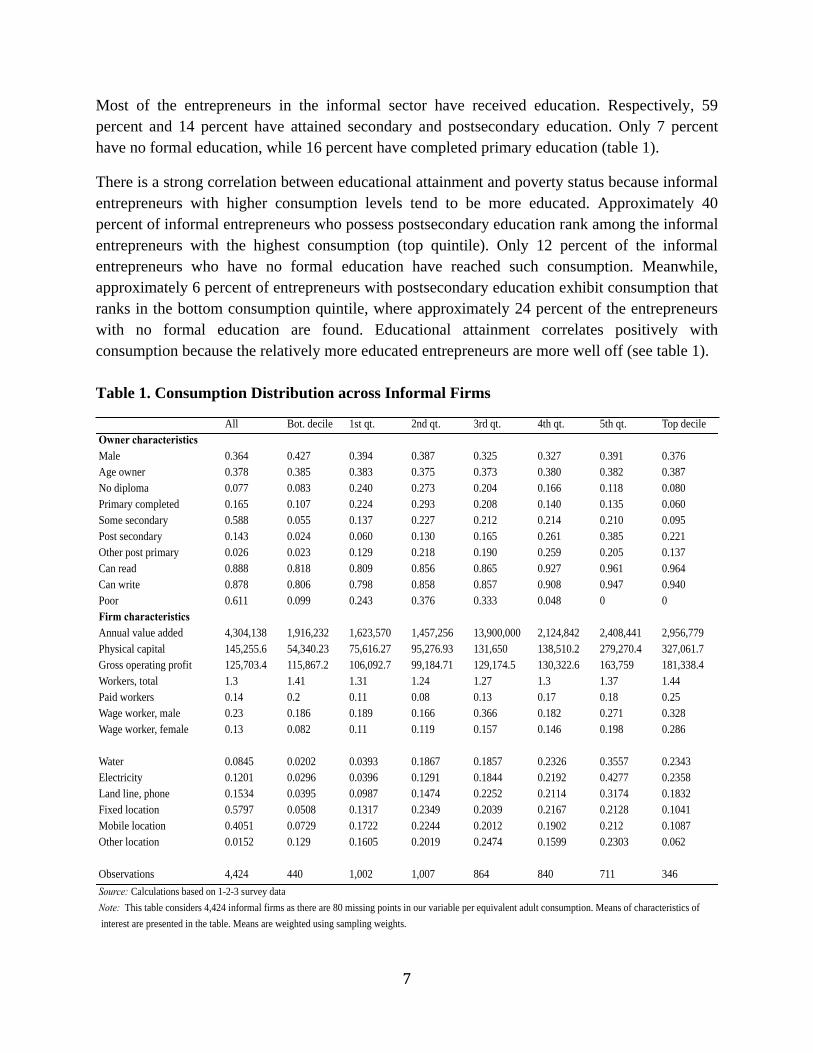
Most of the entrepreneurs in the informal sector have received education. Respectively, 59
percent and 14 percent have attained secondary and postsecondary education. Only 7 percent
have no formal education, while 16 percent have completed primary education (table 1).
There is a strong correlation between educational attainment and poverty status because informal
entrepreneurs with higher consumption levels tend to be more educated. Approximately 40
percent of informal entrepreneurs who possess postsecondary education rank among the informal
entrepreneurs with the highest consumption (top quintile). Only 12 percent of the informal
entrepreneurs who have no formal education have reached such consumption. Meanwhile,
approximately 6 percent of entrepreneurs with postsecondary education exhibit consumption that
ranks in the bottom consumption quintile, where approximately 24 percent of the entrepreneurs
with no formal education are found. Educational attainment correlates positively with
consumption because the relatively more educated entrepreneurs are more well off (see table 1).
Table 1. Consumption Distribution across Informal Firms
All Bot. decile 1st qt. 2nd qt. 3rd qt. 4th qt. 5th qt. Top decile
Owner characteristics
Male 0.364 0.427 0.394 0.387 0.325 0.327 0.391 0.376
Age owner 0.378 0.385 0.383 0.375 0.373 0.380 0.382 0.387
No diploma 0.077 0.083 0.240 0.273 0.204 0.166 0.118 0.080
Primary completed 0.165 0.107 0.224 0.293 0.208 0.140 0.135 0.060
Some secondary 0.588 0.055 0.137 0.227 0.212 0.214 0.210 0.095
Post secondary 0.143 0.024 0.060 0.130 0.165 0.261 0.385 0.221
Other post primary 0.026 0.023 0.129 0.218 0.190 0.259 0.205 0.137
Can read 0.888 0.818 0.809 0.856 0.865 0.927 0.961 0.964
Can write 0.878 0.806 0.798 0.858 0.857 0.908 0.947 0.940
Poor 0.611 0.099 0.243 0.376 0.333 0.048 0 0
Firm characteristics
Annual value added 4,304,138 1,916,232 1,623,570 1,457,256 13,900,000 2,124,842 2,408,441 2,956,779
Physical capital 145,255.6 54,340.23 75,616.27 95,276.93 131,650 138,510.2 279,270.4 327,061.7
Gross operating profit 125,703.4 115,867.2 106,092.7 99,184.71 129,174.5 130,322.6 163,759 181,338.4
Workers, total 1.3 1.41 1.31 1.24 1.27 1.3 1.37 1.44
Paid workers 0.14 0.2 0.11 0.08 0.13 0.17 0.18 0.25
Wage worker, male 0.23 0.186 0.189 0.166 0.366 0.182 0.271 0.328
Wage worker, female 0.13 0.082 0.11 0.119 0.157 0.146 0.198 0.286
Water 0.0845 0.0202 0.0393 0.1867 0.1857 0.2326 0.3557 0.2343
Electricity 0.1201 0.0296 0.0396 0.1291 0.1844 0.2192 0.4277 0.2358
Land line, phone 0.1534 0.0395 0.0987 0.1474 0.2252 0.2114 0.3174 0.1832
Fixed location 0.5797 0.0508 0.1317 0.2349 0.2039 0.2167 0.2128 0.1041
Mobile location 0.4051 0.0729 0.1722 0.2244 0.2012 0.1902 0.212 0.1087
Other location 0.0152 0.129 0.1605 0.2019 0.2474 0.1599 0.2303 0.062
Observations 4,424 440 1,002 1,007 864 840 711 346
Source: Calculations based on 1-2-3 survey data
Note: This table considers 4,424 informal firms as there are 80 missing points in our variable per equivalent adult consumption. Means of characteristics of
interest are presented in the table. Means are weighted using sampling weights.
8
The staff size of urban informal firms varies widely, but most of the firms are staffed by only the
owner. Appendix A, figure A.2 illustrates the distribution of informal firms by staff size. It
shows that 82 percent of entrepreneurs in the informal sector are staffed by one person. Whereas
11 percent of informal firms are staffed by two people, only around 7 percent have from two to
five employees.4 The distribution of the staff size of informal firms by gender shows that 87
percent of firms owned by women are staffed by one person while this is the case for 72 percent
of firms owned by men (appendix A, figure A.3).
Approximately 65 percent of informal firms are active in the agroindustry and food trade, retail
trade, and repair services. The breakdown among these branches indicates that 38 percent of
entrepreneurs operate in the agroindustry and food trade, while 26 percent have retail shops and
repair services. The manufacturing branch represents a minority, with 10 percent of all informal
firms. The wholesale, construction, and mining branches each represents less than 2 percent of
informal firms (appendix A, table A.2).
About 85 percent of entrepreneurs in the informal sector work from a fixed place of business,
whereas 15 percent do not. However, the locations of the fixed places of business often do not
meet basic requirements in a way that sustains business growth. Informal entrepreneurs without a
fixed workplace tend to be mobile. Home is the most common workplace among entrepreneurs
who work from a fixed place. However, 21.7 percent of informal entrepreneurs who work from
their homes do not have the appropriate equipment (appendix A, figure A.4).
The majority of informal firms lack access to basic infrastructure such as water, electricity, and
telecommunication. Only 8 percent, 12 percent, and 15 percent of the firms, respectively, have
access to water, electricity, and telecommunication. Entrepreneurs in the bottom quintile of the
consumption distribution have less access to basic infrastructures mainly because they are less
likely to have a fixed workplace compared with entrepreneurs in the top quintile of the
consumption distribution (see table 1).
Access to basic infrastructure and a fixed workplace is more constrained among women
entrepreneurs than among men entrepreneurs. Whereas 24 percent of men entrepreneurs have
access to telecommunication, only 10 percent of women entrepreneurs have such access.
Similarly, relative to men entrepreneurs (12 percent), more women entrepreneurs (27 percent)
operate from their homes without the appropriate infrastructure (appendix A, figure A.5).
The performance of informal firms is related to their access to capital and the source of their
labor. Firms with large amounts of capital generate the most profits. Such firms are
disproportionately concentrated among entrepreneurs who exhibit high consumption. Highly
4 About 93 percent of informal firms were created by one person. This may indicate a high potential for
cooperatives.
The mean of paid employees is 0.14 (Table 1), which is below the share (0.205) found in Grimm, Knorringa and
Lay (2012) using 1-2-3 survey data for seven West African countries.
9
productive firm owners tend to have at least one wage worker (see table 1). Firm characteristics
and performance vary according to the socioeconomic characteristics of the owner.
The average performance of informal firms, measured by the hourly value added, is CGF
20,697.02, and the average amount of capital is CGF 145,255.60. Both firm performance and
access to capital vary by gender. Overall, informal firms owned by men tend to perform better.
These firms are more likely to have access to more capital and to generate more value added per
hour worked relative to informal firms headed by women. Man-headed informal firms typically
have more workers who are paid. The informal firms with the most capital are active more often
in transport, mining and other primary activities in production and the retrieval of raw materials,
construction, and hotels and restaurants. Around 42 percent of informal firms in the top capital
decile are engaged in transport. Informal firms operating in the food trade, agribusiness, and
wholesale tend to have the least access to capital (appendix A, table A.2).
In general, the richer the entrepreneur, the better the economic performance. Larger hourly value
added is generated by entrepreneurs with higher levels of consumption compared with their
counterparts in the bottom consumption quintile. Informal entrepreneurs in the bottom income
decile exhibit lower value added, about two-thirds as much as the entrepreneurs in the top decile.
Entrepreneurs with greater capital are typically more well educated. Over a third of the
entrepreneurs with greater access to capital (the top quartile) have received vocational education,
that is, other post-primary education. Only 11 percent of the entrepreneurs in the bottom quartile
of the capital distribution have received so much training. Around 36 percent of the
entrepreneurs in the top quartile of the capital distribution have some postsecondary education
compared with 19 percent of the entrepreneurs in the bottom quartile (appendix A, table A.3).
Informal firms with less capital are more constrained by a lack of basic infrastructure (water,
electricity, and phone lines) than their peers. Firms in the bottom quartile of the capital
distribution have less access to basic infrastructure. While close to a third of these firms operate
from mobile locations, this is true of only a fifth of the firms in the top capital quartile (appendix
A, figure A.6). Informal firms in provinces such as Katanga and Kinshasa tend to have access to
more capital and better access to water and electricity (appendix A, table A.2).
4. Identification strategy: Informal firms
4.1. Defining a top performer
Following Grimm, Knorringa, and Lay (2012), the strategy to identify the three categories of
informal entrepreneurs involves three steps. The first step consists in defining growth-oriented
entrepreneurs or top performers in terms of physical capital and value added. Physical capital is
defined as the replacement value of all business-related assets that have been used in the
operation of the enterprise in the previous year, including the business establishment, machinery,
furniture, vehicles, and utilities. In the second step, owner and firm characteristics are identified
10
that are correlated with physical capital and value added, and the empirical probability that a firm
will be highly productive is assessed based on these correlations. In the third step, entrepreneurs
are classified into the three groups—top performers, constrained gazelles, and survivalists—
conditional on the actual status as a top performer and the predicted probability of this status.
The paper defines top performers as those entrepreneurs in the sample who are the most
productive (the top 50 percent in terms of capital productivity, that is, value added per physical
capital) among the top 40 percent of the capital distribution. Because capital accumulation is part
of the economic growth process, it is considered an accurate factor in identifying a growth-
oriented firm.
4.2. Sample selection bias
Because of missing values in the variable of capital and because the definition of the top
performers is based mainly on this variable, the Heckman (1979) two-step estimation is viewed
as a reliable way to test for selection bias. The first step consists in analyzing the determinants of
capital possession. To do so, a probit model is estimated, as the follows:
Pr(Capital = 1) = θ(∝0+ X𝑖′ ∝1+ ω𝑖) (1)
where capital is a dummy variable taking 1 when a firm owns capital and 0 otherwise; is the
cumulative standard distribution function; 𝑖 is a vector of the following factors: business
association, financial knowledge that is measured by a variable equal to 1 if the firm’s owner has
knowledge about microfinance institutions and 0 otherwise, family tradition taking 1 if the owner
started a business because of family tradition, the age of the owner, the age squared; a gender
dummy equal to 1 if the owner is a man and 0 otherwise, and firm age. Dummies are included
for sectors. The equation also includes region fixed effects.
The results show that membership in a business association, the possession of financial
knowledge, and being a man increase the probability of owning capital (table 2). They also
support the evidence that industry is a highly capital-intensive sector. Entrepreneurs in the
industry sector are more likely (around 6.7 percent) than entrepreneurs in other sectors to have
capital. Entrepreneurs operating in hotels and restaurants are also likely to own capital.
Entrepreneurs in retail trade and in repair services show less likelihood of capital ownership.
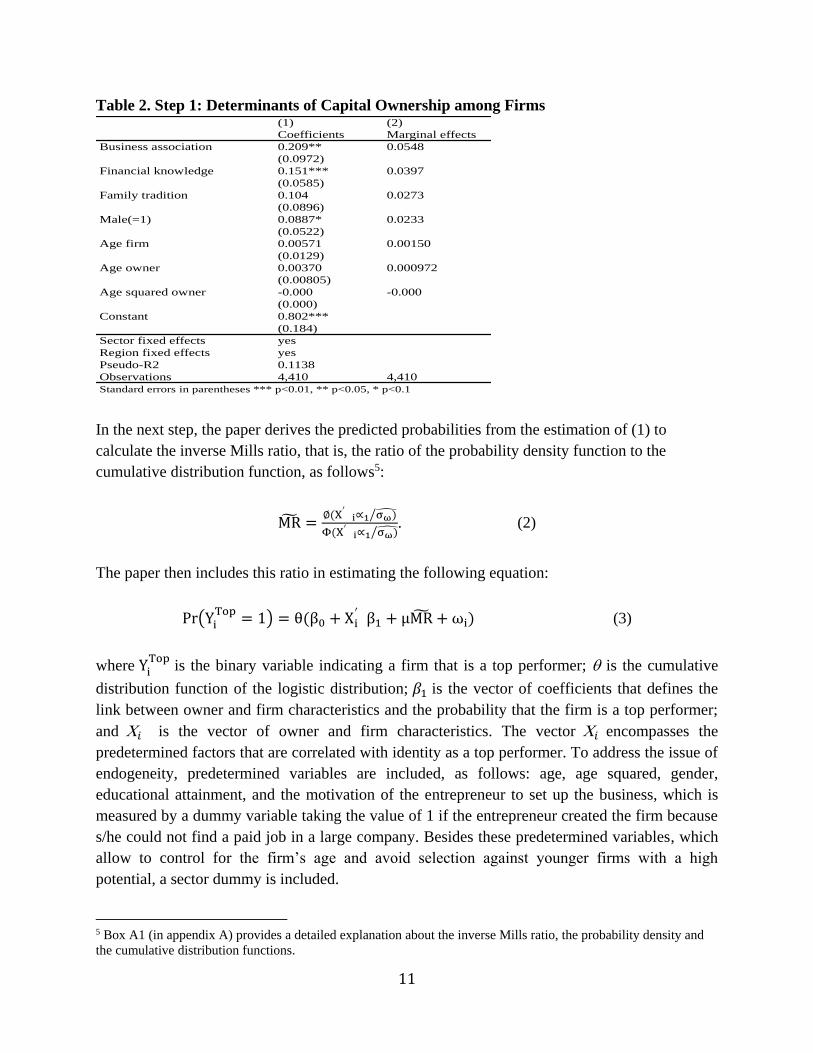
11
Table 2. Step 1: Determinants of Capital Ownership among Firms
In the next step, the paper derives the predicted probabilities from the estimation of (1) to
calculate the inverse Mills ratio, that is, the ratio of the probability density function to the
cumulative distribution function, as follows5:
MR̃ =∅(X′i∝1 σω)̂⁄
Φ(X′i∝1 σω)̂⁄. (2)
The paper then includes this ratio in estimating the following equation:
Pr(YiTop
= 1) = θ(β0 + Xi′β1 + μMR̃ + ωi) (3)
where YiTop
is the binary variable indicating a firm that is a top performer; is the cumulative
distribution function of the logistic distribution; 𝛽1 is the vector of coefficients that defines the
link between owner and firm characteristics and the probability that the firm is a top performer;
and 𝑖 is the vector of owner and firm characteristics. The vector 𝑖 encompasses the
predetermined factors that are correlated with identity as a top performer. To address the issue of
endogeneity, predetermined variables are included, as follows: age, age squared, gender,
educational attainment, and the motivation of the entrepreneur to set up the business, which is
measured by a dummy variable taking the value of 1 if the entrepreneur created the firm because
s/he could not find a paid job in a large company. Besides these predetermined variables, which
allow to control for the firm’s age and avoid selection against younger firms with a high
potential, a sector dummy is included.
5 Box A1 (in appendix A) provides a detailed explanation about the inverse Mills ratio, the probability density and
the cumulative distribution functions.
(1) (2)
Coefficients Marginal effects
Business association 0.209** 0.0548
(0.0972)
Financial knowledge 0.151*** 0.0397
(0.0585)
Family tradition 0.104 0.0273
(0.0896)
Male(=1) 0.0887* 0.0233
(0.0522)
Age firm 0.00571 0.00150
(0.0129)
Age owner 0.00370 0.000972
(0.00805)
Age squared owner -0.000 -0.000
(0.000)
Constant 0.802***
(0.184)
Sector fixed effects yes
Region fixed effects yes
Pseudo-R2 0.1138
Observations 4,410 4,410
Standard errors in parentheses *** p<0.01, ** p<0.05, * p<0.1
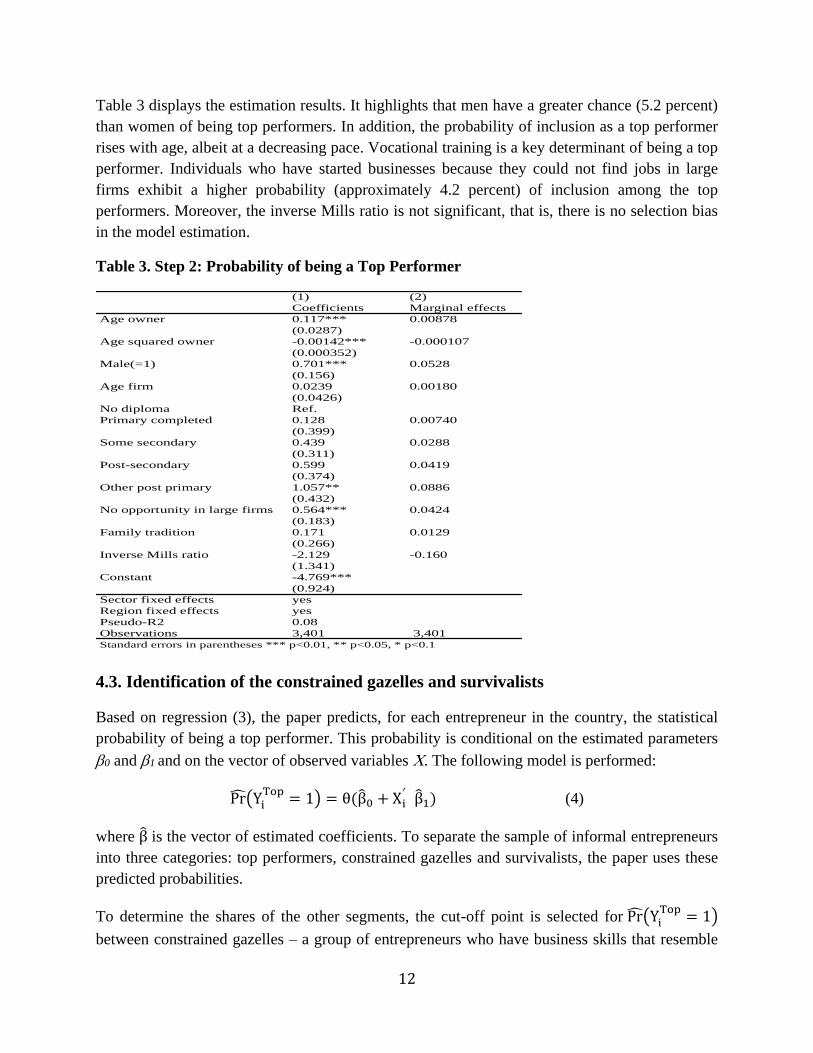
12
Table 3 displays the estimation results. It highlights that men have a greater chance (5.2 percent)
than women of being top performers. In addition, the probability of inclusion as a top performer
rises with age, albeit at a decreasing pace. Vocational training is a key determinant of being a top
performer. Individuals who have started businesses because they could not find jobs in large
firms exhibit a higher probability (approximately 4.2 percent) of inclusion among the top
performers. Moreover, the inverse Mills ratio is not significant, that is, there is no selection bias
in the model estimation.
Table 3. Step 2: Probability of being a Top Performer
4.3. Identification of the constrained gazelles and survivalists
Based on regression (3), the paper predicts, for each entrepreneur in the country, the statistical
probability of being a top performer. This probability is conditional on the estimated parameters
0 and 1 and on the vector of observed variables . The following model is performed:
Pr̂(YiTop
= 1) = θ(β̂0 + Xi′β̂1) (4)
where β̂ is the vector of estimated coefficients. To separate the sample of informal entrepreneurs
into three categories: top performers, constrained gazelles and survivalists, the paper uses these
predicted probabilities.
To determine the shares of the other segments, the cut-off point is selected for Pr̂(YiTop
= 1)
between constrained gazelles – a group of entrepreneurs who have business skills that resemble
(1) (2)
Coefficients Marginal effects
Age owner 0.117*** 0.00878
(0.0287)
Age squared owner -0.00142*** -0.000107
(0.000352)
Male(=1) 0.701*** 0.0528
(0.156)
Age firm 0.0239 0.00180
(0.0426)
No diploma Ref.
Primary completed 0.128 0.00740
(0.399)
Some secondary 0.439 0.0288
(0.311)
Post-secondary 0.599 0.0419
(0.374)
Other post primary 1.057** 0.0886
(0.432)
No opportunity in large firms 0.564*** 0.0424
(0.183)
Family tradition 0.171 0.0129
(0.266)
Inverse Mills ratio -2.129 -0.160
(1.341)
Constant -4.769***
(0.924)
Sector fixed effects yes
Region fixed effects yes
Pseudo-R2 0.08
Observations 3,401 3,401
Standard errors in parentheses *** p<0.01, ** p<0.05, * p<0.1
13
in many respects those of the top performers but are clearly different from those skills
characterizing survivalists – and survivalists such that the mean of this predicted probability is
similar in the group of top performers and the group of constrained gazelles. This suggests that
the distribution of the observable factors is the same in both categories and that on average
constrained gazelles should be as likely as the actual top performers to be top performers. The
survivalists are defined as all entrepreneurs for whom Pr̂(YiTop
= 1) is below the threshold.6
Estimates based on equation (3) illustrate that constrained gazelles and top performers share
some characteristics. Appendix A, table A.5 illustrates the determinants of inclusion among the
three distinct groups of informal firms that have been identified. The results show that firms
managed by men, people who created businesses because they could not find jobs as wage
earners in large firms, more well educated, and older people have a higher probability of being
constrained gazelles. However, these determinants also decrease the probability of being
survivalists.
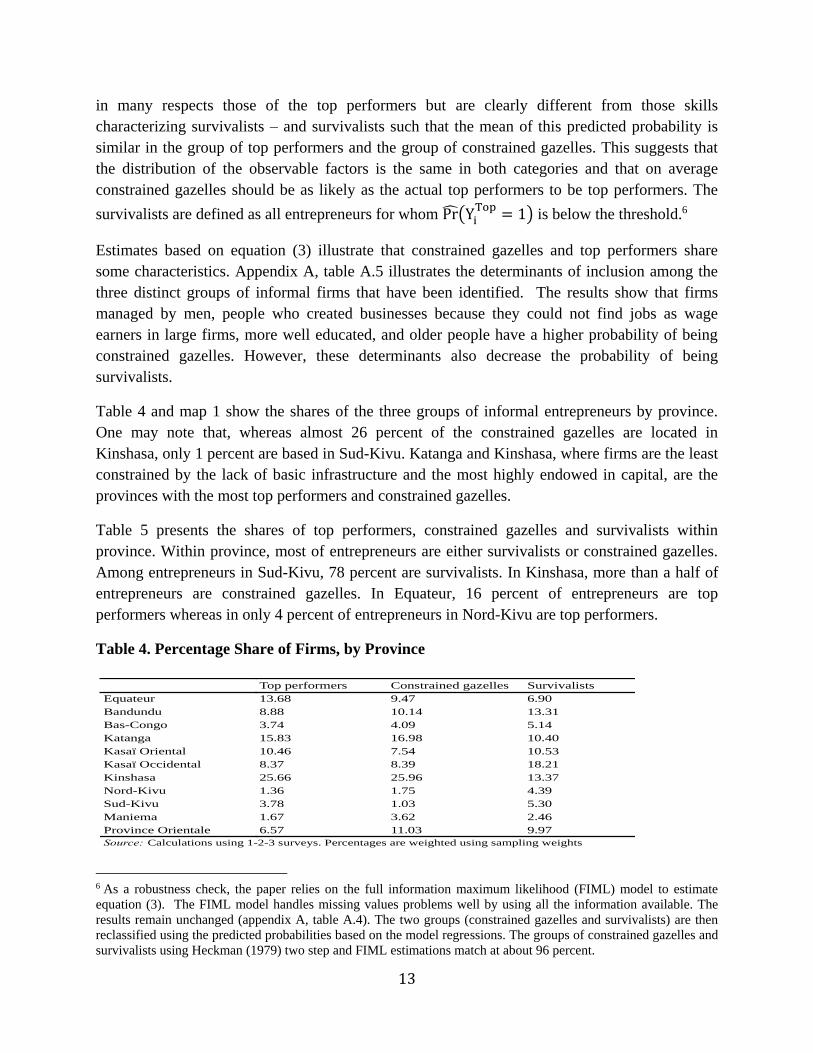
Table 4 and map 1 show the shares of the three groups of informal entrepreneurs by province.
One may note that, whereas almost 26 percent of the constrained gazelles are located in
Kinshasa, only 1 percent are based in Sud-Kivu. Katanga and Kinshasa, where firms are the least
constrained by the lack of basic infrastructure and the most highly endowed in capital, are the
provinces with the most top performers and constrained gazelles.
Table 5 presents the shares of top performers, constrained gazelles and survivalists within
province. Within province, most of entrepreneurs are either survivalists or constrained gazelles.
Among entrepreneurs in Sud-Kivu, 78 percent are survivalists. In Kinshasa, more than a half of
entrepreneurs are constrained gazelles. In Equateur, 16 percent of entrepreneurs are top
performers whereas in only 4 percent of entrepreneurs in Nord-Kivu are top performers.
Table 4. Percentage Share of Firms, by Province
6 As a robustness check, the paper relies on the full information maximum likelihood (FIML) model to estimate
equation (3). The FIML model handles missing values problems well by using all the information available. The
results remain unchanged (appendix A, table A.4). The two groups (constrained gazelles and survivalists) are then
reclassified using the predicted probabilities based on the model regressions. The groups of constrained gazelles and
survivalists using Heckman (1979) two step and FIML estimations match at about 96 percent.
Source: Calculations using 1-2-3 surveys. Percentages are weighted using sampling weights
Sud-Kivu
Maniema
Province Orientale
Kasaï Occidental
Kinshasa
Nord-Kivu
Equateur
Bandundu
Bas-Congo
Katanga
Kasaï Oriental
Top performers Constrained gazelles Survivalists
13.68 9.47 6.90
8.88 10.14 13.31
3.74 4.09 5.14
15.83 16.98 10.40
10.46 7.54 10.53
8.37 8.39 18.21
25.66 25.96 13.37
1.36 1.75 4.39
3.78 1.03 5.30
1.67 3.62 2.46
11.03 9.97
Source: Calculations using 1-2-3 surveys. Percentages are weighted using sampling weights
6.57
14
Map 1. Top Performers, Constrained Gazelles, and Survivalists by Province, 2012 (%)
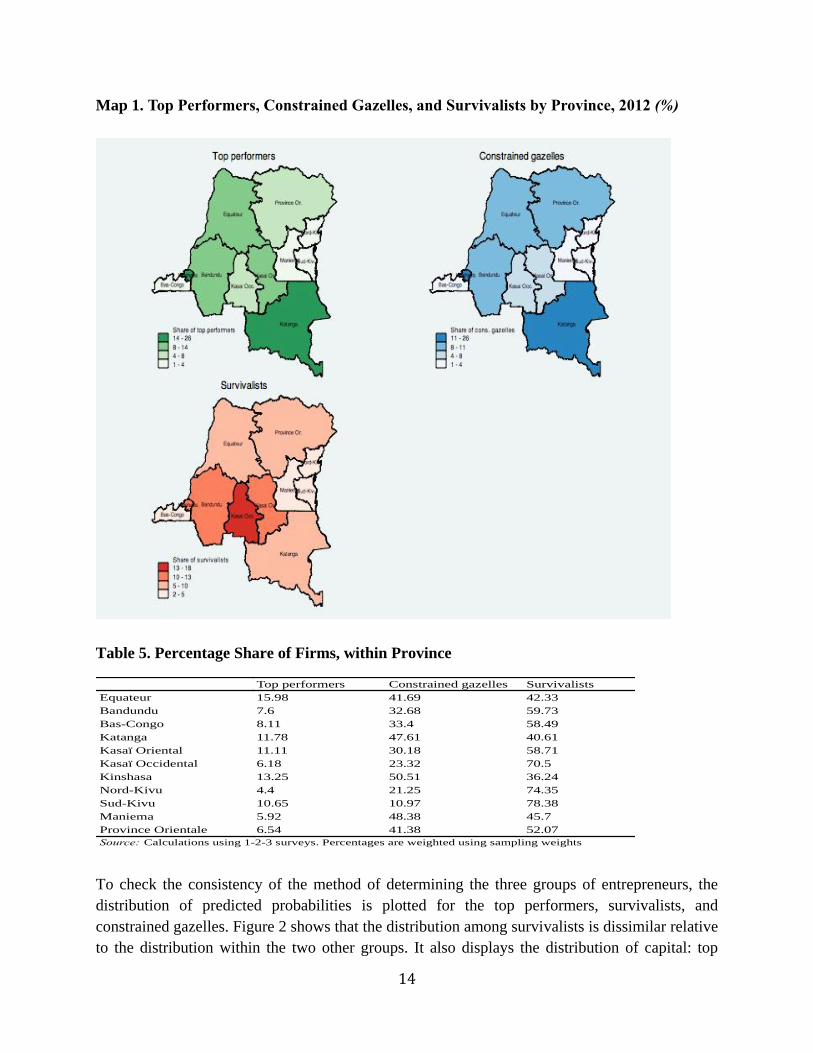
Table 5. Percentage Share of Firms, within Province
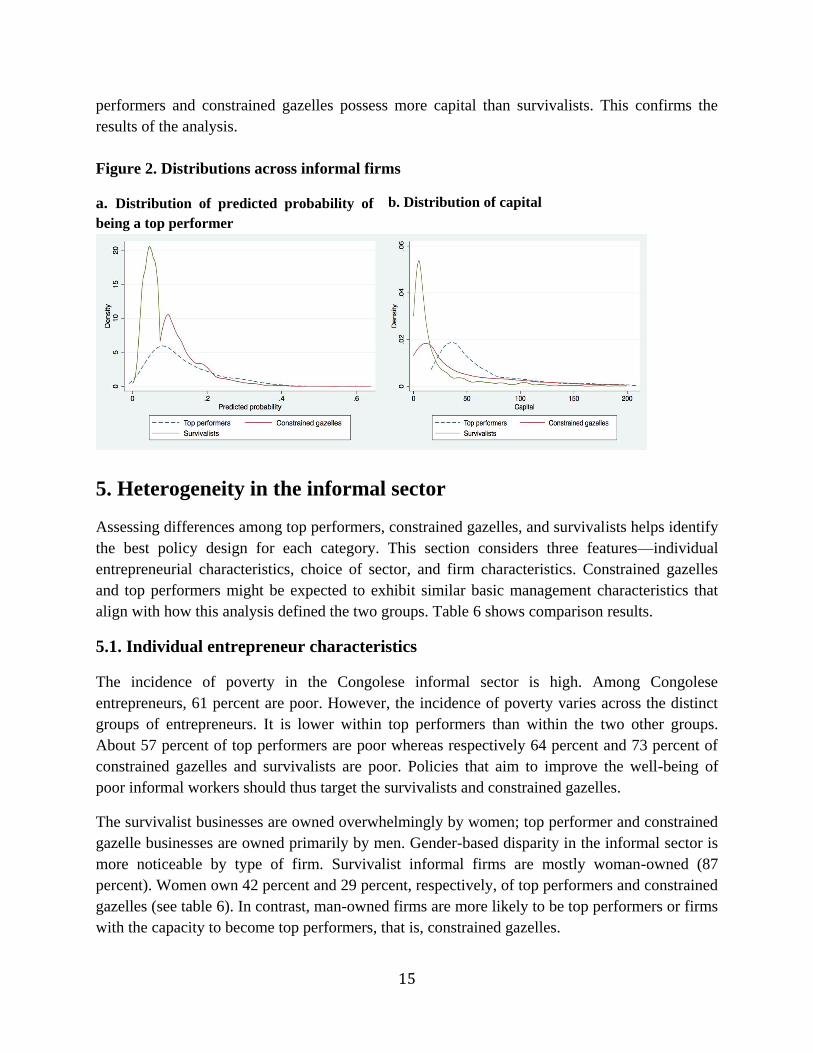
To check the consistency of the method of determining the three groups of entrepreneurs, the
distribution of predicted probabilities is plotted for the top performers, survivalists, and
constrained gazelles. Figure 2 shows that the distribution among survivalists is dissimilar relative
to the distribution within the two other groups. It also displays the distribution of capital: top
Source: Calculations using 1-2-3 surveys. Percentages are weighted using sampling weights
Equateur
Bandundu
Bas-Congo
Katanga
Kasaï Oriental
Province Orientale
Kasaï Occidental
Kinshasa
Nord-Kivu
Sud-Kivu
Maniema
Top performers Constrained gazelles Survivalists
15.98 41.69 42.33
7.6 32.68 59.73
8.11 33.4 58.49
11.78 47.61 40.61
11.11 30.18 58.71
6.18 23.32 70.5
13.25 50.51 36.24
4.4 21.25 74.35
10.65 10.97 78.38
5.92 48.38 45.7
41.38 52.07
Source: Calculations using 1-2-3 surveys. Percentages are weighted using sampling weights
6.54
15
performers and constrained gazelles possess more capital than survivalists. This confirms the
results of the analysis.
Figure 2. Distributions across informal firms
a. Distribution of predicted probability of
being a top performer
b. Distribution of capital
5. Heterogeneity in the informal sector
Assessing differences among top performers, constrained gazelles, and survivalists helps identify
the best policy design for each category. This section considers three features––individual
entrepreneurial characteristics, choice of sector, and firm characteristics. Constrained gazelles
and top performers might be expected to exhibit similar basic management characteristics that
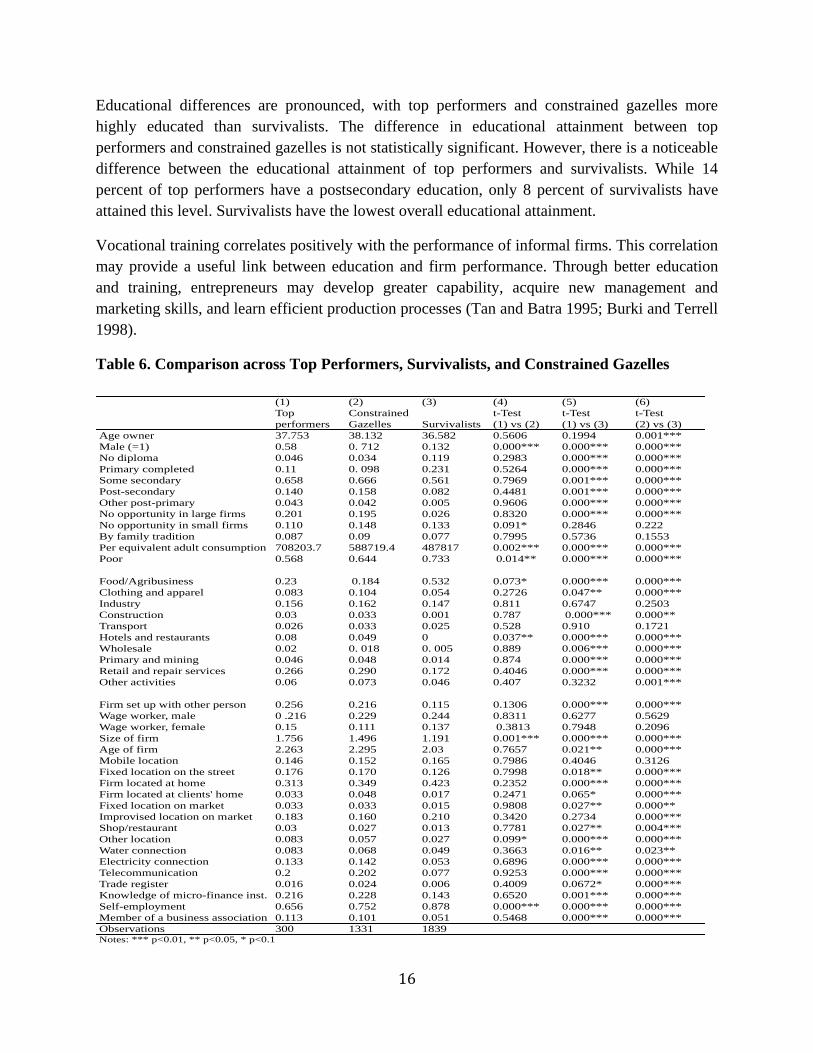
align with how this analysis defined the two groups. Table 6 shows comparison results.
5.1. Individual entrepreneur characteristics
The incidence of poverty in the Congolese informal sector is high. Among Congolese
entrepreneurs, 61 percent are poor. However, the incidence of poverty varies across the distinct
groups of entrepreneurs. It is lower within top performers than within the two other groups.
About 57 percent of top performers are poor whereas respectively 64 percent and 73 percent of
constrained gazelles and survivalists are poor. Policies that aim to improve the well-being of
poor informal workers should thus target the survivalists and constrained gazelles.
The survivalist businesses are owned overwhelmingly by women; top performer and constrained
gazelle businesses are owned primarily by men. Gender-based disparity in the informal sector is
more noticeable by type of firm. Survivalist informal firms are mostly woman-owned (87
percent). Women own 42 percent and 29 percent, respectively, of top performers and constrained
gazelles (see table 6). In contrast, man-owned firms are more likely to be top performers or firms
with the capacity to become top performers, that is, constrained gazelles.
16
Educational differences are pronounced, with top performers and constrained gazelles more
highly educated than survivalists. The difference in educational attainment between top
performers and constrained gazelles is not statistically significant. However, there is a noticeable
difference between the educational attainment of top performers and survivalists. While 14
percent of top performers have a postsecondary education, only 8 percent of survivalists have
attained this level. Survivalists have the lowest overall educational attainment.
Vocational training correlates positively with the performance of informal firms. This correlation
may provide a useful link between education and firm performance. Through better education
and training, entrepreneurs may develop greater capability, acquire new management and
marketing skills, and learn efficient production processes (Tan and Batra 1995; Burki and Terrell
1998).
Table 6. Comparison across Top Performers, Survivalists, and Constrained Gazelles
(1) (2) (3) (4) (5) (6)
Top Constrained t-Test t-Test t-Test
performers Gazelles Survivalists (1) vs (2) (1) vs (3) (2) vs (3)
Age owner 37.753 38.132 36.582 0.5606 0.1994 0.001***
Male (=1) 0.58 0. 712 0.132 0.000*** 0.000*** 0.000***
No diploma 0.046 0.034 0.119 0.2983 0.000*** 0.000***
Primary completed 0.11 0. 098 0.231 0.5264 0.000*** 0.000***
Some secondary 0.658 0.666 0.561 0.7969 0.001*** 0.000***
Post-secondary 0.140 0.158 0.082 0.4481 0.001*** 0.000***
Other post-primary 0.043 0.042 0.005 0.9606 0.000*** 0.000***
No opportunity in large firms 0.201 0.195 0.026 0.8320 0.000*** 0.000***
No opportunity in small firms 0.110 0.148 0.133 0.091* 0.2846 0.222
By family tradition 0.087 0.09 0.077 0.7995 0.5736 0.1553
Per equivalent adult consumption 708203.7 588719.4 487817 0.002*** 0.000*** 0.000***
Poor 0.568 0.644 0.733 0.014** 0.000*** 0.000***
Food/Agribusiness 0.23 0.184 0.532 0.073* 0.000*** 0.000***
Clothing and apparel 0.083 0.104 0.054 0.2726 0.047** 0.000***
Industry 0.156 0.162 0.147 0.811 0.6747 0.2503
Construction 0.03 0.033 0.001 0.787 0.000*** 0.000**
Transport 0.026 0.033 0.025 0.528 0.910 0.1721
Hotels and restaurants 0.08 0.049 0 0.037** 0.000*** 0.000***
Wholesale 0.02 0. 018 0. 005 0.889 0.006*** 0.000***
Primary and mining 0.046 0.048 0.014 0.874 0.000*** 0.000***
Retail and repair services 0.266 0.290 0.172 0.4046 0.000*** 0.000***
Other activities 0.06 0.073 0.046 0.407 0.3232 0.001***
Firm set up with other person 0.256 0.216 0.115 0.1306 0.000*** 0.000***
Wage worker, male 0 .216 0.229 0.244 0.8311 0.6277 0.5629
Wage worker, female 0.15 0.111 0.137 0.3813 0.7948 0.2096
Size of firm 1.756 1.496 1.191 0.001*** 0.000*** 0.000***
Age of firm 2.263 2.295 2.03 0.7657 0.021** 0.000***
Mobile location 0.146 0.152 0.165 0.7986 0.4046 0.3126
Fixed location on the street 0.176 0.170 0.126 0.7998 0.018** 0.000***
Firm located at home 0.313 0.349 0.423 0.2352 0.000*** 0.000***
Firm located at clients' home 0.033 0.048 0.017 0.2471 0.065* 0.000***
Fixed location on market 0.033 0.033 0.015 0.9808 0.027** 0.000**
Improvised location on market 0.183 0.160 0.210 0.3420 0.2734 0.000***
Shop/restaurant 0.03 0.027 0.013 0.7781 0.027** 0.004***
Other location 0.083 0.057 0.027 0.099* 0.000*** 0.000***
Water connection 0.083 0.068 0.049 0.3663 0.016** 0.023**
Electricity connection 0.133 0.142 0.053 0.6896 0.000*** 0.000***
Telecommunication 0.2 0.202 0.077 0.9253 0.000*** 0.000***
Trade register 0.016 0.024 0.006 0.4009 0.0672* 0.000***
Knowledge of micro-finance inst. 0.216 0.228 0.143 0.6520 0.001*** 0.000***
Self-employment 0.656 0.752 0.878 0.000*** 0.000*** 0.000***
Member of a business association 0.113 0.101 0.051 0.5468 0.000*** 0.000***
Observations 300 1331 1839Notes: *** p<0.01, ** p<0.05, * p<0.1
17
5.2. Firm typology and the choice of sector
More than 50 percent of survivalists are engaged in food trade and agribusiness compared with
only 23 percent of top performers and 18.4 percent of constrained gazelles. This sector
comprises for instance retail trades of palm oil, tomatoes and other agricultural products. The
primary sector of top performers and constrained gazelles (26.6 percent and 29.0 percent,
respectively) is repair services and the retail trade, which includes retail trade in coal, fuel, and
kitchen appliances and the repair of bicycles, motorcycles, and household items. Our results are
similar to those of Gindling and Newhouse (2014). Their results show that the successful self-
employed are more likely to operate in retail and services compared to unsuccessful self-
employed.
Top-performing firms are generally larger than constrained gazelles and survivalists. Top
performing firms are approximately 20 percent larger than constrained gazelles and almost 50
percent larger than survivalist firms. Firm size is measured as the total number of paid and non-
paid workers.
Setting up an informal firm with more than one owner may reduce credit market constraints.
Enterprises with multiple owners are more likely to be top performers or constrained gazelles.
About 20 percent of the top performers have founded their businesses as joint ventures. Only 11
percent of survivalists are joint ventures.
Constrained gazelles are generally older than both top performers and survivalists, and
survivalists are, on average, the youngest of the three groups. This age dimension may reflect
accumulated business experience. Firms may also experience both positive and negative shocks
during their existence. The learning-by-doing channel enables firms to learn and to perform
better as they age, making them more likely to survive (Baker and Kennedy 2002). However,
older firms in developing countries may suffer from productivity losses, for example, if their
owners become too old to adopt new technologies (Burki and Terrell 1998; Nichter and
Goldmark 2009).
Top performers and constrained gazelles tend to operate from fixed locations (streets, markets,
shops), while survivalists tend to operate from home and mobile selling points. The transitory
locations of survivalists may explain the greater constraints the survivalists face in taking
advantage of basic infrastructure.
Survivalists possess less financial knowledge, are less likely to register their businesses, and are
less likely to be involved in a business association than either of the other two groups. Top
performers and constrained gazelles are not significantly different in these characteristics. This
highlights that top performers and constrained gazelles share similar management skills and
professional networks.
18
6. Urban poverty and income inequality in the informal sector
Poverty and income inequality are particularly significant in the informal sector. This section
examines these two issues among the three distinct groups of informal firms.
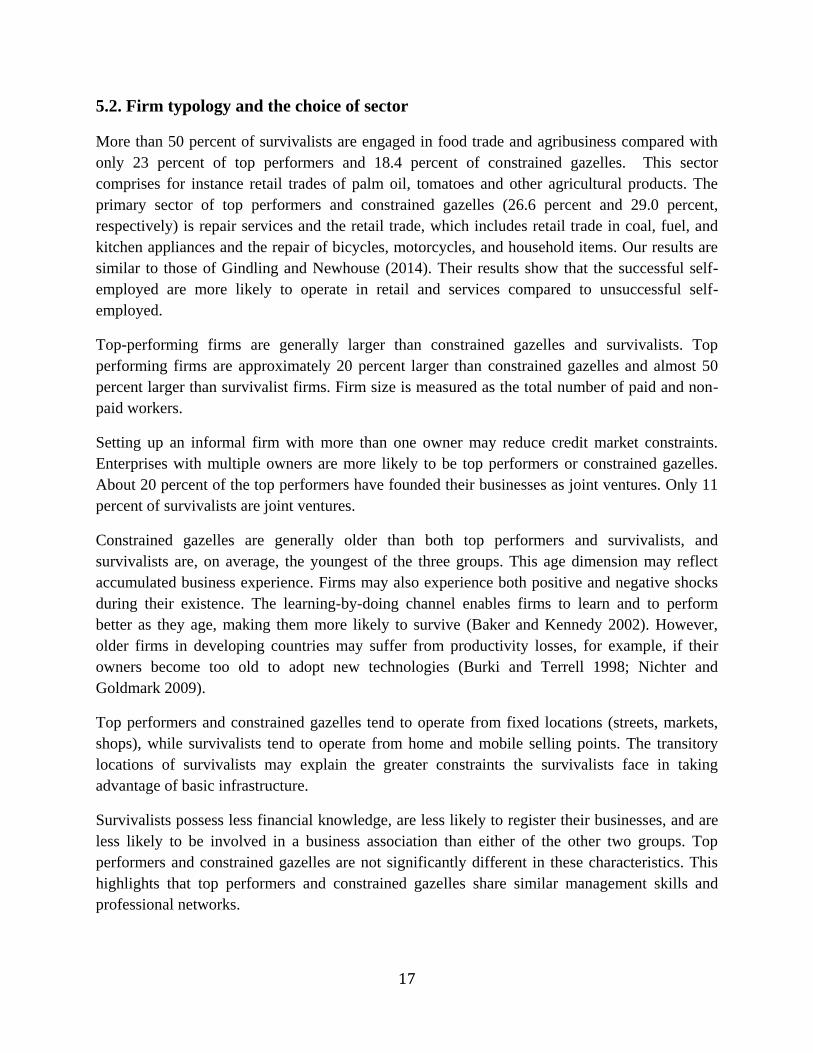
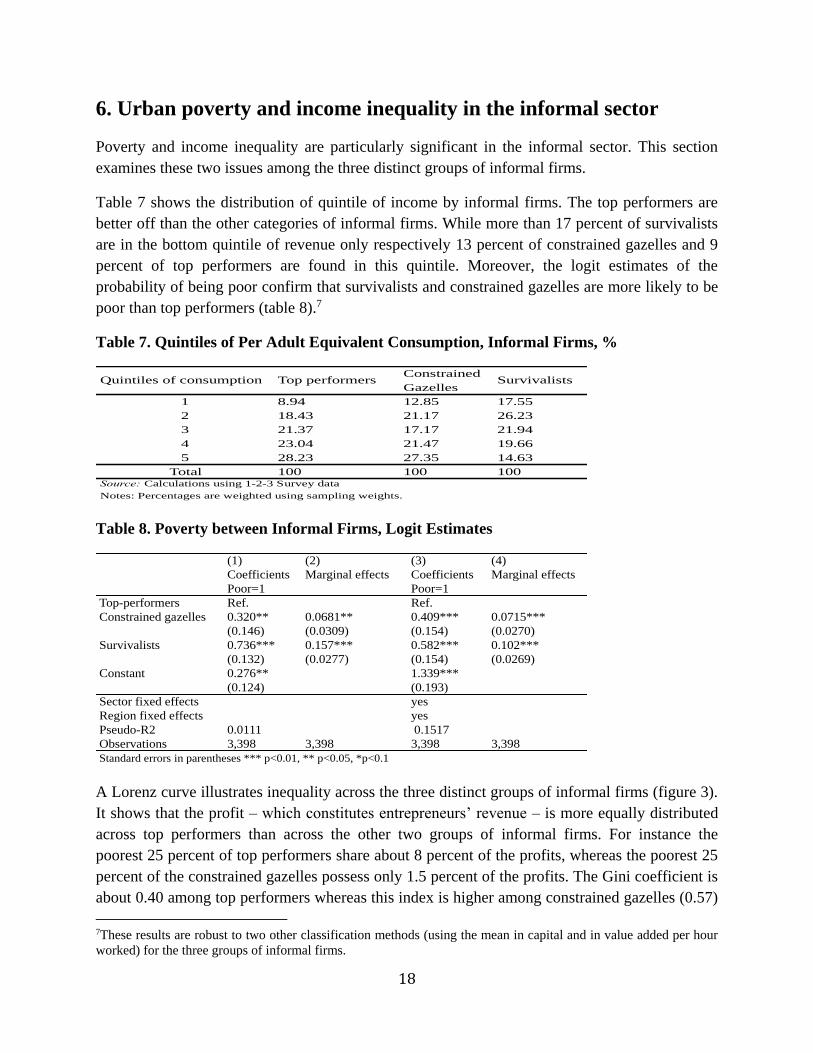
Table 7 shows the distribution of quintile of income by informal firms. The top performers are
better off than the other categories of informal firms. While more than 17 percent of survivalists
are in the bottom quintile of revenue only respectively 13 percent of constrained gazelles and 9
percent of top performers are found in this quintile. Moreover, the logit estimates of the
probability of being poor confirm that survivalists and constrained gazelles are more likely to be
poor than top performers (table 8).7
Table 7. Quintiles of Per Adult Equivalent Consumption, Informal Firms, %
Table 8. Poverty between Informal Firms, Logit Estimates
A Lorenz curve illustrates inequality across the three distinct groups of informal firms (figure 3).
It shows that the profit – which constitutes entrepreneurs’ revenue – is more equally distributed
across top performers than across the other two groups of informal firms. For instance the
poorest 25 percent of top performers share about 8 percent of the profits, whereas the poorest 25
percent of the constrained gazelles possess only 1.5 percent of the profits. The Gini coefficient is
about 0.40 among top performers whereas this index is higher among constrained gazelles (0.57)
7These results are robust to two other classification methods (using the mean in capital and in value added per hour
worked) for the three groups of informal firms.
Constrained
Gazelles
1 8.94 12.85 17.55
2 18.43 21.17 26.23
3 21.37 17.17 21.94
4 23.04 21.47 19.66
5 28.23 27.35 14.63
Total 100 100 100Source: Calculations using 1-2-3 Survey data
Notes: Percentages are weighted using sampling weights.
Quintiles of consumption Top performers Survivalists
(1) (2) (3) (4)
Coefficients Marginal effects Coefficients Marginal effects
Poor=1 Poor=1
Top-performers Ref. Ref.
Constrained gazelles 0.320** 0.0681** 0.409*** 0.0715***
(0.146) (0.0309) (0.154) (0.0270)
Survivalists 0.736*** 0.157*** 0.582*** 0.102***
(0.132) (0.0277) (0.154) (0.0269)
Constant 0.276** 1.339***
(0.124) (0.193)
Sector fixed effects yes
Region fixed effects yes
Pseudo-R2 0.0111 0.1517
Observations 3,398 3,398 3,398 3,398
Standard errors in parentheses *** p<0.01, ** p<0.05, *p<0.1
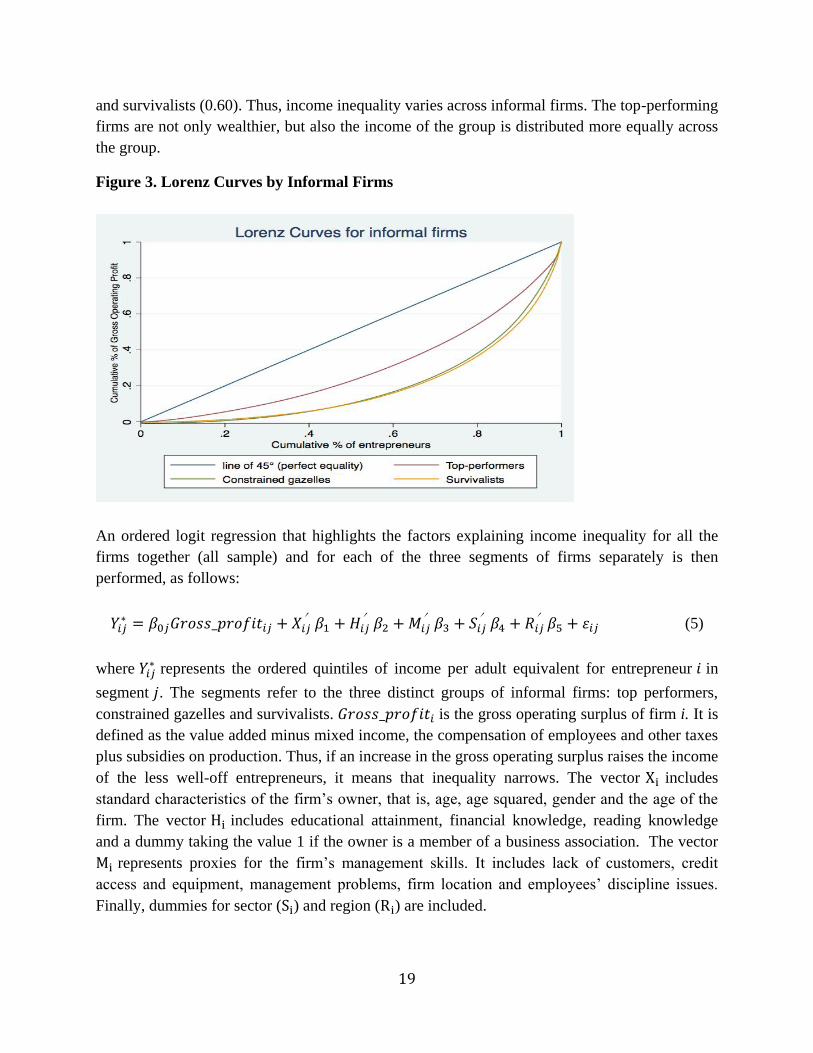
19
and survivalists (0.60). Thus, income inequality varies across informal firms. The top-performing
firms are not only wealthier, but also the income of the group is distributed more equally across
the group.
Figure 3. Lorenz Curves by Informal Firms
An ordered logit regression that highlights the factors explaining income inequality for all the
firms together (all sample) and for each of the three segments of firms separately is then
performed, as follows:
𝑌𝑖𝑗∗ = 𝛽0𝑗𝐺𝑟𝑜𝑠𝑠_𝑝𝑟𝑜𝑓𝑖𝑡𝑖𝑗 + 𝑋𝑖𝑗
′𝛽1 + 𝐻𝑖𝑗′𝛽2 + 𝑀𝑖𝑗
′𝛽3 + 𝑆𝑖𝑗′𝛽4 + 𝑅𝑖𝑗
′𝛽5 + 𝜀𝑖𝑗 (5)
where 𝑌𝑖𝑗∗ represents the ordered quintiles of income per adult equivalent for entrepreneur 𝑖 in
segment 𝑗. The segments refer to the three distinct groups of informal firms: top performers,
constrained gazelles and survivalists. 𝐺𝑟𝑜𝑠𝑠_𝑝𝑟𝑜𝑓𝑖𝑡𝑖 is the gross operating surplus of firm i. It is
defined as the value added minus mixed income, the compensation of employees and other taxes
plus subsidies on production. Thus, if an increase in the gross operating surplus raises the income
of the less well-off entrepreneurs, it means that inequality narrows. The vector Xi includes
standard characteristics of the firm’s owner, that is, age, age squared, gender and the age of the
firm. The vector Hi includes educational attainment, financial knowledge, reading knowledge
and a dummy taking the value 1 if the owner is a member of a business association. The vector
Mi represents proxies for the firm’s management skills. It includes lack of customers, credit
access and equipment, management problems, firm location and employees’ discipline issues.
Finally, dummies for sector (Si) and region (Ri) are included.
20
Table A.6 (in appendix A) displays the estimates of regression (5). The results show that for an
increase of CGF 1,000 in the gross operating surplus, the odds of being in the top quintile versus
the (combined) other categories are 1.001 times (or 10 percent) greater (all sample). This means
that there is inequality among the informal entrepreneurs. An increase in profits is more likely to
positively impact the income of the richest entrepreneurs than the others’ incomes. When
considering each category of firms, the constrained gazelles and survivalists show the same
pattern. However, among the top performers there is an equal chance of being in the top quintile
of income, even if the estimated coefficient is not significant.
Human capital, including educational attainment and the ability to read in any language is a key
factor, that is, it increases the probability of being in the top quintile for all types of informal
firms. Still, the impact of postsecondary educational attainment among top performers is the
greatest. Attainment of other post-primary education, including vocational training, increases the
odds of being in the top income quintile among constrained gazelles, though this is not the case
for the two other groups. Moreover, firms with less access to credit are less likely to be in the top
income quintile. Because of a lack of credit access, top performers, constrained gazelles, and
survivalists are less likely to be among the richest 20 percent. The impact of the lack of credit
access on income inequality is greater among constrained gazelles and survivalists (see table
A.6).
Firm size and the income of the owners appear to be independent among top performers and
survivalists. However, among constrained gazelles, there is a significant negative relationship
between firm size and the probability of being in the highest income quintile. Regarding the
factors underlying firm organization, firms constrained by credit access are less likely to be in
the top income quintile.
These results highlight that pro-poor policies aimed at improving education and providing access
to finance are the most favorable to increasing income among the poorest among informal firms.
The results of inequality regressions are robust to two other classification methods of the three
groups of informal firms and to two other definitions of top performers. First, the groups of top
performers and constrained gazelles are reclassified based on the median value of capital
(appendix A, table A.7). This gives 690 top performers and 941 constrained gazelles. Second, the
top performers are redefined as those entrepreneurs in the top 10 percent of the distribution of
value added per hour worked (appendix A, table A.8). The paper also tests whether the
classification changes according to the definition of a top performer. First, top performers are
defined as those entrepreneurs in the sample who are in the top 40 percent in terms of capital
productivity among the top 40 percent of the capital distribution. Second, the paper defines top
performers as those entrepreneurs in the sample who are in the top 40 percent in terms of capital
productivity among the top 50 percent of the capital distribution. Then, the paper classifies the
21
two other groups, the constrained gazelles and survivalists. Appendix A, tables A.9 and A.10
present the results.8
7. Drivers of the performance of informal firms
In the previous section, poverty and income inequality are analyzed among informal firms. The
findings show that policies aimed at reducing the performance gap between top performers and
the two other groups, namely, constrained gazelles and survivalists, may also help lift
entrepreneurs in the latter two groups out of poverty and reduce income inequality.
This section first corroborates these results based on a Blinder-Oaxaca decomposition and then
examines the factors that make one informal firm more successful than another.
The Blinder-Oaxaca decomposition (Blinder, 1973; Oaxaca, 1973) explains the gap in the means
of an outcome variable—the logarithm of per adult equivalent revenue in this case—between
two groups. This paper compares top performers with constrained gazelles and top performers
with survivalists. It uses the Blinder-Oaxaca to decompose income differences into a part that is
due to differences between the two groups in endowments or characteristics (explained
component), on the one hand, and group differences in returns to those endowments
(unexplained component), on the other.
The formalization of income differences is as follows:
𝑙𝑛𝐼𝑛𝑐𝑜𝑚𝑒𝑇𝑡 − 𝑙𝑛𝐼𝑛𝑐𝑜𝑚𝑒𝑖𝑡 = (𝑋𝑇𝑡 − 𝑋𝑖𝑡)𝛽𝑇𝑡 + (𝛽𝑇𝑡 − 𝛽𝑖𝑡)𝑋𝑖𝑡 (6)
𝑖 ∈ {𝐶𝑜𝑛𝑠𝑡𝑟𝑎𝑖𝑛𝑒𝑑 𝑔𝑎𝑧𝑒𝑙𝑙𝑒𝑠, 𝑆𝑢𝑟𝑣𝑖𝑣𝑎𝑙𝑖𝑠𝑡𝑠}
where 𝑙𝑛𝐼𝑛𝑐𝑜𝑚𝑒𝑇𝑡 and 𝑙𝑛𝐼𝑛𝑐𝑜𝑚𝑒𝑖𝑡 represent the mean of the logarithm of per adult equivalent
income for respectively top performers and constrained gazelles or survivalists in time t. 𝑋 is the
vector of control characteristics for individuals. The first term is the explained component, and
the second term represents the unexplained component as described above.
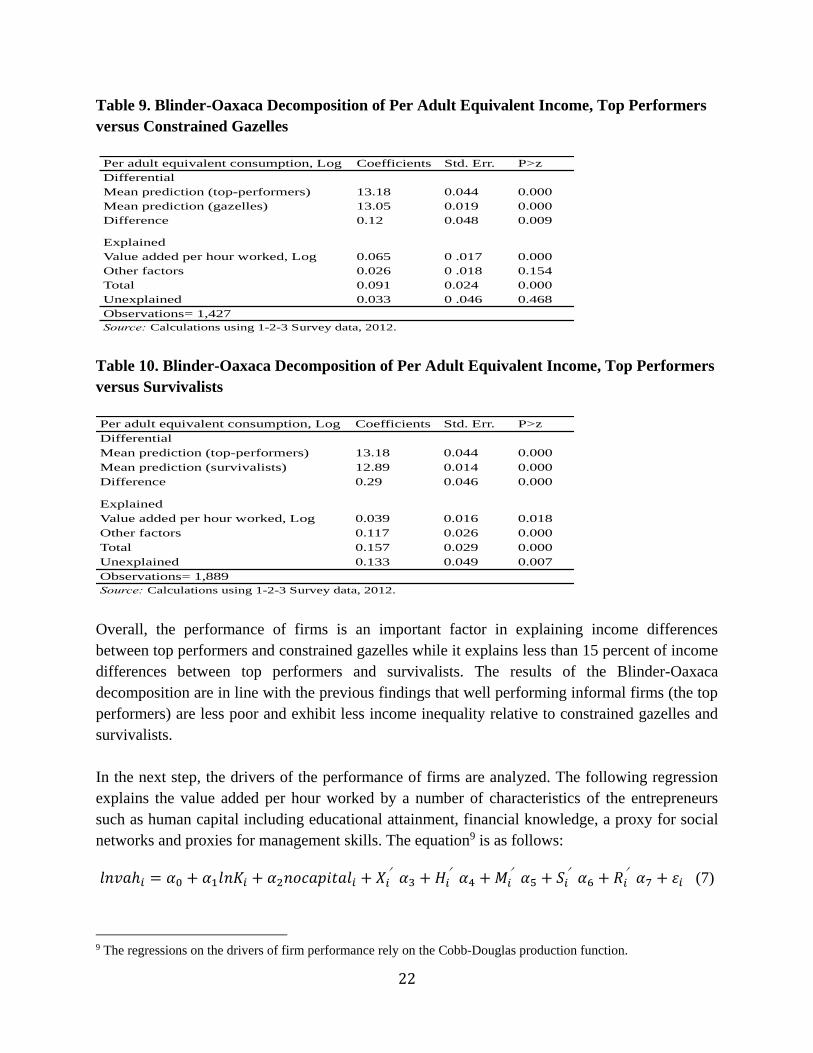
Tables 9 and 10 display the results. We observe that differences in firms’ performance explain
more than half a percent of the revenue gap between top performers and constrained gazelles.
Differences in other factors including the individual characteristics of entrepreneurs such as age
and human capital, and other managerial characteristics such as management and employee
discipline issues, explain more than 20 percent of the revenue gap even though the coefficient is
not significant. Nonetheless more than 25 percent of the gap remains unexplained.
8 We performed an endogeneity test to assess the potential endogeneity of our profit variable (gross operating
surplus). Using the sector-region average of value added per hour worked as an instrument for gross operating profit,
the test did not find evidence of endogeneity.
22
Table 9. Blinder-Oaxaca Decomposition of Per Adult Equivalent Income, Top Performers
versus Constrained Gazelles
Table 10. Blinder-Oaxaca Decomposition of Per Adult Equivalent Income, Top Performers
versus Survivalists
Overall, the performance of firms is an important factor in explaining income differences
between top performers and constrained gazelles while it explains less than 15 percent of income
differences between top performers and survivalists. The results of the Blinder-Oaxaca
decomposition are in line with the previous findings that well performing informal firms (the top
performers) are less poor and exhibit less income inequality relative to constrained gazelles and
survivalists.
In the next step, the drivers of the performance of firms are analyzed. The following regression
explains the value added per hour worked by a number of characteristics of the entrepreneurs
such as human capital including educational attainment, financial knowledge, a proxy for social
networks and proxies for management skills. The equation9 is as follows:
𝑙𝑛𝑣𝑎ℎ𝑖 = 𝛼0 + 𝛼1𝑙𝑛𝐾𝑖 + 𝛼2𝑛𝑜𝑐𝑎𝑝𝑖𝑡𝑎𝑙𝑖 + 𝑋𝑖′𝛼3 + 𝐻𝑖
′𝛼4 + 𝑀𝑖′𝛼5 + 𝑆𝑖
′𝛼6 + 𝑅𝑖′𝛼7 + 𝜀𝑖 (7)
9 The regressions on the drivers of firm performance rely on the Cobb-Douglas production function.
Per adult equivalent consumption, Log Coefficients Std. Err. P>z
Differential
Mean prediction (top-performers) 13.18 0.044 0.000
Mean prediction (gazelles) 13.05 0.019 0.000
Difference 0.12 0.048 0.009
Explained
Value added per hour worked, Log 0.065 0 .017 0.000
Other factors 0.026 0 .018 0.154
Total 0.091 0.024 0.000
Unexplained 0.033 0 .046 0.468
Observations= 1,427
Source: Calculations using 1-2-3 Survey data, 2012.
Per adult equivalent consumption, Log Coefficients Std. Err. P>z
Differential
Mean prediction (top-performers) 13.18 0.044 0.000
Mean prediction (survivalists) 12.89 0.014 0.000
Difference 0.29 0.046 0.000
Explained
Value added per hour worked, Log 0.039 0.016 0.018
Other factors 0.117 0.026 0.000
Total 0.157 0.029 0.000
Unexplained 0.133 0.049 0.007
Observations= 1,889
Source: Calculations using 1-2-3 Survey data, 2012.
23
where the explained variable 𝑙𝑛𝑣𝑎ℎ𝑖 is the log of the ratio of value added with the total hours
worked in firm i. 𝑙𝑛𝐾𝑖 stands for the log of physical capital. Given that in our sample some firms
do not possess any capital, a dummy variable 𝑛𝑜𝑐𝑎𝑝𝑖𝑡𝑎𝑙𝑖 that equals 1 when the firm has no
capital is also introduced. This allows us to avoid obtaining unbiased estimates of the returns to
capital when some firms have zero observations of capital (Battese 1997; Grimm, Knorringa, and
Lay 2012). The vector Xi includes standard characteristics of the firm’s owner, (age squared,
gender and the age of the firm). The vector Hi includes educational attainment, financial
knowledge, reading knowledge and a dummy taking the value 1 if the owner is member of a
business association. The vector Mi includes proxies for firm’s management skills such as lack of
customers, lack of credit access, management issues, employees’ discipline problems, and
problems of location and lack of equipment. The equation also includes sector dummies Si and
region fixed effects Ri.
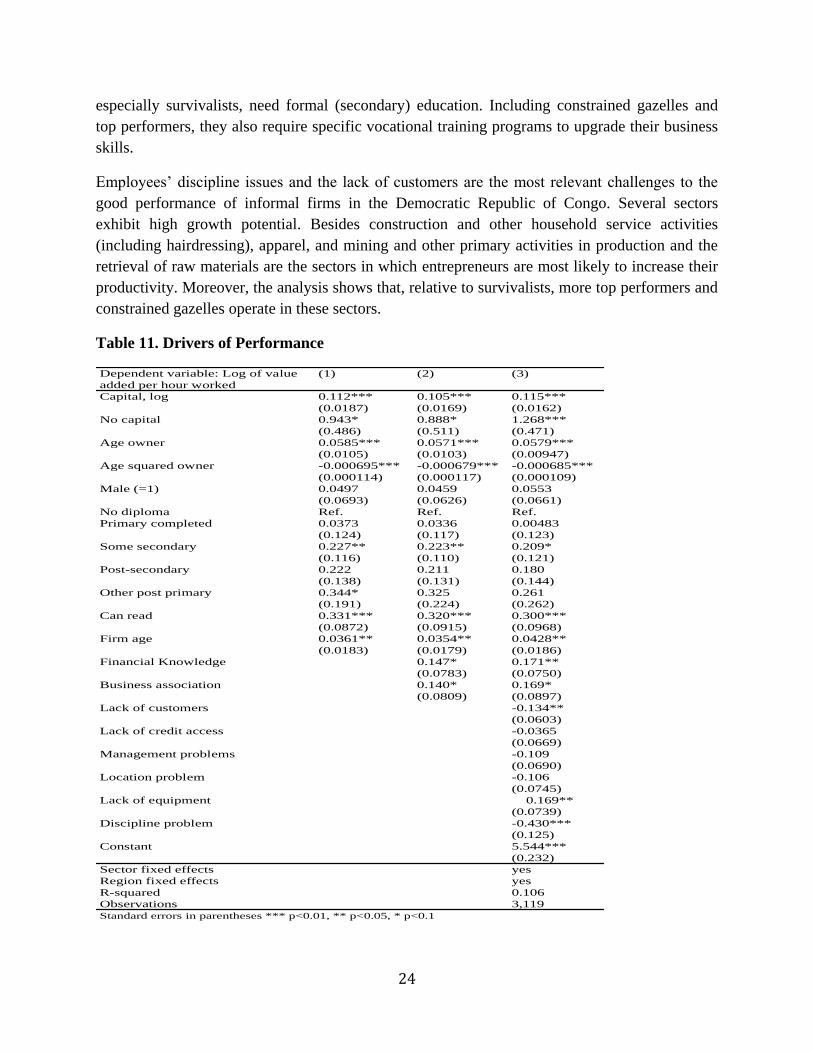
Equation (7) explains the performance drivers of the three groups of firms. Appendix A, figure
A.7 shows that the higher a firm’s value added per hour worked, the better the firm performs.
The results are displayed in table 11. The first column shows the results when we estimate
equation (7) with only some basic characteristics of the firm’s owner, including education. The
second column includes the variables estimated by vectors 𝑋𝑖 and 𝐻𝑖 . And the third column
displays the results if one estimates the equation with all the variables.
The estimated capital elasticity is about 0.115 (column 3). This elasticity is lower than the capital
elasticity (0.150) found using the 1-2-3 survey for seven Sub-Saharan African countries in the
paper of Grimm, Knorringa and Lay (2012). The results show that the older the firm’s owner, the
better is the firm’s, but at a narrowing rate. Human capital, including secondary educational
attainment, vocational training, and reading knowledge, is significantly and positively correlated
with the performance of a firm. For instance, some other post-primary educational attainment,
such as vocational training, raises the performance of firms by around 41 percent (column 1).
Membership in a business association is another important factor in the success of firms. The
availability of a professional network seems to be a key advantage that can help entrepreneurs
gain access to resources such as information and credit.10
However, there is no clear gender effect. The estimated coefficient is positive, but not
significant. All the coefficients associated with the factors used as proxies for management skills
have the expected signs except the variable for the lack of equipment, which may not be a great
problem for those entrepreneurs providing services such as hairdressers or luggage carriers. In
any case, building performance-enhancing skills is always central to enhancing productivity and
reducing inequality and poverty among informal firms. Entrepreneurs in the informal sector,
10 The lack of credit access is not significant (table 11, column 3). Regressions include another financial variable –
which is not subject to endogeneity. While we are concerned about the potential reverse causality between access to
credit and performance of firms, this paper does not discuss the literature analyzing the link between financial
development and economic growth and bi-directional causality.
24
especially survivalists, need formal (secondary) education. Including constrained gazelles and
top performers, they also require specific vocational training programs to upgrade their business
skills.
Employees’ discipline issues and the lack of customers are the most relevant challenges to the
good performance of informal firms in the Democratic Republic of Congo. Several sectors
exhibit high growth potential. Besides construction and other household service activities
(including hairdressing), apparel, and mining and other primary activities in production and the
retrieval of raw materials are the sectors in which entrepreneurs are most likely to increase their
productivity. Moreover, the analysis shows that, relative to survivalists, more top performers and
constrained gazelles operate in these sectors.
Table 11. Drivers of Performance
Dependent variable: Log of value (1) (2) (3)
added per hour worked
Capital, log 0.112*** 0.105*** 0.115***
(0.0187) (0.0169) (0.0162)
No capital 0.943* 0.888* 1.268***
(0.486) (0.511) (0.471)
Age owner 0.0585*** 0.0571*** 0.0579***
(0.0105) (0.0103) (0.00947)
Age squared owner -0.000695*** -0.000679*** -0.000685***
(0.000114) (0.000117) (0.000109)
Male (=1) 0.0497 0.0459 0.0553
(0.0693) (0.0626) (0.0661)
No diploma Ref. Ref. Ref.
Primary completed 0.0373 0.0336 0.00483
(0.124) (0.117) (0.123)
Some secondary 0.227** 0.223** 0.209*
(0.116) (0.110) (0.121)
Post-secondary 0.222 0.211 0.180
(0.138) (0.131) (0.144)
Other post primary 0.344* 0.325 0.261
(0.191) (0.224) (0.262)
Can read 0.331*** 0.320*** 0.300***
(0.0872) (0.0915) (0.0968)
Firm age 0.0361** 0.0354** 0.0428**
(0.0183) (0.0179) (0.0186)
Financial Knowledge 0.147* 0.171**
(0.0783) (0.0750)
Business association 0.140* 0.169*
(0.0809) (0.0897)
Lack of customers -0.134**
(0.0603)
Lack of credit access -0.0365
(0.0669)
Management problems -0.109
(0.0690)
Location problem -0.106
(0.0745)
Lack of equipment 0.169**
(0.0739)
Discipline problem -0.430***
(0.125)
Constant 5.544***
(0.232)
Sector fixed effects yes
Region fixed effects yes
R-squared 0.106
Observations 3,119
Standard errors in parentheses *** p<0.01, ** p<0.05, * p<0.1
25
These results are robust to three other measures of firm performance, namely, value added per
worker, labor productivity and real labor productivity.11
The logarithm of total hours of labor is included in the regressions as an additional explanatory
variable. We observe that the more are the hours worked in a firm, the better this firm performs
(appendix A, table A.11).
Additionally, simple simulations indicate that a number of characteristics, including human
capital and managerial skills, could improve the performance of informal firms. The simulation
relies on ordinary least squares (OLS) estimates to show how the performance of constrained
gazelles and survivalists would improve if these firms shared the same environment with top
performers. The findings reveal that the performance of constrained gazelles (value added per
hour worked) would be enhanced by approximately 5 percent if the entrepreneurs in these firms
had the same or similar educational attainment, financial knowledge, business networks, and
managerial abilities as top performers. Similarly, given backgrounds and preparation resembling
those of the top performers, the performance of survivalists would improve by 26 percent.
Simulations also indicate that human capital—especially vocational training (post-primary
education)—is an important factor in the performance of firms (appendix A, figure A.8). Policies
aimed at enrolling all top performers and constrained gazelles in vocational training could
enhance their performance by 33 percent. Among survivalists, these policies could improve
performance by 34 percent. The impacts of secondary education and reading knowledge on the
performance of firms are not as strong. For instance, if all survivalists had access to secondary
education, their performance would increase by 10 percent.
Additional factors have important effects on the success of firms. Discipline problems have a
relatively greater impact on the performance of survivalists, which thereby decreases by 41
percent, than of top performers and constrained gazelles (approximately 39 percent). Likewise,
wider access to financial knowledge and business associations could improve the performance of
firms, but the impact is slightly stronger among survivalists.
8. Conclusion and Policy Recommendations
The informal sector accounts for an important share of the economic activities in Sub-Saharan
Africa. The literature on the informal sector has focused mainly on explaining the causes of the
emergence and productivity of informal firms and on ways to formalize the informal sector.
Using 1-2-3 survey data on the Democratic Republic of Congo, this paper contributes to the
empirical literature in four main areas. First, following Grimm, Knorringa, and Lay (2012), the
11 Labor productivity is the ratio of production to the number of workers. Real labor productivity is the ratio of
turnover to the number of workers.
26
paper identifies a third category of informal firms in the country, constrained gazelles, who are
neither top performers nor survivalists, and assesses the heterogeneity across these three
classifications of firms. Constrained gazelles show substantial potential to become top
performers, but are constrained by their external environment (lack of water, electricity,
telecommunication infrastructure, and finance). Second, the paper examines poverty and income
inequality within these three distinct categories of firms. Third, using a Blinder-Oaxaca
decomposition, it explains income differences across the three groups. Fourth, the paper analyzes
the drivers of performance and profitability among informal firms.
The paper underlines that poverty and income inequality are more prevalent among constrained
gazelles and survivalists than among top performers. Income inequality among informal firms is
explained primarily by disparities in educational attainment and infrastructure, including the lack
of access to credit. Vocational training raises the odds of being in the top quintile among
constrained gazelles. Access to finance, including financial knowledge and access to credit, is a
more important factor among constrained gazelles and survivalists than among top performers.
The results also show that performance is a key factor in explaining income differences between
informal firms. For example, differences in the performance of firms explain more than 50
percent of the income gap between top performers and constrained gazelles. Thus, policies aimed
at reducing the performance gap between top performers and the two other categories of informal
firms—constrained gazelles and survivalists—could narrow income inequality and reduce
poverty.
The amount of capital, secondary educational attainment, vocational training, and professional
networks are important determinants of the performance of firms. Thus, membership in a
business association boosts the performance of firms by around 17 percent. Lack of demand and
employee discipline issues are two important impediments to performance. The Congolese
informal sector is tremendously heterogeneous in human and physical capital. This heterogeneity
means that the establishment of effective broad-based programs is difficult.
The informal sector is the critical lifeline of the Democratic Republic of Congo. It accounts for
81.5 percent of all employment in the country. Because of this importance, policies to reduce
poverty in the country should be tailored to each of the three groups of firms in the informal
sector. For the survivalists, the priorities should involve providing vocational training to improve
technical and managerial skills and raise the sense of entrepreneurship. Improving financial
literacy and easing the access to finance are also essential for this group. Unlocking the potential
of the constrained gazelles would require facilitating the access to credit and supplying training
programs to enhance managerial skills. The assistance for top performers should seek to
strengthen managerial skills and improve the access to infrastructure, enabling these firms to
expand markets.
27
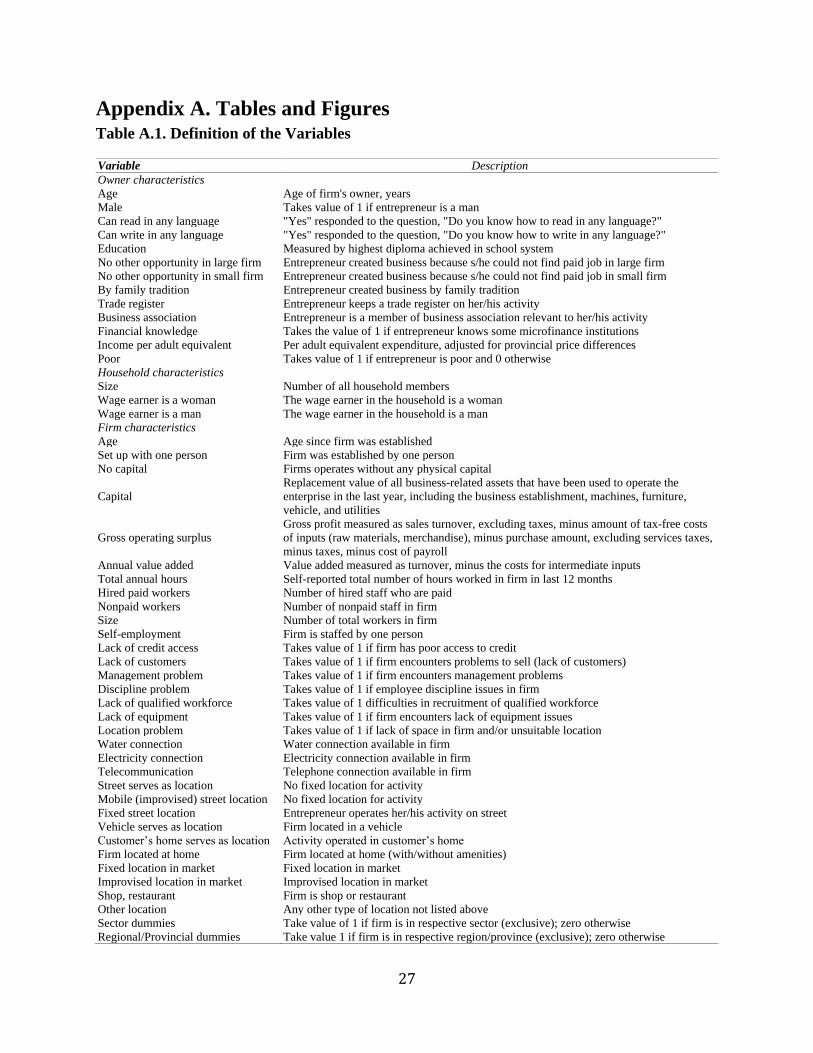
Appendix A. Tables and Figures Table A.1. Definition of the Variables
Variable Description
Owner characteristics
Age Age of firm's owner, years
Male Takes value of 1 if entrepreneur is a man
Can read in any language "Yes" responded to the question, "Do you know how to read in any language?"
Can write in any language "Yes" responded to the question, "Do you know how to write in any language?"
Education Measured by highest diploma achieved in school system
No other opportunity in large firm Entrepreneur created business because s/he could not find paid job in large firm
No other opportunity in small firm Entrepreneur created business because s/he could not find paid job in small firm
By family tradition Entrepreneur created business by family tradition
Trade register Entrepreneur keeps a trade register on her/his activity
Business association Entrepreneur is a member of business association relevant to her/his activity
Financial knowledge Takes the value of 1 if entrepreneur knows some microfinance institutions
Income per adult equivalent Per adult equivalent expenditure, adjusted for provincial price differences
Poor Takes value of 1 if entrepreneur is poor and 0 otherwise
Household characteristics
Size Number of all household members
Wage earner is a woman The wage earner in the household is a woman
Wage earner is a man The wage earner in the household is a man
Firm characteristics
Age Age since firm was established
Set up with one person Firm was established by one person
No capital Firms operates without any physical capital
Capital
Replacement value of all business-related assets that have been used to operate the
enterprise in the last year, including the business establishment, machines, furniture,
vehicle, and utilities
Gross operating surplus
Gross profit measured as sales turnover, excluding taxes, minus amount of tax-free costs
of inputs (raw materials, merchandise), minus purchase amount, excluding services taxes,
minus taxes, minus cost of payroll
Annual value added Value added measured as turnover, minus the costs for intermediate inputs
Total annual hours Self-reported total number of hours worked in firm in last 12 months
Hired paid workers Number of hired staff who are paid
Nonpaid workers Number of nonpaid staff in firm
Size Number of total workers in firm
Self-employment Firm is staffed by one person
Lack of credit access Takes value of 1 if firm has poor access to credit
Lack of customers Takes value of 1 if firm encounters problems to sell (lack of customers)
Management problem Takes value of 1 if firm encounters management problems
Discipline problem Takes value of 1 if employee discipline issues in firm
Lack of qualified workforce Takes value of 1 difficulties in recruitment of qualified workforce
Lack of equipment Takes value of 1 if firm encounters lack of equipment issues
Location problem Takes value of 1 if lack of space in firm and/or unsuitable location
Water connection Water connection available in firm
Electricity connection Electricity connection available in firm
Telecommunication Telephone connection available in firm
Street serves as location No fixed location for activity
Mobile (improvised) street location No fixed location for activity
Fixed street location Entrepreneur operates her/his activity on street
Vehicle serves as location Firm located in a vehicle
Customer’s home serves as location Activity operated in customer’s home
Firm located at home Firm located at home (with/without amenities)
Fixed location in market Fixed location in market
Improvised location in market Improvised location in market
Shop, restaurant Firm is shop or restaurant
Other location Any other type of location not listed above
Sector dummies Take value of 1 if firm is in respective sector (exclusive); zero otherwise
Regional/Provincial dummies Take value 1 if firm is in respective region/province (exclusive); zero otherwise
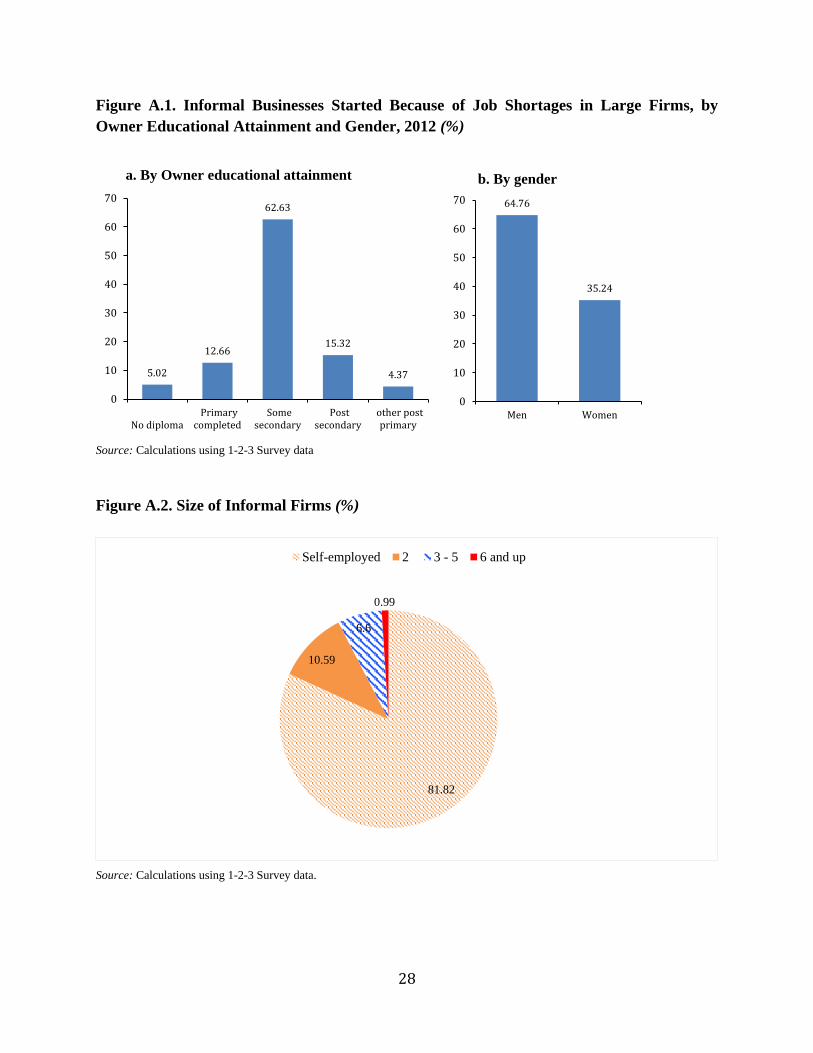
28
Figure A.1. Informal Businesses Started Because of Job Shortages in Large Firms, by
Owner Educational Attainment and Gender, 2012 (%)
Source: Calculations using 1-2-3 Survey data
Figure A.2. Size of Informal Firms (%)
Source: Calculations using 1-2-3 Survey data.
5.02
12.66
62.63
15.32
4.37
0
10
20
30
40
50
60
70
No diploma Primary
completed Some
secondary Post
secondary other post
primary
a. By Owner educational attainment
64.76
35.24
0
10
20
30
40
50
60
70
Men Women
b. By gender
81.82
10.59
6.6
0.99
Self-employed 2 3 - 5 6 and up
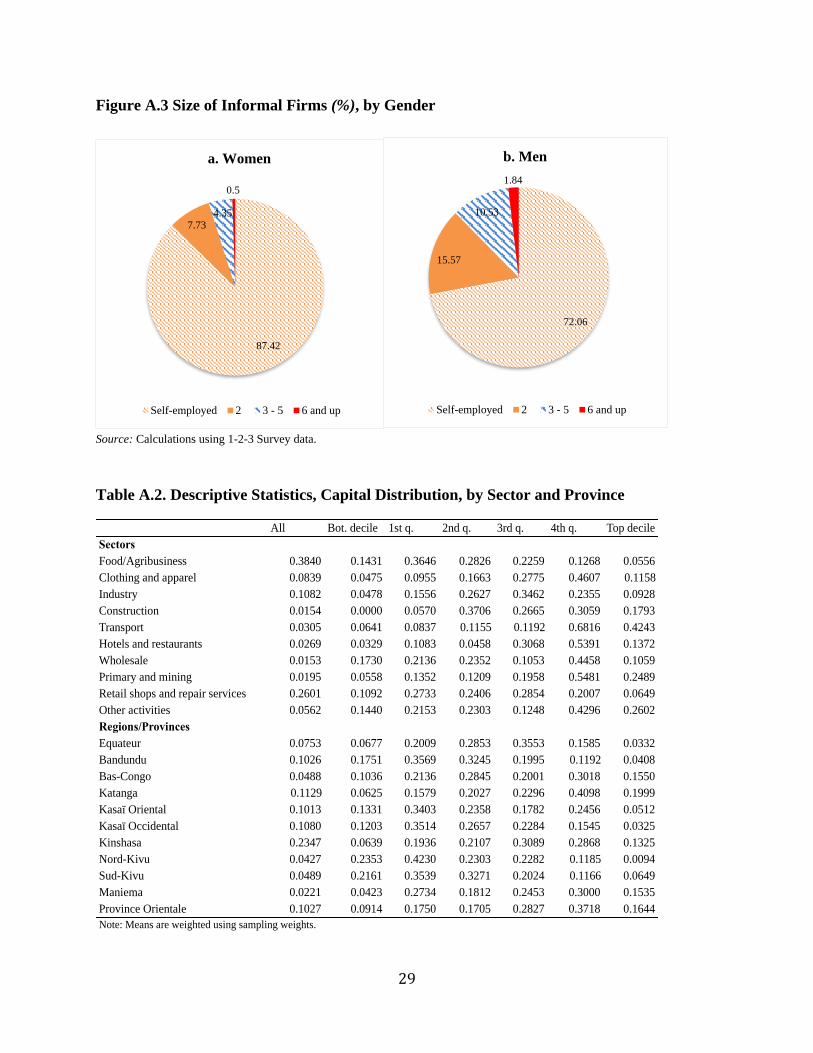
29
Figure A.3 Size of Informal Firms (%), by Gender
Source: Calculations using 1-2-3 Survey data.
Table A.2. Descriptive Statistics, Capital Distribution, by Sector and Province
87.42
7.734.35
0.5
a. Women
Self-employed 2 3 - 5 6 and up
72.06
15.57
10.53
1.84
b. Men
Self-employed 2 3 - 5 6 and up
All Bot. decile 1st q. 2nd q. 3rd q. 4th q. Top decile
Sectors
Food/Agribusiness 0.3840 0.1431 0.3646 0.2826 0.2259 0.1268 0.0556
Clothing and apparel 0.0839 0.0475 0.0955 0.1663 0.2775 0.4607 0.1158
Industry 0.1082 0.0478 0.1556 0.2627 0.3462 0.2355 0.0928
Construction 0.0154 0.0000 0.0570 0.3706 0.2665 0.3059 0.1793
Transport 0.0305 0.0641 0.0837 0.1155 0.1192 0.6816 0.4243
Hotels and restaurants 0.0269 0.0329 0.1083 0.0458 0.3068 0.5391 0.1372
Wholesale 0.0153 0.1730 0.2136 0.2352 0.1053 0.4458 0.1059
Primary and mining 0.0195 0.0558 0.1352 0.1209 0.1958 0.5481 0.2489
Retail shops and repair services 0.2601 0.1092 0.2733 0.2406 0.2854 0.2007 0.0649
Other activities 0.0562 0.1440 0.2153 0.2303 0.1248 0.4296 0.2602
Regions/Provinces
Equateur 0.0753 0.0677 0.2009 0.2853 0.3553 0.1585 0.0332
Bandundu 0.1026 0.1751 0.3569 0.3245 0.1995 0.1192 0.0408
Bas-Congo 0.0488 0.1036 0.2136 0.2845 0.2001 0.3018 0.1550
Katanga 0.1129 0.0625 0.1579 0.2027 0.2296 0.4098 0.1999
Kasaï Oriental 0.1013 0.1331 0.3403 0.2358 0.1782 0.2456 0.0512
Kasaï Occidental 0.1080 0.1203 0.3514 0.2657 0.2284 0.1545 0.0325
Kinshasa 0.2347 0.0639 0.1936 0.2107 0.3089 0.2868 0.1325
Nord-Kivu 0.0427 0.2353 0.4230 0.2303 0.2282 0.1185 0.0094
Sud-Kivu 0.0489 0.2161 0.3539 0.3271 0.2024 0.1166 0.0649
Maniema 0.0221 0.0423 0.2734 0.1812 0.2453 0.3000 0.1535
Province Orientale 0.1027 0.0914 0.1750 0.1705 0.2827 0.3718 0.1644
Note: Means are weighted using sampling weights.
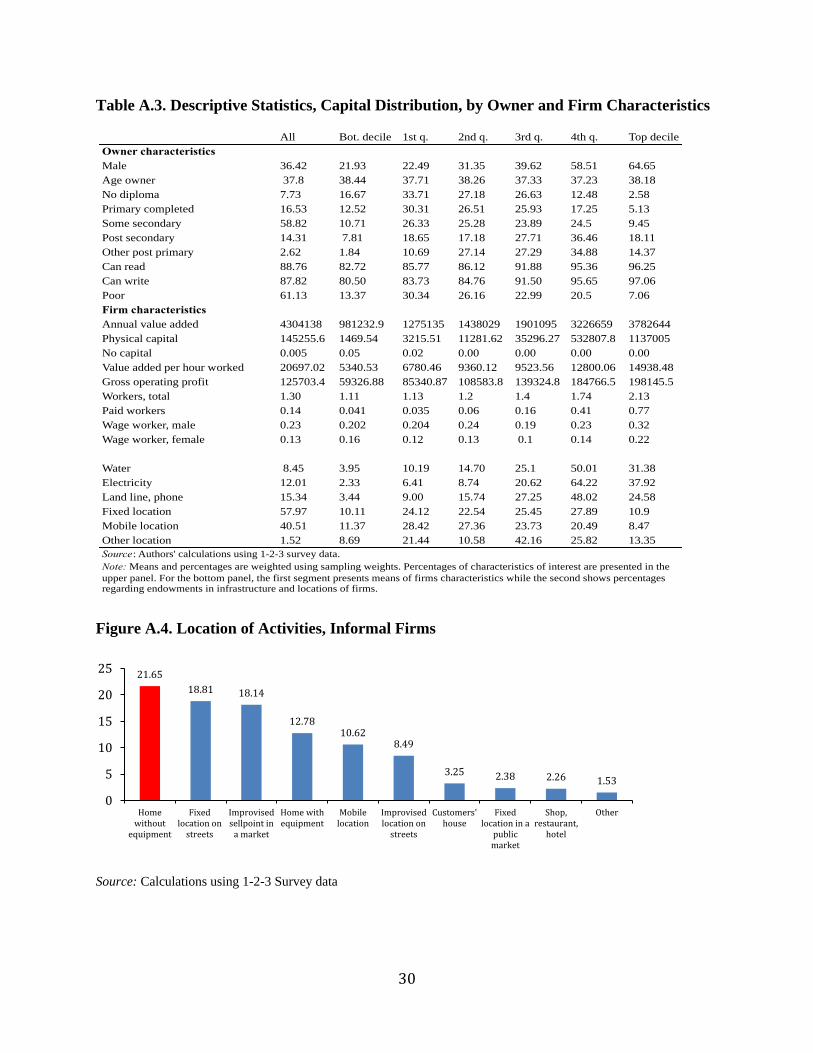
30
Table A.3. Descriptive Statistics, Capital Distribution, by Owner and Firm Characteristics
Figure A.4. Location of Activities, Informal Firms
Source: Calculations using 1-2-3 Survey data
All Bot. decile 1st q. 2nd q. 3rd q. 4th q. Top decile
Owner characteristics
Male 36.42 21.93 22.49 31.35 39.62 58.51 64.65
Age owner 37.8 38.44 37.71 38.26 37.33 37.23 38.18
No diploma 7.73 16.67 33.71 27.18 26.63 12.48 2.58
Primary completed 16.53 12.52 30.31 26.51 25.93 17.25 5.13
Some secondary 58.82 10.71 26.33 25.28 23.89 24.5 9.45
Post secondary 14.31 7.81 18.65 17.18 27.71 36.46 18.11
Other post primary 2.62 1.84 10.69 27.14 27.29 34.88 14.37
Can read 88.76 82.72 85.77 86.12 91.88 95.36 96.25
Can write 87.82 80.50 83.73 84.76 91.50 95.65 97.06
Poor 61.13 13.37 30.34 26.16 22.99 20.5 7.06
Firm characteristics
Annual value added 4304138 981232.9 1275135 1438029 1901095 3226659 3782644
Physical capital 145255.6 1469.54 3215.51 11281.62 35296.27 532807.8 1137005
No capital 0.005 0.05 0.02 0.00 0.00 0.00 0.00
Value added per hour worked 20697.02 5340.53 6780.46 9360.12 9523.56 12800.06 14938.48
Gross operating profit 125703.4 59326.88 85340.87 108583.8 139324.8 184766.5 198145.5
Workers, total 1.30 1.11 1.13 1.2 1.4 1.74 2.13
Paid workers 0.14 0.041 0.035 0.06 0.16 0.41 0.77
Wage worker, male 0.23 0.202 0.204 0.24 0.19 0.23 0.32
Wage worker, female 0.13 0.16 0.12 0.13 0.1 0.14 0.22
Water 8.45 3.95 10.19 14.70 25.1 50.01 31.38
Electricity 12.01 2.33 6.41 8.74 20.62 64.22 37.92
Land line, phone 15.34 3.44 9.00 15.74 27.25 48.02 24.58
Fixed location 57.97 10.11 24.12 22.54 25.45 27.89 10.9
Mobile location 40.51 11.37 28.42 27.36 23.73 20.49 8.47
Other location 1.52 8.69 21.44 10.58 42.16 25.82 13.35
Note: Means and percentages are weighted using sampling weights. Percentages of characteristics of interest are presented in the
upper panel. For the bottom panel, the first segment presents means of firms characteristics while the second shows percentages regarding endowments in infrastructure and locations of firms.
Source: Authors' calculations using 1-2-3 survey data.
21.65
18.81 18.14
12.7810.62
8.49
3.25 2.38 2.26 1.53
0
5
10
15
20
25
Homewithout
equipment
Fixedlocation on
streets
Improvisedsellpoint in
a market
Home withequipment
Mobilelocation
Improvisedlocation on
streets
Customers'house
Fixedlocation in a
publicmarket
Shop,restaurant,
hotel
Other
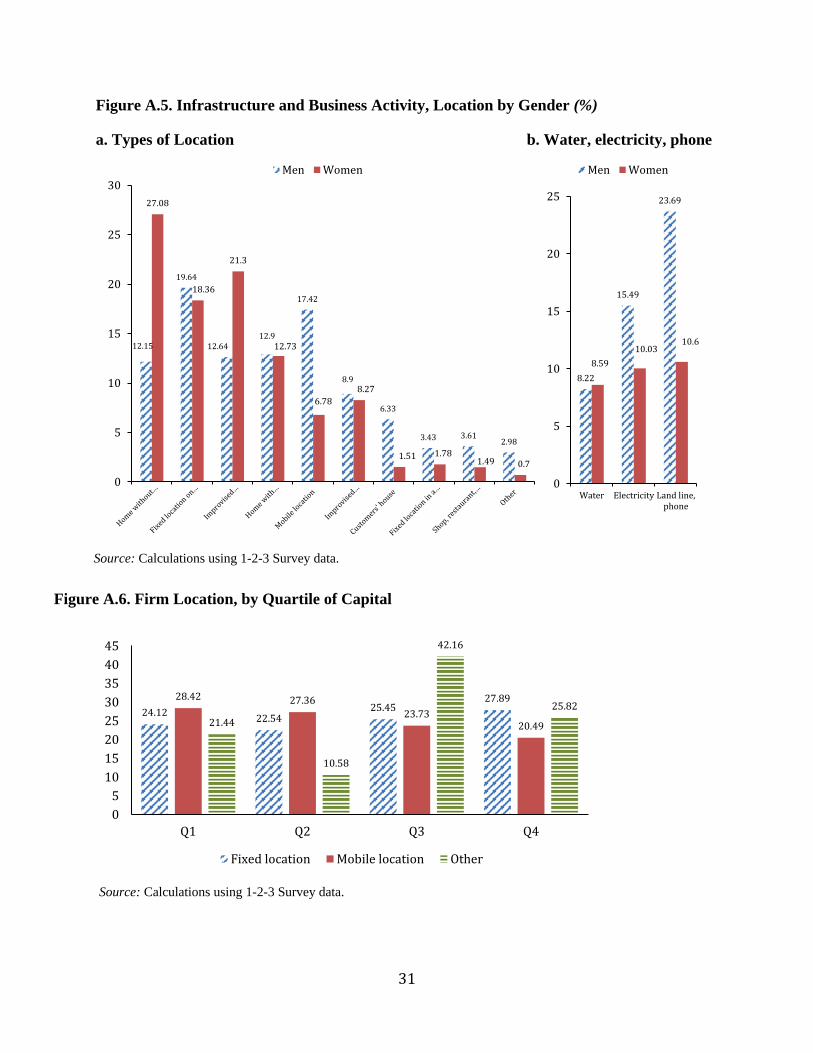
31
Figure A.5. Infrastructure and Business Activity, Location by Gender (%)
a. Types of Location b. Water, electricity, phone
Source: Calculations using 1-2-3 Survey data.
Figure A.6. Firm Location, by Quartile of Capital
Source: Calculations using 1-2-3 Survey data.
12.15
19.64
12.6412.9
17.42
8.9
6.33
3.43 3.612.98
27.08
18.36
21.3
12.73
6.78
8.27
1.51 1.781.49 0.7
0
5
10
15
20
25
30
Men Women
8.22
15.49
23.69
8.59
10.0310.6
0
5
10
15
20
25
Water Electricity Land line,phone
Men Women
24.1222.54
25.4527.8928.42 27.36
23.7320.4921.44
10.58
42.16
25.82
0
5
10
15
20
25
30
35
40
45
Q1 Q2 Q3 Q4
Fixed location Mobile location Other
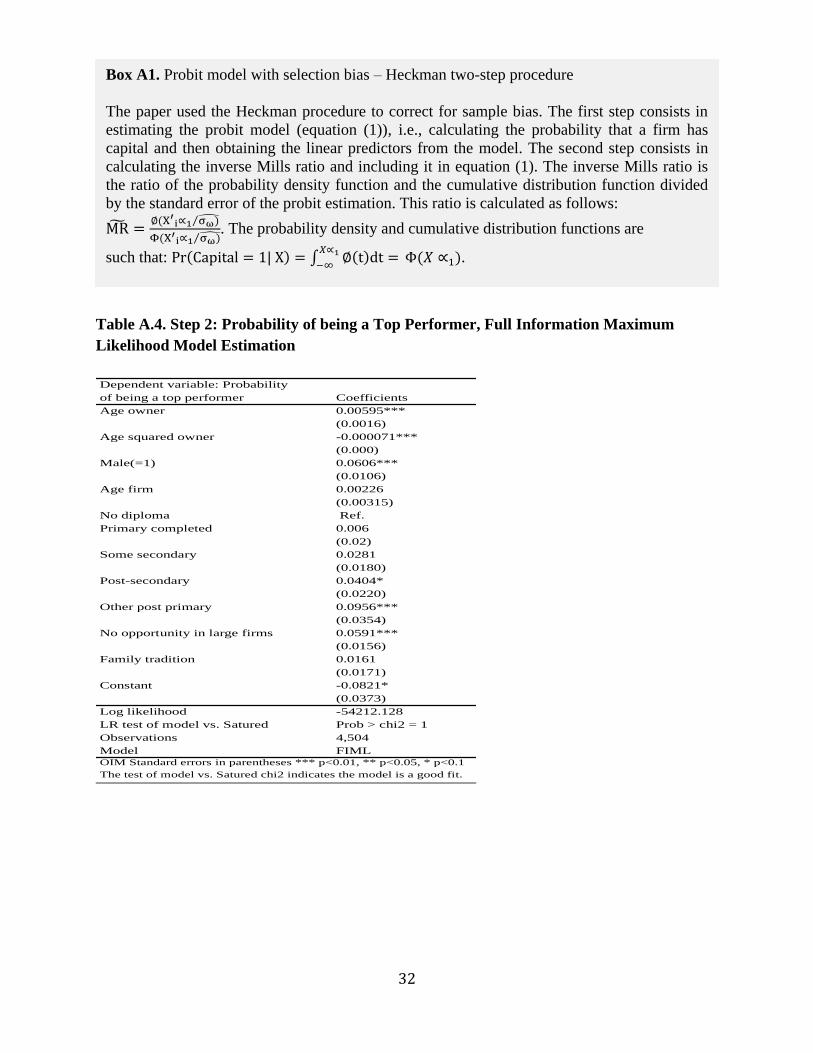
32
Table A.4. Step 2: Probability of being a Top Performer, Full Information Maximum
Likelihood Model Estimation
Dependent variable: Probability
of being a top performer Coefficients
Age owner 0.00595***
(0.0016)
Age squared owner -0.000071***
(0.000)
Male(=1) 0.0606***
(0.0106)
Age firm 0.00226
(0.00315)
No diploma Ref.
Primary completed 0.006
(0.02)
Some secondary 0.0281
(0.0180)
Post-secondary 0.0404*
(0.0220)
Other post primary 0.0956***
(0.0354)
No opportunity in large firms 0.0591***
(0.0156)
Family tradition 0.0161
(0.0171)
Constant -0.0821*
(0.0373)
Log likelihood -54212.128
LR test of model vs. Satured Prob > chi2 = 1
Observations 4,504
Model FIML
OIM Standard errors in parentheses *** p<0.01, ** p<0.05, * p<0.1
The test of model vs. Satured chi2 indicates the model is a good fit.
Box A1. Probit model with selection bias – Heckman two-step procedure
The paper used the Heckman procedure to correct for sample bias. The first step consists in
estimating the probit model (equation (1)), i.e., calculating the probability that a firm has
capital and then obtaining the linear predictors from the model. The second step consists in
calculating the inverse Mills ratio and including it in equation (1). The inverse Mills ratio is
the ratio of the probability density function and the cumulative distribution function divided
by the standard error of the probit estimation. This ratio is calculated as follows:
MR̃ =∅(X′
i∝1 σω)̂⁄
Φ(X′i∝1 σω)̂⁄
. The probability density and cumulative distribution functions are
such that: Pr(Capital = 1| X) = ∫ ∅(t)dt =𝑋∝1
−∞ Φ(𝑋 ∝1).
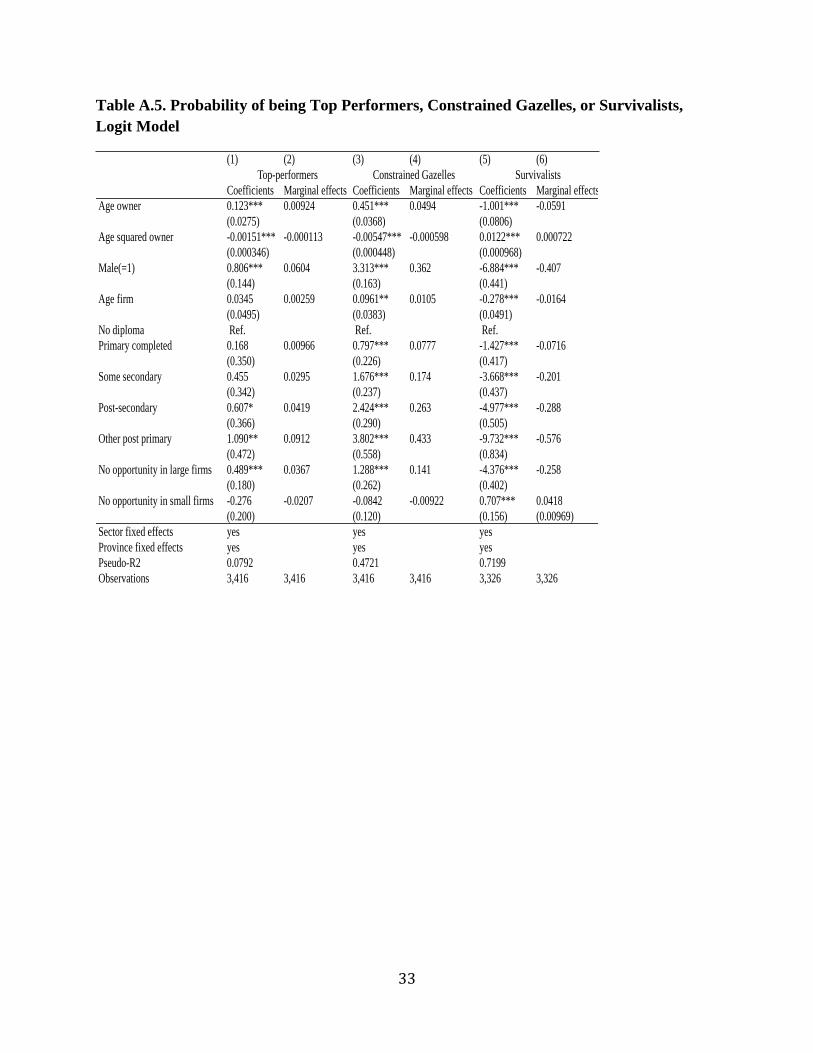
33
Table A.5. Probability of being Top Performers, Constrained Gazelles, or Survivalists,
Logit Model
(1) (2) (3) (4) (5) (6)
Coefficients Marginal effects Coefficients Marginal effects Coefficients Marginal effects
Age owner 0.123*** 0.00924 0.451*** 0.0494 -1.001*** -0.0591
(0.0275) (0.0368) (0.0806)
Age squared owner -0.00151*** -0.000113 -0.00547*** -0.000598 0.0122*** 0.000722
(0.000346) (0.000448) (0.000968)
Male(=1) 0.806*** 0.0604 3.313*** 0.362 -6.884*** -0.407
(0.144) (0.163) (0.441)
Age firm 0.0345 0.00259 0.0961** 0.0105 -0.278*** -0.0164
(0.0495) (0.0383) (0.0491)
No diploma Ref. Ref. Ref.
Primary completed 0.168 0.00966 0.797*** 0.0777 -1.427*** -0.0716
(0.350) (0.226) (0.417)
Some secondary 0.455 0.0295 1.676*** 0.174 -3.668*** -0.201
(0.342) (0.237) (0.437)
Post-secondary 0.607* 0.0419 2.424*** 0.263 -4.977*** -0.288
(0.366) (0.290) (0.505)
Other post primary 1.090** 0.0912 3.802*** 0.433 -9.732*** -0.576
(0.472) (0.558) (0.834)
No opportunity in large firms 0.489*** 0.0367 1.288*** 0.141 -4.376*** -0.258
(0.180) (0.262) (0.402)
No opportunity in small firms -0.276 -0.0207 -0.0842 -0.00922 0.707*** 0.0418
(0.200) (0.120) (0.156) (0.00969)
Sector fixed effects yes yes yes
Province fixed effects yes yes yes
Pseudo-R2 0.0792 0.4721 0.7199
Observations 3,416 3,416 3,416 3,416 3,326 3,326
Top-performers Constrained Gazelles Survivalists
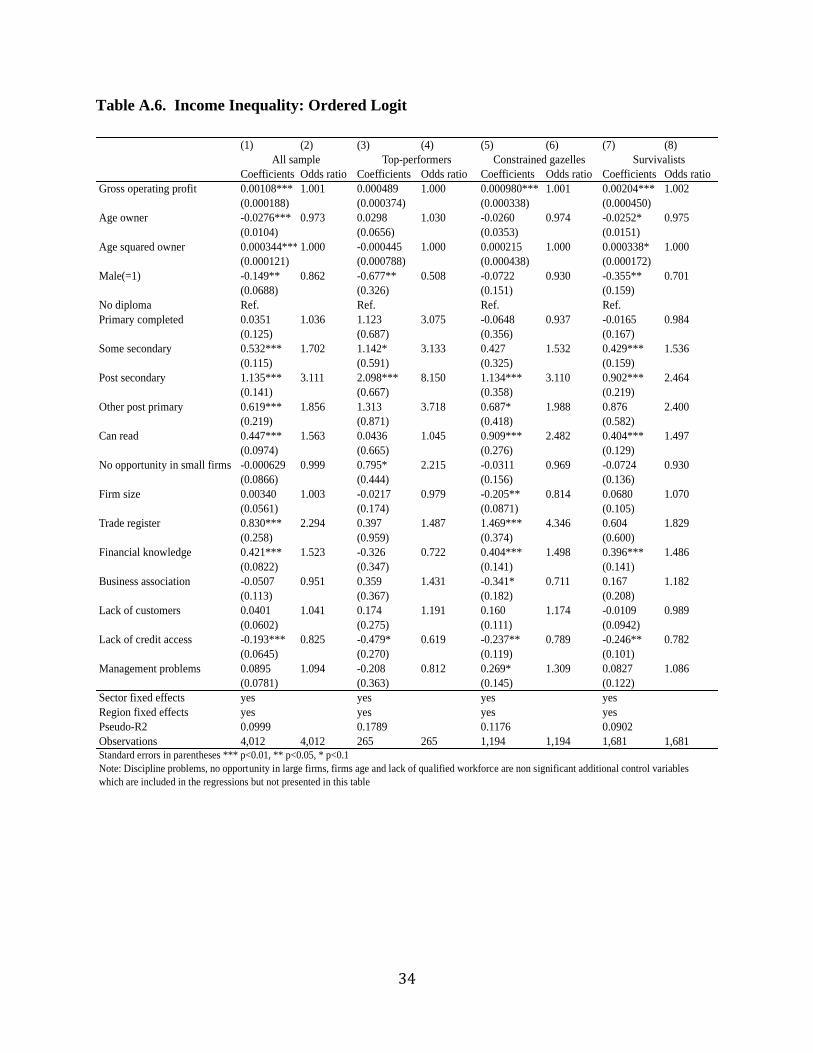
34
Table A.6. Income Inequality: Ordered Logit
(1) (2) (3) (4) (5) (6) (7) (8)
Coefficients Odds ratio Coefficients Odds ratio Coefficients Odds ratio Coefficients Odds ratio
Gross operating profit 0.00108*** 1.001 0.000489 1.000 0.000980*** 1.001 0.00204*** 1.002
(0.000188) (0.000374) (0.000338) (0.000450)
Age owner -0.0276*** 0.973 0.0298 1.030 -0.0260 0.974 -0.0252* 0.975
(0.0104) (0.0656) (0.0353) (0.0151)
Age squared owner 0.000344*** 1.000 -0.000445 1.000 0.000215 1.000 0.000338* 1.000
(0.000121) (0.000788) (0.000438) (0.000172)
Male(=1) -0.149** 0.862 -0.677** 0.508 -0.0722 0.930 -0.355** 0.701
(0.0688) (0.326) (0.151) (0.159)
No diploma Ref. Ref. Ref. Ref.
Primary completed 0.0351 1.036 1.123 3.075 -0.0648 0.937 -0.0165 0.984
(0.125) (0.687) (0.356) (0.167)
Some secondary 0.532*** 1.702 1.142* 3.133 0.427 1.532 0.429*** 1.536
(0.115) (0.591) (0.325) (0.159)
Post secondary 1.135*** 3.111 2.098*** 8.150 1.134*** 3.110 0.902*** 2.464
(0.141) (0.667) (0.358) (0.219)
Other post primary 0.619*** 1.856 1.313 3.718 0.687* 1.988 0.876 2.400
(0.219) (0.871) (0.418) (0.582)
Can read 0.447*** 1.563 0.0436 1.045 0.909*** 2.482 0.404*** 1.497
(0.0974) (0.665) (0.276) (0.129)
No opportunity in small firms -0.000629 0.999 0.795* 2.215 -0.0311 0.969 -0.0724 0.930
(0.0866) (0.444) (0.156) (0.136)
Firm size 0.00340 1.003 -0.0217 0.979 -0.205** 0.814 0.0680 1.070
(0.0561) (0.174) (0.0871) (0.105)
Trade register 0.830*** 2.294 0.397 1.487 1.469*** 4.346 0.604 1.829
(0.258) (0.959) (0.374) (0.600)
Financial knowledge 0.421*** 1.523 -0.326 0.722 0.404*** 1.498 0.396*** 1.486
(0.0822) (0.347) (0.141) (0.141)
Business association -0.0507 0.951 0.359 1.431 -0.341* 0.711 0.167 1.182
(0.113) (0.367) (0.182) (0.208)
Lack of customers 0.0401 1.041 0.174 1.191 0.160 1.174 -0.0109 0.989
(0.0602) (0.275) (0.111) (0.0942)
Lack of credit access -0.193*** 0.825 -0.479* 0.619 -0.237** 0.789 -0.246** 0.782
(0.0645) (0.270) (0.119) (0.101)
Management problems 0.0895 1.094 -0.208 0.812 0.269* 1.309 0.0827 1.086
(0.0781) (0.363) (0.145) (0.122)
Sector fixed effects yes yes yes yes
Region fixed effects yes yes yes yes
Pseudo-R2 0.0999 0.1789 0.1176 0.0902
Observations 4,012 4,012 265 265 1,194 1,194 1,681 1,681
Note: Discipline problems, no opportunity in large firms, firms age and lack of qualified workforce are non significant additional control variables
which are included in the regressions but not presented in this table
All sample Top-performers Constrained gazelles Survivalists
Standard errors in parentheses *** p<0.01, ** p<0.05, * p<0.1
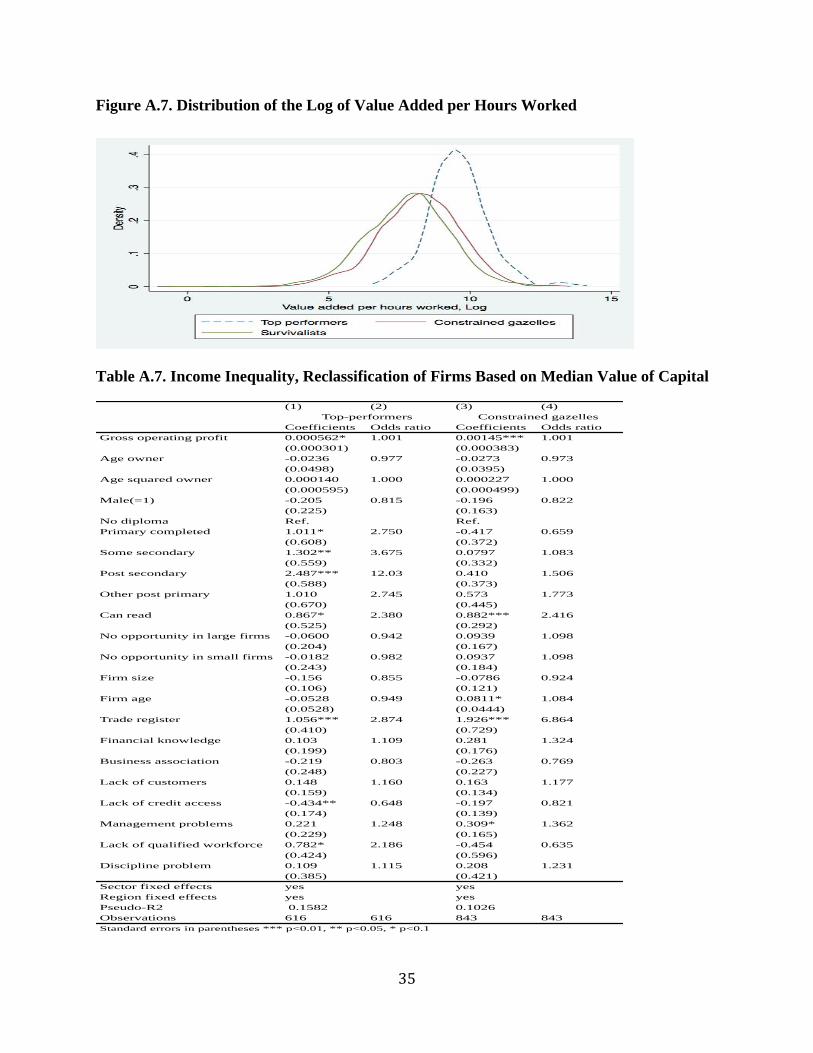
35
Figure A.7. Distribution of the Log of Value Added per Hours Worked
Table A.7. Income Inequality, Reclassification of Firms Based on Median Value of Capital
(1) (2) (3) (4)
Coefficients Odds ratio Coefficients Odds ratio
Gross operating profit 0.000562* 1.001 0.00145*** 1.001
(0.000301) (0.000383)
Age owner -0.0236 0.977 -0.0273 0.973
(0.0498) (0.0395)
Age squared owner 0.000140 1.000 0.000227 1.000
(0.000595) (0.000499)
Male(=1) -0.205 0.815 -0.196 0.822
(0.225) (0.163)
No diploma Ref. Ref.
Primary completed 1.011* 2.750 -0.417 0.659
(0.608) (0.372)
Some secondary 1.302** 3.675 0.0797 1.083
(0.559) (0.332)
Post secondary 2.487*** 12.03 0.410 1.506
(0.588) (0.373)
Other post primary 1.010 2.745 0.573 1.773
(0.670) (0.445)
Can read 0.867* 2.380 0.882*** 2.416
(0.525) (0.292)
No opportunity in large firms -0.0600 0.942 0.0939 1.098
(0.204) (0.167)
No opportunity in small firms -0.0182 0.982 0.0937 1.098
(0.243) (0.184)
Firm size -0.156 0.855 -0.0786 0.924
(0.106) (0.121)
Firm age -0.0528 0.949 0.0811* 1.084
(0.0528) (0.0444)
Trade register 1.056*** 2.874 1.926*** 6.864
(0.410) (0.729)
Financial knowledge 0.103 1.109 0.281 1.324
(0.199) (0.176)
Business association -0.219 0.803 -0.263 0.769
(0.248) (0.227)
Lack of customers 0.148 1.160 0.163 1.177
(0.159) (0.134)
Lack of credit access -0.434** 0.648 -0.197 0.821
(0.174) (0.139)
Management problems 0.221 1.248 0.309* 1.362
(0.229) (0.165)
Lack of qualified workforce 0.782* 2.186 -0.454 0.635
(0.424) (0.596)
Discipline problem 0.109 1.115 0.208 1.231
(0.385) (0.421)
Sector fixed effects yes yes
Region fixed effects yes yes
Pseudo-R2 0.1582 0.1026
Observations 616 616 843 843
Standard errors in parentheses *** p<0.01, ** p<0.05, * p<0.1
Top-performers Constrained gazelles
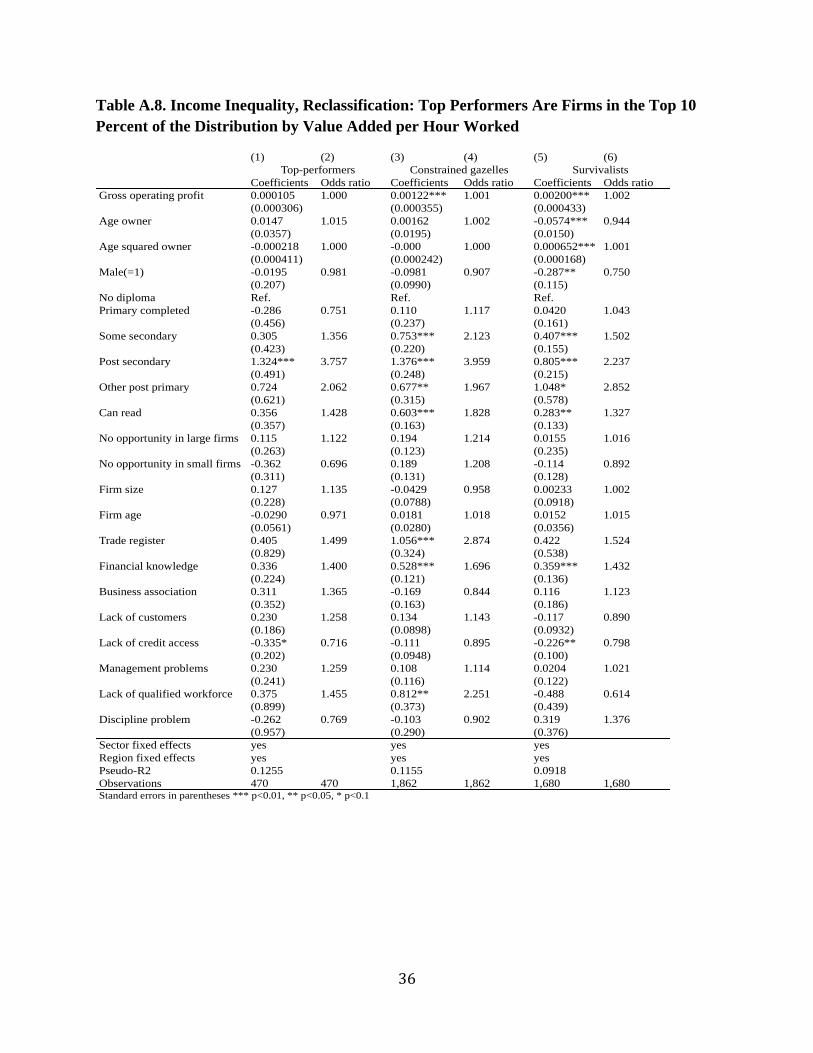
36
Table A.8. Income Inequality, Reclassification: Top Performers Are Firms in the Top 10
Percent of the Distribution by Value Added per Hour Worked
(1) (2) (3) (4) (5) (6)
Coefficients Odds ratio Coefficients Odds ratio Coefficients Odds ratio
Gross operating profit 0.000105 1.000 0.00122*** 1.001 0.00200*** 1.002
(0.000306) (0.000355) (0.000433)
Age owner 0.0147 1.015 0.00162 1.002 -0.0574*** 0.944
(0.0357) (0.0195) (0.0150)
Age squared owner -0.000218 1.000 -0.000 1.000 0.000652*** 1.001
(0.000411) (0.000242) (0.000168)
Male(=1) -0.0195 0.981 -0.0981 0.907 -0.287** 0.750
(0.207) (0.0990) (0.115)
No diploma Ref. Ref. Ref.
Primary completed -0.286 0.751 0.110 1.117 0.0420 1.043
(0.456) (0.237) (0.161)
Some secondary 0.305 1.356 0.753*** 2.123 0.407*** 1.502
(0.423) (0.220) (0.155)
Post secondary 1.324*** 3.757 1.376*** 3.959 0.805*** 2.237
(0.491) (0.248) (0.215)
Other post primary 0.724 2.062 0.677** 1.967 1.048* 2.852
(0.621) (0.315) (0.578)
Can read 0.356 1.428 0.603*** 1.828 0.283** 1.327
(0.357) (0.163) (0.133)
No opportunity in large firms 0.115 1.122 0.194 1.214 0.0155 1.016
(0.263) (0.123) (0.235)
No opportunity in small firms -0.362 0.696 0.189 1.208 -0.114 0.892
(0.311) (0.131) (0.128)
Firm size 0.127 1.135 -0.0429 0.958 0.00233 1.002
(0.228) (0.0788) (0.0918)
Firm age -0.0290 0.971 0.0181 1.018 0.0152 1.015
(0.0561) (0.0280) (0.0356)
Trade register 0.405 1.499 1.056*** 2.874 0.422 1.524
(0.829) (0.324) (0.538)
Financial knowledge 0.336 1.400 0.528*** 1.696 0.359*** 1.432
(0.224) (0.121) (0.136)
Business association 0.311 1.365 -0.169 0.844 0.116 1.123
(0.352) (0.163) (0.186)
Lack of customers 0.230 1.258 0.134 1.143 -0.117 0.890
(0.186) (0.0898) (0.0932)
Lack of credit access -0.335* 0.716 -0.111 0.895 -0.226** 0.798
(0.202) (0.0948) (0.100)
Management problems 0.230 1.259 0.108 1.114 0.0204 1.021
(0.241) (0.116) (0.122)
Lack of qualified workforce 0.375 1.455 0.812** 2.251 -0.488 0.614
(0.899) (0.373) (0.439)
Discipline problem -0.262 0.769 -0.103 0.902 0.319 1.376
(0.957) (0.290) (0.376)
Sector fixed effects yes yes yes
Region fixed effects yes yes yes
Pseudo-R2 0.1255 0.1155 0.0918
Observations 470 470 1,862 1,862 1,680 1,680Standard errors in parentheses *** p<0.01, ** p<0.05, * p<0.1
Top-performers Constrained gazelles Survivalists
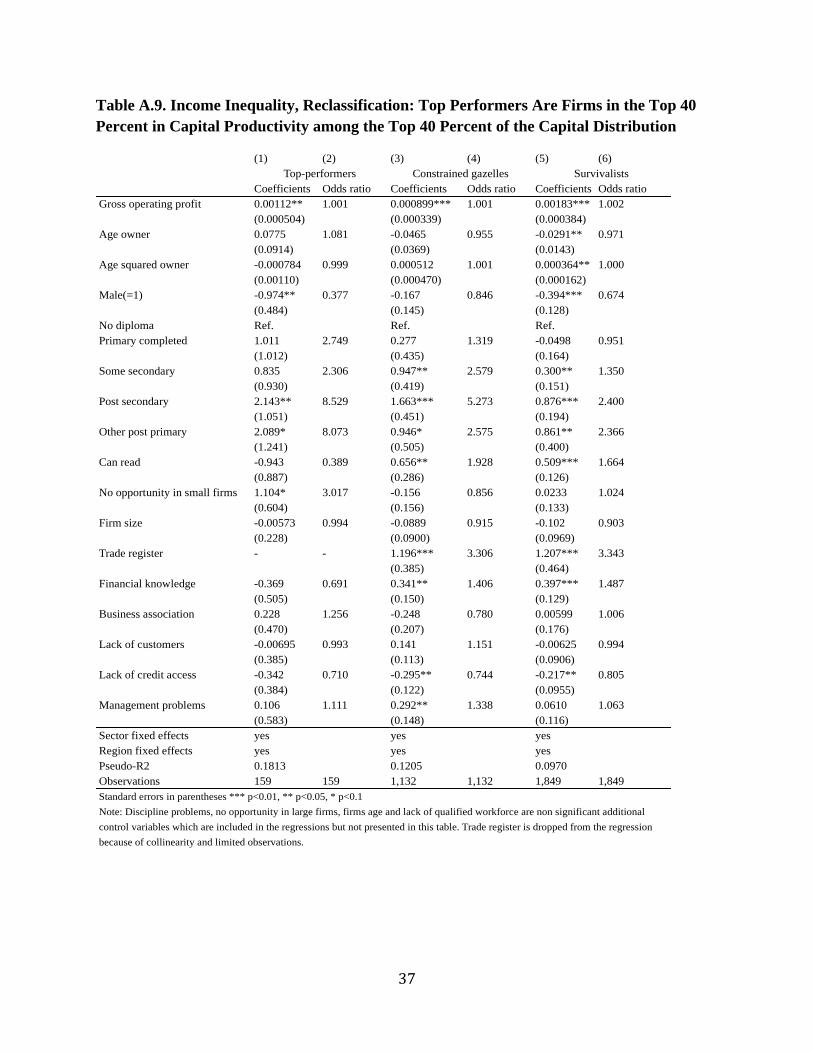
37
Table A.9. Income Inequality, Reclassification: Top Performers Are Firms in the Top 40
Percent in Capital Productivity among the Top 40 Percent of the Capital Distribution
(1) (2) (3) (4) (5) (6)
Coefficients Odds ratio Coefficients Odds ratio Coefficients Odds ratio
Gross operating profit 0.00112** 1.001 0.000899*** 1.001 0.00183*** 1.002
(0.000504) (0.000339) (0.000384)
Age owner 0.0775 1.081 -0.0465 0.955 -0.0291** 0.971
(0.0914) (0.0369) (0.0143)
Age squared owner -0.000784 0.999 0.000512 1.001 0.000364** 1.000
(0.00110) (0.000470) (0.000162)
Male(=1) -0.974** 0.377 -0.167 0.846 -0.394*** 0.674
(0.484) (0.145) (0.128)
No diploma Ref. Ref. Ref.
Primary completed 1.011 2.749 0.277 1.319 -0.0498 0.951
(1.012) (0.435) (0.164)
Some secondary 0.835 2.306 0.947** 2.579 0.300** 1.350
(0.930) (0.419) (0.151)
Post secondary 2.143** 8.529 1.663*** 5.273 0.876*** 2.400
(1.051) (0.451) (0.194)
Other post primary 2.089* 8.073 0.946* 2.575 0.861** 2.366
(1.241) (0.505) (0.400)
Can read -0.943 0.389 0.656** 1.928 0.509*** 1.664
(0.887) (0.286) (0.126)
No opportunity in small firms 1.104* 3.017 -0.156 0.856 0.0233 1.024
(0.604) (0.156) (0.133)
Firm size -0.00573 0.994 -0.0889 0.915 -0.102 0.903
(0.228) (0.0900) (0.0969)
Trade register - - 1.196*** 3.306 1.207*** 3.343
(0.385) (0.464)
Financial knowledge -0.369 0.691 0.341** 1.406 0.397*** 1.487
(0.505) (0.150) (0.129)
Business association 0.228 1.256 -0.248 0.780 0.00599 1.006
(0.470) (0.207) (0.176)
Lack of customers -0.00695 0.993 0.141 1.151 -0.00625 0.994
(0.385) (0.113) (0.0906)
Lack of credit access -0.342 0.710 -0.295** 0.744 -0.217** 0.805
(0.384) (0.122) (0.0955)
Management problems 0.106 1.111 0.292** 1.338 0.0610 1.063
(0.583) (0.148) (0.116)
Sector fixed effects yes yes yes
Region fixed effects yes yes yes
Pseudo-R2 0.1813 0.1205 0.0970
Observations 159 159 1,132 1,132 1,849 1,849
control variables which are included in the regressions but not presented in this table. Trade register is dropped from the regression
because of collinearity and limited observations.
Top-performers Constrained gazelles Survivalists
Standard errors in parentheses *** p<0.01, ** p<0.05, * p<0.1
Note: Discipline problems, no opportunity in large firms, firms age and lack of qualified workforce are non significant additional
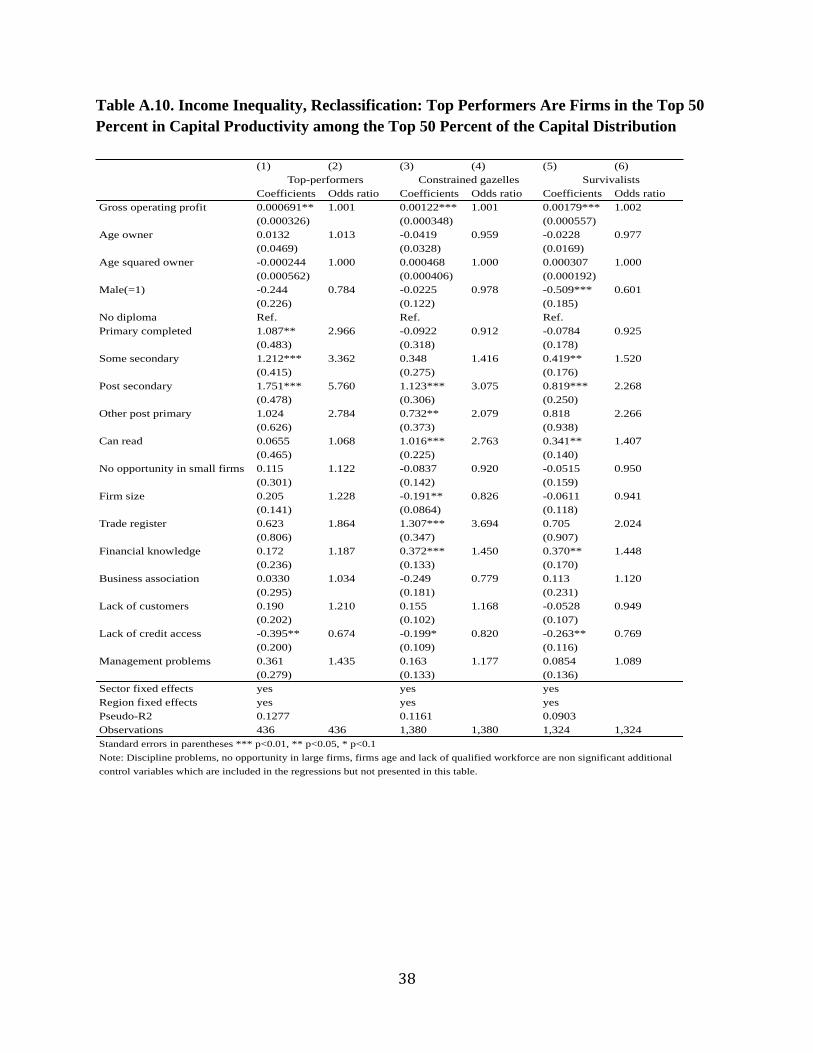
38
Table A.10. Income Inequality, Reclassification: Top Performers Are Firms in the Top 50
Percent in Capital Productivity among the Top 50 Percent of the Capital Distribution
(1) (2) (3) (4) (5) (6)
Coefficients Odds ratio Coefficients Odds ratio Coefficients Odds ratio
Gross operating profit 0.000691** 1.001 0.00122*** 1.001 0.00179*** 1.002
(0.000326) (0.000348) (0.000557)
Age owner 0.0132 1.013 -0.0419 0.959 -0.0228 0.977
(0.0469) (0.0328) (0.0169)
Age squared owner -0.000244 1.000 0.000468 1.000 0.000307 1.000
(0.000562) (0.000406) (0.000192)
Male(=1) -0.244 0.784 -0.0225 0.978 -0.509*** 0.601
(0.226) (0.122) (0.185)
No diploma Ref. Ref. Ref.
Primary completed 1.087** 2.966 -0.0922 0.912 -0.0784 0.925
(0.483) (0.318) (0.178)
Some secondary 1.212*** 3.362 0.348 1.416 0.419** 1.520
(0.415) (0.275) (0.176)
Post secondary 1.751*** 5.760 1.123*** 3.075 0.819*** 2.268
(0.478) (0.306) (0.250)
Other post primary 1.024 2.784 0.732** 2.079 0.818 2.266
(0.626) (0.373) (0.938)
Can read 0.0655 1.068 1.016*** 2.763 0.341** 1.407
(0.465) (0.225) (0.140)
No opportunity in small firms 0.115 1.122 -0.0837 0.920 -0.0515 0.950
(0.301) (0.142) (0.159)
Firm size 0.205 1.228 -0.191** 0.826 -0.0611 0.941
(0.141) (0.0864) (0.118)
Trade register 0.623 1.864 1.307*** 3.694 0.705 2.024
(0.806) (0.347) (0.907)
Financial knowledge 0.172 1.187 0.372*** 1.450 0.370** 1.448
(0.236) (0.133) (0.170)
Business association 0.0330 1.034 -0.249 0.779 0.113 1.120
(0.295) (0.181) (0.231)
Lack of customers 0.190 1.210 0.155 1.168 -0.0528 0.949
(0.202) (0.102) (0.107)
Lack of credit access -0.395** 0.674 -0.199* 0.820 -0.263** 0.769
(0.200) (0.109) (0.116)
Management problems 0.361 1.435 0.163 1.177 0.0854 1.089
(0.279) (0.133) (0.136)
Sector fixed effects yes yes yes
Region fixed effects yes yes yes
Pseudo-R2 0.1277 0.1161 0.0903
Observations 436 436 1,380 1,380 1,324 1,324
control variables which are included in the regressions but not presented in this table.
Top-performers Constrained gazelles Survivalists
Standard errors in parentheses *** p<0.01, ** p<0.05, * p<0.1
Note: Discipline problems, no opportunity in large firms, firms age and lack of qualified workforce are non significant additional
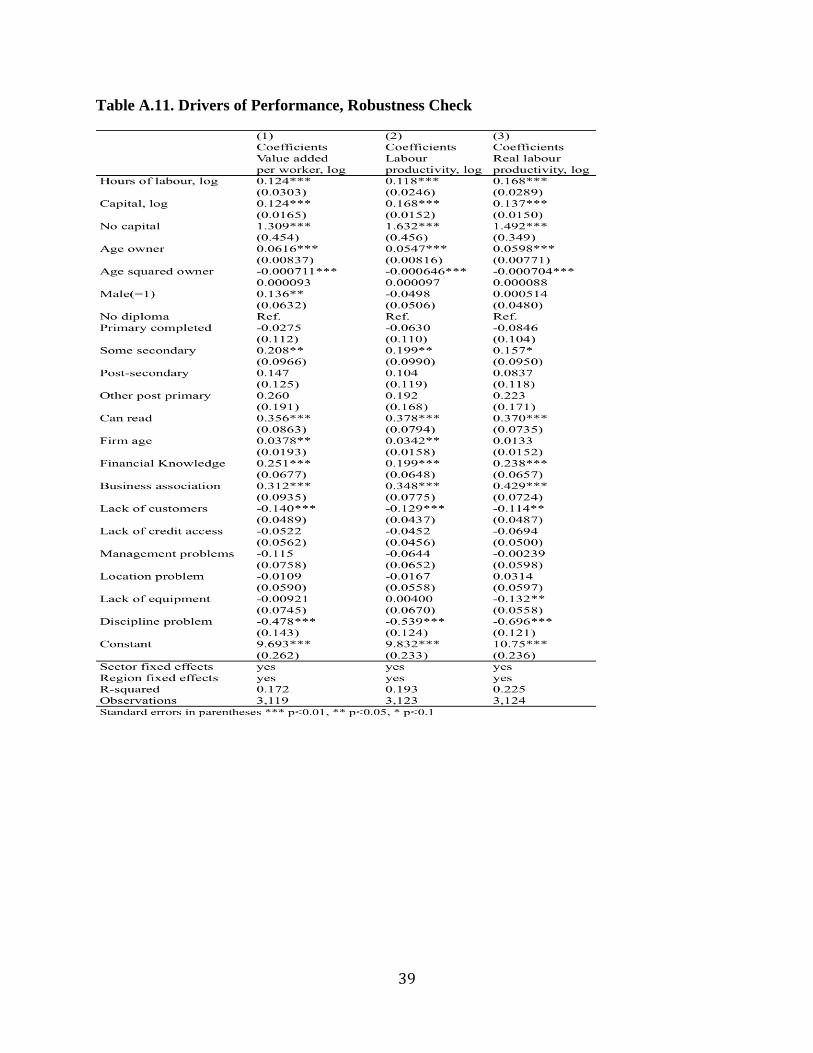
39
Table A.11. Drivers of Performance, Robustness Check
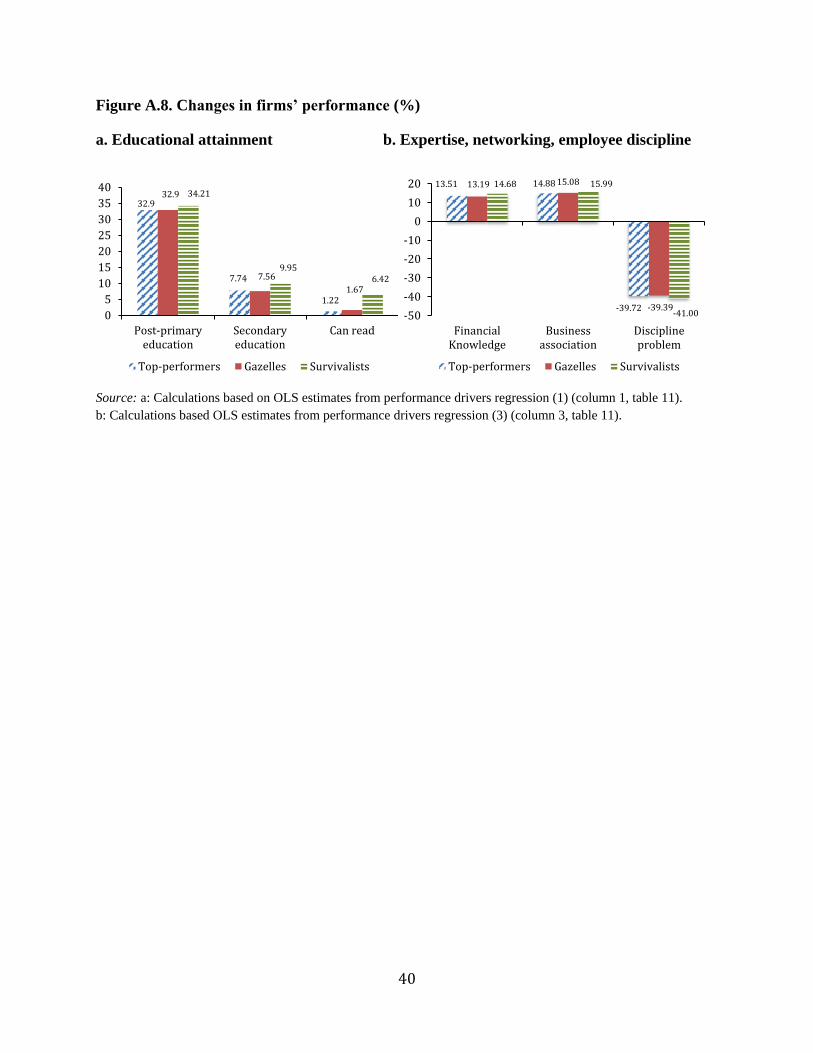
40
Figure A.8. Changes in firms’ performance (%)
a. Educational attainment b. Expertise, networking, employee discipline
Source: a: Calculations based on OLS estimates from performance drivers regression (1) (column 1, table 11).
b: Calculations based OLS estimates from performance drivers regression (3) (column 3, table 11).
32.9
7.74
1.22
32.9
7.56
1.67
34.21
9.956.42
0
5
10
15
20
25
30
35
40
Post-primaryeducation
Secondaryeducation
Can read
Top-performers Gazelles Survivalists
13.51 14.88
-39.72
13.19 15.08
-39.39
14.68 15.99
-41.00-50
-40
-30
-20
-10
0
10
20
FinancialKnowledge
Businessassociation
Disciplineproblem
Top-performers Gazelles Survivalists
41
References
AfDB (African Development Bank). 2013. “Recognizing Africa’s Informal Sector.”
Championing Inclusive Growth across Africa (blog), March 27.
https://www.afdb.org/en/blogs/afdb-championing-inclusive-growth-across-
africa/post/recognizing-africas-informal-sector-11645/.
Baker, George P., and Robert E. Kennedy. 2002. “Survivorship and the Economic Grim Reaper.”
Journal of Law, Economics, and Organization 18 (2): 324–61.
Battese, George E. 1997. “A note on the estimation of Cobb-Douglas production
functions when some explanatory variables have zero values”. Journal of
Agricultural Economics 48(1-3): 250–252.
Berner, Erhard, Georgina Gomez, and Peter Knorringa. 2012. “Helping a Large Number of
People Become a Little Less Poor: The Logic of Survival Entrepreneurs.” European Journal of
Development Research 24 (3): 382–96.
Blinder, Alan S. 1973. “Wage Discrimination: Reduced Form, and Structural Estimates.”
Journal of Human Resources 8 (4): 436–55.
Bosch, Mariano, and William F. Maloney. 2010. “Comparative Analysis of Labor Market
Dynamics Using Markov Processes: An Application to Informality.” Labour Economics 17 (4):
621–31.
Burki, Abid A., and Dek Terrell. 1998. “Measuring Production Efficiency of Small Firms in
Pakistan.” World Development 26 (1): 155–69.
Chong, Alberto, and Mark Gradstein. 2004. “Inequality, Institutions, and Informality.” Research
Department Working Paper 516 (September), Inter-American Development Bank, Washington,
DC.
Cunningham, Wendy V., and William F. Maloney. 2001. “Heterogeneity among Mexico’s
Microenterprises: An Application of Factor and Cluster Analysis.” Economic Development and
Cultural Change 50 (1): 131–56.
De Soto, Hernando. 1989. “The Other Path: The Invisible Revolution in the Third World.” New
York: Harper and Row.
Diao, Xinshen., Josaphat Kweka, Margaret McMillan, and Zara Qureshi. 2016. “Economic
Transformation in Africa from the Bottop Up: Macro and Micro Evidence from Tanzania.”
World Bank. http://pubdocs.worldbank.org/en/471071466186725727/Margaret-McMillan.pdf.
Fafchamps, Marcel. 1994. “Industrial Structure and Micro-Enterprises in Africa.” Journal of
Developing Areas 29 (1): 1–30.
42
Fields, Gary S. 1990. “Labour Market Modelling and the Urban Informal Sector: Theory and
Evidence.” In The informal Sector Revisited, edited by David Turnham, Bernard Salome, and
Antoine Schwarz, 49–69. Paris: Organisation for Economic Co-operation and Development.
Fields, Gary S. 2004. “Dualism in the Labor Market: A Perspective on the Lewis Model after
Half a Century.” Manchester School 72 (6): 724–35.
Gindling, Thomas H., and Newhouse David. 2014. “Self-Employment in the Developing
World.” World Development 56(C): 313-331.
Grimm, Michael, Peter Knorringa, and Jann Lay. 2012. “Constrained Gazelles: High Potentials
in West Africa’s Informal Economy.” World Development 40 (7): 1352–68.
Grimm, Michael, Jens Krüger, and Jann Lay. 2011. “Barriers to Entry and Returns to Capital in
Informal Activities: Evidence from Sub-Saharan Africa.” Review of Income and Wealth 57 (s1):
S27–S53.
Grimm, Michael, J. Lay, F. Roubaud and J. Vaillant. 2011. “Informal sector dynamics in times
of fragile growth: The case of Madagascar”. Washington, DC: World Bank.
http://documents.worldbank.org/curated/en/357541468337172457/Informal-sector-dynamics-in-
times-of-fragile-growth-the-case-of-Madagascar
Hart, Keith. 1973. “Informal Income Opportunities and Urban Employment in Ghana.” Journal
of Modern African Studies 11 (1): 61–89.
Heckman, James J. 1979. “Sample Selection Bias as a Specification Error.” Econometrica 47
(1): 153–61.
ILO (International Labor Office). 1972. Employment, Incomes, and Equality: A Strategy for
Increasing Productive Employment in Kenya. Geneva: ILO.
ILO (International Labor Office). 2002. Decent Work and the Informal Economy. Report VI,
90th Session (June), International Labour Conference. Geneva: ILO.
INS (National Institute of Statistics). 2014. Rapport Global, Enquête 1–2–3: Résultats de
l’enquête sur l’emploi, le secteur informel et sur la consommation des ménages, 2012. Kinshasa:
INS. http://www.ins-rdc.org/sites/default/files/Rapport%20enquete%20123.pdf.
Johnson, Simon, Daniel Kaufmann, and Andrei Shleifer. 1997. “The Unofficial Economy in
Transition.” Brookings Papers on Economic Activity 28 (2): 159–240.
Johnson, Simon, Daniel Kaufmann, and Pablo Zoido-Lobatón. 1998. “Regulatory Discretion and
the Unofficial Economy.” American Economic Review 88 (2): 387–92
Loayza, Norman V. 1996. “The Economics of the Informal Sector: A Simple Model and Some
Empirical Evidence from Latin America.” Carnegie-Rochester Conference Series on Public
43
Policy 45 (1): 129–62.
Maloney, William F. 2004. “Informality Revisited.” World Development 32 (7): 1159–78.
McKenzie, David, and Yaye Seynabou Sakho. 2010. “Does It Pay Firms to Register for Taxes?
The Impact of Formality on Firm Profitability.” Journal of Development Economics 91 (1): 15–
24.
Nichter, Simeon, and Lara Goldmark. 2009. “Small Firm Growth in Developing Countries.”
World Development 37 (9): 1453–64.
Oaxaca, Ronald L. 1973. “Male-Female Wage Differentials in Urban Labor Markets.”
International Economic Review 14 (3): 693–709.
Rogerson, Christian M. 1996. “Urban Poverty and the Informal Economy in South Africa’s
Economic Heartland.” Environment and Urbanization 8 (1): 167–79.
Rubio, Frank F. 1991. “Microenterprise Growth Dynamics in the Dominican Republic: The
ADEMI Case.” GEMINI Working Paper 21 (June), Development Alternatives, Bethesda, MD.
Tan, Hong W., and Geeta Batra. 1995. “Enterprise Training in Developing Countries: Incidence,
Productivity Effects, and Policy Implications.” Monograph, Private Sector Development
Department, World Bank, Washington, DC.
Winkelried, Diego. 2005. “Income Distribution and the Size of the Informal Sector.” Working
paper (October 25), St. John's College, University of Cambridge, Cambridge, UK.
World Bank. 2016. “ The Democratic Republic of Congo Poverty Assessment.” World Bank,
Washington. DC.