Embed Size (px)
Citation preview
Information Retrieval, 3, 189–216, 2000c© 2000 Kluwer Academic Publishers. Manufactured in The Netherlands.
Information Retrieval can Cope with Many Errors
ELKE MITTENDORF [email protected] AG, CH-8048 Zurich, Switzerland
PETER SCHAUBLE [email protected] Information Technology AG, CH-8006 Zurich, Switzerland
Received August 30, 1999; Revised January 7, 2000; Accepted January 19, 2000
Abstract. The retrieval of documents that originate from digitized and OCR-converted paper documents is animportant task for modern retrieval systems. The problems that OCR errors cause for the retrieval process havebeen subject to research for several years now. We approach the problem from a theoretical point of view andmodel OCR conversion as a random experiment. Our theoretical results, which are supported by experiments, showclearly that information retrieval can cope even with many errors. It is, however, important that the documents arenot too short and that recognition errors are distributed appropriately among words and documents. These resultsdisclose that an expensive manual or automatic post-processing of OCR-converted documents usually does notmake sense, but that scanning and OCR must be performed in an appropriate way and with care.
Keywords: probabilistic modelling, retrieval effectiveness, optical character recognition, data corruption
1. Introduction
There has been in recent years a growing need for the conversion of large paper and au-dio archives into electronic form so that these archives may be made accessible throughelectronic retrieval systems. Current generation optical character recognition and automaticspeech recognition systems, the core technologies of this conversion process, are still proneto many recognition errors however. It is therefore important to establish the extent to whicherrors (data corruption) introduced in the conversion of paper and audio archives affect theperformance of electronic retrieval systems used in accessing these archives.
The well-known redundancy in texts and the ability of modern information-retrieval (IR)systems to cope with uncertainty (e.g., Fuhr 1992) let us hope for a certain robustness ofretrieval systems against errors. This robustness is indeed one of the early results of exper-iments on corrupted data in information retrieval (Smith and Stanfill 1988, Glavitsch et al.1994, Sch¨auble and Glavitsch 1994, Croft et al. 1993). However, there are a lot of questionsleft open by experiments performed on corrupted data, e.g.: Why is information retrieval,to a surprisingly high degree, robust against data corruption? Under what circumstances isretrieval effectiveness decreased? What steps can be taken to improve retrieval on corrupteddata? In this paper, we shall concentrate on answering these questions for the retrieval ondata that contains errors because it was produced by optical character recognition (OCR).
There have been several attempts to assess the influence of data corruption on retrievalby a process of experimentation. These experiments have been expensive to develop and
190 MITTENDORF AND SCHAUBLE
have often produced non-intuitive results; results which have not always been successfullyinterpreted by the researchers involved. Information retrieval experiments without datacorruption are difficult to interpret on their own; combines with data-corruption effects it iseven more difficult to assess whether an observed pattern is incidental or represents a generalpattern. In contrast to these expensive experiments, difficult to understand, we have chosena new approach—a theoretical description of data corruption as a random experiment.
Though this work is based on a very theoretical analysis presented in Mittendorf andSchauble (1996) and Mittendorf (1998), we focus here on the practical implications ofthis theory on projects that scan and convert document collections by OCR to make themsearchable. For this reason we refrain from proving theorems, rather make the theoremsplausible and refer to our earlier work. Practical implications are e.g.:
– The scanning of documents still demands a considerable amount of manual work and, thus,has a great potential for saving money at the cost of scanning quality. It is, however, thewrong step for saving money. The result of our work is that it is extremely important thatall documents are digitised with considerable care and good quality. No OCR system andno intelligent retrieval system can compensate for what may be lost here.
– Fortunately, there is a potential to save money in the conversion process from picturesto text. It is a waste of money to aim at an error-less automatic recognition or evento manually type the documents. Good retrieval systems (based on feature-frequencyweighting, inverse document-frequency weighting, and document-length normalisationother than cosine normalisation) are extremely robust against recognition errors.
– Optimisation criteria for OCR systems such as the minimal number of character er-rors or word errors per page do not optimise retrieval effectiveness on OCR-converteddocuments. The smallest degradation of retrieval effectiveness can be achieved if thedistribution of errors among different words, different fonts and paper qualities and thusamong different documents is as close to an equal distribution as possible.
This paper is structured as follows. In Section 2 we sketch the random model and the mainresult of the theoretical analysis, i.e., themain theorem on robustness of retrieval ranking.Section 4 analyses the model, derives statements about the behavior of collection statistics,such as feature frequencies, and compares the statements with test collections. Section 5,finally, derives answers to the questions concerning the influence of data corruption oninformation retrieval from the theory. Consequences of this theoretical analysis for practicaldigitisation projects are concluded in Section 6.
2. A probabilistic model for data corruption
Typically, relevance ranking in information retrieval consists of anindexingstep and aretrieval function. The indexing step identifies the (indexing) featuresϕi —e.g., Porter-reduced non-stopwords—within a document or a query. The set of all features is denotedby8.
For describing data corruption by a probability model we have to deal with sets ofprobability spaces on three levels of complexity: the feature level, the document level, and
INFORMATION RETRIEVAL 191
the document collection level. The probability distributions on feature level that are ofinterest are the distributions for given tokenyk being recognized as a certain featureϕi ,Pyk(ϕi ) = P(x(yk) = ϕi ). Such a distribution depends on the featureϕi that the tokenrepresents and the document in which the token occurs (e.g., on the page quality, old andyellowed paper or new and white paper), and may be it depends on the position of the tokenwithin a document (e.g., if the scanner has the habit of distorting in particular the bottomparagraph of a page).
Indexing represents a documents as a sequence of features. Thus, for our model it makessense to describe the probability space on document levelÄdj as the product space of thecorruption of its features. We assume that the features that representdj andX(dj ). If for thedocumentdj = 〈y0, . . . , yl(dj )− 1〉, yi ∈ 8, the experimentX(dj ) can be described as con-sisting of theindependentexperiments on feature levelX(dj ) = 〈x(y0), . . . , x(yl(dj )− 1)〉thenPdj is the product distribution of the distributions of features that occur indj , i.e.,
Pdj = Py0 · · · Pyl(dj )−1.
This description implicitly assumes that features do not disappear, are not merged or split,and do not emerge from, e.g., a stopword. We discuss some violations of this assumptionbelow.
To understand the influence of data corruption on document ranking the probability spacemust describe all possible corruptions of a complete document collectionD, that is e.g., allpossible results of digitization and OCR conversion of a paper archive with a given scannerand an appropriate OCR device. The random process of taking one possible corruption ofDis denoted byX(D). Similarly to the product space for the document corruption, we definethe probability space onD, ÄD as the product space of the corruption of its documentsD := {d0, . . . ,dn−1}, i.e.,ÄD = Äd0 × · · · ×Ädn−1. A random experiment of taking onepossible corruption ofD is denoted byX(D), the random experiment of taking one possiblecorruption of a documentdj ∈ D is denoted byX(dj). This probability model assumes thatdocuments do not vanish, are not split, and do not magically appear from nowhere. Theseassumptions are realistic if the digitization is performed with appropriate care. That thiscare is essential for a digitization project seems to be obvious and we shall emphasise thislater on.
In contrast to the corrupted documents and collections there are theperfect documentsandperfect collections—which are the result of a process that converts the images or recordingsperfectly, e.g., the manual typing of the documents under the assumption that the typing isperformed without errors. We need perfect objects mainly as abstract concepts with whichwe compare the corrupted objects.
An elementary probability of the probability distribution on feature level is therecognitionprobability of a certain featureϕi within a certain documentdj , i.e.,pr (ϕi , dj). If a tokenyk within the document is an instance on the featureϕi , thenpr (ϕi , dj) is the probabilitythat an occurrence ofϕi in the documentdj is recognized as an instance ofϕi . Note thatwe assume dependence of the feature itself and of the document in which it occurs, butindependence of the particular position of the token. This granularity is sufficient since weshall investigate the ranking of documents, it may not be sufficient if we try to understand,e.g., passage retrieval.
192 MITTENDORF AND SCHAUBLE
Important random functions on the document level for the description of documents arethe following
– Thenoisy feature frequencies
nff(ϕi , dj ) :8∗ → N,nff(ϕi , dj ) := ff(ϕi , X(dj )),
(1)
where8∗ denotes the set of all possible strings over8. Note that the notation may bemisleading. For a given featureϕi and for a given documentdj the noisy feature frequencyis a random function on the probability spaceÄ = 8∗ and not a function on the set offeatures and the set of documents.
– Thenoisy document length,
nl(dj) :8∗ → N,nl(dj) := l(X(dj)),
(2)
measured e.g., in the number of tokens or the number of different features within adocument. Note that the well-known cosine length (Salton 1994) is not a random variableon document level, if the feature weighting is based on idf(ϕ) weighting.
Important random functions on the documents collection level are the following functions:
– Thenoisy document frequency,
ndf(ϕi ) :ÄD → N,ndf(ϕi ) := |{dj ∈ D | ff(ϕi , X(dj )) > 0}|, (3)
and thenoisy inverse document frequency,
nidf(ϕi ) :ÄD → R,
nidf(ϕi ) := 1− log(1+ ndf(ϕi ))
log(1+ n),
(4)
wheren := |D| is the number of documents in the collectionD. (Note that we assume|D| = |X(D)|.)
– Based on a given formula for determining a retrieval status value (RSV), there is thenoisy retrieval status value,
nRSV(q, dj ) :ÄD → R,nRSV(q, dj ) :=RSV(q, X(dj )).
(5)
Other interesting random functions on collection level are e.g., the noisy list, which describesbehavior of the ranking of documents after corruption, or the noisy average precision, whichdescribes the behavior of the performance measure average precision after corruption.
INFORMATION RETRIEVAL 193
Careful digitization: That documents do not disappear during scanning and OCR conversionrequires a careful digitization process. OCR errorscorrupt the information, which is notdesirable but information retrieval can cope with it. Careless scanning is, however respon-sible for thelossof information. Since scanning is a part of the digitization that incurs highcost, projects are inclined to save money with this step.
The loss of documents, however, incurs costs as well because the information need of userscannot then be satisfied completely. Performing the capturing of documents with appropriatecare, such that the loss of documents is minimized, also incurs costs. The expenses causedby an unsatisfied information need is recurring however, whereas the expense of capturingis a one-time cost.
We illustrate the importance of careful digitization: Letx be the probability that anarbitrary documentdi is lost. Further, letk be the number of documents that are relevantto a given query. Without loss of generality assume thatd0, . . . ,dk−1 are relevant. If theevent of losing a given document and the event of being relevant are independent then theprobability that at least one relevant document is lost is
P(at least one relevant document is lost)
= P(d0 is lost∨d1 is lost∨ . . . ∨ dk−1 is lost)
= 1− P(d0 is not lost∧ . . . ∧ dk−1 is not lost)
= 1− (1− x)k. (6)
If, for example, only 1 document out of 1000 documents is lost thenx = 0.001 and ifthere are 100 relevant documents then
P(at least one relevant document is lost)= 0.095. (7)
In a scenario of searches where users need “everything about a certain topic” (a typicalexample are searches for patents) this equation means that there is almost a 10% chancethat a user’s information need cannot be satisfied fully. This might be bearable if a user needssomething about a topic, but not if he or she needs everything about a topic. Of course, incases where it is obvious that users usually query for “something about a topic” the qualityconstraints for scanning may be relaxed.
Consider another scenario: Assume that a retrieval system has to serve about 100known-item searchesper day, i.e., the user knows that there is a document in the collection and heor she wants to find exactly this document. Assume that the 100 known-item searches askfor 100 different documents. Then the probability that at least one of the relevant documents(known items) is lost is, as in (7), 0.095, this number means that with almost a 10% chancethe system is not able to answer all searches per day. For example, in a patent informationsystem it can cause a lot of trouble if the patent that was searched for is present but thesystem cannot find it. In this case the loss of 0.1% of the documents is too expensive.
3. Overtaking probabilities and the main theorem on robustnessof retrieval ranking
In information retrieval the recognition probabilities are only an intermediate piece of infor-mation on the way to knowing how seriously rankings are permutated by data corruption.
194 MITTENDORF AND SCHAUBLE
In particular for a highly ranked document we want to know how many lower ranked doc-uments haveovertakenthem in the corrupted ranking. This point-of-view motivates thedefinition ofovertaking probabilities.
Definition 1. Theovertaking probabilityfor the documentsdj anddk with RSV(q, dj )>
RSV(q, dk) is the probability
P(nRSV(q, dk) > nRSV(q, dj )). (8)
In this section we investigate the systematic effects of data corruption on the ranking byinspecting the expected value E(nRSV(Q, dj )) and the variance Var(nRSV(q, dj )).
An important concept in this context is, whether or not we can expect the documents tobe ranked in the perfect order:
Definition 2. If for the pair (dj , dk) with RSV(q, dj ) > RSV(q, dk)
E(nRSV(q, dj )) > E(nRSV(q, dk)) (9)
holds we say thequality condition is met, if
E(nRSV(q, dj )) < E(nRSV(q, dk))
we say thequality condition is violated.
We denote the difference between a pair of retrieval status values by
δ jk(q) := RSV(q, dj )− RSV(q, dk). (10)
and we denote the difference between a pair of expected noisy retrieval status values by
1 jk(q) := E(nRSV(q, dj ))− E(nRSV(q, dk)). (11)
We are now able to describe the behavior of the overtaking probabilities in more detailby bounding them. We report the bounds in the following theorem. The theorem is the basictheoretical result for our analysis of the influence of data corruption; so that we considerthis theorem to be themain theorem on robustness of retrieval ranking.
Theorem 1. Assume thatnRSV(q, dj ) andnRSV(q, dk) are stochastically independent.LetRSV(q, dj )>RSV(q, dk). If the quality condition is met then
P(nRSV(q, dk) > nRSV(q, dj )) ≤ Var(nRSV(q, dj ))+ Var(nRSV(q, dk))
(1 jk(q))2. (12)
INFORMATION RETRIEVAL 195
If the quality condition is violated then
P(nRSV(q, dk) > nRSV(q, dj )) ≥ 1− Var(nRSV(q, dj ))+ Var(nRSV(q, dk))
(1 jk(q))2.
(13)
The proof, basically an application of Chebychev’s inequality, is reported in the Appendix.
Interpretation of the main theorem: The statement of the main theorem is very abstract. Weinterpret the theorem to further illustrate the abstract statement of Theorem 1. Obviously, ifthe terms on the right side of Inequality (12) and (13) are greater than 1 or smaller than 0 thenTheorem 1 is useless. For other cases it leads to some interesting preliminary conclusionsabout data corruption effects on information retrieval.
– Generally speaking, the smaller the variances of the noisy retrieval status values, thehigher is the probability that the ranking of the documents will be in accordance with theexpected noisy retrieval status values E(nRSV(q, dj )).
– The two inequalities (12) and (13) indicate that, for a sufficiently small variance of noisyretrieval status values, the more pairs violate the quality condition, the more is the rankingcorrupted.
In other words, the essence of Theorem 1 is as follows: The ranking is less corrupted ifthe quality condition is often met and the variance is small.
4. The behavior of collection statistics in theory and in reality
Modern retrieval functions are constructed from statistics that are computed on documents,such as feature frequencies and document length, and from statistics that are computedon collections, such as inverse document frequencies and average document length. In thissection we investigate behavior and values of recognition probabilities on our test collectionand also the behavior of the noisy feature frequencies. For the analysis, theoretically andempirically, of other statistics, such as the noisy logarithmic feature frequencies, noisydocument lengths, noisy inverse document frequencies, etc. we refer to (Mittendorf 1998).
4.1. The test collection
Documents: We used the collection from the TREC-5 confusion track (Voorhees andKantor 1997), which is provided by the National Institute of Standards and Technologies(NIST) as a test collection. It consists of three parallel collections; one perfect collectionD=FR94 and two different corrupted versions of FR94,X(D)=D5 andX(D)=D20. Notethat in our model these two collections are samples generated by two different probabilitydistributions. The collection FR94 consists of 250 Mbyte of data from the 1994 FederalRegister, that are in total 55340 documents of varying length. All documents are written inAmerican English.
196 MITTENDORF AND SCHAUBLE
It is described in Voorhees and Kantor (1997) how the test collection has been produced.The D5 collection is estimated to have a character recognition probability of 95% (a “de-grade” of 5%, therefore the name D5). The D20 collection is estimated to have a characterrecognition probability of 80% (a “degrade”of 20%, D20). The document boundaries havebeen preserved. There were documents lost by the capturing process but we have excludedthem from the test collection.
The production of the test collection at NIST compromised between cost and authenticity.There was no scanning involved, thus the test collection is realistic only to a certain extent.Typical errors due to scanning (crinkled or dirty paper, paper skew, or even the loss ofdocuments) cannot be found in the corrupted collections. However, the errors in D5 andD20 are more realistic than the errors in collections with simulated data corruption; mostimportantly, the size of the test collection is more realistic than all parallel collections thathave been produced by manual corrections in previous experiments, which have generallyconsisted of no more than a few thousand documents.
Queries and relevance information: The NIST has provided 49 known-item searches onthe FR94 collection, which are called CF1,. . . , CF50 (CF29 has been removed from thequery collection). For each query the set of relevant documents consists of exactly onedocument,|Drel(q)| = 1. Known-item searches require a very specialized kind of queries,since they are highly precision-oriented searches. The queries in the test collection thusrepresent only a small subset of all possible queries.
Indexing: We chose a standard indexing procedure for English texts for feature extraction(Ballerini et al. 1997). A feature class consists of all words of at least three consecutivealphanumeric characters, from which the first character must be a letter (a–z or A–Z), thatare reduced to the same stem by Porter’s algorithm (Porter 1980) and that are not an elementof SMART’s stoplist (Salton 1971). The feature extraction is case insensitive. We refer tothese features asPorter-reduced non-stopwords.
The size of the queries, measured in the number of indexing features, is rather small.The smallest queries consist of only one feature; the longest query consists of 14 features.Altogether the 49 queries are made up of 250 features, which is an average of 5.1 featuresper query.
4.2. Recognition probabilities
In this section we estimate collection-wide recognition probabilities on the OCR test col-lection on a feature basis. We consider both the corruption of D5 and the corruption of D20as random experiments. Note that from the model point of view in this experiments we haveonly one realization for each of the two random experiments. Note that we denote a real-ization in the same way as we denote the random variables themselves. We assume that therecognition probabilities are constant across documents, i.e.,pr (ϕi , dj ) = pr (ϕi ), dj ∈ D,so as to have enough samples for a reliable estimation.
INFORMATION RETRIEVAL 197
We count the collection frequency for each of the 250 featuresϕi that occur in the queryset of the test collection:
cf(ϕi ) :=∑dj∈D
ff(ϕi , dj ),
we similarly count the noisy collection frequency,
ncf(ϕi ) :=∑dj∈D
nff(ϕi , dj ) =∑
X(dj )∈X(D)
ff(ϕi ,X(dj)),
for χ(D) = D5 and forχ(D) = D20. The ratio of cf(ϕi ) and ncf(ϕi ) is unfortunatelyaffected not only by the recognition probability but also by the false alarms. If we subtractthe noisy feature frequency nff(ϕi, dj) of those documentsdj where ff(ϕi , dj ) = 0 from thenoisy collection frequency, we eliminate a great portion of all false alarms. Thus, a roughestimate of the recognition probability is given by:
pr (ϕi ) :=ncf(ϕi )−
∑dj ,ϕi /∈dj
nff(ϕi , dj )
cf(ϕi ). (14)
Note that for featuresϕi with a small document frequency the estimate in (14) is not a goodestimate.
We eliminate features with zero collection frequency from the experiment and also ignorethe feature “late”, which happens to have extremely many false alarms.
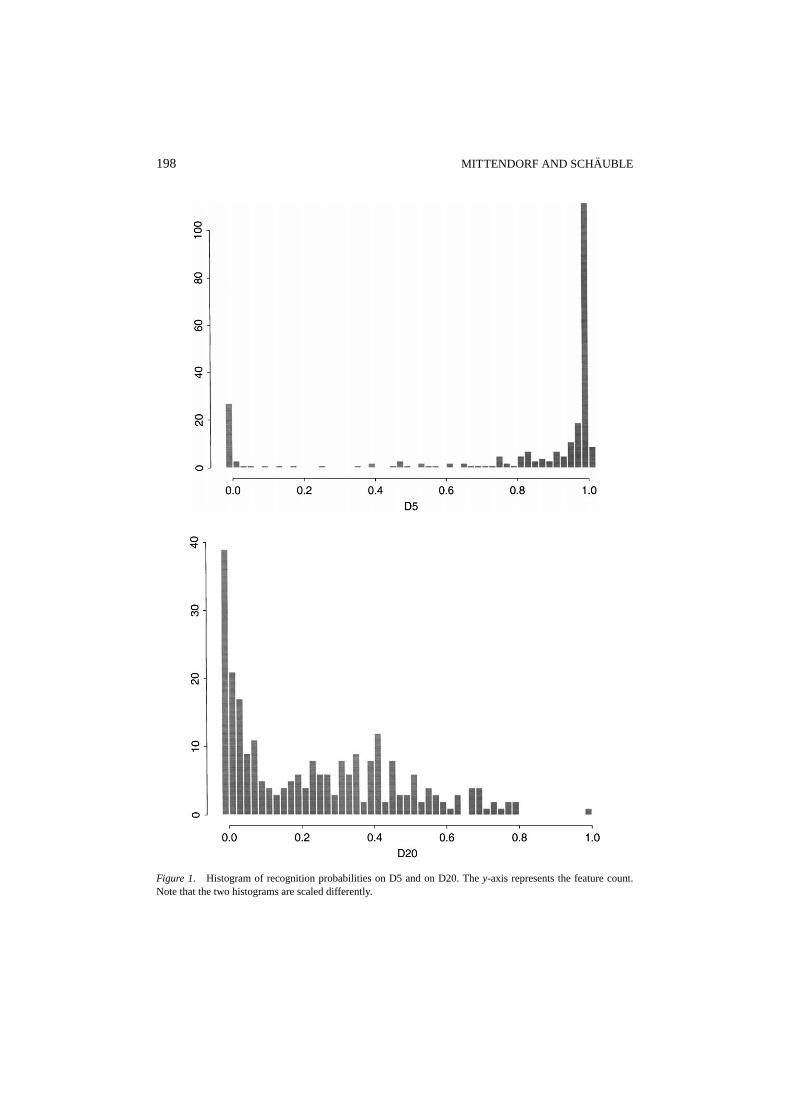
Results and their interpretation: The values for the estimatepr (ϕi ) on D5 and on D20 aresummarised in the histograms in figure 1. The histogram on the left and on the right showthe estimates of recognition probabilities on D5 and on D20, respectively.
The collection D5 is supposed to have a recognition probability of characters of 95%.If the recognition errors are distributed equally across characters we expect word recogni-tion probabilities of approximately 0.958= 0.66 (words with 8 characters) to 0.954= 0.81(words with 4 characters). This is not represented in the the histogram for D5, which re-flects a very skewed distribution. More than half of the query features have a recognitionprobability of 0.97 and higher, other features are never recognised.
The D20 collection contains many more features that are never or almost never recog-nized. Besides the unproportionally high number of features that are never recognized thecollection D20 represents an equal error distribution of most of the features: D20 is sup-posed to have a character recognition probability of 80%. For words of 4 to 8 characterswe can expect to have word recognition probabilities between 0.88= 0.17 and 0.84= 0.41.There are indeed many features with recognition probabilities between 0.2 and 0.4.
A closer look at the misrecognized features reveals the reason for the unequal distribu-tion: All 33 features out of the 250 features in the test set that have recognition probabilitypr (ϕi ) < 0.1 on D5 contain the letterj, the letterz, the letterk, or they occur exclusively incapitalised form, such as the feature “indian”. In this experiment the OCR device system-atically fails for these three letters and capital characters. This behavior of an OCR device
198 MITTENDORF AND SCHAUBLE
Figure 1. Histogram of recognition probabilities on D5 and on D20. They-axis represents the feature count.Note that the two histograms are scaled differently.
INFORMATION RETRIEVAL 199
is not uncommon and can be explained by the way these devices are trained. We shall seein Section 5.4 that the skewed distribution of recognition probabilities causes problems forretrieval and we briefly discuss the reason for the skew in Section 5.5.3.
4.3. Noisy feature frequencies
Feature frequencies are a very important component of effective retrieval functions. Ingeneral, the higher the feature frequencies of query features in a document, the higher isthe probability that the document is relevant to the query (Robertson and Walker 1994).We show (theoretically and empirically) that high feature frequencies cause high noisyfeature frequencies; they are indeed related proportionally with random deviations. Thus,we claim that noisy feature frequencies as well as feature frequencies can be used as reliableestimators for relevance probabilities.
We have provided a theoretical description of the random variables nff(ϕi , dj ), ϕi ∈8, dj ∈ D in Mittendorf (1998) by rewriting noisy feature frequencies as a sum of Bernoullivariables of feature recognitions. We report here the result: If the false alarms are negligiblethen
E(nff(ϕi , dj )) = ff(ϕi , dj )pr (ϕi , dj ). (15)
and
Var(nff(ϕi , dj )) =∑yk=ϕi
Var(Yk)+∑yk 6=ϕi
Var(Yk)
= ff(ϕi , dj )pr (ϕi , dj )(1− pr (ϕi , dj )) (16)
These formulas indicate that noisy feature frequencies increase proportionally with featurefrequencies. The next section validates the formula on a collection-wide basis.
4.4. The analysis of the behavior of noisy feature frequencies on the test collection
To validate formula (15) we need many samples and thus must rely on features with recogni-tion probabilities that are constant across documents, i.e.,pr (ϕi , dj )= pr (ϕi ) for all dj ∈ D.We chose the featureϕi = “provid” on D20 for the following reasons: It occurs very of-ten in the collection, 76546 times in 28946 documents, which promises reliable estimates.It has an overall recognition probability ofpr (ϕi )= 0.41. Recall that 0.41 is exactly therecognition probability of an eight-letter word (such as ‘provides’ or ‘provider’) if eachcharacter has probability 0.8. and thus we can expect that the errors are equally distributedamong all occurrences of the feature in the collection. As most other features, the feature“provid” has a negligible false alarm rate. In Mittendorf (1998) two more feature exampleshave been analysed.
For the given featureϕi = “provid” we produce a set of tuples (ff(ϕi , dj ), nff(ϕi , dj )),with dj ∈ FR94 andX(dj ) ∈ D20. A regression analysis ((Stahel 1995, p. 257) or (Venablesand Ripley 1994)) is performed on the set of tuples; in particular, a “simple linear analysis
200 MITTENDORF AND SCHAUBLE
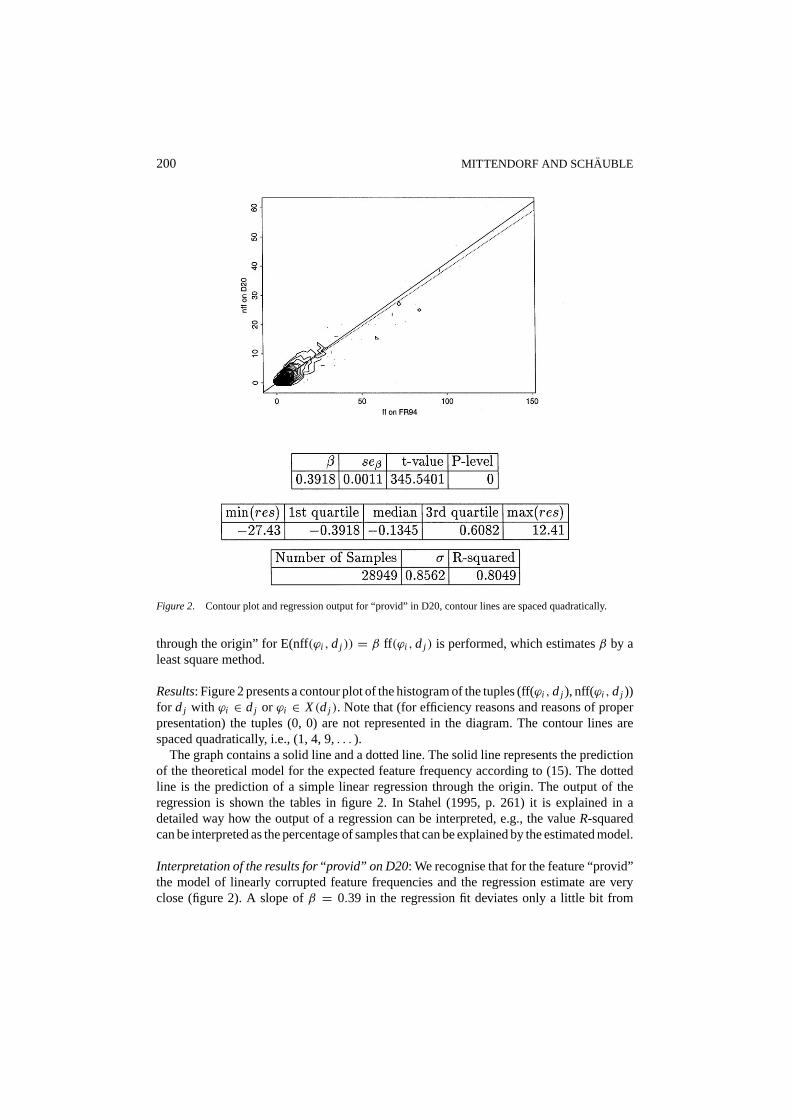
Figure 2. Contour plot and regression output for “provid” in D20, contour lines are spaced quadratically.
through the origin” for E(nff(ϕi , dj )) = β ff(ϕi , dj ) is performed, which estimatesβ by aleast square method.
Results: Figure 2 presents a contour plot of the histogram of the tuples (ff(ϕi , dj ), nff(ϕi , dj ))for dj with ϕi ∈ dj or ϕi ∈ X(dj ). Note that (for efficiency reasons and reasons of properpresentation) the tuples (0, 0) are not represented in the diagram. The contour lines arespaced quadratically, i.e., (1, 4, 9,. . . ).
The graph contains a solid line and a dotted line. The solid line represents the predictionof the theoretical model for the expected feature frequency according to (15). The dottedline is the prediction of a simple linear regression through the origin. The output of theregression is shown the tables in figure 2. In Stahel (1995, p. 261) it is explained in adetailed way how the output of a regression can be interpreted, e.g., the valueR-squaredcan be interpreted as the percentage of samples that can be explained by the estimated model.
Interpretation of the results for“provid” on D20: We recognise that for the feature “provid”the model of linearly corrupted feature frequencies and the regression estimate are veryclose (figure 2). A slope ofβ = 0.39 in the regression fit deviates only a little bit from
INFORMATION RETRIEVAL 201
the model parameter of 0.41. The hight-value and the small estimated standard error forβ, seβ , show a high reliability of the estimate. A high percentage of about 80% of the 28949samples fit the regression model (R-squared).
In summary, the model presented in Section 2 and the theoretically-derived formula (15)fit the OCR test data very well. We have not tried to show whether the formula for thevariance (16) is valid or not. The tendency of increasing variance with increasing featurefrequency, however, is traceable as shown in Mittendorf (1998).
5. The influence of data corruption on information retrieval effectiveness
5.1. Retrieval on corrupted data is feasible
It has been one of the first results in the field of analysing data-corruption effects oninformation retrieval that retrieval on corrupted data is feasible. Researchers have evenbeen surprised at how well retrieval works on highly-corrupted data (Smith and Stanfill1988, Sch¨auble and Glavitsch 1994, Croft et al. 1993, Glavitsch et al. 1994). There ishowever a certain difference in the results that emerge from experiments with simulateddata corruption and from experiments on genuinely-corrupted data. Whereas in both sets ofexperiments the main result is that retrieval is in general robust against data corruption, theexperiments on genuinely-corrupted data has shown that there are queries, for which theretrieval effectiveness has suffered to a very high degree. However, this section explainsthe high robustness; possible problems are discussed in the following sections.
Let us introduce a notation for a general retrieval function:
RSV(q, dj ) := 1
norm(dj )
∑ϕi∈q
a(ff(ϕi , dj ))b(ff(ϕi ,q))w(ϕi ), (17)
wherea, b, norm, andw are non-negative real functions,a andb must not depend on anycollection-wide statistics such as document frequencies. Typicallya andb stand for theidentity function (linear feature frequency weighting) or for a logarithmic transformationsuch as 1+ log(ff(ϕi , dj )). The weightw collects all components of a weighting functionthat depend on collection-wide statistics for the featureϕi , a typical functionw is e.g.,w(ϕi ) = idf(ϕi ). The function norm (dj ) stands for the factor that provides document lengthnormalisation. We shall present here a rather informal explanation why data corruption isrobust. For a formal proof on some retrieval functions refer to Mittendorf and Sch¨auble(1996) and Mittendorf (1998).
Let the following assumptions hold:
– The recognition probability is constant across features and documentspr (ϕi , dj ) =pr , ϕi ∈ 8, dj ∈ D.
– We can approximate E(a(nff(ϕi , dj ))) = Ca(ff(ϕi , dj )),C > 0. For linear feature-frequency weighting this is a good model as shown in 4.3 and also for logarithmicfeature-frequency weighting it is an appropriate model (Mittendorf 1998).
– The normalization is robust against data corruption norm (X(dj ))= norm(dj ). We knowe.g., that length normalization based on the number of tokens is extremely robust, but
202 MITTENDORF AND SCHAUBLE
cosine normalization is not, since the cosine length of a corrupted document is domi-nated by misrecognized low-frequency words and thus high-inverse-document-frequencywords. This fact has been explained in Taghva et al. (1994).
– Theb(ff(ϕi , q)) is robust. In other words, the query is not corrupted.– w(ϕi ) is robust. The inverse document frequency weightw(ϕi )= idf(ϕi ) is not robust,
but weights derived from a training collection are robust.
Then
E(nRSV(q, dj )) = CRSV(q, dj ),
and thus the quality condition (2) is always met, which means that overtaking probabilitiesare low (Theorem 1) and the ranking is likely to be robust.
This behavior reveals that it does not make sense to aim at an error-less recognitionwhen digitizing for retrieval. It is more important to control the distribution of errors amongdocuments and words as will be shown in the Section 5.4.
5.2. The influence of the document length
Previous experiments of retrieval on corrupted data, in particular experiments in Croftet al. (1993), have led to theconjecturethat for long documents retrieval is more robustagainst data corruption than retrieval on short documents. Together with some intuitiveconsiderations—i.e., long documents are more redundant and thus are less prone to the lossof feature occurrences—the conjecture became a conviction in the field of analyzing datacorruption effects on information retrieval. We do not have to rely on intuitive considerationshowever, we haveprovedthe conjecture formally and specified it in Mittendorf (1998) intheTheorem on Robustness and Document Length.
Theorem 2. Assume that there is an infinite sequence of pairs(d(0)j , d
(0)k
),(d(1)j , d
(1)k
),(d(2)j , d
(2)k
), . . .
which satisfy the following requirements.
1. The corresponding lengths l(h)j and l(h)k and the normalization factors are unbounded,
i.e.,
limh→∞
norm(d(h)j
) = ∞ and limh→∞
norm(d(h)k
) = ∞. (18)
2. Assume that the quality condition is either met for all pairs in the sequence(d(h)j , d(h)k ), h∈
N, or that it is violated for all pairs. Furthermore, assume that there exists a positivelower bound1 such that for all1(h)
jk := E(nRSV(q, d(h)j ))− E(nRSV(q, d(h)k ))∣∣1(h)jk
∣∣ > 1. (19)
INFORMATION RETRIEVAL 203
3. Assume that there exists a K> 0 such that we have for all h∈ N and for allϕi ∈ q
Var(a(nff(ϕi , d
(h)j
))) ≤ Knorm(d(h)j
),
Var(a(nff(ϕi , d
(h)k
))) ≤ Knorm(d(h)j
).
(20)
Then we can conclude that, if for all (d(h)j , d(h)k ), h ∈ N, the quality condition is met,
P(nRSV
(q, d(h)k
)> nRSV
(q, d(h)j
))→ 0 (21)
or, if for all (d(h)j , d(h)k ), h ∈ N, the quality condition is violated,
P(nRSV
(q, d(h)k
)> nRSV
(q, d(h)j
))→ 1, (22)
as h→∞.
Theproof is a direct consequence of Theorem 1 and is similar to the proof of the law oflarge numbers. It is worked out in detail in Mittendorf (1998).
This lengthy and somewhat formal theorem may be deterring, but the advantages of theformalism are that the theorem reveals interesting facts more than just the influence of thedocument length.
Interpretation:
– The main implication: The longer the documents in a collection the smaller is the prob-ability that in the presence of errors the rankings are permutated (robustness).
– If documents become longer because they talk about many different topics (scope hy-pothesis (Robertson and Walker 1994)) the difference between the RSV of different doc-uments vanishes, in particular if the RSV are normalised by the document length. Thus,Condition (19) is violated and we cannot imply the robustness. However, if documentsbecome longer because the authors are very verbose (verbosity hypothesis (Robertsonand Walker 1994)) upon one and the same topic the same features recur and with anappropriate document normalization Condition (19) holds.
– We have elaborated in Mittendorf (1998) that the conditions of the theorem hold forwell-known retrieval functions such as proposed by Singhal et al. (1996) and Robertsonand Walker (1994). It is important that the document length normalization is based onthe number of features or the number of tokens in a document.
– The theorem does not state that any collection of long documents is superior to anycollection of short documents in terms of robustness against data corruption. It onlyindicates a general tendency.
5.3. How can robustness be improved if your documents are short?
The Theorem on Robustness and Document Length suggests to digitize a complete docu-ment and not only its summary if both are available. On the one hand the theorem indicates
204 MITTENDORF AND SCHAUBLE
that wordy documents are easier to digitise than concise documents, unfortunately. On theother hand, the theorem also helps us to improve digitization of short and concise documentsfor retrieval purposes. We shall state some tricks to improve robustness. These tricks are ina sense ways of decreasing the variance of the noisy retrieval status values.
1. A common approach in retrieval of corrupted data is the use of n-gram features insteadof feature classes containing words such as porter-reduced non-stopwords.
A token of a word-based feature is only recognized correctly if all of its characters(except for some stemmer-dependent special cases) and thus all the constituting n-gramsare recognized correctly. Thus features based on n-grams have usually higher recognitionrates than word-based features. In addition to the positive effect of lower recognitionprobabilities there are more n-gram tokens in a document than tokens of word-classfeatures. Thus, the documents are longer if length is measured in terms number oftokens and thus we can expect the variance Var(nRSV(q, dj )) to be smaller.
However, n-gram retrieval has a lower retrieval effectiveness than standard word-basedretrieval on perfect data (Cavnar 1992, Teufel 1989, Wechsler and Sch¨auble 1995). Thusthere is a trade-off which has to be considered. In practice n-gram retrieval often paysoff for highly corrupted data.
2. A similar method is to use n-gram featuresandword-class features simultaneously, whichis reported to be successful for experiments with highly-corrupted data in Harding et al.(1997). On perfect data however combining n-gram features with word-based featuresresults in less effective retrieval than word-based features only.
3. One can improve the estimates of the feature frequencies by applying several independentrecognition devices. The recognition quality can be improved by combining differentrecognition methods, e.g., (Garzotto 1994, J¨ager 1996, Jones et al. 1996). However, asmentioned before, a slight improvement of recognition probabilities hardly decreasesthe ranking corruption.
We rather plead for using the different devices to improve the estimate of the RSV. Interms of our probability model different devices yield different independent realizationsof the random functionX(dj ). Note that in case of paper documents, for example oncethe documents are scanned, it is not too much of a problem to run a batch systemthat employs several OCR systems. This approach is, however, very memory intensive.Note that the OCR devices must be independent, that means, in particular, they must bedifferent.
4. Probabilistic matching methods such as described in Mittendorf et al. (1995) have beendeveloped to get better estimates of the perfect feature frequencies: Not only the exactoccurrences of features (as in our probability model) are included in the computation ofnoisy feature frequencies but similar strings in the document are also taken into accountin order to improve the estimate of the noisy feature frequency.
Theorem 1 shows us that a small variance Var(nff(ϕi , dj )) must be a design criterionfor a good probabilistic-matching method that estimates feature frequencies, in particularif we have to deal with short documents and small recognition probabilities because bothproperties lead to high variance, Theorem 2 and Eq. (16). In these cases the additionaleffort of an improved estimate is worthwhile.
INFORMATION RETRIEVAL 205
Unfortunately the effect of the document length cannot be validated with the test collectionbecause ranking corruption is dominated by other factors (as we will show in Section 5.4).This effect has, however, been illustrated before by others (Croft 1993).
5.4. The influence of recognition probabilities that vary from document to documentor from feature to feature
This section explains two factors that degrade information retrieval performance signifi-cantly. We first explain the reason for the degradation of retrieval performance and thenshow on our test collection that indeed these two factors are the major reasons for retrievaldegradation under data corruption.
5.4.1. Variation from document to document.Let us first consider a case where therecognition probabilities of all features within one and the same document are constant,pr (ϕi , dj )= pr (dj ) for all ϕi ∈ dj . Consider a general RSV-function (17). As in Section 5.1assume uncorrupted normalization (such as pivoted normalization based on the number oftokens), uncorrupted feature weightingw(ϕi ) (such as inverse document frequency weight-ing based on document frequencies from an uncorrupted training collection), and a linearfeature-frequency weighting. Then we have
E(nRSV(q, dj )) = 1
norm(dj )
∑ϕi∈q
E(nff(ϕi , dj )) ff(ϕi ,q)w(ϕi )
= 1
norm(dj )
∑ϕi∈q
pr (dj ) ff(ϕi , dj )) ff(ϕi ,q)w(ϕi )
= pr (dj )RSV(q, dj ). (23)
Note that a similar behavior of the corruption of E(nRSV(q, dj )) can be observed for otherweighting schemes, e.g., for logarithmic feature weighting (Mittendorf 1998).
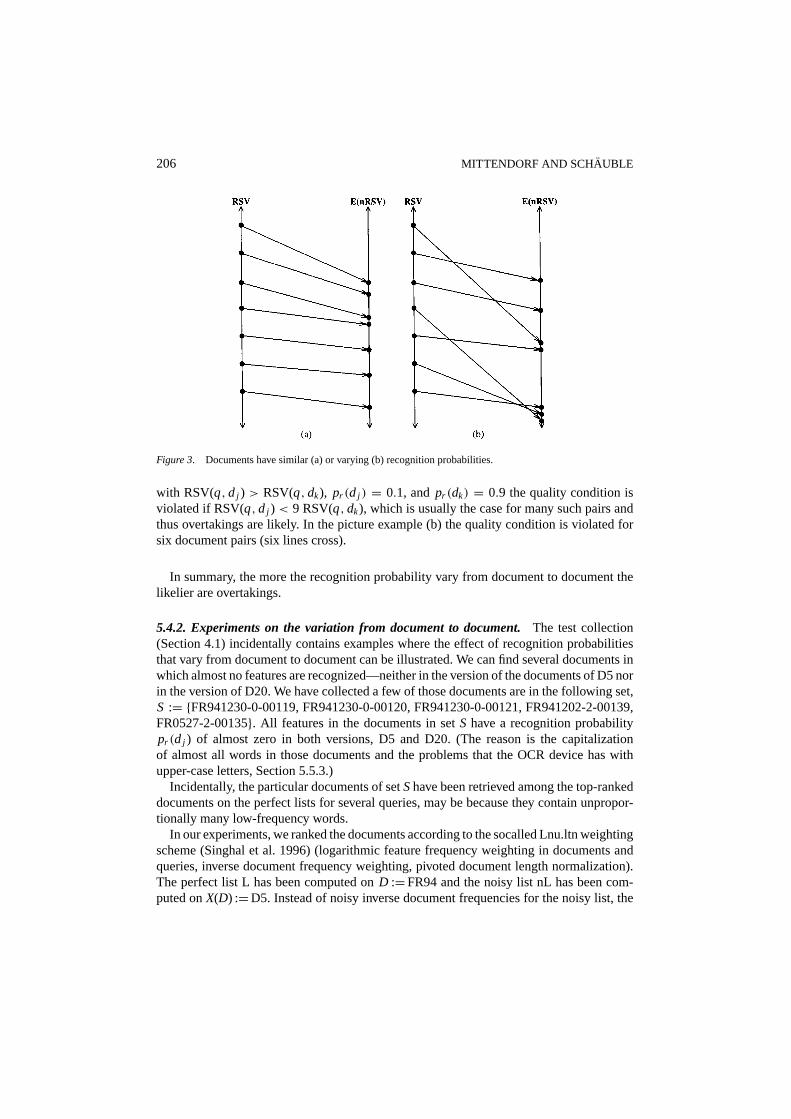
Example. Figure 3 illustrates some overtaking scenarios. Two number axes are opposedto each other in both of the two pictures in the figure. The left axis in each of the picturescontains the documents ranked according to their RSV(q, dj ) and on the right axis ineach of the pictures the documents are placed according to their E(nRSV(q, dj )). Therepresentatives of the same document on the left and right axes are connected with lines.The left picture (a) represents an example for which the recognition probabilities are almostconstant across documents, let e.g., 0.7 ≤ pr (dj ) ≤ 0.8 for all documents. In this case thequality condition is always or almost always met; in the picture example the connecting lineddo never cross, and thus overtakings are not very likely, besides the moderate recognitionprobabilities. The right picture (b) represents an example in which the probabilities varyheavily. Let e.g.,pr (dj ) = 0.1 for documents out of a certain subset (in the picture examplefor those document ranked 1st, 4th, and 5th by the perfect ranking)pr (dj ) = 0.9 for allother documents (in the picture example the 2nd, 3rd, 5th, and 7th document on the perfectranking). For such recognition probabilities the quality condition of a document pair (dj , dk)
206 MITTENDORF AND SCHAUBLE
Figure 3. Documents have similar (a) or varying (b) recognition probabilities.
with RSV(q, dj ) > RSV(q, dk), pr (dj ) = 0.1, andpr (dk) = 0.9 the quality condition isviolated if RSV(q, dj ) < 9 RSV(q, dk), which is usually the case for many such pairs andthus overtakings are likely. In the picture example (b) the quality condition is violated forsix document pairs (six lines cross).
In summary, the more the recognition probability vary from document to document thelikelier are overtakings.
5.4.2. Experiments on the variation from document to document.The test collection(Section 4.1) incidentally contains examples where the effect of recognition probabilitiesthat vary from document to document can be illustrated. We can find several documents inwhich almost no features are recognized—neither in the version of the documents of D5 norin the version of D20. We have collected a few of those documents are in the following set,S := {FR941230-0-00119, FR941230-0-00120, FR941230-0-00121, FR941202-2-00139,FR0527-2-00135}. All features in the documents in setS have a recognition probabilitypr (dj ) of almost zero in both versions, D5 and D20. (The reason is the capitalizationof almost all words in those documents and the problems that the OCR device has withupper-case letters, Section 5.5.3.)
Incidentally, the particular documents of setShave been retrieved among the top-rankeddocuments on the perfect lists for several queries, may be because they contain unpropor-tionally many low-frequency words.
In our experiments, we ranked the documents according to the socalled Lnu.ltn weightingscheme (Singhal et al. 1996) (logarithmic feature frequency weighting in documents andqueries, inverse document frequency weighting, pivoted document length normalization).The perfect list L has been computed onD :=FR94 and the noisy list nL has been com-puted onX(D) :=D5. Instead of noisy inverse document frequencies for the noisy list, the
INFORMATION RETRIEVAL 207
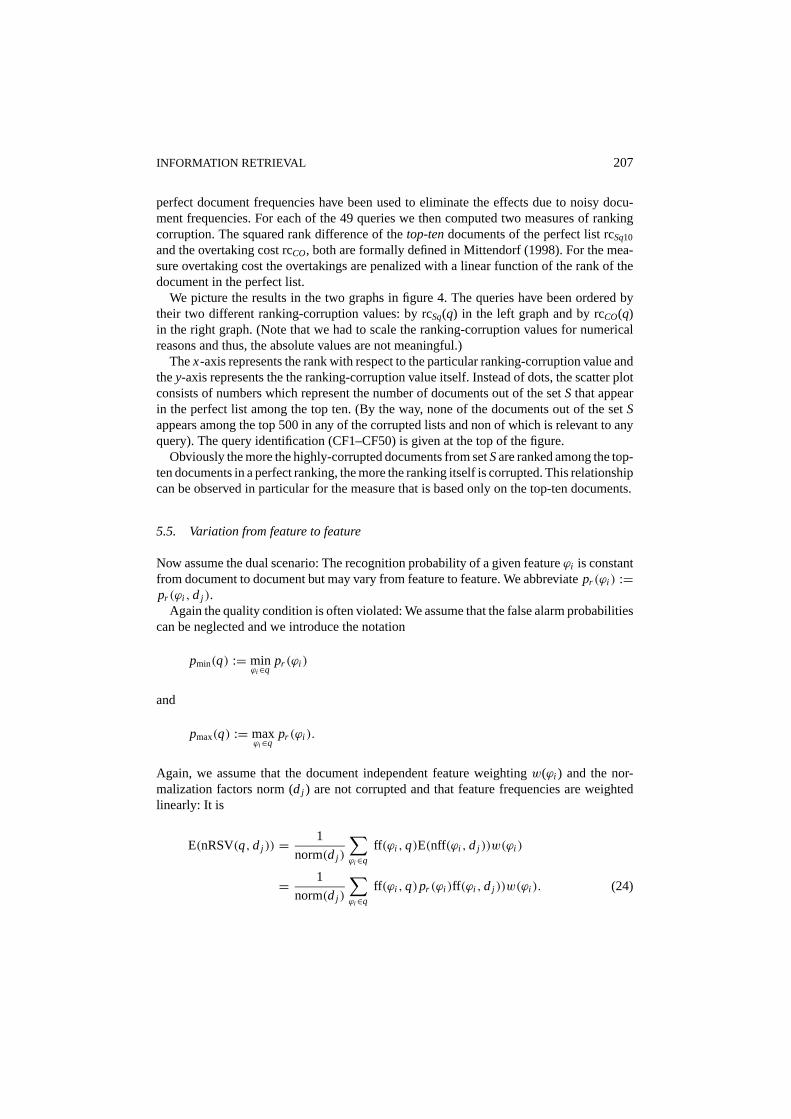
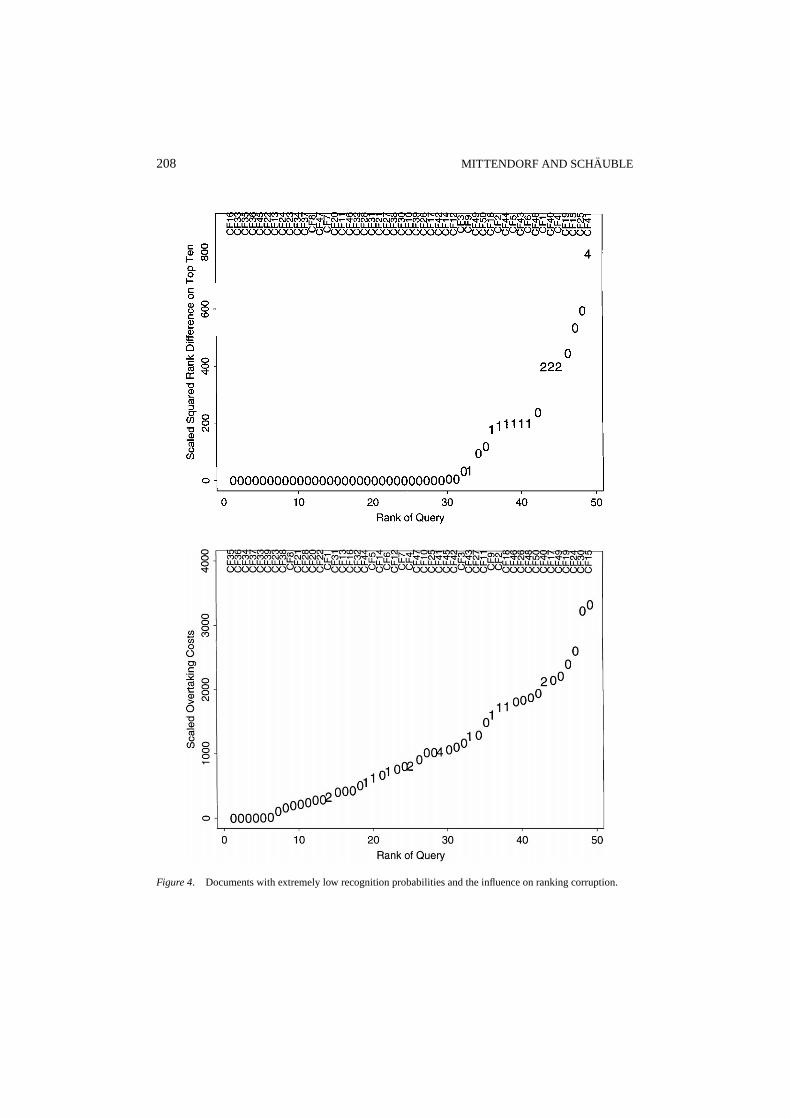
perfect document frequencies have been used to eliminate the effects due to noisy docu-ment frequencies. For each of the 49 queries we then computed two measures of rankingcorruption. The squared rank difference of thetop-tendocuments of the perfect list rcSq10
and the overtaking cost rcCO, both are formally defined in Mittendorf (1998). For the mea-sure overtaking cost the overtakings are penalized with a linear function of the rank of thedocument in the perfect list.
We picture the results in the two graphs in figure 4. The queries have been ordered bytheir two different ranking-corruption values: by rcSq(q) in the left graph and by rcCO(q)in the right graph. (Note that we had to scale the ranking-corruption values for numericalreasons and thus, the absolute values are not meaningful.)
Thex-axis represents the rank with respect to the particular ranking-corruption value andthey-axis represents the the ranking-corruption value itself. Instead of dots, the scatter plotconsists of numbers which represent the number of documents out of the setS that appearin the perfect list among the top ten. (By the way, none of the documents out of the setSappears among the top 500 in any of the corrupted lists and non of which is relevant to anyquery). The query identification (CF1–CF50) is given at the top of the figure.
Obviously the more the highly-corrupted documents from setSare ranked among the top-ten documents in a perfect ranking, the more the ranking itself is corrupted. This relationshipcan be observed in particular for the measure that is based only on the top-ten documents.
5.5. Variation from feature to feature
Now assume the dual scenario: The recognition probability of a given featureϕi is constantfrom document to document but may vary from feature to feature. We abbreviatepr (ϕi ) :=pr (ϕi , dj ).
Again the quality condition is often violated: We assume that the false alarm probabilitiescan be neglected and we introduce the notation
pmin(q) := minϕi∈q
pr (ϕi )
and
pmax(q) := maxϕi∈q
pr (ϕi ).
Again, we assume that the document independent feature weightingw(ϕi ) and the nor-malization factors norm (dj ) are not corrupted and that feature frequencies are weightedlinearly: It is
E(nRSV(q, dj )) = 1
norm(dj )
∑ϕi∈q
ff(ϕi ,q)E(nff(ϕi , dj ))w(ϕi )
= 1
norm(dj )
∑ϕi∈q
ff(ϕi ,q)pr (ϕi )ff(ϕi , dj ))w(ϕi ). (24)
208 MITTENDORF AND SCHAUBLE
Figure 4. Documents with extremely low recognition probabilities and the influence on ranking corruption.
INFORMATION RETRIEVAL 209
Then because
pmin(q) ≤ pr (ϕi ) ≤ pmax(q),
for all ϕi ∈ q, the expected noisy retrieval status values are bounded by
pmin(q) RSV(q, dj ) ≤ E(nRSV(q, dj )) ≤ pmax(q) RSV(q, dj ),
pmin(q) ≤ aj (q) ≤ pmax(q). (25)
We have to assume that the boundspmin(q) andpmax(q) are inclusive because a documentmay contain only those query features with recognition probabilitiespr (ϕi ) that are equalto pmin, another document may contain only those query features withpr (ϕi ) = pmax. Thebehaviour of the expected overtakings resembles the one in figure 3. Thus, again, we haveto expect a high ranking corruption. Note that in Mittendorf (1998) we have included otherweighting schemes into this analysis.
5.5.1. Experiments on the variation from feature to feature.It is not possible to separatethe different effects of document length, varying recognition probabilities across features,and varying probabilities across documents. Thus it is not easy to confirm the theoreticalinvestigations by experiments. In a similar way to Section 5.4.1, we limit the experimentsto extreme cases where we have features with recognition probabilities close to zero. Wealso limit our experiments to the D5 documents, because on D20 the degradation of queryfeatures varies heavily for all queries. In particular, for all queries there is at least one featurethat has a recognition probability less than or equal to 0.15.
The following queries contain at least one feature with recognition probability on D5 lessthan or equal to 0.15. The respective features are specified:
CF2 “risk” CF7 “mark” CF10 “network”CF15 “truck” CF17 “truck”, “jackknife” CF18 “alaska”CF21 “amazon” CF24 “size” CF25 “project”CF27 “mhz” CF30 “alkali”, “character”, “milk” CF31 “zoo”CF32 “subject” CF39 “jellyfish” CF40 “wicker”CF41 “jade” CF42 “duck” CF43 “jazz”CF46 “rock” CF48 “object” CF49 “smoke”CF50 “alaska”
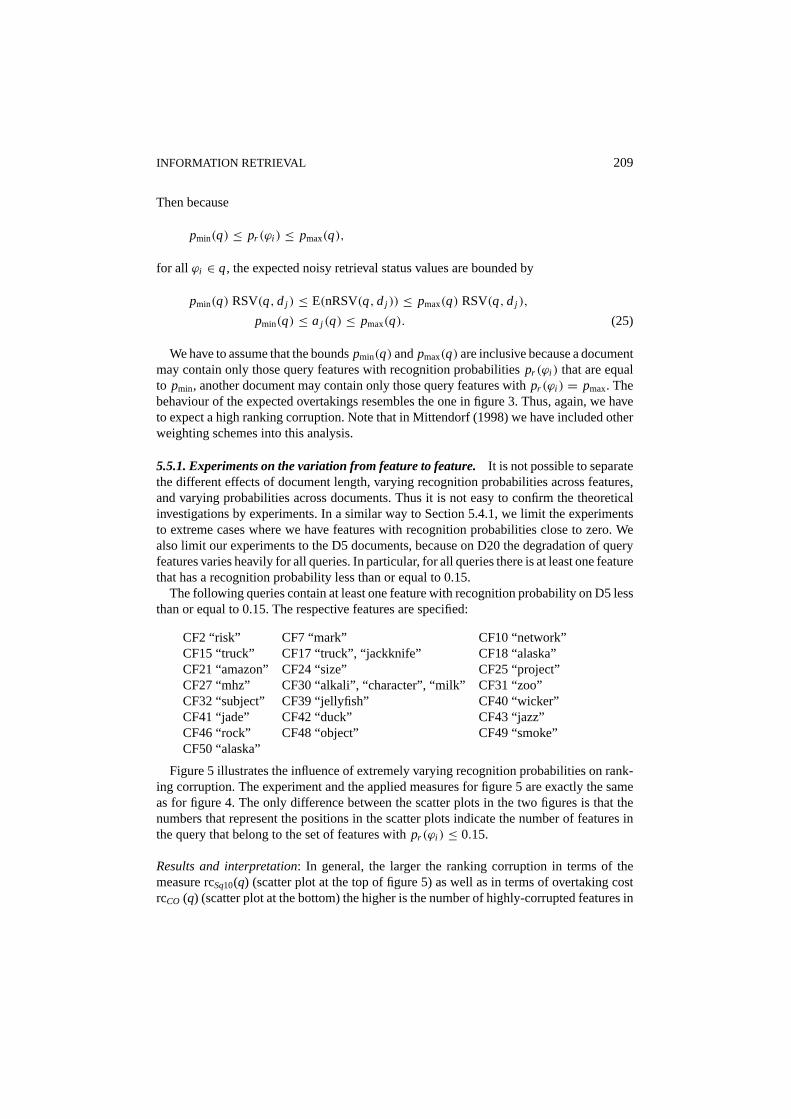
Figure 5 illustrates the influence of extremely varying recognition probabilities on rank-ing corruption. The experiment and the applied measures for figure 5 are exactly the sameas for figure 4. The only difference between the scatter plots in the two figures is that thenumbers that represent the positions in the scatter plots indicate the number of features inthe query that belong to the set of features withpr (ϕi ) ≤ 0.15.
Results and interpretation: In general, the larger the ranking corruption in terms of themeasure rcSq10(q) (scatter plot at the top of figure 5) as well as in terms of overtaking costrcCO (q) (scatter plot at the bottom) the higher is the number of highly-corrupted features in
210 MITTENDORF AND SCHAUBLE
Figure 5. Ranking corruption and number of features with low recognition probabilities.
INFORMATION RETRIEVAL 211
the scatter plot. Extreme variation of recognition probabilities from feature to feature harmretrieval performance.
A close look at the four scatter plots in figures 4 and 5 reveals that for the collectionD5 high ranking corruption isalways due to a high variation in recognition probabilities,either a variation from document to document or a variation from feature to feature.
5.5.2. Remarks on the use of post-processing systems.Post-processing systems are mainlydictionary based spelling correction systems that aim at improving the recognition proba-bilities of words by a dictionary look up of similar words. There is a strong belief in someresearch groups that the automatic post-processing of texts is beneficial in OCR-based textretrieval. This opinion is expressed e.g., in Taghva (1994), although in this research it couldnot be shown that retrieval is significantly better on post-processed data than on the origi-nally corrupted data. The experimental results showed an increase in precision but a decreasein recall and it left the researchers wondering why the retrieval on the post-processed datais good for some queries but is heavily degraded for other queries. The investigations ofSection 5.4 indeed explain the high query variation.
Wiedenhofer et al. (1995) used an elaborate post-processing to improve the indexingprocess for scanned German business letters. They mention a higher efficiency of indexingand retrieval because of the smaller number of indexing features, but they mention also thatthe use of the post-processing system leads to effectiveness problems. They realizedthat the use of a dictionary boosts the recognition probability of some features and overridesthe recognition probability of others. Their effectiveness problems due to post-processingsystems coincide with our theoretical result.
A post-processing system might increase the overall recognition probability of charactersand words. The biggest problem, however, is that a dictionary is always of finite size.After post-processing, features that are contained in the dictionary have high recognitionprobabilities and higher false alarm rates, whereas the recognition probabilities of featuresnot contained in the dictionary remain low or even become zero if they have a high stringsimilarity to one of the elements of the dictionary. The recognition probability varies highlyfrom feature to feature and thus implies high ranking corruption. On the other hand, apost-processing system decreases ranking corruption if all query features are elements ofthe dictionary thereby giving higher recognition probabilities, (15) and (16). This explainsthe high query variation in retrieval effectiveness found in Taghva (1994).
A fact that intensifies the negative effect of the use of post-processing is that the featuresthat are not contained in a dictionary usually are features with high inverse documentfrequencies and thus—whenever contained in a query—make important contributions toa good retrieval result. A post-processing system may be useful in a routing or filteringenvironment where the indexing vocabulary can be limited to the features that occur in thecurrent query (profile) but is not useful for retrieval in general.
5.5.3. A word on the optimization of OCR systems.OCR systems are often trained bymaximising theoverall recognitionprobability or, equivalently, by minimizing the averagenumber of errors per page.
212 MITTENDORF AND SCHAUBLE
Definition 3. Let A be the alphabet of all characters in a languageL then theoverallcharacter-recognition probabilityis defined as
poverall :=∑c∈A
P(c)P(x(c) = c), (26)
whereP(c) is the probability that the charactercoccurs in texts that are written in languageL.
Looking at this formula, we can see that it is more important to be able to recognizefrequent characters such ase (12.02%) ort (9.14%) than infrequent characters such asz(0.09%) orj (0.14%). (The numbers in brackets indicate the occurrence probabilities of thecharacters in the FR94 test collection in percent.)
Consider the following example: In the FR94 collection the occurrence probability of thecharacteri is 0.079, whereas the occurrence probability of the characterj is 0.0014. Thesetwo characters are easily confused by many OCR systems.
Assume that 5% of all charactersi are recognized asj. Then poverall is at least 0.079×0.05 = 0.00395 smaller than for a system that perfectly distinguishes betweeni and j.If you replace eachj by an i without regarding how confident or uncertain the systemis about its decision thenpoverall decreases at most by 0.0014 compared with a systemthat perfectly distinguishes between the two characters. In cases of doubt one must decideagainst infrequent and in favour of frequent characters to gain an optimal overall recognitionprobability. In summary, optimisation of overall recognition probabilities is likely to cause anunequal distribution of errors among characters. Optimizing the average number of errorsof, equivalently, the overall recognition probability is not optimal for retrieval purposes,where we need an equal distribution of errors among words and documents.
5.6. How can robustness be improved in the presence of varyingrecognition probabilities
The most important teaching of Section 5.4 is to aim at the avoidance of great variationof recognition probabilities. If possible the variation must be prevented at the time of therecognition process.
1. A first rule is,do not post-processthe document collection with a dictionary. This rulehas the positive side effect that an extensive and time-consuming step in the process ofdata conversion can be omitted and thus capturing remains cheaper. Pre-processing canbe useful for search tasks where the queries are contained in a controlled vocabulary(dictionary), such as a filtering task.
2. Watch the strategy for optimizing recognition probabilities: We learned that an OCRsystem that works well for retrieval purposes is not necessarily optimized with measuresthat are standard in the evaluation of OCR systems. The same holds for speech recognitionsystems. However, most commercial OCR systems are trainable after purchase, speechrecognition system have to be made application specific anyway. Thus there is a chanceto outwit a wrong optimization strategy if the training strategy is revealed. For example, ifthe overall recognition probability is optimized, the recognition device must be trained on
INFORMATION RETRIEVAL 213
material that consists of all types of recognizable units and all units should be distributedmore or less equally on the material.
If the recognition process can not be influenced or if even after a better optimizationthere is a great feature variation, then we have to find ways and means to circumvent theproblems that are due to varying recognition probabilities.
1. Long queries or query expansion: If several features are lost due to very low recognitionprobabilities then it may be possible to compensate for the loss of these feature byformulating long queries or by using an intelligent query-expansion algorithm. Althoughlong queries or query expansion can compensate for the loss of a few features to acertain extent (Frei and Qui 1993, Xu and Croft 1996, Efthimiadis 1996) the queriesmust operate only with features that are well recognised by the system, and featuresgood for query expansion are not necessarily recognized well. However, it is for usersdifficult to ask good, long queries and query expansion as well is neither an easy tasknor a computationally cheap task and even after the high expenditure of query expansionthe user has still to be satisfied with a suboptimal performance of the system.
There is another reason why users should be encourage to use long queries: Longqueries are beneficial in the presence of false alarms (Sanderson 1994). We have dis-cussed this in detail in Mittendorf (1998).
2. Probabilistic matching: The algorithms that proceed from an exact feature matching to aweaker kind of feature matching (e.g., (Mittendorf et al. 1995, Myka and G¨untzer 1995))qualify themselves for the task of optimizing the retrieval results on corrupted data. Theknowledge that we gained about the influence of recognition variation gives a clear ideahow a good probabilistic matching algorithm must be designed: Equation 24 shows thatthe matching should be relaxed more for features with low recognition probabilities andstill be tight for features with high recognition probabilities.
3. The noisy inverse document frequencyincreases in comparison to the perfect inversedocument frequencies whenever a features is badly recognized. This behavior can, to acertain extent, compensate for the negative effects of varying feature-recognition prob-abilities. It is thus better to count the document frequency on the corrupted collectionthan on a perfect training collection. Besides, the corrupted document frequency countis beneficial in the presence of false alarms (Mittendorf 1998).
4. The simultaneous use ofseveral independent OCR devicesto estimate feature frequenciesas already indicated to compensate for short documents Section 5.3 can also help to levelthe feature recognition probabilities. For this purpose the independent devices must betrained differently.
6. Summary
We applied probability theory to understand data corruption effects on information retrieval.The theory has been validated on a test collection. Our analysis yields results that do notonly explain experimental results on information retrieval that could so far not be explained,it also implies measures for the proper realization of digitization projects for informationretrieval purposes.
214 MITTENDORF AND SCHAUBLE
We briefly summarize the most important consequences for digitization projects.
– Information retrieval on corrupted data is feasible even with only moderate recognitionprobabilities. Although it is obvious that the less errors the more robust is the retrieval, itis a waste of money to aim at an error-less recognition (Section 5.1). The scanning processmust however be performed with appropriate care (Section 2). and a solid retrieval systemmust be applied that employs weighted retrieval (Section 5.1).
– One must be careful with the interpretation of experiments that are performed withsimulated data corruption, if they do not contain variations of recognition probabilities.Variations are the cause of the most permutations in retrieval rankings (Section 5.4).
– If one has the choice of scanning full documents or only document extracts one shouldscan the full documents to achieve more robustness against data corruption (Section 5.2).
– One must be careful with the use of post-processing systems (Section 5.5.2) and theapplication of standard strategies for optimising the recognition because they favor thevariation of recognition probabilities (Section 5.5.3).
– Cosine normalization is harmful (Taghva 1994).– Noisy inverse document frequency is better than inverse document frequencies estimated
on training collections, because noisy inverse document frequency compensates for sev-eral negative effects of recognition probabilities (Section 5.6).
– There are some promising approaches to improve retrieval on corrupted data that areadvisable to employ, such as using several independent OCR devices, probabilistic featurematching, and n-gram based retrieval (Sections 5.3 and 5.6).
Appendix A. Proof of the main theorem (Theorem 1)
For all pairs of documentsdj and queriesq with RSV(q, dj)> 0 there exists andegradationvalue aj (q)
E(nRSV(q, dj )) = aj (q) RSV(q, dj ), (27)
with aj (q) > 0. Then
nRSV(q, dj ) = aj (q) RSV(q, dj )+ s(q, dj ), (28)
wheres(q, dj ) describes the variance
E(s(q, dj )) = 0,
Var(s(q, dj )) = Var(nRSV(q, dj )).
Using the description of the relation between retrieval status values and noisy retrieval statusvalues (28) and the abbreviations for the differences (10) and (11) we get:
P(nRSV(q, dk)>nRSV(q, dj ))
= P(ak(q) RSV(q, dk)+ s(q, dk) > aj (q) RSV(q, dj )+ s(q, dj ))
INFORMATION RETRIEVAL 215
= P(ak(q) RSV(q, dk)+ s(q, dk) > aj (q) RSV(q, dk)+ aj (q)δ jk + s(q, dj ))
= P(s(q, dk)− s(q, dj ) > 1 jk(q))
≤ P(|s(q, dk)− s(q, dj )| > 1 jk(q)).
Chebychev’s inequality, the independence of nRSV(q, dj ) and nRSV(q, dk), and the factthat for two independent variablesX andY, E(XY)= 0 (Pythagoras’ theorem for stochasticvariables) yield
P(nRSV(q, dk) > nRSV(q, dj )) ≤ Var(s(q, dj )− s(q, dk))
(1 jk(q))2
= Var(nRSV(q, dj ))+ Var(nRSV(q, dk))
(1 jk(q))2,
which proves Inequality (12).Similarly with Chebychev’s inequality we show
P(nRSV(q, dj ) ≥ nRSV(q, dk)) ≤ Var(nRSV(q, dj ))+ Var(nRSV(q, dk))
(1k j (q))2.
We have1 jk(q) = −1k j (q) and thus(1k j (q))2 = (1 jk(q))2, then
P(nRSV(q, dk) > nRSV(q, dj ))
= 1− P(nRSV(q, dj ) ≥ nRSV(q, dk))
≥ 1− 1
(1 jk(q))2(Var(nRSV(q, dj ))+ Var(nRSV(q, dk))),
which proves Inequality (13).
References
Ballerini J-P, Buchel M, Domenig R, Knaus D, Mateev B, Mittendorf E, Sch¨auble P, Sheridan P and Wechsler M(1997) SPIDER retrieval system at TREC-5. In: TREC-5 Proceedings.
Cavnar WB (1992) N-gram-based text filtering for TREC-2. In: TREC-2 Proceedings.Croft WB, Harding S, Taghva K and Borsack J (1993) An evaluation of information retrieval accuracy with
simulated OCR output. In: Symposium on Document Analysis and Information Retrieval, pp. 115–126.Efthimiadis E (1996) Query expansion. Annual Review of Information Science and Technology, 31:121–187.Frei HP and Qui Y (1993) Effectiveness of weighted retrieval in an operational IR environment. In: Information
Retrieval ’93. Universit¨atsverlag Konstanz, pp. 41–45.Fuhr N (1992) Probabilistic models in information retrieval. The Computer Journal, 35(3):243–255.Garzotto A (1994) Vollautomatische Erkennung von Schriftzeichen in gedrucktem Schrittgut. PhD Thesis, Uni-
versitat Zurich.Glavitsch U, Sch¨auble P and Wechsler M (1994) Metadata for integrating speech documents in a text retrieval
system. SIGMOD RECORD, 23(4):57–63.Harding SM, Croft WB and Wein C (1997) Probabilistic retrieval OCR degraded text using n-grams. In: Research
and Advanced Technology for Digital Libraries, First European Conference, ECDL’97, pp. 345–359.
216 MITTENDORF AND SCHAUBLE
Jager Th (1996) OCR and voting shell fulfilling specific text analysis requirements. In: Symposium on DocumentAnalysis and Information Retrieval, pp. 287–302.
Jones GJF, Foote JT, Sparck Jones K and Young SJ (1996) Retrieving spoken documents by combining multipleindex sources. In: ACM SIGIR Conference on R&D in Information Retrieval, Zurich, pp. 30–38.
Mittendorf E (1998) Data corruption and information retrieval. PhD Thesis, ETH Zurich, Institute ofComputer Systems.
Mittendorf E and Sch¨auble P (1996) Measuring the effects of data corruption on information retrieval. In: Sym-posium on Document Analysis and Information Retrieval, pp. 179–189.
Mittendorf E, Sch¨auble P and Sheridan P (1995) Applying probabilistic term weighting to OCR text in the case of alarge alphabetic library catalogue. In: ACM SIGIR Conference on R&D in Information Retrieval, pp. 328–335.
Myka A and Guntzer U (1995) Automatic hypertext conversion of paper document collections. In: Adam N,Bhargava B and Yesha Y, Eds., Advances in Digital Libraries—Current Issuses, Springer-Verlag, Berlin, pp. 65–90. Lecture Notes in Computer Science, Vol. 916.
Porter MF (1980) An algorithm for suffix stripping. Program, 14(3):130–137.Robertson SE and Walker S (1994) Some simple effective approximations of the 2-Poisson model for probabilistic
weighted retrieval. In: ACM SIGIR Conference on R&D in Information Retrieval, pp. 232–241.Salton G (1971) The SMART Retrieval System-Experiments in Automatic Document Processing. Prentice Hall,
Englewood, Cliffs, New Jersey.Salton G (1990) Automatic Text Processing. Addison-Wesley, Reading, MA.Sanderson M (1994) Word sense disambiguation and information retrieval. In: ACM SIGIR Conference on R&D
in Information Retrieval, pp. 142–151.Schauble P and Glavitsch U (1994) Assessing the retrieval effectiveness of a speech retrieval system by simulating
recognition errors. In: ARPA Workshop on Human Language Technology (HLT’94), pp. 370–372.Singhal A, Buckley C and Mitra M (1996) Pivoted document length normalization. In: ACM SIGIR Conference
on R&D in Information Retrieval, pp. 21–29.Smith S and Stanfill C (1988) An analysis of the effects of data corruption on text retrieval performance. Thinking
Machines Corporation, Cambridge, MA.Stahel W (1995) Statistische Datenanalyse: Eine Einf¨uhrung fur naturwissenschaftler. Lehrbuch, Angewandte
Mathematik. Vieweg, Wiesbaden.Taghva K, Borsack J and Condit A (1994) Effects of OCR errors on ranking and feedback using the vector space
model. Technical Report TR 94-06, University of Nevada, Las Vegas.Taghva K, Borsack J and Condit A (1994) Results of applying probabilistic IR to OCR text. In: ACM SIGIR
Conference on R&D in Information Retrieval, pp. 202–211.Teufel B (1989) Informationsspuren zum numerischen und graphischen Vergleich von reduzierten
naturlichsprachlichen Texten. PhD Thesis, Swiss Federal Institute of Technology, VdF-Verlag, Z¨urich.Venables WN and Ripley BD (1994) Modern applied statistics with S-plus. Statistics and Computing. Springer-
Verlag, New York.Voorhees E and Kantor P (1997) TREC-5 confusion track. In: TREC-5 Proceedings.Wechsler M and Sch¨auble P (1995) Speech retrieval based on automatic indexing. In: Ruthven Ian Ed., Proceedings
of the Final Workshop on Multimedia Information Retrieval (MIRO’95), Electronic Workshops in Computing,Springer, Glasgow.
Wiedenhofer L, Hein H-G and Dengel A (1995) Post-processing of OCR results for automatic indexing. In: ThirdInternational Conference on Document Analysis and Recognition, Montreal, August 1995. IEEE ComputerSociety Press, Silver Spring, MD, pp. 592–597.
Xu J and Croft WB (1996) Query expansion using local and global document analysis. In: ACM SIGIR Conferenceon R&D in Information Retrieval, pp. 4–11.