Embed Size (px)
Citation preview

Information Technology Business Case Development University of Wisconsin System Administration Business Cases 1, 2, & 3 August 2015
© 2015 Huron Consulting Group. All Rights Reserved. Proprietary & Confidential.
Executive Summary
2
BUSINESS CASES
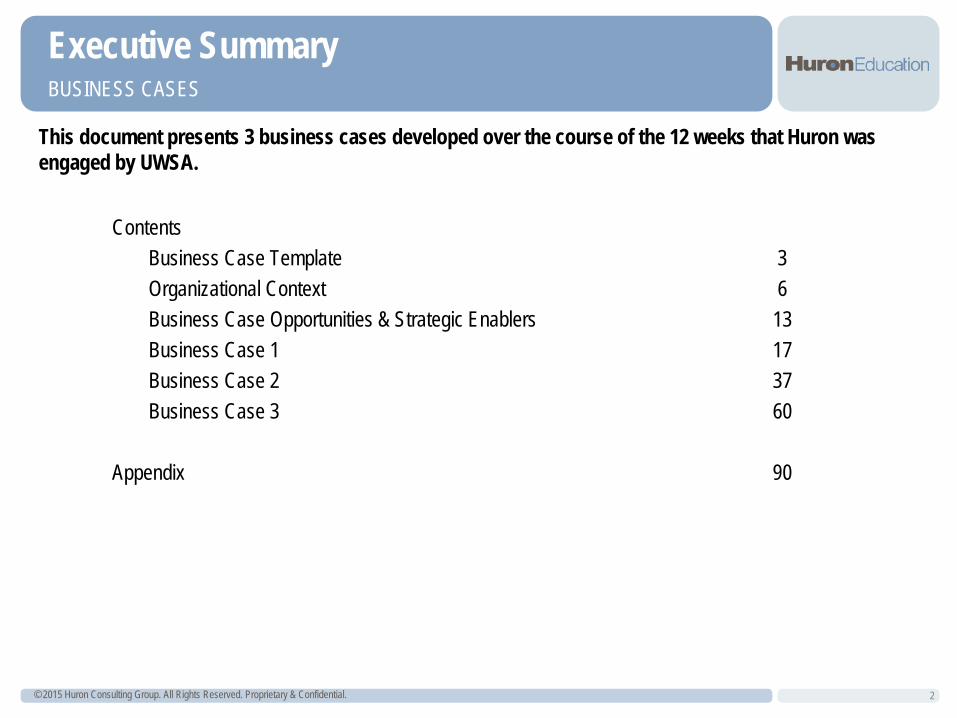
This document presents 3 business cases developed over the course of the 12 weeks that Huron was engaged by UWSA.
Contents Business Case Template 3 Organizational Context 6 Business Case Opportunities & Strategic Enablers 13 Business Case 1 17 Business Case 2 37 Business Case 3 60 Appendix 90

Business Case Template
© 2015 Huron Consulting Group. All Rights Reserved. Proprietary & Confidential.
Business Cases BUSINESS CASE OVERVIEW
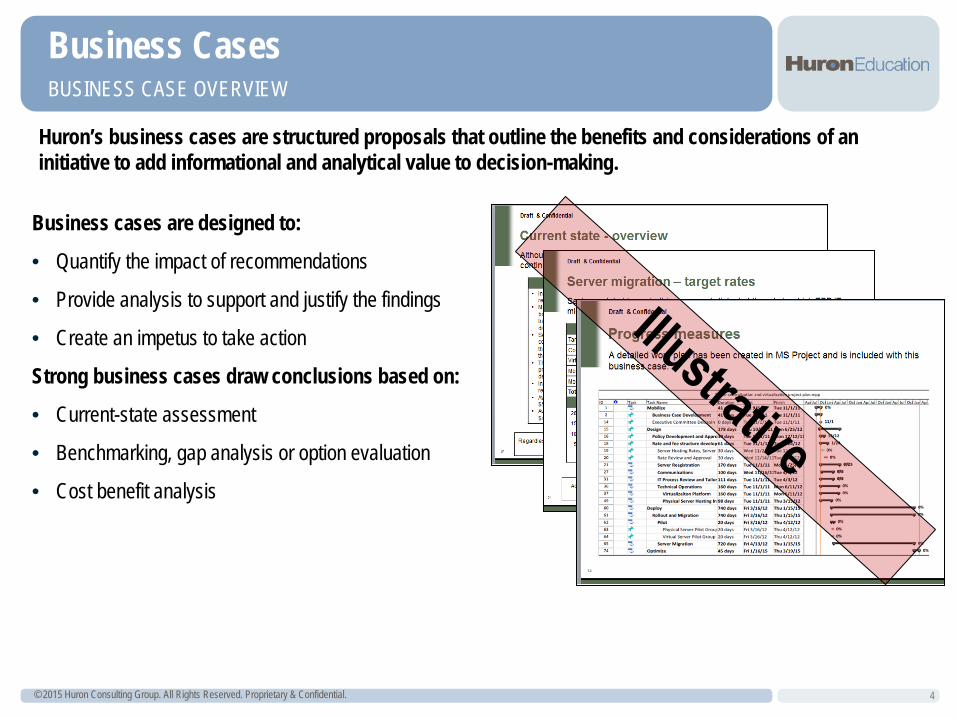
Huron’s business cases are structured proposals that outline the benefits and considerations of an initiative to add informational and analytical value to decision-making.
4
Business cases are designed to:
• Quantify the impact of recommendations
• Provide analysis to support and justify the findings
• Create an impetus to take action
Strong business cases draw conclusions based on:
• Current-state assessment
• Benchmarking, gap analysis or option evaluation
• Cost benefit analysis
© 2015 Huron Consulting Group. All Rights Reserved. Proprietary & Confidential.
Business Cases DATA & ASSUMPTIONS
5
Data Assumptions and Notes: • Data available at the time of this report was either inconsistent, incomplete, or unknown. This underscores the
need for a more standardized and transparent approach to data collection and reporting.
• Projected financial impact displayed may not include full cost of implementation. For opportunities selected to pursue, the UW should engage in more robust data collection and analysis to identify the full scope of implementation, resource requirements, and associated costs.
• Analyses may not incorporate campus-level initiatives taking place to reduce costs in reaction to the announced budget cuts. Additional consideration should be given to reductions that have already taken place at the institutional level.
Organizational Context
© 2015 Huron Consulting Group. All Rights Reserved. Proprietary & Confidential.
Business Cases ORGANIZATION CONTEXT
7
The work that culminates in the business cases presented in this document was conducted during a period of immense challenge with an uncertain budget future and therefore unclear responses to cuts.
Before we get into the detail of the business cases, we wish to acknowledge the engagement of the IT community across the
University of Wisconsin system campuses, including the CIOs, and the engagement of Provosts and Chief Business Officers in providing
input, data, guidance, perspective, institutional and historical context, and encouragement.
© 2015 Huron Consulting Group. All Rights Reserved. Proprietary & Confidential.
Business Cases ORGANIZATION CONTEXT
8
Providing the full context is infeasible, however, there are several critical elements of context that are important to understand when considering the ideas and recommendations presented in this document.
Organizational Context: • The University of Wisconsin System is facing reductions in state funding by approximately $125 million per year • Those cuts are the largest of a series of cuts the University has received over the past decade • The campuses that comprise the UW System operate predominately independently with several noted
exceptions including: (System-wide high-speed network, Common Systems Review Group, VoIP collaboration, virtualization collaborations)
• Recent leadership turn-over throughout the UW System (Chancellors, Provosts, UW system leadership) • Culture of decentralized and distributed decision making both at the system and institutional level IT Trends: • Rapid pace of innovation • Changing user preferences require that IT functions be increasingly nimble and adaptive • Increasing adoption of digitization and technology across nearly every facet of the academy • Increased capacity and capability for 3rd party services (e.g., Amazon Web Services) • Students who are “digital natives” served by faculty and staff with vastly different attitudes, capabilities, and
understanding of technology
© 2015 Huron Consulting Group. All Rights Reserved. Proprietary & Confidential.
Business Cases BUSINESS CASE OPPORTUNITY IDENTIFICATION
9
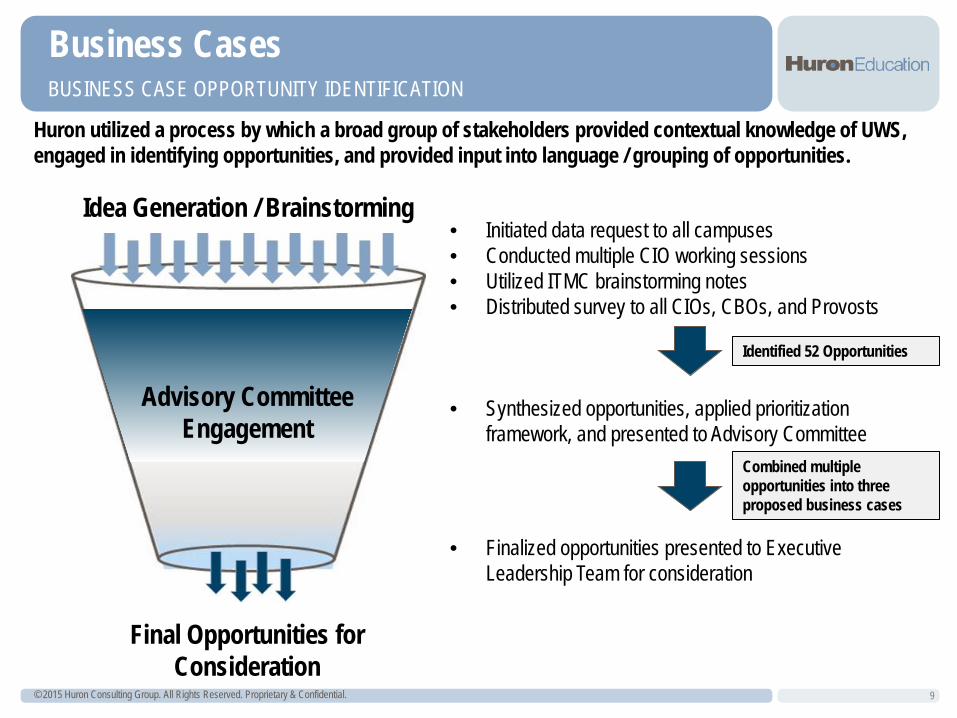
Huron utilized a process by which a broad group of stakeholders provided contextual knowledge of UWS, engaged in identifying opportunities, and provided input into language / grouping of opportunities.
• Initiated data request to all campuses • Conducted multiple CIO working sessions • Utilized ITMC brainstorming notes • Distributed survey to all CIOs, CBOs, and Provosts
• Synthesized opportunities, applied prioritization framework, and presented to Advisory Committee
• Finalized opportunities presented to Executive Leadership Team for consideration
Idea Generation / Brainstorming
Final Opportunities for Consideration
Advisory Committee Engagement
Identified 52 Opportunities
Combined multiple opportunities into three proposed business cases
© 2015 Huron Consulting Group. All Rights Reserved. Proprietary & Confidential.
Business Cases CONSIDERATIONS
10
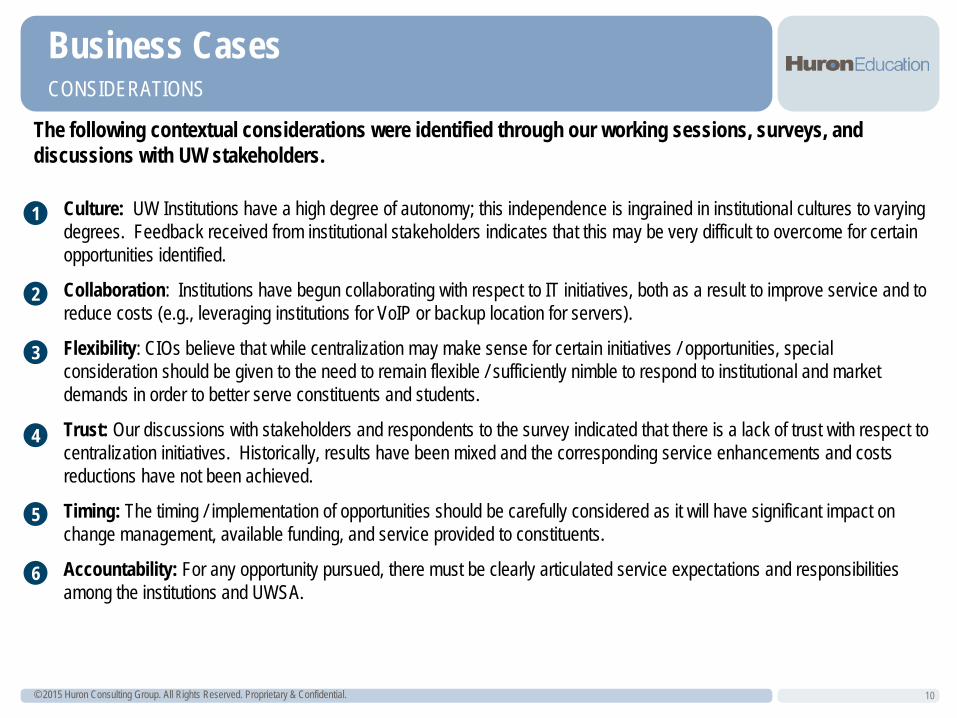
• Culture: UW Institutions have a high degree of autonomy; this independence is ingrained in institutional cultures to varying degrees. Feedback received from institutional stakeholders indicates that this may be very difficult to overcome for certain opportunities identified.
• Collaboration: Institutions have begun collaborating with respect to IT initiatives, both as a result to improve service and to reduce costs (e.g., leveraging institutions for VoIP or backup location for servers).
• Flexibility: CIOs believe that while centralization may make sense for certain initiatives / opportunities, special consideration should be given to the need to remain flexible / sufficiently nimble to respond to institutional and market demands in order to better serve constituents and students.
• Trust: Our discussions with stakeholders and respondents to the survey indicated that there is a lack of trust with respect to centralization initiatives. Historically, results have been mixed and the corresponding service enhancements and costs reductions have not been achieved.
• Timing: The timing / implementation of opportunities should be carefully considered as it will have significant impact on change management, available funding, and service provided to constituents.
• Accountability: For any opportunity pursued, there must be clearly articulated service expectations and responsibilities among the institutions and UWSA.
1
2
3
4
5
6
The following contextual considerations were identified through our working sessions, surveys, and discussions with UW stakeholders.
© 2015 Huron Consulting Group. All Rights Reserved. Proprietary & Confidential. 11
EFFECTIVE IT DECISION MAKING STRUCTURES
Business Cases
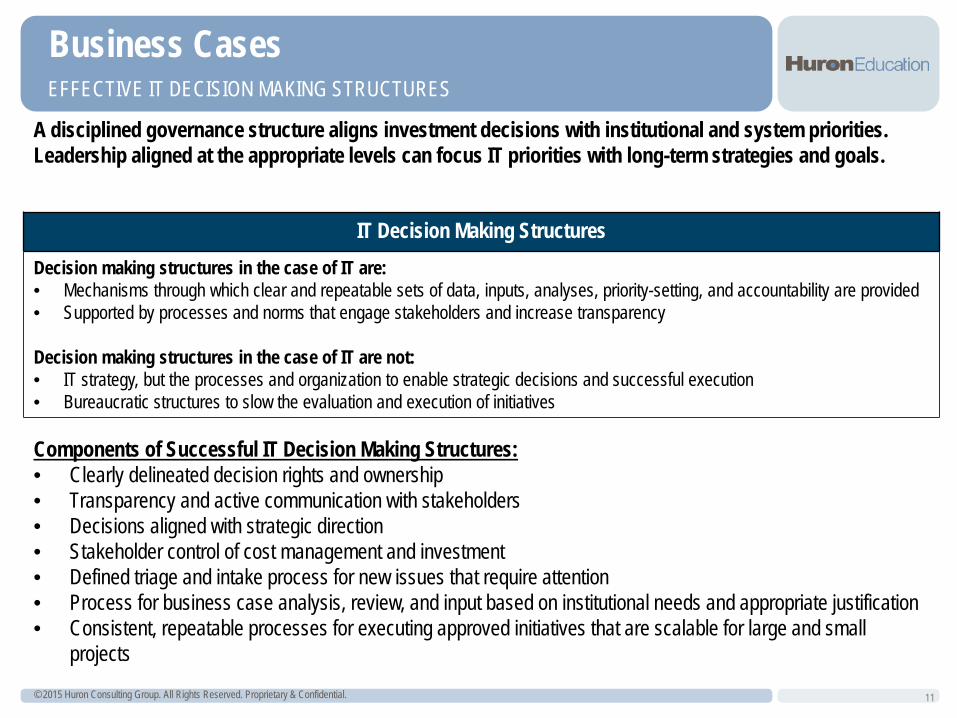
A disciplined governance structure aligns investment decisions with institutional and system priorities. Leadership aligned at the appropriate levels can focus IT priorities with long-term strategies and goals.
Components of Successful IT Decision Making Structures: • Clearly delineated decision rights and ownership • Transparency and active communication with stakeholders • Decisions aligned with strategic direction • Stakeholder control of cost management and investment • Defined triage and intake process for new issues that require attention • Process for business case analysis, review, and input based on institutional needs and appropriate justification • Consistent, repeatable processes for executing approved initiatives that are scalable for large and small
projects
IT Decision Making Structures Decision making structures in the case of IT are: • Mechanisms through which clear and repeatable sets of data, inputs, analyses, priority-setting, and accountability are provided • Supported by processes and norms that engage stakeholders and increase transparency
Decision making structures in the case of IT are not: • IT strategy, but the processes and organization to enable strategic decisions and successful execution • Bureaucratic structures to slow the evaluation and execution of initiatives
© 2015 Huron Consulting Group. All Rights Reserved. Proprietary & Confidential.
Business Cases BUSINESS CASE OPPORTUNITIES
12
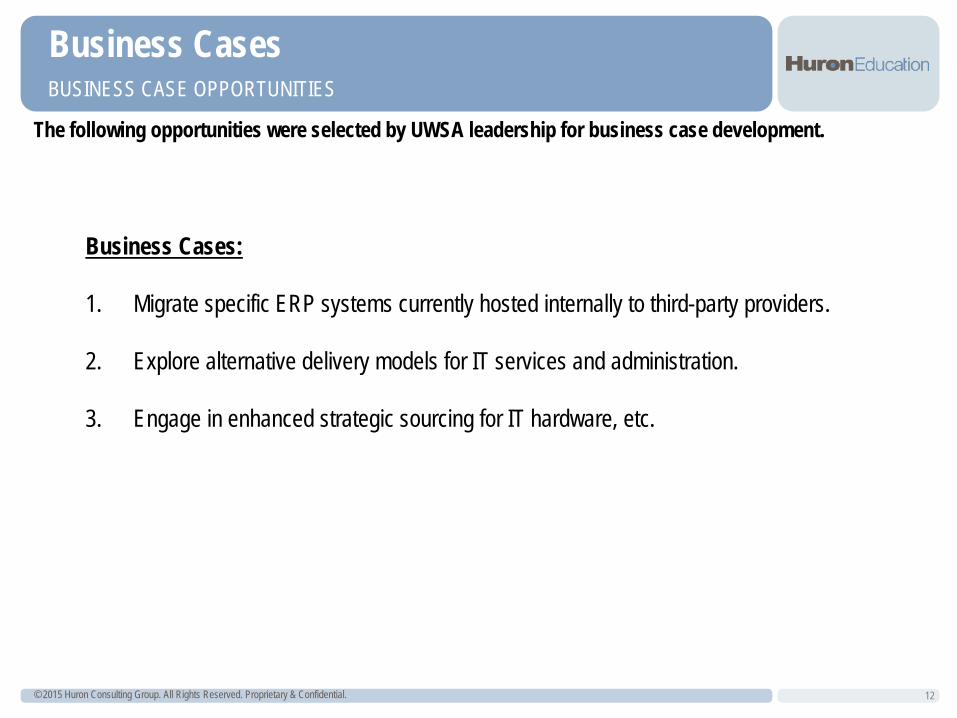
The following opportunities were selected by UWSA leadership for business case development.
Business Cases: 1. Migrate specific ERP systems currently hosted internally to third-party providers.
2. Explore alternative delivery models for IT services and administration.
3. Engage in enhanced strategic sourcing for IT hardware, etc.
Business Case Opportunities & Strategic Enablers
© 2015 Huron Consulting Group. All Rights Reserved. Proprietary & Confidential.
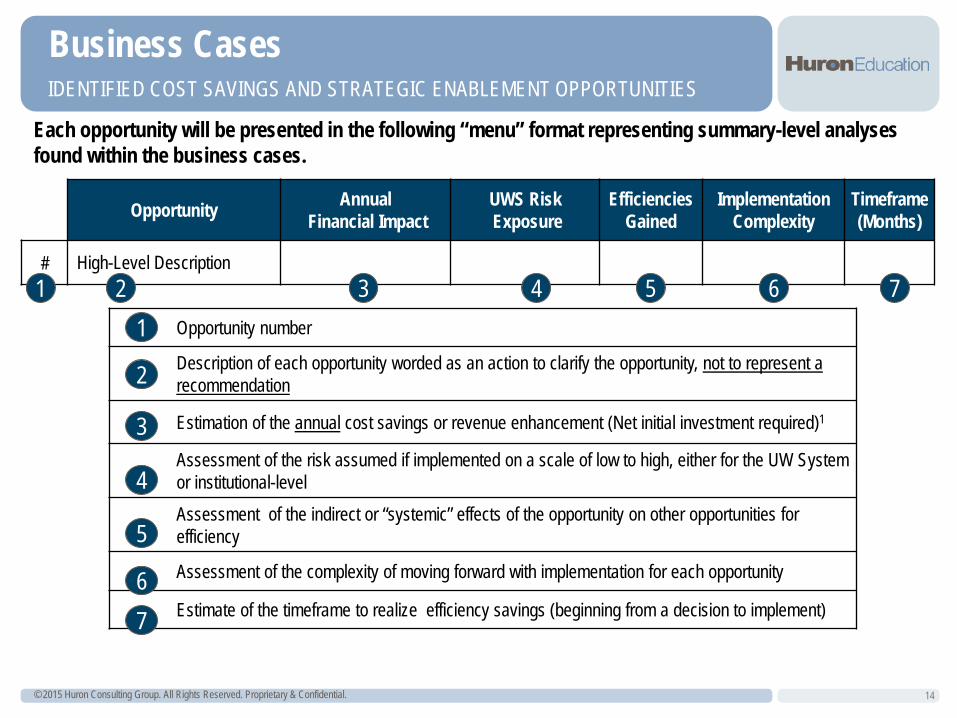
Opportunity number
Description of each opportunity worded as an action to clarify the opportunity, not to represent a recommendation
Estimation of the annual cost savings or revenue enhancement (Net initial investment required)1
Assessment of the risk assumed if implemented on a scale of low to high, either for the UW System or institutional-level Assessment of the indirect or “systemic” effects of the opportunity on other opportunities for efficiency
Assessment of the complexity of moving forward with implementation for each opportunity
Estimate of the timeframe to realize efficiency savings (beginning from a decision to implement)
Business Cases IDENTIFIED COST SAVINGS AND STRATEGIC ENABLEMENT OPPORTUNITIES
14
Each opportunity will be presented in the following “menu” format representing summary-level analyses found within the business cases.
Opportunity Annual Financial Impact
UWS Risk Exposure
Efficiencies Gained
Implementation Complexity
Timeframe (Months)
# High-Level Description 1 2 3 4 5 6 7
1
2
3
4
5
6 7
© 2015 Huron Consulting Group. All Rights Reserved. Proprietary & Confidential.
Business Cases IDENTIFIED COST SAVINGS AND STRATEGIC ENABLEMENT OPPORTUNITIES
15
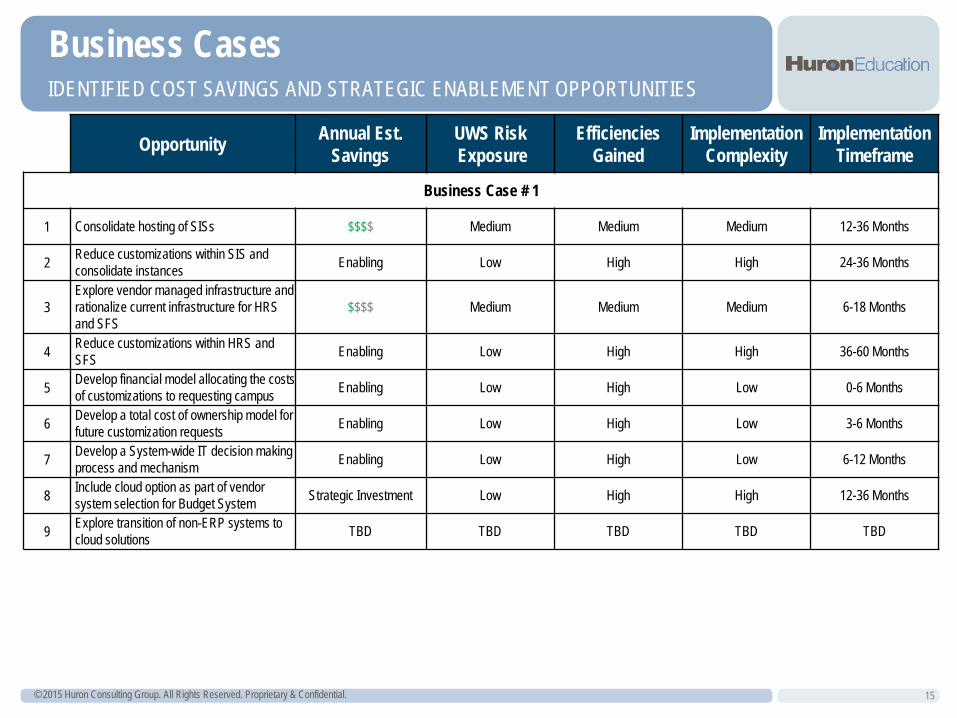
Opportunity Annual Est. Savings
UWS Risk Exposure
Efficiencies Gained
Implementation Complexity
Implementation Timeframe
Business Case # 1
1 Consolidate hosting of SISs $$$$ Medium Medium Medium 12-36 Months
2 Reduce customizations within SIS and consolidate instances Enabling Low High High 24-36 Months
3 Explore vendor managed infrastructure and rationalize current infrastructure for HRS and SFS
$$$$ Medium Medium Medium 6-18 Months
4 Reduce customizations within HRS and SFS Enabling Low High High 36-60 Months
5 Develop financial model allocating the costs of customizations to requesting campus Enabling Low High Low 0-6 Months
6 Develop a total cost of ownership model for future customization requests Enabling Low High Low 3-6 Months
7 Develop a System-wide IT decision making process and mechanism Enabling Low High Low 6-12 Months
8 Include cloud option as part of vendor system selection for Budget System Strategic Investment Low High High 12-36 Months
9 Explore transition of non-ERP systems to cloud solutions TBD TBD TBD TBD TBD
© 2015 Huron Consulting Group. All Rights Reserved. Proprietary & Confidential.
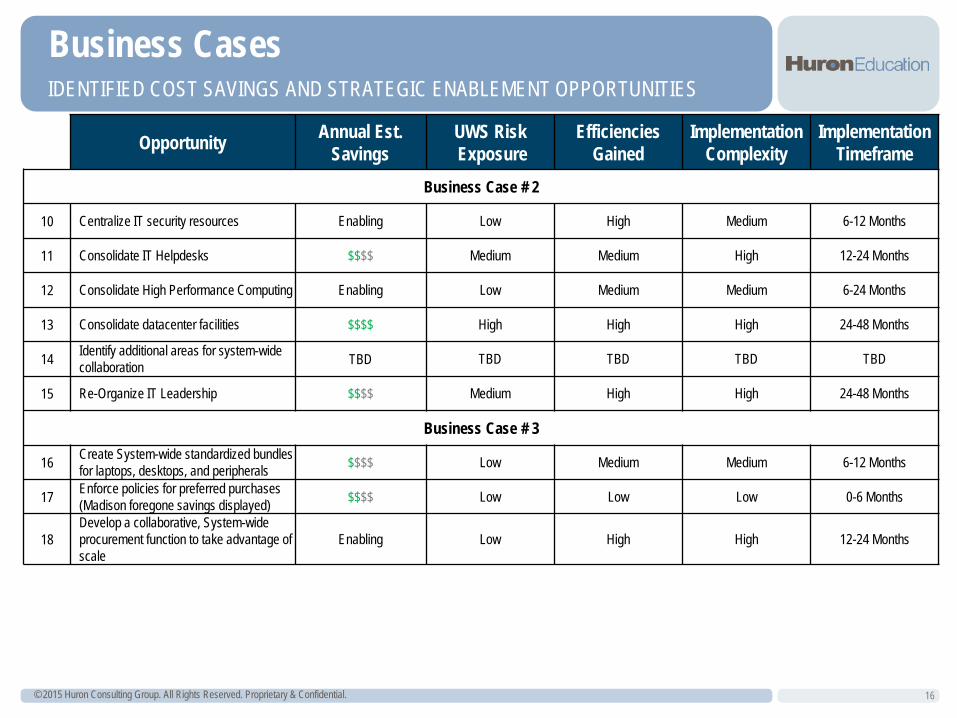
Business Cases IDENTIFIED COST SAVINGS AND STRATEGIC ENABLEMENT OPPORTUNITIES
16
Opportunity Annual Est. Savings
UWS Risk Exposure
Efficiencies Gained
Implementation Complexity
Implementation Timeframe
Business Case # 2
10 Centralize IT security resources Enabling Low High Medium 6-12 Months
11 Consolidate IT Helpdesks $$$$ Medium Medium High 12-24 Months
12 Consolidate High Performance Computing Enabling Low Medium Medium 6-24 Months
13 Consolidate datacenter facilities $$$$ High High High 24-48 Months
14 Identify additional areas for system-wide collaboration TBD TBD TBD TBD TBD
15 Re-Organize IT Leadership $$$$ Medium High High 24-48 Months
Business Case # 3
16 Create System-wide standardized bundles for laptops, desktops, and peripherals $$$$ Low Medium Medium 6-12 Months
17 Enforce policies for preferred purchases (Madison foregone savings displayed) $$$$ Low Low Low 0-6 Months
18 Develop a collaborative, System-wide procurement function to take advantage of scale
Enabling Low High High 12-24 Months
Business Case #1: Evaluate Alternative Hosting Models
for Primary Systems
© 2015 Huron Consulting Group. All Rights Reserved. Proprietary & Confidential.
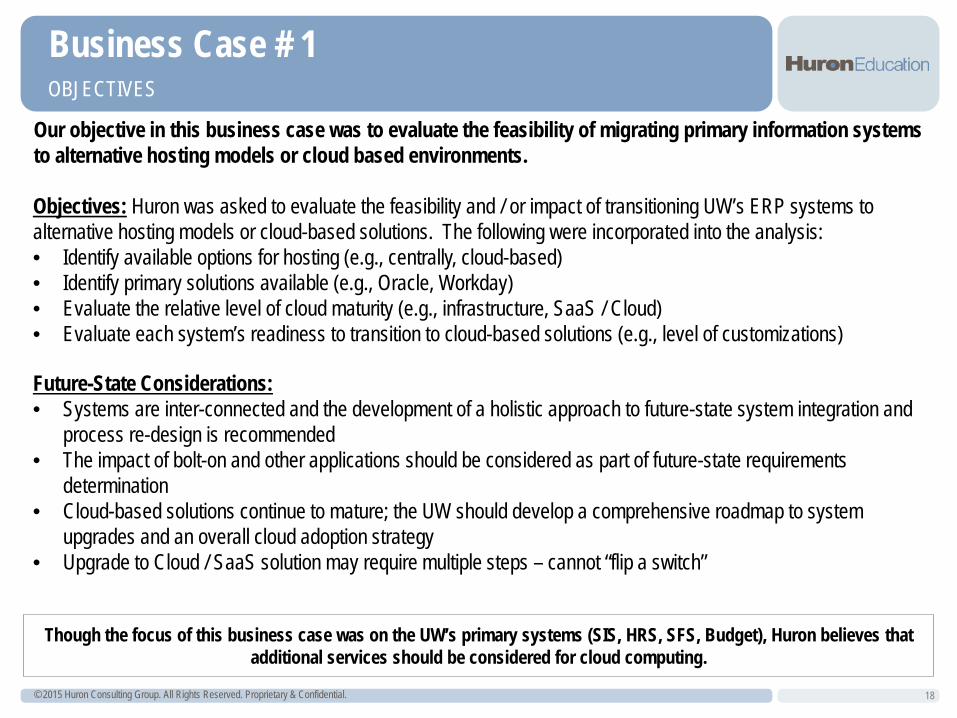
Business Case # 1 OBJECTIVES
Our objective in this business case was to evaluate the feasibility of migrating primary information systems to alternative hosting models or cloud based environments.
18
Though the focus of this business case was on the UW’s primary systems (SIS, HRS, SFS, Budget), Huron believes that additional services should be considered for cloud computing.
Objectives: Huron was asked to evaluate the feasibility and / or impact of transitioning UW’s ERP systems to alternative hosting models or cloud-based solutions. The following were incorporated into the analysis: • Identify available options for hosting (e.g., centrally, cloud-based) • Identify primary solutions available (e.g., Oracle, Workday) • Evaluate the relative level of cloud maturity (e.g., infrastructure, SaaS / Cloud) • Evaluate each system’s readiness to transition to cloud-based solutions (e.g., level of customizations)
Future-State Considerations: • Systems are inter-connected and the development of a holistic approach to future-state system integration and
process re-design is recommended • The impact of bolt-on and other applications should be considered as part of future-state requirements
determination • Cloud-based solutions continue to mature; the UW should develop a comprehensive roadmap to system
upgrades and an overall cloud adoption strategy • Upgrade to Cloud / SaaS solution may require multiple steps – cannot “flip a switch”
© 2015 Huron Consulting Group. All Rights Reserved. Proprietary & Confidential.
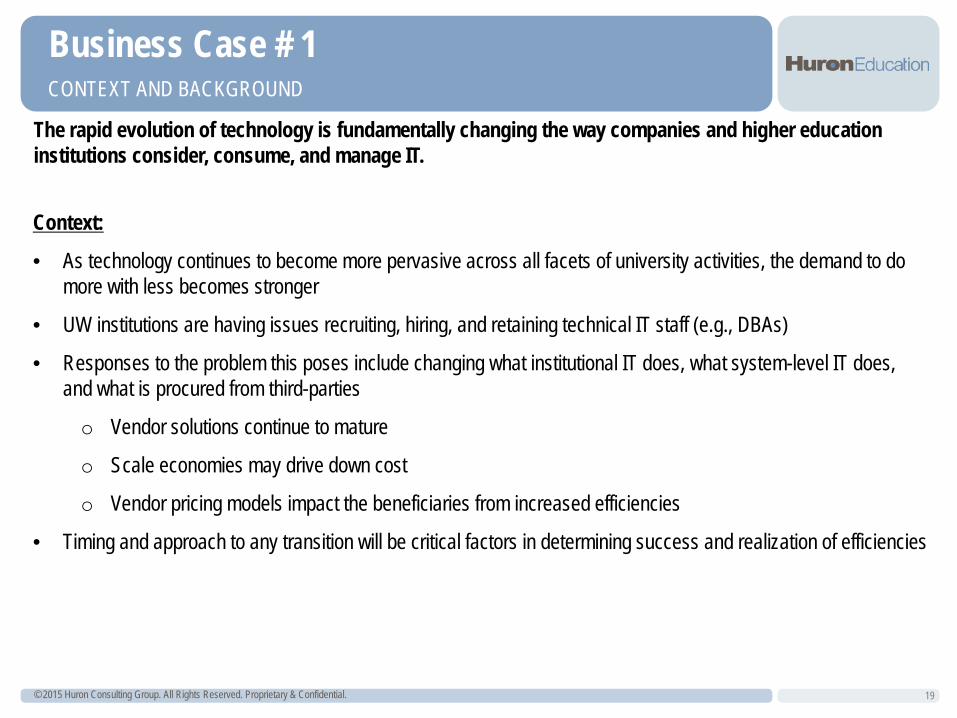
Business Case # 1 CONTEXT AND BACKGROUND
The rapid evolution of technology is fundamentally changing the way companies and higher education institutions consider, consume, and manage IT.
19
Context:
• As technology continues to become more pervasive across all facets of university activities, the demand to do more with less becomes stronger
• UW institutions are having issues recruiting, hiring, and retaining technical IT staff (e.g., DBAs)
• Responses to the problem this poses include changing what institutional IT does, what system-level IT does, and what is procured from third-parties
o Vendor solutions continue to mature
o Scale economies may drive down cost
o Vendor pricing models impact the beneficiaries from increased efficiencies
• Timing and approach to any transition will be critical factors in determining success and realization of efficiencies
© 2015 Huron Consulting Group. All Rights Reserved. Proprietary & Confidential.
Business Case # 1 WHAT IS CLOUD COMPUTING
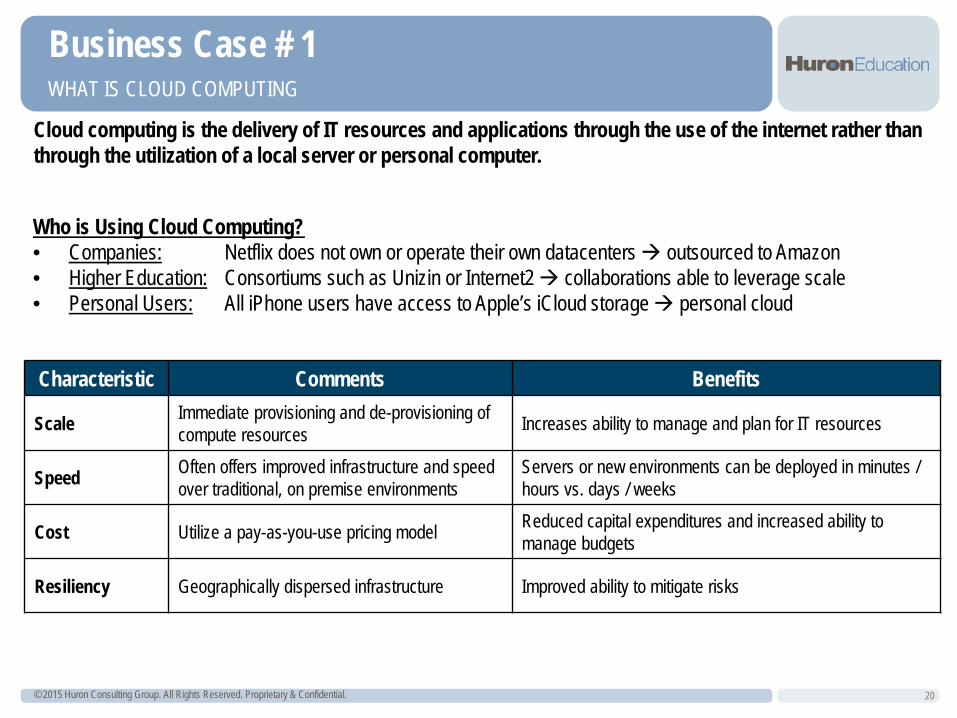
Cloud computing is the delivery of IT resources and applications through the use of the internet rather than through the utilization of a local server or personal computer.
20
Characteristic Comments Benefits
Scale Immediate provisioning and de-provisioning of compute resources Increases ability to manage and plan for IT resources
Speed Often offers improved infrastructure and speed over traditional, on premise environments
Servers or new environments can be deployed in minutes / hours vs. days / weeks
Cost Utilize a pay-as-you-use pricing model Reduced capital expenditures and increased ability to manage budgets
Resiliency Geographically dispersed infrastructure Improved ability to mitigate risks
Who is Using Cloud Computing? • Companies: Netflix does not own or operate their own datacenters outsourced to Amazon • Higher Education: Consortiums such as Unizin or Internet2 collaborations able to leverage scale • Personal Users: All iPhone users have access to Apple’s iCloud storage personal cloud
© 2015 Huron Consulting Group. All Rights Reserved. Proprietary & Confidential.
Business Case # 1 WHAT IS CLOUD COMPUTING
21
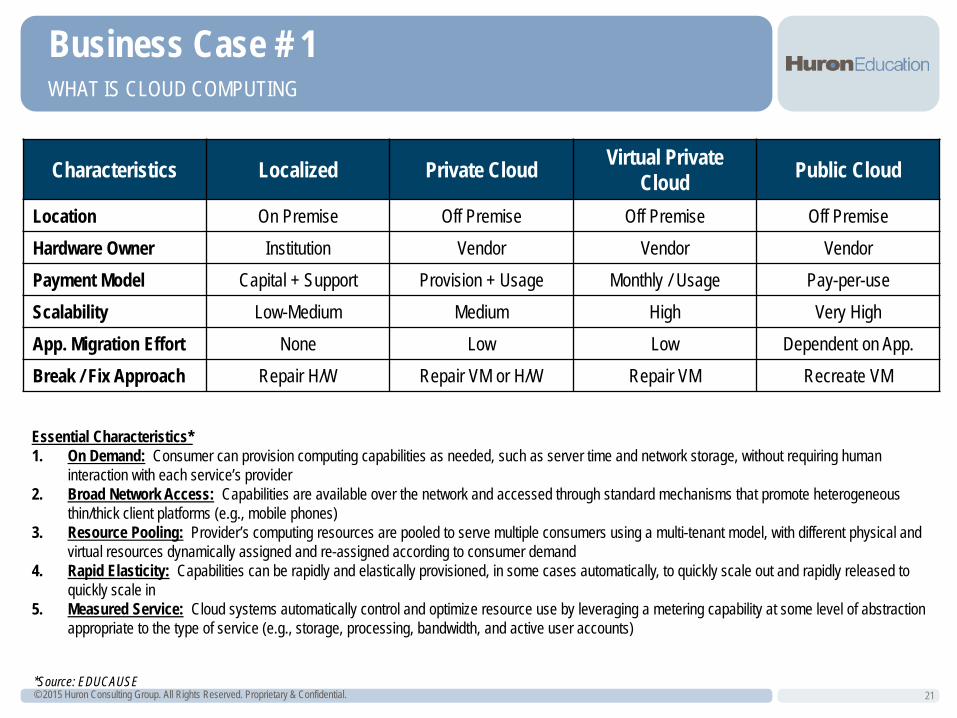
Essential Characteristics* 1. On Demand: Consumer can provision computing capabilities as needed, such as server time and network storage, without requiring human
interaction with each service’s provider 2. Broad Network Access: Capabilities are available over the network and accessed through standard mechanisms that promote heterogeneous
thin/thick client platforms (e.g., mobile phones) 3. Resource Pooling: Provider’s computing resources are pooled to serve multiple consumers using a multi-tenant model, with different physical and
virtual resources dynamically assigned and re-assigned according to consumer demand 4. Rapid Elasticity: Capabilities can be rapidly and elastically provisioned, in some cases automatically, to quickly scale out and rapidly released to
quickly scale in 5. Measured Service: Cloud systems automatically control and optimize resource use by leveraging a metering capability at some level of abstraction
appropriate to the type of service (e.g., storage, processing, bandwidth, and active user accounts)
*Source: EDUCAUSE
Characteristics Localized Private Cloud Virtual Private Cloud Public Cloud
Location On Premise Off Premise Off Premise Off Premise Hardware Owner Institution Vendor Vendor Vendor Payment Model Capital + Support Provision + Usage Monthly / Usage Pay-per-use Scalability Low-Medium Medium High Very High App. Migration Effort None Low Low Dependent on App. Break / Fix Approach Repair H/W Repair VM or H/W Repair VM Recreate VM
© 2015 Huron Consulting Group. All Rights Reserved. Proprietary & Confidential.
Business Case # 1 WHAT IS CLOUD COMPUTING
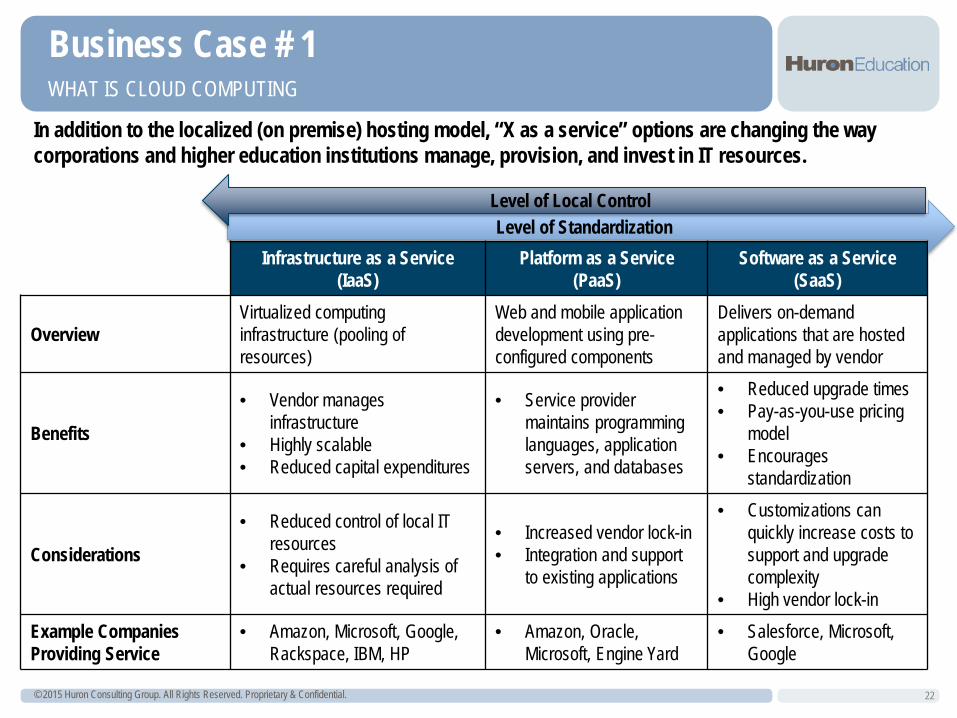
In addition to the localized (on premise) hosting model, “X as a service” options are changing the way corporations and higher education institutions manage, provision, and invest in IT resources.
22
Infrastructure as a Service (IaaS)
Platform as a Service (PaaS)
Software as a Service (SaaS)
Overview Virtualized computing infrastructure (pooling of resources)
Web and mobile application development using pre-configured components
Delivers on-demand applications that are hosted and managed by vendor
Benefits
• Vendor manages infrastructure
• Highly scalable • Reduced capital expenditures
• Service provider maintains programming languages, application servers, and databases
• Reduced upgrade times • Pay-as-you-use pricing
model • Encourages
standardization
Considerations
• Reduced control of local IT resources
• Requires careful analysis of actual resources required
• Increased vendor lock-in • Integration and support
to existing applications
• Customizations can quickly increase costs to support and upgrade complexity
• High vendor lock-in Example Companies Providing Service
• Amazon, Microsoft, Google, Rackspace, IBM, HP
• Amazon, Oracle, Microsoft, Engine Yard
• Salesforce, Microsoft, Google
Level of Standardization Level of Local Control
© 2015 Huron Consulting Group. All Rights Reserved. Proprietary & Confidential.
Business Case # 1 WHAT IS CLOUD COMPUTING
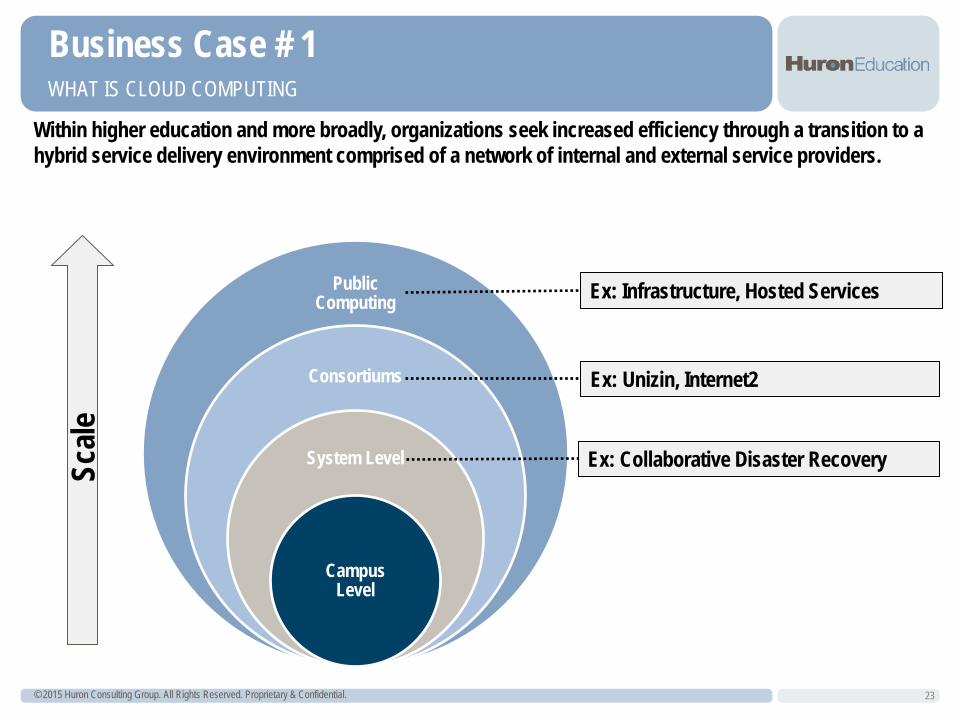
Within higher education and more broadly, organizations seek increased efficiency through a transition to a hybrid service delivery environment comprised of a network of internal and external service providers.
23
Public Computing
Consortiums
System Level
Campus Level
Ex: Infrastructure, Hosted Services
Ex: Unizin, Internet2
Ex: Collaborative Disaster Recovery Scale
© 2015 Huron Consulting Group. All Rights Reserved. Proprietary & Confidential.
Business Case # 1 LEADING HIGHER EDUCATION ERP VENDORS
24
Increasingly, vendors and companies are investing in cloud-based solutions as a transition from “traditional” ERPs.
Comments:
• Industry investment in “cloud” based ERP systems is strong and appears to be the signaled direction of technology migration
• PwC predicts that by 2016, investments by companies in SaaS solutions will double to $78 billion, vs. investments in traditional ERP systems, declining by over 30% to less than $15 billion*
• Gartner predicts that by 2018, at least 30% of service-centric companies will move the majority of their ERP applications to the cloud**
• Gartner predicts that by 2017, 70% of hybrid ERPs (combination of cloud and “traditional” solutions) will fail to improve cost-benefit outcomes unless cloud applications provide differentiated functionality – cloud applications do not provide value without careful consideration of process, etc.
• Companies like Oracle and Workday are rapidly investing in, and developing, integrated cloud solutions
Source: *Forbes: Five Catalysts Accelerating Cloud ERP Growth in 2015 **Gartner
© 2015 Huron Consulting Group. All Rights Reserved. Proprietary & Confidential.
Business Case # 1 HIGHER EDUCATION CLOUD CONSORTIUMS– UNIZIN AND INTERNET 2
Large, Higher Education led consortiums are changing the way cloud-based services are developed and made available to institutions, research centers, and other governmental / industry partners.
25
• Founded in 2014 • Consortium founded and led by higher education
institutions with a focus on developing a new approach to digital learning
• Sought an alternative option for learning management systems with a focus on collaboration rather than institution-specific initiatives
• Cloud-scale service operator and integrator supporting Digital Education offerings to partners including Content, Software Platforms, and Analytics
• Designed to better support faculty and enable student success
• Focus to provide “common gauge rail approach” for infrastructure – encourages faculty collaboration
• Founded in 1997 • Non-profit computer networking consortium • Institutions / partners can provision network and other
services • Connects over 60,000 U.S. educational, research,
government, and community anchor institutions • Develops and deploys network technologies such as
large-scale performance measurement and management tools, secure identity and access management tools, and the ability to schedule high-bandwidth, high-performance circuits
• Creates a faster alternative to the internet and fostered creativity, research, and development not previously possible
© 2015 Huron Consulting Group. All Rights Reserved. Proprietary & Confidential.
Business Case # 1 SELECT EXAMPLES OF ERP CLOUD COMPUTING IN HIGHER EDUCATION
26
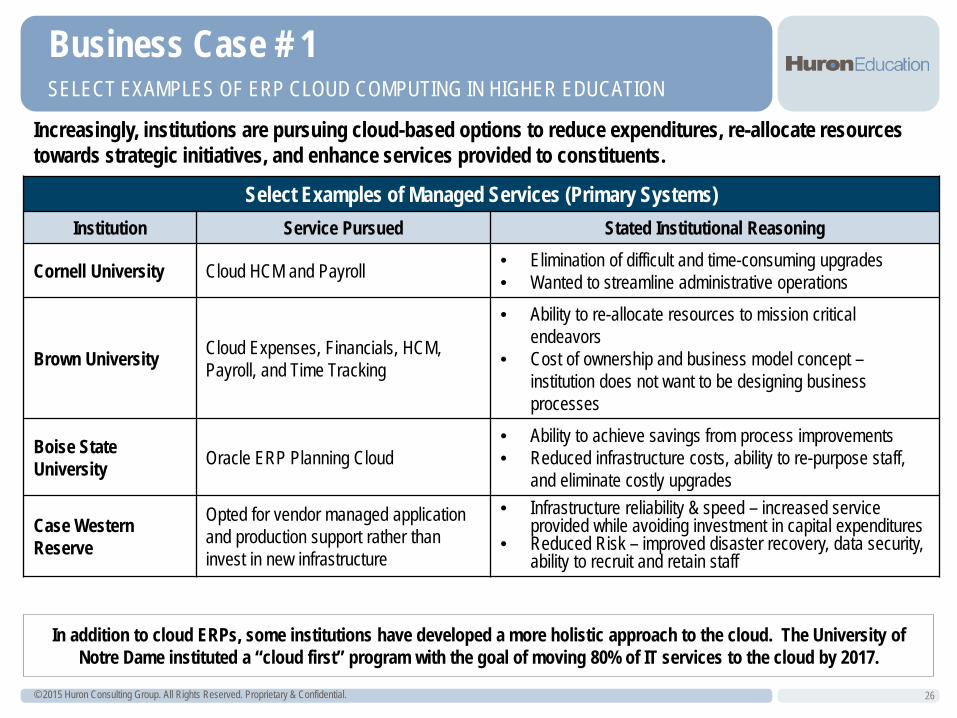
Increasingly, institutions are pursuing cloud-based options to reduce expenditures, re-allocate resources towards strategic initiatives, and enhance services provided to constituents.
Select Examples of Managed Services (Primary Systems) Institution Service Pursued Stated Institutional Reasoning
Cornell University Cloud HCM and Payroll • Elimination of difficult and time-consuming upgrades • Wanted to streamline administrative operations
Brown University Cloud Expenses, Financials, HCM, Payroll, and Time Tracking
• Ability to re-allocate resources to mission critical endeavors
• Cost of ownership and business model concept – institution does not want to be designing business processes
Boise State University Oracle ERP Planning Cloud
• Ability to achieve savings from process improvements • Reduced infrastructure costs, ability to re-purpose staff,
and eliminate costly upgrades
Case Western Reserve
Opted for vendor managed application and production support rather than invest in new infrastructure
• Infrastructure reliability & speed – increased service provided while avoiding investment in capital expenditures
• Reduced Risk – improved disaster recovery, data security, ability to recruit and retain staff
In addition to cloud ERPs, some institutions have developed a more holistic approach to the cloud. The University of Notre Dame instituted a “cloud first” program with the goal of moving 80% of IT services to the cloud by 2017.
© 2015 Huron Consulting Group. All Rights Reserved. Proprietary & Confidential.
Business Case # 1 BENEFITS / CONSIDERATIONS OF CLOUD COMPUTING
27
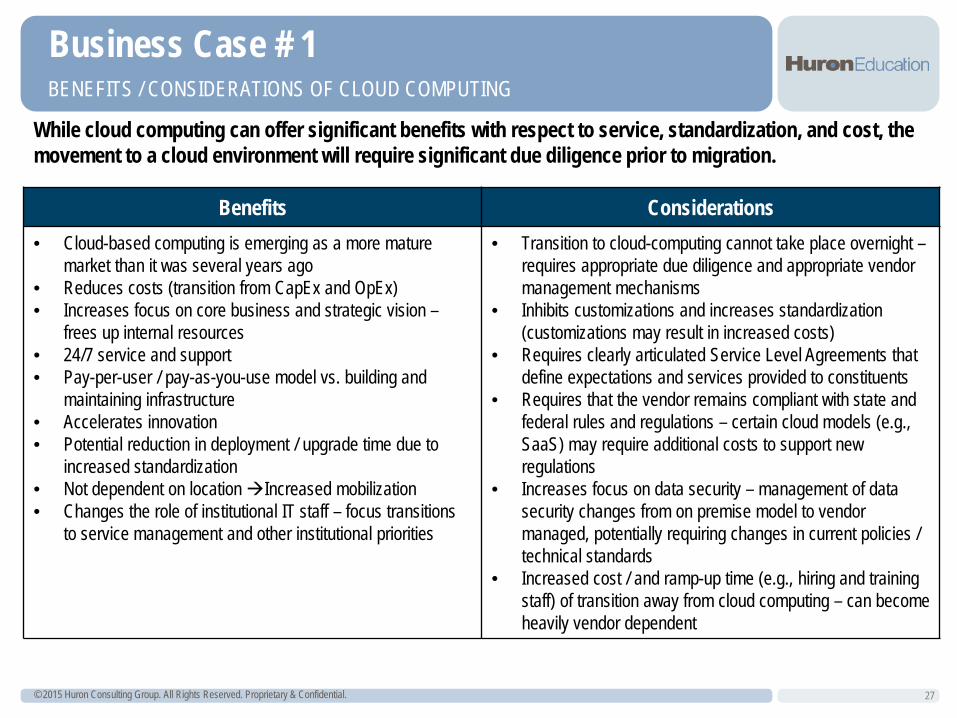
Benefits Considerations • Cloud-based computing is emerging as a more mature
market than it was several years ago • Reduces costs (transition from CapEx and OpEx) • Increases focus on core business and strategic vision –
frees up internal resources • 24/7 service and support • Pay-per-user / pay-as-you-use model vs. building and
maintaining infrastructure • Accelerates innovation • Potential reduction in deployment / upgrade time due to
increased standardization • Not dependent on location Increased mobilization • Changes the role of institutional IT staff – focus transitions
to service management and other institutional priorities
• Transition to cloud-computing cannot take place overnight – requires appropriate due diligence and appropriate vendor management mechanisms
• Inhibits customizations and increases standardization (customizations may result in increased costs)
• Requires clearly articulated Service Level Agreements that define expectations and services provided to constituents
• Requires that the vendor remains compliant with state and federal rules and regulations – certain cloud models (e.g., SaaS) may require additional costs to support new regulations
• Increases focus on data security – management of data security changes from on premise model to vendor managed, potentially requiring changes in current policies / technical standards
• Increased cost / and ramp-up time (e.g., hiring and training staff) of transition away from cloud computing – can become heavily vendor dependent
While cloud computing can offer significant benefits with respect to service, standardization, and cost, the movement to a cloud environment will require significant due diligence prior to migration.
© 2015 Huron Consulting Group. All Rights Reserved. Proprietary & Confidential.
Business Case # 1 HOSTING OPTIONS FOR CURRENT SYSTEMS
28
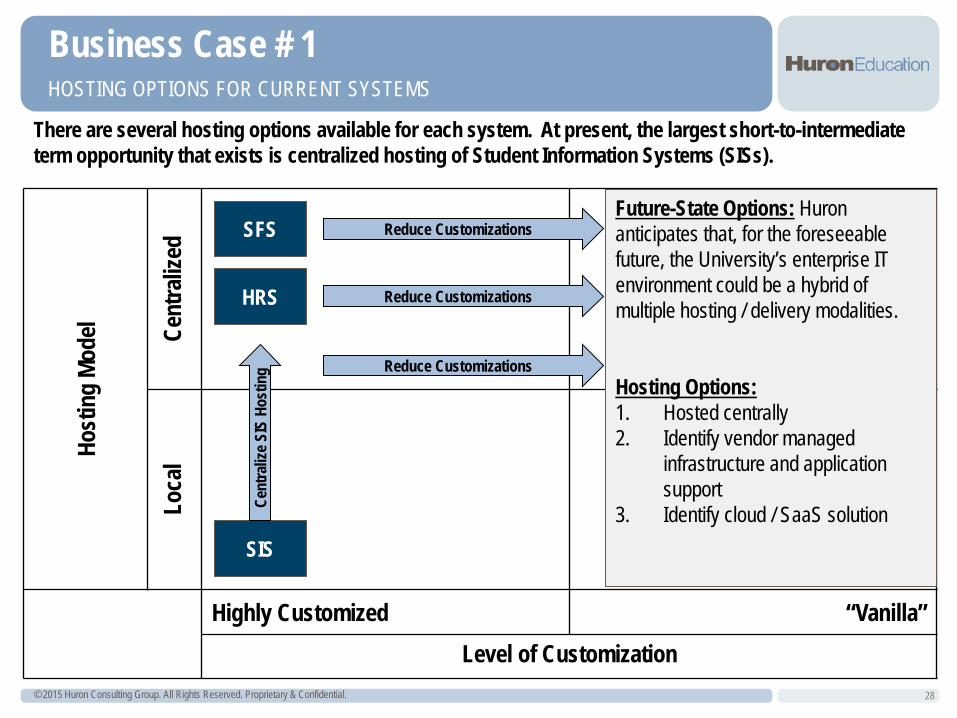
There are several hosting options available for each system. At present, the largest short-to-intermediate term opportunity that exists is centralized hosting of Student Information Systems (SISs).
Host
ing
Mode
l Cent
raliz
ed
Loca
l
Highly Customized “Vanilla” Level of Customization
SFS
HRS
SIS
Reduce Customizations
Reduce Customizations
Reduce Customizations
Cent
raliz
e SIS
Hos
ting
Future-State Options: Huron anticipates that, for the foreseeable future, the University’s enterprise IT environment could be a hybrid of multiple hosting / delivery modalities. Hosting Options: 1. Hosted centrally 2. Identify vendor managed
infrastructure and application support
3. Identify cloud / SaaS solution
© 2015 Huron Consulting Group. All Rights Reserved. Proprietary & Confidential.
Business Case # 1 SIS RECOMMENDATION OVERVIEW
29
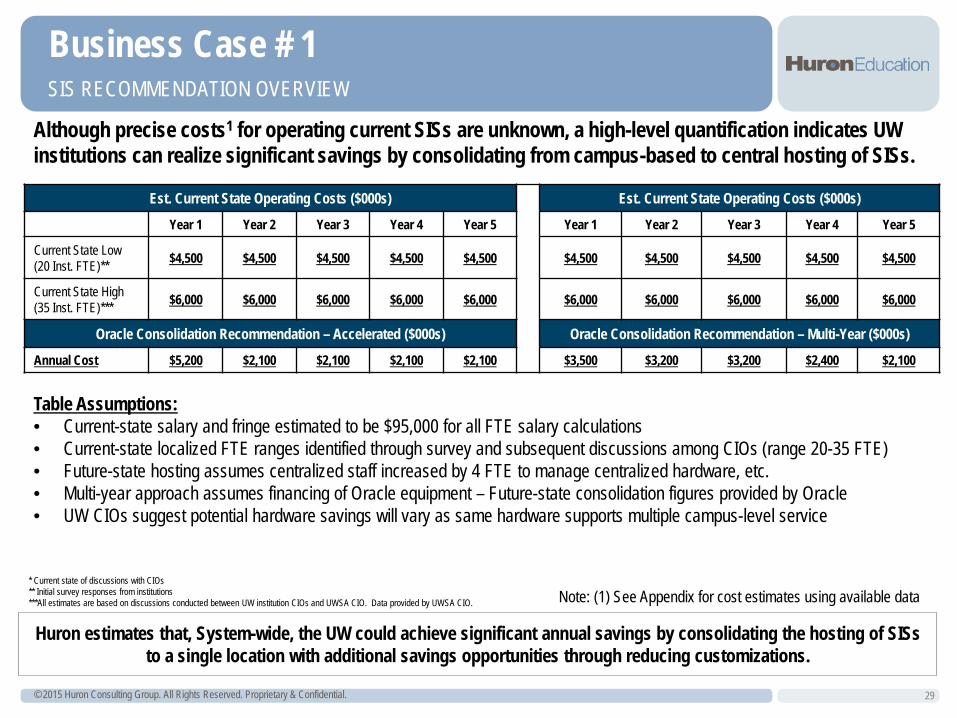
Although precise costs1 for operating current SISs are unknown, a high-level quantification indicates UW institutions can realize significant savings by consolidating from campus-based to central hosting of SISs.
* Current state of discussions with CIOs ** Initial survey responses from institutions ***All estimates are based on discussions conducted between UW institution CIOs and UWSA CIO. Data provided by UWSA CIO.
Table Assumptions: • Current-state salary and fringe estimated to be $95,000 for all FTE salary calculations • Current-state localized FTE ranges identified through survey and subsequent discussions among CIOs (range 20-35 FTE) • Future-state hosting assumes centralized staff increased by 4 FTE to manage centralized hardware, etc. • Multi-year approach assumes financing of Oracle equipment – Future-state consolidation figures provided by Oracle • UW CIOs suggest potential hardware savings will vary as same hardware supports multiple campus-level service
Note: (1) See Appendix for cost estimates using available data
Huron estimates that, System-wide, the UW could achieve significant annual savings by consolidating the hosting of SISs to a single location with additional savings opportunities through reducing customizations.
Est. Current State Operating Costs ($000s) Est. Current State Operating Costs ($000s) Year 1 Year 2 Year 3 Year 4 Year 5 Year 1 Year 2 Year 3 Year 4 Year 5
Current State Low (20 Inst. FTE)** $4,500 $4,500 $4,500 $4,500 $4,500 $4,500 $4,500 $4,500 $4,500 $4,500
Current State High (35 Inst. FTE)*** $6,000 $6,000 $6,000 $6,000 $6,000 $6,000 $6,000 $6,000 $6,000 $6,000
Oracle Consolidation Recommendation – Accelerated ($000s) Oracle Consolidation Recommendation – Multi-Year ($000s) Annual Cost $5,200 $2,100 $2,100 $2,100 $2,100 $3,500 $3,200 $3,200 $2,400 $2,100
© 2015 Huron Consulting Group. All Rights Reserved. Proprietary & Confidential.
Business Case # 1 STANDARDIZATION OF INSTITUTIONAL BUSINESS PROCESSES
30
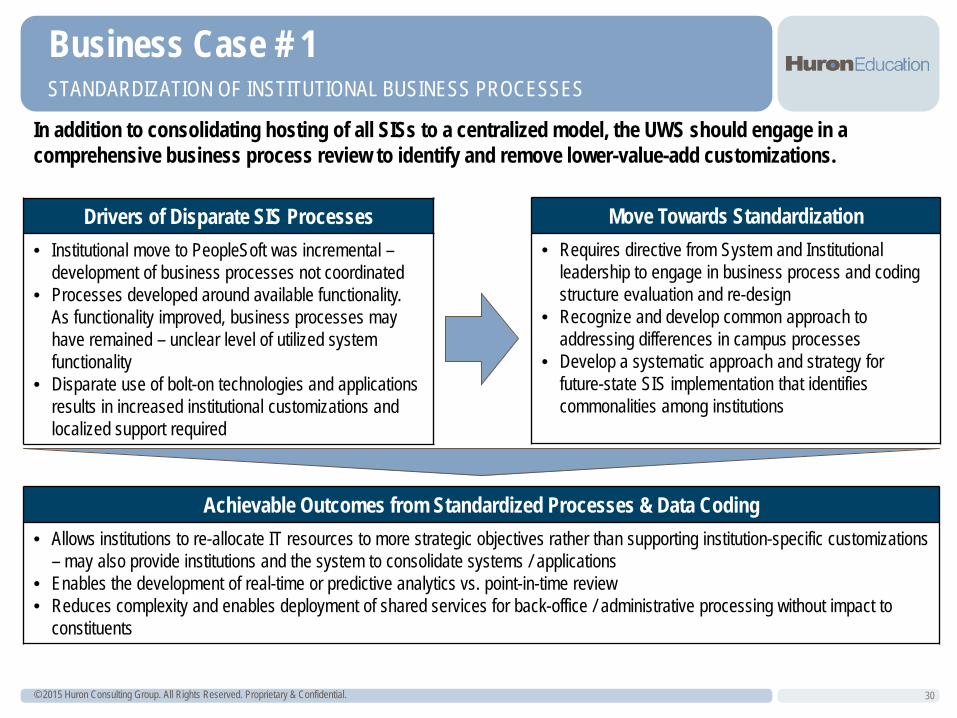
In addition to consolidating hosting of all SISs to a centralized model, the UWS should engage in a comprehensive business process review to identify and remove lower-value-add customizations.
Drivers of Disparate SIS Processes • Institutional move to PeopleSoft was incremental –
development of business processes not coordinated • Processes developed around available functionality.
As functionality improved, business processes may have remained – unclear level of utilized system functionality
• Disparate use of bolt-on technologies and applications results in increased institutional customizations and localized support required
Move Towards Standardization • Requires directive from System and Institutional
leadership to engage in business process and coding structure evaluation and re-design
• Recognize and develop common approach to addressing differences in campus processes
• Develop a systematic approach and strategy for future-state SIS implementation that identifies commonalities among institutions
Achievable Outcomes from Standardized Processes & Data Coding • Allows institutions to re-allocate IT resources to more strategic objectives rather than supporting institution-specific customizations
– may also provide institutions and the system to consolidate systems / applications • Enables the development of real-time or predictive analytics vs. point-in-time review • Reduces complexity and enables deployment of shared services for back-office / administrative processing without impact to
constituents
© 2015 Huron Consulting Group. All Rights Reserved. Proprietary & Confidential.
Business Case # 1 VENDOR MATURITY AND UWS READINESS
31
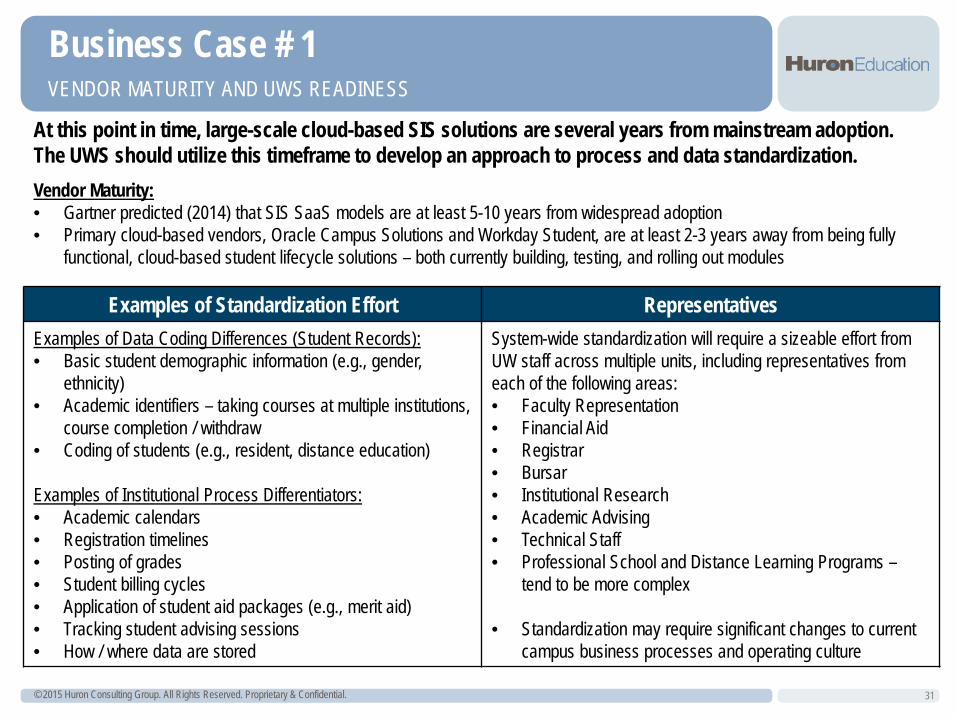
At this point in time, large-scale cloud-based SIS solutions are several years from mainstream adoption. The UWS should utilize this timeframe to develop an approach to process and data standardization. Vendor Maturity: • Gartner predicted (2014) that SIS SaaS models are at least 5-10 years from widespread adoption • Primary cloud-based vendors, Oracle Campus Solutions and Workday Student, are at least 2-3 years away from being fully
functional, cloud-based student lifecycle solutions – both currently building, testing, and rolling out modules
Examples of Standardization Effort Representatives Examples of Data Coding Differences (Student Records): • Basic student demographic information (e.g., gender,
ethnicity) • Academic identifiers – taking courses at multiple institutions,
course completion / withdraw • Coding of students (e.g., resident, distance education) Examples of Institutional Process Differentiators: • Academic calendars • Registration timelines • Posting of grades • Student billing cycles • Application of student aid packages (e.g., merit aid) • Tracking student advising sessions • How / where data are stored
System-wide standardization will require a sizeable effort from UW staff across multiple units, including representatives from each of the following areas: • Faculty Representation • Financial Aid • Registrar • Bursar • Institutional Research • Academic Advising • Technical Staff • Professional School and Distance Learning Programs –
tend to be more complex
• Standardization may require significant changes to current campus business processes and operating culture
© 2015 Huron Consulting Group. All Rights Reserved. Proprietary & Confidential.
Business Case # 1 HRS & SFS OVERVIEW
32
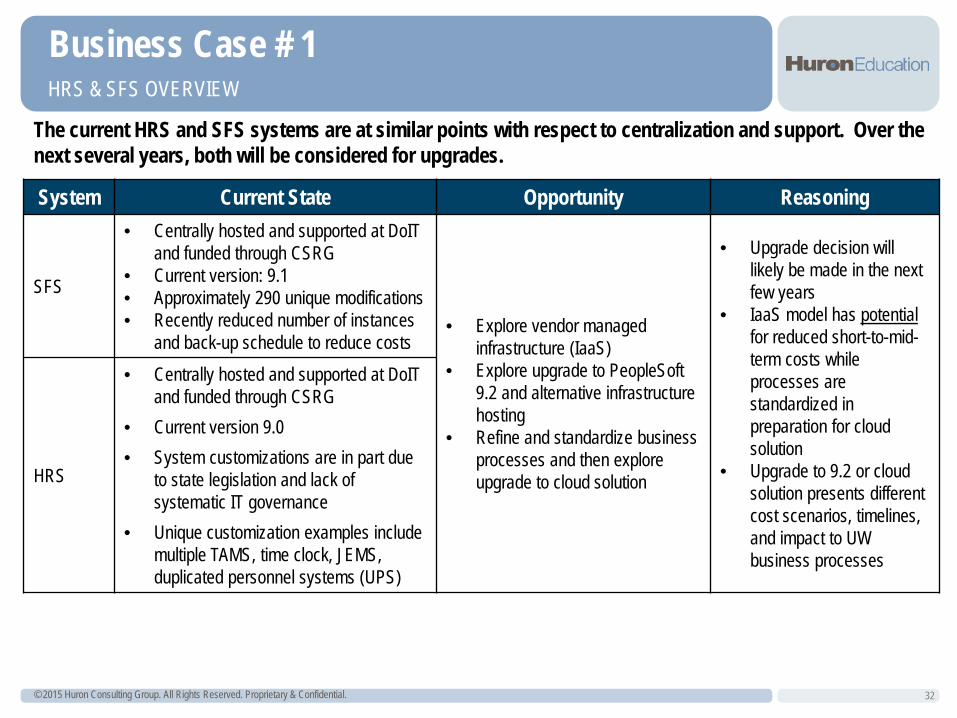
The current HRS and SFS systems are at similar points with respect to centralization and support. Over the next several years, both will be considered for upgrades.
System Current State Opportunity Reasoning
SFS
• Centrally hosted and supported at DoIT and funded through CSRG
• Current version: 9.1 • Approximately 290 unique modifications • Recently reduced number of instances
and back-up schedule to reduce costs • Explore vendor managed
infrastructure (IaaS) • Explore upgrade to PeopleSoft
9.2 and alternative infrastructure hosting
• Refine and standardize business processes and then explore upgrade to cloud solution
• Upgrade decision will likely be made in the next few years
• IaaS model has potential for reduced short-to-mid-term costs while processes are standardized in preparation for cloud solution
• Upgrade to 9.2 or cloud solution presents different cost scenarios, timelines, and impact to UW business processes
HRS
• Centrally hosted and supported at DoIT and funded through CSRG
• Current version 9.0 • System customizations are in part due
to state legislation and lack of systematic IT governance
• Unique customization examples include multiple TAMS, time clock, JEMS, duplicated personnel systems (UPS)
© 2015 Huron Consulting Group. All Rights Reserved. Proprietary & Confidential.
Business Case # 1 HRS & SFS OVERVIEW (CONT’D)
33
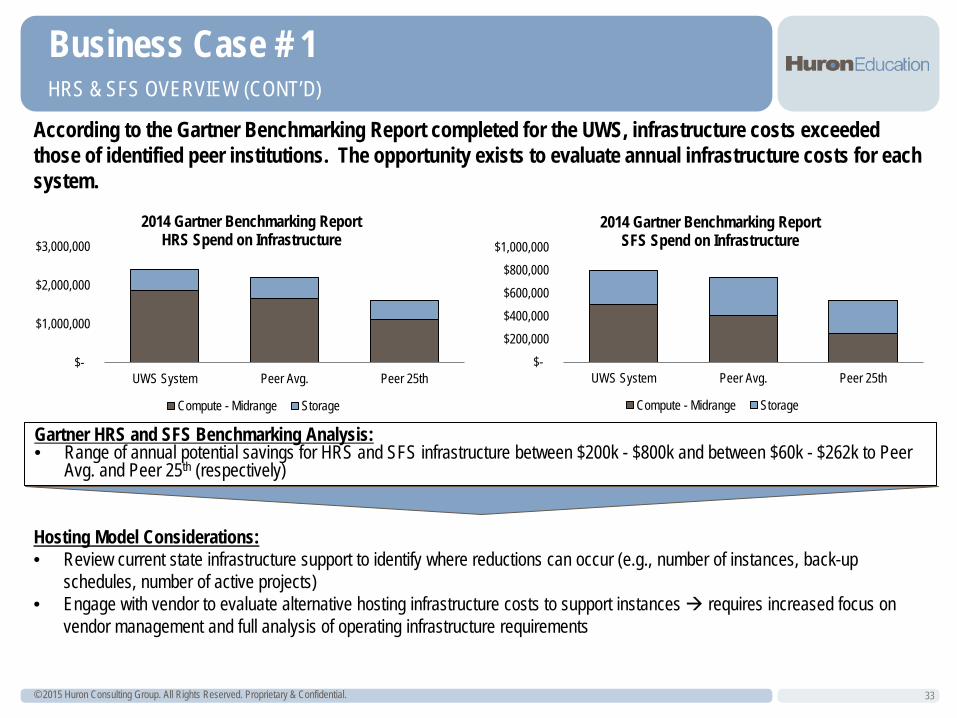
According to the Gartner Benchmarking Report completed for the UWS, infrastructure costs exceeded those of identified peer institutions. The opportunity exists to evaluate annual infrastructure costs for each system.
$-
$1,000,000
$2,000,000
$3,000,000
UWS System Peer Avg. Peer 25th
2014 Gartner Benchmarking Report HRS Spend on Infrastructure
Compute - Midrange Storage
$- $200,000 $400,000 $600,000 $800,000
$1,000,000
UWS System Peer Avg. Peer 25th
2014 Gartner Benchmarking Report SFS Spend on Infrastructure
Compute - Midrange Storage
Gartner HRS and SFS Benchmarking Analysis: • Range of annual potential savings for HRS and SFS infrastructure between $200k - $800k and between $60k - $262k to Peer
Avg. and Peer 25th (respectively)
Hosting Model Considerations: • Review current state infrastructure support to identify where reductions can occur (e.g., number of instances, back-up
schedules, number of active projects) • Engage with vendor to evaluate alternative hosting infrastructure costs to support instances requires increased focus on
vendor management and full analysis of operating infrastructure requirements
© 2015 Huron Consulting Group. All Rights Reserved. Proprietary & Confidential.
Business Case # 1 HRS & SFS OVERVIEW (CONT’D)
34
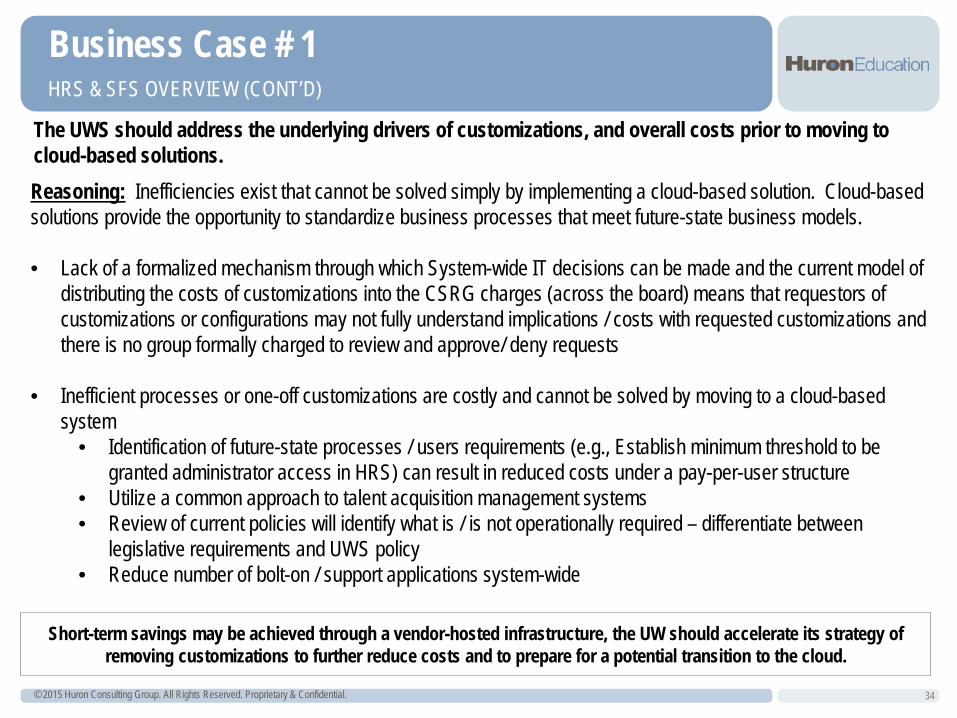
The UWS should address the underlying drivers of customizations, and overall costs prior to moving to cloud-based solutions. Reasoning: Inefficiencies exist that cannot be solved simply by implementing a cloud-based solution. Cloud-based solutions provide the opportunity to standardize business processes that meet future-state business models. • Lack of a formalized mechanism through which System-wide IT decisions can be made and the current model of
distributing the costs of customizations into the CSRG charges (across the board) means that requestors of customizations or configurations may not fully understand implications / costs with requested customizations and there is no group formally charged to review and approve/ deny requests
• Inefficient processes or one-off customizations are costly and cannot be solved by moving to a cloud-based system
• Identification of future-state processes / users requirements (e.g., Establish minimum threshold to be granted administrator access in HRS) can result in reduced costs under a pay-per-user structure
• Utilize a common approach to talent acquisition management systems • Review of current policies will identify what is / is not operationally required – differentiate between
legislative requirements and UWS policy • Reduce number of bolt-on / support applications system-wide
Short-term savings may be achieved through a vendor-hosted infrastructure, the UW should accelerate its strategy of
removing customizations to further reduce costs and to prepare for a potential transition to the cloud.
© 2015 Huron Consulting Group. All Rights Reserved. Proprietary & Confidential.
Business Case # 1 BUDGET SYSTEM CONSIDERATIONS
35
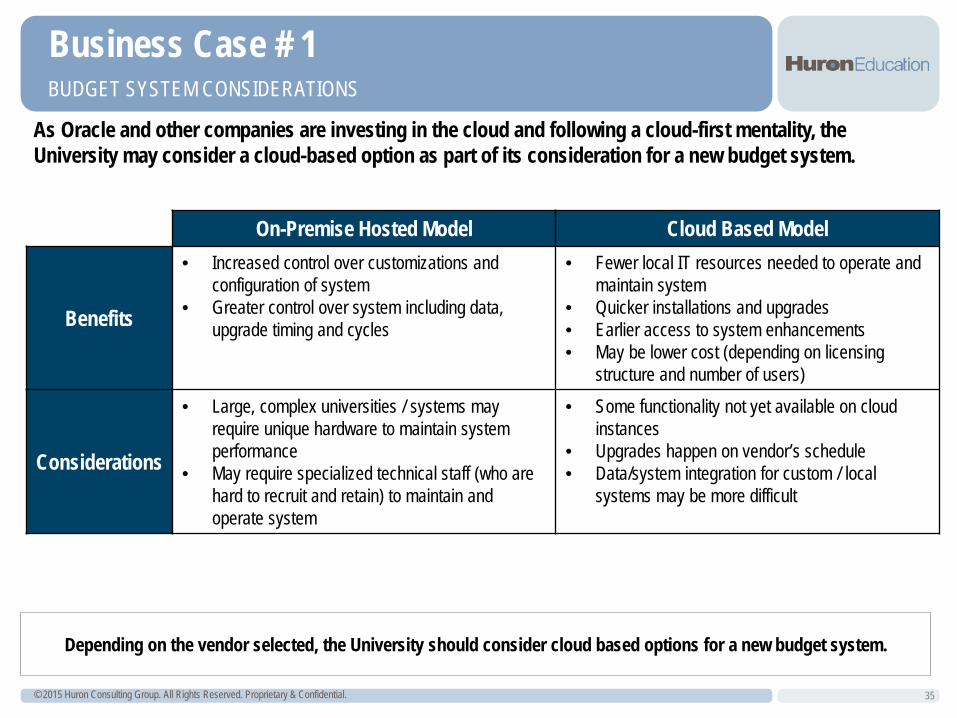
As Oracle and other companies are investing in the cloud and following a cloud-first mentality, the University may consider a cloud-based option as part of its consideration for a new budget system.
On-Premise Hosted Model Cloud Based Model
Benefits
• Increased control over customizations and configuration of system
• Greater control over system including data, upgrade timing and cycles
• Fewer local IT resources needed to operate and maintain system
• Quicker installations and upgrades • Earlier access to system enhancements • May be lower cost (depending on licensing
structure and number of users)
Considerations
• Large, complex universities / systems may require unique hardware to maintain system performance
• May require specialized technical staff (who are hard to recruit and retain) to maintain and operate system
• Some functionality not yet available on cloud instances
• Upgrades happen on vendor’s schedule • Data/system integration for custom / local
systems may be more difficult
Depending on the vendor selected, the University should consider cloud based options for a new budget system.
© 2015 Huron Consulting Group. All Rights Reserved. Proprietary & Confidential.
Business Case # 1 RECOMMENDATIONS
36
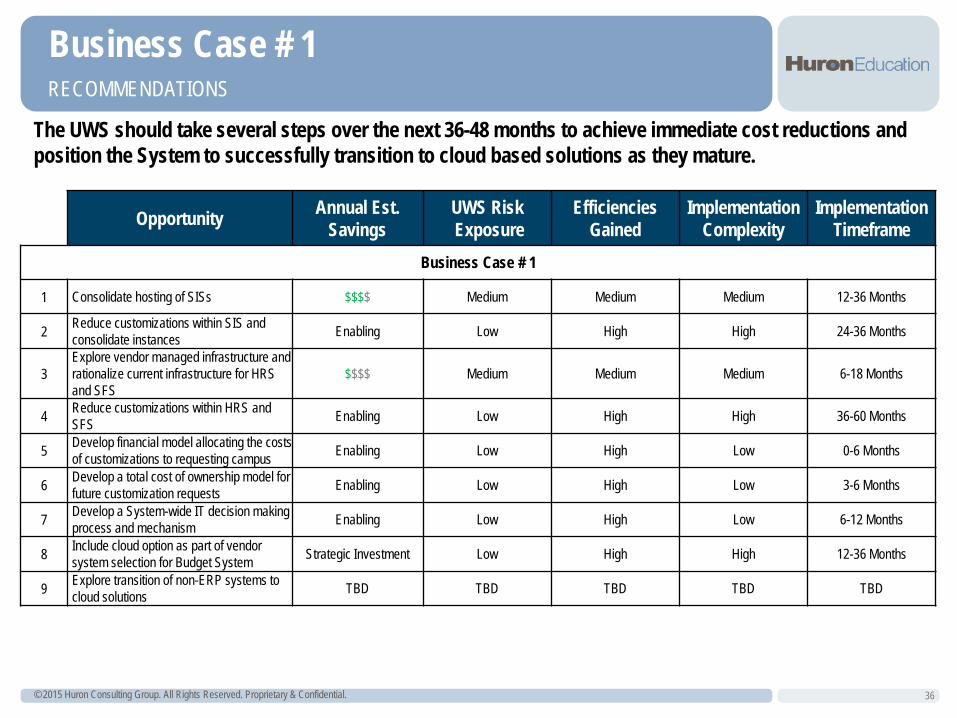
The UWS should take several steps over the next 36-48 months to achieve immediate cost reductions and position the System to successfully transition to cloud based solutions as they mature.
Opportunity Annual Est. Savings
UWS Risk Exposure
Efficiencies Gained
Implementation Complexity
Implementation Timeframe
Business Case # 1
1 Consolidate hosting of SISs $$$$ Medium Medium Medium 12-36 Months
2 Reduce customizations within SIS and consolidate instances Enabling Low High High 24-36 Months
3 Explore vendor managed infrastructure and rationalize current infrastructure for HRS and SFS
$$$$ Medium Medium Medium 6-18 Months
4 Reduce customizations within HRS and SFS Enabling Low High High 36-60 Months
5 Develop financial model allocating the costs of customizations to requesting campus Enabling Low High Low 0-6 Months
6 Develop a total cost of ownership model for future customization requests Enabling Low High Low 3-6 Months
7 Develop a System-wide IT decision making process and mechanism Enabling Low High Low 6-12 Months
8 Include cloud option as part of vendor system selection for Budget System Strategic Investment Low High High 12-36 Months
9 Explore transition of non-ERP systems to cloud solutions TBD TBD TBD TBD TBD
Business Case #2: Evaluate Alternative IT Administrative and Service
Delivery Models
© 2015 Huron Consulting Group. All Rights Reserved. Proprietary & Confidential. 38
CURRENT STATE IT ADMINISTRATION & SERVICE DELIVERY
Business Case #2
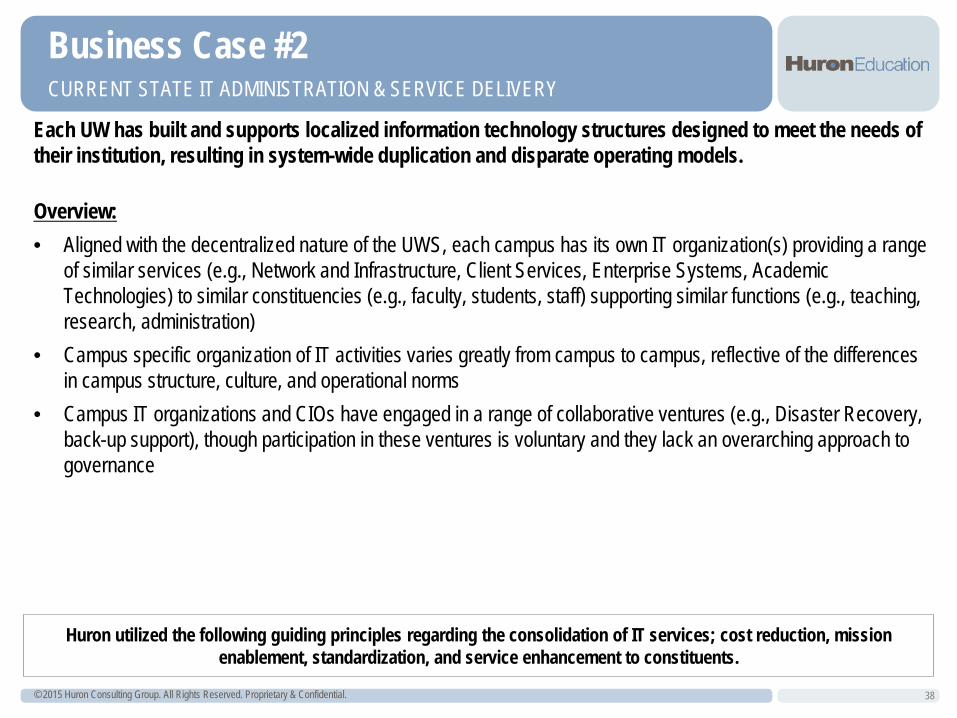
Each UW has built and supports localized information technology structures designed to meet the needs of their institution, resulting in system-wide duplication and disparate operating models.
Overview: • Aligned with the decentralized nature of the UWS, each campus has its own IT organization(s) providing a range
of similar services (e.g., Network and Infrastructure, Client Services, Enterprise Systems, Academic Technologies) to similar constituencies (e.g., faculty, students, staff) supporting similar functions (e.g., teaching, research, administration)
• Campus specific organization of IT activities varies greatly from campus to campus, reflective of the differences in campus structure, culture, and operational norms
• Campus IT organizations and CIOs have engaged in a range of collaborative ventures (e.g., Disaster Recovery, back-up support), though participation in these ventures is voluntary and they lack an overarching approach to governance
Huron utilized the following guiding principles regarding the consolidation of IT services; cost reduction, mission enablement, standardization, and service enhancement to constituents.
© 2015 Huron Consulting Group. All Rights Reserved. Proprietary & Confidential. 39
CURRENT STATE IT ADMINISTRATION & SERVICE DELIVERY
Business Case #2
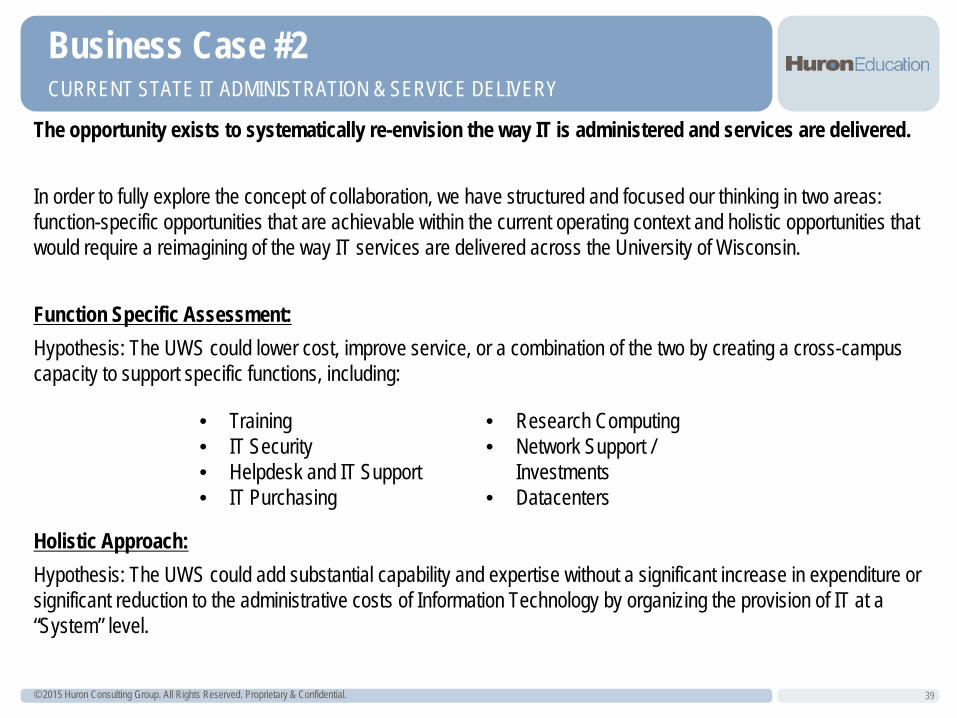
The opportunity exists to systematically re-envision the way IT is administered and services are delivered.
In order to fully explore the concept of collaboration, we have structured and focused our thinking in two areas: function-specific opportunities that are achievable within the current operating context and holistic opportunities that would require a reimagining of the way IT services are delivered across the University of Wisconsin. Function Specific Assessment: Hypothesis: The UWS could lower cost, improve service, or a combination of the two by creating a cross-campus capacity to support specific functions, including: Holistic Approach: Hypothesis: The UWS could add substantial capability and expertise without a significant increase in expenditure or significant reduction to the administrative costs of Information Technology by organizing the provision of IT at a “System” level.
• Training • IT Security • Helpdesk and IT Support • IT Purchasing
• Research Computing • Network Support /
Investments • Datacenters
© 2015 Huron Consulting Group. All Rights Reserved. Proprietary & Confidential. 40
TYPES OF IT MODELS
Business Case #2
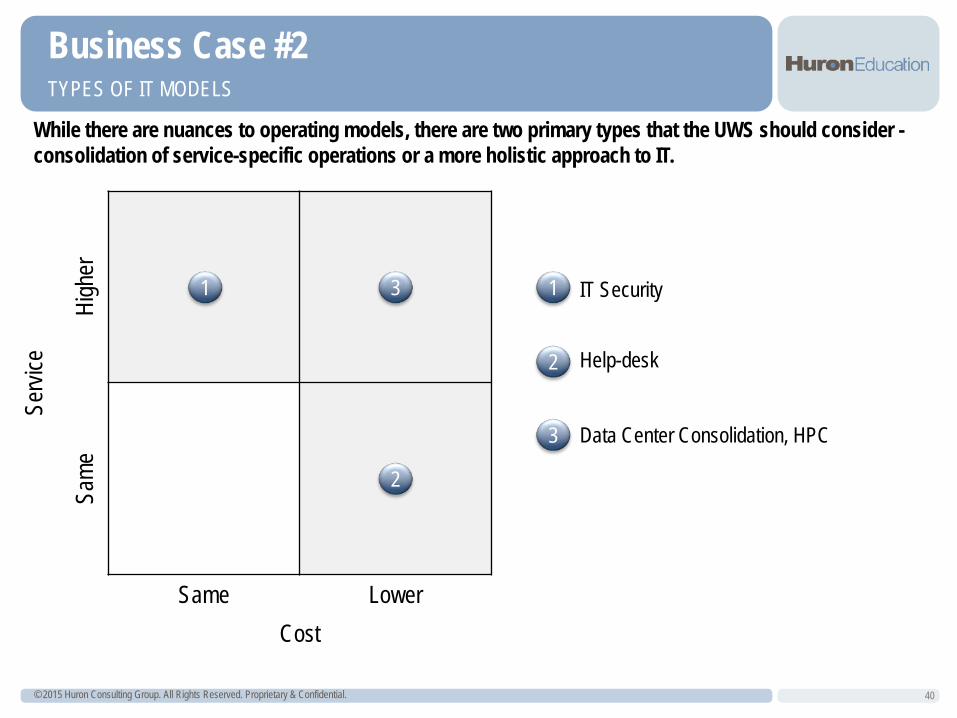
While there are nuances to operating models, there are two primary types that the UWS should consider - consolidation of service-specific operations or a more holistic approach to IT.
Servi
ce
High
er
3 1
Same
2
Same Lower Cost
3 1
2
1
3
2
IT Security
Help-desk
Data Center Consolidation, HPC
© 2015 Huron Consulting Group. All Rights Reserved. Proprietary & Confidential. 41
EXAMPLE 1: IT SECURITY
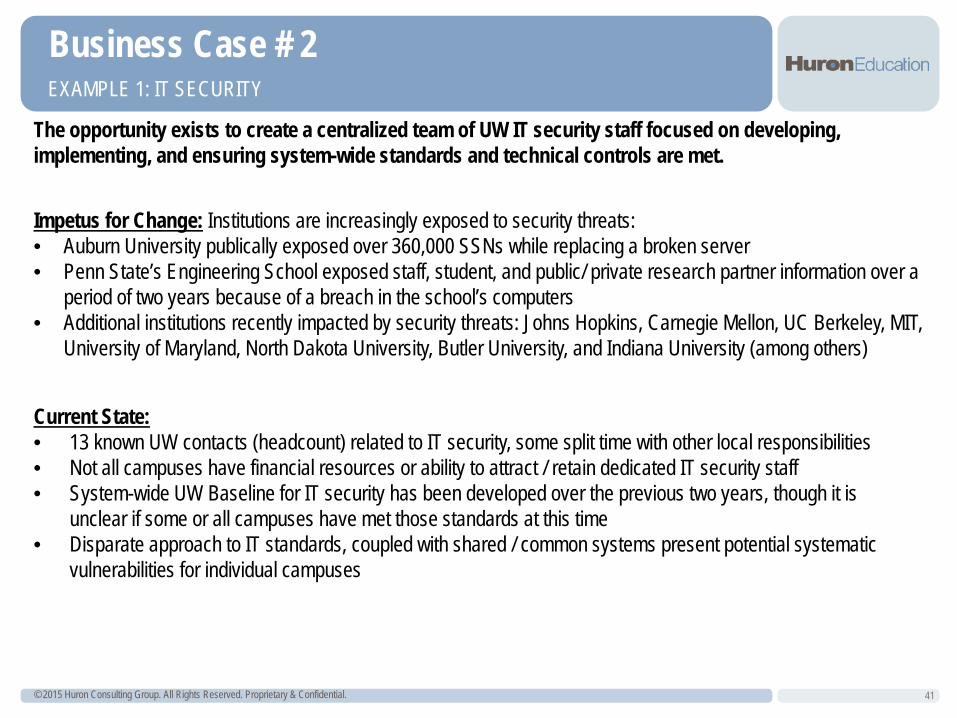
The opportunity exists to create a centralized team of UW IT security staff focused on developing, implementing, and ensuring system-wide standards and technical controls are met.
Business Case # 2
Current State: • 13 known UW contacts (headcount) related to IT security, some split time with other local responsibilities • Not all campuses have financial resources or ability to attract / retain dedicated IT security staff • System-wide UW Baseline for IT security has been developed over the previous two years, though it is
unclear if some or all campuses have met those standards at this time • Disparate approach to IT standards, coupled with shared / common systems present potential systematic
vulnerabilities for individual campuses
Impetus for Change: Institutions are increasingly exposed to security threats: • Auburn University publically exposed over 360,000 SSNs while replacing a broken server • Penn State’s Engineering School exposed staff, student, and public/ private research partner information over a
period of two years because of a breach in the school’s computers • Additional institutions recently impacted by security threats: Johns Hopkins, Carnegie Mellon, UC Berkeley, MIT,
University of Maryland, North Dakota University, Butler University, and Indiana University (among others)
© 2015 Huron Consulting Group. All Rights Reserved. Proprietary & Confidential. 42
EXAMPLE 1: IT SECURITY (CONT’D)
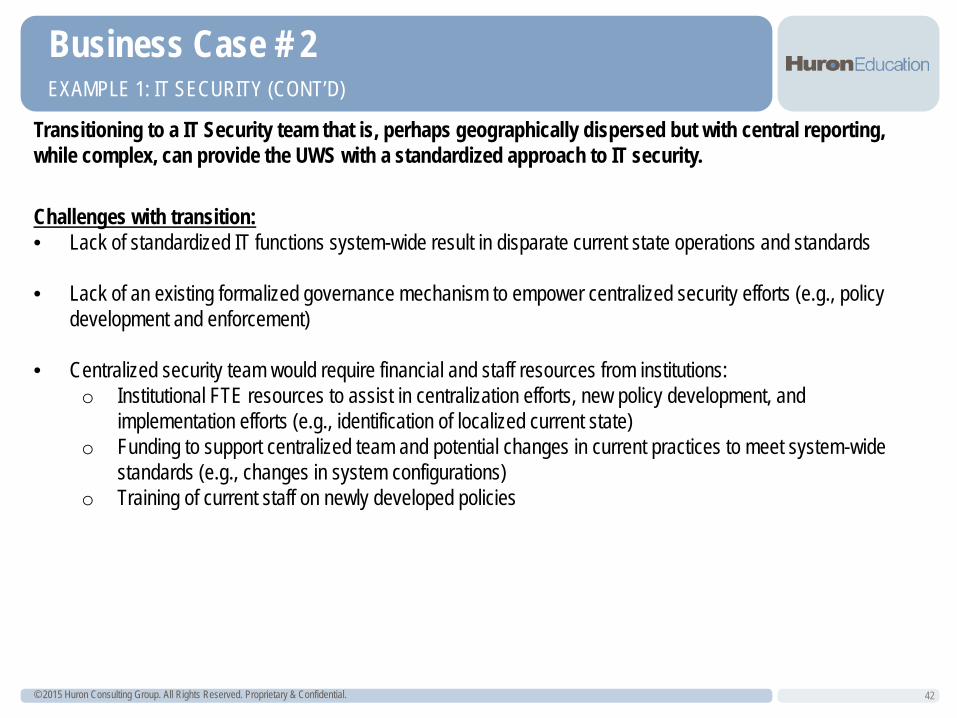
Transitioning to a IT Security team that is, perhaps geographically dispersed but with central reporting, while complex, can provide the UWS with a standardized approach to IT security.
Business Case # 2
Challenges with transition: • Lack of standardized IT functions system-wide result in disparate current state operations and standards
• Lack of an existing formalized governance mechanism to empower centralized security efforts (e.g., policy
development and enforcement)
• Centralized security team would require financial and staff resources from institutions: o Institutional FTE resources to assist in centralization efforts, new policy development, and
implementation efforts (e.g., identification of localized current state) o Funding to support centralized team and potential changes in current practices to meet system-wide
standards (e.g., changes in system configurations) o Training of current staff on newly developed policies
© 2015 Huron Consulting Group. All Rights Reserved. Proprietary & Confidential. 43
EXAMPLE 1: IT SECURITY (CONT’D)
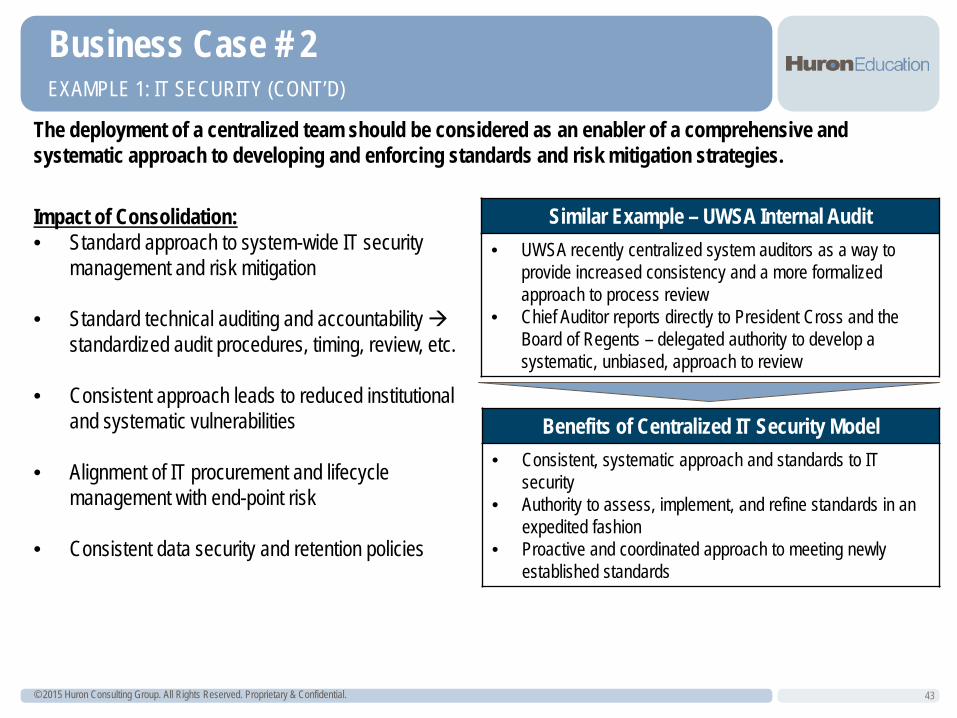
The deployment of a centralized team should be considered as an enabler of a comprehensive and systematic approach to developing and enforcing standards and risk mitigation strategies.
Business Case # 2
Impact of Consolidation: • Standard approach to system-wide IT security
management and risk mitigation
• Standard technical auditing and accountability standardized audit procedures, timing, review, etc.
• Consistent approach leads to reduced institutional and systematic vulnerabilities
• Alignment of IT procurement and lifecycle management with end-point risk
• Consistent data security and retention policies
Similar Example – UWSA Internal Audit • UWSA recently centralized system auditors as a way to
provide increased consistency and a more formalized approach to process review
• Chief Auditor reports directly to President Cross and the Board of Regents – delegated authority to develop a systematic, unbiased, approach to review
Benefits of Centralized IT Security Model • Consistent, systematic approach and standards to IT
security • Authority to assess, implement, and refine standards in an
expedited fashion • Proactive and coordinated approach to meeting newly
established standards
© 2015 Huron Consulting Group. All Rights Reserved. Proprietary & Confidential.
Business Case # 2 EXAMPLE 2: HELPDESK (HD) OVERVIEW
44
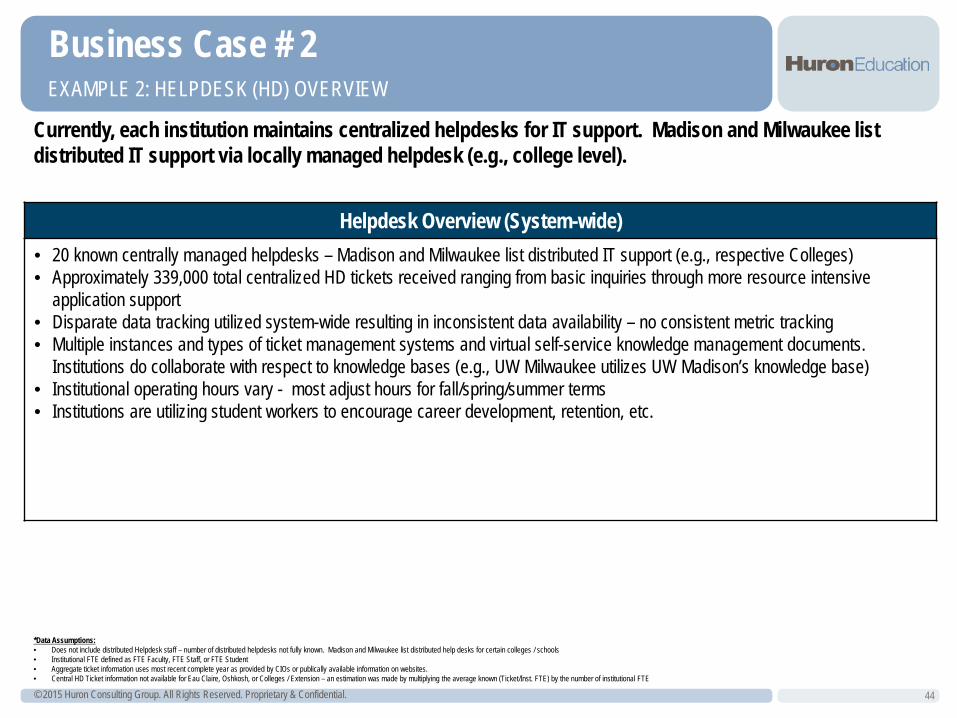
Currently, each institution maintains centralized helpdesks for IT support. Madison and Milwaukee list distributed IT support via locally managed helpdesk (e.g., college level).
*Data Assumptions: • Does not include distributed Helpdesk staff – number of distributed helpdesks not fully known. Madison and Milwaukee list distributed help desks for certain colleges / schools • Institutional FTE defined as FTE Faculty, FTE Staff, or FTE Student • Aggregate ticket information uses most recent complete year as provided by CIOs or publically available information on websites. • Central HD Ticket information not available for Eau Claire, Oshkosh, or Colleges / Extension – an estimation was made by multiplying the average known (Ticket/Inst. FTE) by the number of institutional FTE
Helpdesk Overview (System-wide) • 20 known centrally managed helpdesks – Madison and Milwaukee list distributed IT support (e.g., respective Colleges) • Approximately 339,000 total centralized HD tickets received ranging from basic inquiries through more resource intensive
application support • Disparate data tracking utilized system-wide resulting in inconsistent data availability – no consistent metric tracking • Multiple instances and types of ticket management systems and virtual self-service knowledge management documents.
Institutions do collaborate with respect to knowledge bases (e.g., UW Milwaukee utilizes UW Madison’s knowledge base) • Institutional operating hours vary - most adjust hours for fall/spring/summer terms • Institutions are utilizing student workers to encourage career development, retention, etc.
© 2015 Huron Consulting Group. All Rights Reserved. Proprietary & Confidential. 45
EXAMPLE 2: CONCEPTUAL FUTURE STATE HD MODEL
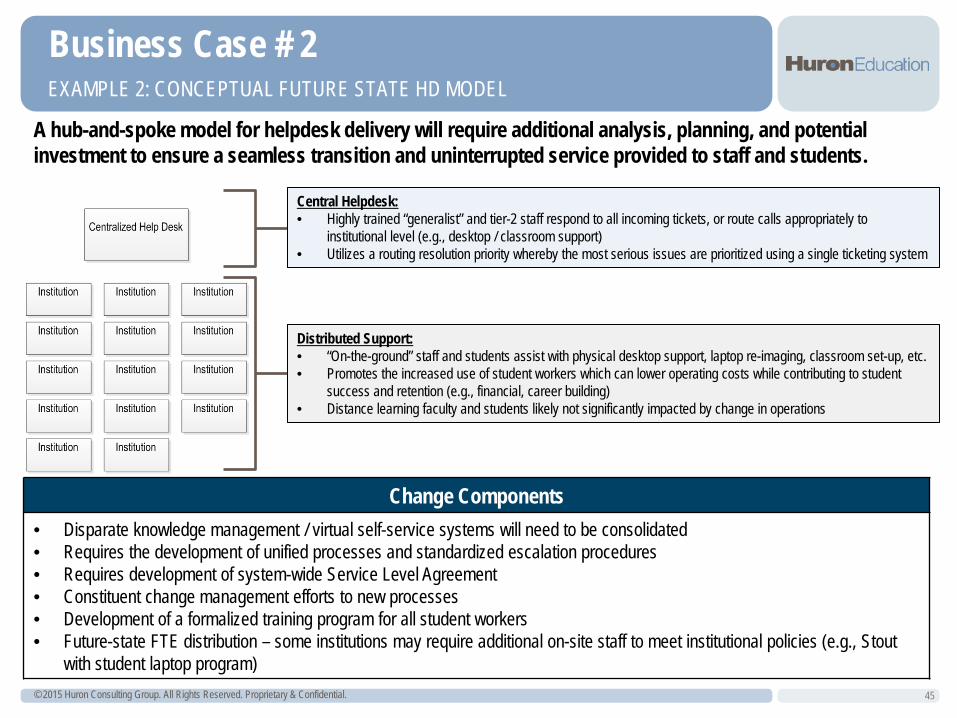
A hub-and-spoke model for helpdesk delivery will require additional analysis, planning, and potential investment to ensure a seamless transition and uninterrupted service provided to staff and students.
Business Case # 2
Central Helpdesk: • Highly trained “generalist” and tier-2 staff respond to all incoming tickets, or route calls appropriately to
institutional level (e.g., desktop / classroom support) • Utilizes a routing resolution priority whereby the most serious issues are prioritized using a single ticketing system
Distributed Support: • “On-the-ground” staff and students assist with physical desktop support, laptop re-imaging, classroom set-up, etc. • Promotes the increased use of student workers which can lower operating costs while contributing to student
success and retention (e.g., financial, career building) • Distance learning faculty and students likely not significantly impacted by change in operations
Change Components • Disparate knowledge management / virtual self-service systems will need to be consolidated • Requires the development of unified processes and standardized escalation procedures • Requires development of system-wide Service Level Agreement • Constituent change management efforts to new processes • Development of a formalized training program for all student workers • Future-state FTE distribution – some institutions may require additional on-site staff to meet institutional policies (e.g., Stout
with student laptop program)
© 2015 Huron Consulting Group. All Rights Reserved. Proprietary & Confidential. 46
EXAMPLE 2: FUTURE-STATE HELPDESK BENEFITS AND CONSIDERATIONS
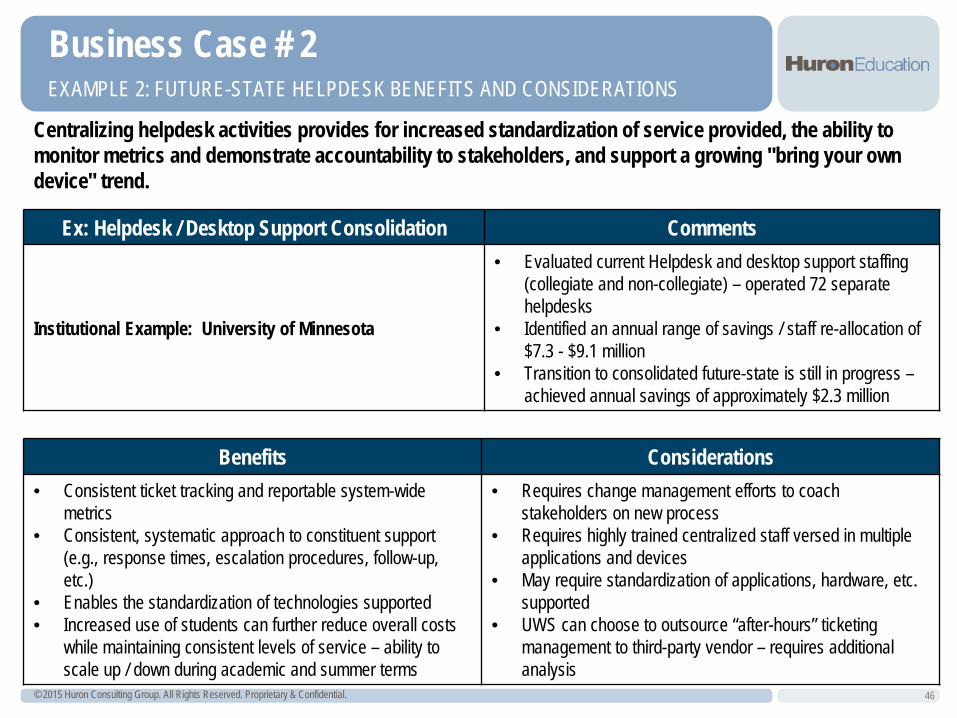
Centralizing helpdesk activities provides for increased standardization of service provided, the ability to monitor metrics and demonstrate accountability to stakeholders, and support a growing "bring your own device" trend.
Business Case # 2
Benefits Considerations • Consistent ticket tracking and reportable system-wide
metrics • Consistent, systematic approach to constituent support
(e.g., response times, escalation procedures, follow-up, etc.)
• Enables the standardization of technologies supported • Increased use of students can further reduce overall costs
while maintaining consistent levels of service – ability to scale up / down during academic and summer terms
• Requires change management efforts to coach stakeholders on new process
• Requires highly trained centralized staff versed in multiple applications and devices
• May require standardization of applications, hardware, etc. supported
• UWS can choose to outsource “after-hours” ticketing management to third-party vendor – requires additional analysis
Ex: Helpdesk / Desktop Support Consolidation Comments
Institutional Example: University of Minnesota
• Evaluated current Helpdesk and desktop support staffing (collegiate and non-collegiate) – operated 72 separate helpdesks
• Identified an annual range of savings / staff re-allocation of $7.3 - $9.1 million
• Transition to consolidated future-state is still in progress – achieved annual savings of approximately $2.3 million
© 2015 Huron Consulting Group. All Rights Reserved. Proprietary & Confidential. 47
EXAMPLE 3: CENTRALIZED HIGH PERFORMANCE COMPUTING (HPC)
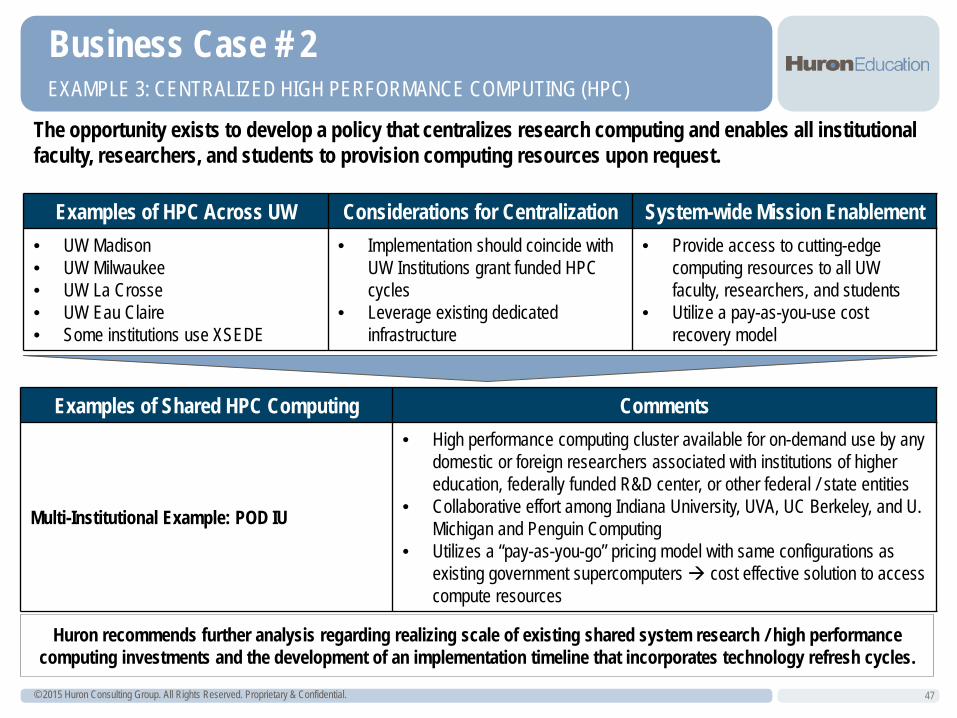
The opportunity exists to develop a policy that centralizes research computing and enables all institutional faculty, researchers, and students to provision computing resources upon request.
Business Case # 2
Examples of Shared HPC Computing Comments
Multi-Institutional Example: POD IU
• High performance computing cluster available for on-demand use by any domestic or foreign researchers associated with institutions of higher education, federally funded R&D center, or other federal / state entities
• Collaborative effort among Indiana University, UVA, UC Berkeley, and U. Michigan and Penguin Computing
• Utilizes a “pay-as-you-go” pricing model with same configurations as existing government supercomputers cost effective solution to access compute resources
Examples of HPC Across UW Considerations for Centralization System-wide Mission Enablement • UW Madison • UW Milwaukee • UW La Crosse • UW Eau Claire • Some institutions use XSEDE
• Implementation should coincide with UW Institutions grant funded HPC cycles
• Leverage existing dedicated infrastructure
• Provide access to cutting-edge computing resources to all UW faculty, researchers, and students
• Utilize a pay-as-you-use cost recovery model
Huron recommends further analysis regarding realizing scale of existing shared system research / high performance computing investments and the development of an implementation timeline that incorporates technology refresh cycles.
© 2015 Huron Consulting Group. All Rights Reserved. Proprietary & Confidential. 48
EXAMPLE 4: CONSOLIDATE SYSTEM-WIDE DATACENTERS / SERVER FACILITIES
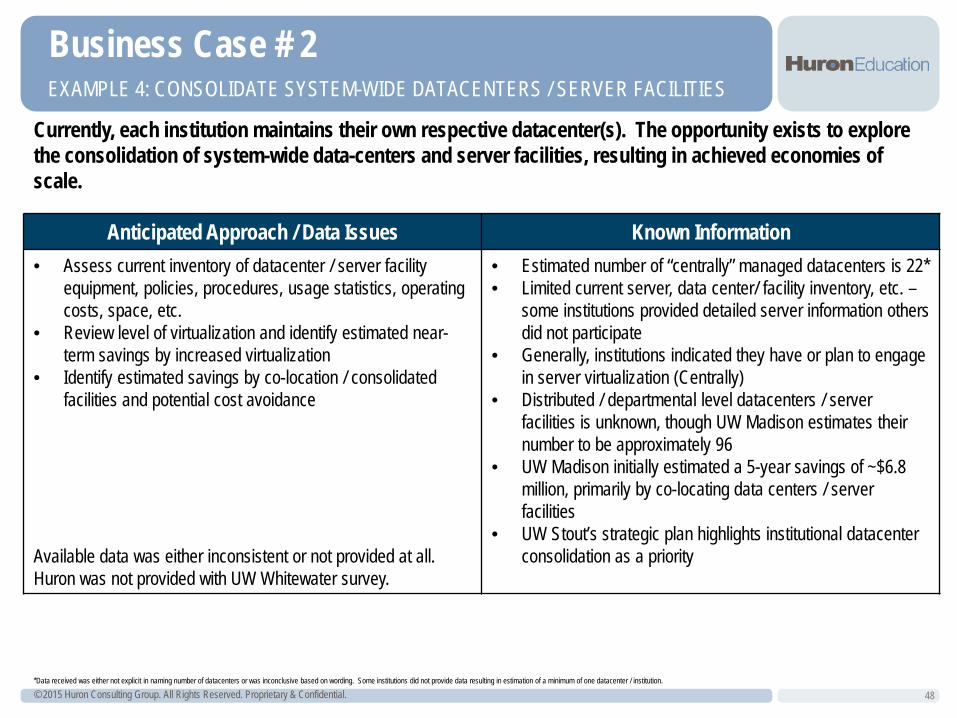
Currently, each institution maintains their own respective datacenter(s). The opportunity exists to explore the consolidation of system-wide data-centers and server facilities, resulting in achieved economies of scale.
Business Case # 2
*Data received was either not explicit in naming number of datacenters or was inconclusive based on wording. Some institutions did not provide data resulting in estimation of a minimum of one datacenter / institution.
Anticipated Approach / Data Issues Known Information • Assess current inventory of datacenter / server facility
equipment, policies, procedures, usage statistics, operating costs, space, etc.
• Review level of virtualization and identify estimated near-term savings by increased virtualization
• Identify estimated savings by co-location / consolidated facilities and potential cost avoidance
Available data was either inconsistent or not provided at all. Huron was not provided with UW Whitewater survey.
• Estimated number of “centrally” managed datacenters is 22* • Limited current server, data center/ facility inventory, etc. –
some institutions provided detailed server information others did not participate
• Generally, institutions indicated they have or plan to engage in server virtualization (Centrally)
• Distributed / departmental level datacenters / server facilities is unknown, though UW Madison estimates their number to be approximately 96
• UW Madison initially estimated a 5-year savings of ~$6.8 million, primarily by co-locating data centers / server facilities
• UW Stout’s strategic plan highlights institutional datacenter consolidation as a priority
© 2015 Huron Consulting Group. All Rights Reserved. Proprietary & Confidential. 49
EXAMPLE 4: CONSOLIDATE SYSTEM-WIDE DATACENTERS (CONT’D)
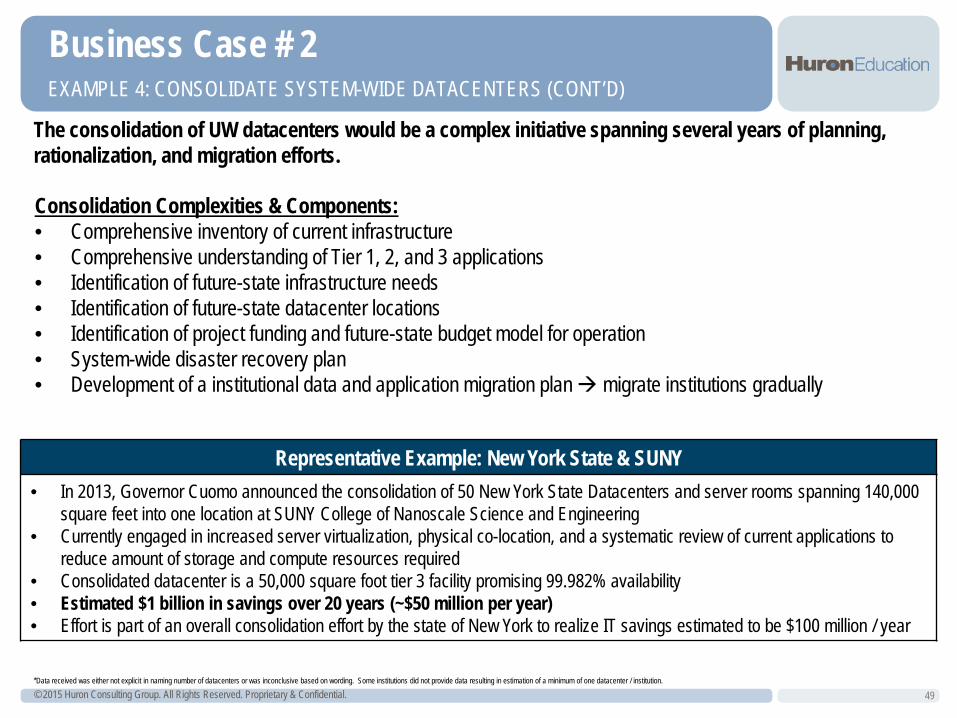
The consolidation of UW datacenters would be a complex initiative spanning several years of planning, rationalization, and migration efforts.
Business Case # 2
*Data received was either not explicit in naming number of datacenters or was inconclusive based on wording. Some institutions did not provide data resulting in estimation of a minimum of one datacenter / institution.
Representative Example: New York State & SUNY • In 2013, Governor Cuomo announced the consolidation of 50 New York State Datacenters and server rooms spanning 140,000
square feet into one location at SUNY College of Nanoscale Science and Engineering • Currently engaged in increased server virtualization, physical co-location, and a systematic review of current applications to
reduce amount of storage and compute resources required • Consolidated datacenter is a 50,000 square foot tier 3 facility promising 99.982% availability • Estimated $1 billion in savings over 20 years (~$50 million per year) • Effort is part of an overall consolidation effort by the state of New York to realize IT savings estimated to be $100 million / year
Consolidation Complexities & Components: • Comprehensive inventory of current infrastructure • Comprehensive understanding of Tier 1, 2, and 3 applications • Identification of future-state infrastructure needs • Identification of future-state datacenter locations • Identification of project funding and future-state budget model for operation • System-wide disaster recovery plan • Development of a institutional data and application migration plan migrate institutions gradually
© 2015 Huron Consulting Group. All Rights Reserved. Proprietary & Confidential. 50
EXAMPLE 4: CONSOLIDATING SYSTEM-WIDE DATACENTERS (CONT’D)
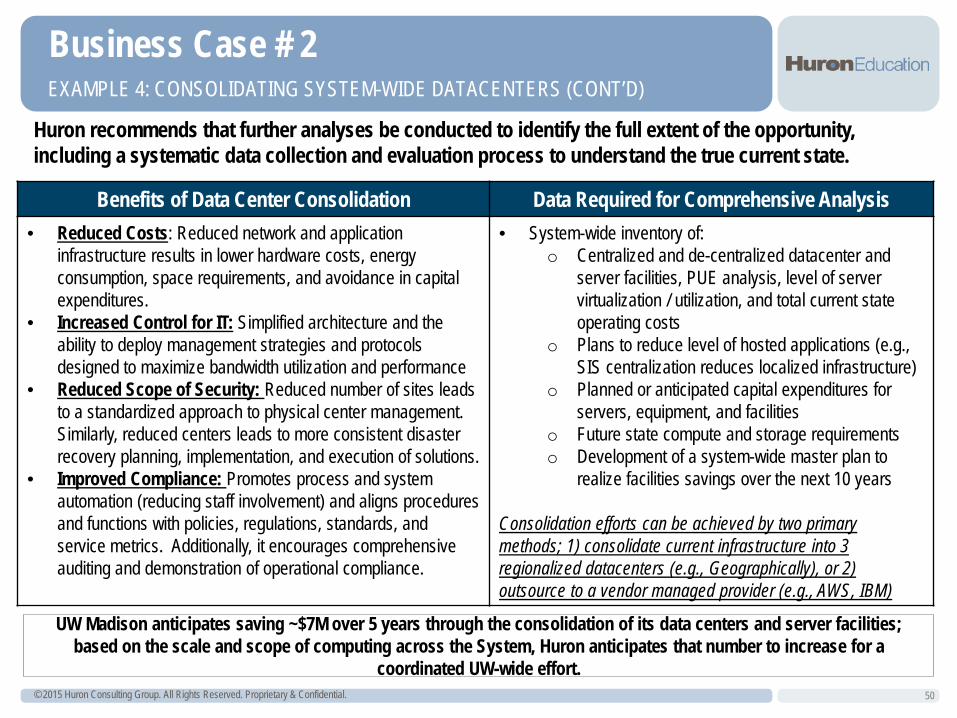
Huron recommends that further analyses be conducted to identify the full extent of the opportunity, including a systematic data collection and evaluation process to understand the true current state.
Business Case # 2
UW Madison anticipates saving ~$7M over 5 years through the consolidation of its data centers and server facilities; based on the scale and scope of computing across the System, Huron anticipates that number to increase for a
coordinated UW-wide effort.
Benefits of Data Center Consolidation Data Required for Comprehensive Analysis • Reduced Costs: Reduced network and application
infrastructure results in lower hardware costs, energy consumption, space requirements, and avoidance in capital expenditures.
• Increased Control for IT: Simplified architecture and the ability to deploy management strategies and protocols designed to maximize bandwidth utilization and performance
• Reduced Scope of Security: Reduced number of sites leads to a standardized approach to physical center management. Similarly, reduced centers leads to more consistent disaster recovery planning, implementation, and execution of solutions.
• Improved Compliance: Promotes process and system automation (reducing staff involvement) and aligns procedures and functions with policies, regulations, standards, and service metrics. Additionally, it encourages comprehensive auditing and demonstration of operational compliance.
• System-wide inventory of: o Centralized and de-centralized datacenter and
server facilities, PUE analysis, level of server virtualization / utilization, and total current state operating costs
o Plans to reduce level of hosted applications (e.g., SIS centralization reduces localized infrastructure)
o Planned or anticipated capital expenditures for servers, equipment, and facilities
o Future state compute and storage requirements o Development of a system-wide master plan to
realize facilities savings over the next 10 years Consolidation efforts can be achieved by two primary methods; 1) consolidate current infrastructure into 3 regionalized datacenters (e.g., Geographically), or 2) outsource to a vendor managed provider (e.g., AWS, IBM)
© 2015 Huron Consulting Group. All Rights Reserved. Proprietary & Confidential. 51
HOLISTIC APPROACH: REORGANIZE INFORMATION TECHNOLOGY DELIVERY
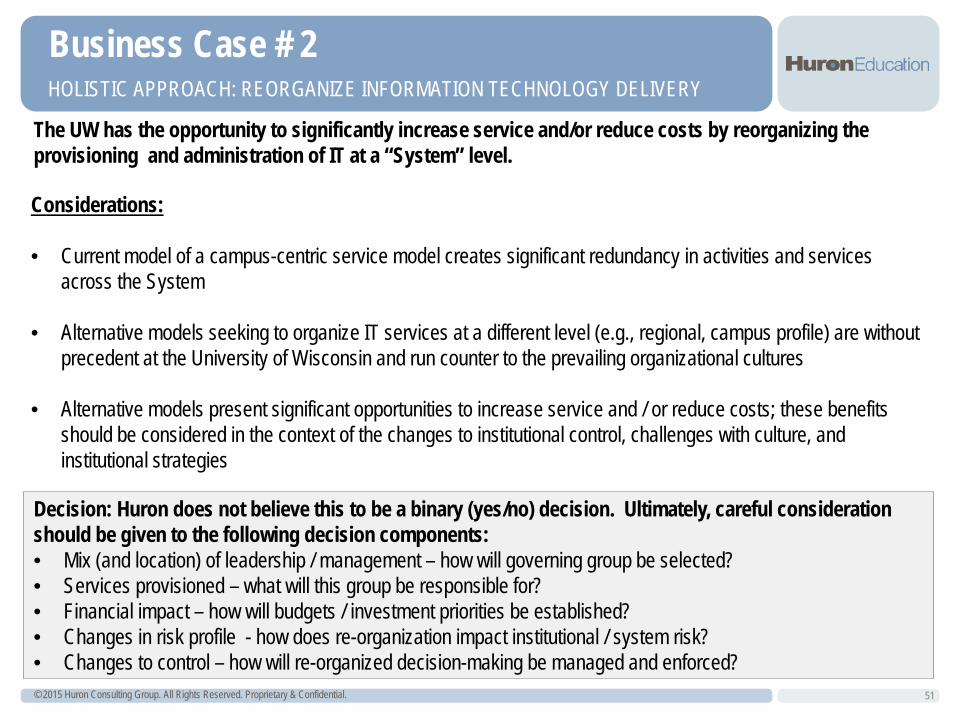
The UW has the opportunity to significantly increase service and/or reduce costs by reorganizing the provisioning and administration of IT at a “System” level.
Business Case # 2
Considerations:
• Current model of a campus-centric service model creates significant redundancy in activities and services across the System
• Alternative models seeking to organize IT services at a different level (e.g., regional, campus profile) are without precedent at the University of Wisconsin and run counter to the prevailing organizational cultures
• Alternative models present significant opportunities to increase service and / or reduce costs; these benefits should be considered in the context of the changes to institutional control, challenges with culture, and institutional strategies
Decision: Huron does not believe this to be a binary (yes/no) decision. Ultimately, careful consideration should be given to the following decision components: • Mix (and location) of leadership / management – how will governing group be selected? • Services provisioned – what will this group be responsible for? • Financial impact – how will budgets / investment priorities be established? • Changes in risk profile - how does re-organization impact institutional / system risk? • Changes to control – how will re-organized decision-making be managed and enforced?
© 2015 Huron Consulting Group. All Rights Reserved. Proprietary & Confidential. 52
REORGANIZE INFORMATION TECHNOLOGY DELIVERY
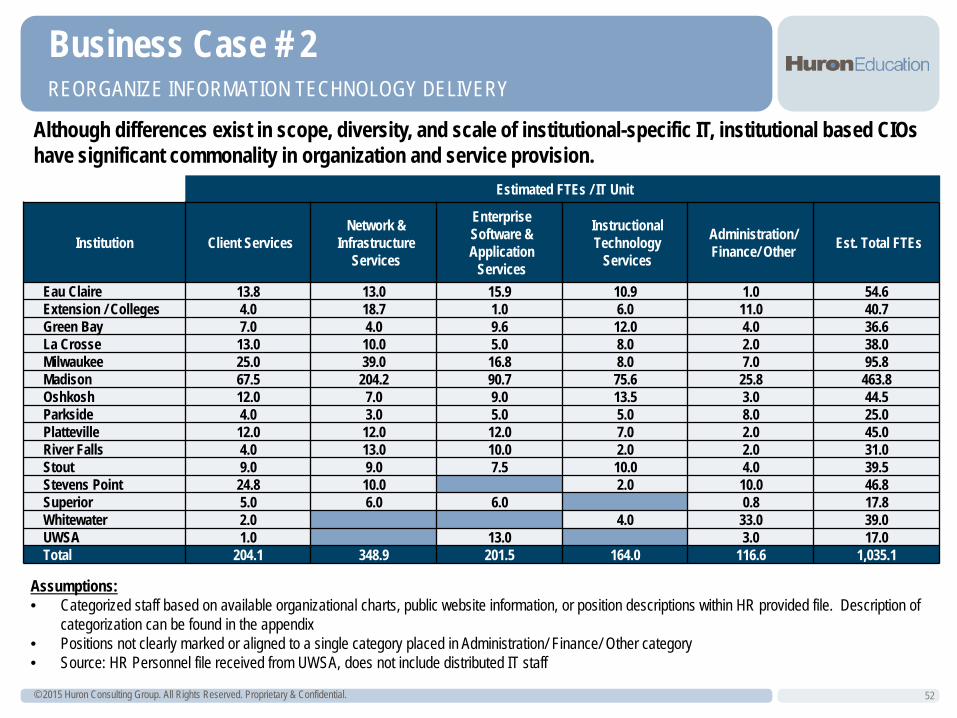
Although differences exist in scope, diversity, and scale of institutional-specific IT, institutional based CIOs have significant commonality in organization and service provision.
Business Case # 2
Estimated FTEs / IT Unit
Institution Client Services Network &
Infrastructure Services
Enterprise Software & Application
Services
Instructional Technology
Services
Administration/ Finance/ Other Est. Total FTEs
Eau Claire 13.8 13.0 15.9 10.9 1.0 54.6 Extension / Colleges 4.0 18.7 1.0 6.0 11.0 40.7 Green Bay 7.0 4.0 9.6 12.0 4.0 36.6 La Crosse 13.0 10.0 5.0 8.0 2.0 38.0 Milwaukee 25.0 39.0 16.8 8.0 7.0 95.8 Madison 67.5 204.2 90.7 75.6 25.8 463.8 Oshkosh 12.0 7.0 9.0 13.5 3.0 44.5 Parkside 4.0 3.0 5.0 5.0 8.0 25.0 Platteville 12.0 12.0 12.0 7.0 2.0 45.0 River Falls 4.0 13.0 10.0 2.0 2.0 31.0 Stout 9.0 9.0 7.5 10.0 4.0 39.5 Stevens Point 24.8 10.0 2.0 10.0 46.8 Superior 5.0 6.0 6.0 0.8 17.8 Whitewater 2.0 4.0 33.0 39.0 UWSA 1.0 13.0 3.0 17.0 Total 204.1 348.9 201.5 164.0 116.6 1,035.1
Assumptions: • Categorized staff based on available organizational charts, public website information, or position descriptions within HR provided file. Description of
categorization can be found in the appendix • Positions not clearly marked or aligned to a single category placed in Administration/ Finance/ Other category • Source: HR Personnel file received from UWSA, does not include distributed IT staff
© 2015 Huron Consulting Group. All Rights Reserved. Proprietary & Confidential. 53
REORGANIZE INFORMATION TECHNOLOGY DELIVERY
In order to successfully transition to a System-wide model for the provision and leadership of IT services, the UWS would have to develop enhanced capabilities to support a new model.
Business Case # 2
Required Core Capabilities: 1. A mechanism through which the System could make decisions regarding IT priorities, budgets, service models,
and service levels – currently, decision-making is institutionally focused • Campus leadership collectively should consider what technology is truly unique to campus strategic
priorities and rationalize IT Services accordingly
2. Improved data environment, enhanced reporting, and performance measurement – currently, data are not readily available or fully understood resulting in the inability to inform decision-making
3. Articulation of the value added to faculty, institutional leadership, and the System of new IT-related roles both on-campus and at the system level
© 2015 Huron Consulting Group. All Rights Reserved. Proprietary & Confidential. 54
DECISION MAKING
The University of Wisconsin has few System-wide mechanisms through which opportunities can be evaluated and decisions made as a “system.”
Business Case # 2
Common Systems Review Group (CSRG), comprised of IT, academic, and administrative leadership, is one of the few examples of System-wide IT decision making (though the reality is that only approximately 4% of the CSRG budget is uncommitted per year and there are far more projects requesting funding than there is funding available). To be successful, any new model will need to expand the remit of a group like CSRG. Required Capabilities & Authority: • Develop shared solutions • Evaluate opportunities to transition campus based activities to “scale” • Decide on service levels and functionality of shared systems • Ensure IT services are aligned with budgets and campus requirements. Changes to IT funding may include: • Pay overhead costs for central IT out of a central fund and charge institutions on a direct or marginal basis • Provide select IT services without a charge to institutions
The University of Wisconsin should empower the CSRG (or a variant) to expand it’s remit to include the development of a capacity to make broader cross-campus IT decisions and to provide oversight of any System-wide services.
© 2015 Huron Consulting Group. All Rights Reserved. Proprietary & Confidential. 55
SYSTEM-WIDE CAPABILITIES
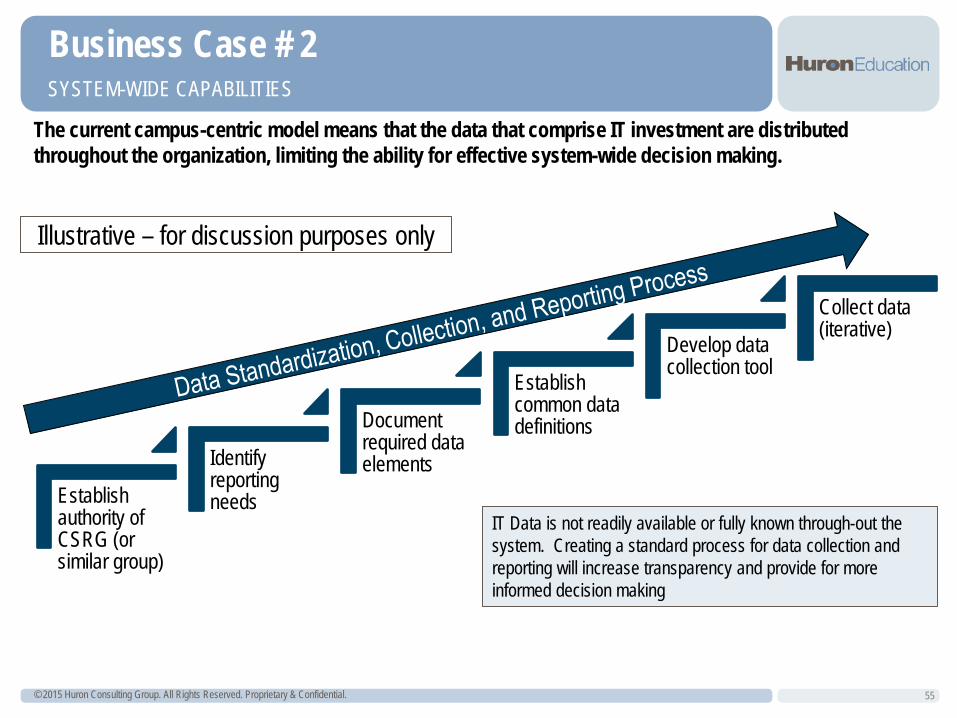
The current campus-centric model means that the data that comprise IT investment are distributed throughout the organization, limiting the ability for effective system-wide decision making.
Business Case # 2
Establish authority of CSRG (or similar group)
Identify reporting needs
Document required data elements
Establish common data definitions
Develop data collection tool
Collect data (iterative)
Illustrative – for discussion purposes only
IT Data is not readily available or fully known through-out the system. Creating a standard process for data collection and reporting will increase transparency and provide for more informed decision making
© 2015 Huron Consulting Group. All Rights Reserved. Proprietary & Confidential. 56
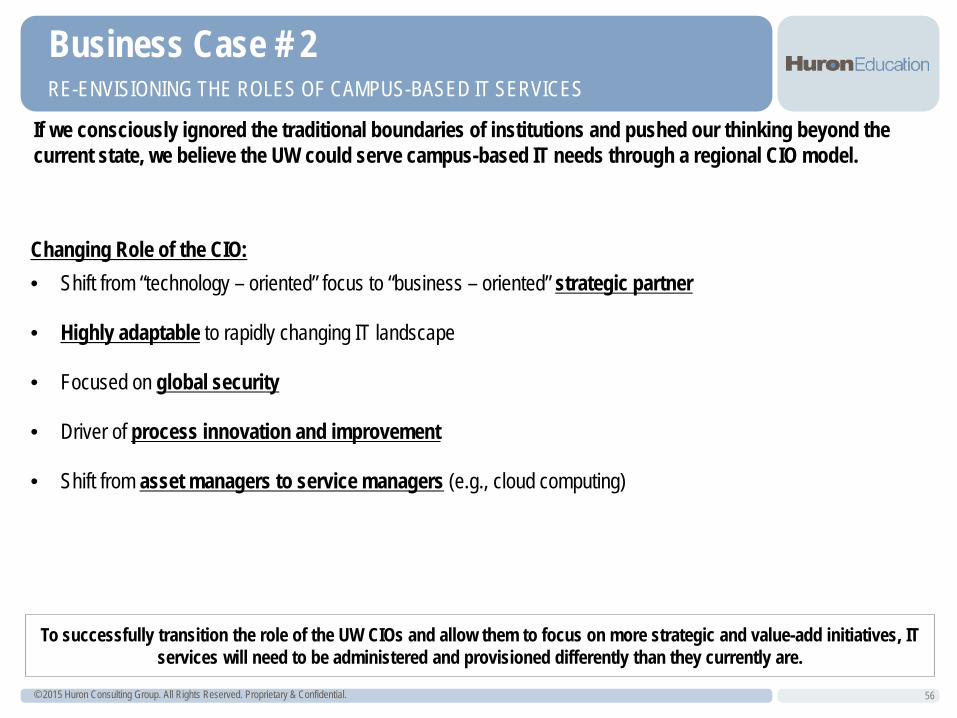
RE-ENVISIONING THE ROLES OF CAMPUS-BASED IT SERVICES
If we consciously ignored the traditional boundaries of institutions and pushed our thinking beyond the current state, we believe the UW could serve campus-based IT needs through a regional CIO model.
Business Case # 2
Changing Role of the CIO: • Shift from “technology – oriented” focus to “business – oriented” strategic partner
• Highly adaptable to rapidly changing IT landscape
• Focused on global security
• Driver of process innovation and improvement
• Shift from asset managers to service managers (e.g., cloud computing)
To successfully transition the role of the UW CIOs and allow them to focus on more strategic and value-add initiatives, IT services will need to be administered and provisioned differently than they currently are.
© 2015 Huron Consulting Group. All Rights Reserved. Proprietary & Confidential. 57
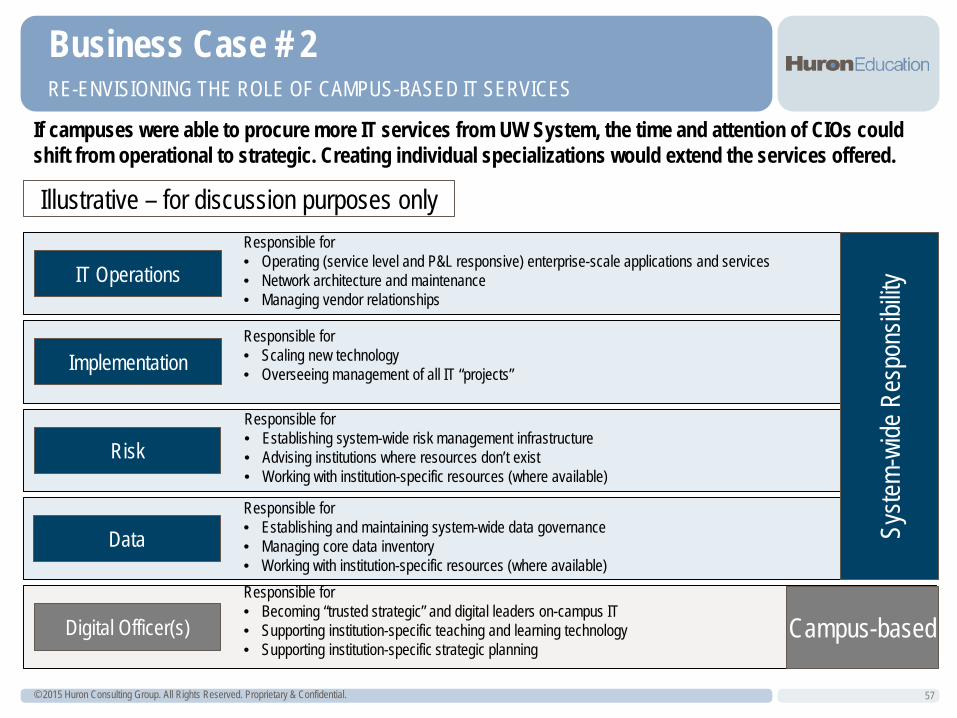
RE-ENVISIONING THE ROLE OF CAMPUS-BASED IT SERVICES
If campuses were able to procure more IT services from UW System, the time and attention of CIOs could shift from operational to strategic. Creating individual specializations would extend the services offered.
Business Case # 2
Illustrative – for discussion purposes only
IT Operations Responsible for • Operating (service level and P&L responsive) enterprise-scale applications and services • Network architecture and maintenance • Managing vendor relationships
Implementation Responsible for • Scaling new technology • Overseeing management of all IT “projects”
Risk Responsible for • Establishing system-wide risk management infrastructure • Advising institutions where resources don’t exist • Working with institution-specific resources (where available)
Digital Officer(s)
Responsible for • Becoming “trusted strategic” and digital leaders on-campus IT • Supporting institution-specific teaching and learning technology • Supporting institution-specific strategic planning
Data Responsible for • Establishing and maintaining system-wide data governance • Managing core data inventory • Working with institution-specific resources (where available)
Syste
m-wi
de R
espo
nsibi
lity
Campus-based
© 2015 Huron Consulting Group. All Rights Reserved. Proprietary & Confidential. 58
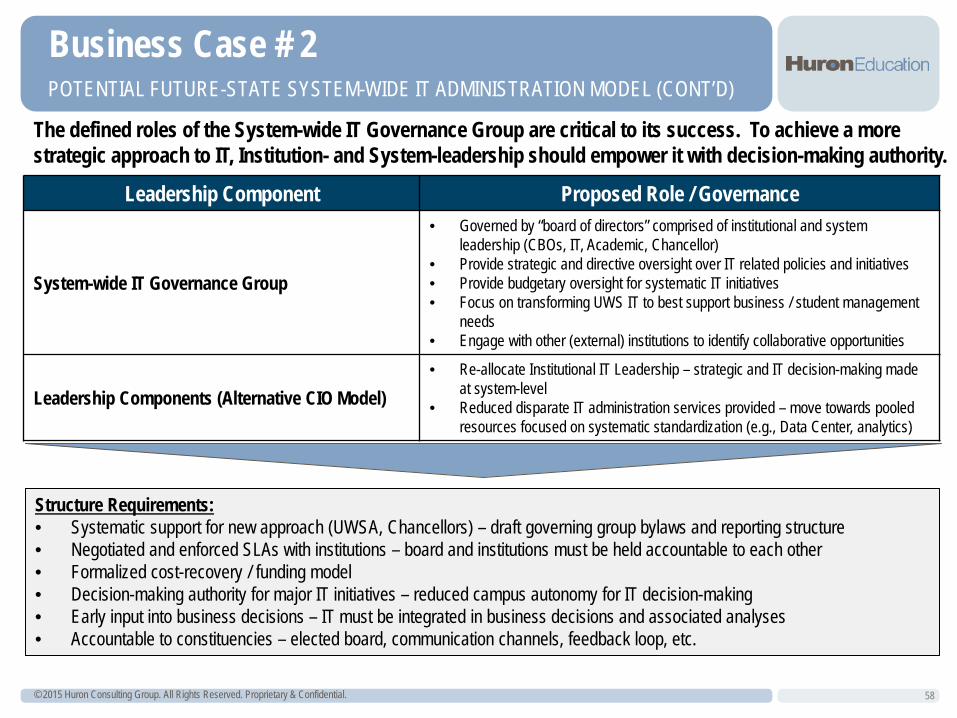
POTENTIAL FUTURE-STATE SYSTEM-WIDE IT ADMINISTRATION MODEL (CONT’D)
Business Case # 2
Leadership Component Proposed Role / Governance
System-wide IT Governance Group
• Governed by “board of directors” comprised of institutional and system leadership (CBOs, IT, Academic, Chancellor)
• Provide strategic and directive oversight over IT related policies and initiatives • Provide budgetary oversight for systematic IT initiatives • Focus on transforming UWS IT to best support business / student management
needs • Engage with other (external) institutions to identify collaborative opportunities
Leadership Components (Alternative CIO Model) • Re-allocate Institutional IT Leadership – strategic and IT decision-making made
at system-level • Reduced disparate IT administration services provided – move towards pooled
resources focused on systematic standardization (e.g., Data Center, analytics)
Structure Requirements: • Systematic support for new approach (UWSA, Chancellors) – draft governing group bylaws and reporting structure • Negotiated and enforced SLAs with institutions – board and institutions must be held accountable to each other • Formalized cost-recovery / funding model • Decision-making authority for major IT initiatives – reduced campus autonomy for IT decision-making • Early input into business decisions – IT must be integrated in business decisions and associated analyses • Accountable to constituencies – elected board, communication channels, feedback loop, etc.
The defined roles of the System-wide IT Governance Group are critical to its success. To achieve a more strategic approach to IT, Institution- and System-leadership should empower it with decision-making authority.
© 2015 Huron Consulting Group. All Rights Reserved. Proprietary & Confidential. 59
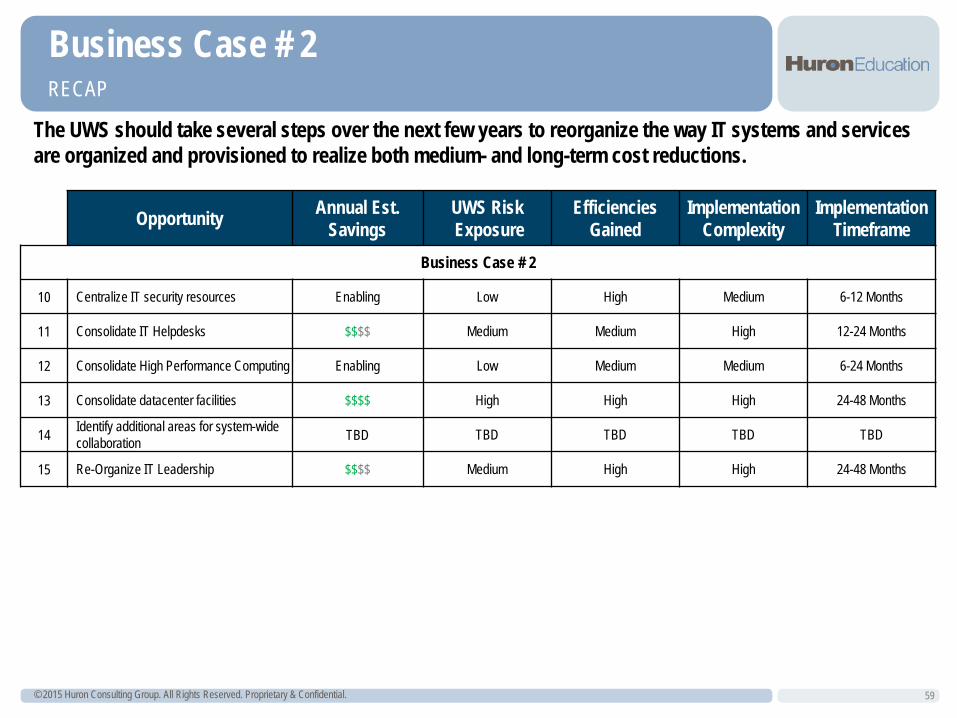
RECAP
The UWS should take several steps over the next few years to reorganize the way IT systems and services are organized and provisioned to realize both medium- and long-term cost reductions.
Business Case # 2
Opportunity Annual Est. Savings
UWS Risk Exposure
Efficiencies Gained
Implementation Complexity
Implementation Timeframe
Business Case # 2
10 Centralize IT security resources Enabling Low High Medium 6-12 Months
11 Consolidate IT Helpdesks $$$$ Medium Medium High 12-24 Months
12 Consolidate High Performance Computing Enabling Low Medium Medium 6-24 Months
13 Consolidate datacenter facilities $$$$ High High High 24-48 Months
14 Identify additional areas for system-wide collaboration TBD TBD TBD TBD TBD
15 Re-Organize IT Leadership $$$$ Medium High High 24-48 Months
Business Case #3: Engage in Enhanced Strategic Sourcing for
IT Hardware
© 2015 Huron Consulting Group. All Rights Reserved. Proprietary & Confidential.
Business Case # 3 CONTEXT AND BACKGROUND
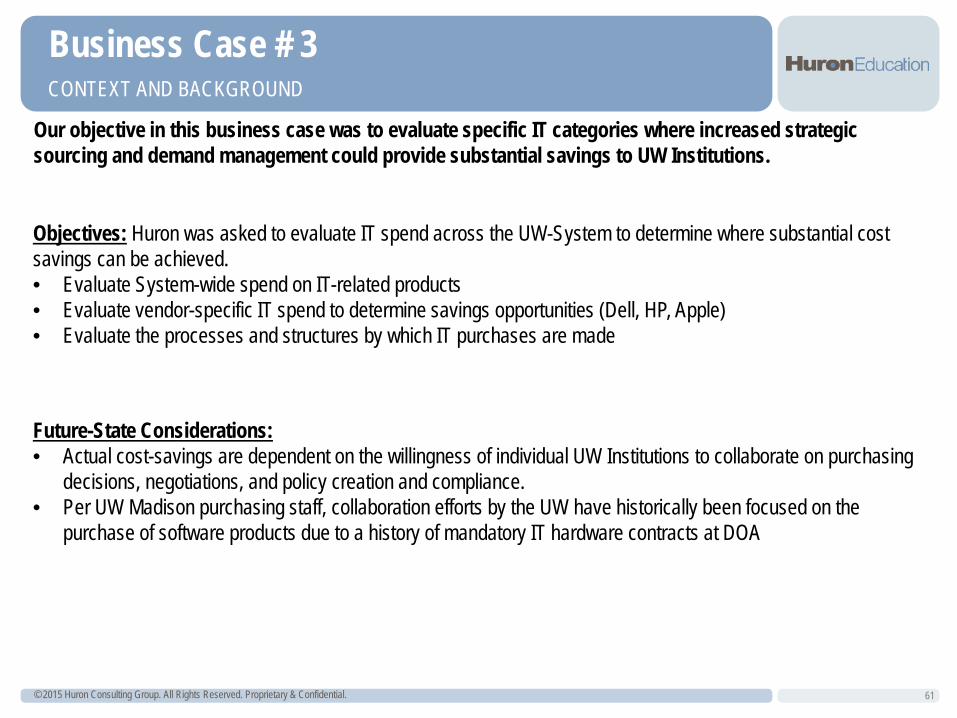
Our objective in this business case was to evaluate specific IT categories where increased strategic sourcing and demand management could provide substantial savings to UW Institutions.
61
Objectives: Huron was asked to evaluate IT spend across the UW-System to determine where substantial cost savings can be achieved. • Evaluate System-wide spend on IT-related products • Evaluate vendor-specific IT spend to determine savings opportunities (Dell, HP, Apple) • Evaluate the processes and structures by which IT purchases are made
Future-State Considerations: • Actual cost-savings are dependent on the willingness of individual UW Institutions to collaborate on purchasing
decisions, negotiations, and policy creation and compliance. • Per UW Madison purchasing staff, collaboration efforts by the UW have historically been focused on the
purchase of software products due to a history of mandatory IT hardware contracts at DOA
© 2015 Huron Consulting Group. All Rights Reserved. Proprietary & Confidential. 62
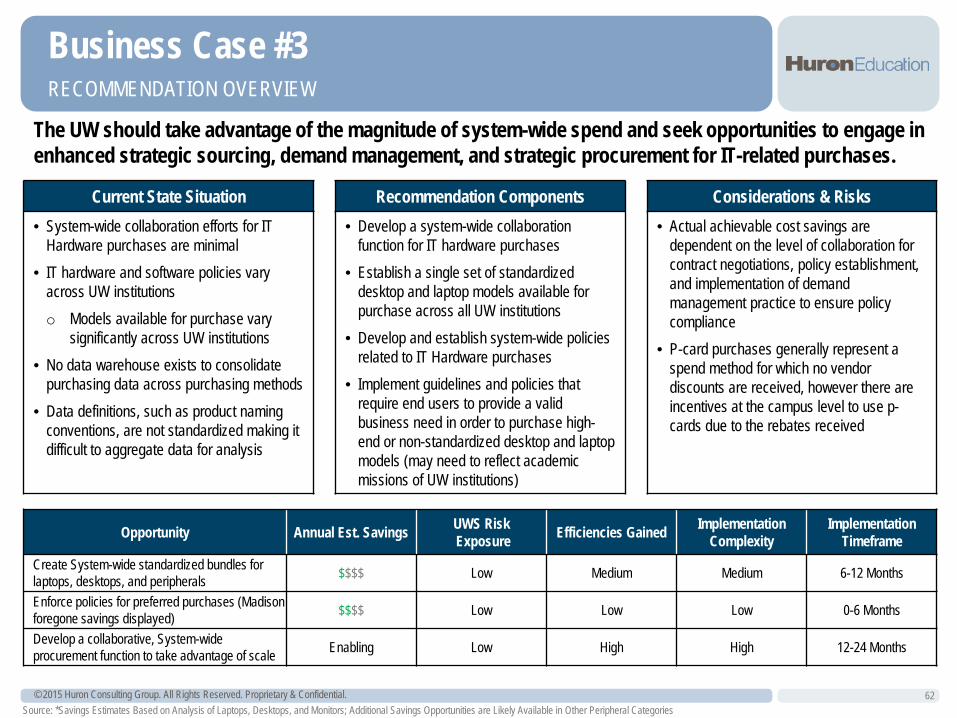
RECOMMENDATION OVERVIEW
Opportunity Annual Est. Savings UWS Risk Exposure Efficiencies Gained Implementation
Complexity Implementation
Timeframe Create System-wide standardized bundles for laptops, desktops, and peripherals $$$$ Low Medium Medium 6-12 Months
Enforce policies for preferred purchases (Madison foregone savings displayed) $$$$ Low Low Low 0-6 Months
Develop a collaborative, System-wide procurement function to take advantage of scale Enabling Low High High 12-24 Months
Business Case #3
Current State Situation Recommendation Components Considerations & Risks • System-wide collaboration efforts for IT
Hardware purchases are minimal • IT hardware and software policies vary
across UW institutions o Models available for purchase vary
significantly across UW institutions • No data warehouse exists to consolidate
purchasing data across purchasing methods • Data definitions, such as product naming
conventions, are not standardized making it difficult to aggregate data for analysis
• Develop a system-wide collaboration function for IT hardware purchases
• Establish a single set of standardized desktop and laptop models available for purchase across all UW institutions
• Develop and establish system-wide policies related to IT Hardware purchases
• Implement guidelines and policies that require end users to provide a valid business need in order to purchase high-end or non-standardized desktop and laptop models (may need to reflect academic missions of UW institutions)
• Actual achievable cost savings are dependent on the level of collaboration for contract negotiations, policy establishment, and implementation of demand management practice to ensure policy compliance
• P-card purchases generally represent a spend method for which no vendor discounts are received, however there are incentives at the campus level to use p-cards due to the rebates received
Source: *Savings Estimates Based on Analysis of Laptops, Desktops, and Monitors; Additional Savings Opportunities are Likely Available in Other Peripheral Categories
The UW should take advantage of the magnitude of system-wide spend and seek opportunities to engage in enhanced strategic sourcing, demand management, and strategic procurement for IT-related purchases.
© 2015 Huron Consulting Group. All Rights Reserved. Proprietary & Confidential.
Business Case #3 EXECUTIVE SUMMARY
63
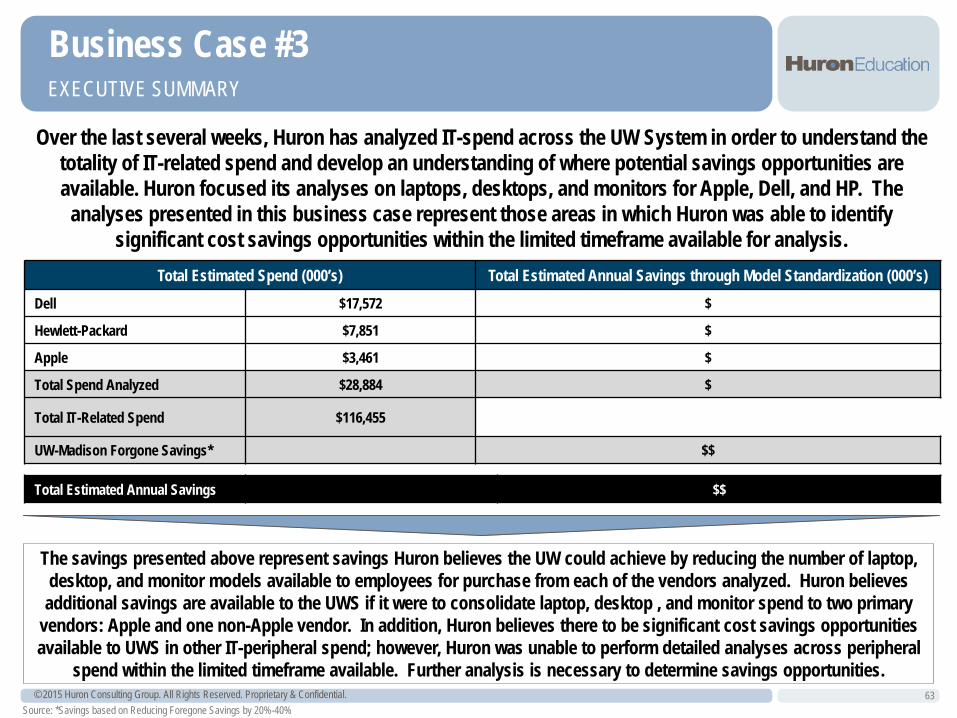
Over the last several weeks, Huron has analyzed IT-spend across the UW System in order to understand the totality of IT-related spend and develop an understanding of where potential savings opportunities are available. Huron focused its analyses on laptops, desktops, and monitors for Apple, Dell, and HP. The
analyses presented in this business case represent those areas in which Huron was able to identify significant cost savings opportunities within the limited timeframe available for analysis.
Total Estimated Spend (000’s) Total Estimated Annual Savings through Model Standardization (000’s) Dell $17,572 $
Hewlett-Packard $7,851 $
Apple $3,461 $
Total Spend Analyzed $28,884 $
Total IT-Related Spend $116,455
UW-Madison Forgone Savings* $$
Total Estimated Annual Savings $$
The savings presented above represent savings Huron believes the UW could achieve by reducing the number of laptop, desktop, and monitor models available to employees for purchase from each of the vendors analyzed. Huron believes additional savings are available to the UWS if it were to consolidate laptop, desktop , and monitor spend to two primary
vendors: Apple and one non-Apple vendor. In addition, Huron believes there to be significant cost savings opportunities available to UWS in other IT-peripheral spend; however, Huron was unable to perform detailed analyses across peripheral
spend within the limited timeframe available. Further analysis is necessary to determine savings opportunities.
Source: *Savings based on Reducing Foregone Savings by 20%-40%
© 2015 Huron Consulting Group. All Rights Reserved. Proprietary & Confidential.
Business Case #3 OVERALL DESKTOP/LAPTOP SPEND AND ANALYSIS SUMMARY
64
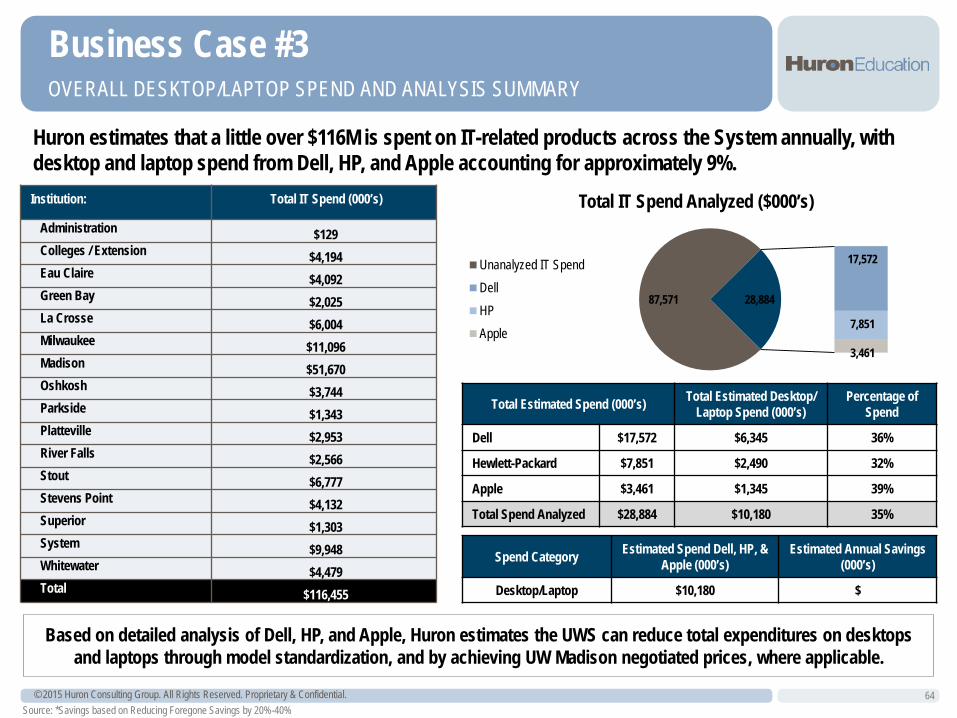
Huron estimates that a little over $116M is spent on IT-related products across the System annually, with desktop and laptop spend from Dell, HP, and Apple accounting for approximately 9%.
Total Estimated Spend (000’s) Total Estimated Desktop/ Laptop Spend (000’s)
Percentage of Spend
Dell $17,572 $6,345 36%
Hewlett-Packard $7,851 $2,490 32%
Apple $3,461 $1,345 39%
Total Spend Analyzed $28,884 $10,180 35%
Source: *Savings based on Reducing Foregone Savings by 20%-40%
Institution: Total IT Spend (000’s)
Administration $129 Colleges / Extension $4,194 Eau Claire $4,092 Green Bay $2,025 La Crosse $6,004 Milwaukee $11,096 Madison $51,670 Oshkosh $3,744 Parkside $1,343 Platteville $2,953 River Falls $2,566 Stout $6,777 Stevens Point $4,132 Superior $1,303 System $9,948 Whitewater $4,479 Total $116,455
Based on detailed analysis of Dell, HP, and Apple, Huron estimates the UWS can reduce total expenditures on desktops and laptops through model standardization, and by achieving UW Madison negotiated prices, where applicable.
87,571
17,572
7,851
3,461
28,884
Total IT Spend Analyzed ($000’s)
Unanalyzed IT SpendDellHPApple
Spend Category Estimated Spend Dell, HP, & Apple (000’s)
Estimated Annual Savings (000’s)
Desktop/Laptop $10,180 $
© 2015 Huron Consulting Group. All Rights Reserved. Proprietary & Confidential.
Business Case #3 MODEL STANDARDIZATION AND BUNDLING
In order to achieve savings, UW Institutions will need to collaborate and cooperate to ensure standardized models meet the technological needs of the majority of constituents across all campuses.
65
The UWS must take in to account the following considerations when evaluating potential models for standardization: • Standardized models should vary in technological capabilities to ensure that administrative, academic,
and research computing needs are all met • IT organizations across UWS need to be active participants in engaging campus constituents to understand user
preferences to define standardized models, and to build campus support for the established vendor and vendor products
• UWS needs to ensure that the preferences of all levels of stakeholders are included in the determination of
standardized models to be offered
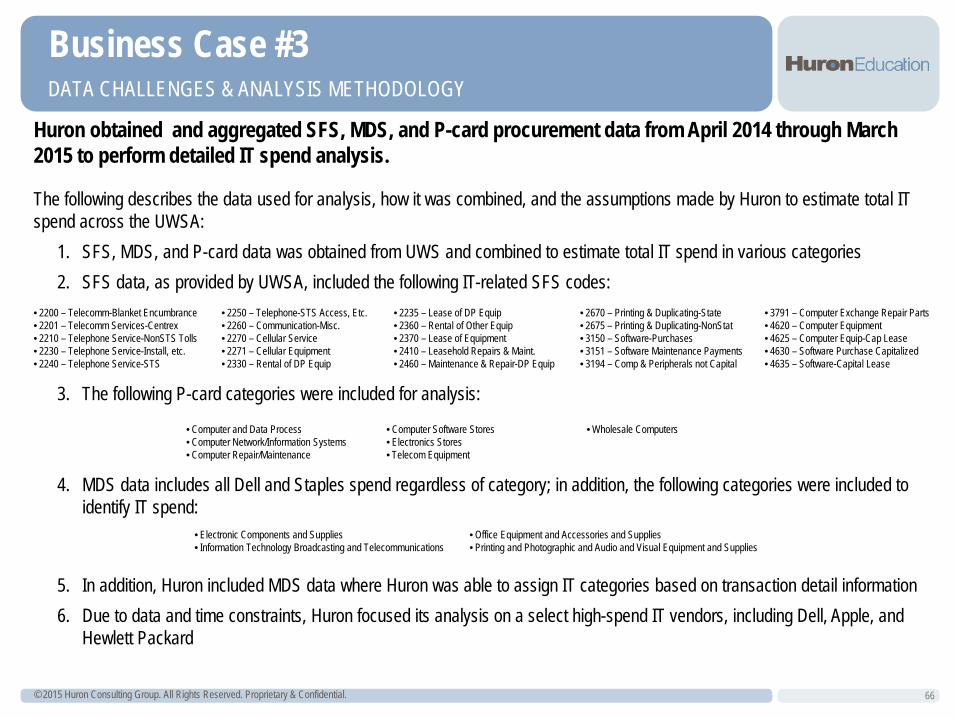
© 2015 Huron Consulting Group. All Rights Reserved. Proprietary & Confidential.
Business Case #3 DATA CHALLENGES & ANALYSIS METHODOLOGY
Huron obtained and aggregated SFS, MDS, and P-card procurement data from April 2014 through March 2015 to perform detailed IT spend analysis.
66
The following describes the data used for analysis, how it was combined, and the assumptions made by Huron to estimate total IT spend across the UWSA:
1. SFS, MDS, and P-card data was obtained from UWS and combined to estimate total IT spend in various categories 2. SFS data, as provided by UWSA, included the following IT-related SFS codes:
3. The following P-card categories were included for analysis: 4. MDS data includes all Dell and Staples spend regardless of category; in addition, the following categories were included to
identify IT spend:
5. In addition, Huron included MDS data where Huron was able to assign IT categories based on transaction detail information 6. Due to data and time constraints, Huron focused its analysis on a select high-spend IT vendors, including Dell, Apple, and
Hewlett Packard
• 2200 – Telecomm-Blanket Encumbrance • 2201 – Telecomm Services-Centrex • 2210 – Telephone Service-NonSTS Tolls • 2230 – Telephone Service-Install, etc. • 2240 – Telephone Service-STS
• 2250 – Telephone-STS Access, Etc. • 2260 – Communication-Misc. • 2270 – Cellular Service • 2271 – Cellular Equipment • 2330 – Rental of DP Equip
• 2235 – Lease of DP Equip • 2360 – Rental of Other Equip • 2370 – Lease of Equipment • 2410 – Leasehold Repairs & Maint. • 2460 – Maintenance & Repair-DP Equip
• 2670 – Printing & Duplicating-State • 2675 – Printing & Duplicating-NonStat • 3150 – Software-Purchases • 3151 – Software Maintenance Payments • 3194 – Comp & Peripherals not Capital
• 3791 – Computer Exchange Repair Parts • 4620 – Computer Equipment • 4625 – Computer Equip-Cap Lease • 4630 – Software Purchase Capitalized • 4635 – Software-Capital Lease
• Electronic Components and Supplies • Information Technology Broadcasting and Telecommunications
• Office Equipment and Accessories and Supplies • Printing and Photographic and Audio and Visual Equipment and Supplies
• Computer and Data Process • Computer Network/Information Systems • Computer Repair/Maintenance
• Computer Software Stores • Electronics Stores • Telecom Equipment
• Wholesale Computers
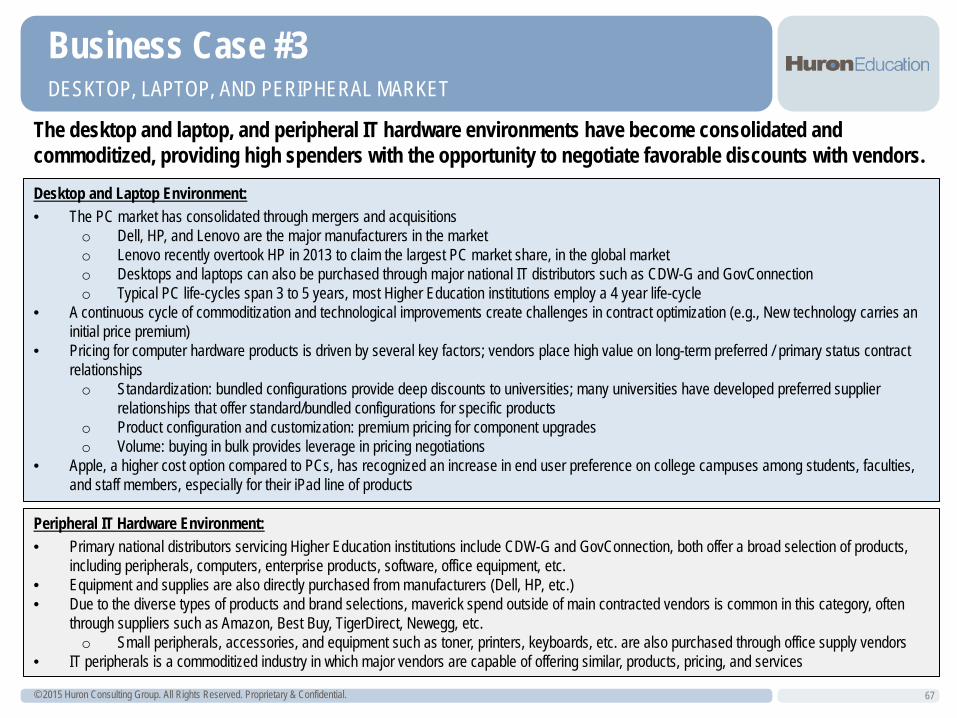
© 2015 Huron Consulting Group. All Rights Reserved. Proprietary & Confidential. 67
DESKTOP, LAPTOP, AND PERIPHERAL MARKET
Business Case #3
The desktop and laptop, and peripheral IT hardware environments have become consolidated and commoditized, providing high spenders with the opportunity to negotiate favorable discounts with vendors. Desktop and Laptop Environment: • The PC market has consolidated through mergers and acquisitions
o Dell, HP, and Lenovo are the major manufacturers in the market o Lenovo recently overtook HP in 2013 to claim the largest PC market share, in the global market o Desktops and laptops can also be purchased through major national IT distributors such as CDW-G and GovConnection o Typical PC life-cycles span 3 to 5 years, most Higher Education institutions employ a 4 year life-cycle
• A continuous cycle of commoditization and technological improvements create challenges in contract optimization (e.g., New technology carries an initial price premium)
• Pricing for computer hardware products is driven by several key factors; vendors place high value on long-term preferred / primary status contract relationships o Standardization: bundled configurations provide deep discounts to universities; many universities have developed preferred supplier
relationships that offer standard/bundled configurations for specific products o Product configuration and customization: premium pricing for component upgrades o Volume: buying in bulk provides leverage in pricing negotiations
• Apple, a higher cost option compared to PCs, has recognized an increase in end user preference on college campuses among students, faculties, and staff members, especially for their iPad line of products
Peripheral IT Hardware Environment: • Primary national distributors servicing Higher Education institutions include CDW-G and GovConnection, both offer a broad selection of products,
including peripherals, computers, enterprise products, software, office equipment, etc. • Equipment and supplies are also directly purchased from manufacturers (Dell, HP, etc.) • Due to the diverse types of products and brand selections, maverick spend outside of main contracted vendors is common in this category, often
through suppliers such as Amazon, Best Buy, TigerDirect, Newegg, etc. o Small peripherals, accessories, and equipment such as toner, printers, keyboards, etc. are also purchased through office supply vendors
• IT peripherals is a commoditized industry in which major vendors are capable of offering similar, products, pricing, and services
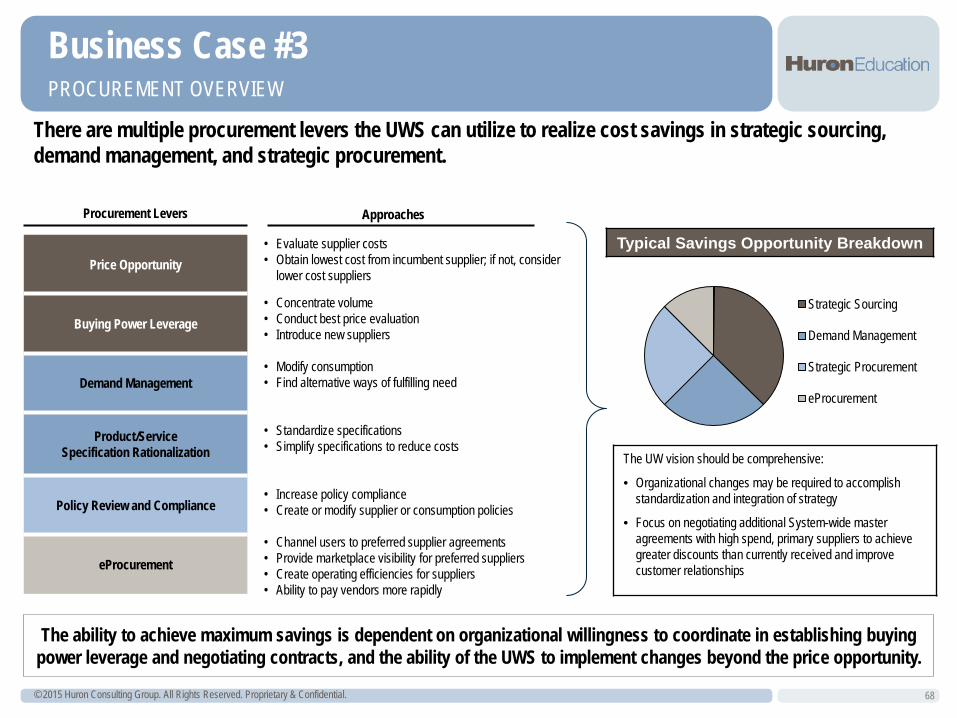
© 2015 Huron Consulting Group. All Rights Reserved. Proprietary & Confidential. 68
PROCUREMENT OVERVIEW
The ability to achieve maximum savings is dependent on organizational willingness to coordinate in establishing buying power leverage and negotiating contracts, and the ability of the UWS to implement changes beyond the price opportunity.
There are multiple procurement levers the UWS can utilize to realize cost savings in strategic sourcing, demand management, and strategic procurement.
Business Case #3
Approaches Procurement Levers
• Evaluate supplier costs • Obtain lowest cost from incumbent supplier; if not, consider
lower cost suppliers
• Concentrate volume • Conduct best price evaluation • Introduce new suppliers • Modify consumption • Find alternative ways of fulfilling need
• Standardize specifications • Simplify specifications to reduce costs • Increase policy compliance • Create or modify supplier or consumption policies
• Channel users to preferred supplier agreements • Provide marketplace visibility for preferred suppliers • Create operating efficiencies for suppliers • Ability to pay vendors more rapidly
Typical Savings Opportunity Breakdown
Strategic Sourcing
Demand Management
Strategic Procurement
eProcurement
Price Opportunity
Buying Power Leverage
Demand Management
Product/Service Specification Rationalization
Policy Review and Compliance
eProcurement
The UW vision should be comprehensive:
• Organizational changes may be required to accomplish standardization and integration of strategy
• Focus on negotiating additional System-wide master agreements with high spend, primary suppliers to achieve greater discounts than currently received and improve customer relationships
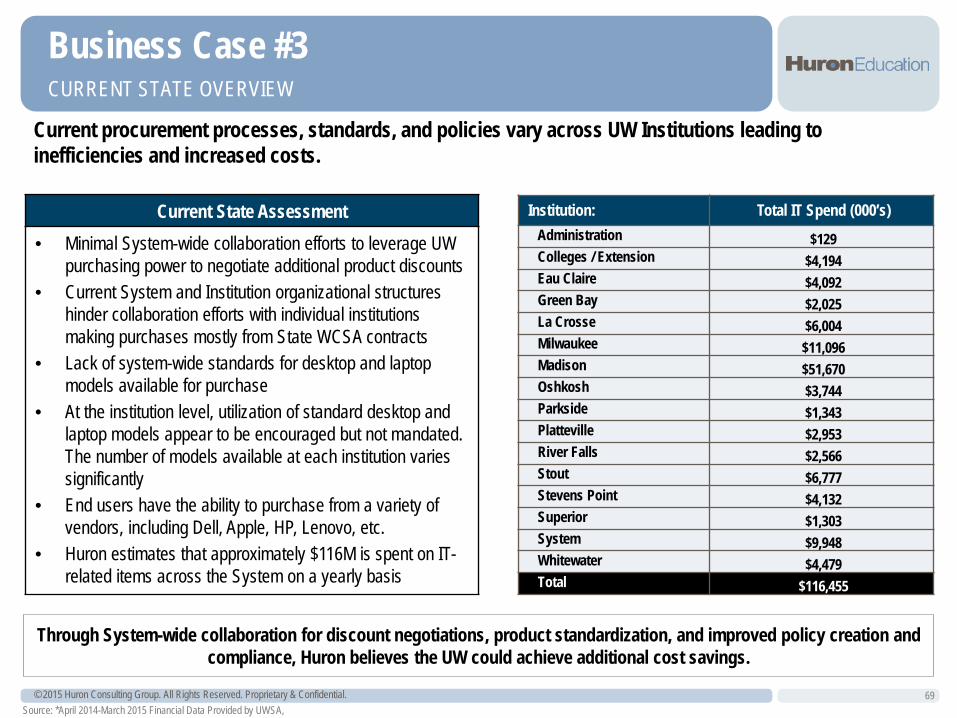
© 2015 Huron Consulting Group. All Rights Reserved. Proprietary & Confidential. 69
CURRENT STATE OVERVIEW
Business Case #3
Current procurement processes, standards, and policies vary across UW Institutions leading to inefficiencies and increased costs.
Current State Assessment • Minimal System-wide collaboration efforts to leverage UW
purchasing power to negotiate additional product discounts • Current System and Institution organizational structures
hinder collaboration efforts with individual institutions making purchases mostly from State WCSA contracts
• Lack of system-wide standards for desktop and laptop models available for purchase
• At the institution level, utilization of standard desktop and laptop models appear to be encouraged but not mandated. The number of models available at each institution varies significantly
• End users have the ability to purchase from a variety of vendors, including Dell, Apple, HP, Lenovo, etc.
• Huron estimates that approximately $116M is spent on IT-related items across the System on a yearly basis
Through System-wide collaboration for discount negotiations, product standardization, and improved policy creation and compliance, Huron believes the UW could achieve additional cost savings.
Institution: Total IT Spend (000’s) Administration $129 Colleges / Extension $4,194 Eau Claire $4,092 Green Bay $2,025 La Crosse $6,004 Milwaukee $11,096 Madison $51,670 Oshkosh $3,744 Parkside $1,343 Platteville $2,953 River Falls $2,566 Stout $6,777 Stevens Point $4,132 Superior $1,303 System $9,948 Whitewater $4,479 Total $116,455
Source: *April 2014-March 2015 Financial Data Provided by UWSA,
© 2015 Huron Consulting Group. All Rights Reserved. Proprietary & Confidential.
Business Case #3 SAVINGS CALCULATIONS DESCRIPTION
Savings calculations were estimated by Huron using the following data and assumptions:
70
Huron obtained Dell, HP, and Apple data from varying sources. The following data sources were used to calculate weighted-average prices and to estimate savings for the selected vendors: • Dell – Huron utilized UW institution spend data provided by the DOA • HP – Huron utilized spend data for UW institutions provided directly by Hewlett-Packard • Apple – Huron utilized UW institution spend data provided by UWSA Huron understands that UW Madison bundle prices vary from weighted-average prices calculated using DOA data. Weighted-average prices calculated would include only those purchases through the state contracts, which do not have the same level of discounts as those obtained by UW Madison.
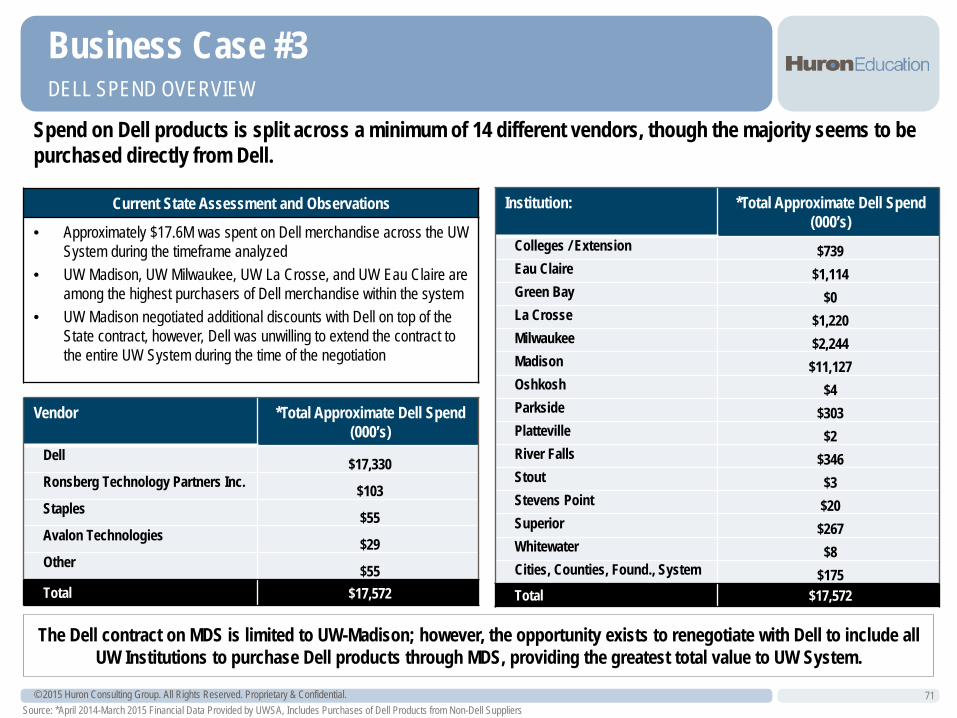
© 2015 Huron Consulting Group. All Rights Reserved. Proprietary & Confidential. 71
DELL SPEND OVERVIEW
Business Case #3
Spend on Dell products is split across a minimum of 14 different vendors, though the majority seems to be purchased directly from Dell.
Institution: *Total Approximate Dell Spend (000’s)
Colleges / Extension $739 Eau Claire $1,114 Green Bay $0 La Crosse $1,220 Milwaukee $2,244 Madison $11,127 Oshkosh $4 Parkside $303 Platteville $2 River Falls $346 Stout $3 Stevens Point $20 Superior $267 Whitewater $8 Cities, Counties, Found., System $175 Total $17,572
The Dell contract on MDS is limited to UW-Madison; however, the opportunity exists to renegotiate with Dell to include all UW Institutions to purchase Dell products through MDS, providing the greatest total value to UW System.
Source: *April 2014-March 2015 Financial Data Provided by UWSA, Includes Purchases of Dell Products from Non-Dell Suppliers
Current State Assessment and Observations
• Approximately $17.6M was spent on Dell merchandise across the UW System during the timeframe analyzed
• UW Madison, UW Milwaukee, UW La Crosse, and UW Eau Claire are among the highest purchasers of Dell merchandise within the system
• UW Madison negotiated additional discounts with Dell on top of the State contract, however, Dell was unwilling to extend the contract to the entire UW System during the time of the negotiation
Vendor *Total Approximate Dell Spend (000’s)
Dell $17,330 Ronsberg Technology Partners Inc. $103 Staples $55 Avalon Technologies $29 Other $55 Total $17,572
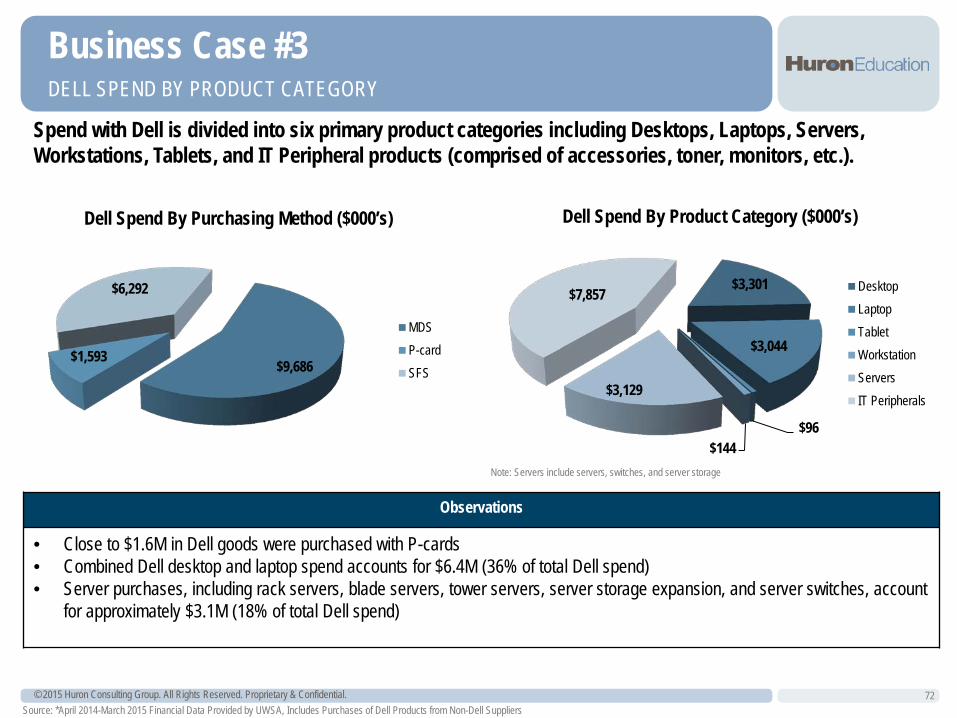
© 2015 Huron Consulting Group. All Rights Reserved. Proprietary & Confidential. 72
DELL SPEND BY PRODUCT CATEGORY
Business Case #3
Spend with Dell is divided into six primary product categories including Desktops, Laptops, Servers, Workstations, Tablets, and IT Peripheral products (comprised of accessories, toner, monitors, etc.).
Note: Servers include servers, switches, and server storage
$3,301
$3,044
$96 $144
$3,129
$7,857
Dell Spend By Product Category ($000’s)
DesktopLaptopTabletWorkstationServersIT Peripherals
Observations
• Close to $1.6M in Dell goods were purchased with P-cards • Combined Dell desktop and laptop spend accounts for $6.4M (36% of total Dell spend) • Server purchases, including rack servers, blade servers, tower servers, server storage expansion, and server switches, account
for approximately $3.1M (18% of total Dell spend)
$9,686 $1,593
$6,292
Dell Spend By Purchasing Method ($000’s)
MDSP-cardSFS
Source: *April 2014-March 2015 Financial Data Provided by UWSA, Includes Purchases of Dell Products from Non-Dell Suppliers
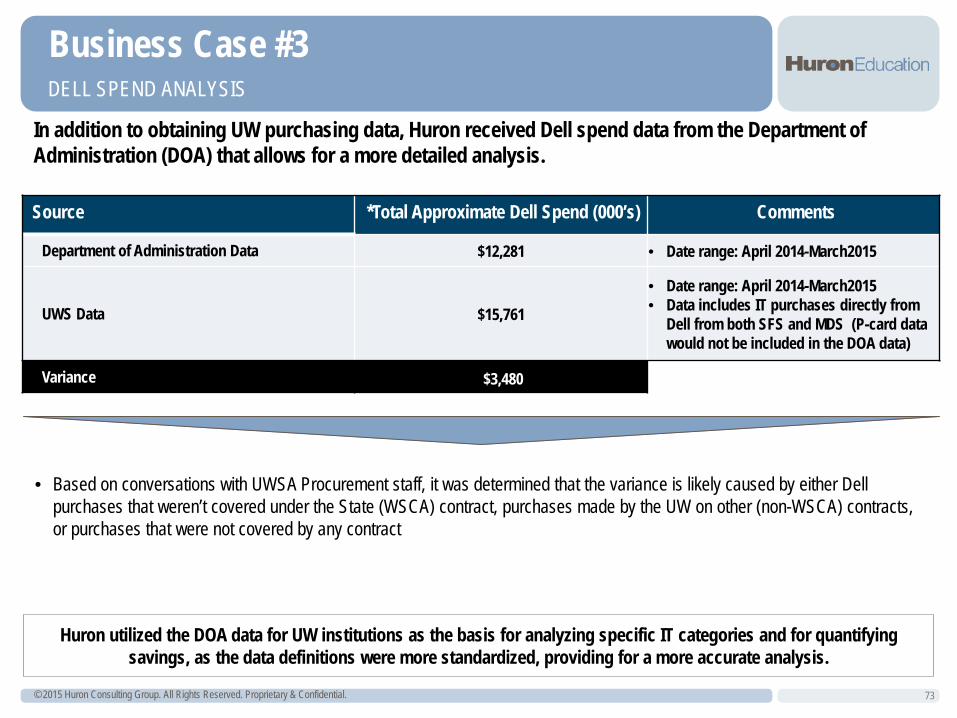
© 2015 Huron Consulting Group. All Rights Reserved. Proprietary & Confidential.
Business Case #3 DELL SPEND ANALYSIS
73
In addition to obtaining UW purchasing data, Huron received Dell spend data from the Department of Administration (DOA) that allows for a more detailed analysis.
• Based on conversations with UWSA Procurement staff, it was determined that the variance is likely caused by either Dell purchases that weren’t covered under the State (WSCA) contract, purchases made by the UW on other (non-WSCA) contracts, or purchases that were not covered by any contract
Source *Total Approximate Dell Spend (000’s) Comments
Department of Administration Data $12,281 • Date range: April 2014-March2015
UWS Data $15,761
• Date range: April 2014-March2015 • Data includes IT purchases directly from
Dell from both SFS and MDS (P-card data would not be included in the DOA data)
Variance $3,480
Huron utilized the DOA data for UW institutions as the basis for analyzing specific IT categories and for quantifying savings, as the data definitions were more standardized, providing for a more accurate analysis.
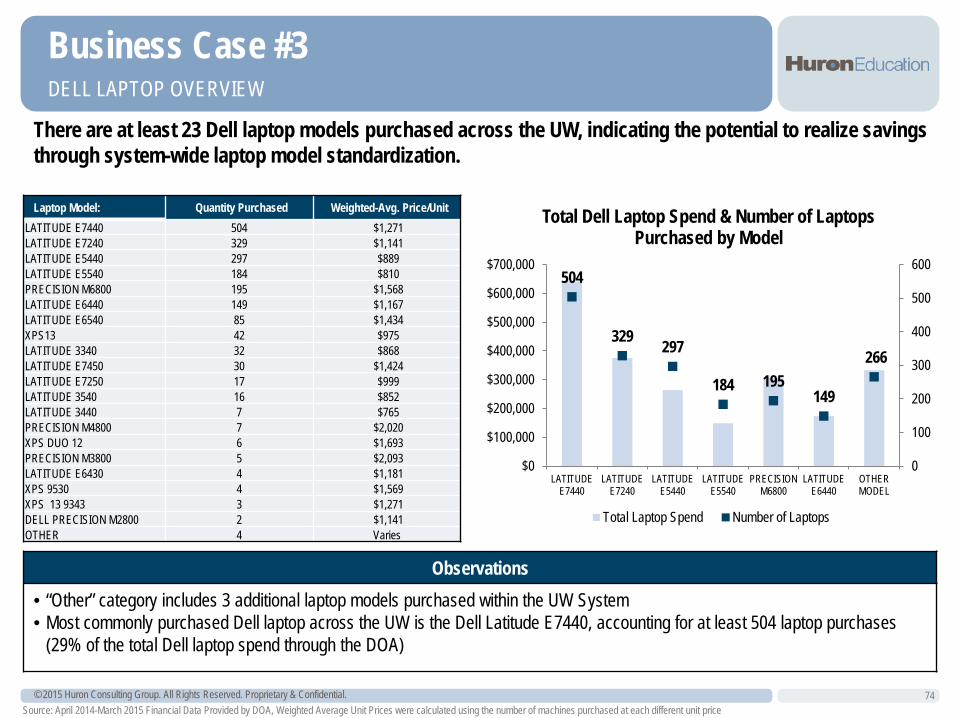
© 2015 Huron Consulting Group. All Rights Reserved. Proprietary & Confidential. 74
DELL LAPTOP OVERVIEW
Business Case #3
There are at least 23 Dell laptop models purchased across the UW, indicating the potential to realize savings through system-wide laptop model standardization.
504
329 297
184 195 149
266
0
100
200
300
400
500
600
$0
$100,000
$200,000
$300,000
$400,000
$500,000
$600,000
$700,000
LATITUDEE7440
LATITUDEE7240
LATITUDEE5440
LATITUDEE5540
PRECISIONM6800
LATITUDEE6440
OTHERMODEL
Total Dell Laptop Spend & Number of Laptops Purchased by Model
Total Laptop Spend Number of Laptops
Observations • “Other” category includes 3 additional laptop models purchased within the UW System • Most commonly purchased Dell laptop across the UW is the Dell Latitude E7440, accounting for at least 504 laptop purchases
(29% of the total Dell laptop spend through the DOA)
Source: April 2014-March 2015 Financial Data Provided by DOA, Weighted Average Unit Prices were calculated using the number of machines purchased at each different unit price
Laptop Model: Quantity Purchased Weighted-Avg. Price/Unit LATITUDE E7440 504 $1,271 LATITUDE E7240 329 $1,141 LATITUDE E5440 297 $889 LATITUDE E5540 184 $810 PRECISION M6800 195 $1,568 LATITUDE E6440 149 $1,167 LATITUDE E6540 85 $1,434 XPS13 42 $975 LATITUDE 3340 32 $868 LATITUDE E7450 30 $1,424 LATITUDE E7250 17 $999 LATITUDE 3540 16 $852 LATITUDE 3440 7 $765 PRECISION M4800 7 $2,020 XPS DUO 12 6 $1,693 PRECISION M3800 5 $2,093 LATITUDE E6430 4 $1,181 XPS 9530 4 $1,569 XPS 13 9343 3 $1,271 DELL PRECISION M2800 2 $1,141 OTHER 4 Varies
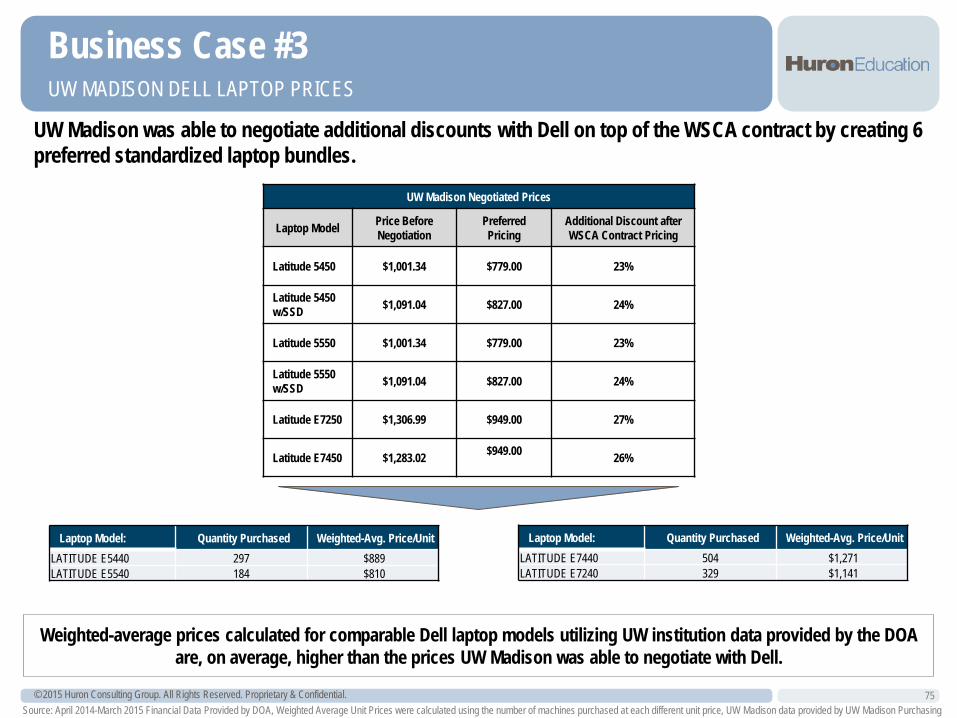
© 2015 Huron Consulting Group. All Rights Reserved. Proprietary & Confidential. 75
UW MADISON DELL LAPTOP PRICES
Business Case #3
UW Madison was able to negotiate additional discounts with Dell on top of the WSCA contract by creating 6 preferred standardized laptop bundles.
Source: April 2014-March 2015 Financial Data Provided by DOA, Weighted Average Unit Prices were calculated using the number of machines purchased at each different unit price, UW Madison data provided by UW Madison Purchasing
UW Madison Negotiated Prices
Laptop Model Price Before Negotiation
Preferred Pricing
Additional Discount after WSCA Contract Pricing
Latitude 5450 $1,001.34 $779.00 23%
Latitude 5450 w/SSD $1,091.04 $827.00 24%
Latitude 5550 $1,001.34 $779.00 23%
Latitude 5550 w/SSD $1,091.04 $827.00 24%
Latitude E7250 $1,306.99 $949.00 27%
Latitude E7450 $1,283.02 $949.00 26%
Weighted-average prices calculated for comparable Dell laptop models utilizing UW institution data provided by the DOA are, on average, higher than the prices UW Madison was able to negotiate with Dell.
Laptop Model: Quantity Purchased Weighted-Avg. Price/Unit LATITUDE E5440 297 $889 LATITUDE E5540 184 $810
Laptop Model: Quantity Purchased Weighted-Avg. Price/Unit LATITUDE E7440 504 $1,271 LATITUDE E7240 329 $1,141
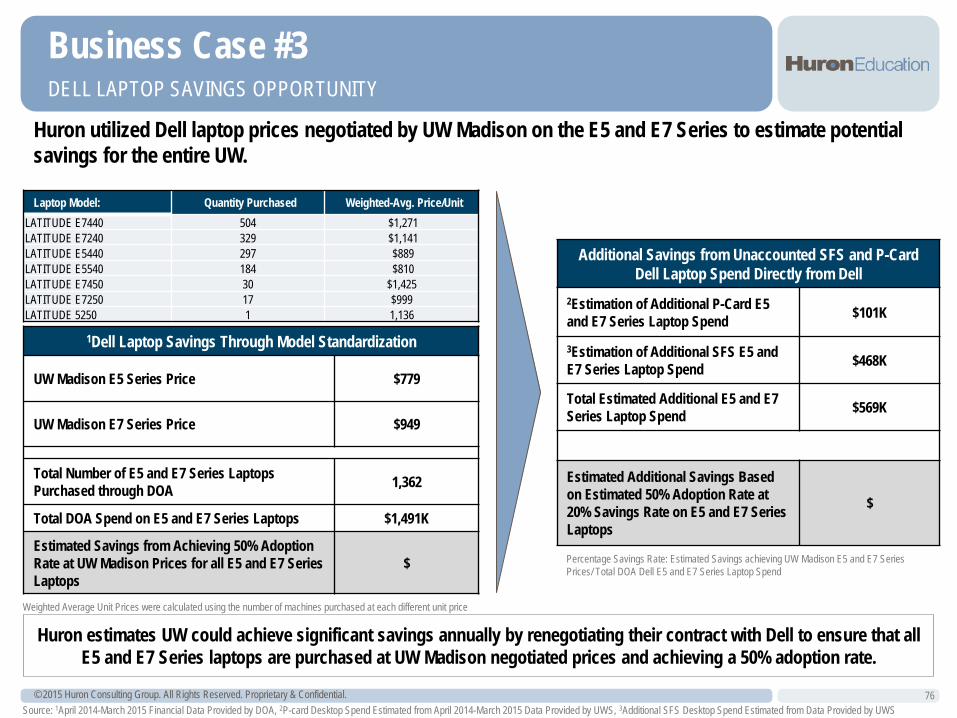
© 2015 Huron Consulting Group. All Rights Reserved. Proprietary & Confidential. 76
DELL LAPTOP SAVINGS OPPORTUNITY
Business Case #3
Huron utilized Dell laptop prices negotiated by UW Madison on the E5 and E7 Series to estimate potential savings for the entire UW.
Laptop Model: Quantity Purchased Weighted-Avg. Price/Unit LATITUDE E7440 504 $1,271 LATITUDE E7240 329 $1,141 LATITUDE E5440 297 $889 LATITUDE E5540 184 $810 LATITUDE E7450 30 $1,425 LATITUDE E7250 17 $999 LATITUDE 5250 1 1,136
1Dell Laptop Savings Through Model Standardization
UW Madison E5 Series Price $779
UW Madison E7 Series Price $949
Total Number of E5 and E7 Series Laptops Purchased through DOA 1,362
Total DOA Spend on E5 and E7 Series Laptops $1,491K
Estimated Savings from Achieving 50% Adoption Rate at UW Madison Prices for all E5 and E7 Series Laptops
$
Huron estimates UW could achieve significant savings annually by renegotiating their contract with Dell to ensure that all E5 and E7 Series laptops are purchased at UW Madison negotiated prices and achieving a 50% adoption rate.
Additional Savings from Unaccounted SFS and P-Card Dell Laptop Spend Directly from Dell
2Estimation of Additional P-Card E5 and E7 Series Laptop Spend $101K
3Estimation of Additional SFS E5 and E7 Series Laptop Spend $468K
Total Estimated Additional E5 and E7 Series Laptop Spend $569K
Estimated Additional Savings Based on Estimated 50% Adoption Rate at 20% Savings Rate on E5 and E7 Series Laptops
$
Weighted Average Unit Prices were calculated using the number of machines purchased at each different unit price
Percentage Savings Rate: Estimated Savings achieving UW Madison E5 and E7 Series Prices/ Total DOA Dell E5 and E7 Series Laptop Spend
Source: 1April 2014-March 2015 Financial Data Provided by DOA, 2P-card Desktop Spend Estimated from April 2014-March 2015 Data Provided by UWS, 3Additional SFS Desktop Spend Estimated from Data Provided by UWS
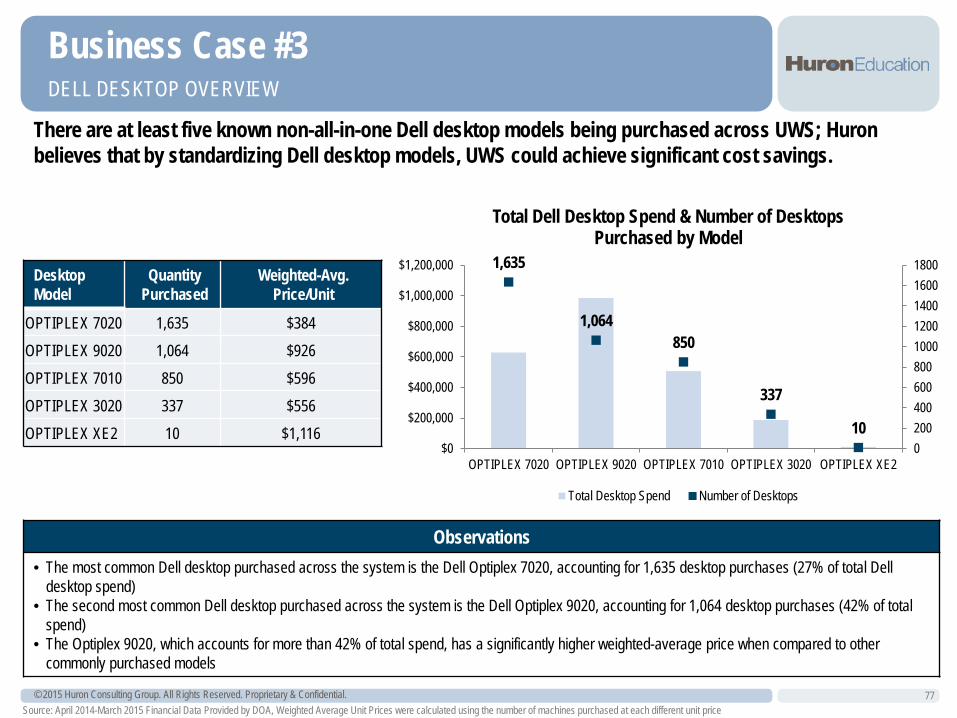
© 2015 Huron Consulting Group. All Rights Reserved. Proprietary & Confidential. 77
DELL DESKTOP OVERVIEW
Business Case #3
There are at least five known non-all-in-one Dell desktop models being purchased across UWS; Huron believes that by standardizing Dell desktop models, UWS could achieve significant cost savings.
1,635
1,064 850
337
10 020040060080010001200140016001800
$0
$200,000
$400,000
$600,000
$800,000
$1,000,000
$1,200,000
OPTIPLEX 7020 OPTIPLEX 9020 OPTIPLEX 7010 OPTIPLEX 3020 OPTIPLEX XE2
Total Dell Desktop Spend & Number of Desktops Purchased by Model
Total Desktop Spend Number of Desktops
Observations • The most common Dell desktop purchased across the system is the Dell Optiplex 7020, accounting for 1,635 desktop purchases (27% of total Dell
desktop spend) • The second most common Dell desktop purchased across the system is the Dell Optiplex 9020, accounting for 1,064 desktop purchases (42% of total
spend) • The Optiplex 9020, which accounts for more than 42% of total spend, has a significantly higher weighted-average price when compared to other
commonly purchased models
Desktop Model
Quantity Purchased
Weighted-Avg. Price/Unit
OPTIPLEX 7020 1,635 $384 OPTIPLEX 9020 1,064 $926 OPTIPLEX 7010 850 $596 OPTIPLEX 3020 337 $556 OPTIPLEX XE2 10 $1,116
Source: April 2014-March 2015 Financial Data Provided by DOA, Weighted Average Unit Prices were calculated using the number of machines purchased at each different unit price
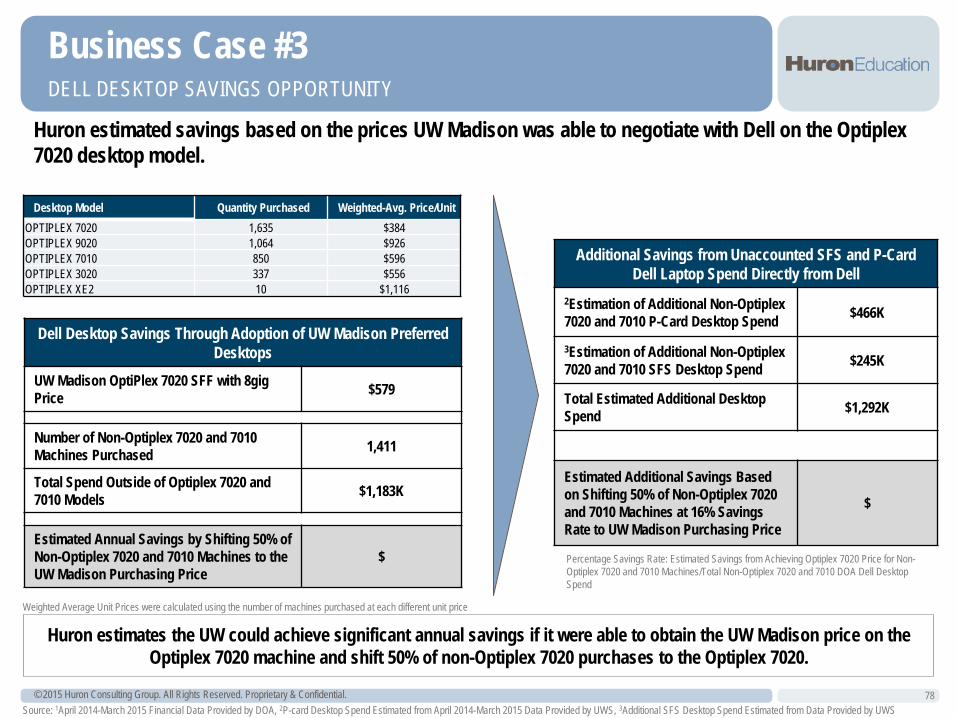
© 2015 Huron Consulting Group. All Rights Reserved. Proprietary & Confidential. 78
DELL DESKTOP SAVINGS OPPORTUNITY
Business Case #3
Huron estimated savings based on the prices UW Madison was able to negotiate with Dell on the Optiplex 7020 desktop model.
Source: 1April 2014-March 2015 Financial Data Provided by DOA, 2P-card Desktop Spend Estimated from April 2014-March 2015 Data Provided by UWS, 3Additional SFS Desktop Spend Estimated from Data Provided by UWS
Huron estimates the UW could achieve significant annual savings if it were able to obtain the UW Madison price on the Optiplex 7020 machine and shift 50% of non-Optiplex 7020 purchases to the Optiplex 7020.
Additional Savings from Unaccounted SFS and P-Card Dell Laptop Spend Directly from Dell
2Estimation of Additional Non-Optiplex 7020 and 7010 P-Card Desktop Spend $466K
3Estimation of Additional Non-Optiplex 7020 and 7010 SFS Desktop Spend $245K
Total Estimated Additional Desktop Spend $1,292K
Estimated Additional Savings Based on Shifting 50% of Non-Optiplex 7020 and 7010 Machines at 16% Savings Rate to UW Madison Purchasing Price
$
Weighted Average Unit Prices were calculated using the number of machines purchased at each different unit price
Desktop Model Quantity Purchased Weighted-Avg. Price/Unit OPTIPLEX 7020 1,635 $384 OPTIPLEX 9020 1,064 $926 OPTIPLEX 7010 850 $596 OPTIPLEX 3020 337 $556 OPTIPLEX XE2 10 $1,116
Dell Desktop Savings Through Adoption of UW Madison Preferred Desktops
UW Madison OptiPlex 7020 SFF with 8gig Price $579
Number of Non-Optiplex 7020 and 7010 Machines Purchased 1,411
Total Spend Outside of Optiplex 7020 and 7010 Models $1,183K
Estimated Annual Savings by Shifting 50% of Non-Optiplex 7020 and 7010 Machines to the UW Madison Purchasing Price
$ Percentage Savings Rate: Estimated Savings from Achieving Optiplex 7020 Price for Non-Optiplex 7020 and 7010 Machines/Total Non-Optiplex 7020 and 7010 DOA Dell Desktop Spend
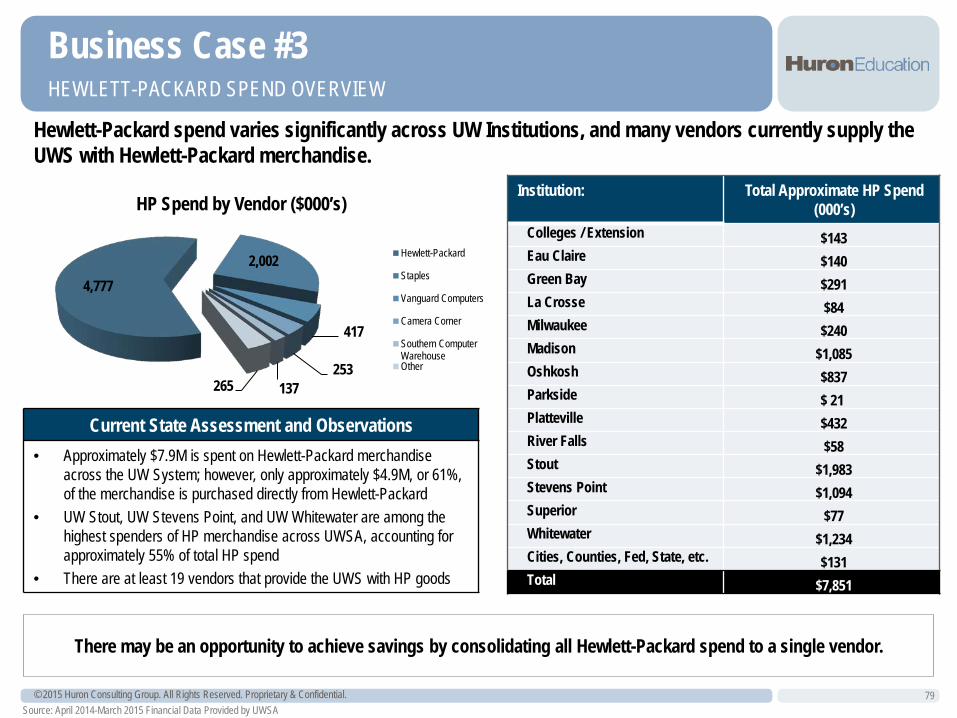
© 2015 Huron Consulting Group. All Rights Reserved. Proprietary & Confidential. 79
HEWLETT-PACKARD SPEND OVERVIEW
Business Case #3
Hewlett-Packard spend varies significantly across UW Institutions, and many vendors currently supply the UWS with Hewlett-Packard merchandise.
Institution: Total Approximate HP Spend (000’s)
Colleges / Extension $143 Eau Claire $140 Green Bay $291 La Crosse $84 Milwaukee $240 Madison $1,085 Oshkosh $837 Parkside $ 21 Platteville $432 River Falls $58 Stout $1,983 Stevens Point $1,094 Superior $77 Whitewater $1,234 Cities, Counties, Fed, State, etc. $131 Total $7,851
There may be an opportunity to achieve savings by consolidating all Hewlett-Packard spend to a single vendor.
Source: April 2014-March 2015 Financial Data Provided by UWSA
Current State Assessment and Observations • Approximately $7.9M is spent on Hewlett-Packard merchandise
across the UW System; however, only approximately $4.9M, or 61%, of the merchandise is purchased directly from Hewlett-Packard
• UW Stout, UW Stevens Point, and UW Whitewater are among the highest spenders of HP merchandise across UWSA, accounting for approximately 55% of total HP spend
• There are at least 19 vendors that provide the UWS with HP goods
4,777 2,002
417
253 137 265
HP Spend by Vendor ($000’s)
Hewlett-Packard
Staples
Vanguard Computers
Camera Corner
Southern ComputerWarehouseOther
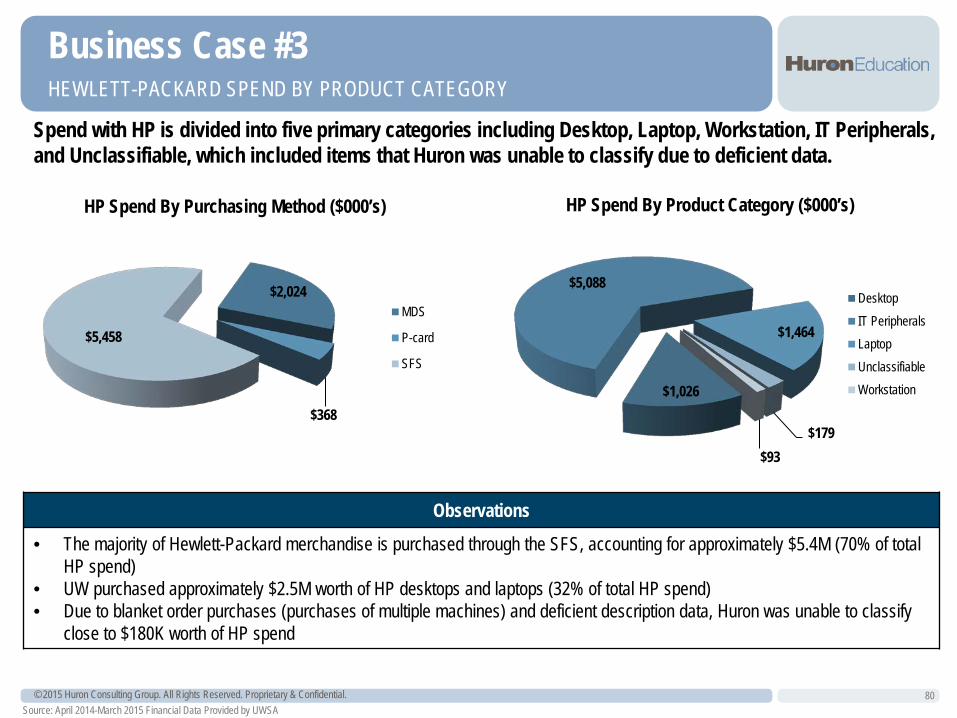
© 2015 Huron Consulting Group. All Rights Reserved. Proprietary & Confidential. 80
HEWLETT-PACKARD SPEND BY PRODUCT CATEGORY
Business Case #3
Source: April 2014-March 2015 Financial Data Provided by UWSA
Spend with HP is divided into five primary categories including Desktop, Laptop, Workstation, IT Peripherals, and Unclassifiable, which included items that Huron was unable to classify due to deficient data.
$1,026
$5,088
$1,464
$179 $93
HP Spend By Product Category ($000’s)
DesktopIT PeripheralsLaptopUnclassifiableWorkstation
Observations
• The majority of Hewlett-Packard merchandise is purchased through the SFS, accounting for approximately $5.4M (70% of total HP spend)
• UW purchased approximately $2.5M worth of HP desktops and laptops (32% of total HP spend) • Due to blanket order purchases (purchases of multiple machines) and deficient description data, Huron was unable to classify
close to $180K worth of HP spend
$2,024
$368
$5,458
HP Spend By Purchasing Method ($000’s)
MDS
P-card
SFS
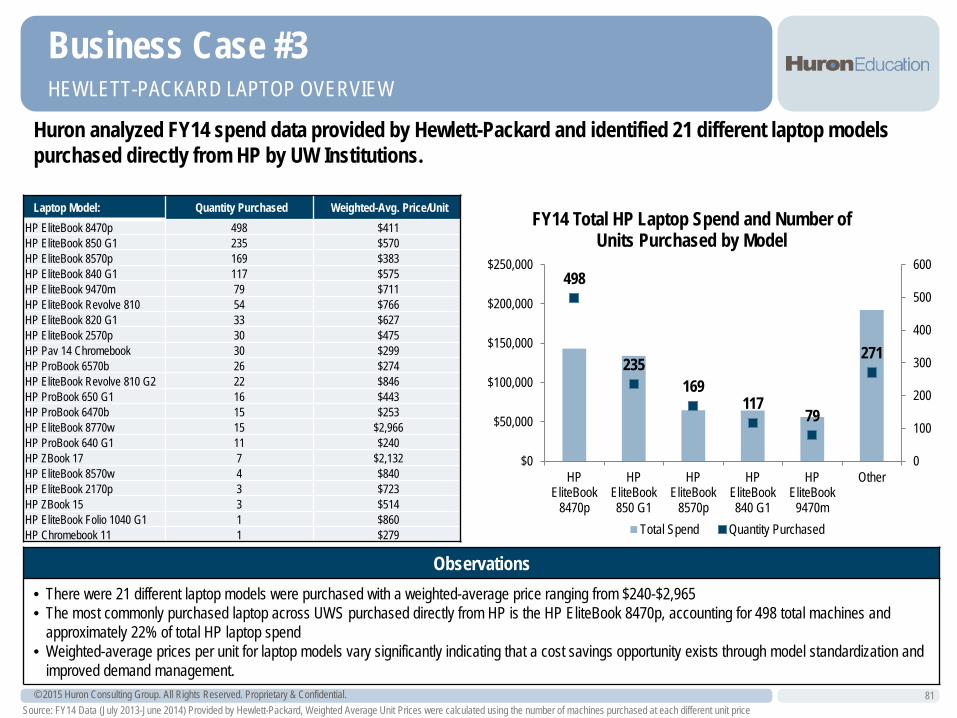
© 2015 Huron Consulting Group. All Rights Reserved. Proprietary & Confidential. 81
HEWLETT-PACKARD LAPTOP OVERVIEW
Business Case #3
Huron analyzed FY14 spend data provided by Hewlett-Packard and identified 21 different laptop models purchased directly from HP by UW Institutions.
498
235 169
117 79
271
0
100
200
300
400
500
600
$0
$50,000
$100,000
$150,000
$200,000
$250,000
HPEliteBook
8470p
HPEliteBook850 G1
HPEliteBook
8570p
HPEliteBook840 G1
HPEliteBook
9470m
Other
FY14 Total HP Laptop Spend and Number of Units Purchased by Model
Total Spend Quantity Purchased
Observations • There were 21 different laptop models were purchased with a weighted-average price ranging from $240-$2,965 • The most commonly purchased laptop across UWS purchased directly from HP is the HP EliteBook 8470p, accounting for 498 total machines and
approximately 22% of total HP laptop spend • Weighted-average prices per unit for laptop models vary significantly indicating that a cost savings opportunity exists through model standardization and
improved demand management.
Source: FY14 Data (July 2013-June 2014) Provided by Hewlett-Packard, Weighted Average Unit Prices were calculated using the number of machines purchased at each different unit price
Laptop Model: Quantity Purchased Weighted-Avg. Price/Unit HP EliteBook 8470p 498 $411 HP EliteBook 850 G1 235 $570 HP EliteBook 8570p 169 $383 HP EliteBook 840 G1 117 $575 HP EliteBook 9470m 79 $711 HP EliteBook Revolve 810 54 $766 HP EliteBook 820 G1 33 $627 HP EliteBook 2570p 30 $475 HP Pav 14 Chromebook 30 $299 HP ProBook 6570b 26 $274 HP EliteBook Revolve 810 G2 22 $846 HP ProBook 650 G1 16 $443 HP ProBook 6470b 15 $253 HP EliteBook 8770w 15 $2,966 HP ProBook 640 G1 11 $240 HP ZBook 17 7 $2,132 HP EliteBook 8570w 4 $840 HP EliteBook 2170p 3 $723 HP ZBook 15 3 $514 HP EliteBook Folio 1040 G1 1 $860 HP Chromebook 11 1 $279
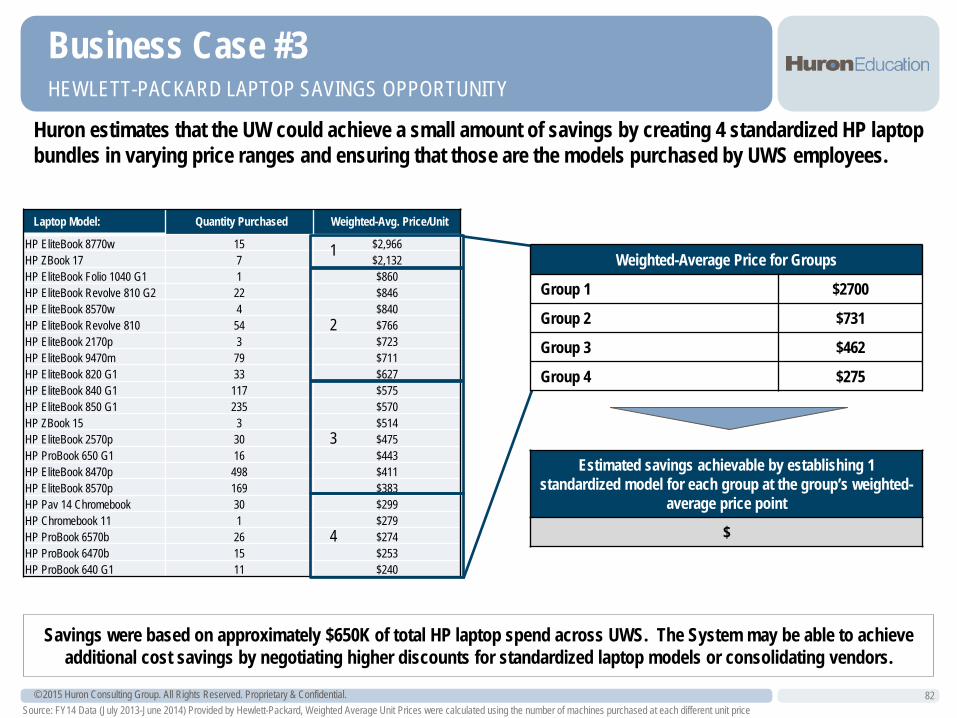
© 2015 Huron Consulting Group. All Rights Reserved. Proprietary & Confidential.
Laptop Model: Quantity Purchased Weighted-Avg. Price/Unit
HP EliteBook 8770w 15 $2,966 HP ZBook 17 7 $2,132 HP EliteBook Folio 1040 G1 1 $860 HP EliteBook Revolve 810 G2 22 $846 HP EliteBook 8570w 4 $840 HP EliteBook Revolve 810 54 $766 HP EliteBook 2170p 3 $723 HP EliteBook 9470m 79 $711 HP EliteBook 820 G1 33 $627 HP EliteBook 840 G1 117 $575 HP EliteBook 850 G1 235 $570 HP ZBook 15 3 $514 HP EliteBook 2570p 30 $475 HP ProBook 650 G1 16 $443 HP EliteBook 8470p 498 $411 HP EliteBook 8570p 169 $383 HP Pav 14 Chromebook 30 $299 HP Chromebook 11 1 $279 HP ProBook 6570b 26 $274 HP ProBook 6470b 15 $253 HP ProBook 640 G1 11 $240
82
HEWLETT-PACKARD LAPTOP SAVINGS OPPORTUNITY
Business Case #3
Huron estimates that the UW could achieve a small amount of savings by creating 4 standardized HP laptop bundles in varying price ranges and ensuring that those are the models purchased by UWS employees.
Savings were based on approximately $650K of total HP laptop spend across UWS. The System may be able to achieve additional cost savings by negotiating higher discounts for standardized laptop models or consolidating vendors.
Source: FY14 Data (July 2013-June 2014) Provided by Hewlett-Packard, Weighted Average Unit Prices were calculated using the number of machines purchased at each different unit price
1
2
3
4
Estimated savings achievable by establishing 1 standardized model for each group at the group’s weighted-
average price point
$
Weighted-Average Price for Groups
Group 1 $2700
Group 2 $731
Group 3 $462
Group 4 $275
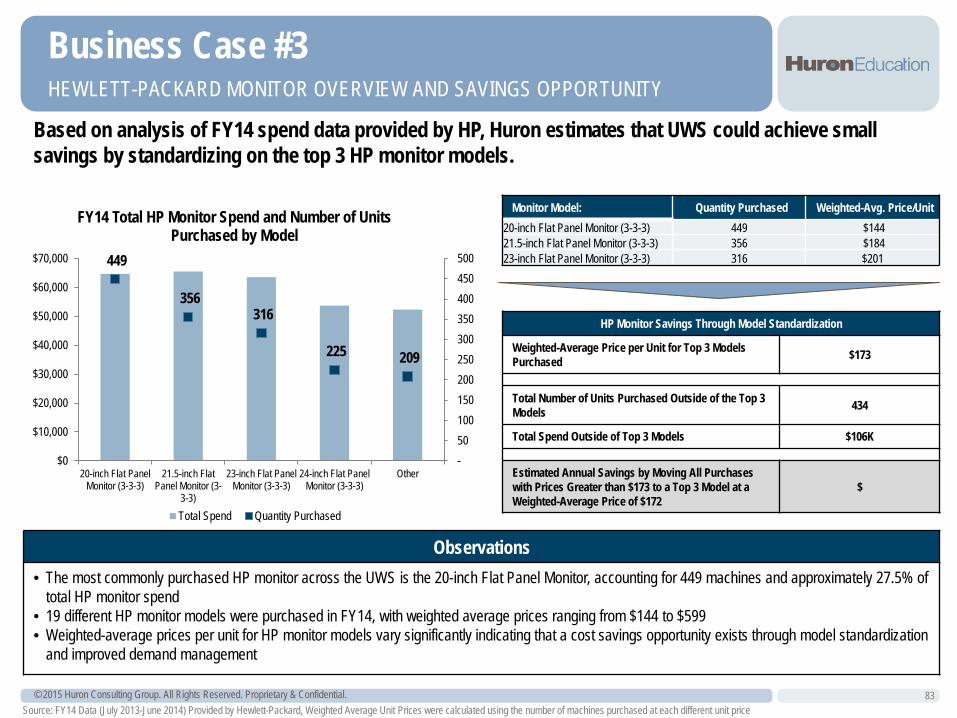
© 2015 Huron Consulting Group. All Rights Reserved. Proprietary & Confidential. 83
HEWLETT-PACKARD MONITOR OVERVIEW AND SAVINGS OPPORTUNITY
Business Case #3
Based on analysis of FY14 spend data provided by HP, Huron estimates that UWS could achieve small savings by standardizing on the top 3 HP monitor models.
449
356 316
225 209
- 50 100 150 200 250 300 350 400 450 500
$0
$10,000
$20,000
$30,000
$40,000
$50,000
$60,000
$70,000
20-inch Flat PanelMonitor (3-3-3)
21.5-inch FlatPanel Monitor (3-
3-3)
23-inch Flat PanelMonitor (3-3-3)
24-inch Flat PanelMonitor (3-3-3)
Other
FY14 Total HP Monitor Spend and Number of Units Purchased by Model
Total Spend Quantity Purchased
Observations • The most commonly purchased HP monitor across the UWS is the 20-inch Flat Panel Monitor, accounting for 449 machines and approximately 27.5% of
total HP monitor spend • 19 different HP monitor models were purchased in FY14, with weighted average prices ranging from $144 to $599 • Weighted-average prices per unit for HP monitor models vary significantly indicating that a cost savings opportunity exists through model standardization
and improved demand management
Monitor Model: Quantity Purchased Weighted-Avg. Price/Unit 20-inch Flat Panel Monitor (3-3-3) 449 $144 21.5-inch Flat Panel Monitor (3-3-3) 356 $184 23-inch Flat Panel Monitor (3-3-3) 316 $201
HP Monitor Savings Through Model Standardization
Weighted-Average Price per Unit for Top 3 Models Purchased $173
Total Number of Units Purchased Outside of the Top 3 Models 434
Total Spend Outside of Top 3 Models $106K
Estimated Annual Savings by Moving All Purchases with Prices Greater than $173 to a Top 3 Model at a Weighted-Average Price of $172
$
Source: FY14 Data (July 2013-June 2014) Provided by Hewlett-Packard, Weighted Average Unit Prices were calculated using the number of machines purchased at each different unit price
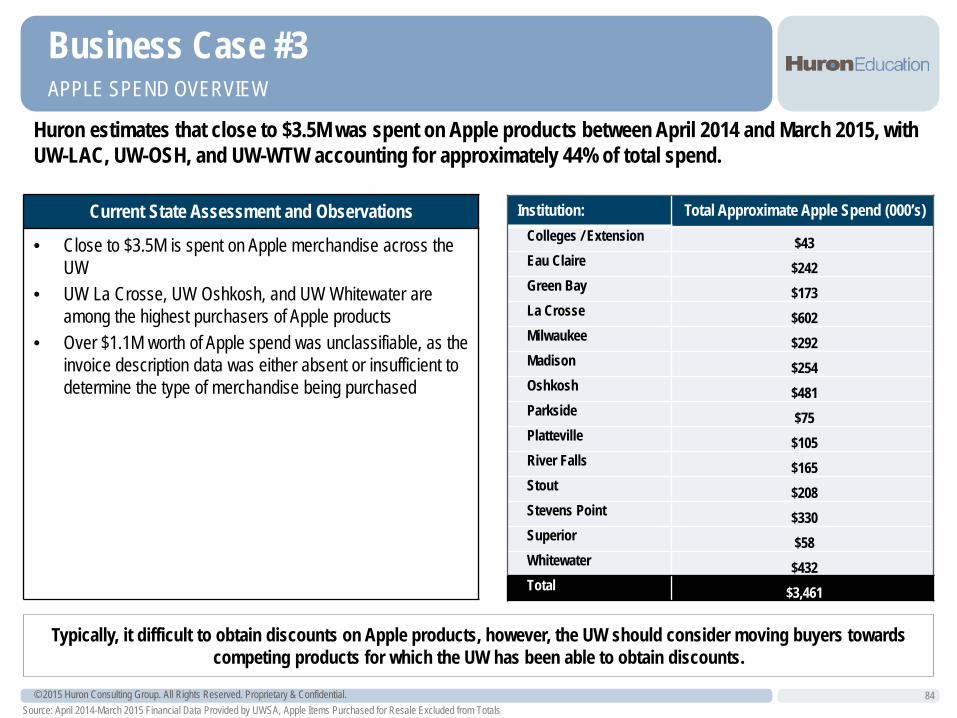
© 2015 Huron Consulting Group. All Rights Reserved. Proprietary & Confidential. 84
APPLE SPEND OVERVIEW
Business Case #3
Huron estimates that close to $3.5M was spent on Apple products between April 2014 and March 2015, with UW-LAC, UW-OSH, and UW-WTW accounting for approximately 44% of total spend.
Institution: Total Approximate Apple Spend (000’s) Colleges / Extension $43 Eau Claire $242 Green Bay $173 La Crosse $602 Milwaukee $292 Madison $254 Oshkosh $481 Parkside $75 Platteville $105 River Falls $165 Stout $208 Stevens Point $330 Superior $58 Whitewater $432 Total $3,461
Typically, it difficult to obtain discounts on Apple products, however, the UW should consider moving buyers towards competing products for which the UW has been able to obtain discounts.
Source: April 2014-March 2015 Financial Data Provided by UWSA, Apple Items Purchased for Resale Excluded from Totals
Current State Assessment and Observations
• Close to $3.5M is spent on Apple merchandise across the UW
• UW La Crosse, UW Oshkosh, and UW Whitewater are among the highest purchasers of Apple products
• Over $1.1M worth of Apple spend was unclassifiable, as the invoice description data was either absent or insufficient to determine the type of merchandise being purchased
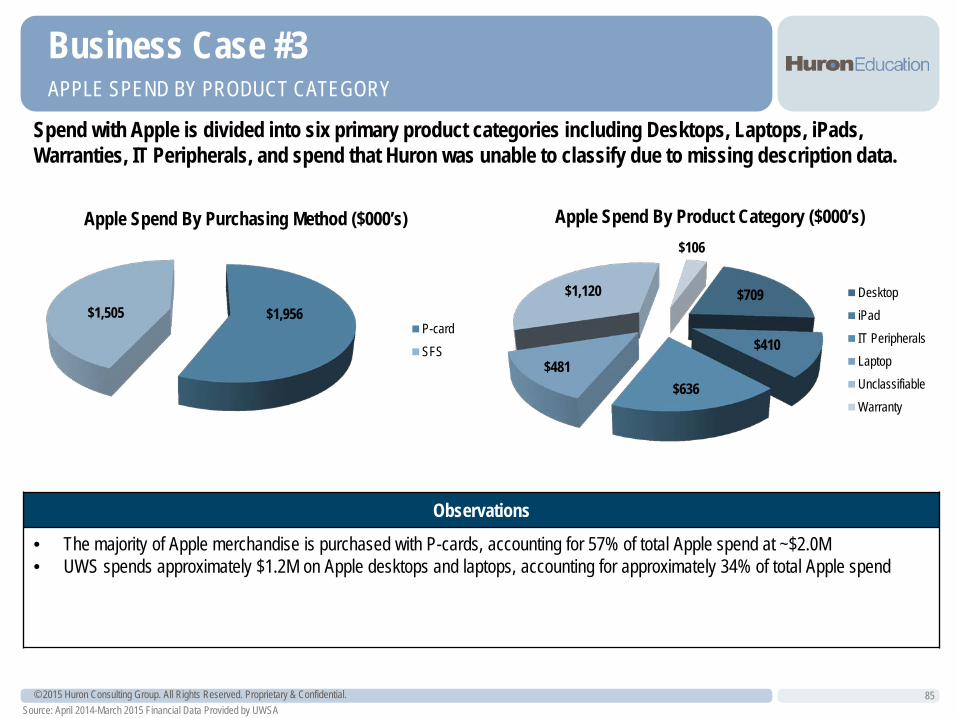
© 2015 Huron Consulting Group. All Rights Reserved. Proprietary & Confidential. 85
APPLE SPEND BY PRODUCT CATEGORY
Business Case #3
Source: April 2014-March 2015 Financial Data Provided by UWSA
Spend with Apple is divided into six primary product categories including Desktops, Laptops, iPads, Warranties, IT Peripherals, and spend that Huron was unable to classify due to missing description data.
$709
$410
$636 $481
$1,120
$106
Apple Spend By Product Category ($000’s)
DesktopiPadIT PeripheralsLaptopUnclassifiableWarranty
$1,956 $1,505
Apple Spend By Purchasing Method ($000’s)
P-cardSFS
Observations
• The majority of Apple merchandise is purchased with P-cards, accounting for 57% of total Apple spend at ~$2.0M • UWS spends approximately $1.2M on Apple desktops and laptops, accounting for approximately 34% of total Apple spend
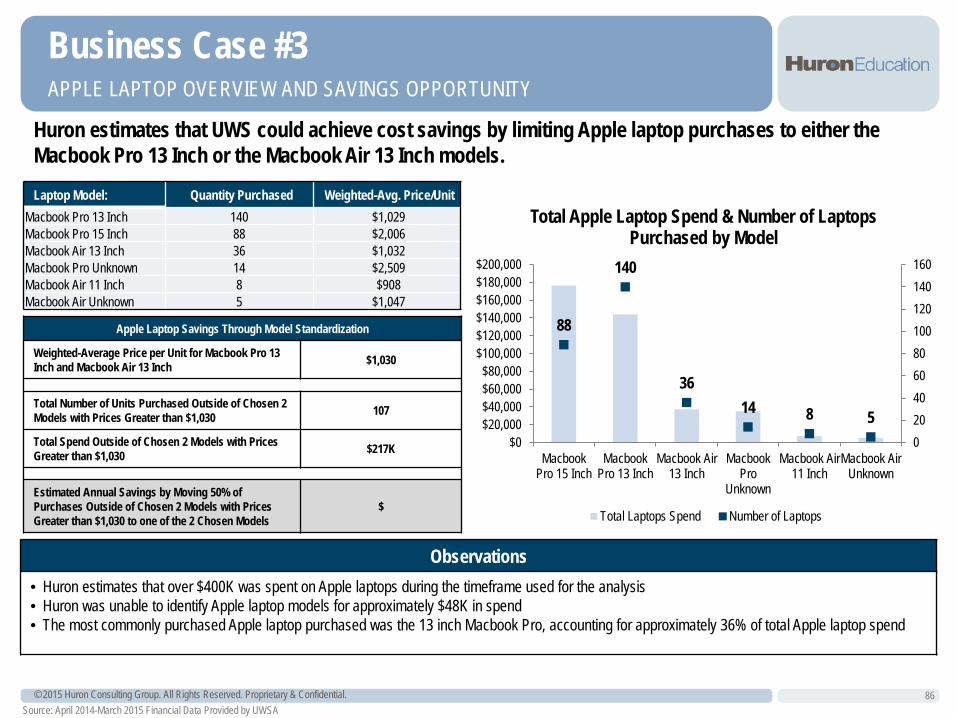
© 2015 Huron Consulting Group. All Rights Reserved. Proprietary & Confidential. 86
APPLE LAPTOP OVERVIEW AND SAVINGS OPPORTUNITY
Business Case #3
Huron estimates that UWS could achieve cost savings by limiting Apple laptop purchases to either the Macbook Pro 13 Inch or the Macbook Air 13 Inch models.
88
140
36 14 8 5
020406080100120140160
$0$20,000$40,000$60,000$80,000
$100,000$120,000$140,000$160,000$180,000$200,000
MacbookPro 15 Inch
MacbookPro 13 Inch
Macbook Air13 Inch
MacbookPro
Unknown
Macbook Air11 Inch
Macbook AirUnknown
Total Apple Laptop Spend & Number of Laptops Purchased by Model
Total Laptops Spend Number of Laptops
Source: April 2014-March 2015 Financial Data Provided by UWSA
Laptop Model: Quantity Purchased Weighted-Avg. Price/Unit Macbook Pro 13 Inch 140 $1,029 Macbook Pro 15 Inch 88 $2,006 Macbook Air 13 Inch 36 $1,032 Macbook Pro Unknown 14 $2,509 Macbook Air 11 Inch 8 $908 Macbook Air Unknown 5 $1,047
Apple Laptop Savings Through Model Standardization
Weighted-Average Price per Unit for Macbook Pro 13 Inch and Macbook Air 13 Inch $1,030
Total Number of Units Purchased Outside of Chosen 2 Models with Prices Greater than $1,030 107
Total Spend Outside of Chosen 2 Models with Prices Greater than $1,030 $217K
Estimated Annual Savings by Moving 50% of Purchases Outside of Chosen 2 Models with Prices Greater than $1,030 to one of the 2 Chosen Models
$
Observations • Huron estimates that over $400K was spent on Apple laptops during the timeframe used for the analysis • Huron was unable to identify Apple laptop models for approximately $48K in spend • The most commonly purchased Apple laptop purchased was the 13 inch Macbook Pro, accounting for approximately 36% of total Apple laptop spend
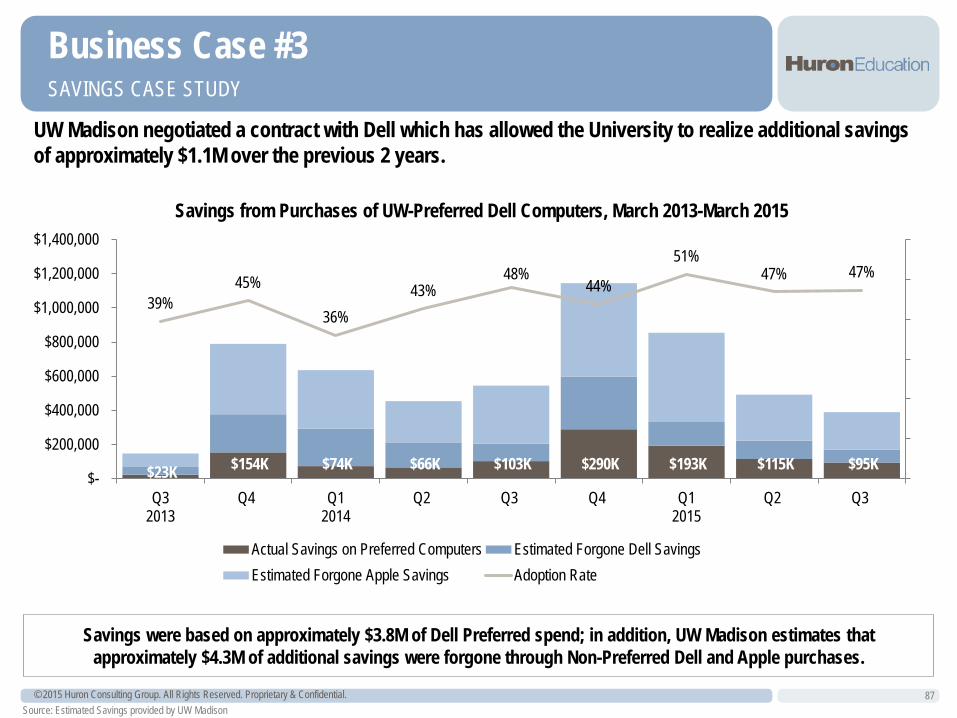
© 2015 Huron Consulting Group. All Rights Reserved. Proprietary & Confidential. 87
SAVINGS CASE STUDY
Business Case #3
UW Madison negotiated a contract with Dell which has allowed the University to realize additional savings of approximately $1.1M over the previous 2 years.
$23K $154K $74K $66K $103K $290K $193K $115K $95K
39% 45%
36% 43%
48% 44%
51% 47% 47%
$-
$200,000
$400,000
$600,000
$800,000
$1,000,000
$1,200,000
$1,400,000
Q32013
Q4 Q12014
Q2 Q3 Q4 Q12015
Q2 Q3
Savings from Purchases of UW-Preferred Dell Computers, March 2013-March 2015
Actual Savings on Preferred Computers Estimated Forgone Dell SavingsEstimated Forgone Apple Savings Adoption Rate
Source: Estimated Savings provided by UW Madison
Savings were based on approximately $3.8M of Dell Preferred spend; in addition, UW Madison estimates that approximately $4.3M of additional savings were forgone through Non-Preferred Dell and Apple purchases.
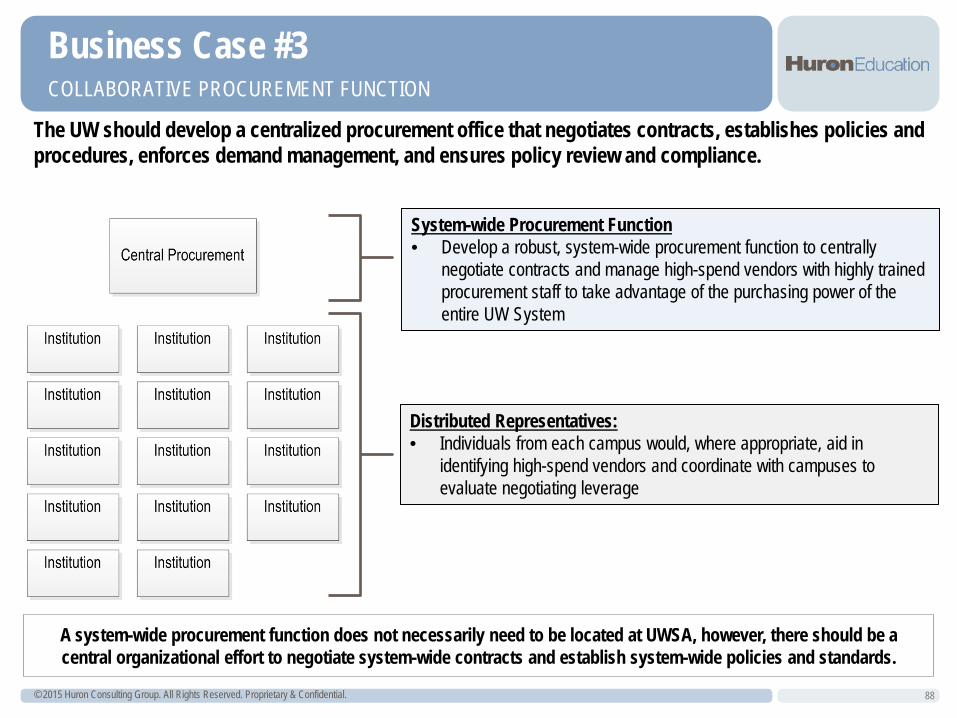
© 2015 Huron Consulting Group. All Rights Reserved. Proprietary & Confidential. 88
COLLABORATIVE PROCUREMENT FUNCTION
Business Case #3
The UW should develop a centralized procurement office that negotiates contracts, establishes policies and procedures, enforces demand management, and ensures policy review and compliance.
System-wide Procurement Function • Develop a robust, system-wide procurement function to centrally
negotiate contracts and manage high-spend vendors with highly trained procurement staff to take advantage of the purchasing power of the entire UW System
Distributed Representatives: • Individuals from each campus would, where appropriate, aid in
identifying high-spend vendors and coordinate with campuses to evaluate negotiating leverage
A system-wide procurement function does not necessarily need to be located at UWSA, however, there should be a central organizational effort to negotiate system-wide contracts and establish system-wide policies and standards.
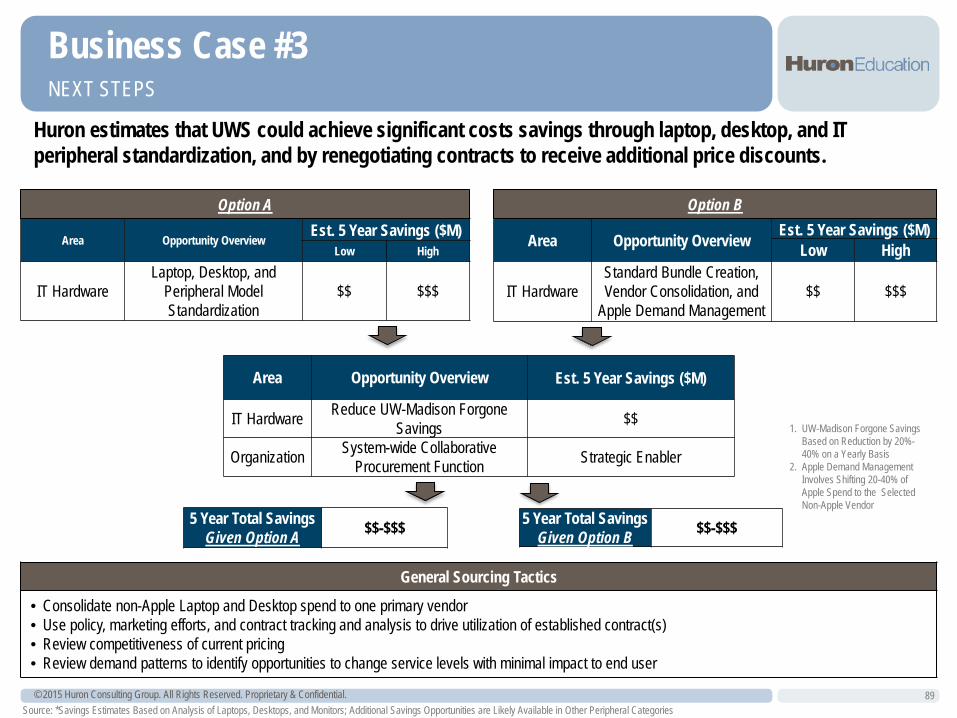
© 2015 Huron Consulting Group. All Rights Reserved. Proprietary & Confidential. 89
NEXT STEPS
Business Case #3
Huron estimates that UWS could achieve significant costs savings through laptop, desktop, and IT peripheral standardization, and by renegotiating contracts to receive additional price discounts.
General Sourcing Tactics
• Consolidate non-Apple Laptop and Desktop spend to one primary vendor • Use policy, marketing efforts, and contract tracking and analysis to drive utilization of established contract(s) • Review competitiveness of current pricing • Review demand patterns to identify opportunities to change service levels with minimal impact to end user
Option A Option B
Area Opportunity Overview Est. 5 Year Savings ($M)
Low High
IT Hardware Laptop, Desktop, and
Peripheral Model Standardization
$$ $$$
Area Opportunity Overview Est. 5 Year Savings ($M) Low High
IT Hardware Standard Bundle Creation, Vendor Consolidation, and
Apple Demand Management $$ $$$
Area Opportunity Overview Est. 5 Year Savings ($M)
IT Hardware Reduce UW-Madison Forgone Savings $$
Organization System-wide Collaborative Procurement Function Strategic Enabler
5 Year Total Savings Given Option A $$-$$$ 5 Year Total Savings
Given Option B $$-$$$
1. UW-Madison Forgone Savings Based on Reduction by 20%-40% on a Yearly Basis
2. Apple Demand Management Involves Shifting 20-40% of Apple Spend to the Selected Non-Apple Vendor
Source: *Savings Estimates Based on Analysis of Laptops, Desktops, and Monitors; Additional Savings Opportunities are Likely Available in Other Peripheral Categories

Appendix
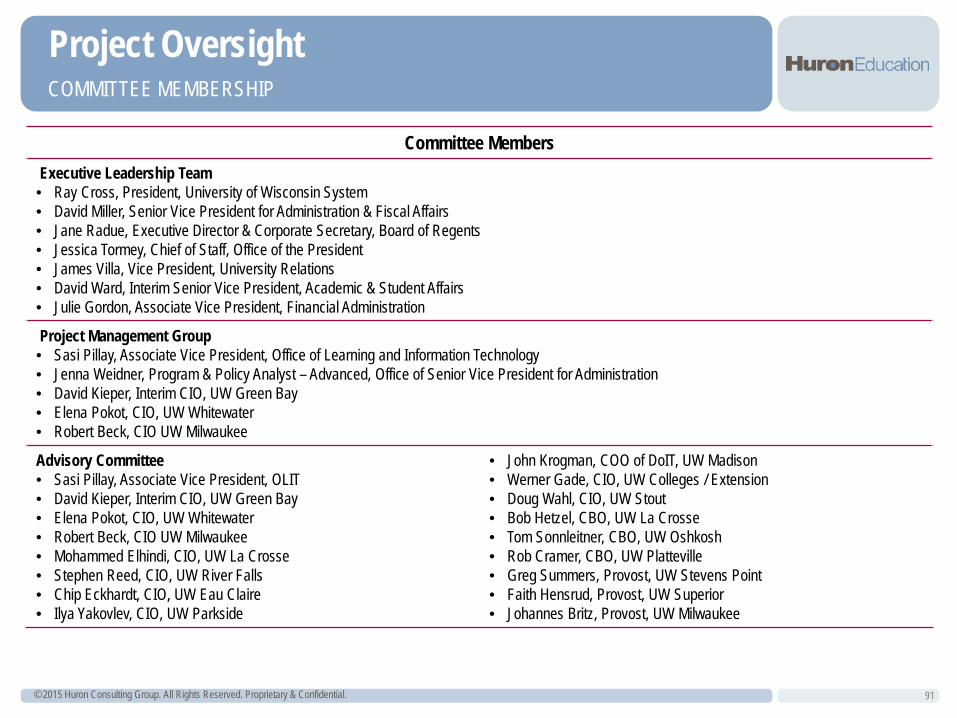
© 2015 Huron Consulting Group. All Rights Reserved. Proprietary & Confidential.
Project Oversight
91
Committee Members Executive Leadership Team • Ray Cross, President, University of Wisconsin System • David Miller, Senior Vice President for Administration & Fiscal Affairs • Jane Radue, Executive Director & Corporate Secretary, Board of Regents • Jessica Tormey, Chief of Staff, Office of the President • James Villa, Vice President, University Relations • David Ward, Interim Senior Vice President, Academic & Student Affairs • Julie Gordon, Associate Vice President, Financial Administration
Project Management Group • Sasi Pillay, Associate Vice President, Office of Learning and Information Technology • Jenna Weidner, Program & Policy Analyst – Advanced, Office of Senior Vice President for Administration • David Kieper, Interim CIO, UW Green Bay • Elena Pokot, CIO, UW Whitewater • Robert Beck, CIO UW Milwaukee
Advisory Committee • Sasi Pillay, Associate Vice President, OLIT • David Kieper, Interim CIO, UW Green Bay • Elena Pokot, CIO, UW Whitewater • Robert Beck, CIO UW Milwaukee • Mohammed Elhindi, CIO, UW La Crosse • Stephen Reed, CIO, UW River Falls • Chip Eckhardt, CIO, UW Eau Claire • Ilya Yakovlev, CIO, UW Parkside
• John Krogman, COO of DoIT, UW Madison • Werner Gade, CIO, UW Colleges / Extension • Doug Wahl, CIO, UW Stout • Bob Hetzel, CBO, UW La Crosse • Tom Sonnleitner, CBO, UW Oshkosh • Rob Cramer, CBO, UW Platteville • Greg Summers, Provost, UW Stevens Point • Faith Hensrud, Provost, UW Superior • Johannes Britz, Provost, UW Milwaukee
COMMITTEE MEMBERSHIP
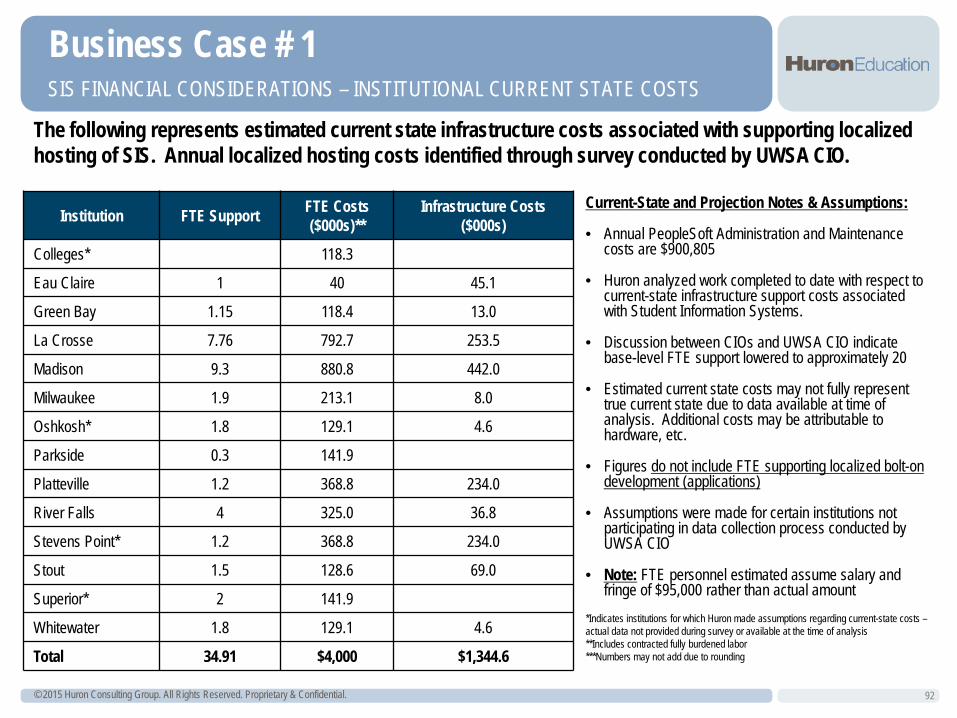
© 2015 Huron Consulting Group. All Rights Reserved. Proprietary & Confidential.
Business Case # 1 SIS FINANCIAL CONSIDERATIONS – INSTITUTIONAL CURRENT STATE COSTS
92
The following represents estimated current state infrastructure costs associated with supporting localized hosting of SIS. Annual localized hosting costs identified through survey conducted by UWSA CIO.
Current-State and Projection Notes & Assumptions:
• Annual PeopleSoft Administration and Maintenance costs are $900,805
• Huron analyzed work completed to date with respect to current-state infrastructure support costs associated with Student Information Systems.
• Discussion between CIOs and UWSA CIO indicate base-level FTE support lowered to approximately 20
• Estimated current state costs may not fully represent true current state due to data available at time of analysis. Additional costs may be attributable to hardware, etc.
• Figures do not include FTE supporting localized bolt-on development (applications)
• Assumptions were made for certain institutions not participating in data collection process conducted by UWSA CIO
• Note: FTE personnel estimated assume salary and fringe of $95,000 rather than actual amount
*Indicates institutions for which Huron made assumptions regarding current-state costs – actual data not provided during survey or available at the time of analysis **Includes contracted fully burdened labor ***Numbers may not add due to rounding
Institution FTE Support FTE Costs ($000s)**
Infrastructure Costs ($000s)
Colleges* 118.3
Eau Claire 1 40 45.1
Green Bay 1.15 118.4 13.0
La Crosse 7.76 792.7 253.5
Madison 9.3 880.8 442.0
Milwaukee 1.9 213.1 8.0
Oshkosh* 1.8 129.1 4.6
Parkside 0.3 141.9
Platteville 1.2 368.8 234.0
River Falls 4 325.0 36.8
Stevens Point* 1.2 368.8 234.0
Stout 1.5 128.6 69.0
Superior* 2 141.9
Whitewater 1.8 129.1 4.6
Total 34.91 $4,000 $1,344.6
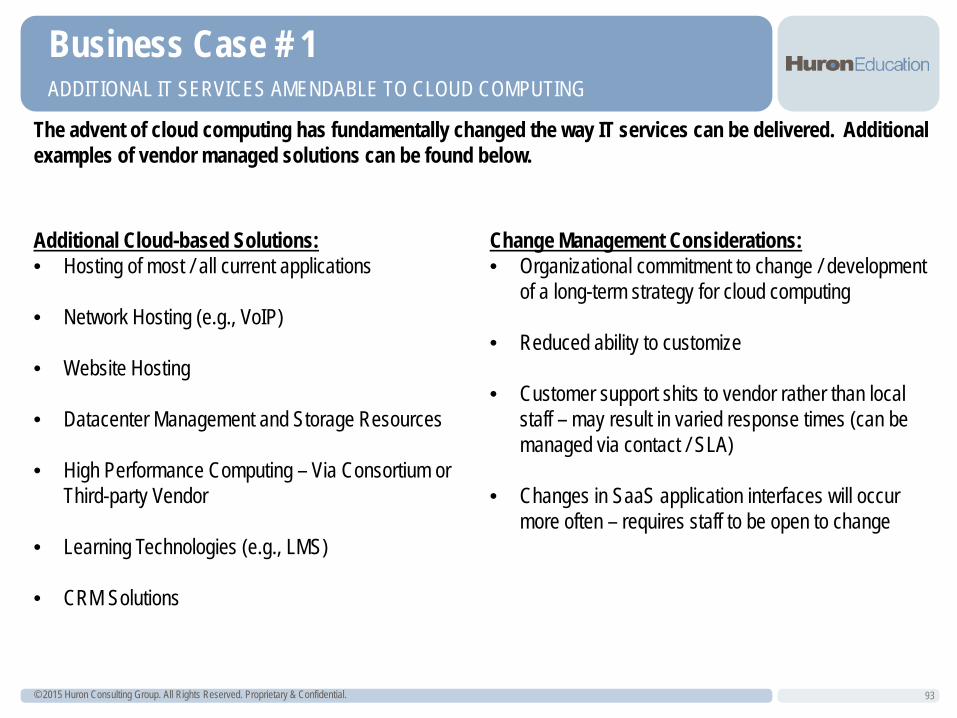
© 2015 Huron Consulting Group. All Rights Reserved. Proprietary & Confidential.
Business Case # 1 ADDITIONAL IT SERVICES AMENDABLE TO CLOUD COMPUTING
93
The advent of cloud computing has fundamentally changed the way IT services can be delivered. Additional examples of vendor managed solutions can be found below.
Additional Cloud-based Solutions: • Hosting of most / all current applications
• Network Hosting (e.g., VoIP)
• Website Hosting
• Datacenter Management and Storage Resources
• High Performance Computing – Via Consortium or
Third-party Vendor
• Learning Technologies (e.g., LMS)
• CRM Solutions
Change Management Considerations: • Organizational commitment to change / development
of a long-term strategy for cloud computing
• Reduced ability to customize
• Customer support shits to vendor rather than local staff – may result in varied response times (can be managed via contact / SLA)
• Changes in SaaS application interfaces will occur more often – requires staff to be open to change
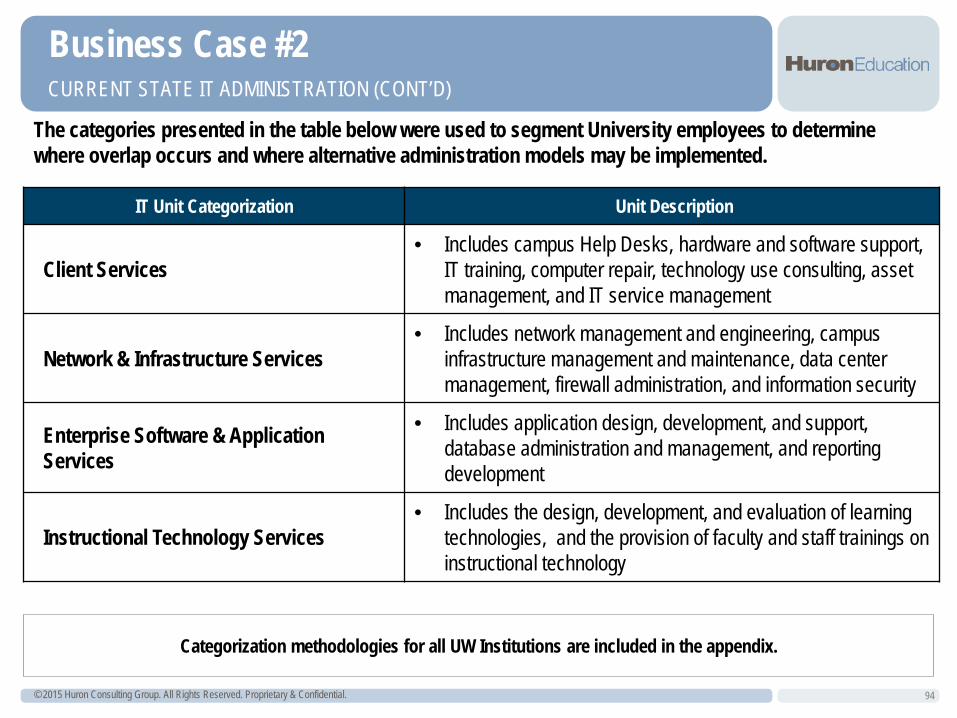
© 2015 Huron Consulting Group. All Rights Reserved. Proprietary & Confidential.
Business Case #2 CURRENT STATE IT ADMINISTRATION (CONT’D)
The categories presented in the table below were used to segment University employees to determine where overlap occurs and where alternative administration models may be implemented.
94
Types of Cloud
IT Unit Categorization Unit Description
Client Services • Includes campus Help Desks, hardware and software support,
IT training, computer repair, technology use consulting, asset management, and IT service management
Network & Infrastructure Services • Includes network management and engineering, campus
infrastructure management and maintenance, data center management, firewall administration, and information security
Enterprise Software & Application Services
• Includes application design, development, and support, database administration and management, and reporting development
Instructional Technology Services • Includes the design, development, and evaluation of learning
technologies, and the provision of faculty and staff trainings on instructional technology
Categorization methodologies for all UW Institutions are included in the appendix.
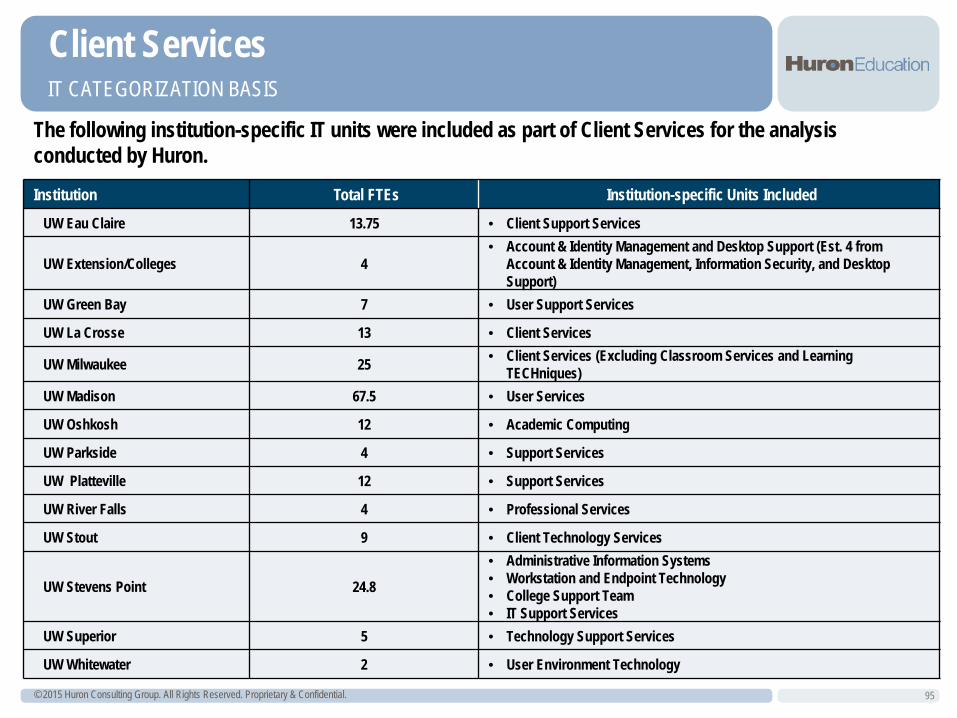
© 2015 Huron Consulting Group. All Rights Reserved. Proprietary & Confidential.
Client Services IT CATEGORIZATION BASIS
The following institution-specific IT units were included as part of Client Services for the analysis conducted by Huron.
95
Institution Total FTEs Institution-specific Units Included UW Eau Claire 13.75 • Client Support Services
UW Extension/Colleges 4 • Account & Identity Management and Desktop Support (Est. 4 from
Account & Identity Management, Information Security, and Desktop Support)
UW Green Bay 7 • User Support Services
UW La Crosse 13 • Client Services
UW Milwaukee 25 • Client Services (Excluding Classroom Services and Learning TECHniques)
UW Madison 67.5 • User Services
UW Oshkosh 12 • Academic Computing
UW Parkside 4 • Support Services
UW Platteville 12 • Support Services
UW River Falls 4 • Professional Services
UW Stout 9 • Client Technology Services
UW Stevens Point 24.8
• Administrative Information Systems • Workstation and Endpoint Technology • College Support Team • IT Support Services
UW Superior 5 • Technology Support Services
UW Whitewater 2 • User Environment Technology
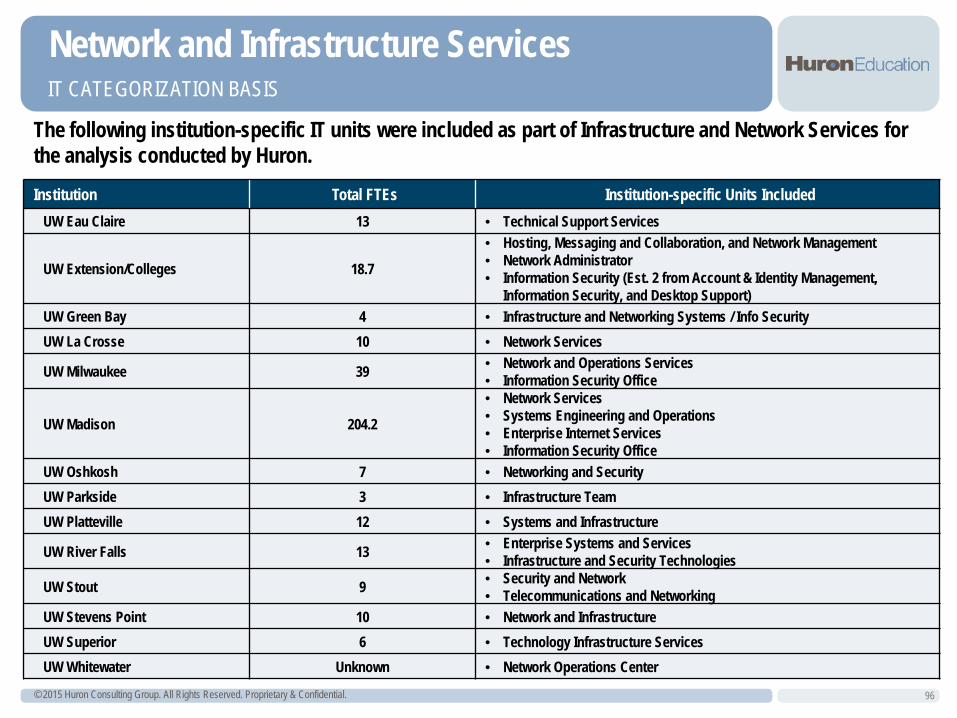
© 2015 Huron Consulting Group. All Rights Reserved. Proprietary & Confidential.
Network and Infrastructure Services IT CATEGORIZATION BASIS
The following institution-specific IT units were included as part of Infrastructure and Network Services for the analysis conducted by Huron.
96
Institution Total FTEs Institution-specific Units Included UW Eau Claire 13 • Technical Support Services
UW Extension/Colleges 18.7
• Hosting, Messaging and Collaboration, and Network Management • Network Administrator • Information Security (Est. 2 from Account & Identity Management,
Information Security, and Desktop Support) UW Green Bay 4 • Infrastructure and Networking Systems / Info Security UW La Crosse 10 • Network Services
UW Milwaukee 39 • Network and Operations Services • Information Security Office
UW Madison 204.2
• Network Services • Systems Engineering and Operations • Enterprise Internet Services • Information Security Office
UW Oshkosh 7 • Networking and Security UW Parkside 3 • Infrastructure Team UW Platteville 12 • Systems and Infrastructure
UW River Falls 13 • Enterprise Systems and Services • Infrastructure and Security Technologies
UW Stout 9 • Security and Network • Telecommunications and Networking
UW Stevens Point 10 • Network and Infrastructure UW Superior 6 • Technology Infrastructure Services UW Whitewater Unknown • Network Operations Center
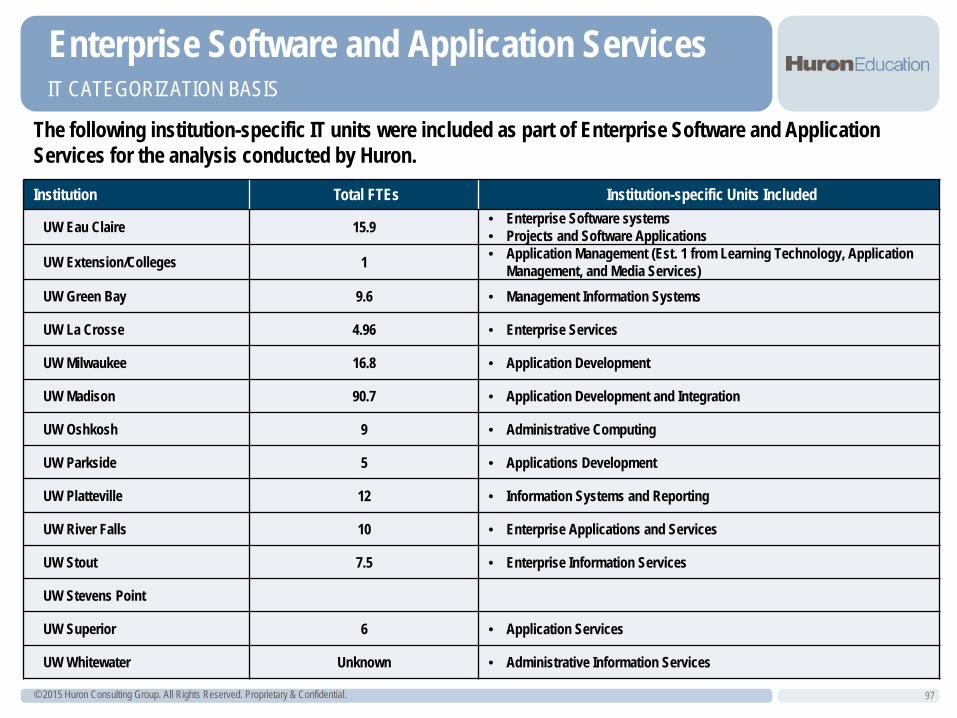
© 2015 Huron Consulting Group. All Rights Reserved. Proprietary & Confidential.
Enterprise Software and Application Services IT CATEGORIZATION BASIS
The following institution-specific IT units were included as part of Enterprise Software and Application Services for the analysis conducted by Huron.
97
Institution Total FTEs Institution-specific Units Included
UW Eau Claire 15.9 • Enterprise Software systems • Projects and Software Applications
UW Extension/Colleges 1 • Application Management (Est. 1 from Learning Technology, Application Management, and Media Services)
UW Green Bay 9.6 • Management Information Systems
UW La Crosse 4.96 • Enterprise Services
UW Milwaukee 16.8 • Application Development
UW Madison 90.7 • Application Development and Integration
UW Oshkosh 9 • Administrative Computing
UW Parkside 5 • Applications Development
UW Platteville 12 • Information Systems and Reporting
UW River Falls 10 • Enterprise Applications and Services
UW Stout 7.5 • Enterprise Information Services
UW Stevens Point
UW Superior 6 • Application Services
UW Whitewater Unknown • Administrative Information Services
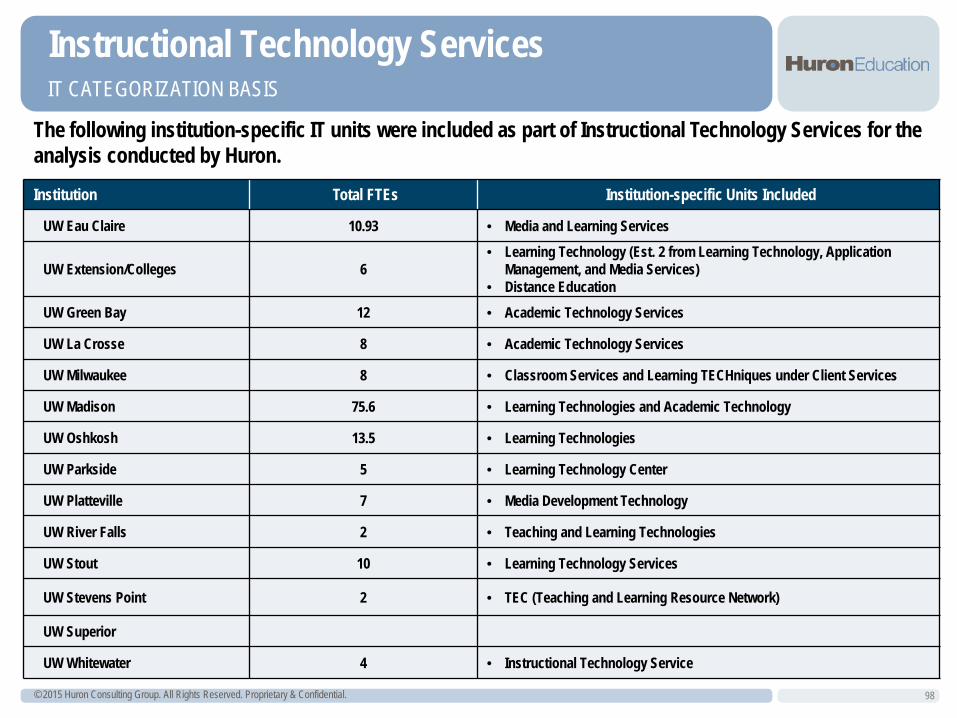
© 2015 Huron Consulting Group. All Rights Reserved. Proprietary & Confidential.
Instructional Technology Services IT CATEGORIZATION BASIS
The following institution-specific IT units were included as part of Instructional Technology Services for the analysis conducted by Huron.
98
Institution Total FTEs Institution-specific Units Included
UW Eau Claire 10.93 • Media and Learning Services
UW Extension/Colleges 6 • Learning Technology (Est. 2 from Learning Technology, Application
Management, and Media Services) • Distance Education
UW Green Bay 12 • Academic Technology Services
UW La Crosse 8 • Academic Technology Services
UW Milwaukee 8 • Classroom Services and Learning TECHniques under Client Services
UW Madison 75.6 • Learning Technologies and Academic Technology
UW Oshkosh 13.5 • Learning Technologies
UW Parkside 5 • Learning Technology Center
UW Platteville 7 • Media Development Technology
UW River Falls 2 • Teaching and Learning Technologies
UW Stout 10 • Learning Technology Services
UW Stevens Point 2 • TEC (Teaching and Learning Resource Network)
UW Superior
UW Whitewater 4 • Instructional Technology Service
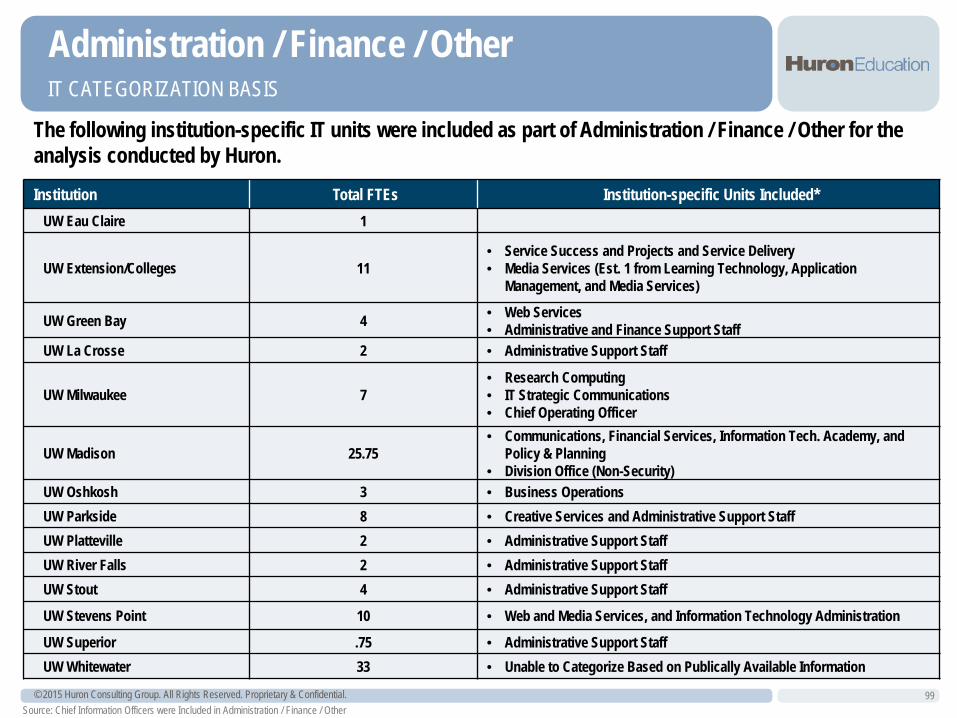
© 2015 Huron Consulting Group. All Rights Reserved. Proprietary & Confidential.
Administration / Finance / Other IT CATEGORIZATION BASIS
The following institution-specific IT units were included as part of Administration / Finance / Other for the analysis conducted by Huron.
99
Institution Total FTEs Institution-specific Units Included* UW Eau Claire 1
UW Extension/Colleges 11 • Service Success and Projects and Service Delivery • Media Services (Est. 1 from Learning Technology, Application
Management, and Media Services)
UW Green Bay 4 • Web Services • Administrative and Finance Support Staff
UW La Crosse 2 • Administrative Support Staff
UW Milwaukee 7 • Research Computing • IT Strategic Communications • Chief Operating Officer
UW Madison 25.75 • Communications, Financial Services, Information Tech. Academy, and
Policy & Planning • Division Office (Non-Security)
UW Oshkosh 3 • Business Operations UW Parkside 8 • Creative Services and Administrative Support Staff UW Platteville 2 • Administrative Support Staff UW River Falls 2 • Administrative Support Staff UW Stout 4 • Administrative Support Staff
UW Stevens Point 10 • Web and Media Services, and Information Technology Administration
UW Superior .75 • Administrative Support Staff UW Whitewater 33 • Unable to Categorize Based on Publically Available Information
Source: Chief Information Officers were Included in Administration / Finance / Other