Embed Size (px)
Citation preview
Inheritance of Cow Durability for Linear Type Traits1
DEVAN C. FUNK2 and L. B. HANSENDepartment of Animal Science
UnIversity of MinnesotaSt Paul 55108
DENNIS A. FUNK3Holstein Association
Brattleboro, VT 05301
ABSTRACT
Final score and 14 linear type traitsfrom appraisal by the Holstein Association were analyzed to assess inheritanceof cow durability. Change of type scoresfrom first to second parity (second minusfirst) was cow durability. Score for firstparity, change of score from ftrst to second parity, and FCM were simultaneously evaluated with a multiple-traitmixed model for each type trait. Firstanalysis did not allow missing scores ofcows for second parity, but subsequentanalysis permitted missing data for second parity. When cows were required tohave type scores for second parity, heritabilities for change of score were fromzero (rear legs and foot angle) to 6%(floal score). Genetic correlations of FCMand change of score were from -.35(romp angle) to .24 (stature). When cowswere not required to have type scoresfrom second lactation, heritabilities forchange of score were less than 8% for alltraits except udder depth (17%). Exceptfor dairy form and fore udder attachment,all genetic correlations of type scoresfrom ftrst lactation and change of scorewere positive. Seemingly, little newknowledge of linear type traits for rank-
Received June 20, 1990.Accepted December 18. 1990.lContribution Number 18,304 of the Minnesota Agri
cultural Experiment Station based on research supported bythe Station and by a grant from the Holstein Association,Bmttleboro, VT.
2Present address: Tri-State Breeders Cooperative, Bamboo~ WI 53913.
Present address: University of Wisconsin, Departmentof Dairy Science, Madison 53706.
ing of sires was provided by appraisal ofcows after first parity.(Key words: type, durability, genetics)
Abbreviation key: HA = Holstein Association,PDT = Predicted Difference type, STA = standard transmitting ability.
INTRODUCTION
The Holstein Association (HA) began routinely scoring cows with a linear system as partof its herd appraisal program on January 1,1983 (9). Linear type traits are scored from onebiological extreme to another using a continuous scale from 1 to 50 points. Herds are routinely appraised by HA at 7-mo intervals. andcows often are reappraised, but dairy producersare permitted to skip scheduled appraisals on awhole-herd basis. Type scores of cows are summarized biannually for sire evaluations. Siresummaries provide PO type (PDT) for floalscore (recently renamed predicted transmittingability [PfA] type) and standard transmittingability (STA) for linear type traits.
Since July 1987, appraisals closest to 30 moof age have been used for sire evaluation tominimize the opportunity for culling bias and tofacilitate uniform comparisons (10). However,elimination of appraisals from older cows mayreduce the expression of cow durability in thesire ev;l1uations.
Smith and Allaire (16) deftned cow durability in two ways: 1) resistance to degenerationand 2) lack of aging. Regardless of deftnition,deterioration over time is implied. Stress ofhigh production apparently causes cows to age,or wear out, more quickly. Improving resistance to degeneration and reducing involuntaryculling could increase dairy proftts (3, 18).
Low production was the major reason fordisposal during first lactation for Burnside and
1991 J Dairy Sci 74:1753-1759 1753
1754
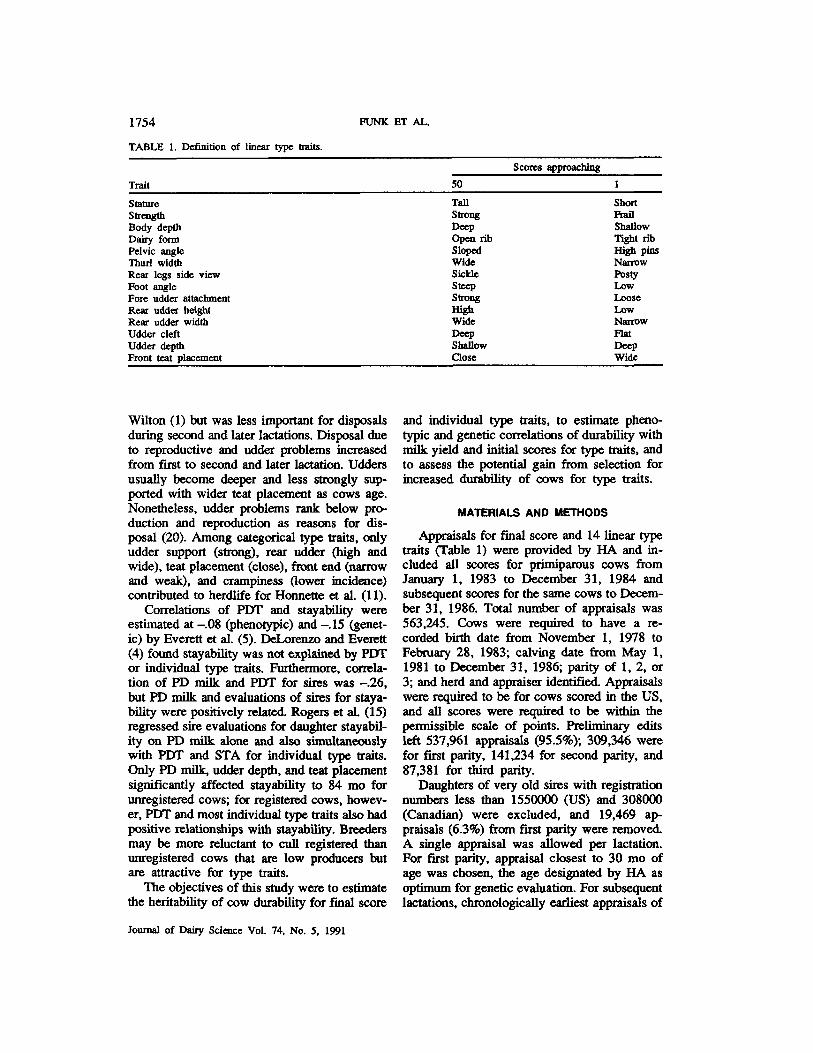
TABLE 1. Defmition of linear type traits.
Trait
StatureStrengthBody depthDairy formPelvic angleThud widthRear legs side viewFoot angleFore udder attachmentRear udder heightRear udder widthUdder cleftUdder depthFront teat placement
FUNK ET AL.
50
TallStrongDeepOpen ribSlopedWideSicldeSteepStrongHighWideDeepShallowClose
Scores approaching
ShortFrailShallowTight ribHigh pinsNarrowPastyLowLooseLowNarrowFIatDeepWide
Wilton (1) but was less important for disposalsduring second and later lactations. Disposal dueto reproductive and udder problems increasedfrom first to second and later lactation. Uddersusually become deeper and less strongly supported with wider teat placement as cows age.Nonetheless, udder problems rank below production and reproduction as reasons for disposal (20). Among categorical type traits, onlyudder support (strong), rear udder (high andwide), teat placement (close), front end (narrowand weak), and crampiness (lower incidence)contributed to herdlife for Honnette et al. (11).
Correlations of PDT and stayability wereestimated at -.08 (phenotypic) and -.15 (genetic) by Everett et al. (5). DeLorenzo and Everett(4) found stayability was not explained by PDTor individual type traits. Furthermore, correlation of PD milk and PDT for sires was -.26,but PD milk and evaluations of sires for stayability were positively related. Rogers et al. (15)regressed sire evaluations for daughter stayability on PD milk alone and also simultaneouslywith PDT and STA for individual type traits.Only PD milk, udder depth, and teat placementsignificantly affected stayability to 84 mo forunregistered cows; for registered cows, however, PDT and most individual type traits also hadpositive relationships with stayability. Breedersmay be more reluctant to cull registered thanunregistered cows that are low producers butare attractive for type traits.
The objectives of this study were to estimatethe heritability of cow durability for final score
lournal of Dairy Science Vol. 74, No.5. 1991
and individual type traits, to estimate phenotypic and genetic correlations of durability withmilk yield and initial scores for type traits, andto assess the potential gain from selection forincreased durability of cows for type traits.
MATERIALS AND METHODS
Appraisals for final score and 14 linear typetraits (Table 1) were provided by HA and included all scores for primiparous cows fromJanuary 1. 1983 to December 31, 1984 andsubsequent scores for the same cows to December 31. 1986. Total number of appraisals was563,245. Cows were required to have a recorded birth date from November I, 1978 toFebruary 28, 1983; calving date from May I,1981 to December 31, 1986; parity of 1, 2, or3; and herd and appraiser identified. Appraisalswere required to be for cows scored in the US,and all scores were required to be within thepermissible scale of points. Preliminary editsleft 537,961 appraisals (95.5%); 309,346 werefor first parity, 141,234 for second parity, and87,381 for third parity.
Daughters of very old sires with registrationnumbers less than ooסס155 (US) and 308000(Canadian) were excluded, and 19,469 appraisals (6.3%) from first parity were removed.A single appraisal was allowed per lactation.For first parity, appraisal closest to 30 mo ofage was chosen, the age designated by HA asoptimum for genetic evaluation. For subsequentlactations, chronologically earliest appraisals of
INHERITANCE OF COW DURABILI'IY FOR TYPE 1755
cows were retained because cows were morelikely to be lactating than dry. Appraisals forsecond and third parity of cows were requiredto be from the same herd as first parity, becausemerchandised cows were more likely to havereceived preferential care. In total, 22,330 appraisals (7.7%) for first parity were eliminatedbecause of multiple appraisals or change ofherd. Single appraisals of 267,547 cows forfirst parity remained. Furthermore, cows wererequired to be daughters of sires with at least20 primiparous daughters in 5 or more herds.This edit was designed to eliminate daughtersof natural service sires; 211,719 daughters of1088 sires remained.
Only 14% of primiparous cows were unregistered (29,377 of 211,719), but, more importantly, only 8% of unregistered cows wererescored in second lactation (2277 of 29,377)versus 50% for registered cows (92,049 of182,342). A majority of unregistered cows arescored simply for the Sire Evaluation for Typeprogram of HA, which facilitates early estimation of PDT for progeny-tested sires; therefore,few unregistered cows are rescored. Dairyproducers are required to reappraise all registered cows if the herd is appraised again, butreappraisal of unregistered cows is optional.Among unregistered cows, therefore, only thosewith potential for improved scores are likely tobe reappraised. Because of low nwnbers ofunregistered cows (14% for first parity) andopportunity for bias when dairy producerschoose cows to reappraise, all unregisteredcows were removed from the study.
Cows with extremely low final scores werereassigned scores, as is routinely done by HAbecause of a skewed distribution for originalscores. Final scores were reassigned: 50 to 65;51,52,53,54, and 55 to 66; 56, 57, 58, 59, and60 to 67; 61 and 62 to 68; 63 and 64 to 69; 65and 66 to 70; 67 and 68 to 71; 69 and 70 to 72;71 and 72 to 73; and 73 to 74. Scores for alltraits were preadjusted for effects of age andstage of lactation at time of appraisal withmultiplicative factors (6).
Analysis was with multiple-trait mixedmodels that had three dependent variables of 1)score from first parity for a type trait, 2) changeof score from first to second parity (secondscore minus first score) for the same type trait,and 3) FCM with a 3.7% base for fat. Independent variables were fixed effect of herd ap-
praisal (absorbed) and random effect of sire.Fitting of herd appraisals accounted for effectsof herd, year, season, appraiser, and all theirinteractions. A multiple-trait REML program ofVanRaden (19) considered genetic relationshipsamong sires (7) but did not permit missingsecond appraisals of cows, which may haveintroduced culling bias.
Data were further reduced to facilitate themultiple-trait method of analysis. Cows wererequired to have 305-<1 lactation, twice dailymilking, mature equivalent milk and fatrecords, which were obtained from the AnimalImprovement Program Laboratory, USDA,Beltsville, MD to calculate FCM. Only data forcows with a second appraisal during secondlactation were retained because few cows hadan appraisal for third but not second parity.Furthermore, only cows from herd appraisalswith at least 10 primiparous cows were included in the study to improve precision ofestimation, and sires again were required tohave 20 daughters in 5 herds. For analyses ofdata that included cows with first and secondappraisals, reduced data were 30,730 cows by196 sires (plus 40 male ancestors) in 2003 herdappraisals.
Concern of selection bias is diminished asmore information affecting selection (multipletraits and genetic relationships) is included instatistical models (8, 13). All cows that wereprovided for the study were appraised duringfirst lactation and most had a record of FCM,but 50% were not appraised during secondlactation. A multiple-trait program of Valente(17) based on methods of Meyer (14) accommodated analysis of cows with missing secondappraisals and was used for nwnerous subsetsof the data, but computational costs were excessive. Ultimately, only 20 herd appraisals (3from California, 5 from New York, 5 fromTexas, and 7 from Wisconsin) were analyzed.Within each state, the herd appraisals selectedwere those with most cows appraised for second parity. Additionally, edits required cows tohave a record of FCM and sires to have at least20 daughters in 5 or more herds. The requirements placed on the data were exceedinglyrestrictive and only 743 daughters (499 withsecond appraisals) of 20 sires (plus 9 maleancestors) were analyzed.
For analysis with the VanRaden program(19), convergence was assumed when genetic
Journal of Dairy Science Vol. 74, No.5, 1991
1756 FUNK ET AL.
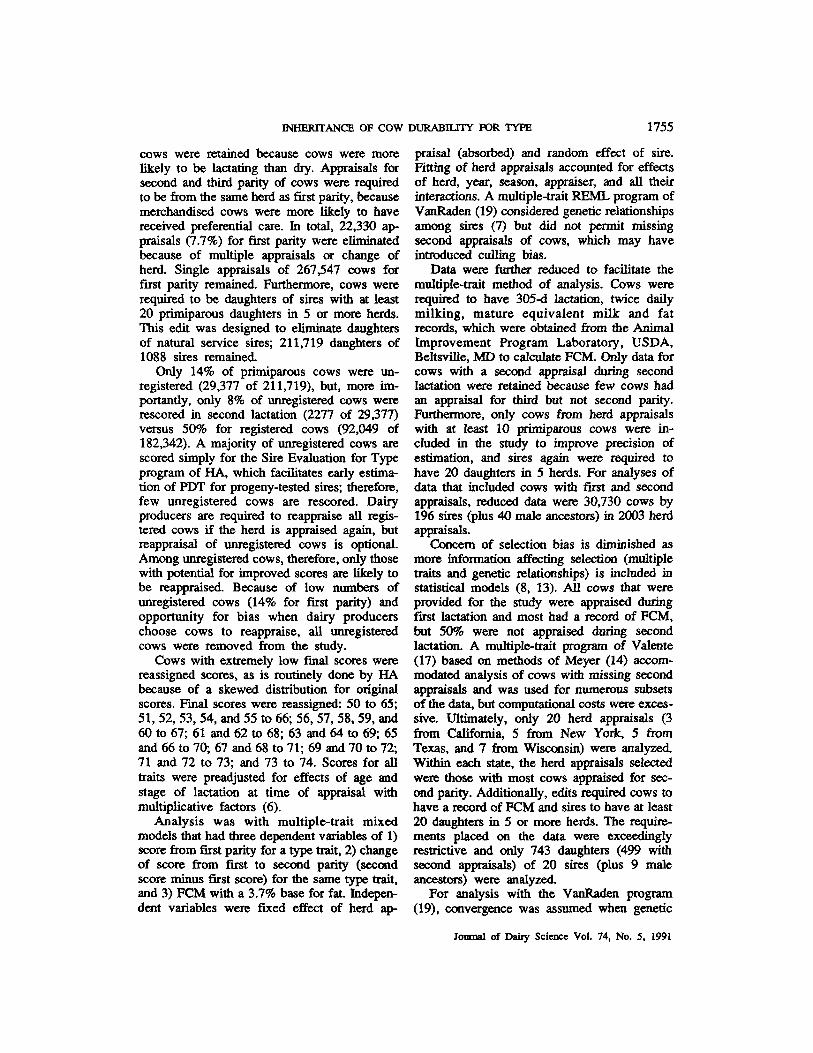
TABLE 2. Heritability of linear type traits for score fromfiIst parity and change of score from first to second paritywith equal number of traits for cows.!
variances changed no more than .001 timesprevious estimate and genetic correlationschanged no more than .001. Criterion for convergence with the Valente program (17) was
TIllitFirstscore2
Changeof score3
for all i and j where t is element i, j of T. thesire (co)variance matrix for iteration n.
RESULTS AND DISCUSSION
Equal Number of Dependent Variables
Table 2 has estimates of heritability for theanalysis requiring all three dependent variables(multiple traits) for cows. Heritabilities for firstparity (fIrst score) were near estimates for HAtype traits reported by Lawstuen et al. (12).Two type traits had lower estimates. bodydepth (.01 lower) and dairy form (.07 lower),but all other type traits had estimates that wereslightly higher (.01 to .08) than those ofLawstuen et al. (12). Stature (43%) and bodydepth (34%) had highest heritabilities, and footangle (14%) and udder cleft (14%) had lowestestimates. Fat-corrected milk: was simultaneously analyzed as a multiple trait for each typetrait. and heritabilities for FCM were uniformly28 or 29%.
Heritability for change of score from first tosecond parity (Table 2) was greater than 2% foronly fInal score (6%). Remarkably. all six udder traits uniformly had heritability of 2% forchange of score. all six traits describing bodyform and dimension had heritability of 1%. andboth foot and leg traits had heritability of O.Extremely low estimates of heritability suggested little gain from selection for improvedcow durability as measured by change of scorefrom first to second parity. Final score, essentially a composite trait of the other~ traits.offered somewhat greater potential (h = 6%)as a selection criterion. Of course, estimates inTable 2 may be biased by preferential cullingof cows between appraisals for first and secondparity. Heritability for change of score is dependent on the genetic and phenotypic correlations between the traits themselves. Our resultssuggest that the genetic correlations betweentraits in fIrst and second parity were very high,
Journal of Dairy Science Vol. 74, No.5, 1991
Final score 28.06Stature .43 .01StreD8th 2S .01Body depth .34 .01Dairy form 26 .01Pelvic angle .30 .01Thurl width .31 .01Rear legs side view .17 .00Foot lUIg1e .14.00Fore udder altaclnnent: 22 .02Rear udder height 22 .02Rear udder width .17 .02Udder cleft .14.02Udder depth 27 .02Front teat placmlent 21 .02
IHeritability of FCM was 28 or 29 with approximateSE of .04 for all analyses.
2Range of approximate SE for estimates was .024 to.052.
~e of approximate SE for estimates was .004 to.009 for all traits except final score (.014).
and this was expected because the intracowrepeatability of fInal score is about .75 (10).
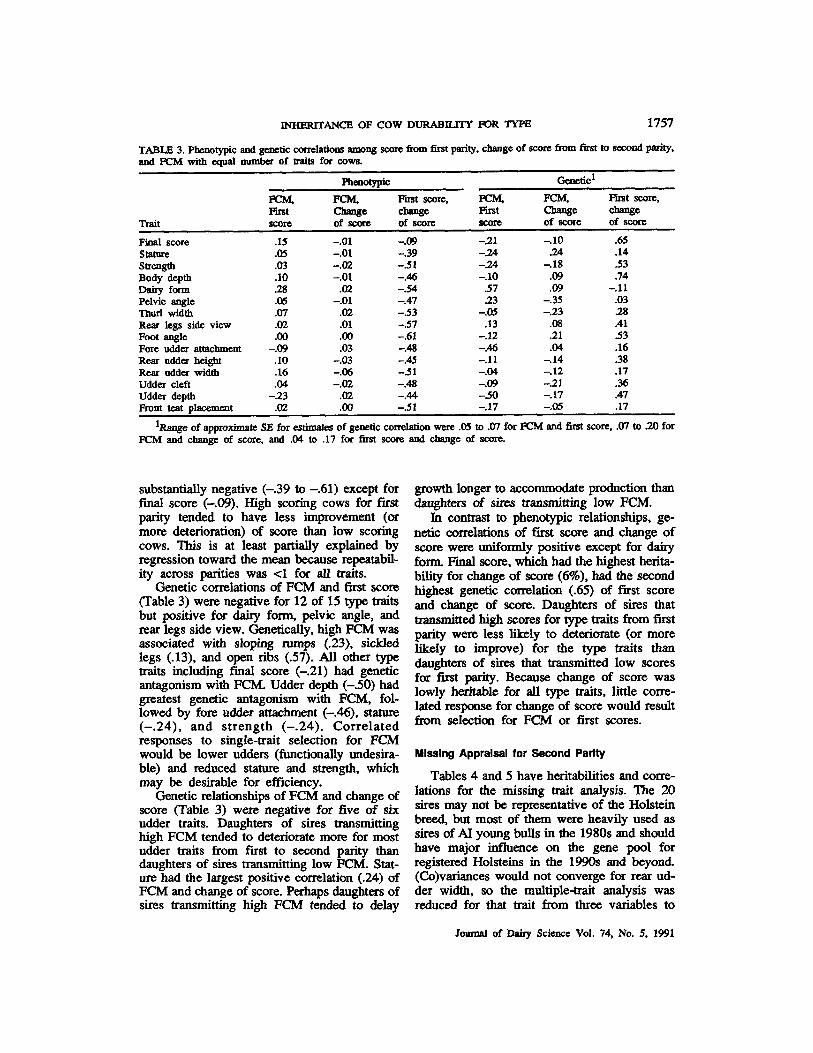
Correlations of first score, change of score,and FCM are in Table 3. Phenotypic correlations of FCM and first score were positive forall type traits except fore udder attachment(-.09) and udder depth (-.23). Highly productive cows tended to have looser fore udderattachments and deeper udders. Phenotypic correlation of FCM and first score for fInal scorewas positive (.15) and in disagreement withearlier studies that had negative estimates ofphenotypic correlation (-.26 and -.28) for milk:yield and fInal score (2, 5). As time has passed.HA may have placed greater emphasis on evidence of high production when assigning fInalscore to cows. Dairy form had the greatestrelationship with FCM (.28).
Phenotypic correlations of FCM and changeof score (Table 3) were near 0 for all typetraits. Only rear udder width had a phenotypiccorrelation (-.06) that departed more than .03from O. Apparently, yield of FCM had littleinfluence on change of scores from first tosecond parity. Phenotypic correlations of fIrstscore and change of score, however, were all
INHE.IUTANCE OF COW DURABILITY FOR TYPE 1757
TABLE 3. Phenotypic and genetic correlations among score from first parity, change of score from first to second parity,and FCM with equaI number of IrlIits for cows.
Phenotypic
Trait
R:M,Firstscore
PCM,Changeof score
First score,cbangeof score
FCM,Firstscore
PCM,Changeof score
F'ust score,chaDgeof score
Final score .15 -.01 -.09 -.21 -.10 .65Stature .05 -.01 -.39 -.24 .24 .14Strength .03 -.02 -.51 -.24 -.18 .53Body depth .10 -.01 -.46 -.10 .09 .74Dairy form .28.02 -.54 .57 .09 -.11Pelvic angle .05 -.01 -.47 .23 -.35 .031burI width ,(17.02 -.53 -.05 -.23 .28Rear legs side view .02 .01 -.57 .13 .08 .41Foot angle .00.00 -.61 -.12 .21 .53Fore udder attachment -.09 .03 -.48 -.46 .04 .16Rear udder height .10 -.03 -.45 -.11 -.14 .38Rear udder width .16 -.06 -.51 -.04 -.12 .17Udder cleft .04 -.02 -.48 -.09 -.21 .36Udder depth -.23 .02 -.44 -.50 -.17 .47Front teat placement .02 .00 -.51 -.17 -.05 .17
lRange of approximate SE for estimates of genetic correlation were .05 to .07 for PCM and first score, .07 to .20 forFCM and cbange of score, and .04 to .17 for first score and chaDge of score.
substantially negative (-.39 to -.61) except forfinal score (-.09). High scoring cows for firstparity tended to have less improvement (ormore deterioration) of score than low scoringcows. This is at least partially explained byregression toward the mean because repeatabil.ity across parities was <1 for all traits.
Genetic correlations of FCM and first score(fable 3) were negative for 12 of 15 type traitsbut positive for dairy form, pelvic angle, andrear legs side view. Genetically, high FCM wasassociated with sloping rumps (.23), sickledlegs (.13), and open ribs (.57). All other typetraits including final score (-.21) had geneticantagonism with FCM Udder depth (-.50) hadgreatest genetic antagonism with FCM, followed by fore uddee attachment (-.46), stature(-.24), and strength (-.24). Correlatedresponses to single-trait selection foe FCMwould be lower udders (functionally oodesirable) and reduced stature and strength, whichmay be desirable foe efficiency.
Genetic relationships of FCM and change ofscore (Table 3) were negative foe five of sixudder traits. Daughters of sires transmittinghigh FCM tended to deteriorate more for mostudder traits from first to second parity thandaughters of sires transmitting low FCM. Stature had the largest positive correlation (.24) ofFCM and change of score. Perhaps daughters ofsires transmitting high FCM tended to delay
growth longer to acconunodate production thandaughters of sires transmitting low FCM
In contrast to phenotypic relationships, genetic correlations of first score and change ofscore were uniformly positive except for dairyform. Fmal score, which had the highest heritability for change of score (6%), had the secondhighest genetic correlation (.65) of first scoreand change of score. Daughters of sires thattransmitted high scores for type traits from firstparity were less likely to deteriorate (or morelikely to improve) for the type traits thandaughters of sires that transmitted low scoresfor first parity. Because change of score waslowly heritable for all type traits, little correlated response for change of score would resultfrom selection for FCM or first scores.
Missing Appraisal for Second Parity
Tables 4 and 5 have heritabilities and correlations for the missing trait analysis. The 20sires may not be representative of the Holsteinbreed, but most of them were heavily used assires of AI young bulls in the 1980s and shouldhave major influence on the gene pool forregistered Holsteins in the 1990s and beyond.(Co)variances would not converge for rear udder width, so the multiple-trait analysis wasreduced for that trait from three variables to
loumal of Dairy Science Vol. 74, No.5, 1991
1758 FUNK ET AL.
TABLE 4. Heritability of linear type traits for score fromfirst parity and change of score from first to second paritywith unequal number of traits for cows. l
two pairwise analyses of 1) FCM and change ofscore and 2) first score and change of score.
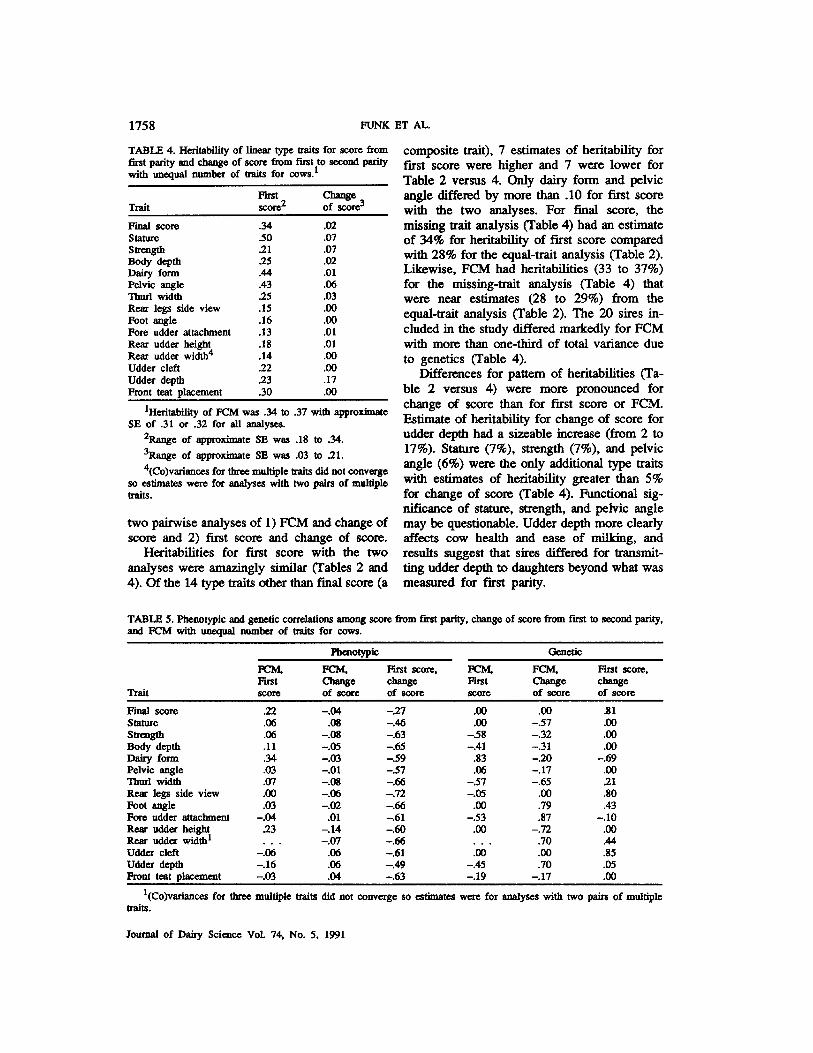
Heritabilities for first score with the twoanalyses were amazingly similar (Tables 2 and4). Of the 14 type traits other than final score (a
1Heritability of FCM was .34 to .37 with approximateSE of .31 or .32 for all analyses.
2Range of approximate SE was .18 to .34.
~e of approximate SE was .03 to .21.
4(Co)variances for three multiple traits did not convergeso estimates were for analyses with two pairs of multipletraits.
Final score .34.02Stature .50 .07Strength .21 .07Body depth .25 .02Dairy form .44 .01Pelvic angle .43 .06Thud width .25 .03Rear legs side view .15 .00Foot angle .16.00Fore udder attachment.13 .01Rear udder height .18 .01Rear udder width4 .14 .00Udder cleft .22.00Udder depth .23 .17Front teat placement .30 .00
composite trait), 7 estimates of heritability forfirst score were higher and 7 were lower forTable 2 versus 4. Only dairy form and pelvicangle differed by more than .10 for first scorewith the two analyses. For final score, themissing trait analysis (Table 4) had an estimateof 34% for heritability of first score comparedwith 28% for the equal-trait analysis (Table 2).Likewise, FCM had heritabilities (33 to 37%)for the missing-trait analysis (Table 4) thatwere near estimates (28 to 29%) from theequal-trait analysis (Table 2). The 20 sires included in the study differed markedly for FCMwith more than one-third of total variance dueto genetics (Table 4).
Differences for pattern of heritabilities (Table 2 versus 4) were more pronounced forchange of score than for first score or FCM.Estimate of heritability for change of score forudder depth had a sizeable increase (from 2 to17%). Stature (7%), strength (7%), and pelvicangle (6%) were the only additional type traitswith estimates of heritability greater than 5%for change of score (Table 4). Functional significance of stature, strength, and pelvic anglemay be questionable. Udder depth more clearlyaffects cow health and ease of milking, andresults suggest that sires differed for transmitting udder depth to daughters beyond what wasmeasured for first parity.
Changeof score3Trait
TABLE 5. Phenotypic and genetic correlations among score from first parity, change of score from first to second parity,and FCM with unequal number of traits for cows.
Phcnotypic Genetic
Trait
FCM,Firstscore
FCM,Changeof score
First score,changeof score
FCM,Firstscore
FCM,Changeof score
First score,changeof score
Final score .22 -.04 -27 .00 .00 .81Stature .06.08 -.46 .00 -.57 .00Strength .06 -.08 -.63 -.58 -.32 .00Body depth .11 -.05 -.65 -.41 -.31 .00Dairy form .34 -.03 -.59 .83 -.20 -.69Pelvic angle .03 -.01 -.57 .06 -.17 .00Thud width .07 -.08 -.66 -.57 -.65 21Rear legs side view .00 -.06 -.72 -.05 .00 .80Foot angle .03 -.02 -.66 .00 .79 .43Fore udder attachment -.04 .01 -.61 -.53 .87 -.10Rear udder hei~ 23 -.14 -.60 .00 -.72 .00Rear udder width1 -.07 -.66 .70.44Udder cleft -.06 .06 -.61 .00 .00 .85Udder depth -.16 .06 -.49 -.45 .70 .05Front teat placement -.03 .04 -.63 -.19 -.17 .00
l(CO)variances for three multiple traits did not converge so estimates were for analyses with two pairs of multipletraits.
Iournal of Dairy Science VoL 74, No.5, 1991
INHERITANCE OF COW DURABILITY FOR TYPE 1759
Phenotypic correlations of FCM and firstscore had similar estimates for the two analyses(Tables 3 and 5) with antagonism of FCM andsome udder traits. Estimates of phenotypic correlation for FCM and change of score tended todepart more from 0 in Table 5 than in Table 3.
Genetically, udder depth (-.45), fore udderattachment (-.53), and strength (-.58) again hadsubstantial antagonism for FCM and first score(Table 5), but thur! width (-.57) and bodydepth (-.41) also had much antagonism forFCM and first score with the missing-trait analysis. Estimates of genetic correlation for firstscore and change of score again were positive(Table 5) with only two exceptions, dairy formand fore udder attachment.
For FCM and change of score, genetic correlations noticeably differed for the two analyses(Tables 3 and 5). Correlations with most positive estimates were fore udder attachment (.87),foot angle (.79), rear udder width (.70), andudder depth (.70). Sires that transmitted highestFCM also tended to transmit most change ofscore (more improvement or less deterioration)for the four traits. Conversely, the most negative correlations were for rear udder height(-.72), thur! width (-.65), and stature (-.57)with less change (less improvement or moredeterioration) associated with high FCM.
CONCLUSIONS
Some udder traits, such as udder depth, haveeconomic importance and, for change of score,have a small to modest inheritance (2 to 17%).Little gain could be anticipated from selectionfor cow durability (measured as change of scorefrom first to second parity). Selection for typetraits for first parity likely encompasses mostconformational contributions to durability ofcows. Cows that have type deficiencies thatlimit herdlife are likely to receive low scoresfor those type traits during first parity andreappraisal would add little new knowledge ofdurability.
ACKNOWLEDGMENTS
This study was supported by a grant fromthe Holstein-Friesian Association of America,Brattleboro, VT.
REFERENCES
1 Burnside, E. B., and I. W. Wilton. 1970. Anatomicaltraits as they relate to productive utility. 1. Dairy Sci.53:837.
2 Carter, H. W. 1968. Percentage of sire's daughtershaving a second, fourtb, and sixth lactation. 1. DairySci. 51:312.
3 Congleton, W. R., 1r., and L. W. King. 1984. Profitability of daiJy cow herd life. 1. Dairy Sci. 67:661.
4 De Lorenzo, M. A., and R. W. Everett. 1982. Relationships between milk and fat production, type, and stayability in Holstein sire evaluation. 1. Dairy Sci. 65:1277.
5 Everett, R. W., J. F. Keown, and E. E. Clapp. 1976.Relationships among type, production, and stayabilityin Holstein cattle. 1. Dairy Sci. 59:1505.
6 Funk, D. C., L. B. Hansen, and D. A. Punk. 1991.Adjustment of linear type scores from Holstein classification for age and stage of lactation. 1. Dairy Sci. 74:645.
7 Henderson, C. R. 1975. Inverse of a matrix of relationships due to sires and matemaI grandsires.1. Dairy Sci.58:1917.
8 Henderson, C. R. 1984. Estimation of variances andcovariances under multiple trait models. I. Dairy Sci.67:1581.
9 Holstein Association. 1984. Linear classification manual Holstein-Friesian Assoc. Am., Brattleboro, vr.
10 Holstein Association. 1986. Winter forum manual.Holstein-Friesian Assoc. Am, Brattleboro, vr.
II HOIIIICtte, J. E., W. E. Vinson, 1. M. White, and R. H.Kliewer. 1980. Contribution of descriptively codedtype tIaits to longevity of Holstein cows. 1. Dairy Sci.63:807.
12 Lawstuen, D. A., L. B. Hansen, and L. P. 1ohnson.1987. Inheritance and relationships of linear type traitsfor age groups of Holsteins. 1. Dairy Sci. 70:1027.
13 Meyer, K., and R. Thompson. 1984. Bias in varianceand covariance component estimators due to selectionon a corre1ated trait. Z. Tierz. ZuechtuDgsbiol. 101:33.
14 Meyer, K. 1986. Between algorithms: a "short cut"restricted maximum likelihood procedure to estimatevariance components. 1. Dairy Sci. 69:1904.
15 Rogers, G. W., B. T. McDaniel, M. R. Dentine, and L.P. Jobnson. 1988. Relationships among survival rates,predicted differences for yield, and linear type tIaits. J.Dairy Sci. 71:214.
16 Smith, S. P., and P. R. Allaire. 1985. Durability oftraits: nonlinear association between initial and subsequent measures. 1. Dairy Sci. 68:939.
17 Valente, 1. 1988. Multiple trait v~variancecomponent estimation procedures with missing information for some traits. Ph.D. Diss., Iowa State Univ.,Ames.
18 Van Arendonk, JAM. 1985. Studies on the replacement policies in daiJy cattle. n. Optimum policy andiDfluences of changes in production and prices. Livest.Prod. Sci. 13:101.
19 VanRaden, P. M. 1986. Computational strategies forestimation of variance components. Ph.D. Diss., IowaState Univ., Ames.
20 Van Vleck, L. D., and H. D. Norman. 1972. Association of type traits with reasons for disposal. I. DairySci. 55:1698.
Joumal of Dairy Science Vol. 74, No.5, 1991


![Christopher paolini [inheritance cycle 04] - inheritance (pdf)](https://img.pdfslide.net/doc/110x75/554f25d2b4c905723a8b52b8/christopher-paolini-inheritance-cycle-04-inheritance-pdf.jpg)


