Embed Size (px)
Citation preview
1
Initial Public Offerings: Updated Statistics
Jay R. Ritter Cordell Professor of Finance
University of Florida 352.846-2837 voice
March 8, 2016
Table 1: Mean First-day Returns and Money Left on the Table, 1980-2015 Table 1a: Also including the post-issue aggregate market value Table 2: Mean First-day Returns, Categorized by Sales, for IPOs from 1980-2015 Figure 1: First-day Turnover Categorized by Decade and First-Day Return, 1983-2015 Table 3: First-day Turnover Categorized by Decade and First-Day Return, 1983-2015 Table 3b: First-day Turnover Categorized by NYSE and Nasdaq Listings, 1983-2015 Table 4: Median Age and Fraction of IPOs with VC- and Buyout-backing, 1980-2015 Table 4a: Median Price-to sales Ratios of Tech-stock IPOs, 1980-2015 Table 4b: Profitability and Median Sales of Technology and Biotech IPOs, 1980-2015 Table 4c: The number of VC-, Growth Capital-, and Buyout-backed IPOs, 1980-2015 Table 4d: VC-backed IPOs, restricted to those headquartered in the U.S., 1980-2015 Table 4e: Post-issue market value of tech stock IPOs Table 5: Number of U. S. IPOs with an offer price of greater than $5.00 that doubled (offer to close) in price on the first day of trading, 1997-2015 Table 6: Number of Initial Public Offerings, First-Day Return, and Revisions from the File Price Range by Cohort Year, 1990-2015 Table 7: Percentage of IPOs Relative to File Price Range, 1980-2015 Table 8: Number of Offerings, Average First-day Returns, and Gross Proceeds of Initial Public Offerings in 1960-2015, by Year Table 9: Fraction of IPOs with Negative Earnings, 1980-2015 Table 10: Gross Spreads Continue to Remain at 7% on Moderate-Size Deals Table 11: Mean and Median Gross Spreads and Number of Managing Underwriters, 1980-2015 Table 11a: Mean and Median Gross Spreads (Equally Weighted and Proceeds-Weighted), 1975-2015 Table 12: Number of IPOs Categorized by the LTM Sales Over/Under $50 million (2005 $), 1980-2015 Table 12a: Median Market Cap and Pre-IPO Sales (2005 $), and Median Price-to-sales ratio, 1980-2015 Table 12b: Number of IPOs Categorized by the LTM Sales Over/Under $1 billion (2011 $), 1980-2015 Table 13: IPO Auctions in the U.S., 1999-2015 Table 14: The Market Share of Foreign Companies Among U.S. Listings, 1980-2015 Table 15: How Many IPOs are There? 1980-2015 Table 15a: Closed-end Funds, REITs, and SPACs, and IPO Volume and Average First-day Returns with Banks, LPs, and ADRs Included Table 16: Long-run Returns on IPOs Categorized by the Pre-issue Sales of the Firm, 1980-2014 Table 16a: Long-run Returns on IPOs Categorized by $1 Billion Sales of the Firm, 1980-2014 Table 17: Long-run Returns on IPOs Categorized by VC-backing or Buyout Fund-backing Table 17a: Long-run Returns on IPOs Categorized by VC-, Growth Capital-, or Buyout Fund-backing Table 18: Long-run Returns on IPOs Categorized by VC-backing, by Subperiod Table 19: Table I of Ritter and Welch 2002 Journal of Finance article: Number of IPOs, First-day Returns, and Long Run Performance, 1980 to 2014 (returns through Dec. 2015) Table 20: Returns by Event Year for the First Five Years after the IPO for IPOs from 1980-2014 Table 21: Mean and Median Public Float, 1980-2015 Figure 2: Fraction of IPOs with Negative EPS and Fraction of Tech Stocks, 1980-2015 Figure 3: Mean and Median Public Float, 1980-2015 Figure 4: Average First-day Return and Aggregate Amount of Money Left on the Table, 1990-2015 Figure 5: Number of IPOs and Average First-day Return, 1980-2015 Figure 6: Number and Percentage of Chinese IPOs, 1988-2015
2
Only 117 operating companies went public in the U.S. in 2015, excluding ADRs, natural resource limited partnerships and trusts, closed-end funds, REITs, SPACs, banks and S&Ls, unit offers, penny stocks (offer price of less than $5 per share), and stocks not listed on Nasdaq or the NYSE (including NYSE MKT LLC, the former American Stock Exchange). Of these 117 operating companies, 103 were from the U.S. A higher volume figure has been reported in many sources (177 counting all offerings), but the higher numbers typically include not only operating companies (mostly domestic), but also some companies that were already traded in other countries and are thus actually follow-on offerings, banks and S&Ls (7 offerings, most of which are mutual conversions with depositors buying the stock), oil & gas partnerships or unit trusts (9 offerings), ADRs (8 offerings), REITs (7 offerings), special purpose acquisition companies (SPACs, 18 offerings), closed-end funds, including business development companies (8 offerings), other unit offerings (1 offering), IPOs that do not trade on the NYSE (including NYSE MKT) or Nasdaq (1 offering), and IPOs with an offer price below $5.00 (1 offering). Some of the IPOs could be excluded from the 177 count for more than one reason. There are also several bulletin board-traded issues that I (and Dealogic) classify as follow-ons, and thus don’t count, but which Thomson-Reuters classifies as IPOs. Note: Some of the tables may have slightly different counts for the number of IPOs in some years. These inconsistencies are because I periodically add or delete a company that had been misclassified or find some missing data. I do not immediately update every table. I rely on data from Thomson Reuters (SDC) and Dealogic, but also use information from IPOScoop.com and Renaissance Capital and the prospectuses, and other sources. For IPOs from June 1996 and later, the prospectuses (S.E.C. form 424B) are available on EDGAR. For IPOs from 1975-1996 (the pre-EDGAR days), I have most of the original paper prospectuses courtesy of Graeme Howard and Todd Huxster. For foreign IPOs from 1996-2000, the S.E.C. did not require electronic filing, so they are not available on EDGAR, but I have the paper copies for many of them. In November 2013 I stopped at the Stanford Business School library, which has a microfiche collection of prospectuses of deals from the 1980s, and filled in the missing numbers for pre-IPO sales, earnings per share, and founding dates for a handful of “problem children” for which I did not have the numbers. The tables reflect the fact that I now have complete information on these variables for all but one of the 8,178 IPOs from 1980-2015. In March 2014, Jack Cooney alerted me to several misclassifications, and the tables below have been corrected to reflect the changes that were made. In almost all of my tables, I use a more conservative definition of what is an IPO than most other data providers. Partly, the definition that is appropriate depends upon what one is focusing on. From an underwriter’s point of view, anything that generates fees is relevant, including closed-end funds, REITs, and SPACs. I exclude these, as well as penny stocks, banks and S&Ls (mainly conversions of mutual to stock companies), ADRs, natural resource LPs, unit offers, penny stocks, small best efforts deals, and stocks that are not listed on the NYSE (including NYSE MKT and its predecessor, the Amex) or Nasdaq. I exclude some of these categories (such as LPs) partly because it is difficult to determine the founding date of the underlying assets, and I do not like to have a different number of firms in different tables. Another motivation is that I am focusing on operating companies that potentially create jobs. Diana Shao assisted me in updating most of the tables to include 2015.
3
Table 1
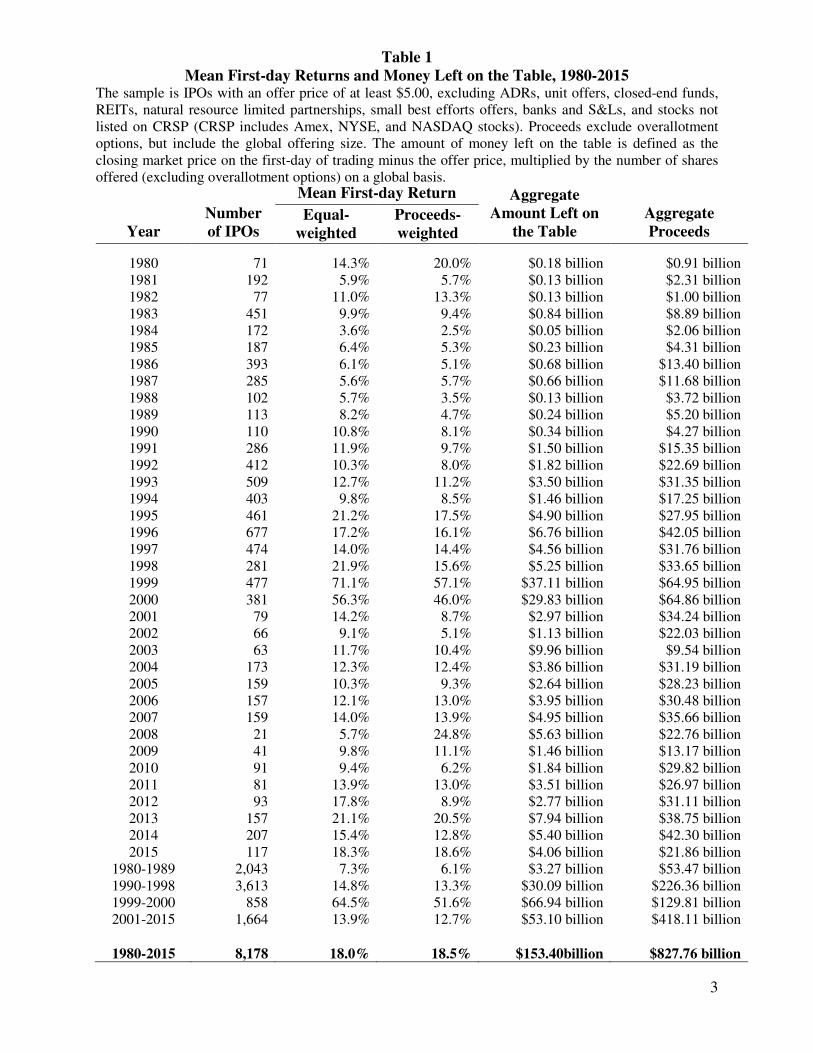
Mean First-day Returns and Money Left on the Table, 1980-2015 The sample is IPOs with an offer price of at least $5.00, excluding ADRs, unit offers, closed-end funds, REITs, natural resource limited partnerships, small best efforts offers, banks and S&Ls, and stocks not listed on CRSP (CRSP includes Amex, NYSE, and NASDAQ stocks). Proceeds exclude overallotment options, but include the global offering size. The amount of money left on the table is defined as the closing market price on the first-day of trading minus the offer price, multiplied by the number of shares offered (excluding overallotment options) on a global basis.
Year
Number of IPOs
Mean First-day Return Aggregate Amount Left on
the Table
Aggregate Proceeds
Equal-weighted
Proceeds-weighted
1980 71 14.3% 20.0% $0.18 billion $0.91 billion 1981 192 5.9% 5.7% $0.13 billion $2.31 billion 1982 77 11.0% 13.3% $0.13 billion $1.00 billion 1983 451 9.9% 9.4% $0.84 billion $8.89 billion 1984 172 3.6% 2.5% $0.05 billion $2.06 billion 1985 187 6.4% 5.3% $0.23 billion $4.31 billion 1986 393 6.1% 5.1% $0.68 billion $13.40 billion 1987 285 5.6% 5.7% $0.66 billion $11.68 billion 1988 102 5.7% 3.5% $0.13 billion $3.72 billion 1989 113 8.2% 4.7% $0.24 billion $5.20 billion 1990 110 10.8% 8.1% $0.34 billion $4.27 billion 1991 286 11.9% 9.7% $1.50 billion $15.35 billion 1992 412 10.3% 8.0% $1.82 billion $22.69 billion 1993 509 12.7% 11.2% $3.50 billion $31.35 billion 1994 403 9.8% 8.5% $1.46 billion $17.25 billion 1995 461 21.2% 17.5% $4.90 billion $27.95 billion 1996 677 17.2% 16.1% $6.76 billion $42.05 billion 1997 474 14.0% 14.4% $4.56 billion $31.76 billion 1998 281 21.9% 15.6% $5.25 billion $33.65 billion 1999 477 71.1% 57.1% $37.11 billion $64.95 billion 2000 381 56.3% 46.0% $29.83 billion $64.86 billion 2001 79 14.2% 8.7% $2.97 billion $34.24 billion 2002 66 9.1% 5.1% $1.13 billion $22.03 billion 2003 63 11.7% 10.4% $9.96 billion $9.54 billion 2004 173 12.3% 12.4% $3.86 billion $31.19 billion 2005 159 10.3% 9.3% $2.64 billion $28.23 billion 2006 157 12.1% 13.0% $3.95 billion $30.48 billion 2007 159 14.0% 13.9% $4.95 billion $35.66 billion 2008 21 5.7% 24.8% $5.63 billion $22.76 billion 2009 41 9.8% 11.1% $1.46 billion $13.17 billion 2010 91 9.4% 6.2% $1.84 billion $29.82 billion 2011 81 13.9% 13.0% $3.51 billion $26.97 billion 2012 93 17.8% 8.9% $2.77 billion $31.11 billion 2013 157 21.1% 20.5% $7.94 billion $38.75 billion 2014 207 15.4% 12.8% $5.40 billion $42.30 billion 2015 117 18.3% 18.6% $4.06 billion $21.86 billion
1980-1989 2,043 7.3% 6.1% $3.27 billion $53.47 billion 1990-1998 3,613 14.8% 13.3% $30.09 billion $226.36 billion 1999-2000 858 64.5% 51.6% $66.94 billion $129.81 billion 2001-2015 1,664 13.9% 12.7% $53.10 billion $418.11 billion
1980-2015 8,178 18.0% 18.5% $153.40billion $827.76 billion
4
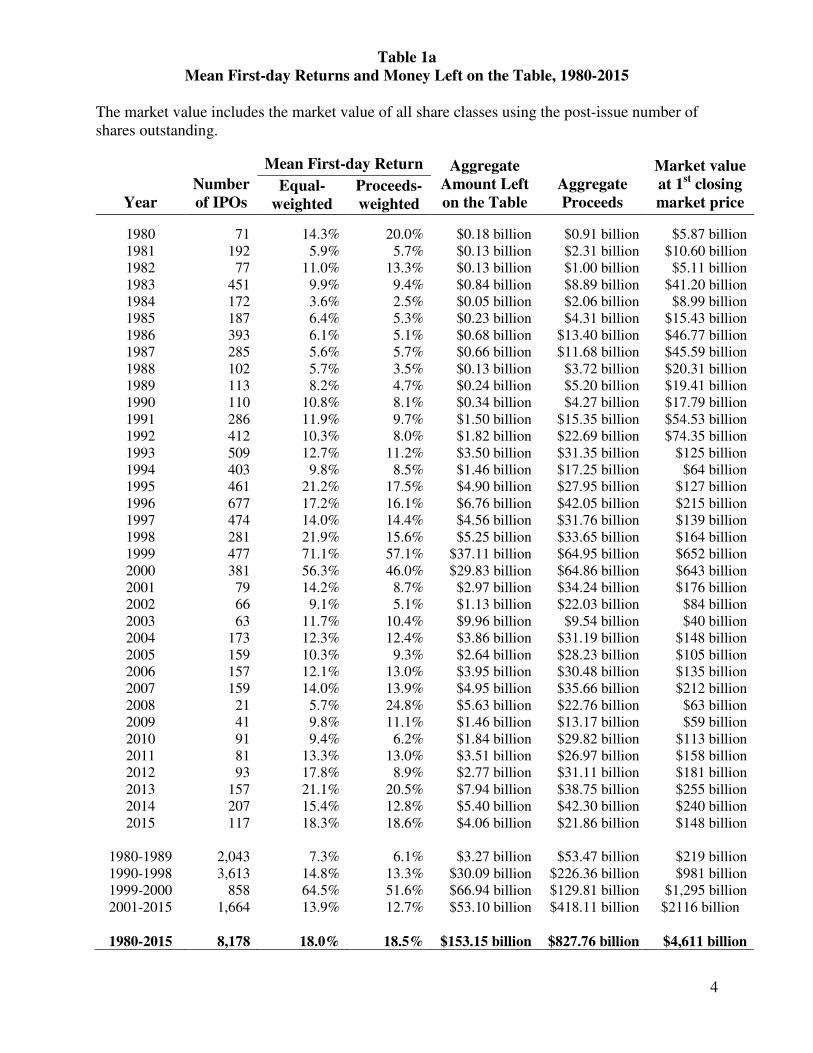
Table 1a Mean First-day Returns and Money Left on the Table, 1980-2015
The market value includes the market value of all share classes using the post-issue number of shares outstanding.
Year
Number of IPOs
Mean First-day Return Aggregate Amount Left on the Table
Aggregate Proceeds
Market value at 1st closing market price
Equal-weighted
Proceeds-weighted
1980 71 14.3% 20.0% $0.18 billion $0.91 billion $5.87 billion 1981 192 5.9% 5.7% $0.13 billion $2.31 billion $10.60 billion 1982 77 11.0% 13.3% $0.13 billion $1.00 billion $5.11 billion 1983 451 9.9% 9.4% $0.84 billion $8.89 billion $41.20 billion 1984 172 3.6% 2.5% $0.05 billion $2.06 billion $8.99 billion 1985 187 6.4% 5.3% $0.23 billion $4.31 billion $15.43 billion 1986 393 6.1% 5.1% $0.68 billion $13.40 billion $46.77 billion 1987 285 5.6% 5.7% $0.66 billion $11.68 billion $45.59 billion 1988 102 5.7% 3.5% $0.13 billion $3.72 billion $20.31 billion 1989 113 8.2% 4.7% $0.24 billion $5.20 billion $19.41 billion 1990 110 10.8% 8.1% $0.34 billion $4.27 billion $17.79 billion 1991 286 11.9% 9.7% $1.50 billion $15.35 billion $54.53 billion 1992 412 10.3% 8.0% $1.82 billion $22.69 billion $74.35 billion 1993 509 12.7% 11.2% $3.50 billion $31.35 billion $125 billion 1994 403 9.8% 8.5% $1.46 billion $17.25 billion $64 billion 1995 461 21.2% 17.5% $4.90 billion $27.95 billion $127 billion 1996 677 17.2% 16.1% $6.76 billion $42.05 billion $215 billion 1997 474 14.0% 14.4% $4.56 billion $31.76 billion $139 billion 1998 281 21.9% 15.6% $5.25 billion $33.65 billion $164 billion 1999 477 71.1% 57.1% $37.11 billion $64.95 billion $652 billion 2000 381 56.3% 46.0% $29.83 billion $64.86 billion $643 billion 2001 79 14.2% 8.7% $2.97 billion $34.24 billion $176 billion 2002 66 9.1% 5.1% $1.13 billion $22.03 billion $84 billion 2003 63 11.7% 10.4% $9.96 billion $9.54 billion $40 billion 2004 173 12.3% 12.4% $3.86 billion $31.19 billion $148 billion 2005 159 10.3% 9.3% $2.64 billion $28.23 billion $105 billion 2006 157 12.1% 13.0% $3.95 billion $30.48 billion $135 billion 2007 159 14.0% 13.9% $4.95 billion $35.66 billion $212 billion 2008 21 5.7% 24.8% $5.63 billion $22.76 billion $63 billion 2009 41 9.8% 11.1% $1.46 billion $13.17 billion $59 billion 2010 91 9.4% 6.2% $1.84 billion $29.82 billion $113 billion 2011 81 13.3% 13.0% $3.51 billion $26.97 billion $158 billion 2012 93 17.8% 8.9% $2.77 billion $31.11 billion $181 billion 2013 157 21.1% 20.5% $7.94 billion $38.75 billion $255 billion 2014 207 15.4% 12.8% $5.40 billion $42.30 billion $240 billion 2015 117 18.3% 18.6% $4.06 billion $21.86 billion $148 billion
1980-1989 2,043 7.3% 6.1% $3.27 billion $53.47 billion $219 billion 1990-1998 3,613 14.8% 13.3% $30.09 billion $226.36 billion $981 billion 1999-2000 858 64.5% 51.6% $66.94 billion $129.81 billion $1,295 billion 2001-2015 1,664 13.9% 12.7% $53.10 billion $418.11 billion $2116 billion
1980-2015 8,178 18.0% 18.5% $153.15 billion $827.76 billion $4,611 billion
5
Table 2
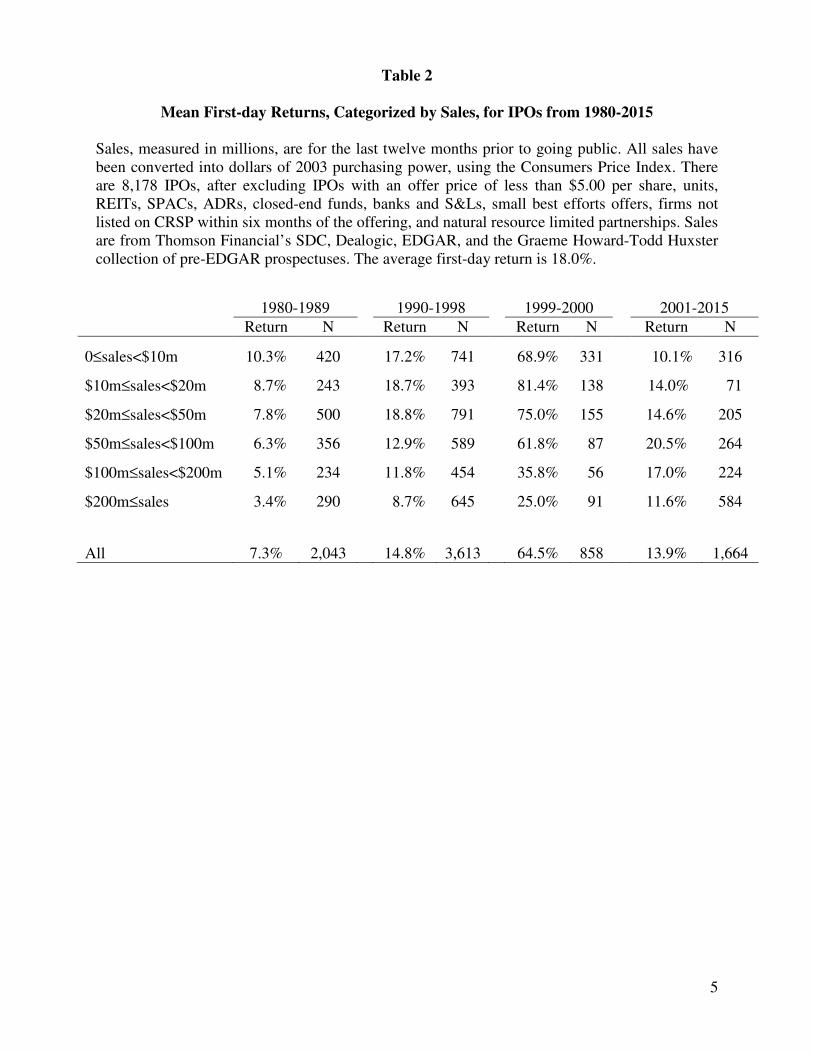
Mean First-day Returns, Categorized by Sales, for IPOs from 1980-2015
Sales, measured in millions, are for the last twelve months prior to going public. All sales have been converted into dollars of 2003 purchasing power, using the Consumers Price Index. There are 8,178 IPOs, after excluding IPOs with an offer price of less than $5.00 per share, units, REITs, SPACs, ADRs, closed-end funds, banks and S&Ls, small best efforts offers, firms not listed on CRSP within six months of the offering, and natural resource limited partnerships. Sales are from Thomson Financial’s SDC, Dealogic, EDGAR, and the Graeme Howard-Todd Huxster collection of pre-EDGAR prospectuses. The average first-day return is 18.0%.
1980-1989
1990-1998
1999-2000
2001-2015
Return N Return N Return N Return N
0≤sales<$10m 10.3% 420
17.2% 741
68.9% 331
10.1% 316
$10m≤sales<$20m 8.7% 243
18.7% 393
81.4% 138
14.0% 71
$20m≤sales<$50m 7.8% 500
18.8% 791
75.0% 155
14.6% 205
$50m≤sales<$100m 6.3% 356
12.9% 589
61.8% 87
20.5% 264
$100m≤sales<$200m 5.1% 234
11.8% 454
35.8% 56
17.0% 224
$200m≤sales 3.4% 290
8.7% 645
25.0% 91
11.6% 584
All 7.3% 2,043
14.8% 3,613
64.5% 858
13.9% 1,664
6
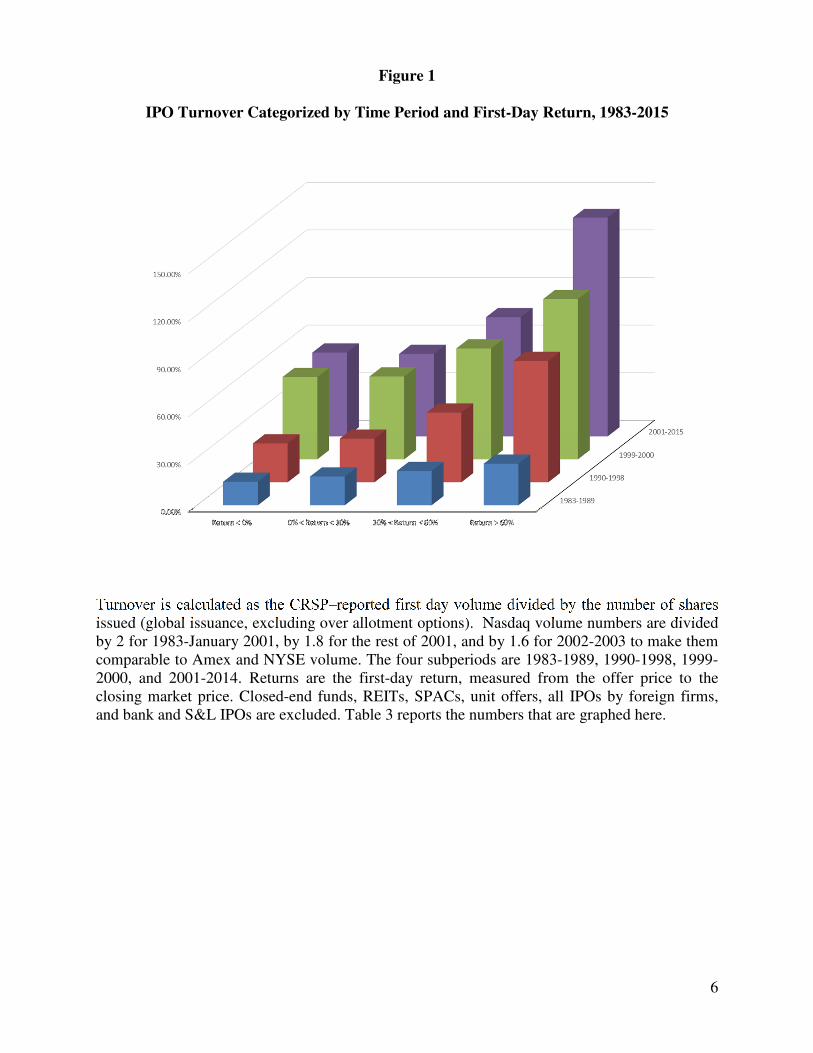
Figure 1
IPO Turnover Categorized by Time Period and First-Day Return, 1983-2015
Turnover is calculated as the CRSP–reported first day volume divided by the number of shares issued (global issuance, excluding over allotment options). Nasdaq volume numbers are divided by 2 for 1983-January 2001, by 1.8 for the rest of 2001, and by 1.6 for 2002-2003 to make them comparable to Amex and NYSE volume. The four subperiods are 1983-1989, 1990-1998, 1999-2000, and 2001-2014. Returns are the first-day return, measured from the offer price to the closing market price. Closed-end funds, REITs, SPACs, unit offers, all IPOs by foreign firms, and bank and S&L IPOs are excluded. Table 3 reports the numbers that are graphed here.
7
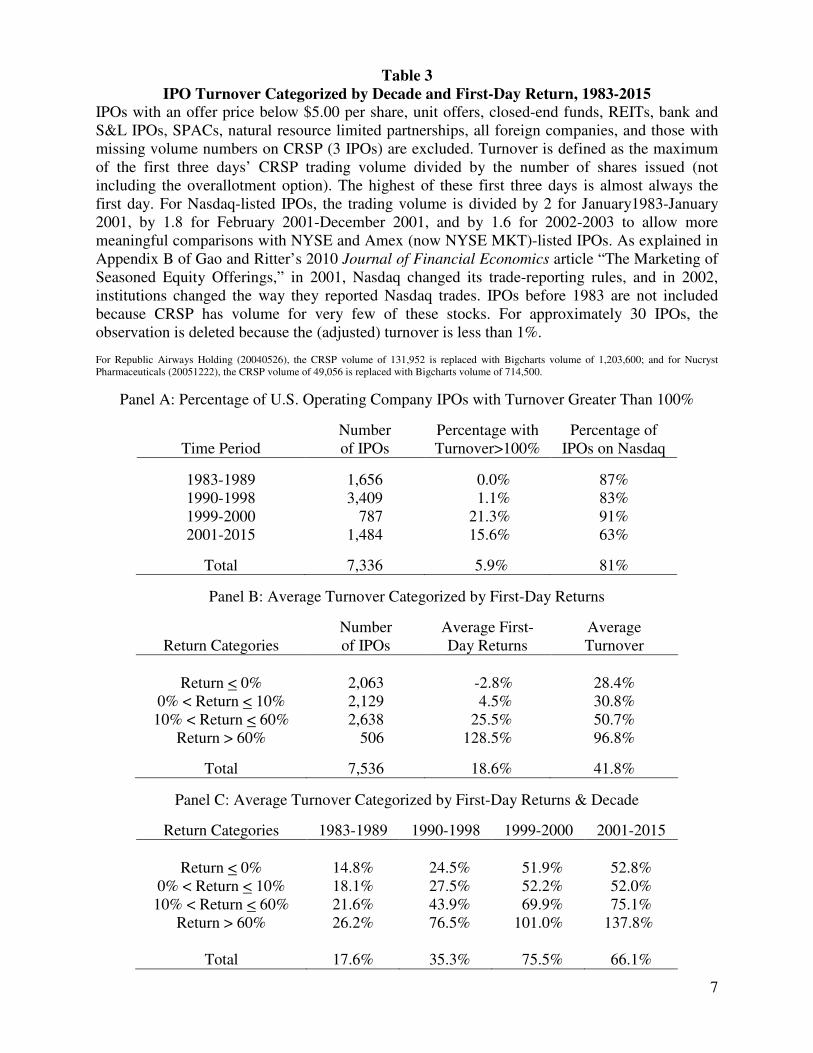
Table 3 IPO Turnover Categorized by Decade and First-Day Return, 1983-2015
IPOs with an offer price below $5.00 per share, unit offers, closed-end funds, REITs, bank and S&L IPOs, SPACs, natural resource limited partnerships, all foreign companies, and those with missing volume numbers on CRSP (3 IPOs) are excluded. Turnover is defined as the maximum of the first three days’ CRSP trading volume divided by the number of shares issued (not including the overallotment option). The highest of these first three days is almost always the first day. For Nasdaq-listed IPOs, the trading volume is divided by 2 for January1983-January 2001, by 1.8 for February 2001-December 2001, and by 1.6 for 2002-2003 to allow more meaningful comparisons with NYSE and Amex (now NYSE MKT)-listed IPOs. As explained in Appendix B of Gao and Ritter’s 2010 Journal of Financial Economics article “The Marketing of Seasoned Equity Offerings,” in 2001, Nasdaq changed its trade-reporting rules, and in 2002, institutions changed the way they reported Nasdaq trades. IPOs before 1983 are not included because CRSP has volume for very few of these stocks. For approximately 30 IPOs, the observation is deleted because the (adjusted) turnover is less than 1%. For Republic Airways Holding (20040526), the CRSP volume of 131,952 is replaced with Bigcharts volume of 1,203,600; and for Nucryst Pharmaceuticals (20051222), the CRSP volume of 49,056 is replaced with Bigcharts volume of 714,500.
Panel A: Percentage of U.S. Operating Company IPOs with Turnover Greater Than 100%
Time Period
Number of IPOs
Percentage with Turnover>100%
Percentage of IPOs on Nasdaq
1983-1989 1,656 0.0% 87% 1990-1998 3,409 1.1% 83% 1999-2000 787 21.3% 91% 2001-2015 1,484 15.6% 63%
Total 7,336 5.9% 81%
Panel B: Average Turnover Categorized by First-Day Returns
Return Categories
Number of IPOs
Average First-Day Returns
Average Turnover
Return < 0% 2,063 -2.8% 28.4%
0% < Return < 10% 2,129 4.5% 30.8% 10% < Return < 60% 2,638 25.5% 50.7%
Return > 60% 506 128.5% 96.8%
Total 7,536 18.6% 41.8%
Panel C: Average Turnover Categorized by First-Day Returns & Decade
Return Categories 1983-1989 1990-1998 1999-2000 2001-2015
Return < 0% 14.8% 24.5% 51.9% 52.8%
0% < Return < 10% 18.1% 27.5% 52.2% 52.0% 10% < Return < 60% 21.6% 43.9% 69.9% 75.1%
Return > 60% 26.2% 76.5% 101.0% 137.8%
Total 17.6% 35.3% 75.5% 66.1%
8
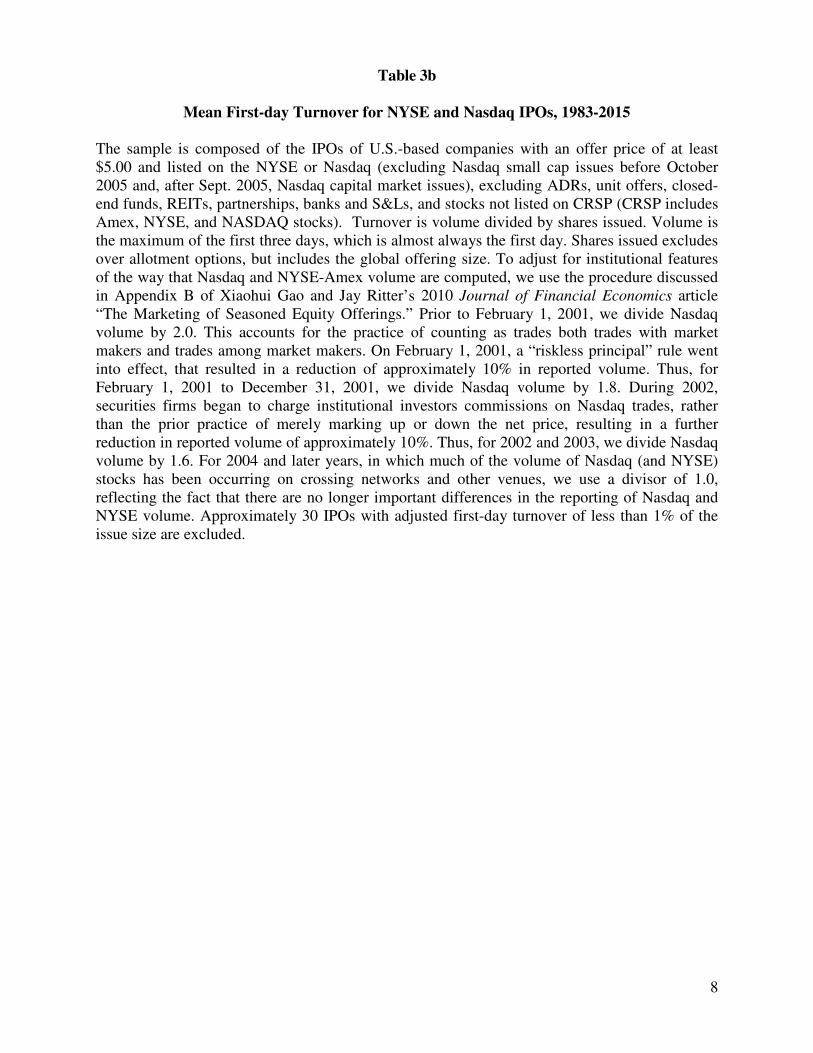
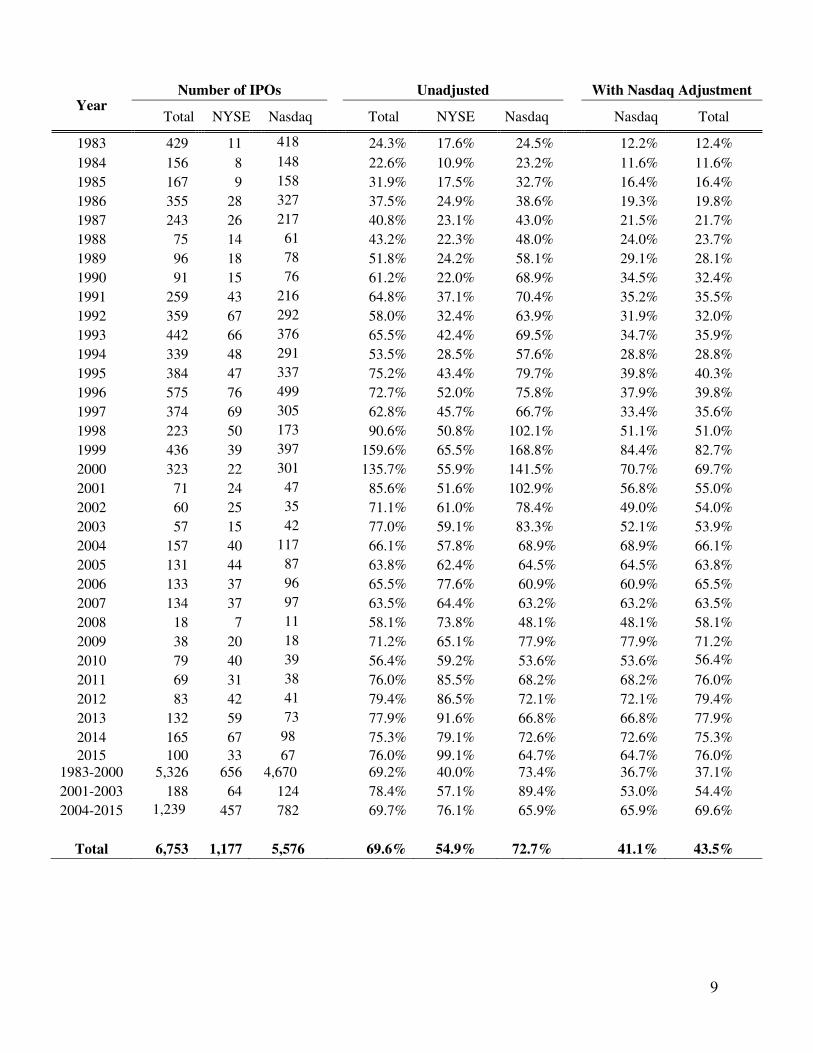
Table 3b
Mean First-day Turnover for NYSE and Nasdaq IPOs, 1983-2015
The sample is composed of the IPOs of U.S.-based companies with an offer price of at least $5.00 and listed on the NYSE or Nasdaq (excluding Nasdaq small cap issues before October 2005 and, after Sept. 2005, Nasdaq capital market issues), excluding ADRs, unit offers, closed-end funds, REITs, partnerships, banks and S&Ls, and stocks not listed on CRSP (CRSP includes Amex, NYSE, and NASDAQ stocks). Turnover is volume divided by shares issued. Volume is the maximum of the first three days, which is almost always the first day. Shares issued excludes over allotment options, but includes the global offering size. To adjust for institutional features of the way that Nasdaq and NYSE-Amex volume are computed, we use the procedure discussed in Appendix B of Xiaohui Gao and Jay Ritter’s 2010 Journal of Financial Economics article “The Marketing of Seasoned Equity Offerings.” Prior to February 1, 2001, we divide Nasdaq volume by 2.0. This accounts for the practice of counting as trades both trades with market makers and trades among market makers. On February 1, 2001, a “riskless principal” rule went into effect, that resulted in a reduction of approximately 10% in reported volume. Thus, for February 1, 2001 to December 31, 2001, we divide Nasdaq volume by 1.8. During 2002, securities firms began to charge institutional investors commissions on Nasdaq trades, rather than the prior practice of merely marking up or down the net price, resulting in a further reduction in reported volume of approximately 10%. Thus, for 2002 and 2003, we divide Nasdaq volume by 1.6. For 2004 and later years, in which much of the volume of Nasdaq (and NYSE) stocks has been occurring on crossing networks and other venues, we use a divisor of 1.0, reflecting the fact that there are no longer important differences in the reporting of Nasdaq and NYSE volume. Approximately 30 IPOs with adjusted first-day turnover of less than 1% of the issue size are excluded.
9
Year
Number of IPOs Unadjusted With Nasdaq Adjustment
Total NYSE Nasdaq Total NYSE Nasdaq Nasdaq Total
1983 429 11 418 24.3% 17.6% 24.5% 12.2% 12.4%
1984 156 8 148 22.6% 10.9% 23.2% 11.6% 11.6%
1985 167 9 158 31.9% 17.5% 32.7% 16.4% 16.4%
1986 355 28 327 37.5% 24.9% 38.6% 19.3% 19.8%
1987 243 26 217 40.8% 23.1% 43.0% 21.5% 21.7%
1988 75 14 61 43.2% 22.3% 48.0% 24.0% 23.7%
1989 96 18 78 51.8% 24.2% 58.1% 29.1% 28.1%
1990 91 15 76 61.2% 22.0% 68.9% 34.5% 32.4%
1991 259 43 216 64.8% 37.1% 70.4% 35.2% 35.5%
1992 359 67 292 58.0% 32.4% 63.9% 31.9% 32.0%
1993 442 66 376 65.5% 42.4% 69.5% 34.7% 35.9%
1994 339 48 291 53.5% 28.5% 57.6% 28.8% 28.8%
1995 384 47 337 75.2% 43.4% 79.7% 39.8% 40.3%
1996 575 76 499 72.7% 52.0% 75.8% 37.9% 39.8%
1997 374 69 305 62.8% 45.7% 66.7% 33.4% 35.6%
1998 223 50 173 90.6% 50.8% 102.1% 51.1% 51.0%
1999 436 39 397 159.6% 65.5% 168.8% 84.4% 82.7%
2000 323 22 301 135.7% 55.9% 141.5% 70.7% 69.7%
2001 71 24 47 85.6% 51.6% 102.9% 56.8% 55.0%
2002 60 25 35 71.1% 61.0% 78.4% 49.0% 54.0%
2003 57 15 42 77.0% 59.1% 83.3% 52.1% 53.9%
2004 157 40 117 66.1% 57.8% 68.9% 68.9% 66.1%
2005 131 44 87 63.8% 62.4% 64.5% 64.5% 63.8%
2006 133 37 96 65.5% 77.6% 60.9% 60.9% 65.5%
2007 134 37 97 63.5% 64.4% 63.2% 63.2% 63.5%
2008 18 7 11 58.1% 73.8% 48.1% 48.1% 58.1%
2009 38 20 18 71.2% 65.1% 77.9% 77.9% 71.2%
2010 79 40 39 56.4% 59.2% 53.6% 53.6% 56.4% 2011 69 31 38 76.0% 85.5% 68.2% 68.2% 76.0%
2012 83 42 41 79.4% 86.5% 72.1% 72.1% 79.4%
2013 132 59 73 77.9% 91.6% 66.8% 66.8% 77.9%
2014 165 67 98 75.3% 79.1% 72.6% 72.6% 75.3%
2015 100 33 67 76.0% 99.1% 64.7% 64.7% 76.0% 1983-2000 5,326 656 4,670 69.2% 40.0% 73.4% 36.7% 37.1%
2001-2003 188 64 124 78.4% 57.1% 89.4% 53.0% 54.4%
2004-2015 1,239 1,144
457 782 69.7% 76.1% 65.9% 65.9% 69.6%
Total 6,753 1,177 5,576 69.6% 54.9% 72.7% 41.1% 43.5%
10
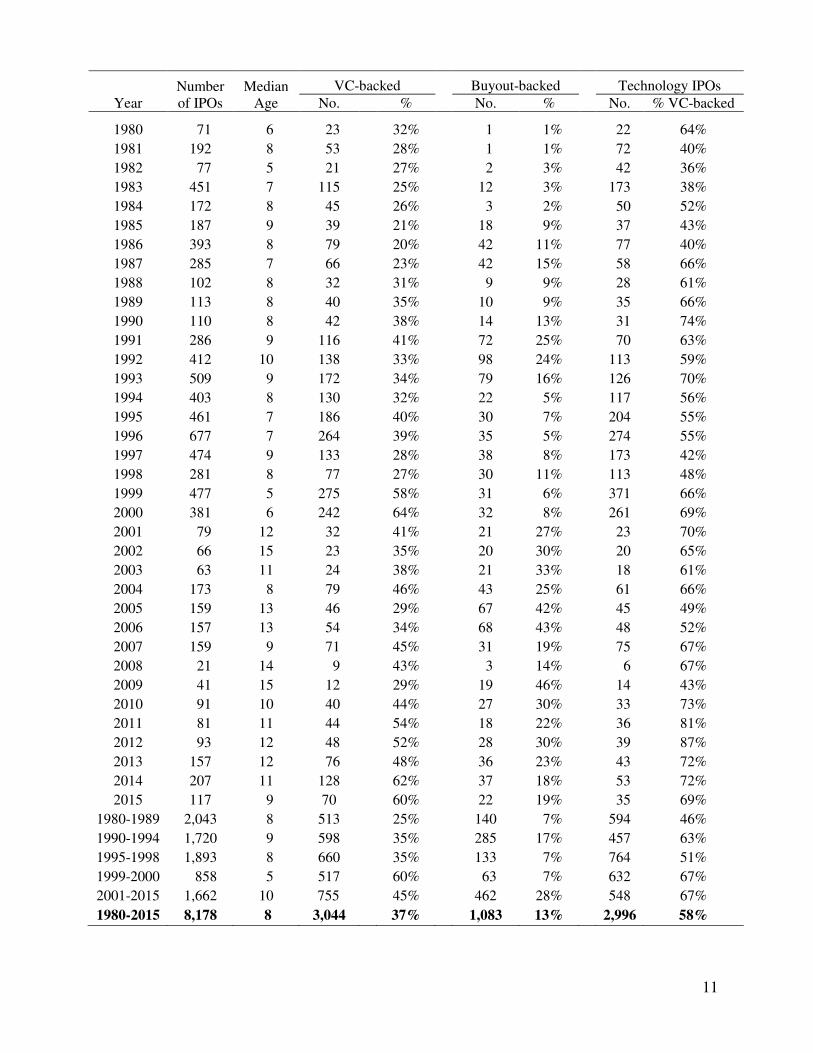
Table 4
Median Age and Fraction of IPOs with VC and Buyout Backing, 1980-2015
There are 8,178 IPOs after excluding those with an offer price below $5.00 per share, unit offers, ADRs, closed-end funds, oil & gas limited partnerships, acquisition companies, REITs, bank and S&L IPOs, and firms not listed on CRSP. Missing numbers are supplemented by direct inspection of prospectuses on EDGAR, information from Dealogic for IPOs after 1991, Howard and Co.’s Going Public: The IPO Reporter from 1980-1985, the Graeme Howard-Todd Huxster collection of IPO prospectuses for 1975-2006, and the Stanford GSB microfiche collection of registration statements form the 1980s. Tech stocks are defined as internet-related stocks plus other technology stocks, not including biotech. Loughran and Ritter (2004) list the SIC codes in their appendix 3 and sources of founding dates in appendix 1. Age is defined as the year of the IPO minus the year of founding. For buyout-backed IPOs, the founding date of the predecessor company is used. For rollups, the founding date of the oldest acquired company is used in most cases. Private equity (PE) or buyout-backed IPOs were restricted to “reverse LBOs” in the 1980s and 1990s. Jerry Cao has assisted with providing information on which IPOs are buyout-backed. The financial backers of some companies are easy to classify, such as when Sequoia Capital and Kleiner Perkins invested in Google, or when KKR invested in Dollar General. But other situations involve growth capital investing, as when Warburg Pincus finances a company that rolls up some doctors’ offices. With just two categories (VC and buyout), there is some arbitrariness in the categorization of IPOs backed by growth capital investors. 379 growth capital-backed IPOs are classified as VC-backed. The definition of technology stocks has been changed from that in Loughran and Ritter (2004 Financial Management), with SIC=3559, 3576, and 7389 added to tech. Some 7389 (business services) companies have had their SIC codes changed into non-tech categories, such as consulting and two new SIC codes: 5614 for telemarketing firms and 7388 for non-tech business services such as Sotheby’s Auctions.
(table on the next page)
11
Year
Number of IPOs
Median Age
VC-backed Buyout-backed Technology IPOs
No. % No. % No. % VC-backed
1980 71 6 23 32% 1 1% 22 64%
1981 192 8 53 28% 1 1% 72 40%
1982 77 5 21 27% 2 3% 42 36%
1983 451 7 115 25% 12 3% 173 38%
1984 172 8 45 26%
3 2% 50 52%
1985 187 9 39 21% 18 9% 37 43%
1986 393 8 79 20% 42 11% 77 40%
1987 285 7 66 23% 42 15% 58 66%
1988 102 8 32 31% 9 9% 28 61%
1989 113 8 40 35% 10 9% 35 66%
1990 110 8 42 38% 14 13% 31 74%
1991 286 9 116 41% 72 25% 70 63%
1992 412 10 138 33% 98 24% 113 59%
1993 509 9 172 34% 79 16% 126 70%
1994 403 8 130 32% 22 5% 117 56%
1995 461 7 186 40% 30 7% 204 55%
1996 677 7 264 39% 35 5% 274 55%
1997 474 9 133 28% 38 8% 173 42%
1998 281 8 77 27% 30 11% 113 48%
1999 477 5 275 58% 31 6% 371 66%
2000 381 6 242 64% 32 8% 261 69%
2001 79 12 32 41% 21 27% 23 70%
2002 66 15 23 35% 20 30% 20 65%
2003 63 11 24 38% 21 33% 18 61%
2004 173 8 79 46% 43 25% 61 66%
2005 159 13 46 29% 67 42% 45 49%
2006 157 13 54 34% 68 43% 48 52%
2007 159 9 71 45% 31 19% 75 67%
2008 21 14 9 43% 3 14% 6 67%
2009 41 15 12 29% 19 46% 14 43%
2010 91 10 40 44% 27 30% 33 73%
2011 81 11 44 54% 18 22% 36 81%
2012 93 12 48 52% 28 30% 39 87%
2013 157 12 76 48% 36 23% 43 72%
2014 207 11 128 62% 37 18% 53 72%
2015 117 9 70 60% 22 19% 35 69%
1980-1989 2,043 8 513 25% 140 7% 594 46%
1990-1994 1,720 9 598 35% 285 17% 457 63%
1995-1998 1,893 8 660 35% 133 7% 764 51%
1999-2000 858 5 517 60% 63 7% 632 67%
2001-2015 1,662 10 755 45% 462 28% 548 67%
1980-2015 8,178 8 3,044
37% 1,083
13% 2,996 58%
12
Table 4a
Technology Company IPOs, 1980-2015
There are 2,996 tech stock IPOs, after excluding those with an offer price below $5.00 per share, unit offers, ADRs, closed-end funds, natural resource limited partnerships (and most other LPs, but not buyout firms such as Carlyle Group), acquisition companies, REITs, bank and S&L IPOs, and firms not listed on CRSP. Missing and questionable numbers from the SDC new issues database are supplemented by direct inspection of prospectuses on EDGAR, information from Dealogic for IPOs after 1991, Howard and Co.’s Going Public: The IPO Reporter from 1980-1985, and the Graeme Howard-Todd Huxster collection of IPO prospectuses for 1975-2006. Tech stocks are defined as internet-related stocks plus other technology stocks including telecom, but not including biotech. Loughran and Ritter (2004) list the SIC codes in their appendix 3 and sources of founding dates in appendix 1. The definition of technology stocks has been changed from that in Loughran and Ritter (2004 Financial Management), with SIC=3559, 3576, and 7389 added to tech. Some 7389 (business services) companies have had their SIC codes changed into non-tech categories, such as consulting and two new SIC codes: 5614 for telemarketing firms and 7388 for non-tech business services such as Sotheby’s Auctions. For the column with VC-backed IPOs, there are 3,044 IPOs including both technology and non-technology companies. For buyout-backed IPOs, the founding date of the predecessor company is used. Price-to-sales ratios are computed using both the offer price (OP) and the first closing market price (MP) for computing the market capitalization of equity. Market cap is calculated using the post-issue shares outstanding, with all share classes included in the case of dual-class companies. The undiluted number of shares is used, which is some cases (e.g., Facebook, Twitter, and Castlight Health) understates the market cap due to the existence of substantial amounts of in-the-money employee stock options that are highly likely to be exercised. Sales are the last twelve months (LTM) revenues as reported in the prospectus. The median sales, in millions, is expressed in both nominal dollars and in dollars of 2014 purchasing power using the CPI. The median age, in years, is the number of years since the calendar year of the founding date and the calendar year of the IPO. The percentage of IPOs that are profitable measures profitability using trailing LTM earnings (usually using after extraordinary items earnings, and usually using pro forma numbers that are computed assuming that any recent or concurrent mergers have already occurred, and the conversion of convertible preferred stock into common stock). In some cases, last fiscal year earnings are used when LTM earnings are unavailable. Even concepts like market cap (for the price-to-sales ratios) become ambiguous when you realize that companies like Facebook have many deep in-the-money options outstanding, so whether you use the fully diluted number of shares or the undiluted number can affect the calculations substantially for some companies.
(table on the next page)

13
Year
Number of Tech
IPOs
Proceeds in $millions Median
Price-to-sales
Median sales, $mm
Median age
% profitable VC-backed Technology OP MP Nominal
al $2014
1980 22 388 378 3.4 3.8 16.2 48.8 6.5 91%
1981 72 648 838 3.5 3.6 12.9 34.8 9 88%
1982 42 490 648 4.2 4.5 10.5 26.2 5 83%
1983 173 2,768 3,271 5.7 6.5 8.6 20.6 6 71%
1984 50 614 543 2.4 2.5 9.8 22.5 6.5 80%
1985 37 667 375 2.0 2.4 13.4 29.8 7 84%
1986 77 1,558 1,217 3.4 3.6 13.0 27.8 6 74%
1987 58 1,315 1,324 3.2 3.2 18.3 38.4 5.5 86%
1988 28 674 888 2.8 2.9 24.0 48.6 5.5 79%
1989 35 869 748 3.4 4.0 31.5 61.0 6 77%
1990 31 1,085 747 3.6 3.7 29.1 53.5 9 94%
1991 70 3,887 2,738 3.2 3.7 34.5 60.0 9 74%
1992 113 4,970 5,847 3.4 3.6 22.8 38.7 8 65%
1993 126 5,929 5,415 3.0 3.6 27.0 44.3 8 74%
1994 117 3,726 3,659 3.7 4.2 21.0 33.6 8 70%
1995 204 7,023 9,781 4.6 5.7 21.6 33.6 8 71%
1996 274 11,579 16,185 6.9 8.3 16.7 25.3 7 47%
1997 173 4,993 7,447 5.2 5.7 21.5 31.7 7 50%
1998 113 3,882 8,118 8.8 11.9 22.1 32.0 6 36%
1999 371 22,012 33,792 26.5 42.8 12.1 17.2 4 14%
2000 261 23,304 42,498 31.7 48.9 12.1 16.8 5 14%
2001 23 2,658 5,773 8.1 13.4 24.6 32.9 9 30%
2002 20 1,956 2,587 2.9 3.1 95.2 125.9 9 40%
2003 18 1,789 2,242 4.1 4.6 86.2 111.1 7 39%
2004 61 7,183 9,064 6.4 7.1 55.5 70.2 8 44%
2005 45 3,676 6,994 4.5 4.5 68.0 83.6 9 36%
2006 48 4,661 4,873 5.5 6.3 57.6 68.0 9 50%
2007 75 9,820 11,371 6.5 8.0 70.0 81.0 8 29%
2008 6 863 1,194 4.9 5.7 156.7 173.8 14 67%
2009 14 1,697 4,125 3.0 3.6 174.3 193.3 11 71%
2010 33 3,873 4,347 3.4 3.9 119.5 129.2 11 64%
2011 36 8,603 9,412 6.1 6.6 141.3 150.3 10 36%
2012 39 21,031 20,250 4.4 4.9 108.1 111.7 9 44%
2013 43 11,553 8,486 5.3 6.1 105.8 107.6 9 28%
2014 53 18,058 9,965 6.2 6.8 90.5 90.5 11 17%
2015 35 9,086 9,520 5.5 6.5 128.4 128.1 11 26%
1980-2015 2,996 208,903 256,661 5.8 6.9 21.6 35.8 7 50%
14
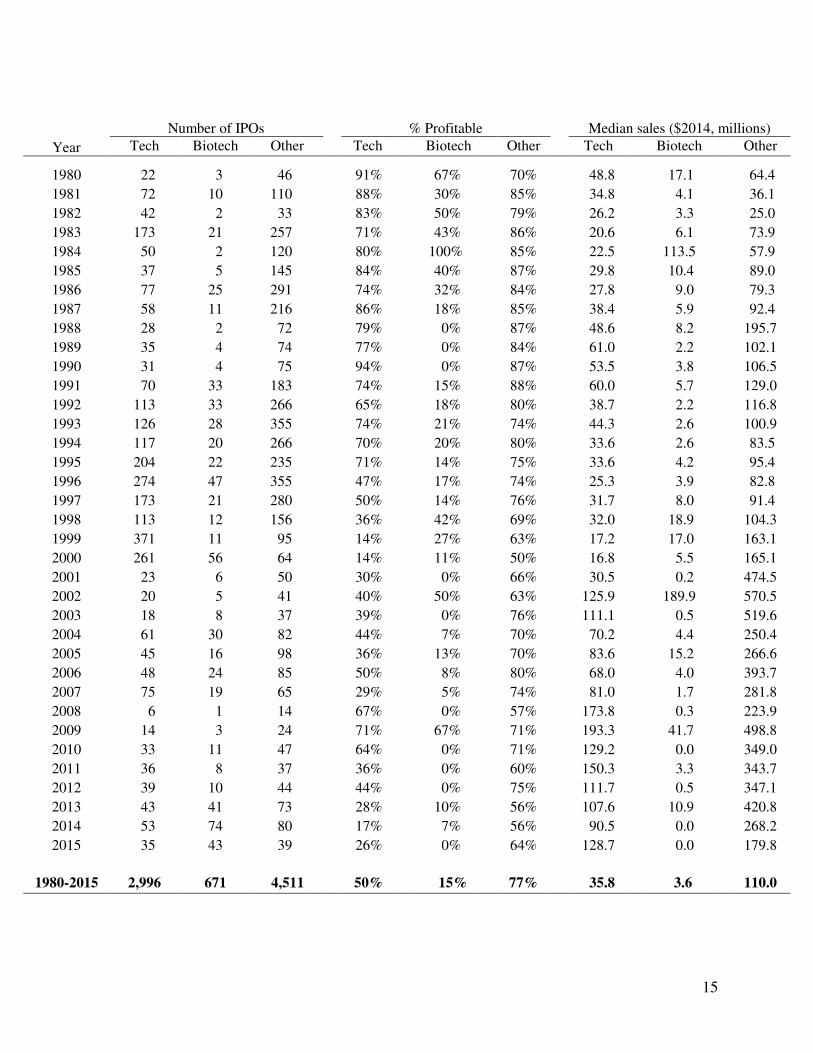
Table 4b
Technology and Biotechnology Company IPOs, 1980-2015
There are 2,996 tech and 671 biotech IPOs from 1980-2015, after excluding those with an offer price below $5.00 per share, unit offers, ADRs, closed-end funds, partnerships, acquisition companies, REITs, bank and S&L IPOs, and firms not listed on CRSP. Missing and questionable numbers from the SDC new issues database are supplemented by direct inspection of prospectuses on EDGAR, information from Dealogic for IPOs after 1991, Howard and Co.’s Going Public: The IPO Reporter from 1980-1985, and the Graeme Howard-Todd Huxster collection of IPO prospectuses for 1975-2006. Tech stocks are defined as internet-related stocks plus other technology stocks including telecom, but not including biotech. Loughran and Ritter (2004) list the SIC codes in their appendix 3 and sources of founding dates in appendix 1. The definition of technology stocks has been changed from that in Loughran and Ritter (2004 Financial Management), with SIC=3559, 3576, and 7389 added to tech. Some 7389 (business services) companies have had their SIC codes changed into non-tech categories, such as consulting and two new SIC codes that I created: 5614 for telemarketing firms and 7388 for non-tech business services such as Sotheby’s Auctions. Biotech is defined as SIC=2830, 2833, 2834, 2835, 2836, and 8731. Sales are the last twelve months (LTM) revenues as reported in the prospectus. The median sales, in millions, are expressed in dollars of 2014 purchasing power using the CPI. Pro forma numbers are usually used if there have been recent mergers or mergers that coincide with the IPO. The percentage of IPOs that are profitable measures profitability using trailing LTM earnings (usually using after extraordinary items earnings, and usually using pro forma numbers that are computed assuming that any recent or concurrent mergers have already occurred, and the conversion of convertible preferred stock into common stock). In some cases, last fiscal year earnings are used when LTM earnings are unavailable.
(table on the next page)
15
Year
Number of IPOs % Profitable Median sales ($2014, millions)
Tech Biotech Other Tech Biotech Other Tech Biotech Other
1980 22 3 46 91% 67% 70% 48.8 17.1
64.4
1981 72 10 110 88% 30% 85% 34.8 4.1 36.1
1982 42 2 33 83% 50% 79% 26.2 3.3 25.0
1983 173 21 257 71% 43% 86% 20.6 6.1 73.9
1984 50 2 120 80% 100% 85% 22.5 113.5 57.9
1985 37 5 145 84% 40% 87% 29.8 10.4 89.0
1986 77 25 291 74% 32% 84% 27.8 9.0 79.3
1987 58 11 216 86% 18% 85% 38.4 5.9 92.4
1988 28 2 72 79% 0% 87% 48.6 8.2 195.7
1989 35 4 74 77% 0% 84% 61.0 2.2 102.1
1990 31 4 75 94% 0% 87% 53.5 3.8 106.5
1991 70 33 183 74% 15% 88% 60.0 5.7 129.0
1992 113 33 266 65% 18% 80% 38.7 2.2 116.8
1993 126 28 355 74% 21% 74% 44.3 2.6 100.9
1994 117 20 266 70% 20% 80% 33.6 2.6 83.5
1995 204 22 235 71% 14% 75% 33.6 4.2 95.4
1996 274 47 355 47% 17% 74% 25.3 3.9 82.8
1997 173 21 280 50% 14% 76% 31.7 8.0 91.4
1998 113 12 156 36% 42% 69% 32.0 18.9 104.3
1999 371 11 95 14% 27% 63% 17.2 17.0 163.1
2000 261 56 64 14% 11% 50% 16.8 5.5 165.1
2001 23 6 50 30% 0% 66% 30.5 0.2 474.5
2002 20 5 41 40% 50% 63% 125.9 189.9 570.5
2003 18 8 37 39% 0% 76% 111.1 0.5 519.6
2004 61 30 82 44% 7% 70% 70.2 4.4 250.4
2005 45 16 98 36% 13% 70% 83.6 15.2 266.6
2006 48 24 85 50% 8% 80% 68.0 4.0 393.7
2007 75 19 65 29% 5% 74% 81.0 1.7 281.8
2008 6 1 14 67% 0% 57% 173.8 0.3 223.9
2009 14 3 24 71% 67% 71% 193.3 41.7 498.8
2010 33 11 47 64% 0% 71% 129.2 0.0 349.0
2011 36 8 37 36% 0% 60% 150.3 3.3 343.7
2012 39 10 44 44% 0% 75% 111.7 0.5 347.1
2013 43 41 73 28% 10% 56% 107.6 10.9 420.8
2014 53 74 80 17% 7% 56% 90.5 0.0 268.2
2015 35 43 39 26% 0% 64% 128.7 0.0 179.8
1980-2015 2,996 671 4,511 50% 15% 77% 35.8 3.6 110.0
16
Table 4c
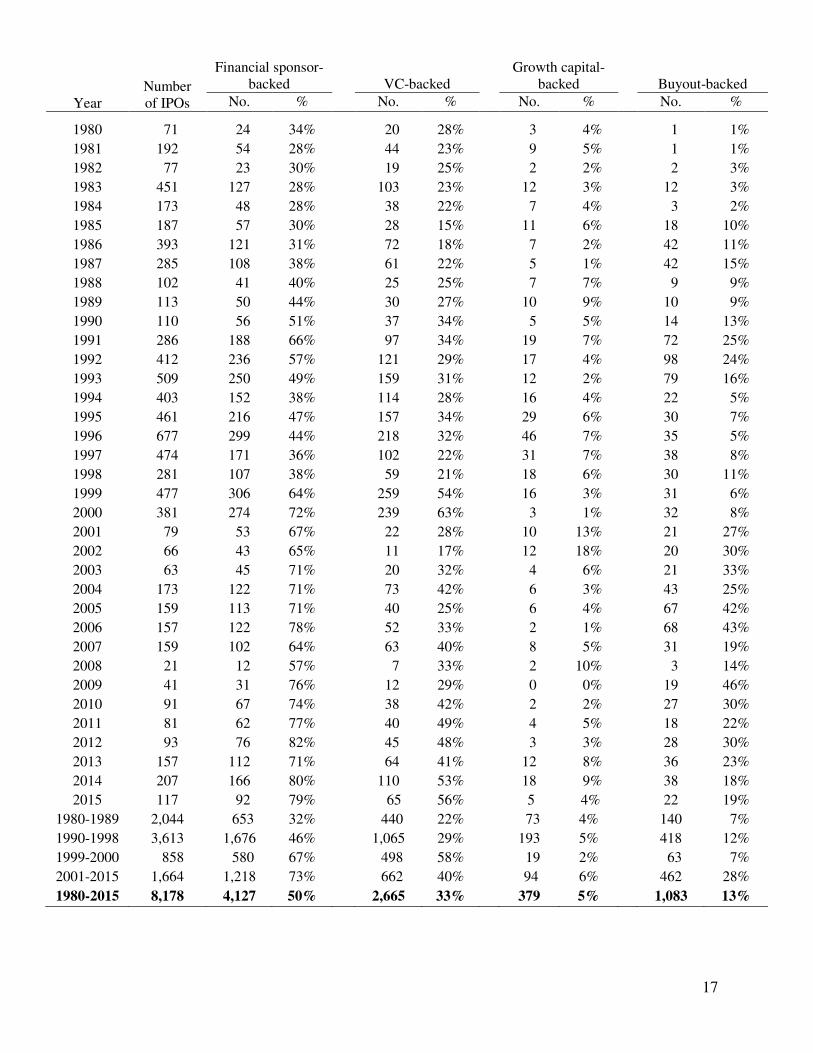
VC-backed, Growth Capital-backed, and Buyout-backed IPOs, 1980-2015
There are 8,178 IPOs after excluding those with an offer price below $5.00 per share, unit offers, ADRs, closed-end funds, natural resource limited partnerships, special purpose acquisition companies (SPACs), REITs, bank and S&L IPOs, small best efforts offerings, and firms not listed on CRSP within six months of the IPO. Missing numbers in the Thomson Reuters new issues database are found by direct inspection of prospectuses on EDGAR, information from Dealogic for IPOs after 1989, Howard and Co.’s Going Public: The IPO Reporter from 1980-1985, and the Graeme Howard-Todd Huxster collection of IPO prospectuses for 1975-1996. Some foreign company IPOs from 1997-2001 that did not use ADRs but did not file electronically, and therefore do not have a prospectus available on EDGAR, were also accessed from the Graeme Howard-Todd Huxster database. Additional information was collected from microfiches at Stanford’s GSB library. Tech stocks are defined as internet-related stocks plus other technology stocks including telecom, but not including biotech. Loughran and Ritter (2004) list the SIC codes in their appendix 3 and sources of founding dates in appendix 1, and I have slightly updated the classifications. Growth capital-backed IPOs are IPOs with a financial sponsor that, unlike a buyout-sponsored deal, typically owns far less than 90% of the equity prior to the IPO. Furthermore, many growth capital-backed IPOs have debt in their capital structure. The main criteria for classifying a financial sponsor as growth capital rather than venture capital is whether the company is investing in tangible assets (e.g, stores or hospitals) or intangibles (e.g., R&D); this is highly correlated with the industry of the company: restaurants, retail operations such as clothing store chains, healthcare operations (doctors’ offices and dental offices), and retirement homes are generally classified as growth capital-backed. Many growth capital-backed IPOs are involved in rollups of a fragmented industry, where the financial sponsor has provided capital to make acquisitions to consolidate a fragmented industry, such as funeral homes. If a company is growing via acquisitions, it would generally be categorized as growth capital-backed rather than venture-backed. Jerry Cao has provided information on which IPOs are buyout-backed. 379 growth capital-backed IPOs are not classified as VC-backed in this table.
(table on the next page)
17
Year Number of IPOs
Financial sponsor-backed
VC-backed
Growth capital-backed
Buyout-backed
No. % No. % No. % No. %
1980 71 24 34% 20 28% 3 4% 1 1%
1981 192 54 28% 44 23% 9 5% 1 1%
1982 77 23 30% 19 25% 2 2% 2 3%
1983 451 127 28% 103 23% 12 3% 12 3%
1984 173 48 28% 38 22% 7 4% 3 2%
1985 187 57 30% 28 15% 11 6% 18 10%
1986 393 121 31% 72 18% 7 2% 42 11%
1987 285 108 38% 61 22% 5 1% 42 15%
1988 102 41 40% 25 25% 7 7% 9 9%
1989 113 50 44% 30 27% 10 9% 10 9%
1990 110 56 51% 37 34% 5 5% 14 13%
1991 286 188 66% 97 34% 19 7% 72 25%
1992 412 236 57% 121 29% 17 4% 98 24%
1993 509 250 49% 159 31% 12 2% 79 16%
1994 403 152 38% 114 28% 16 4% 22 5%
1995 461 216 47% 157 34% 29 6% 30 7%
1996 677 299 44% 218 32% 46 7% 35 5%
1997 474 171 36% 102 22% 31 7% 38 8%
1998 281 107 38% 59 21% 18 6% 30 11%
1999 477 306 64% 259 54% 16 3% 31 6%
2000 381 274 72% 239 63% 3 1% 32 8%
2001 79 53 67% 22 28% 10 13% 21 27%
2002 66 43 65% 11 17% 12 18% 20 30%
2003 63 45 71% 20 32% 4 6% 21 33%
2004 173 122 71% 73 42% 6 3% 43 25%
2005 159 113 71% 40 25% 6 4% 67 42%
2006 157 122 78% 52 33% 2 1% 68 43%
2007 159 102 64% 63 40% 8 5% 31 19%
2008 21 12 57% 7 33% 2 10% 3 14%
2009 41 31 76% 12 29% 0 0% 19 46%
2010 91 67 74% 38 42% 2 2% 27 30%
2011 81 62 77% 40 49% 4 5% 18 22%
2012 93 76 82% 45 48% 3 3% 28 30%
2013 157 112 71% 64 41% 12 8% 36 23%
2014 207 166 80% 110 53% 18 9% 38 18%
2015 117 92 79% 65 56% 5 4% 22 19%
1980-1989 2,044 653 32% 440 22% 73 4% 140 7%
1990-1998 3,613 1,676 46% 1,065 29% 193 5% 418 12%
1999-2000 858 580 67% 498 58% 19 2% 63 7%
2001-2015 1,664 1,218 73% 662 40% 94 6% 462 28%
1980-2015 8,178 4,127 50% 2,665
33% 379 5% 1,083
13%
18
Table 4d
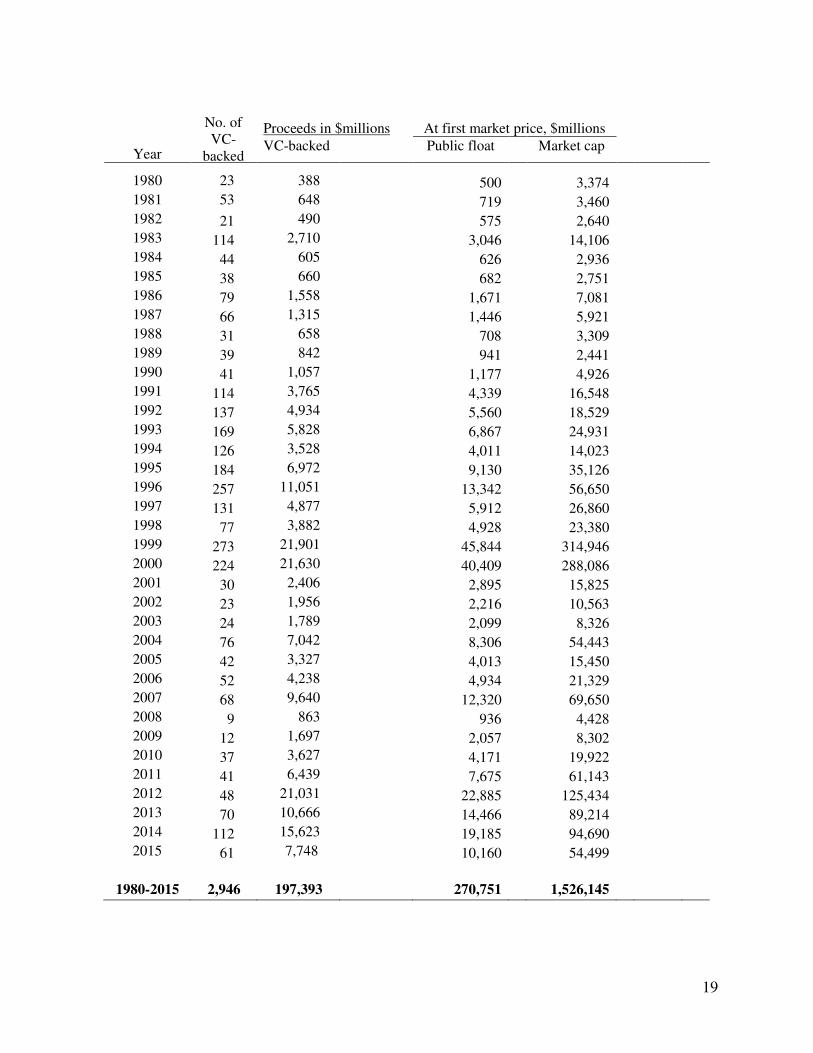
VC-backed IPOs, U.S.-headquartered Companies Only, 1980-2015
There are 2,946 venture capital-backed IPOs of U.S. headquartered companies, after excluding those with an offer price below $5.00 per share, unit offers, ADRs, closed-end funds, natural resource limited partnerships (and most other LPs, but not buyout firms such as Carlyle Group), acquisition companies, REITs, bank and S&L IPOs, and firms not listed on CRSP. VC-backed includes growth capital-backed IPOs. Missing and questionable numbers from the SDC new issues database are supplemented by direct inspection of prospectuses on EDGAR, information from Dealogic for IPOs after 1991, Howard and Co.’s Going Public: The IPO Reporter from 1980-1985, and the Graeme Howard-Todd Huxster collection of IPO prospectuses for 1975-2006. The public float is calculated as the shares issued multiplied by the first closing market price, and does not include overallotment shares. All numbers use the undiluted number of shares outstanding. For dual-class companies such as Facebook, all share classes are included, with the assumption that the price per share is the same for each class. Even concepts like market cap (for the price-to-sales ratios) become ambiguous when you realize that companies like Facebook have many deep in-the-money options outstanding, so whether you use the fully diluted number of shares or the undiluted number can affect the calculations substantially for some companies. Example: For 1980, the 23 VC-backed IPOs raised $388 million, the shares of which had a market cap of $500 million using the first closing market price. The market cap, using all shares outstanding, was $3.374 billion in total. Of this, Apple Computer issued 4.6 million shares at $22 per share (proceeds of $101.2 million), closing at $28.75 per share (public float value of $132.25 million), with 55.136 million shares outstanding ($1,585 million market cap).
(table on the next page)
19
Year
No. of VC-
backed
Proceeds in $millions At first market price, $millions
VC-backed Public float Market cap
1980 23 388 500 3,374
1981 53 648 719 3,460 1982 21 490 575 2,640 1983 114 2,710 3,046 14,106 1984 44 605 626 2,936 1985 38 660 682 2,751 1986 79 1,558 1,671 7,081 1987 66 1,315 1,446 5,921 1988 31 658 708 3,309 1989 39 842 941 2,441 1990 41 1,057 1,177 4,926 1991 114 3,765 4,339 16,548 1992 137 4,934 5,560 18,529 1993 169 5,828 6,867 24,931 1994 126 3,528 4,011 14,023 1995 184 6,972 9,130 35,126 1996 257 11,051 13,342 56,650 1997 131 4,877 5,912 26,860 1998 77 3,882 4,928 23,380 1999 273 21,901 45,844 314,946 2000 224 21,630 40,409 288,086 2001 30 2,406 2,895 15,825 2002 23 1,956 2,216 10,563 2003 24 1,789 2,099 8,326 2004 76 7,042 8,306 54,443 2005 42 3,327 4,013 15,450 2006 52 4,238 4,934 21,329 2007 68 9,640 12,320 69,650 2008 9 863 936 4,428 2009 12 1,697 2,057 8,302 2010 37 3,627 4,171 19,922 2011 41 6,439 7,675 61,143 2012 48 21,031 22,885 125,434 2013 70 10,666 14,466 89,214 2014 112 15,623 19,185 94,690 2015 61 7,748 10,160 54,499
1980-2015 2,946 197,393 270,751 1,526,145
20
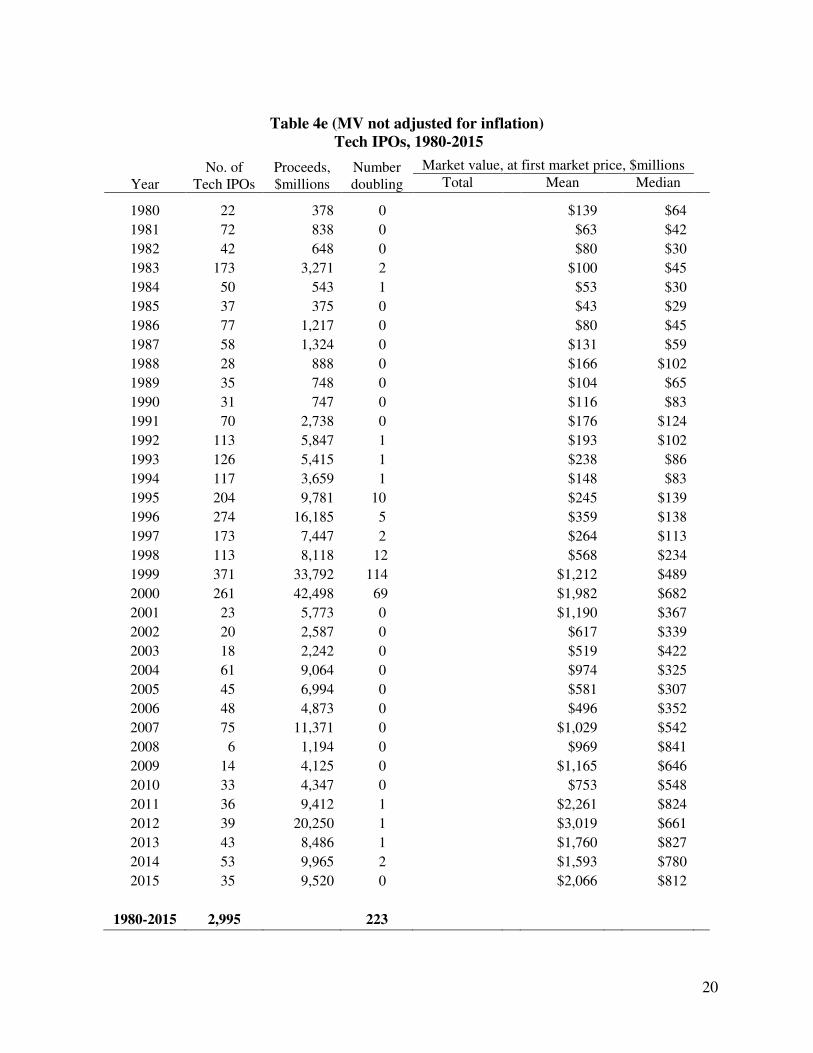
Table 4e (MV not adjusted for inflation) Tech IPOs, 1980-2015
Year No. of
Tech IPOs Proceeds, $millions
Number doubling
Market value, at first market price, $millions
Total Mean Median
1980 22 378 0 $139 $64
1981 72 838 0 $63 $42
1982 42 648 0 $80 $30
1983 173 3,271 2 $100 $45
1984 50 543 1 $53 $30
1985 37 375 0 $43 $29
1986 77 1,217 0 $80 $45
1987 58 1,324 0 $131 $59
1988 28 888 0 $166 $102
1989 35 748 0 $104 $65
1990 31 747 0 $116 $83
1991 70 2,738 0 $176 $124
1992 113 5,847 1 $193 $102
1993 126 5,415 1 $238 $86
1994 117 3,659 1 $148 $83
1995 204 9,781 10 $245 $139
1996 274 16,185 5 $359 $138
1997 173 7,447 2 $264 $113
1998 113 8,118 12 $568 $234
1999 371 33,792 114 $1,212 $489
2000 261 42,498 69 $1,982 $682
2001 23 5,773 0 $1,190 $367
2002 20 2,587 0 $617 $339
2003 18 2,242 0 $519 $422
2004 61 9,064 0 $974 $325
2005 45 6,994 0 $581 $307
2006 48 4,873 0 $496 $352
2007 75 11,371 0 $1,029 $542
2008 6 1,194 0 $969 $841
2009 14 4,125 0 $1,165 $646
2010 33 4,347 0 $753 $548
2011 36 9,412 1 $2,261 $824
2012 39 20,250 1 $3,019 $661
2013 43 8,486 1 $1,760 $827
2014 53 9,965 2 $1,593 $780
2015 35 9,520 0 $2,066 $812
1980-2015 2,995 223
21
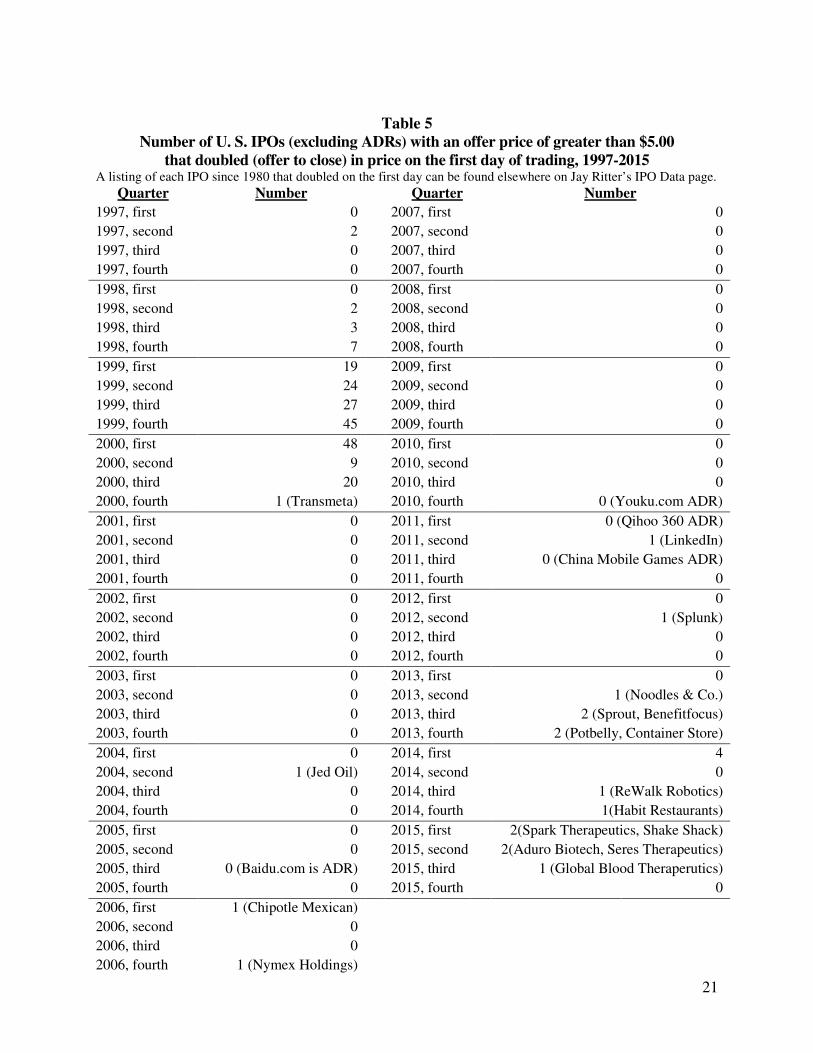
Table 5 Number of U. S. IPOs (excluding ADRs) with an offer price of greater than $5.00
that doubled (offer to close) in price on the first day of trading, 1997-2015 A listing of each IPO since 1980 that doubled on the first day can be found elsewhere on Jay Ritter’s IPO Data page.
Quarter Number Quarter Number
1997, first 0 2007, first 0
1997, second 2 2007, second 0
1997, third 0 2007, third 0
1997, fourth 0 2007, fourth 0
1998, first 0 2008, first 0
1998, second 2 2008, second 0
1998, third 3 2008, third 0
1998, fourth 7 2008, fourth 0
1999, first 19 2009, first 0
1999, second 24 2009, second 0
1999, third 27 2009, third 0
1999, fourth 45 2009, fourth 0
2000, first 48 2010, first 0
2000, second 9 2010, second 0
2000, third 20 2010, third 0
2000, fourth 1 (Transmeta) 2010, fourth 0 (Youku.com ADR)
2001, first 0 2011, first 0 (Qihoo 360 ADR)
2001, second 0 2011, second 1 (LinkedIn)
2001, third 0 2011, third 0 (China Mobile Games ADR)
2001, fourth 0 2011, fourth 0
2002, first 0 2012, first 0
2002, second 0 2012, second 1 (Splunk)
2002, third 0 2012, third 0
2002, fourth 0 2012, fourth 0
2003, first 0 2013, first 0
2003, second 0 2013, second 1 (Noodles & Co.)
2003, third 0 2013, third 2 (Sprout, Benefitfocus)
2003, fourth 0 2013, fourth 2 (Potbelly, Container Store)
2004, first 0 2014, first 4
2004, second 1 (Jed Oil) 2014, second 0
2004, third 0 2014, third 1 (ReWalk Robotics)
2004, fourth 0 2014, fourth 1(Habit Restaurants)
2005, first 0 2015, first 2(Spark Therapeutics, Shake Shack)
2005, second 0 2015, second 2(Aduro Biotech, Seres Therapeutics)
2005, third 0 (Baidu.com is ADR) 2015, third 1 (Global Blood Theraperutics)
2005, fourth 0 2015, fourth 0
2006, first 1 (Chipotle Mexican)
2006, second 0
2006, third 0
2006, fourth 1 (Nymex Holdings)
22
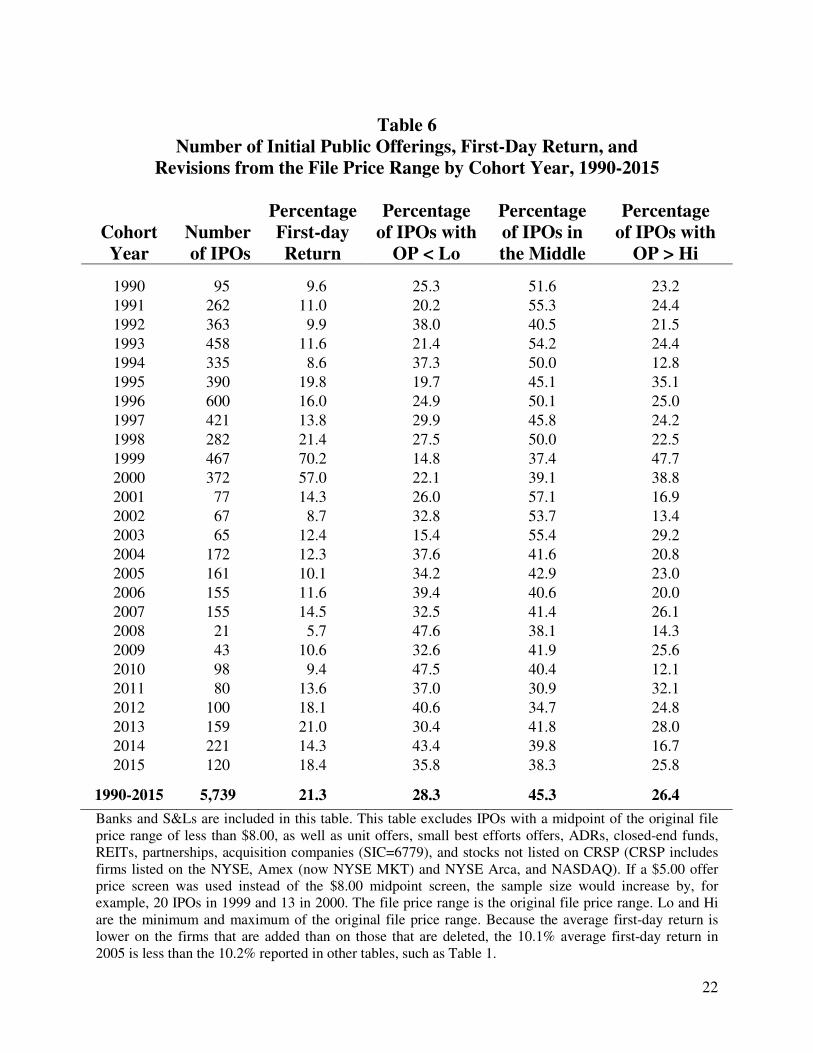
Table 6 Number of Initial Public Offerings, First-Day Return, and
Revisions from the File Price Range by Cohort Year, 1990-2015
Cohort Year
Number of IPOs
Percentage First-day Return
Percentage of IPOs with
OP < Lo
Percentage of IPOs in the Middle
Percentage of IPOs with
OP > Hi
1990 95 9.6 25.3 51.6 23.2
1991 262 11.0 20.2 55.3 24.4
1992 363 9.9 38.0 40.5 21.5
1993 458 11.6 21.4 54.2 24.4
1994 335 8.6 37.3 50.0 12.8
1995 390 19.8 19.7 45.1 35.1
1996 600 16.0 24.9 50.1 25.0
1997 421 13.8 29.9 45.8 24.2
1998 282 21.4 27.5 50.0 22.5
1999 467 70.2 14.8 37.4 47.7
2000 372 57.0 22.1 39.1 38.8
2001 77 14.3 26.0 57.1 16.9
2002 67 8.7 32.8 53.7 13.4
2003 65 12.4 15.4 55.4 29.2
2004 172 12.3 37.6 41.6 20.8
2005 161 10.1 34.2 42.9 23.0
2006 155 11.6 39.4 40.6 20.0
2007 155 14.5 32.5 41.4 26.1
2008 21 5.7 47.6 38.1 14.3
2009 43 10.6 32.6 41.9 25.6
2010 98 9.4 47.5 40.4 12.1
2011 80 13.6 37.0 30.9 32.1
2012 100 18.1 40.6 34.7 24.8
2013 159 21.0 30.4 41.8 28.0
2014 221 14.3 43.4 39.8 16.7
2015 120 18.4 35.8 38.3 25.8
1990-2015 5,739 21.3 28.3 45.3 26.4
Banks and S&Ls are included in this table. This table excludes IPOs with a midpoint of the original file price range of less than $8.00, as well as unit offers, small best efforts offers, ADRs, closed-end funds, REITs, partnerships, acquisition companies (SIC=6779), and stocks not listed on CRSP (CRSP includes firms listed on the NYSE, Amex (now NYSE MKT) and NYSE Arca, and NASDAQ). If a $5.00 offer price screen was used instead of the $8.00 midpoint screen, the sample size would increase by, for example, 20 IPOs in 1999 and 13 in 2000. The file price range is the original file price range. Lo and Hi are the minimum and maximum of the original file price range. Because the average first-day return is lower on the firms that are added than on those that are deleted, the 10.1% average first-day return in 2005 is less than the 10.2% reported in other tables, such as Table 1.
23
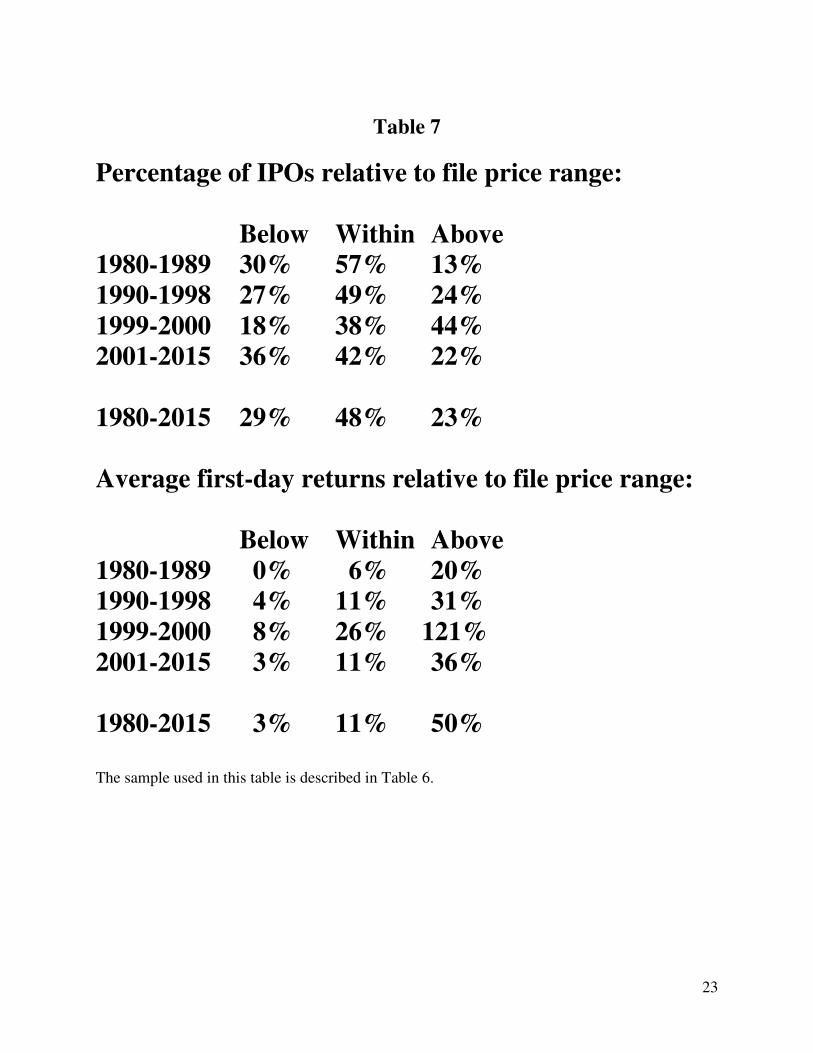
Table 7
Percentage of IPOs relative to file price range: Below Within Above 1980-1989 30% 57% 13% 1990-1998 27% 49% 24% 1999-2000 18% 38% 44% 2001-2015 36% 42% 22% 1980-2015 29% 48% 23% Average first-day returns relative to file price range: Below Within Above 1980-1989 0% 6% 20% 1990-1998 4% 11% 31% 1999-2000 8% 26% 121% 2001-2015 3% 11% 36% 1980-2015 3% 11% 50% The sample used in this table is described in Table 6.
24
Table 8
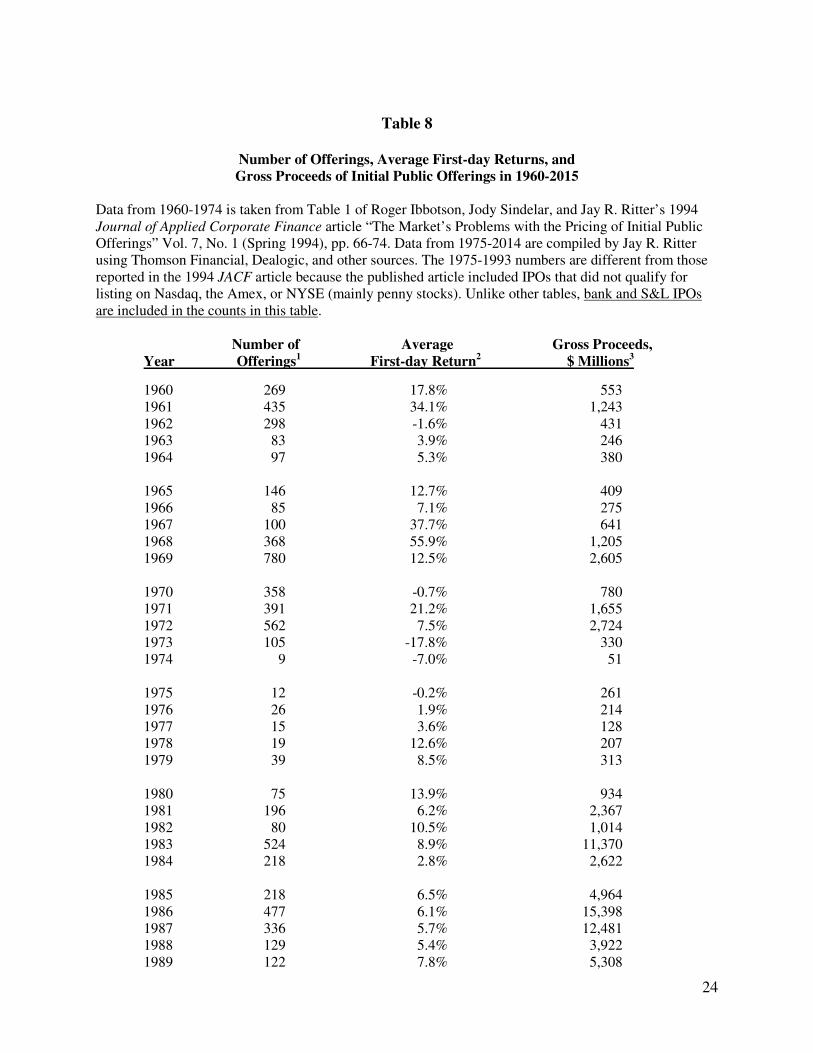
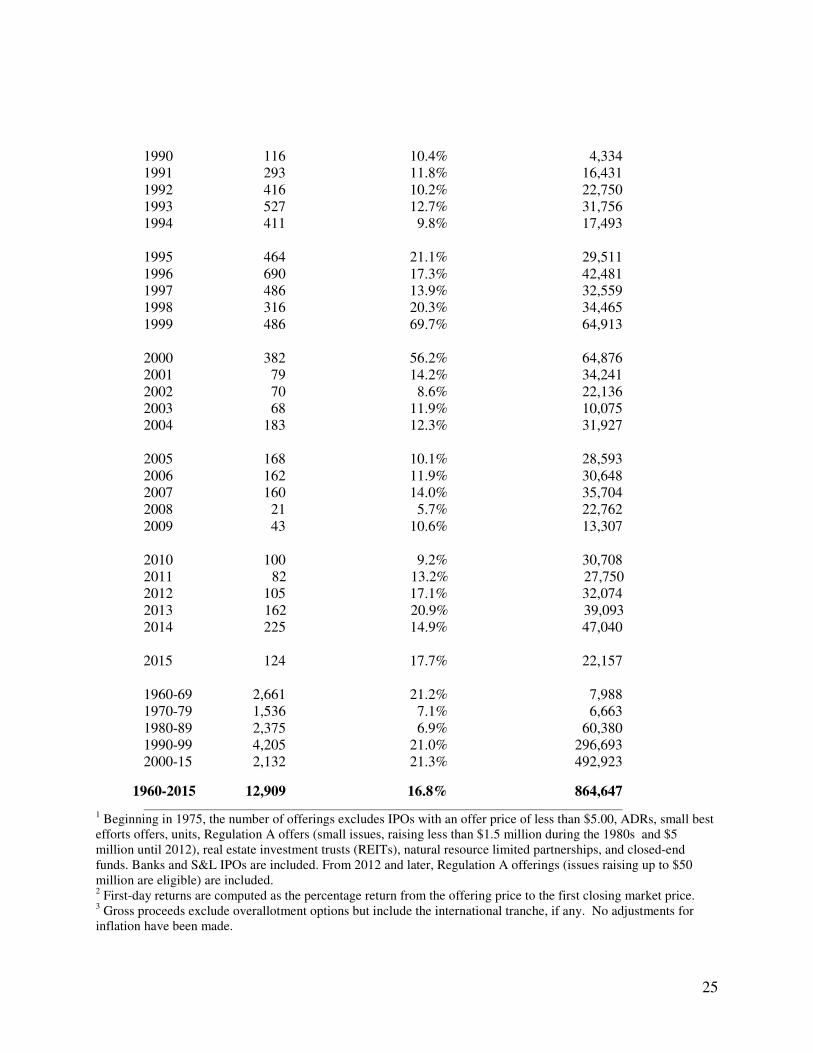
Number of Offerings, Average First-day Returns, and Gross Proceeds of Initial Public Offerings in 1960-2015
Data from 1960-1974 is taken from Table 1 of Roger Ibbotson, Jody Sindelar, and Jay R. Ritter’s 1994 Journal of Applied Corporate Finance article “The Market’s Problems with the Pricing of Initial Public Offerings” Vol. 7, No. 1 (Spring 1994), pp. 66-74. Data from 1975-2014 are compiled by Jay R. Ritter using Thomson Financial, Dealogic, and other sources. The 1975-1993 numbers are different from those reported in the 1994 JACF article because the published article included IPOs that did not qualify for listing on Nasdaq, the Amex, or NYSE (mainly penny stocks). Unlike other tables, bank and S&L IPOs are included in the counts in this table. Number of Average Gross Proceeds, Year Offerings1 First-day Return2 $ Millions3
1960 269 17.8% 553 1961 435 34.1% 1,243
1962 298 -1.6% 431 1963 83 3.9% 246 1964 97 5.3% 380 1965 146 12.7% 409 1966 85 7.1% 275 1967 100 37.7% 641 1968 368 55.9% 1,205 1969 780 12.5% 2,605 1970 358 -0.7% 780 1971 391 21.2% 1,655 1972 562 7.5% 2,724 1973 105 -17.8% 330 1974 9 -7.0% 51
1975 12 -0.2% 261 1976 26 1.9% 214 1977 15 3.6% 128 1978 19 12.6% 207 1979 39 8.5% 313 1980 75 13.9% 934 1981 196 6.2% 2,367 1982 80 10.5% 1,014 1983 524 8.9% 11,370 1984 218 2.8% 2,622 1985 218 6.5% 4,964 1986 477 6.1% 15,398 1987 336 5.7% 12,481 1988 129 5.4% 3,922 1989 122 7.8% 5,308
25
1990 116 10.4% 4,334 1991 293 11.8% 16,431 1992 416 10.2% 22,750 1993 527 12.7% 31,756 1994 411 9.8% 17,493 1995 464 21.1% 29,511 1996 690 17.3% 42,481 1997 486 13.9% 32,559 1998 316 20.3% 34,465 1999 486 69.7% 64,913 2000 382 56.2% 64,876 2001 79 14.2% 34,241 2002 70 8.6% 22,136 2003 68 11.9% 10,075 2004 183 12.3% 31,927 2005 168 10.1% 28,593 2006 162 11.9% 30,648 2007 160 14.0% 35,704 2008 21 5.7% 22,762 2009 43 10.6% 13,307 2010 100 9.2% 30,708 2011 82 13.2% 27,750 2012 105 17.1% 32,074 2013 162 20.9% 39,093 2014 225 14.9% 47,040 2015 124 17.7% 22,157 1960-69 2,661 21.2% 7,988 1970-79 1,536 7.1% 6,663 1980-89 2,375 6.9% 60,380 1990-99 4,205 21.0% 296,693 2000-15 2,132 21.3% 492,923 1960-2015 12,909 16.8% 864,647 1 Beginning in 1975, the number of offerings excludes IPOs with an offer price of less than $5.00, ADRs, small best efforts offers, units, Regulation A offers (small issues, raising less than $1.5 million during the 1980s and $5 million until 2012), real estate investment trusts (REITs), natural resource limited partnerships, and closed-end funds. Banks and S&L IPOs are included. From 2012 and later, Regulation A offerings (issues raising up to $50 million are eligible) are included. 2 First-day returns are computed as the percentage return from the offering price to the first closing market price. 3 Gross proceeds exclude overallotment options but include the international tranche, if any. No adjustments for inflation have been made.
26
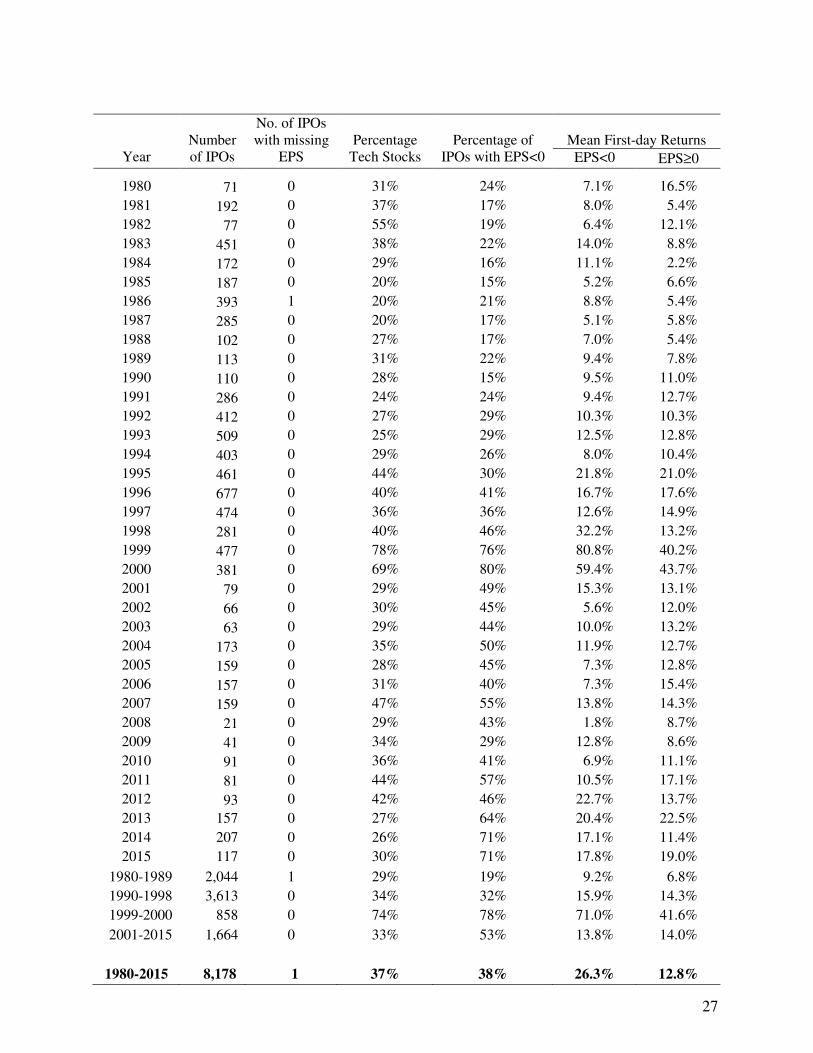
Table 9
Fraction of IPOs with Negative Earnings, 1980-2015
IPOs with an offer price below $5.00 per share, unit offers, ADRs, closed-end funds, partnerships, acquisition companies, REITs, bank and S&L IPOs, and firms not listed on CRSP within six months of the offer date are excluded. When available, I use the earnings per share for the most recent twelve months (commonly known as LTM for last twelve months) prior to going public. When a merger is involved, we use the pro forma numbers (as if the merger had already occurred). I am not completely consistent in the use of earnings before or after extraordinary items. Some extraordinary items are associated with the IPO, including gains or losses on conversion of convertible securities at the time of the IPO, or writeups or writedowns associated with mergers. I usually use the before extraordinary items EPS if the one-time charges are associated with the IPO. When the trailing twelve months EPS number is unavailable, I use the most recent fiscal year EPS number. Missing numbers are supplemented by direct inspection of prospectuses on EDGAR, EPS information from Dealogic for IPOs after 1991, and Howard and Co.’s Going Public: The IPO Reporter from 1980-1995. Remaining missing numbers have been found in the Graeme Howard-Todd Huxster collection of IPO prospectuses and the Stanford Business School microfiche collection of prospectuses from the 1980s. Don Patton of UC-Davis has tracked down a couple of remaining missing numbers. Tech stocks are defined as internet-related stocks plus other technology stocks, not including biotech. Loughran and Ritter (2004) list the SIC codes in their appendix 3 and sources of founding dates in appendix 1.
(on the next page)
27
Year
Number of IPOs
No. of IPOs with missing
EPS
Percentage
Tech Stocks
Percentage of
IPOs with EPS<0
Mean First-day Returns
EPS<0 EPS≥0
1980 71 0 31% 24% 7.1% 16.5%
1981 192 0 37% 17% 8.0% 5.4%
1982 77 0 55% 19% 6.4% 12.1%
1983 451 0 38% 22% 14.0% 8.8%
1984 172 0 29% 16% 11.1% 2.2%
1985 187 0 20% 15% 5.2% 6.6%
1986 393 1 20% 21% 8.8% 5.4%
1987 285 0 20% 17% 5.1% 5.8%
1988 102 0 27% 17% 7.0% 5.4%
1989 113 0 31% 22% 9.4% 7.8%
1990 110 0 28% 15% 9.5% 11.0%
1991 286 0 24% 24% 9.4% 12.7%
1992 412 0 27% 29% 10.3% 10.3%
1993 509 0 25% 29% 12.5% 12.8%
1994 403 0 29% 26% 8.0% 10.4%
1995 461 0 44% 30% 21.8% 21.0%
1996 677 0 40% 41% 16.7% 17.6%
1997 474 0 36% 36% 12.6% 14.9%
1998 281 0 40% 46% 32.2% 13.2%
1999 477 0 78% 76% 80.8% 40.2%
2000 381 0 69% 80% 59.4% 43.7%
2001 79 0 29% 49% 15.3% 13.1%
2002 66 0 30% 45% 5.6% 12.0%
2003 63 0 29% 44% 10.0% 13.2%
2004 173 0 35% 50% 11.9% 12.7%
2005 159 0 28% 45% 7.3% 12.8%
2006 157 0 31% 40% 7.3% 15.4%
2007 159 0 47% 55% 13.8% 14.3%
2008 21 0 29% 43% 1.8% 8.7%
2009 41 0 34% 29% 12.8% 8.6%
2010 91 0 36% 41% 6.9% 11.1%
2011 81 0 44% 57% 10.5% 17.1%
2012 93 0 42% 46% 22.7% 13.7%
2013 157 2,051
0 27% 64% 20.4% 22.5%
2014 207 0 26% 71% 17.1% 11.4%
2015 117 0 30% 71% 17.8% 19.0%
1980-1989 2,044 1 29% 19% 9.2% 6.8%
1990-1998 3,613 0 34% 32% 15.9% 14.3%
1999-2000 858 0 74% 78% 71.0% 41.6%
2001-2015 1,664 0 33% 53% 13.8% 14.0%
1980-2015 8,178 1 37% 38% 26.3% 12.8%
28
Table 10
Gross Spreads Continue to Remain at 7% on Moderate-Size Deals
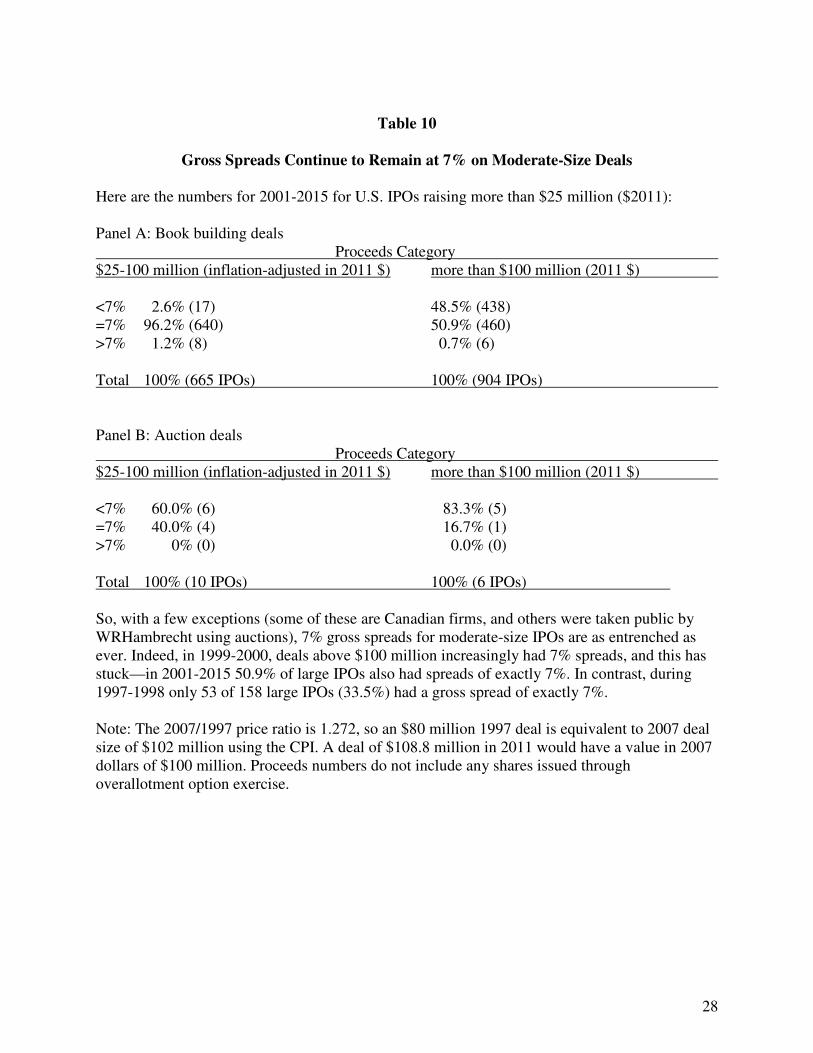
Here are the numbers for 2001-2015 for U.S. IPOs raising more than $25 million ($2011): Panel A: Book building deals Proceeds Category $25-100 million (inflation-adjusted in 2011 $) more than $100 million (2011 $) <7% 2.6% (17) 48.5% (438) =7% 96.2% (640) 50.9% (460) >7% 1.2% (8) 0.7% (6) Total 100% (665 IPOs) 100% (904 IPOs) Panel B: Auction deals Proceeds Category $25-100 million (inflation-adjusted in 2011 $) more than $100 million (2011 $) <7% 60.0% (6) 83.3% (5) =7% 40.0% (4) 16.7% (1) >7% 0% (0) 0.0% (0) Total 100% (10 IPOs) 100% (6 IPOs) So, with a few exceptions (some of these are Canadian firms, and others were taken public by WRHambrecht using auctions), 7% gross spreads for moderate-size IPOs are as entrenched as ever. Indeed, in 1999-2000, deals above $100 million increasingly had 7% spreads, and this has stuck—in 2001-2015 50.9% of large IPOs also had spreads of exactly 7%. In contrast, during 1997-1998 only 53 of 158 large IPOs (33.5%) had a gross spread of exactly 7%. Note: The 2007/1997 price ratio is 1.272, so an $80 million 1997 deal is equivalent to 2007 deal size of $102 million using the CPI. A deal of $108.8 million in 2011 would have a value in 2007 dollars of $100 million. Proceeds numbers do not include any shares issued through overallotment option exercise.
29
Table 11
Mean and Median Gross Spreads and Number of Managing Underwriters, 1980-2015
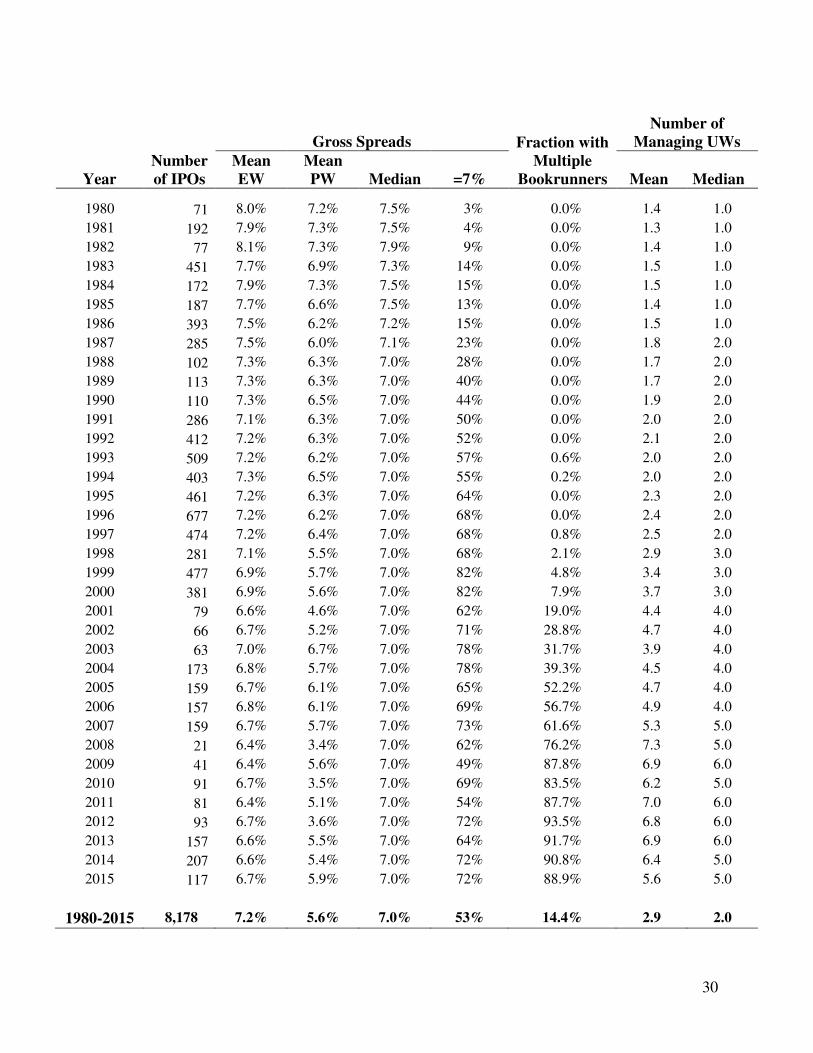
IPOs with an offer price below $5.00 per share, unit offers, ADRs, closed-end funds, REITs, bank and S&L IPOs, energy limited partnerships, and firms not listed on CRSP within six months of the offer date are excluded. EW is equally weighted and PW is proceeds-weighted. The fraction=7% is the percentage of IPOs with a gross spread equal to exactly 7%. The number of managing underwriters is the sum of both leads and co-managers. Spread data are available for all but one of the IPOs from 1984, resulting in a sample size of 8,177 rather than 8,178. The decrease in the fraction of IPOs with a 7% spread in 2001-2002 is due to the smaller fraction of deals with proceeds of less than $150 million. In 2008 (Visa with a spread of 2.8% on a $17.9 billion IPO), 2010 (General Motors with a spread of 0.75% on a $15.8 billion IPO), and 2012 (Facebook with a 1.1% spread on a $16 billion IPO) a higher fraction of IPOs were mega-deals with a gross spread far below 7%. UW is Underwriter.
30
Year
Number of IPOs
Gross Spreads
Fraction with
Multiple Bookrunners
Number of Managing UWs
Mean EW
Mean PW
Median
=7% Mean Median
1980 71 8.0% 7.2% 7.5% 3% 0.0% 1.4 1.0
1981 192 7.9% 7.3% 7.5% 4% 0.0% 1.3 1.0
1982 77 8.1% 7.3%
7.9% 9% 0.0% 1.4 1.0
1983 451 7.7% 6.9% 7.3% 14% 0.0% 1.5 1.0
1984 172 7.9% 7.3% 7.5% 15% 0.0% 1.5 1.0
1985 187 7.7% 6.6% 7.5% 13% 0.0% 1.4 1.0
1986 393 7.5% 6.2% 7.2% 15% 0.0% 1.5 1.0
1987 285 7.5% 6.0% 7.1% 23% 0.0% 1.8 2.0
1988 102 7.3% 6.3% 7.0% 28% 0.0% 1.7 2.0
1989 113 7.3% 6.3% 7.0% 40% 0.0% 1.7 2.0
1990 110 7.3% 6.5% 7.0% 44% 0.0% 1.9 2.0
1991 286 7.1% 6.3% 7.0% 50% 0.0% 2.0 2.0
1992 412 7.2% 6.3% 7.0% 52% 0.0% 2.1 2.0
1993 509 7.2% 6.2% 7.0% 57% 0.6% 2.0 2.0
1994 403 7.3% 6.5% 7.0% 55% 0.2% 2.0 2.0
1995 461 7.2% 6.3% 7.0% 64% 0.0% 2.3 2.0
1996 677 7.2% 6.2% 7.0% 68% 0.0% 2.4 2.0
1997 474 7.2% 6.4% 7.0% 68% 0.8% 2.5 2.0
1998 281 7.1% 5.5% 7.0% 68% 2.1% 2.9 3.0
1999 477 6.9% 5.7% 7.0% 82% 4.8% 3.4 3.0
2000 381 6.9% 5.6% 7.0% 82% 7.9% 3.7 3.0
2001 79 6.6% 4.6% 7.0% 62% 19.0% 4.4 4.0
2002 66 6.7% 5.2% 7.0% 71% 28.8% 4.7 4.0
2003 63 7.0% 6.7% 7.0% 78% 31.7% 3.9 4.0
2004 173 6.8% 5.7% 7.0% 78% 39.3% 4.5 4.0
2005 159 6.7% 6.1% 7.0% 65% 52.2% 4.7 4.0
2006 157 6.8% 6.1% 7.0% 69% 56.7% 4.9 4.0
2007 159 6.7% 5.7% 7.0% 73% 61.6% 5.3 5.0
2008 21 6.4% 3.4% 7.0% 62% 76.2% 7.3 5.0
2009 41 6.4% 5.6% 7.0% 49% 87.8% 6.9 6.0
2010 91 6.7% 3.5% 7.0% 69% 83.5% 6.2 5.0
2011 81 6.4% 5.1% 7.0% 54% 87.7% 7.0 6.0
2012 93 6.7% 3.6% 7.0% 72% 93.5% 6.8 6.0
2013 157 6.6% 5.5% 7.0% 64% 91.7% 6.9 6.0
2014 207 6.6% 5.4% 7.0% 72% 90.8% 6.4 5.0
2015 117 6.7% 5.9% 7.0% 72% 88.9% 5.6 5.0
1980-2015 8,178 7.2% 5.6% 7.0% 53% 14.4% 2.9 2.0
31
Table 11a Mean and Median Gross Spreads and Number of Managing Underwriters, 1975-2015
Year
Number of IPOs
Gross Spreads Fraction with Multiple
Bookrunners
Number of Managing UWs Mean
EW Mean PW
Median
=7% Mean Median
1975 12 7.2% 6.1% 7.6% 8% 0.0% 1.4 1.0 1976 26 7.5% 7.1% 7.6% 4% 0.0% 1.4 1.0 1977 15 7.5% 7.3% 7.8% 0% 0.0% 1.5 1.0 1978 18 7.4% 7.1% 7.5% 6% 0.0% 1.8 1.0 1979 38 7.8% 7.6% 7.5% 0% 0.0% 1.3 1.0 1980 71 8.0% 7.2% 7.5% 3% 0.0% 1.4 1.0 1981 192 7.9% 7.3% 7.5% 4% 0.0% 1.3 1.0 1982 77 8.1% 7.3%
7.9% 9% 0.0% 1.4 1.0
1983 451 7.7% 6.9% 7.3% 14% 0.0% 1.5 1.0 1984 172 7.9% 7.3% 7.5% 15% 0.0% 1.5 1.0 1985 187 7.7% 6.6% 7.5% 13% 0.0% 1.4 1.0 1986 393 7.5% 6.2% 7.2% 15% 0.0% 1.5 1.0 1987 285 7.5% 6.0% 7.1% 23% 0.0% 1.8 2.0 1988 102 7.3% 6.3% 7.0% 28% 0.0% 1.7 2.0 1989 113 7.3% 6.3% 7.0% 40% 0.0% 1.7 2.0 1990 110 7.3% 6.5% 7.0% 44% 0.0% 1.9 2.0 1991 286 7.1% 6.3% 7.0% 50% 0.0% 2.0 2.0 1992 412 7.2% 6.3% 7.0% 52% 0.0% 2.1 2.0 1993 509 7.2% 6.2% 7.0% 57% 0.6% 2.0 2.0 1994 403 7.3% 6.5% 7.0% 55% 0.2% 2.0 2.0 1995 461 7.2% 6.3% 7.0% 64% 0.0% 2.3 2.0 1996 677 7.2% 6.2% 7.0% 68% 0.0% 2.4 2.0 1997 474 7.2% 6.4% 7.0% 68% 0.8% 2.5 2.0 1998 281 7.1% 5.5% 7.0% 68% 2.1% 2.9 3.0 1999 477 6.9% 5.7% 7.0% 82% 4.8% 3.4 3.0 2000 381 6.9% 5.6% 7.0% 82% 7.9% 3.7 3.0 2001 79 6.6% 4.6% 7.0% 62% 19.0% 4.4 4.0 2002 66 6.7% 5.2% 7.0% 71% 28.8% 4.7 4.0 2003 63 7.0% 6.7% 7.0% 78% 31.7% 3.9 4.0 2004 173 6.8% 5.7% 7.0% 78% 39.3% 4.5 4.0 2005 159 6.7% 6.1% 7.0% 65% 52.2% 4.7 4.0 2006 157 6.8% 6.1% 7.0% 69% 56.7% 4.9 4.0 2007 159 6.7% 5.7% 7.0% 73% 61.6% 5.3 5.0 2008 21 6.4% 3.4% 7.0% 62% 76.2% 7.3 5.0 2009 41 6.4% 5.6% 7.0% 49% 87.8% 6.9 6.0 2010 91 6.7% 3.5% 7.0% 69% 83.5% 6.2 5.0 2011 81 6.4% 5.1% 7.0% 54% 87.7% 7.0 6.0 2012 93 6.7% 3.6% 7.0% 72% 93.5% 6.8 6.0 2013 157 6.6% 5.5% 7.0% 64% 91.7% 6.9 6.0 2014 207 6.6% 5.4% 7.0% 72% 90.8% 6.4 5.0 2015 117 6.7% 5.9% 7.0% 72% 88.9% 5.6 5.0
32
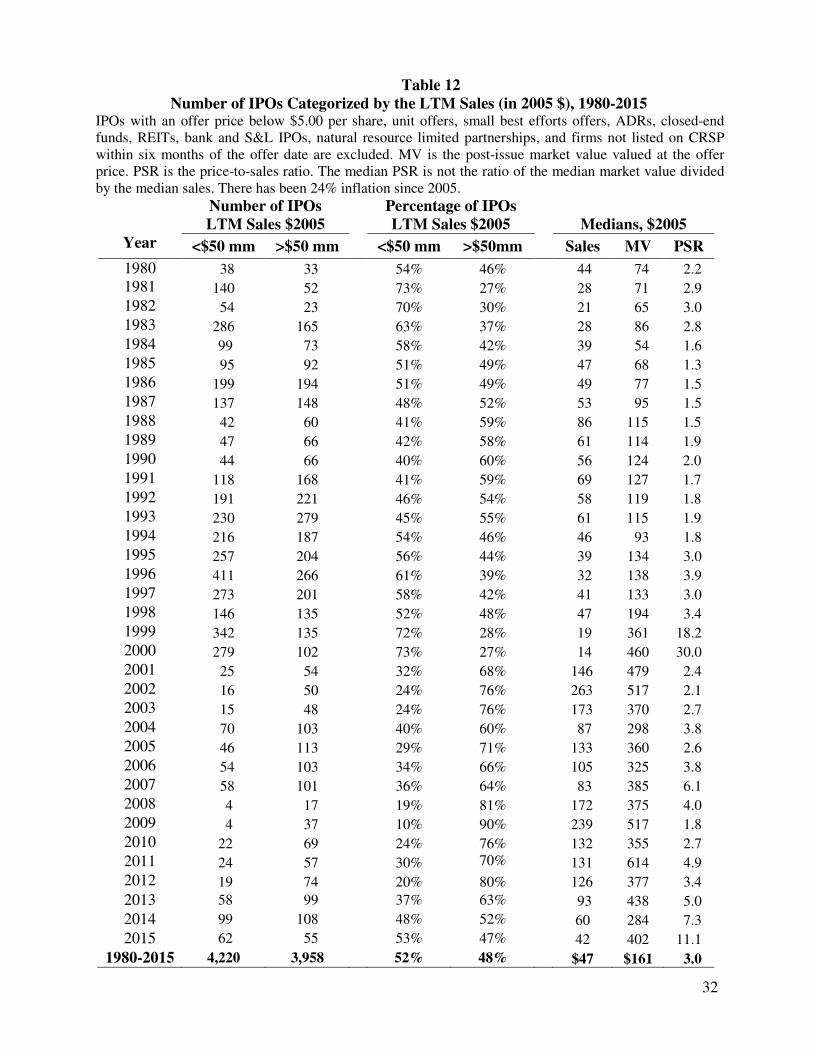
Table 12 Number of IPOs Categorized by the LTM Sales (in 2005 $), 1980-2015
IPOs with an offer price below $5.00 per share, unit offers, small best efforts offers, ADRs, closed-end funds, REITs, bank and S&L IPOs, natural resource limited partnerships, and firms not listed on CRSP within six months of the offer date are excluded. MV is the post-issue market value valued at the offer price. PSR is the price-to-sales ratio. The median PSR is not the ratio of the median market value divided by the median sales. There has been 24% inflation since 2005.
Year
Number of IPOs LTM Sales $2005
Percentage of IPOs LTM Sales $2005
Medians, $2005
<$50 mm >$50 mm <$50 mm >$50mm Sales MV PSR
1980 38 33 54% 46% 44 74 2.2
1981 140 52 73% 27% 28 71 2.9
1982 54 23 70% 30% 21 65 3.0
1983 286 165 63% 37% 28 86 2.8
1984 99 73 58% 42% 39 54 1.6
1985 95 92 51% 49% 47 68 1.3
1986 199 194 51% 49% 49 77 1.5
1987 137 148 48% 52% 53 95 1.5
1988 42 60 41% 59% 86 115 1.5
1989 47 66 42% 58% 61 114 1.9
1990 44 66 40% 60% 56 124 2.0
1991 118 168 41% 59% 69 127 1.7
1992 191 221 46% 54% 58 119 1.8
1993 230 279 45% 55% 61 115 1.9
1994 216 187 54% 46% 46 93 1.8
1995 257 204 56% 44% 39 134 3.0
1996 411 266 61% 39% 32 138 3.9
1997 273 201 58% 42% 41 133 3.0
1998 146 135 52% 48% 47 194 3.4
1999 342 135 72% 28% 19 361 18.2
2000 279 102 73% 27% 14 460 30.0
2001 25 54 32% 68% 146 479 2.4
2002 16 50 24% 76% 263 517 2.1
2003 15 48 24% 76% 173 370 2.7
2004 70 103 40% 60% 87 298 3.8
2005 46 113 29% 71% 133 360 2.6
2006 54 103 34% 66% 105 325 3.8
2007 58 101 36% 64% 83 385 6.1
2008 4 17 19% 81% 172 375 4.0
2009 4 37 10% 90% 239 517 1.8
2010 22 69 24% 76% 132 355 2.7
2011 24 57 30% 70% 80
131 614 4.9
2012 19 74 20% 80% 126 377 3.4
2013 58 99 37% 63% 93 438 5.0
2014 99 108 48% 52% 60 284 7.3
2015 62 55 53% 47% 42 402 11.1
1980-2015 4,220 3,958 52% 48% $47 $161 3.0
33
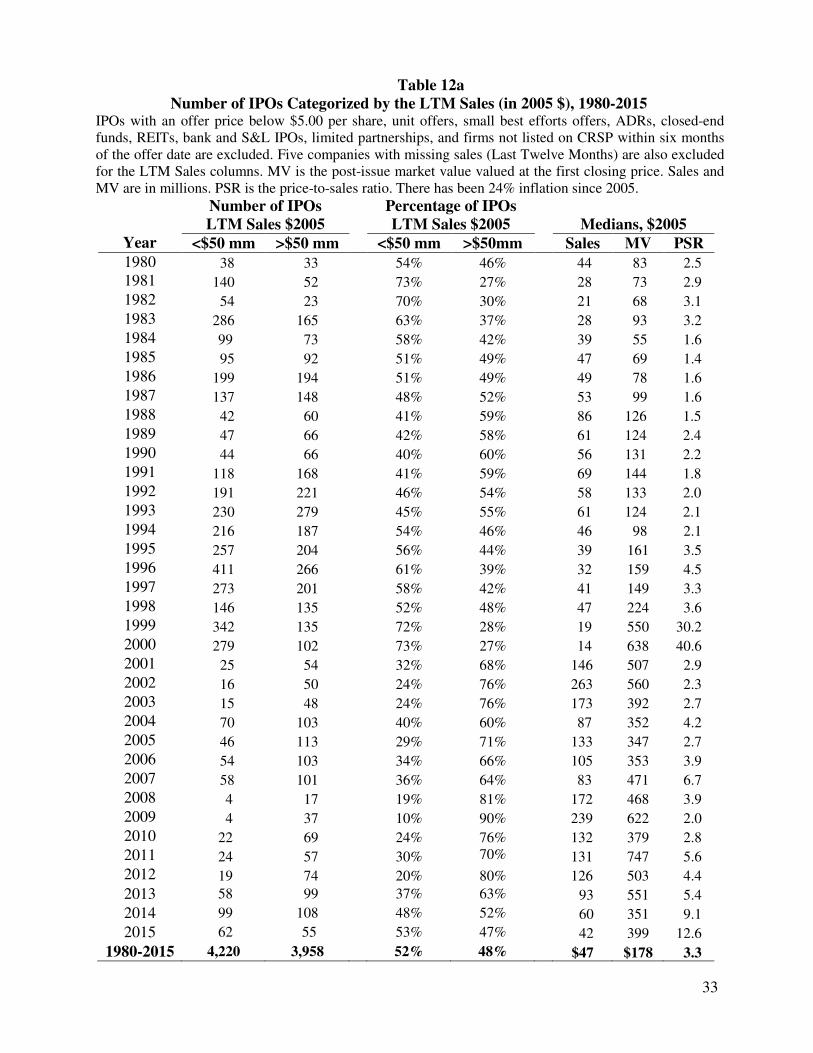
Table 12a Number of IPOs Categorized by the LTM Sales (in 2005 $), 1980-2015
IPOs with an offer price below $5.00 per share, unit offers, small best efforts offers, ADRs, closed-end funds, REITs, bank and S&L IPOs, limited partnerships, and firms not listed on CRSP within six months of the offer date are excluded. Five companies with missing sales (Last Twelve Months) are also excluded for the LTM Sales columns. MV is the post-issue market value valued at the first closing price. Sales and MV are in millions. PSR is the price-to-sales ratio. There has been 24% inflation since 2005.
Year
Number of IPOs LTM Sales $2005
Percentage of IPOs LTM Sales $2005
Medians, $2005
<$50 mm >$50 mm <$50 mm >$50mm Sales MV PSR 1980 38 33 54% 46% 44 83 2.5
1981 140 52 73% 27% 28 73 2.9
1982 54 23 70% 30% 21 68 3.1
1983 286 165 63% 37% 28 93 3.2
1984 99 73 58% 42% 39 55 1.6
1985 95 92 51% 49% 47 69 1.4
1986 199 194 51% 49% 49 78 1.6
1987 137 148 48% 52% 53 99 1.6
1988 42 60 41% 59% 86 126 1.5
1989 47 66 42% 58% 61 124 2.4
1990 44 66 40% 60% 56 131 2.2
1991 118 168 41% 59% 69 144 1.8
1992 191 221 46% 54% 58 133 2.0
1993 230 279 45% 55% 61 124 2.1
1994 216 187 54% 46% 46 98 2.1
1995 257 204 56% 44% 39 161 3.5
1996 411 266 61% 39% 32 159 4.5
1997 273 201 58% 42% 41 149 3.3
1998 146 135 52% 48% 47 224 3.6
1999 342 135 72% 28% 19 550 30.2
2000 279 102 73% 27% 14 638 40.6
2001 25 54 32% 68% 146 507 2.9
2002 16 50 24% 76% 263 560 2.3
2003 15 48 24% 76% 173 392 2.7
2004 70 103 40% 60% 87 352 4.2
2005 46 113 29% 71% 133 347 2.7
2006 54 103 34% 66% 105 353 3.9
2007 58 101 36% 64% 83 471 6.7
2008 4 17 19% 81% 172 468 3.9
2009 4 37 10% 90% 239 622 2.0
2010 22 69 24% 76% 132 379 2.8
2011 24 57 30% 70% 80
131 747 5.6
2012 19 74 20% 80% 126 503 4.4
2013 58 99 37% 63% 93 551 5.4
2014 99 108 48% 52% 60 351 9.1
2015 62 55 53% 47% 42 399 12.6
1980-2015 4,220 3,958 52% 48% $47 $178 3.3
34
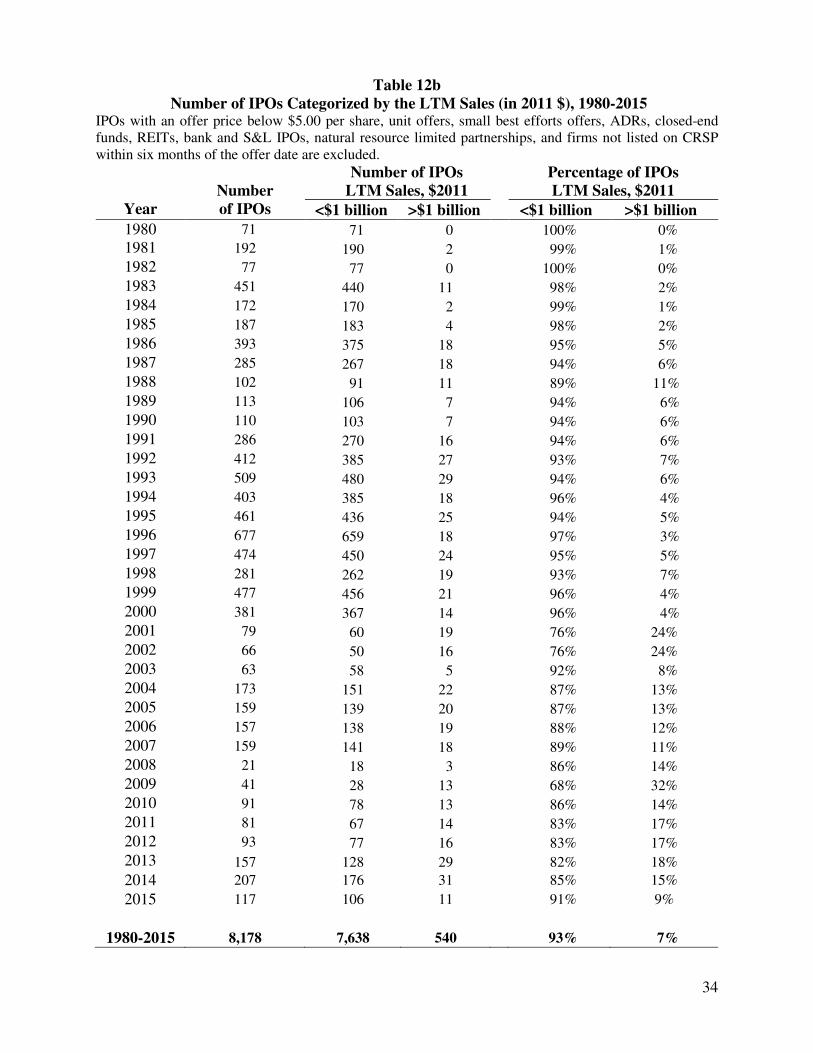
Table 12b Number of IPOs Categorized by the LTM Sales (in 2011 $), 1980-2015
IPOs with an offer price below $5.00 per share, unit offers, small best efforts offers, ADRs, closed-end funds, REITs, bank and S&L IPOs, natural resource limited partnerships, and firms not listed on CRSP within six months of the offer date are excluded.
Year
Number of IPOs
Number of IPOs LTM Sales, $2011
Percentage of IPOs LTM Sales, $2011
<$1 billion >$1 billion <$1 billion >$1 billion
1980 71 71 0 100% 0%
1981 192 190 2 99% 1%
1982 77 77 0 100% 0%
1983 451 440 11 98% 2%
1984 172 170 2 99% 1%
1985 187 183 4 98% 2%
1986 393 375 18 95% 5%
1987 285 267 18 94% 6%
1988 102 91 11 89% 11%
1989 113 106 7 94% 6%
1990 110 103 7 94% 6%
1991 286 270 16 94% 6%
1992 412 385 27 93% 7%
1993 509 480 29 94% 6%
1994 403 385 18 96% 4%
1995 461 436 25 94% 5%
1996 677 659 18 97% 3%
1997 474 450 24 95% 5%
1998 281 262 19 93% 7%
1999 477 456 21 96% 4%
2000 381 367 14 96% 4%
2001 79 60 19 76% 24%
2002 66 50 16 76% 24%
2003 63 58 5 92% 8%
2004 173 151 22 87% 13%
2005 159 139 20 87% 13%
2006 157 138 19 88% 12%
2007 159 141 18 89% 11%
2008 21 18 3 86% 14%
2009 41 28 13 68% 32%
2010 91 78 13 86% 14%
2011 81 67 14 83% 17%
2012 93 77 16 83% 17%
2013 157 128 29 82% 18%
2014 207 176 31 85% 15%
2015 117 106 11 91% 9%
1980-2015 8,178 7,638 540 93% 7%
35
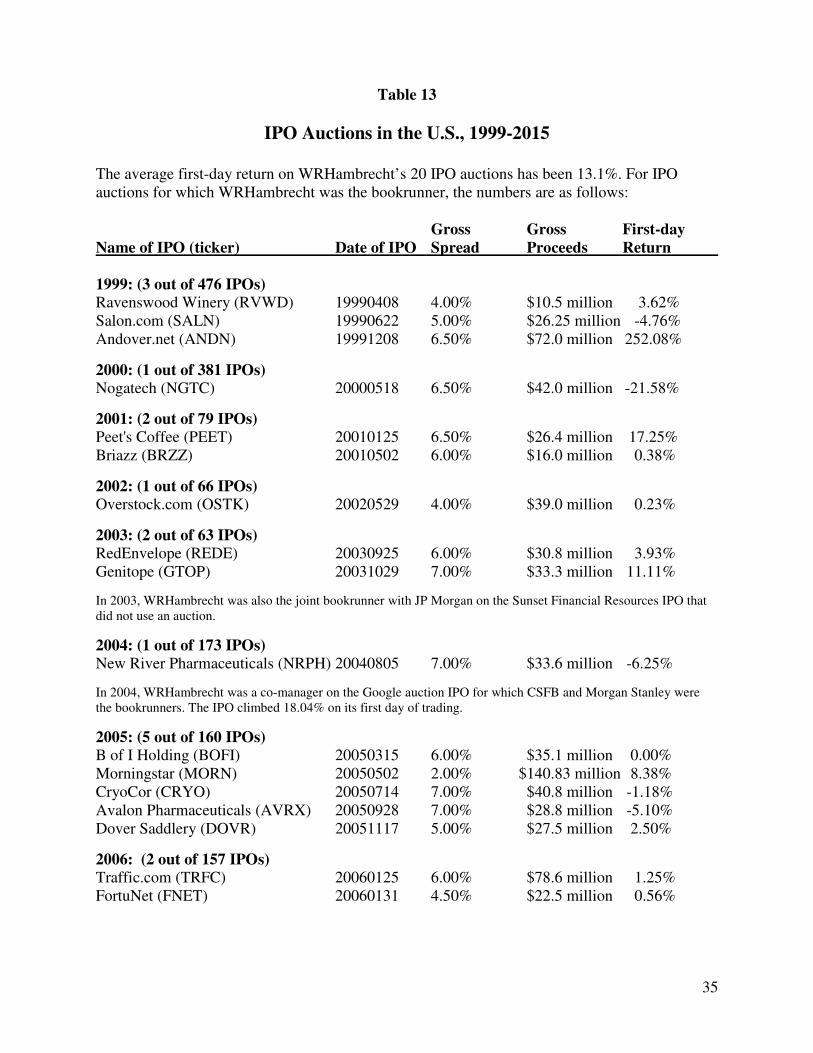
Table 13
IPO Auctions in the U.S., 1999-2015
The average first-day return on WRHambrecht’s 20 IPO auctions has been 13.1%. For IPO auctions for which WRHambrecht was the bookrunner, the numbers are as follows: Gross Gross First-day Name of IPO (ticker) Date of IPO Spread Proceeds Return 1999: (3 out of 476 IPOs) Ravenswood Winery (RVWD) 19990408 4.00% $10.5 million 3.62% Salon.com (SALN) 19990622 5.00% $26.25 million -4.76% Andover.net (ANDN) 19991208 6.50% $72.0 million 252.08%
2000: (1 out of 381 IPOs) Nogatech (NGTC) 20000518 6.50% $42.0 million -21.58%
2001: (2 out of 79 IPOs) Peet's Coffee (PEET) 20010125 6.50% $26.4 million 17.25% Briazz (BRZZ) 20010502 6.00% $16.0 million 0.38%
2002: (1 out of 66 IPOs) Overstock.com (OSTK) 20020529 4.00% $39.0 million 0.23%
2003: (2 out of 63 IPOs) RedEnvelope (REDE) 20030925 6.00% $30.8 million 3.93% Genitope (GTOP) 20031029 7.00% $33.3 million 11.11%
In 2003, WRHambrecht was also the joint bookrunner with JP Morgan on the Sunset Financial Resources IPO that did not use an auction.
2004: (1 out of 173 IPOs) New River Pharmaceuticals (NRPH) 20040805 7.00% $33.6 million -6.25%
In 2004, WRHambrecht was a co-manager on the Google auction IPO for which CSFB and Morgan Stanley were the bookrunners. The IPO climbed 18.04% on its first day of trading.
2005: (5 out of 160 IPOs) B of I Holding (BOFI) 20050315 6.00% $35.1 million 0.00% Morningstar (MORN) 20050502 2.00% $140.83 million 8.38% CryoCor (CRYO) 20050714 7.00% $40.8 million -1.18% Avalon Pharmaceuticals (AVRX) 20050928 7.00% $28.8 million -5.10% Dover Saddlery (DOVR) 20051117 5.00% $27.5 million 2.50%
2006: (2 out of 157 IPOs) Traffic.com (TRFC) 20060125 6.00% $78.6 million 1.25% FortuNet (FNET) 20060131 4.50% $22.5 million 0.56%
36
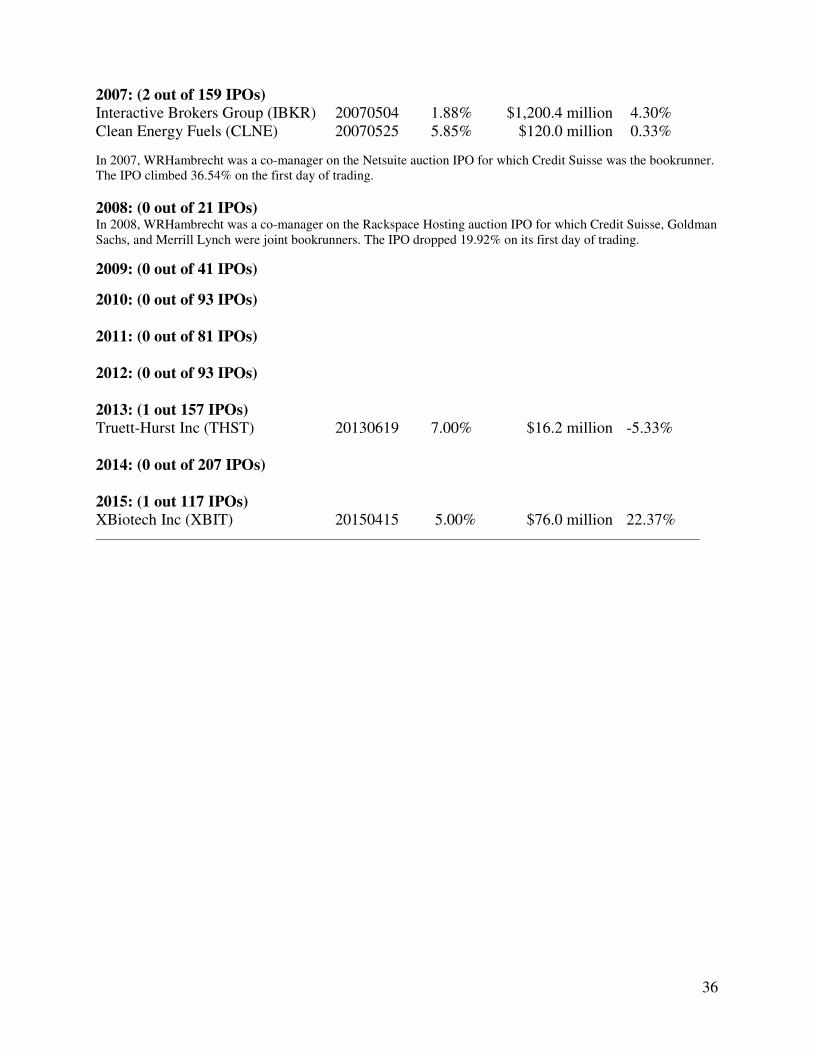
2007: (2 out of 159 IPOs) Interactive Brokers Group (IBKR) 20070504 1.88% $1,200.4 million 4.30% Clean Energy Fuels (CLNE) 20070525 5.85% $120.0 million 0.33%
In 2007, WRHambrecht was a co-manager on the Netsuite auction IPO for which Credit Suisse was the bookrunner. The IPO climbed 36.54% on the first day of trading.
2008: (0 out of 21 IPOs) In 2008, WRHambrecht was a co-manager on the Rackspace Hosting auction IPO for which Credit Suisse, Goldman Sachs, and Merrill Lynch were joint bookrunners. The IPO dropped 19.92% on its first day of trading.
2009: (0 out of 41 IPOs)
2010: (0 out of 93 IPOs) 2011: (0 out of 81 IPOs) 2012: (0 out of 93 IPOs) 2013: (1 out 157 IPOs) Truett-Hurst Inc (THST) 20130619 7.00% $16.2 million -5.33% 2014: (0 out of 207 IPOs) 2015: (1 out 117 IPOs) XBiotech Inc (XBIT) 20150415 5.00% $76.0 million 22.37%
37
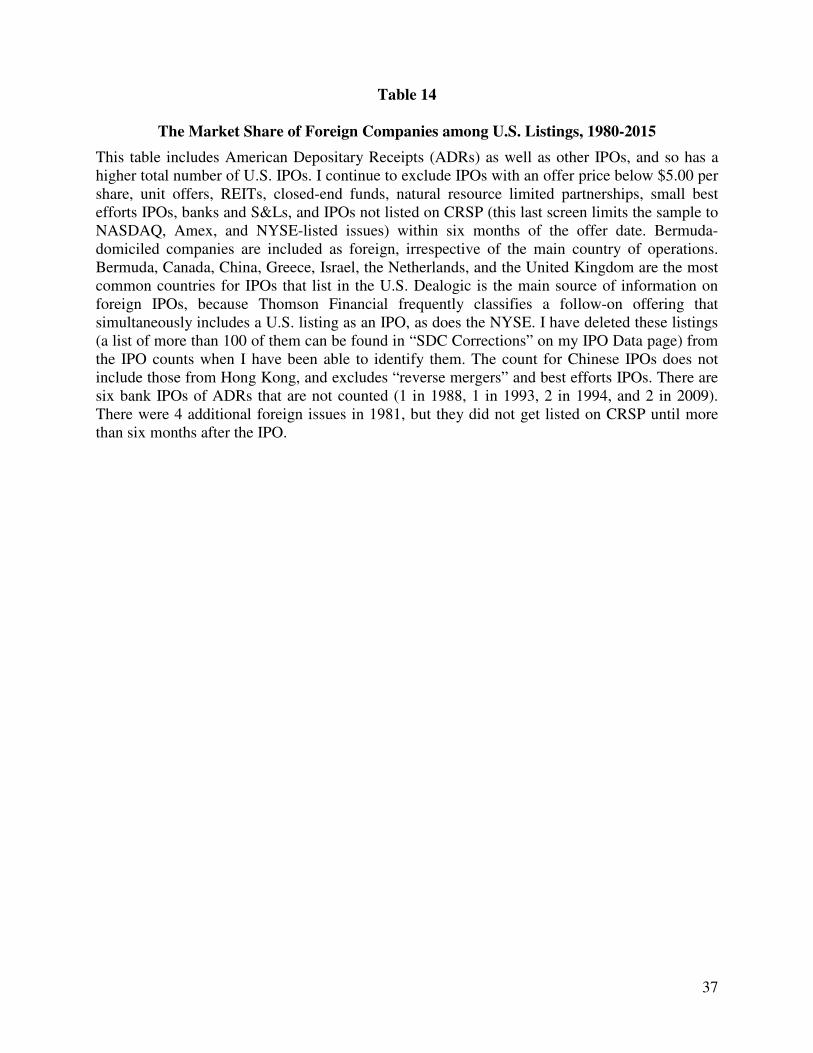
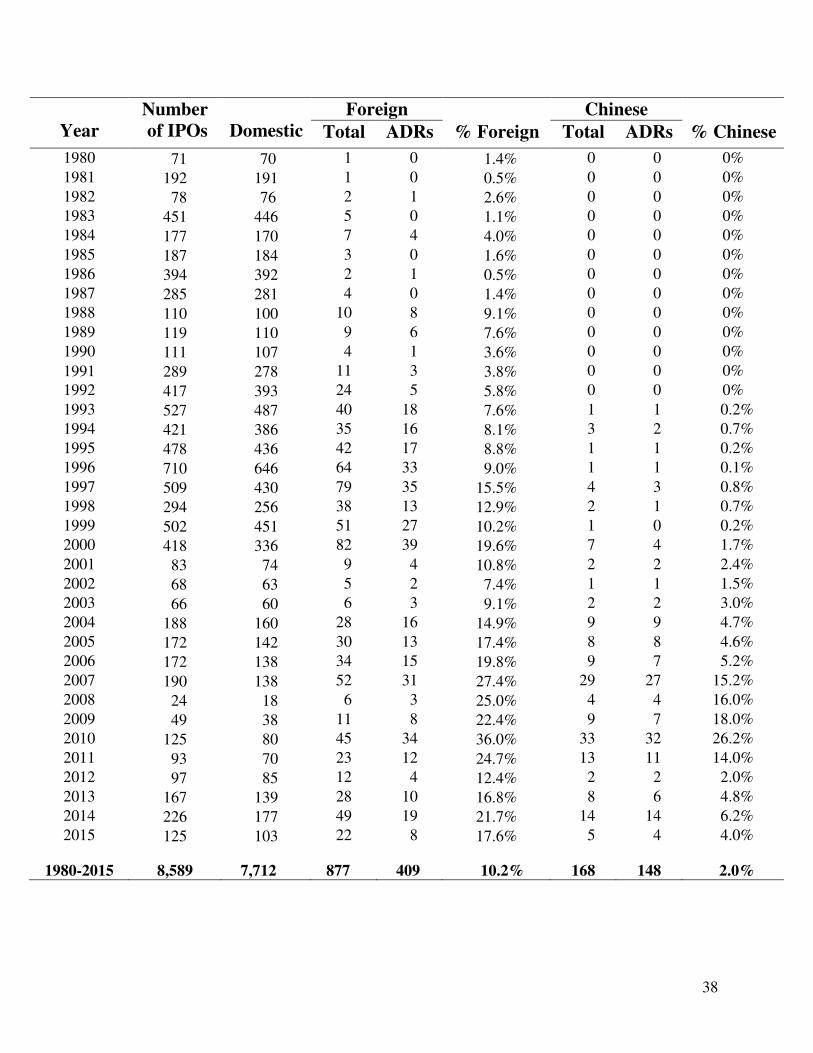
Table 14
The Market Share of Foreign Companies among U.S. Listings, 1980-2015
This table includes American Depositary Receipts (ADRs) as well as other IPOs, and so has a higher total number of U.S. IPOs. I continue to exclude IPOs with an offer price below $5.00 per share, unit offers, REITs, closed-end funds, natural resource limited partnerships, small best efforts IPOs, banks and S&Ls, and IPOs not listed on CRSP (this last screen limits the sample to NASDAQ, Amex, and NYSE-listed issues) within six months of the offer date. Bermuda-domiciled companies are included as foreign, irrespective of the main country of operations. Bermuda, Canada, China, Greece, Israel, the Netherlands, and the United Kingdom are the most common countries for IPOs that list in the U.S. Dealogic is the main source of information on foreign IPOs, because Thomson Financial frequently classifies a follow-on offering that simultaneously includes a U.S. listing as an IPO, as does the NYSE. I have deleted these listings (a list of more than 100 of them can be found in “SDC Corrections” on my IPO Data page) from the IPO counts when I have been able to identify them. The count for Chinese IPOs does not include those from Hong Kong, and excludes “reverse mergers” and best efforts IPOs. There are six bank IPOs of ADRs that are not counted (1 in 1988, 1 in 1993, 2 in 1994, and 2 in 2009). There were 4 additional foreign issues in 1981, but they did not get listed on CRSP until more than six months after the IPO.
38
Year
Number of IPOs
Domestic
Foreign Chinese
Total ADRs % Foreign Total ADRs % Chinese
1980 71 70 1 0 1.4% 0 0 0%
1981 192 191 1 0 0.5% 0 0 0%
1982 78 76 2 1 2.6% 0 0 0%
1983 451 446 5 0 1.1% 0 0 0%
1984 177 170 7 4 4.0% 0 0 0%
1985 187 184 3 0 1.6% 0 0 0%
1986 394 392 2 1 0.5% 0 0 0%
1987 285 281 4 0 1.4% 0 0 0%
1988 110 100 10 8 9.1% 0 0 0%
1989 119 110 9 6 7.6% 0 0 0%
1990 111 107 4 1 3.6% 0 0 0%
1991 289 278 11 3 3.8% 0 0 0%
1992 417 393 24 5 5.8% 0 0 0%
1993 527 487 40 18 7.6% 1 1 0.2%
1994 421 386 35 16 8.1% 3 2 0.7%
1995 478 436 42 17 8.8% 1 1 0.2%
1996 710 646 64 33 9.0% 1 1 0.1%
1997 509 430 79 35 15.5% 4 3 0.8%
1998 294 256 38 13 12.9% 2 1 0.7%
1999 502 451 51 27 10.2% 1 0 0.2%
2000 418 336 82 39 19.6% 7 4 1.7%
2001 83 74 9 4 10.8% 2 2 2.4%
2002 68 63 5 2 7.4% 1 1 1.5%
2003 66 60 6 3 9.1% 2 2 3.0%
2004 188 160 28 16 14.9% 9 9 4.7%
2005 172 142 30 13 17.4% 8 8 4.6%
2006 172 138 34 15 19.8% 9 7 5.2%
2007 190 138 52 31 27.4% 29 27 15.2%
2008 24 18 6 3 25.0% 4 4 16.0%
2009 49 38 11 8 22.4% 9 7 18.0%
2010 125 80 45 34 36.0% 33 32 26.2%
2011 93 70 23 12 24.7% 13 11 14.0%
2012 97 85 12 4 12.4% 2 2 2.0%
2013 167 139 28 10 16.8% 8 6 4.8%
2014 226 177 49 19 21.7% 14 14 6.2%
2015 125 103 22 8 17.6% 5 4 4.0%
1980-2015 8,589 7,712 877 409 10.2% 168 148 2.0%
39
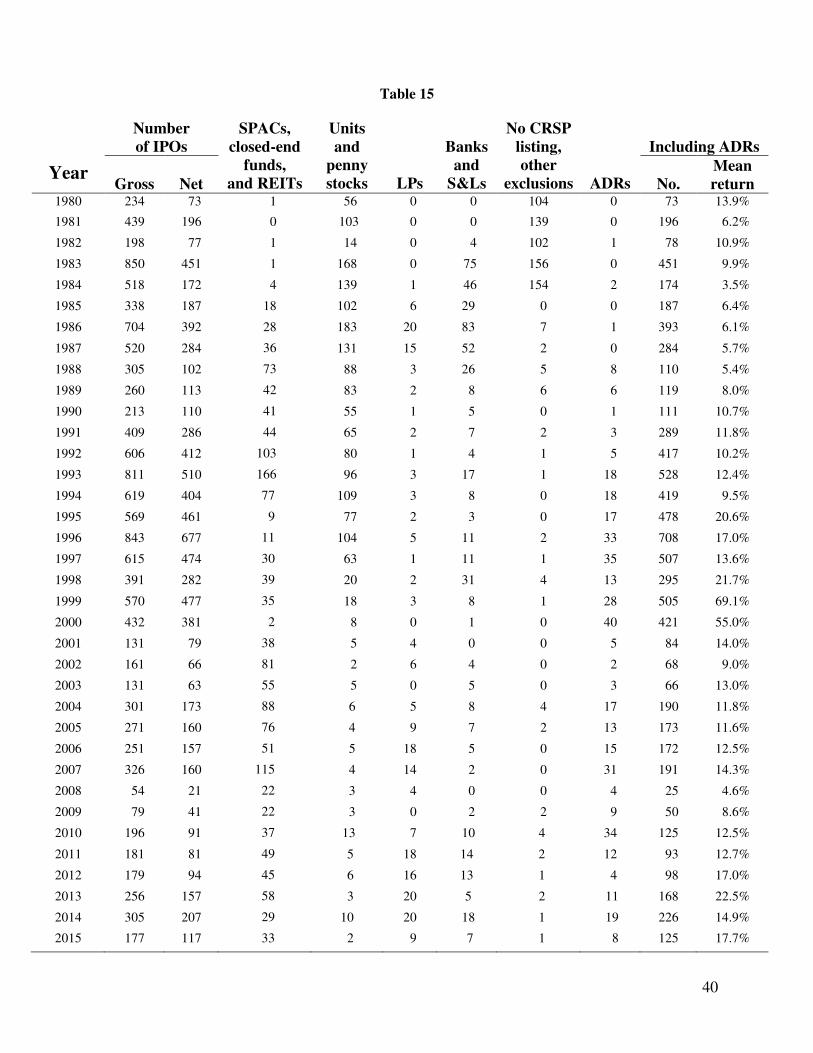
Table 15
How Many IPOs Are There?
The net number of IPOs excludes Special Purpose Acquisition Companies (SPACs), closed-end funds, Real Estate Investment Trusts (REITs), unit offers (typically composed of a share plus a warrant to buy a share), IPOs with an offer price of less than $5.00, commercial banks and savings and loans, companies not promptly listed on the Amex, NYSE, or Nasdaq, master limited partnerships, small best efforts offers (included in the other exclusions column), and foreign companies issuing American Depositary Receipts (6 of which are banks). For 1993-1994, 4 ADRs are missing a first-day return, and the “including ADRs” averages exclude them. SPACs that are unit offers are classified as SPACs rather than units. No CRSP listing refers to IPOs not listed on CRSP within six months of the IPO. CRSP covers stocks listed on Nasdaq, the NYSE, and the NYSE MKT (the Amex prior to May 10, 2012).
40
Table 15
Year
Number of IPOs
SPACs, closed-end
funds, and REITs
Units and
penny stocks
LPs
Banks
and S&Ls
No CRSP listing, other
exclusions
ADRs
Including ADRs
Gross
Net
No.
Mean return
1980 234 73 1 56 0 0 104 0 73 13.9%
1981 439 196 0 103 0 0 139 0 196 6.2%
1982 198 77 1 14 0 4 102 1 78 10.9%
1983 850 451 1 168 0 75 156 0 451 9.9%
1984 518 172 4 139 1 46 154 2 174 3.5%
1985 338 187 18 102 6 29 0 0 187 6.4%
1986 704 392 28 183 20 83 7 1 393 6.1%
1987 520 284 36 131 15 52 2 0 284 5.7%
1988 305 102 73 88 3 26 5 8 110 5.4%
1989 260 113 42 83 2 8 6 6 119 8.0%
1990 213 110 41 55 1 5 0 1 111 10.7%
1991 409 286 44 65 2 7 2 3 289 11.8%
1992 606 412 103 80 1 4 1 5 417 10.2%
1993 811 510 166 96 3 17 1 18 528 12.4%
1994 619 404 77 109 3 8 0 18 419 9.5%
1995 569 461 9 77 2 3 0 17 478 20.6%
1996 843 677 11 104 5 11 2 33 708 17.0%
1997 615 474 30 63 1 11 1 35 507 13.6%
1998 391 282 39 20 2 31 4 13 295 21.7%
1999 570 477 35 18 3 8 1 28 505 69.1%
2000 432 381 2 8 0 1 0 40 421 55.0%
2001 131 79 38 5 4 0 0 5 84 14.0%
2002 161 66 81 2 6 4 0 2 68 9.0%
2003 131 63 55 5 0 5 0 3 66 13.0%
2004 301 173 88 6 5 8 4 17 190 11.8%
2005 271 160 76 4 9 7 2 13 173 11.6%
2006 251 157 51 5 18 5 0 15 172 12.5%
2007 326 160 115 4 14 2 0 31 191 14.3%
2008 54 21 22 3 4 0 0 4 25 4.6%
2009 79 41 22 3 0 2 2 9 50 8.6%
2010 196 91 37 13 7 10 4 34 125 12.5%
2011 181 81 49 5 18 14 2 12 93 12.7%
2012 179 94 45 6 16 13 1 4 98 17.0%
2013 256 157 58 3 20 5 2 11 168 22.5%
2014 305 207 29 10 20 18 1 19 226 14.9%
2015 177 117 33 2 9 7 1 8 125 17.7%
41
Table 15a
IPO Volume and Average First-day Returns with Banks, LPs, and ADRs Included
In the last two columns of the table, the net number of IPOs is expanded to include LPs, banks and S&Ls, and ADRs. Only CRSP-listed IPOs that have first-day return information are included, and therefore the number of IPOs added is slightly less for many years than if the “net” IPO count is added to the LP count, the bank and S&L count, and the ADR count. CRSP covers IPOs that are listed on Nasdaq, NYSE, and NYSE Market (formerly Amex). If a stock takes more than six months before CRSP-listing, it is not included in the count. The sample size of 9,158 IPOs from 1980-2014 includes the 8,062 IPOs from 1980-2014 used in most tables, plus 401 ADRs, 197 natural resource industry limited partnerships, and 498 bank and S&L IPOs. As with Table 15, the net number of IPOs in the first column excludes Special Purpose Acquisition Companies (SPACs), closed-end funds, Real Estate Investment Trusts (REITs), unit offers (typically composed of a share plus a warrant to buy a share), IPOs with an offer price of less than $5.00, commercial banks and savings and loans, companies not promptly listed on the Amex, NYSE, or Nasdaq, natural resource master limited partnerships, small best efforts offers (included in the other exclusions column), and foreign companies issuing American Depositary Receipts (6 of which are banks). SPACs that are unit offers are classified as SPACs rather than units. Note: www.spacanalytics.com reports a higher number for 2004 (12), 2005 (28), and 2006 (37). Table 15a also differs from Table 15 in that the category of SPACs, closed-end funds, and REITs in Table 15 is decomposed into the three component parts. Blind pool offerings from the pre-2004 era are not included as SPACs. These blind-pool offers are almost always screened out of the net number of offerings because they are either unit offers, penny stocks (offer price below $5 per share), small best efforts deals, or were not CRSP-listed. The remaining blind pool offers are excluded in the “other reasons” category. A typical blind pool offering raised a few million dollars and investors never received anything in return. The average first-day return on 498 bank and S&L IPOs through 2014 is 5.9%, with a range of -20% to +57.5%. In most of my tables, I exclude Bank and S&L IPOs because, among other reasons, it is not always clear how many shares are sold to the general public versus sold to depositors and employees, since most of these offerings are demutualizations. The same can be said of some insurance IPOs, which I include. The average first-day return on 401 non-bank ADR IPOs through 2014 is 17.3%, with a range of -27.3% to 414.3%, with the 2000 internet company Crayfish Co. Ltd IPO having the highest return, at 414.3%. In most of my tables, I exclude ADRs because, among other reasons, the accounting data is not always reliable (SDC sometimes makes translation mistakes) and the U.S. tranche may be a small part of a larger offering, especially in the home country of the company. The average first-day return on 197 limited partnerships through 2014 is 3.7%, with a range of -6.8% to +33.3%. In most of my tables, I exclude natural resource company limited partnerships because it if frequently difficult to discern the founding date of the underlying business, since most of these IPOs are spinoffs partly motivated by tax minimization strategies. Also, most of these LPs are created at the time of the IPO, and identifying whether the LP is profitable, what its trailing sales are, and what its assets are, is sometimes problematic. The same can be said of rollups, which I include. I also include newly created reinsurance companies.
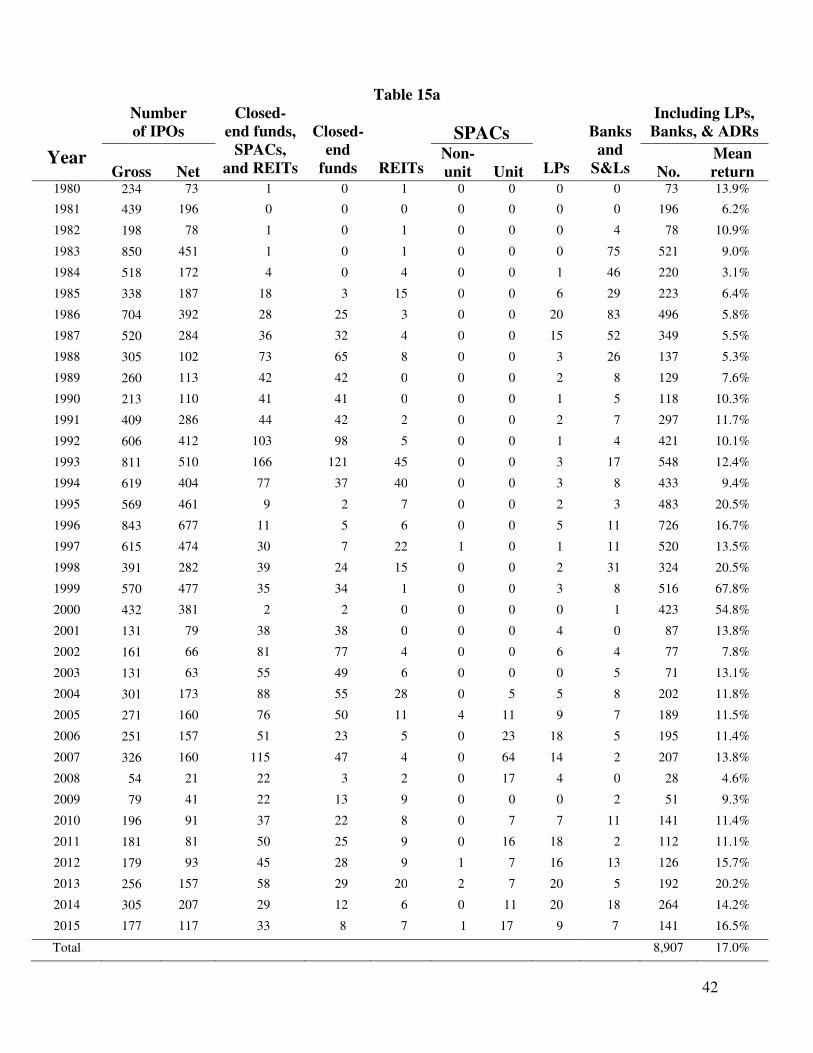
42
Table 15a
Year
Number of IPOs
Closed-end funds,
SPACs, and REITs
Closed-
end funds
REITs
SPACs
LPs
Banks
and S&Ls
Including LPs, Banks, & ADRs
Gross
Net
Non-unit
Unit
No.
Mean return
1980 234 73 1 0 1 0 0 0 0 73 13.9%
1981 439 196 0 0 0 0 0 0 0 196 6.2%
1982 198 78 1 0 1 0 0 0 4 78 10.9%
1983 850 451 1 0 1 0 0 0 75 521 9.0%
1984 518 172 4 0 4 0 0 1 46 220 3.1%
1985 338 187 18 3 15 0 0 6 29 223 6.4%
1986 704 392 28 25 3 0 0 20 83 496 5.8%
1987 520 284 36 32 4 0 0 15 52 349 5.5%
1988 305 102 73 65 8 0 0 3 26 137 5.3%
1989 260 113 42 42 0 0 0 2 8 129 7.6%
1990 213 110 41 41 0 0 0 1 5 118 10.3%
1991 409 286 44 42 2 0 0 2 7 297 11.7%
1992 606 412 103 98 5 0 0 1 4 421 10.1%
1993 811 510 166 121 45 0 0 3 17 548 12.4%
1994 619 404 77 37 40 0 0 3 8 433 9.4%
1995 569 461 9 2 7 0 0 2 3 483 20.5%
1996 843 677 11 5 6 0 0 5 11 726 16.7%
1997 615 474 30 7 22 1 0 1 11 520 13.5%
1998 391 282 39 24 15 0 0 2 31 324 20.5%
1999 570 477 35 34 1 0 0 3 8 516 67.8%
2000 432 381 2 2 0 0 0 0 1 423 54.8%
2001 131 79 38 38 0 0 0 4 0 87 13.8%
2002 161 66 81 77 4 0 0 6 4 77 7.8%
2003 131 63 55 49 6 0 0 0 5 71 13.1%
2004 301 173 88 55 28 0 5 5 8 202 11.8%
2005 271 160 76 50 11 4 11 9 7 189 11.5%
2006 251 157 51 23 5 0 23 18 5 195 11.4%
2007 326 160 115 47 4 0 64 14 2 207 13.8%
2008 54 21 22 3 2 0 17 4 0 28 4.6%
2009 79 41 22 13 9 0 0 0 2 51 9.3%
2010 196 91 37 22 8 0 7 7 11 141 11.4%
2011 181 81 50 25 9 0 16 18 2 112 11.1%
2012 179 93 45 28 9 1 7 16 13 126 15.7%
2013 256 157 58 29 20 2 7 20 5 192 20.2%
2014 305 207 29 12 6 0 11 20 18 264 14.2%
2015 177 117 33 8 7 1 17 9 7 141 16.5%
Total 8,907 17.0%
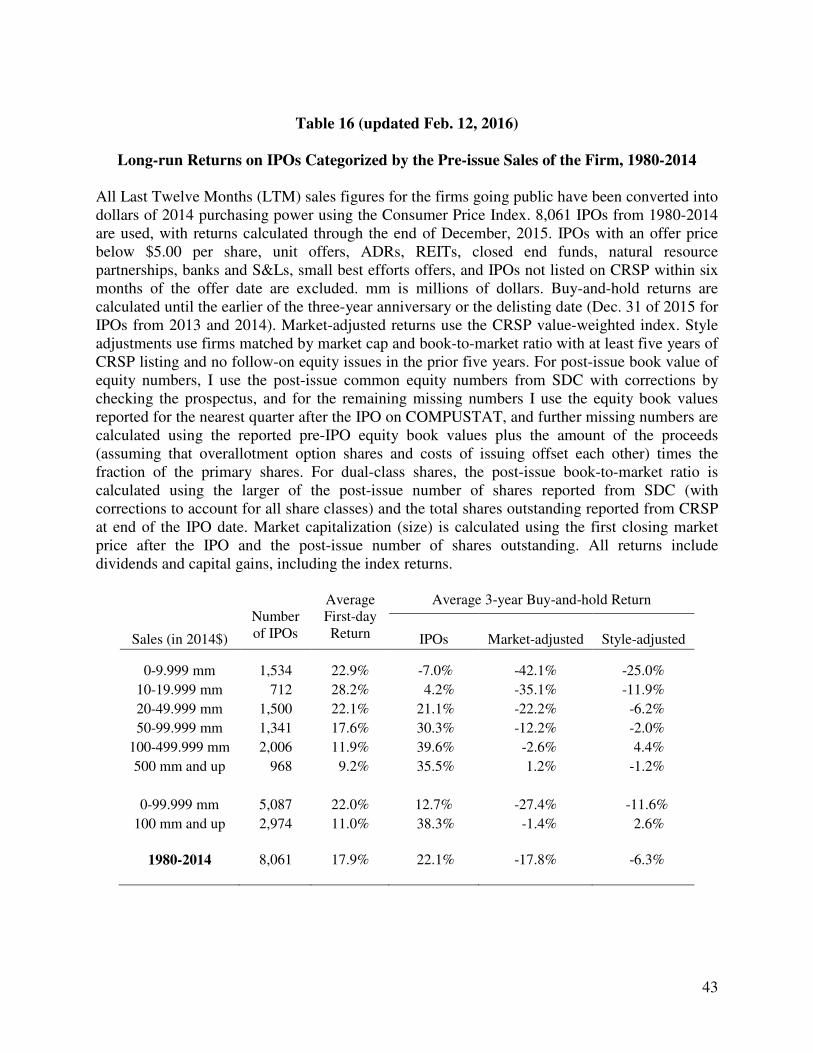
43
Table 16 (updated Feb. 12, 2016)
Long-run Returns on IPOs Categorized by the Pre-issue Sales of the Firm, 1980-2014
All Last Twelve Months (LTM) sales figures for the firms going public have been converted into dollars of 2014 purchasing power using the Consumer Price Index. 8,061 IPOs from 1980-2014 are used, with returns calculated through the end of December, 2015. IPOs with an offer price below $5.00 per share, unit offers, ADRs, REITs, closed end funds, natural resource partnerships, banks and S&Ls, small best efforts offers, and IPOs not listed on CRSP within six months of the offer date are excluded. mm is millions of dollars. Buy-and-hold returns are calculated until the earlier of the three-year anniversary or the delisting date (Dec. 31 of 2015 for IPOs from 2013 and 2014). Market-adjusted returns use the CRSP value-weighted index. Style adjustments use firms matched by market cap and book-to-market ratio with at least five years of CRSP listing and no follow-on equity issues in the prior five years. For post-issue book value of equity numbers, I use the post-issue common equity numbers from SDC with corrections by checking the prospectus, and for the remaining missing numbers I use the equity book values reported for the nearest quarter after the IPO on COMPUSTAT, and further missing numbers are calculated using the reported pre-IPO equity book values plus the amount of the proceeds (assuming that overallotment option shares and costs of issuing offset each other) times the fraction of the primary shares. For dual-class shares, the post-issue book-to-market ratio is calculated using the larger of the post-issue number of shares reported from SDC (with corrections to account for all share classes) and the total shares outstanding reported from CRSP at end of the IPO date. Market capitalization (size) is calculated using the first closing market price after the IPO and the post-issue number of shares outstanding. All returns include dividends and capital gains, including the index returns.
Number of IPOs
Average First-day Return
Average 3-year Buy-and-hold Return
Sales (in 2014$)
IPOs
Market-adjusted
Style-adjusted
0-9.999 mm 1,534 22.9% -7.0% -42.1% -25.0%
10-19.999 mm 712 28.2% 4.2% -35.1% -11.9%
20-49.999 mm 1,500 22.1% 21.1% -22.2% -6.2%
50-99.999 mm 1,341 17.6% 30.3% -12.2% -2.0%
100-499.999 mm 2,006 11.9% 39.6% -2.6% 4.4%
500 mm and up 968 9.2% 35.5% 1.2% -1.2%
0-99.999 mm 5,087 22.0% 12.7% -27.4% -11.6%
100 mm and up 2,974 11.0% 38.3% -1.4% 2.6%
1980-2014
8,061
17.9%
22.1%
-17.8%
-6.3%
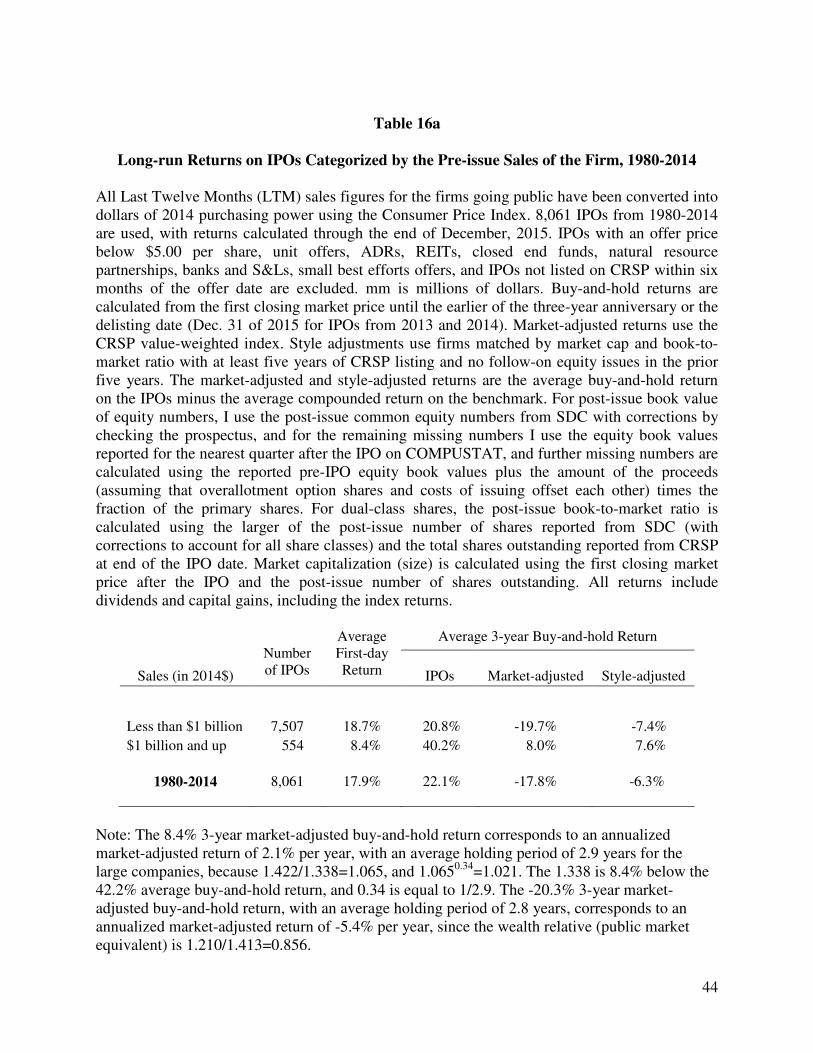
44
Table 16a
Long-run Returns on IPOs Categorized by the Pre-issue Sales of the Firm, 1980-2014
All Last Twelve Months (LTM) sales figures for the firms going public have been converted into dollars of 2014 purchasing power using the Consumer Price Index. 8,061 IPOs from 1980-2014 are used, with returns calculated through the end of December, 2015. IPOs with an offer price below $5.00 per share, unit offers, ADRs, REITs, closed end funds, natural resource partnerships, banks and S&Ls, small best efforts offers, and IPOs not listed on CRSP within six months of the offer date are excluded. mm is millions of dollars. Buy-and-hold returns are calculated from the first closing market price until the earlier of the three-year anniversary or the delisting date (Dec. 31 of 2015 for IPOs from 2013 and 2014). Market-adjusted returns use the CRSP value-weighted index. Style adjustments use firms matched by market cap and book-to-market ratio with at least five years of CRSP listing and no follow-on equity issues in the prior five years. The market-adjusted and style-adjusted returns are the average buy-and-hold return on the IPOs minus the average compounded return on the benchmark. For post-issue book value of equity numbers, I use the post-issue common equity numbers from SDC with corrections by checking the prospectus, and for the remaining missing numbers I use the equity book values reported for the nearest quarter after the IPO on COMPUSTAT, and further missing numbers are calculated using the reported pre-IPO equity book values plus the amount of the proceeds (assuming that overallotment option shares and costs of issuing offset each other) times the fraction of the primary shares. For dual-class shares, the post-issue book-to-market ratio is calculated using the larger of the post-issue number of shares reported from SDC (with corrections to account for all share classes) and the total shares outstanding reported from CRSP at end of the IPO date. Market capitalization (size) is calculated using the first closing market price after the IPO and the post-issue number of shares outstanding. All returns include dividends and capital gains, including the index returns.
Number of IPOs
Average First-day Return
Average 3-year Buy-and-hold Return
Sales (in 2014$)
IPOs
Market-adjusted
Style-adjusted
Less than $1 billion 7,507 18.7% 20.8% -19.7% -7.4%
$1 billion and up 554 8.4% 40.2% 8.0% 7.6%
1980-2014
8,061
17.9%
22.1%
-17.8%
-6.3%
Note: The 8.4% 3-year market-adjusted buy-and-hold return corresponds to an annualized market-adjusted return of 2.1% per year, with an average holding period of 2.9 years for the large companies, because 1.422/1.338=1.065, and 1.0650.34=1.021. The 1.338 is 8.4% below the 42.2% average buy-and-hold return, and 0.34 is equal to 1/2.9. The -20.3% 3-year market-adjusted buy-and-hold return, with an average holding period of 2.8 years, corresponds to an annualized market-adjusted return of -5.4% per year, since the wealth relative (public market equivalent) is 1.210/1.413=0.856.
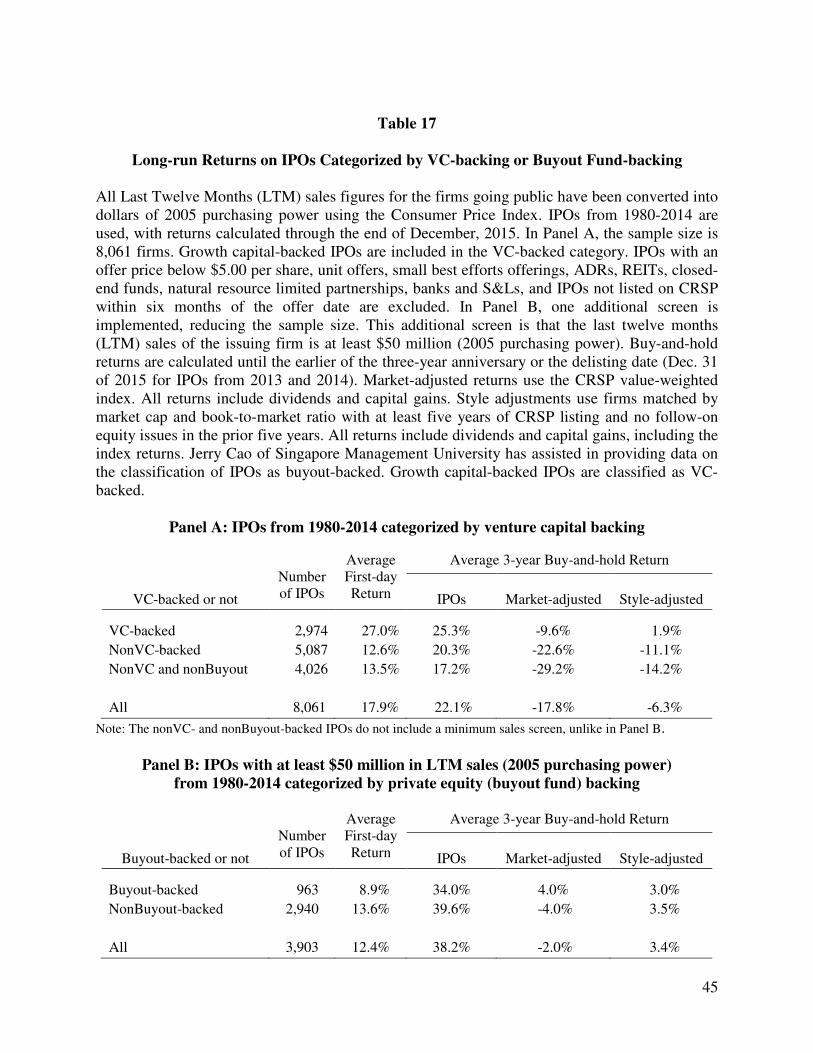
45
Table 17
Long-run Returns on IPOs Categorized by VC-backing or Buyout Fund-backing
All Last Twelve Months (LTM) sales figures for the firms going public have been converted into dollars of 2005 purchasing power using the Consumer Price Index. IPOs from 1980-2014 are used, with returns calculated through the end of December, 2015. In Panel A, the sample size is 8,061 firms. Growth capital-backed IPOs are included in the VC-backed category. IPOs with an offer price below $5.00 per share, unit offers, small best efforts offerings, ADRs, REITs, closed-end funds, natural resource limited partnerships, banks and S&Ls, and IPOs not listed on CRSP within six months of the offer date are excluded. In Panel B, one additional screen is implemented, reducing the sample size. This additional screen is that the last twelve months (LTM) sales of the issuing firm is at least $50 million (2005 purchasing power). Buy-and-hold returns are calculated until the earlier of the three-year anniversary or the delisting date (Dec. 31 of 2015 for IPOs from 2013 and 2014). Market-adjusted returns use the CRSP value-weighted index. All returns include dividends and capital gains. Style adjustments use firms matched by market cap and book-to-market ratio with at least five years of CRSP listing and no follow-on equity issues in the prior five years. All returns include dividends and capital gains, including the index returns. Jerry Cao of Singapore Management University has assisted in providing data on the classification of IPOs as buyout-backed. Growth capital-backed IPOs are classified as VC-backed.
Panel A: IPOs from 1980-2014 categorized by venture capital backing
Number of IPOs
Average First-day Return
Average 3-year Buy-and-hold Return
VC-backed or not
IPOs
Market-adjusted
Style-adjusted
VC-backed 2,974 27.0% 25.3% -9.6% 1.9%
NonVC-backed 5,087 12.6% 20.3% -22.6% -11.1%
NonVC and nonBuyout 4,026 13.5% 17.2% -29.2% -14.2%
All 8,061 17.9% 22.1% -17.8% -6.3%
Note: The nonVC- and nonBuyout-backed IPOs do not include a minimum sales screen, unlike in Panel B.
Panel B: IPOs with at least $50 million in LTM sales (2005 purchasing power) from 1980-2014 categorized by private equity (buyout fund) backing
Number of IPOs
Average First-day Return
Average 3-year Buy-and-hold Return
Buyout-backed or not
IPOs
Market-adjusted
Style-adjusted
Buyout-backed 963 8.9% 34.0% 4.0% 3.0%
NonBuyout-backed 2,940 13.6% 39.6% -4.0% 3.5%
All 3,903 12.4% 38.2% -2.0% 3.4%
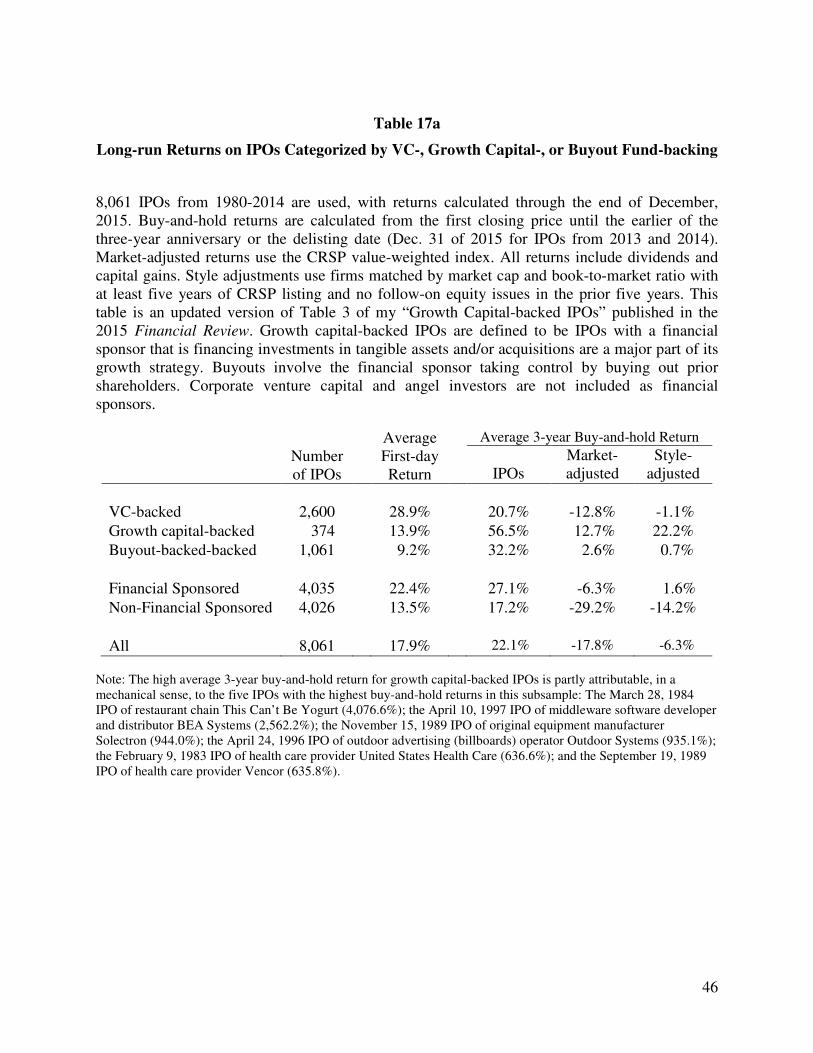
46
Table 17a
Long-run Returns on IPOs Categorized by VC-, Growth Capital-, or Buyout Fund-backing
8,061 IPOs from 1980-2014 are used, with returns calculated through the end of December, 2015. Buy-and-hold returns are calculated from the first closing price until the earlier of the three-year anniversary or the delisting date (Dec. 31 of 2015 for IPOs from 2013 and 2014). Market-adjusted returns use the CRSP value-weighted index. All returns include dividends and capital gains. Style adjustments use firms matched by market cap and book-to-market ratio with at least five years of CRSP listing and no follow-on equity issues in the prior five years. This table is an updated version of Table 3 of my “Growth Capital-backed IPOs” published in the 2015 Financial Review. Growth capital-backed IPOs are defined to be IPOs with a financial sponsor that is financing investments in tangible assets and/or acquisitions are a major part of its growth strategy. Buyouts involve the financial sponsor taking control by buying out prior shareholders. Corporate venture capital and angel investors are not included as financial sponsors.
Number of IPOs
Average First-day Return
Average 3-year Buy-and-hold Return
IPOs
Market-adjusted
Style-adjusted
VC-backed 2,600 28.9% 20.7% -12.8% -1.1%
Growth capital-backed 374 13.9% 56.5% 12.7% 22.2%
Buyout-backed-backed 1,061 9.2% 32.2% 2.6% 0.7%
Financial Sponsored 4,035 22.4% 27.1% -6.3% 1.6%
Non-Financial Sponsored 4,026 13.5% 17.2% -29.2% -14.2%
All 8,061 17.9% 22.1% -17.8% -6.3%
Note: The high average 3-year buy-and-hold return for growth capital-backed IPOs is partly attributable, in a mechanical sense, to the five IPOs with the highest buy-and-hold returns in this subsample: The March 28, 1984 IPO of restaurant chain This Can’t Be Yogurt (4,076.6%); the April 10, 1997 IPO of middleware software developer and distributor BEA Systems (2,562.2%); the November 15, 1989 IPO of original equipment manufacturer Solectron (944.0%); the April 24, 1996 IPO of outdoor advertising (billboards) operator Outdoor Systems (935.1%); the February 9, 1983 IPO of health care provider United States Health Care (636.6%); and the September 19, 1989 IPO of health care provider Vencor (635.8%).
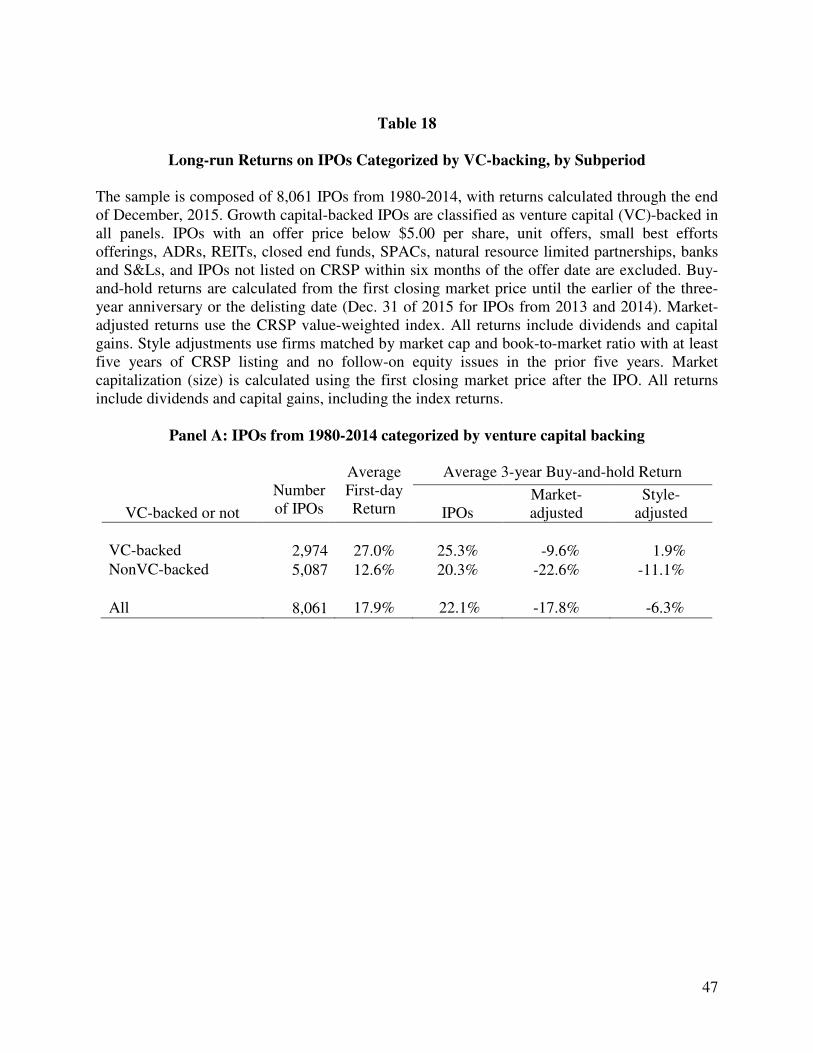
47
Table 18
Long-run Returns on IPOs Categorized by VC-backing, by Subperiod The sample is composed of 8,061 IPOs from 1980-2014, with returns calculated through the end of December, 2015. Growth capital-backed IPOs are classified as venture capital (VC)-backed in all panels. IPOs with an offer price below $5.00 per share, unit offers, small best efforts offerings, ADRs, REITs, closed end funds, SPACs, natural resource limited partnerships, banks and S&Ls, and IPOs not listed on CRSP within six months of the offer date are excluded. Buy-and-hold returns are calculated from the first closing market price until the earlier of the three-year anniversary or the delisting date (Dec. 31 of 2015 for IPOs from 2013 and 2014). Market-adjusted returns use the CRSP value-weighted index. All returns include dividends and capital gains. Style adjustments use firms matched by market cap and book-to-market ratio with at least five years of CRSP listing and no follow-on equity issues in the prior five years. Market capitalization (size) is calculated using the first closing market price after the IPO. All returns include dividends and capital gains, including the index returns.
Panel A: IPOs from 1980-2014 categorized by venture capital backing
Number of IPOs
Average First-day Return
Average 3-year Buy-and-hold Return
VC-backed or not
IPOs
Market-adjusted
Style-adjusted
VC-backed 2,974 27.0% 25.3% -9.6% 1.9% NonVC-backed 5,087 12.6% 20.3% -22.6% -11.1%
All 8,061 17.9% 22.1% -17.8% -6.3%
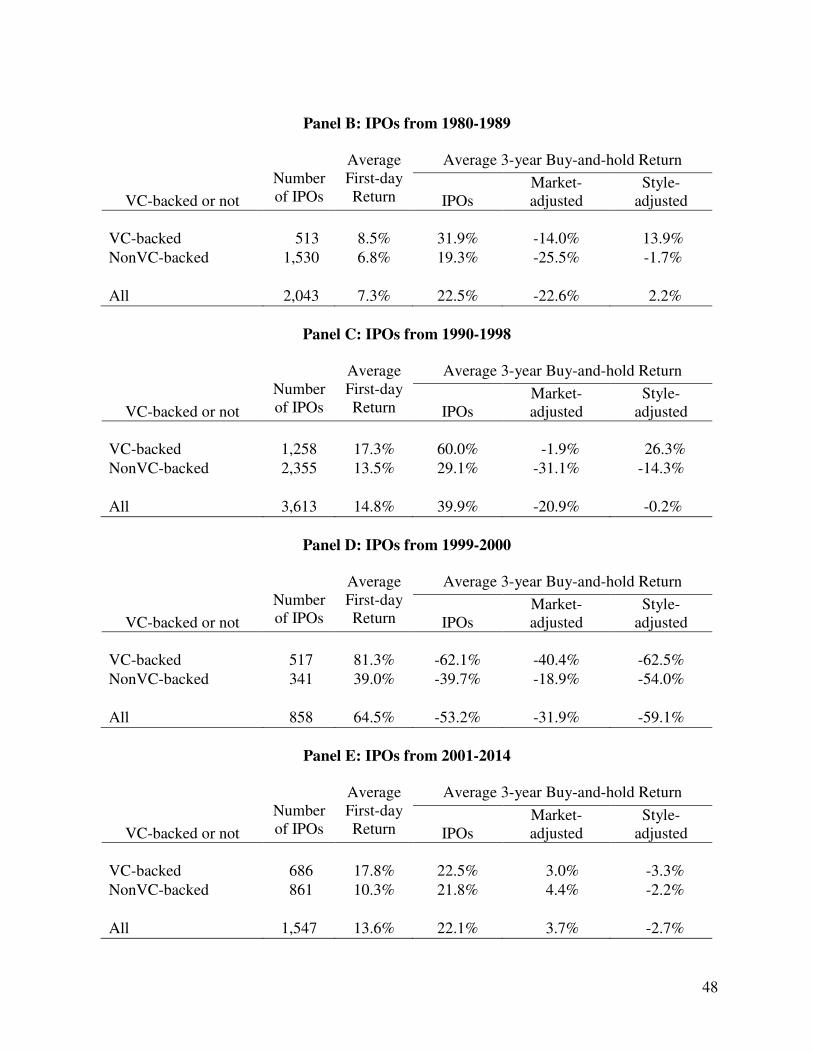
48
Panel B: IPOs from 1980-1989
Number of IPOs
Average First-day Return
Average 3-year Buy-and-hold Return
VC-backed or not
IPOs
Market-adjusted
Style-adjusted
VC-backed 513 8.5% 31.9% -14.0% 13.9%
NonVC-backed 1,530 6.8% 19.3% -25.5% -1.7%
All 2,043 7.3% 22.5% -22.6% 2.2%
Panel C: IPOs from 1990-1998
Number of IPOs
Average First-day Return
Average 3-year Buy-and-hold Return
VC-backed or not
IPOs
Market-adjusted
Style-adjusted
VC-backed 1,258 17.3% 60.0% -1.9% 26.3%
NonVC-backed 2,355 13.5% 29.1% -31.1% -14.3%
All 3,613 14.8% 39.9% -20.9% -0.2%
Panel D: IPOs from 1999-2000
Number of IPOs
Average First-day Return
Average 3-year Buy-and-hold Return
VC-backed or not
IPOs
Market-adjusted
Style-adjusted
VC-backed 517 81.3% -62.1% -40.4% -62.5%
NonVC-backed 341 39.0% -39.7% -18.9% -54.0%
All 858 64.5% -53.2% -31.9% -59.1%
Panel E: IPOs from 2001-2014
Number of IPOs
Average First-day Return
Average 3-year Buy-and-hold Return
VC-backed or not
IPOs
Market-adjusted
Style-adjusted
VC-backed 686 17.8% 22.5% 3.0% -3.3%
NonVC-backed 861 10.3% 21.8% 4.4% -2.2%
All 1,547 13.6% 22.1% 3.7% -2.7%
49
Table 19: Updated Table I of Ritter and Welch 2002 Journal of Finance article
Number of IPOs, First-day Returns, and Long Run Performance, IPOs from 1980-2014
The equally weighted (EW) average first-day return is measured from the offer price to the first CRSP-listed closing price. EW average three-year buy-and-hold percentage returns (capital gains plus dividends) are calculated from the first closing market price to the earlier of the three-year anniversary price, the delisting price, or December 31, 2015. Buy-and-hold returns for initial public offerings (IPOs) occurring after Dec. 31, 2014 are not calculated. Market-adjusted returns are calculated as the buy-and-hold return on an IPO minus the compounded daily return on the CRSP value-weighted index of Amex, Nasdaq, and NYSE firms. Style-adjusted buy-and-hold returns are calculated as the difference between the return on an IPO and a style-matched firm. For each IPO, a non-IPO matching firm that has been CRSP-listed for at least five years with the closest market capitalization (size) and book-to-market ratio as the IPO is used. Market capitalization is calculated using the first closing market price after the IPO. If this stock is delisted prior to the IPO return’s ending date, or if it conducts a follow-on stock offering, a replacement matching firm is spliced in on a point-forward basis. IPOs with an offer price below $5.00 per share, unit offers, small best efforts offers, natural resource limited partnerships, REITs, closed-end funds, banks and S&Ls, ADRs, and IPOs not listed on CRSP within six months of issuing have been excluded. Data is from Thomson Financial Securities Data, with supplements from Dealogic and other sources, and corrections by the authors. The number of IPOs per year is much lower than in the 1995 Journal of Finance article “The New Issues Puzzle” by Loughran and Ritter because that paper used a $1.00 offer price screen. The number is larger than in the 2002 Journal of Finance article “A Review of IPO Activity, Pricing, and Allocations” due to various data corrections and the back-filling of Nasdaq-listed foreign issuers by CRSP. (Updated Feb. 10, 2016)
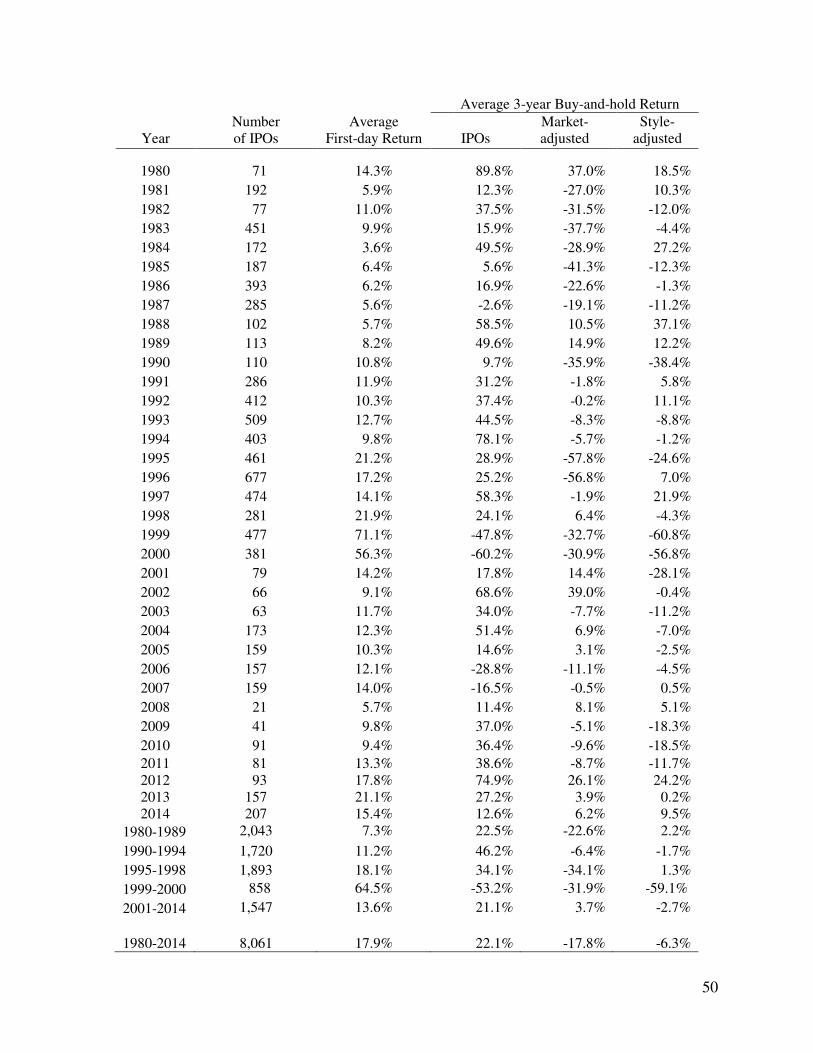
50
Average 3-year Buy-and-hold Return
Year
Number of IPOs
Average First-day Return
IPOs
Market-adjusted
Style-adjusted
1980 71 14.3% 89.8% 37.0% 18.5%
1981 192 5.9% 12.3% -27.0% 10.3%
1982 77 11.0% 37.5% -31.5% -12.0%
1983 451 9.9% 15.9% -37.7% -4.4%
1984 172 3.6% 49.5% -28.9% 27.2%
1985 187 6.4% 5.6% -41.3% -12.3%
1986 393 6.2% 16.9% -22.6% -1.3%
1987 285 5.6% -2.6% -19.1% -11.2%
1988 102 5.7% 58.5% 10.5% 37.1%
1989 113 8.2% 49.6% 14.9% 12.2%
1990 110 10.8% 9.7% -35.9% -38.4%
1991 286 11.9% 31.2% -1.8% 5.8%
1992 412 10.3% 37.4% -0.2% 11.1%
1993 509 12.7% 44.5% -8.3% -8.8%
1994 403 9.8% 78.1% -5.7% -1.2%
1995 461 21.2% 28.9% -57.8% -24.6%
1996 677 17.2% 25.2% -56.8% 7.0%
1997 474 14.1% 58.3% -1.9% 21.9%
1998 281 21.9% 24.1% 6.4% -4.3%
1999 477 71.1% -47.8% -32.7% -60.8%
2000 381 56.3% -60.2% -30.9% -56.8%
2001 79 14.2% 17.8% 14.4% -28.1%
2002 66 9.1% 68.6% 39.0% -0.4%
2003 63 11.7% 34.0% -7.7% -11.2%
2004 173 12.3% 51.4% 6.9% -7.0%
2005 159 10.3% 14.6% 3.1% -2.5%
2006 157 12.1% -28.8% -11.1% -4.5%
2007 159 14.0% -16.5% -0.5% 0.5%
2008 21 5.7% 11.4% 8.1% 5.1%
2009 41 9.8% 37.0% -5.1% -18.3%
2010 91 9.4% 36.4% -9.6% -18.5%
2011 81 13.3% 38.6% -8.7% -11.7% 2012 93 17.8% 74.9% 26.1% 24.2% 2013 157 21.1% 27.2% 3.9% 0.2% 2014 207 15.4% 12.6% 6.2% 9.5%
1980-1989 2,043 7.3% 22.5% -22.6% 2.2%
1990-1994 1,720 11.2% 46.2% -6.4% -1.7%
1995-1998 1,893 18.1% 34.1% -34.1% 1.3%
1999-2000 858 64.5% -53.2% -31.9% -59.1%
2001-2014 1,547 13.6% 21.1% 3.7% -2.7%
1980-2014
8,061
17.9% 22.1% -17.8% -6.3%
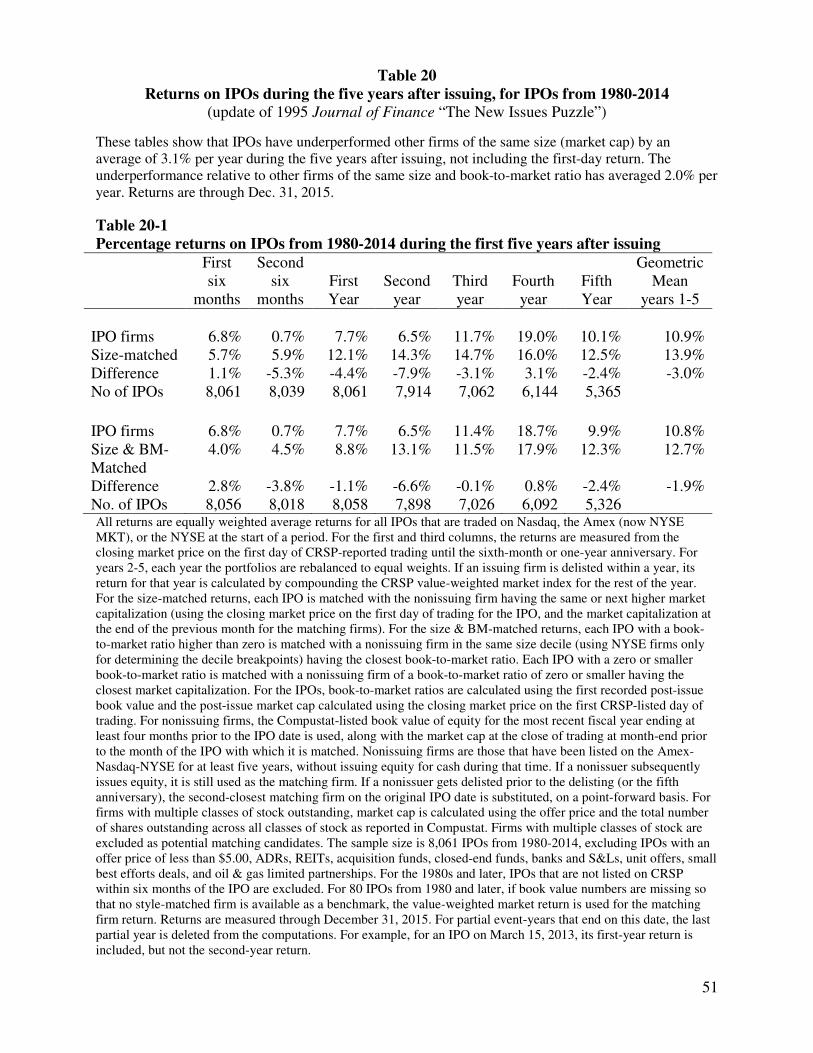
51
Table 20 Returns on IPOs during the five years after issuing, for IPOs from 1980-2014
(update of 1995 Journal of Finance “The New Issues Puzzle”)
These tables show that IPOs have underperformed other firms of the same size (market cap) by an average of 3.1% per year during the five years after issuing, not including the first-day return. The underperformance relative to other firms of the same size and book-to-market ratio has averaged 2.0% per year. Returns are through Dec. 31, 2015.
Table 20-1 Percentage returns on IPOs from 1980-2014 during the first five years after issuing
First six
months
Second six
months
First Year
Second
year
Third year
Fourth year
Fifth Year
Geometric Mean
years 1-5
IPO firms 6.8% 0.7% 7.7% 6.5% 11.7% 19.0% 10.1% 10.9% Size-matched 5.7% 5.9% 12.1% 14.3% 14.7% 16.0% 12.5% 13.9% Difference 1.1% -5.3% -4.4% -7.9% -3.1% 3.1% -2.4% -3.0% No of IPOs 8,061 8,039 8,061 7,914 7,062 6,144 5,365
IPO firms 6.8% 0.7% 7.7% 6.5% 11.4% 18.7% 9.9% 10.8% Size & BM-Matched
4.0% 4.5% 8.8% 13.1% 11.5% 17.9% 12.3% 12.7%
Difference 2.8% -3.8% -1.1% -6.6% -0.1% 0.8% -2.4% -1.9% No. of IPOs 8,056 8,018 8,058 7,898 7,026 6,092 5,326 All returns are equally weighted average returns for all IPOs that are traded on Nasdaq, the Amex (now NYSE MKT), or the NYSE at the start of a period. For the first and third columns, the returns are measured from the closing market price on the first day of CRSP-reported trading until the sixth-month or one-year anniversary. For years 2-5, each year the portfolios are rebalanced to equal weights. If an issuing firm is delisted within a year, its return for that year is calculated by compounding the CRSP value-weighted market index for the rest of the year. For the size-matched returns, each IPO is matched with the nonissuing firm having the same or next higher market capitalization (using the closing market price on the first day of trading for the IPO, and the market capitalization at the end of the previous month for the matching firms). For the size & BM-matched returns, each IPO with a book-to-market ratio higher than zero is matched with a nonissuing firm in the same size decile (using NYSE firms only for determining the decile breakpoints) having the closest book-to-market ratio. Each IPO with a zero or smaller book-to-market ratio is matched with a nonissuing firm of a book-to-market ratio of zero or smaller having the closest market capitalization. For the IPOs, book-to-market ratios are calculated using the first recorded post-issue book value and the post-issue market cap calculated using the closing market price on the first CRSP-listed day of trading. For nonissuing firms, the Compustat-listed book value of equity for the most recent fiscal year ending at least four months prior to the IPO date is used, along with the market cap at the close of trading at month-end prior to the month of the IPO with which it is matched. Nonissuing firms are those that have been listed on the Amex-Nasdaq-NYSE for at least five years, without issuing equity for cash during that time. If a nonissuer subsequently issues equity, it is still used as the matching firm. If a nonissuer gets delisted prior to the delisting (or the fifth anniversary), the second-closest matching firm on the original IPO date is substituted, on a point-forward basis. For firms with multiple classes of stock outstanding, market cap is calculated using the offer price and the total number of shares outstanding across all classes of stock as reported in Compustat. Firms with multiple classes of stock are excluded as potential matching candidates. The sample size is 8,061 IPOs from 1980-2014, excluding IPOs with an offer price of less than $5.00, ADRs, REITs, acquisition funds, closed-end funds, banks and S&Ls, unit offers, small best efforts deals, and oil & gas limited partnerships. For the 1980s and later, IPOs that are not listed on CRSP within six months of the IPO are excluded. For 80 IPOs from 1980 and later, if book value numbers are missing so that no style-matched firm is available as a benchmark, the value-weighted market return is used for the matching firm return. Returns are measured through December 31, 2015. For partial event-years that end on this date, the last partial year is deleted from the computations. For example, for an IPO on March 15, 2013, its first-year return is included, but not the second-year return.
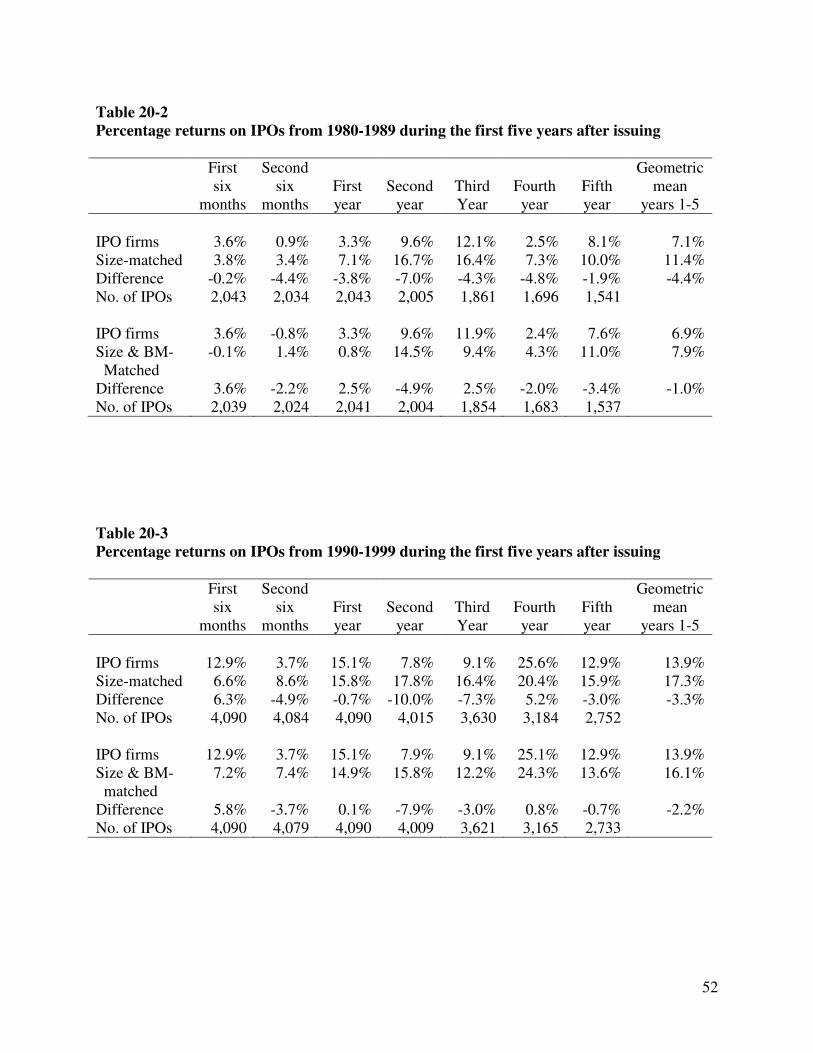
52
Table 20-2 Percentage returns on IPOs from 1980-1989 during the first five years after issuing
First six
months
Second six
months
First year
Second
year
Third Year
Fourth year
Fifth year
Geometric mean
years 1-5
IPO firms 3.6% 0.9% 3.3% 9.6% 12.1% 2.5% 8.1% 7.1% Size-matched 3.8% 3.4% 7.1% 16.7% 16.4% 7.3% 10.0% 11.4% Difference -0.2% -4.4% -3.8% -7.0% -4.3% -4.8% -1.9% -4.4% No. of IPOs 2,043 2,034 2,043 2,005 1,861 1,696 1,541 IPO firms 3.6% -0.8% 3.3% 9.6% 11.9% 2.4% 7.6% 6.9% Size & BM- Matched
-0.1% 1.4% 0.8% 14.5% 9.4% 4.3% 11.0% 7.9%
Difference 3.6% -2.2% 2.5% -4.9% 2.5% -2.0% -3.4% -1.0% No. of IPOs 2,039 2,024 2,041 2,004 1,854 1,683 1,537
Table 20-3 Percentage returns on IPOs from 1990-1999 during the first five years after issuing
First six
months
Second six
months
First year
Second
year
Third Year
Fourth year
Fifth year
Geometric mean
years 1-5
IPO firms 12.9% 3.7% 15.1% 7.8% 9.1% 25.6% 12.9% 13.9% Size-matched 6.6% 8.6% 15.8% 17.8% 16.4% 20.4% 15.9% 17.3% Difference 6.3% -4.9% -0.7% -10.0% -7.3% 5.2% -3.0% -3.3% No. of IPOs 4,090 4,084 4,090 4,015 3,630 3,184 2,752 IPO firms 12.9% 3.7% 15.1% 7.9% 9.1% 25.1% 12.9% 13.9% Size & BM- matched
7.2% 7.4% 14.9% 15.8% 12.2% 24.3% 13.6% 16.1%
Difference 5.8% -3.7% 0.1% -7.9% -3.0% 0.8% -0.7% -2.2% No. of IPOs 4,090 4,079 4,090 4,009 3,621 3,165 2,733
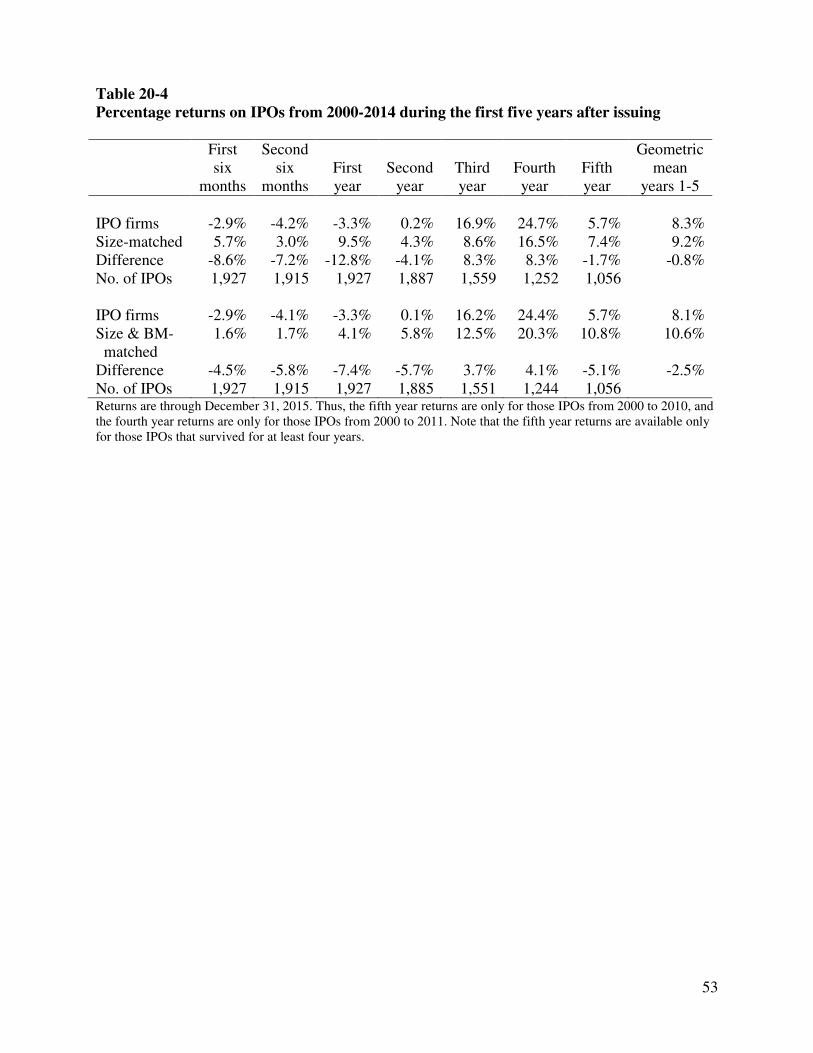
53
Table 20-4 Percentage returns on IPOs from 2000-2014 during the first five years after issuing
First six
months
Second six
months
First year
Second
year
Third year
Fourth year
Fifth year
Geometric mean
years 1-5
IPO firms -2.9% -4.2% -3.3% 0.2% 16.9% 24.7% 5.7% 8.3% Size-matched 5.7% 3.0% 9.5% 4.3% 8.6% 16.5% 7.4% 9.2% Difference -8.6% -7.2% -12.8% -4.1% 8.3% 8.3% -1.7% -0.8% No. of IPOs 1,927 1,915 1,927 1,887 1,559 1,252 1,056 IPO firms -2.9% -4.1% -3.3% 0.1% 16.2% 24.4% 5.7% 8.1% Size & BM- matched
1.6% 1.7% 4.1% 5.8% 12.5% 20.3% 10.8% 10.6%
Difference -4.5% -5.8% -7.4% -5.7% 3.7% 4.1% -5.1% -2.5% No. of IPOs 1,927 1,915 1,927 1,885 1,551 1,244 1,056 Returns are through December 31, 2015. Thus, the fifth year returns are only for those IPOs from 2000 to 2010, and the fourth year returns are only for those IPOs from 2000 to 2011. Note that the fifth year returns are available only for those IPOs that survived for at least four years.
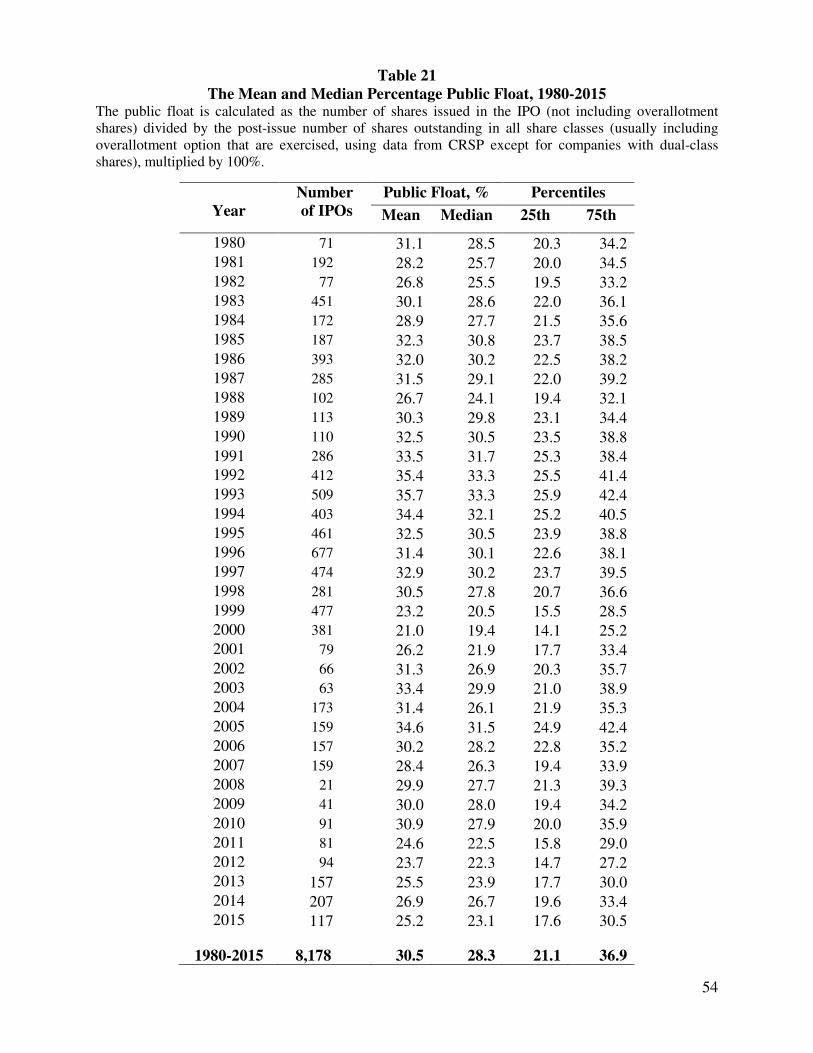
54
Table 21 The Mean and Median Percentage Public Float, 1980-2015
The public float is calculated as the number of shares issued in the IPO (not including overallotment shares) divided by the post-issue number of shares outstanding in all share classes (usually including overallotment option that are exercised, using data from CRSP except for companies with dual-class shares), multiplied by 100%.
Year
Number of IPOs
Public Float, % Percentiles
Mean Median 25th 75th
1980 71 31.1 28.5 20.3 34.2 1981 192 28.2 25.7 20.0 34.5 1982 77 26.8 25.5 19.5 33.2 1983 451 30.1 28.6 22.0 36.1 1984 172 28.9 27.7 21.5 35.6 1985 187 32.3 30.8 23.7 38.5 1986 393 32.0 30.2 22.5 38.2 1987 285 31.5 29.1 22.0 39.2 1988 102 26.7 24.1 19.4 32.1 1989 113 30.3 29.8 23.1 34.4 1990 110 32.5 30.5 23.5 38.8 1991 286 33.5 31.7 25.3 38.4 1992 412 35.4 33.3 25.5 41.4 1993 509 35.7 33.3 25.9 42.4 1994 403 34.4 32.1 25.2 40.5 1995 461 32.5 30.5 23.9 38.8 1996 677 31.4 30.1 22.6 38.1 1997 474 32.9 30.2 23.7 39.5 1998 281 30.5 27.8 20.7 36.6 1999 477 23.2 20.5 15.5 28.5 2000 381 21.0 19.4 14.1 25.2 2001 79 26.2 21.9 17.7 33.4 2002 66 31.3 26.9 20.3 35.7 2003 63 33.4 29.9 21.0 38.9 2004 173 31.4 26.1 21.9 35.3 2005 159 34.6 31.5 24.9 42.4 2006 157 30.2 28.2 22.8 35.2 2007 159 28.4 26.3 19.4 33.9 2008 21 29.9 27.7 21.3 39.3 2009 41 30.0 28.0 19.4 34.2 2010 91 30.9 27.9 20.0 35.9 2011 81 24.6 22.5 15.8 29.0 2012 94 23.7 22.3 14.7 27.2 2013 157 25.5 23.9 17.7 30.0 2014 207 26.9 26.7 19.6 33.4 2015 117 25.2 23.1 17.6 30.5
1980-2015 8,178 30.5 28.3 21.1 36.9
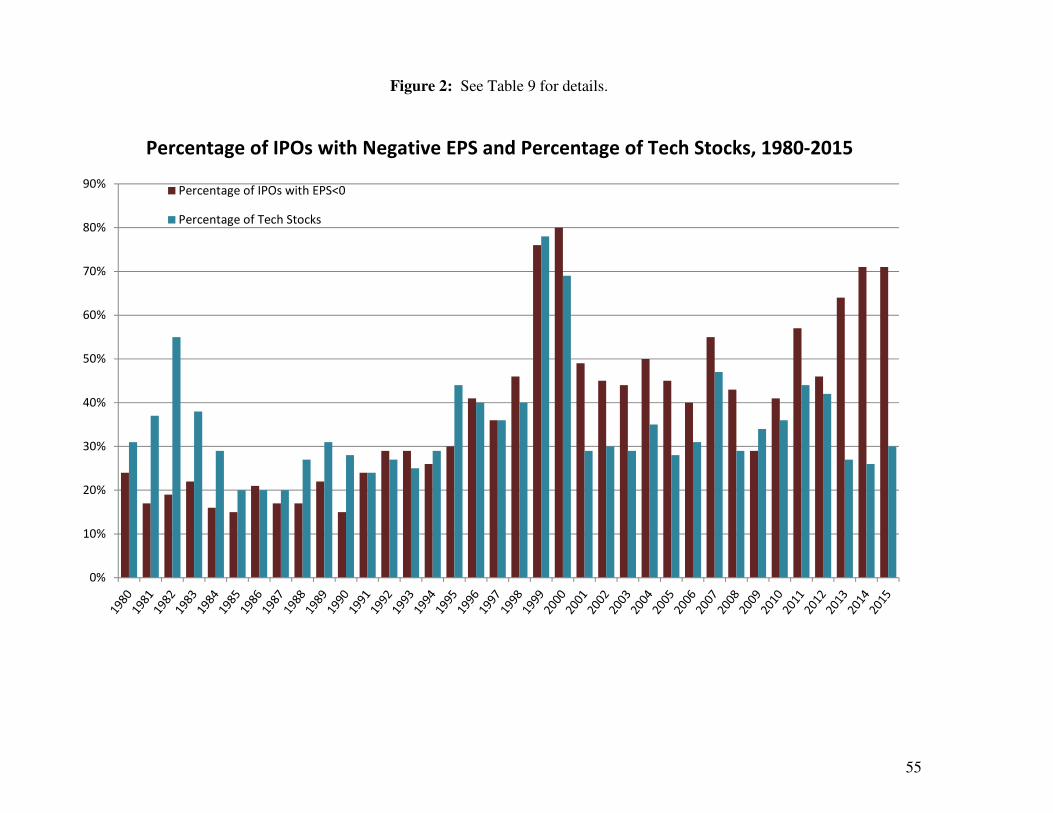
55
Figure 2: See Table 9 for details.
0%
10%
20%
30%
40%
50%
60%
70%
80%
90%Percentage of IPOs with EPS<0
Percentage of Tech Stocks
Percentage of IPOs with Negative EPS and Percentage of Tech Stocks, 1980-2015
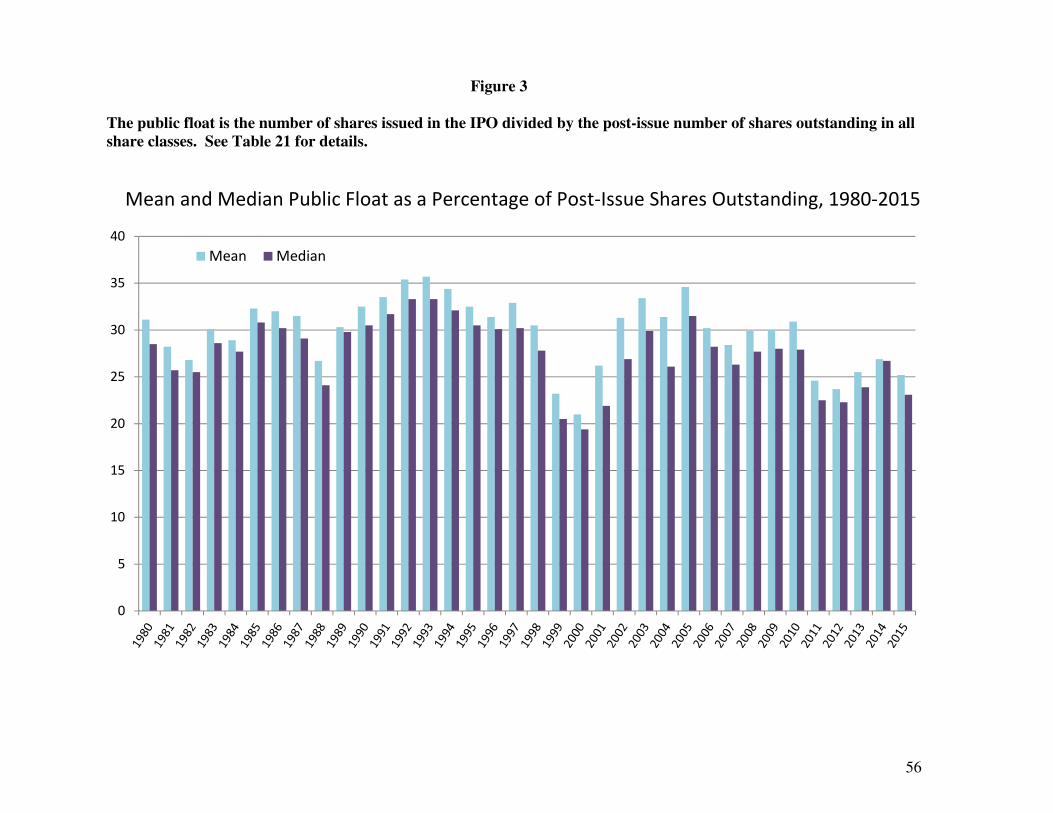
56
Figure 3
The public float is the number of shares issued in the IPO divided by the post-issue number of shares outstanding in all share classes. See Table 21 for details.
0
5
10
15
20
25
30
35
40
Mean Median
Mean and Median Public Float as a Percentage of Post-Issue Shares Outstanding, 1980-2015
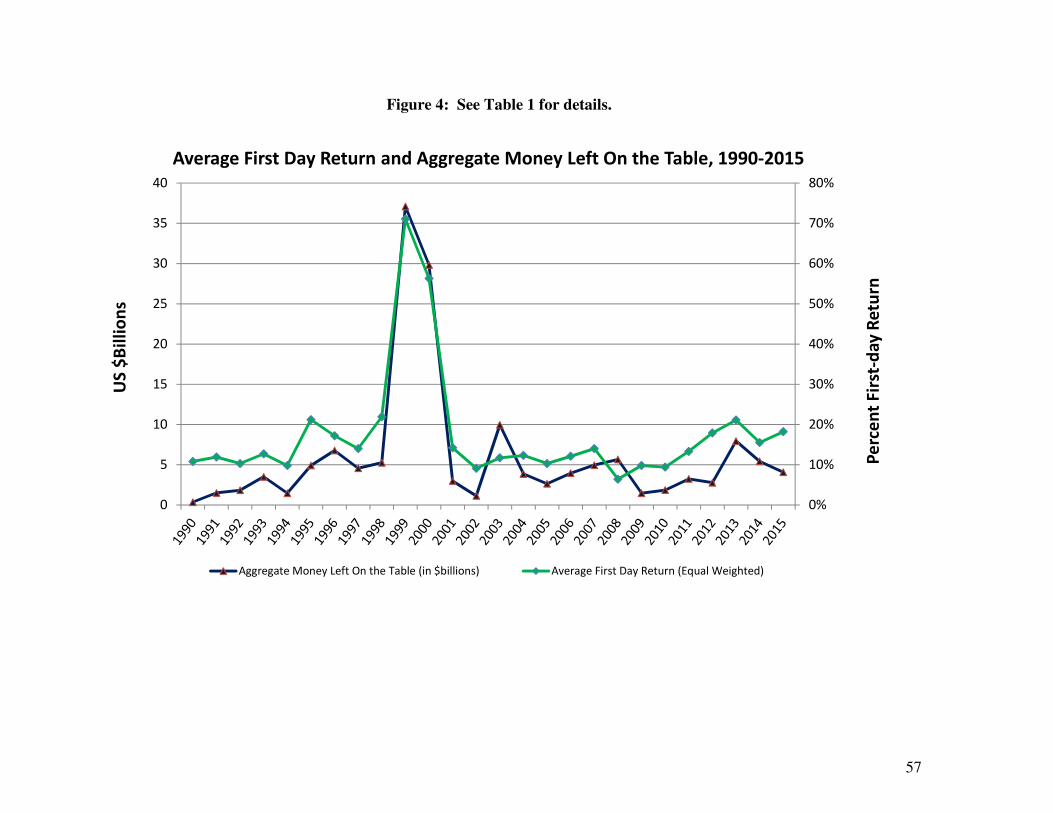
57
Figure 4: See Table 1 for details.
0%
10%
20%
30%
40%
50%
60%
70%
80%
0
5
10
15
20
25
30
35
40
Pe
rce
nt
Fir
st-d
ay
Re
turn
US
$B
illi
on
s
Average First Day Return and Aggregate Money Left On the Table, 1990-2015
Aggregate Money Left On the Table (in $billions) Average First Day Return (Equal Weighted)
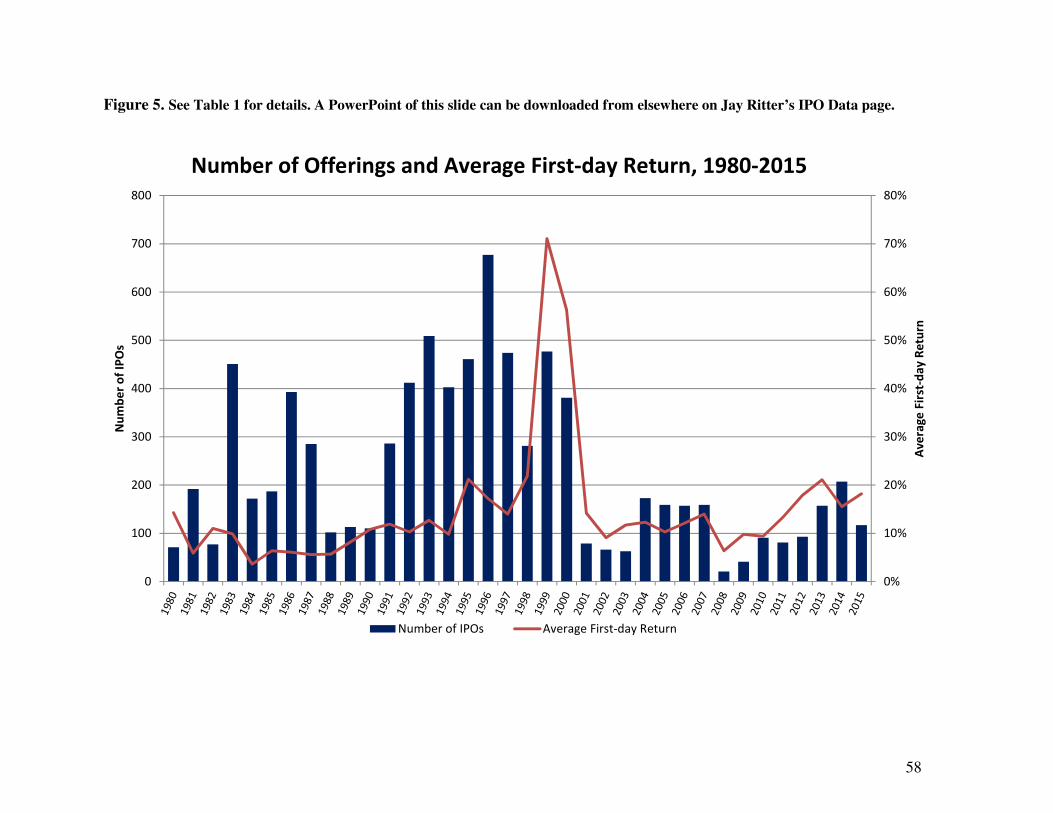
58
Figure 5. See Table 1 for details. A PowerPoint of this slide can be downloaded from elsewhere on Jay Ritter’s IPO Data page.
Number of Offerings and Average First-day Return, 1980-2015
0%
10%
20%
30%
40%
50%
60%
70%
80%
0
100
200
300
400
500
600
700
800
Av
era
ge
Fir
st-d
ay
Re
turn
Nu
mb
er
of
IPO
s
Number of IPOs Average First-day Return
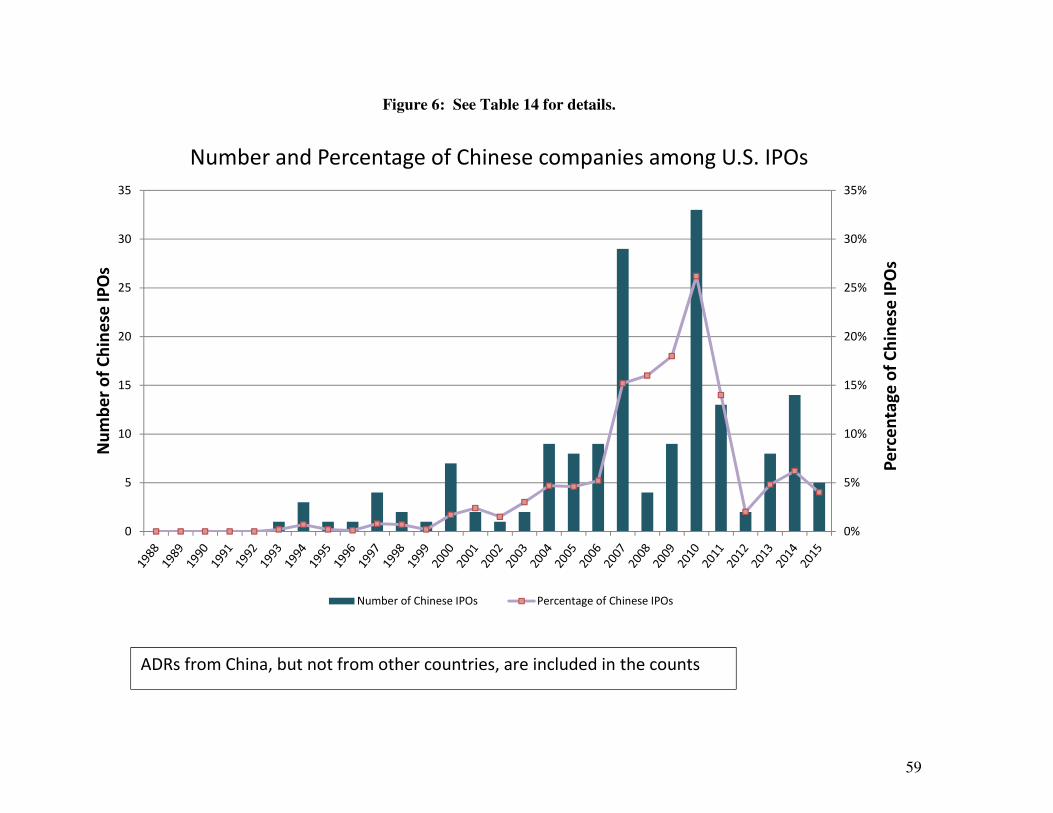
59
Figure 6: See Table 14 for details.
0%
5%
10%
15%
20%
25%
30%
35%
0
5
10
15
20
25
30
35
Pe
rce
nta
ge
of
Ch
ine
se I
PO
s
Nu
mb
er
of
Ch
ine
se I
PO
s
Number and Percentage of Chinese companies among U.S. IPOs
Number of Chinese IPOs Percentage of Chinese IPOs
ADRs from China, but not from other countries, are included in the counts