Embed Size (px)
Citation preview
-
50.00
100.00
150.00
200.00
250.00
300.00
Shasun Pharma Sensex
IndiaNivesh ResearchIndiaNivesh Securities Private Limited601 & 602, Sukh Sagar, N. S. Patkar Marg, Girgaum Chowpatty, Mumbai 400 007. Tel: (022) 66188800
Initiating CoverageOctober 3, 2012 Shasun Pharmaceuticals Ltd.
CMP : Rs.169
Reco : BUY
Target : Rs.233
STOCK INFO
BSE 524552
NSE SHASUNCHEM
Bloomberg SAPH IN
Reuters SHAS.BO
Sector Pharmaceutical
Face Value (Rs) 2
Equity Capital (Rs mn) 110
Mkt Cap (Rs mn) 9,130
52w H/L (Rs) 185/38
Avg Daily Vol (BSE+NSE) 343,978
SHAREHOLDING PATTERN %
(as on 30th Jun. 2012)
Promoters 41.0
FIIs 4.0
DIIs 20.1
Public & Others 34.9
Source: Company, BSE
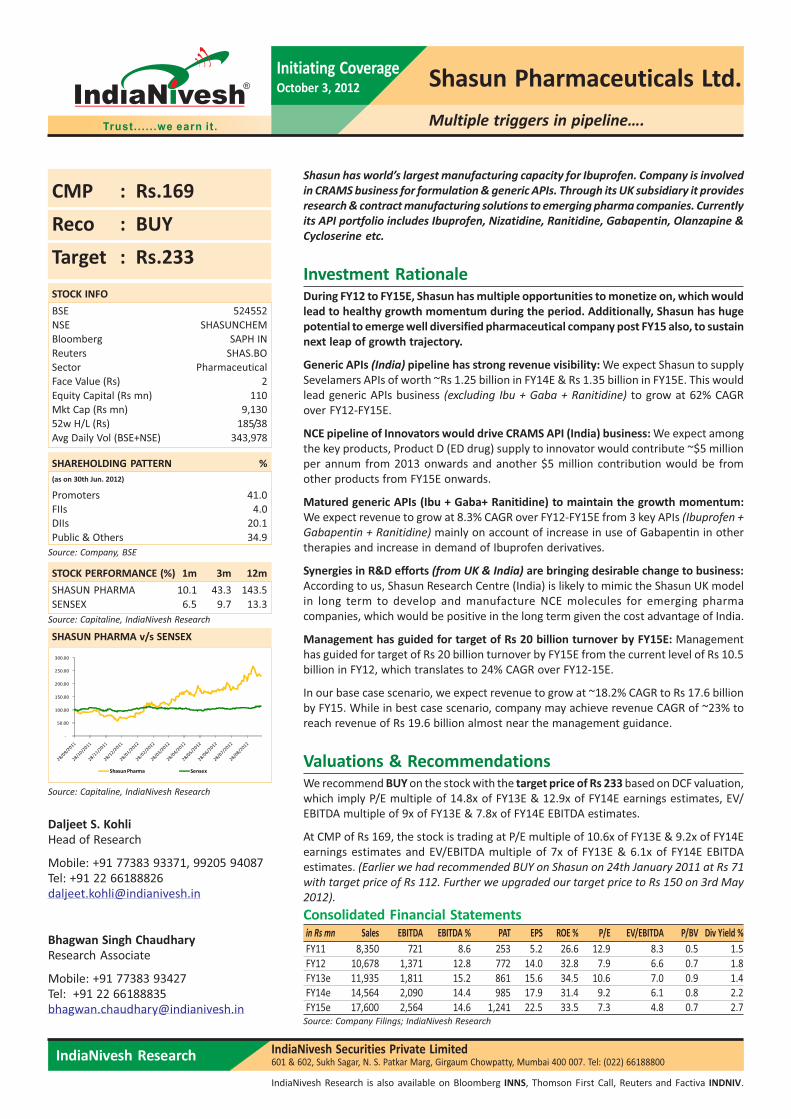
STOCK PERFORMANCE (%) 1m 3m 12m
SHASUN PHARMA 10.1 43.3 143.5
SENSEX 6.5 9.7 13.3
SHASUN PHARMA v/s SENSEX
Source: Capitaline, IndiaNivesh Research
Source: Capitaline, IndiaNivesh Research
Multiple triggers in pipeline….
IndiaNivesh Research is also available on Bloomberg INNS, Thomson First Call, Reuters and Factiva INDNIV.
Consolidated Financial Statements
in Rs mn Sales EBITDA EBITDA % PAT EPS ROE % P/E EV/EBITDA P/BV Div Yield %
FY11 8,350 721 8.6 253 5.2 26.6 12.9 8.3 0.5 1.5
FY12 10,678 1,371 12.8 772 14.0 32.8 7.9 6.6 0.7 1.8
FY13e 11,935 1,811 15.2 861 15.6 34.5 10.6 7.0 0.9 1.4
FY14e 14,564 2,090 14.4 985 17.9 31.4 9.2 6.1 0.8 2.2
FY15e 17,600 2,564 14.6 1,241 22.5 33.5 7.3 4.8 0.7 2.7
Source: Company Filings; IndiaNivesh Research
Daljeet S. KohliHead of Research
Mobile: +91 77383 93371, 99205 94087Tel: +91 22 [email protected]
Bhagwan Singh ChaudharyResearch Associate
Mobile: +91 77383 93427Tel: +91 22 [email protected]
Shasun has world’s largest manufacturing capacity for Ibuprofen. Company is involved
in CRAMS business for formulation & generic APIs. Through its UK subsidiary it provides
research & contract manufacturing solutions to emerging pharma companies. Currently
its API portfolio includes Ibuprofen, Nizatidine, Ranitidine, Gabapentin, Olanzapine &
Cycloserine etc.
Investment RationaleDuring FY12 to FY15E, Shasun has multiple opportunities to monetize on, which would
lead to healthy growth momentum during the period. Additionally, Shasun has huge
potential to emerge well diversified pharmaceutical company post FY15 also, to sustain
next leap of growth trajectory.
Generic APIs (India) pipeline has strong revenue visibility: We expect Shasun to supply
Sevelamers APIs of worth ~Rs 1.25 billion in FY14E & Rs 1.35 billion in FY15E. This would
lead generic APIs business (excluding Ibu + Gaba + Ranitidine) to grow at 62% CAGR
over FY12-FY15E.
NCE pipeline of Innovators would drive CRAMS API (India) business: We expect among
the key products, Product D (ED drug) supply to innovator would contribute ~$5 million
per annum from 2013 onwards and another $5 million contribution would be from
other products from FY15E onwards.
Matured generic APIs (Ibu + Gaba+ Ranitidine) to maintain the growth momentum:
We expect revenue to grow at 8.3% CAGR over FY12-FY15E from 3 key APIs (Ibuprofen +
Gabapentin + Ranitidine) mainly on account of increase in use of Gabapentin in other
therapies and increase in demand of Ibuprofen derivatives.
Synergies in R&D efforts (from UK & India) are bringing desirable change to business:
According to us, Shasun Research Centre (India) is likely to mimic the Shasun UK model
in long term to develop and manufacture NCE molecules for emerging pharma
companies, which would be positive in the long term given the cost advantage of India.
Management has guided for target of Rs 20 billion turnover by FY15E: Management
has guided for target of Rs 20 billion turnover by FY15E from the current level of Rs 10.5
billion in FY12, which translates to 24% CAGR over FY12-15E.
In our base case scenario, we expect revenue to grow at ~18.2% CAGR to Rs 17.6 billion
by FY15. While in best case scenario, company may achieve revenue CAGR of ~23% to
reach revenue of Rs 19.6 billion almost near the management guidance.
Valuations & RecommendationsWe recommend BUY on the stock with the target price of Rs 233 based on DCF valuation,
which imply P/E multiple of 14.8x of FY13E & 12.9x of FY14E earnings estimates, EV/
EBITDA multiple of 9x of FY13E & 7.8x of FY14E EBITDA estimates.
At CMP of Rs 169, the stock is trading at P/E multiple of 10.6x of FY13E & 9.2x of FY14E
earnings estimates and EV/EBITDA multiple of 7x of FY13E & 6.1x of FY14E EBITDA
estimates. (Earlier we had recommended BUY on Shasun on 24th January 2011 at Rs 71
with target price of Rs 112. Further we upgraded our target price to Rs 150 on 3rd May
2012).
IndiaNivesh Research October 3, 2012 | 2
Initiating Coverage | Shasun Pharmaceuticals Ltd. Multiple triggers in pipeline….
Investment Rationale
From FY12 to FY15E, Shasun has multiple opportunities to monetize on, which
would lead to healthy growth momentum during the period. Additionally, Shasun
has huge potential to emerge well diversified pharmaceutical company post FY15
also, to sustain next leap of growth trajectory.
Generic APIs (India) pipeline has strong revenue visibility
In terms of Generic APIs as well as CRAMS APIs for NCEs (New Chemical Entities),
Shasun has many products in pipeline which shows long term revenue visibility.
Source: FDA; IndiaNivesh Research
Key DMFs fillings:
Among the DMFs filled in recent past, Sevelamer HCL, Sevelamer Carbonate &
Colesevelam are the key upcoming opportunities for Shasun. Company is setting
up a separate block in Cuddalore API plant to cater to the world demand for
Sevelamer HCl & Sevelamer Carbonate, which are going off patent in August 2013.
Both these drugs are used for the treatment of chronic kidney disorders (CKD)
patients on dialysis to treat a condition called hyperphosphatemia (or elevated
phosphorus level). There are ~ 0.4 million patients each in US & Europe and ~65,000
in Brazil.
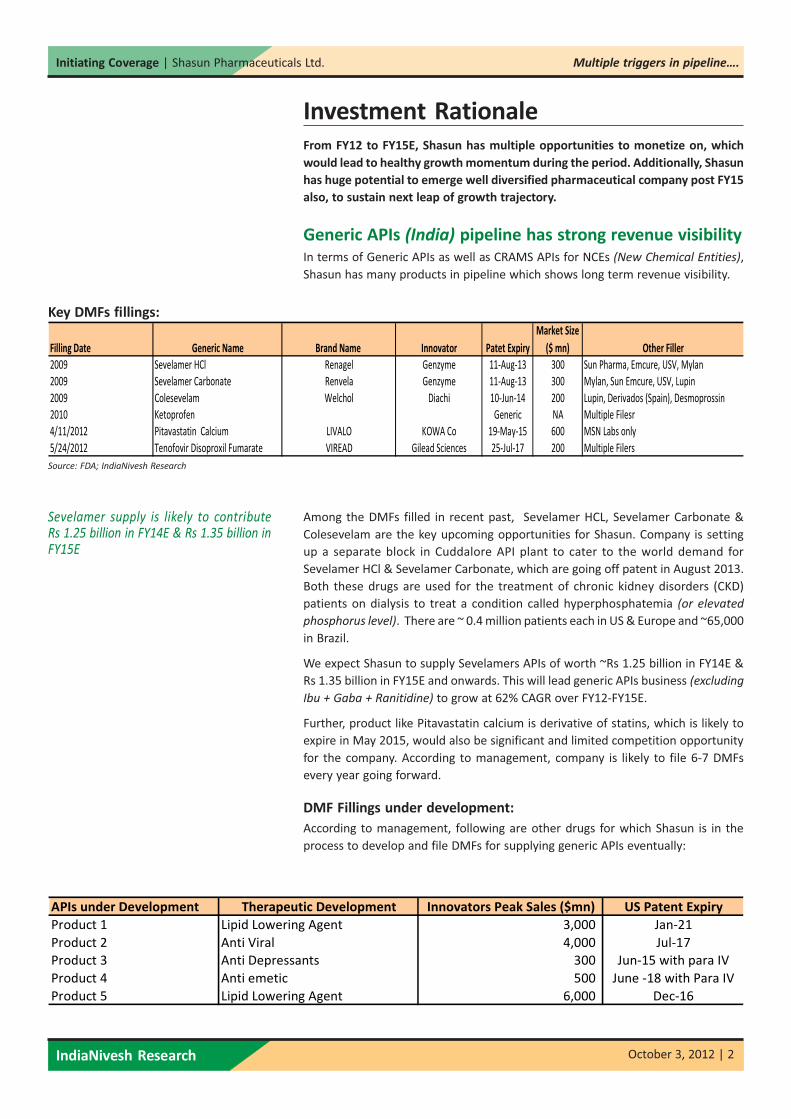
We expect Shasun to supply Sevelamers APIs of worth ~Rs 1.25 billion in FY14E &
Rs 1.35 billion in FY15E and onwards. This will lead generic APIs business (excluding
Ibu + Gaba + Ranitidine) to grow at 62% CAGR over FY12-FY15E.
Further, product like Pitavastatin calcium is derivative of statins, which is likely to
expire in May 2015, would also be significant and limited competition opportunity
for the company. According to management, company is likely to file 6-7 DMFs
every year going forward.
DMF Fillings under development:
According to management, following are other drugs for which Shasun is in the
process to develop and file DMFs for supplying generic APIs eventually:
APIs under Development Therapeutic Development Innovators Peak Sales ($mn) US Patent Expiry
Product 1 Lipid Lowering Agent 3,000 Jan-21
Product 2 Anti Viral 4,000 Jul-17
Product 3 Anti Depressants 300 Jun-15 with para IV
Product 4 Anti emetic 500 June -18 with Para IV
Product 5 Lipid Lowering Agent 6,000 Dec-16
Filling Date Generic Name Brand Name Innovator Patet Expiry
Market Size
($ mn) Other Filler
2009 Sevelamer HCl Renagel Genzyme 11-Aug-13 300 Sun Pharma, Emcure, USV, Mylan
2009 Sevelamer Carbonate Renvela Genzyme 11-Aug-13 300 Mylan, Sun Emcure, USV, Lupin
2009 Colesevelam Welchol Diachi 10-Jun-14 200 Lupin, Derivados (Spain), Desmoprossin
2010 Ketoprofen Generic NA Multiple Filesr
4/11/2012 Pitavastatin Calcium LIVALO KOWA Co 19-May-15 600 MSN Labs only
5/24/2012 Tenofovir Disoproxil Fumarate VIREAD Gilead Sciences 25-Jul-17 200 Multiple Filers
Sevelamer supply is likely to contributeRs 1.25 billion in FY14E & Rs 1.35 billion inFY15E
IndiaNivesh Research October 3, 2012 | 3
Initiating Coverage | Shasun Pharmaceuticals Ltd. Multiple triggers in pipeline….
53%
10%
139%
66%
0%
20%
40%
60%
80%
100%
120%
140%
160%
-
500
1,000
1,500
2,000
2,500
3,000
3,500
4,000
FY11 FY12 FY13E FY14E FY15E
Source: Company Filings; IndiaNivesh Research
APIs under Development Therapeutic Development Innovators Peak Sales ($mn) US Patent Expiry
Product 6 Anti Coagulant 3,000 Feb-21
Product 7 Metabolic Disorder 600 June-17 with Para IV
Product 8 Respiratory Disease 1,000 Jun-20
Product 9 Schizophrenia 750 Jul-18
Product 10 Metabolic Disorder 750 Sep-18
Product 11 Anti Coagulant 4,000 Feb-22, with Para IV
Product 12 Cough Suppressants 1,500 Open
Product 13 Metabolic Disorder 2,000 Open
Revenue growth from generic APIs (Excluding Ibu+ Gaba+ Ranitidine):
Source: Company Filings; IndiaNivesh Research
NCE pipeline of innovators would drive CRAMS API (India)business:
CRAMS API (India) Pipeline:
Source: Company Filings; IndiaNivesh Research
Company’s India (CRAMS) business has strong CRAMS API pipeline (see the table
given above) to supply APIs for NCEs (New Chemical Entities), which have cumulativemarket potential of up to ~$45 million annually.
Among these, product D has been approved by USFDA in April 2012 for the treatmentof erectile dysfunction, and innovator is in the process of negotiation with its partnersto launch the product in US by the starting of the year 2013. Shasun is estimatingthis product to have potential of up to ~$15 million annually, though we expect ~$5million per annum opportunity for Shasun, expecting low acceptance of product.Additionally, atleast another $5 million contribution would be from other productsfrom FY15E onwards.
Product D supply to commence from thestarting of 2013, which would contribute~$5 million annually
Therapy Expected supplyMarket Potential
(USD Mn)
Product C anti gaut in 2013 0.75
Product D ED in 2013 15
Product E Diabetic Validation in 2012 10.5
Product F Asthma in 2014 9
Product G Phase II in 2017 9
Product H Phase II Analgesic NA 2
IndiaNivesh Research October 3, 2012 | 4
Initiating Coverage | Shasun Pharmaceuticals Ltd. Multiple triggers in pipeline….
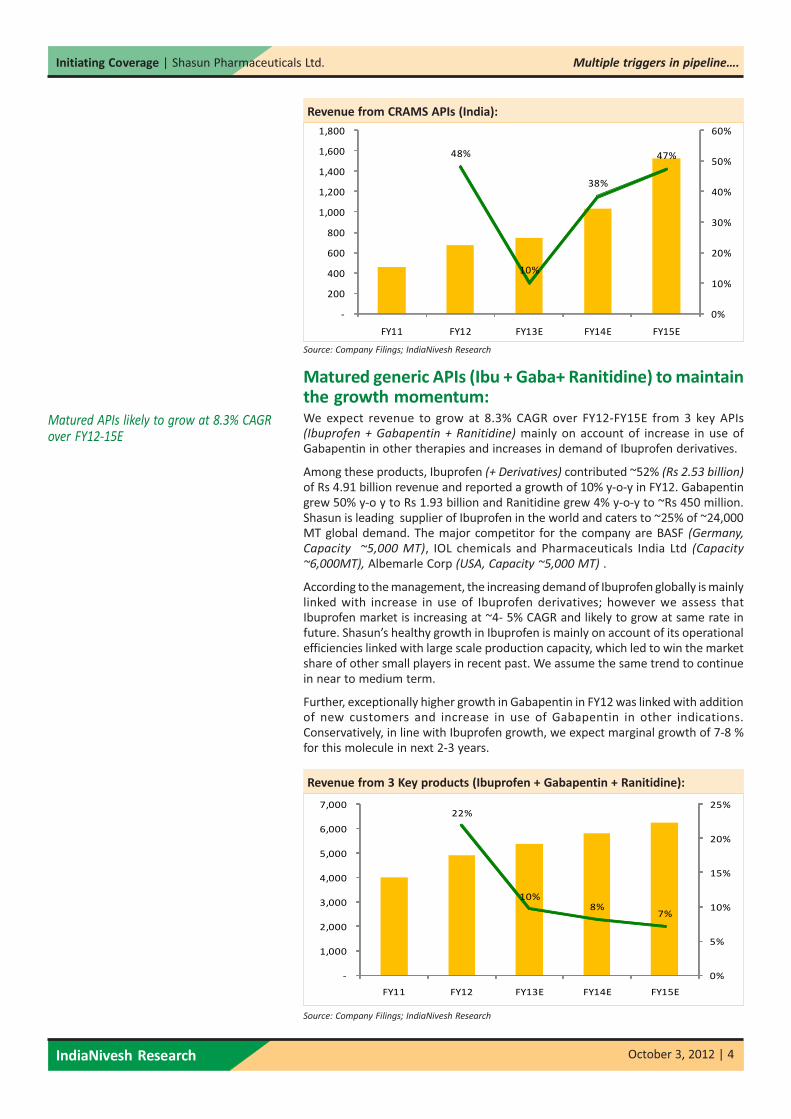
22%
10%
8%7%
0%
5%
10%
15%
20%
25%
-
1,000
2,000
3,000
4,000
5,000
6,000
7,000
FY11 FY12 FY13E FY14E FY15E
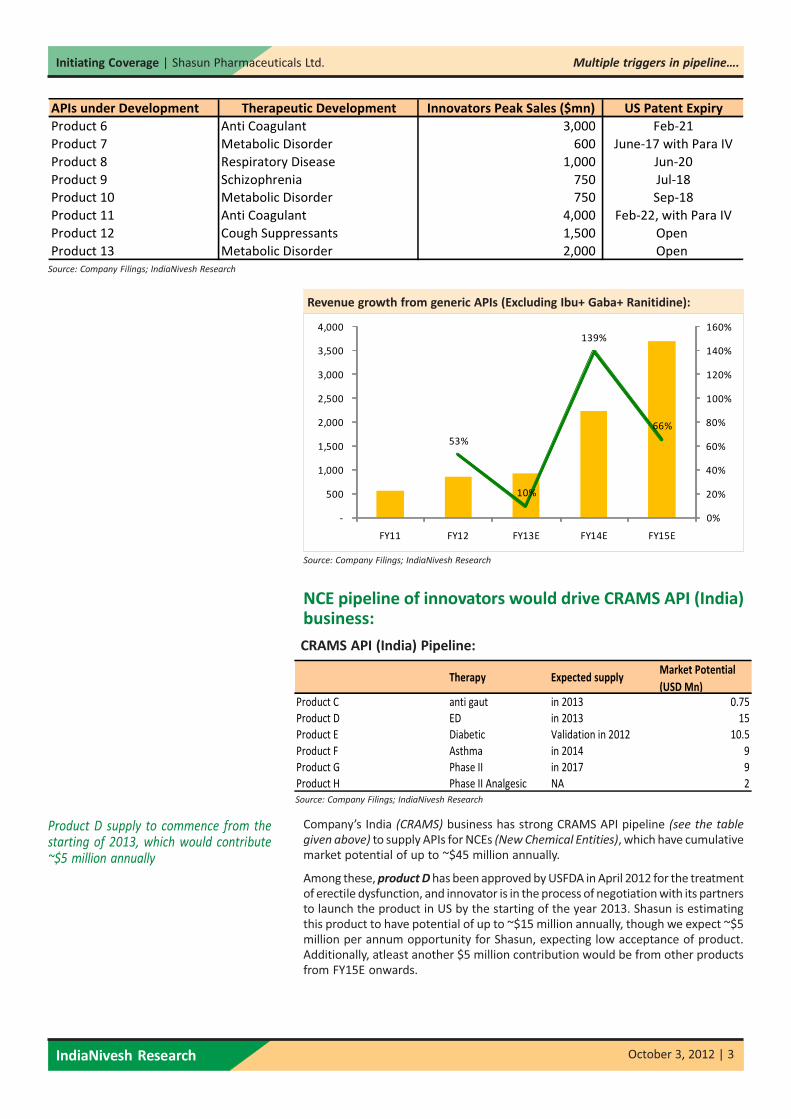
48%
10%
38%
47%
0%
10%
20%
30%
40%
50%
60%
-
200
400
600
800
1,000
1,200
1,400
1,600
1,800
FY11 FY12 FY13E FY14E FY15E
Revenue from CRAMS APIs (India):
Source: Company Filings; IndiaNivesh Research
Matured generic APIs (Ibu + Gaba+ Ranitidine) to maintainthe growth momentum:We expect revenue to grow at 8.3% CAGR over FY12-FY15E from 3 key APIs(Ibuprofen + Gabapentin + Ranitidine) mainly on account of increase in use ofGabapentin in other therapies and increases in demand of Ibuprofen derivatives.
Among these products, Ibuprofen (+ Derivatives) contributed ~52% (Rs 2.53 billion)
of Rs 4.91 billion revenue and reported a growth of 10% y-o-y in FY12. Gabapentingrew 50% y-o y to Rs 1.93 billion and Ranitidine grew 4% y-o-y to ~Rs 450 million.Shasun is leading supplier of Ibuprofen in the world and caters to ~25% of ~24,000MT global demand. The major competitor for the company are BASF (Germany,
Capacity ~5,000 MT), IOL chemicals and Pharmaceuticals India Ltd (Capacity
~6,000MT), Albemarle Corp (USA, Capacity ~5,000 MT) .
According to the management, the increasing demand of Ibuprofen globally is mainlylinked with increase in use of Ibuprofen derivatives; however we assess thatIbuprofen market is increasing at ~4- 5% CAGR and likely to grow at same rate infuture. Shasun’s healthy growth in Ibuprofen is mainly on account of its operationalefficiencies linked with large scale production capacity, which led to win the marketshare of other small players in recent past. We assume the same trend to continuein near to medium term.
Further, exceptionally higher growth in Gabapentin in FY12 was linked with additionof new customers and increase in use of Gabapentin in other indications.Conservatively, in line with Ibuprofen growth, we expect marginal growth of 7-8 %for this molecule in next 2-3 years.
Revenue from 3 Key products (Ibuprofen + Gabapentin + Ranitidine):
Source: Company Filings; IndiaNivesh Research
Matured APIs likely to grow at 8.3% CAGRover FY12-15E
IndiaNivesh Research October 3, 2012 | 5
Initiating Coverage | Shasun Pharmaceuticals Ltd. Multiple triggers in pipeline….
India APIs FY11 FY12 FY13E FY14E FY15E
Ibu + Gaba+ Ranitidine 4,028 4,911 5,388 5,831 6,252
y-o-y 22% 10% 8% 7%
Others (including Pipeiline) 557 851 932 2,232 3,695
y-o-y 53% 10% 139% 66%
CRAMS APIs 459 680 748 1,035 1,526
y-o-y 48% 10% 38% 47%
Total 5,043 6,441 7,068 9,098 11,473
y-o-y 28% 10% 29% 26%
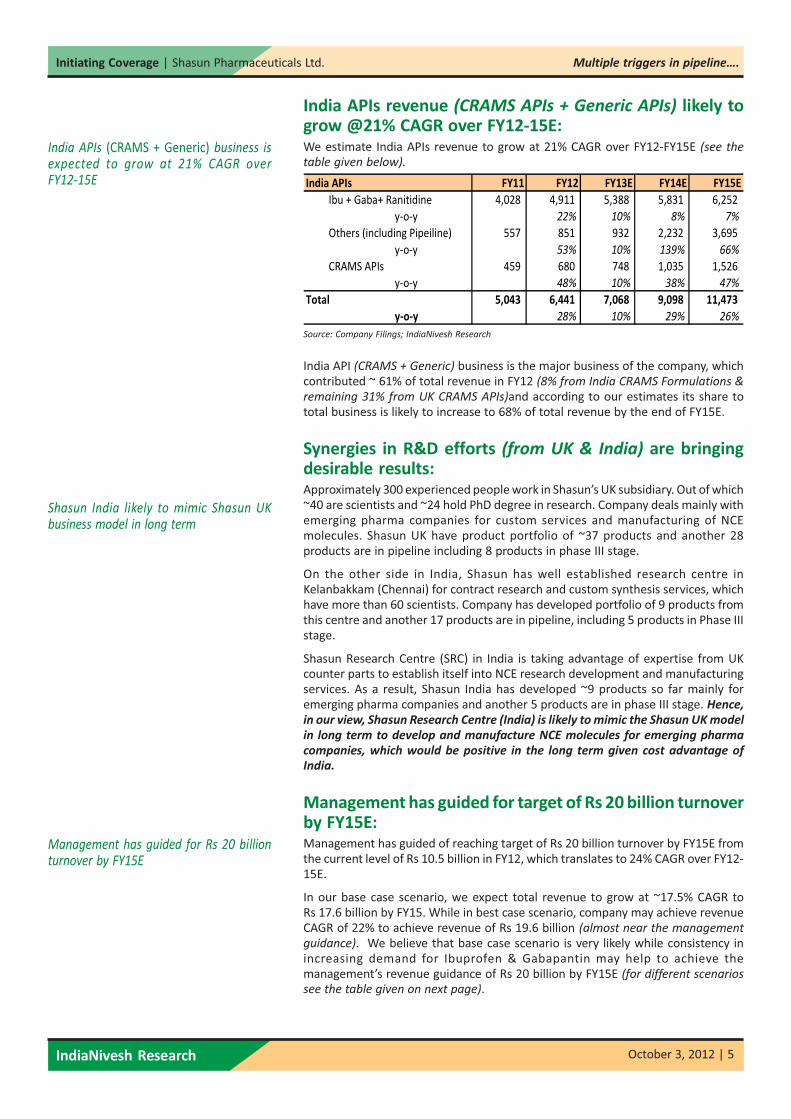
India APIs revenue (CRAMS APIs + Generic APIs) likely togrow @21% CAGR over FY12-15E:We estimate India APIs revenue to grow at 21% CAGR over FY12-FY15E (see the
table given below).
Source: Company Filings; IndiaNivesh Research
India API (CRAMS + Generic) business is the major business of the company, whichcontributed ~ 61% of total revenue in FY12 (8% from India CRAMS Formulations &
remaining 31% from UK CRAMS APIs)and according to our estimates its share tototal business is likely to increase to 68% of total revenue by the end of FY15E.
Synergies in R&D efforts (from UK & India) are bringingdesirable results:Approximately 300 experienced people work in Shasun’s UK subsidiary. Out of which~40 are scientists and ~24 hold PhD degree in research. Company deals mainly withemerging pharma companies for custom services and manufacturing of NCEmolecules. Shasun UK have product portfolio of ~37 products and another 28products are in pipeline including 8 products in phase III stage.
On the other side in India, Shasun has well established research centre inKelanbakkam (Chennai) for contract research and custom synthesis services, whichhave more than 60 scientists. Company has developed portfolio of 9 products fromthis centre and another 17 products are in pipeline, including 5 products in Phase IIIstage.
Shasun Research Centre (SRC) in India is taking advantage of expertise from UKcounter parts to establish itself into NCE research development and manufacturingservices. As a result, Shasun India has developed ~9 products so far mainly foremerging pharma companies and another 5 products are in phase III stage. Hence,
in our view, Shasun Research Centre (India) is likely to mimic the Shasun UK model
in long term to develop and manufacture NCE molecules for emerging pharma
companies, which would be positive in the long term given cost advantage of
India.
Management has guided for target of Rs 20 billion turnoverby FY15E:Management has guided of reaching target of Rs 20 billion turnover by FY15E fromthe current level of Rs 10.5 billion in FY12, which translates to 24% CAGR over FY12-15E.
In our base case scenario, we expect total revenue to grow at ~17.5% CAGR toRs 17.6 billion by FY15. While in best case scenario, company may achieve revenueCAGR of 22% to achieve revenue of Rs 19.6 billion (almost near the management
guidance). We believe that base case scenario is very likely while consistency inincreasing demand for Ibuprofen & Gabapantin may help to achieve themanagement’s revenue guidance of Rs 20 billion by FY15E (for different scenarios
see the table given on next page).
India APIs (CRAMS + Generic) business isexpected to grow at 21% CAGR overFY12-15E
Shasun India likely to mimic Shasun UKbusiness model in long term
Management has guided for Rs 20 billionturnover by FY15E
IndiaNivesh Research October 3, 2012 | 6
Initiating Coverage | Shasun Pharmaceuticals Ltd. Multiple triggers in pipeline….
Source: IndiaNivesh Research
Potential & Opportunities to scale up business from FY15Eonwards:Apart from the rationale given above we believe that Shasun has huge potential tofurther improve its financials from FY15E onwards and maintain the growthmomentum in long term due to following reasons:
A) Scalability in Pondicherry formulations unit:
Shasun forayed into CRAMS formulations business in 2005. It has a formulationfacility of ~3.5 billion tablet production capacity in Pondicherry with employeestrength of ~650. From this facility, company supply drugs worth of ~Rs 520million in FY11 and ~Rs 840 million ( 8% of total revenue) in FY12. Accordingto our estimates, more than 50% production (in volume term) from this facilityis for Ibuprofen and ~25% is for Ranitidine, which are high volume and lowvalue products. Hence, currently, this facility is generating only ~25% valueproducts, which is resulting in low profitability for the company.
Going forward, company is likely to increase this facility’s capacity to 5 billiontablets annually at nominal capex of ~Rs 250 million and further can expandto ~9 billion tablets in next 4-5 years. We are of the view that productioncommencement for domestic formulation market from same facility andincrease in contracts for value products would provide margin boost for thecompany in long term.
Additionally, Shasun has ~21 ANDAs in developing stage to file with USFDAfor own self to sell directly or through partners in US market. Hence,commercialization of these high margin products (some time by FY15 onwards)
would improve utilization of Ponduchery CRAMS facility and profitability.
B) Contribution from domestic formulation business:
Shasun has plans to launch branded generic formulations in domestic marketsat pan India level with ~250 field force initially. Company is targeting Cardio &Diabetic therapeutic segments and has finalized 4-5 products includingStreptokinase (bio-similar drug used for Myocardial Infarction),Warfarin(anticoagulant) & Glimeperide + Metformin (used to treat diabetes Mellitus
type II).
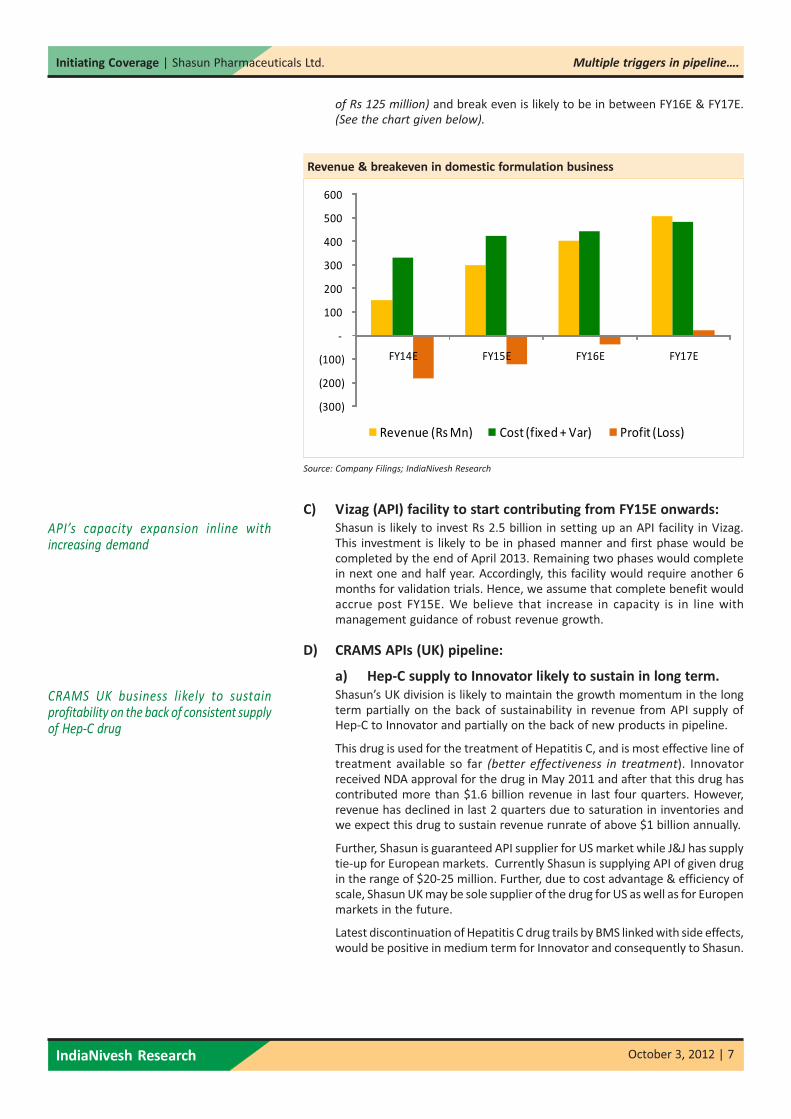
Management expects this business to contribute revenue of ~ Rs 200 million(loss of Rs 300 million) in FY14E & Rs 500 million (break even at bottom level)
in FY15E. However, conservatively, due to high competition in domesticmarket, we estimate domestic formulation business to contribute revenue of~Rs 150 million in FY14E, (loss of Rs 183 million), Rs 300 million in FY15E (loss
Pondicherry formulations unit has hugescope to scale up production for highmargin products
Shasun plans to launch genericformulations pan India from FY14E
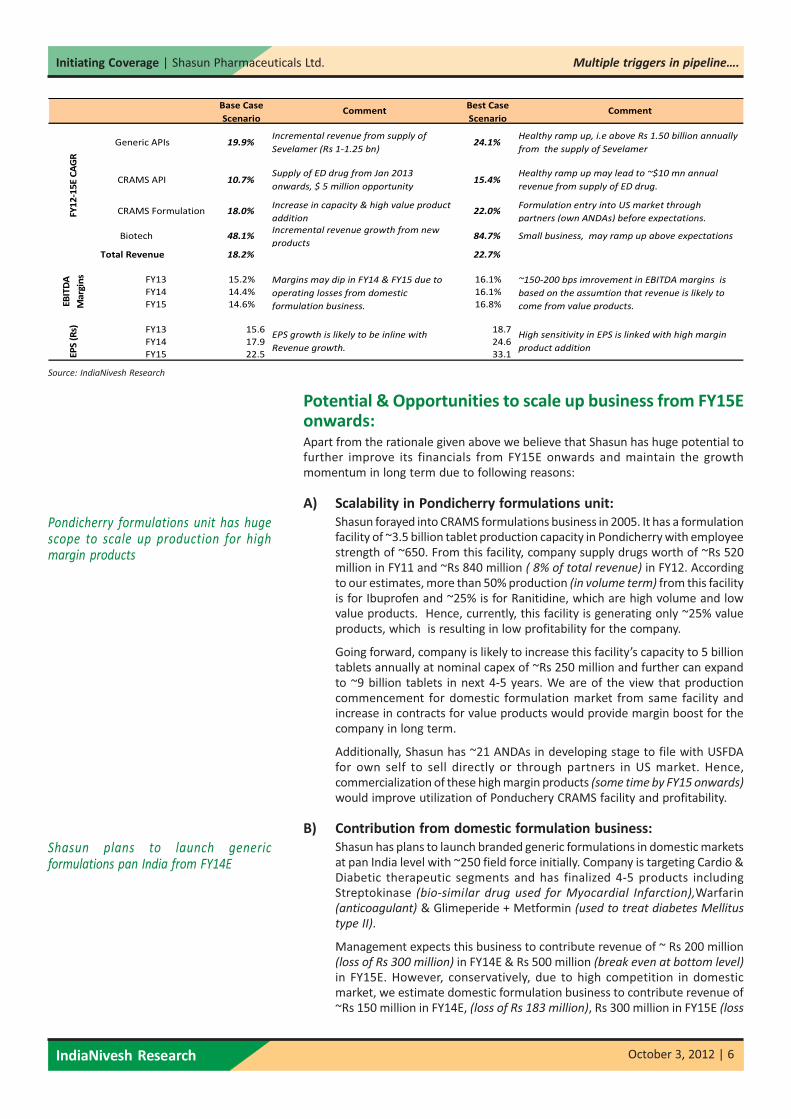
Generic APIs 19.9%Incremental revenue from supply of
Sevelamer (Rs 1-1.25 bn) 24.1%
Healthy ramp up, i.e above Rs 1.50 billion annually
from the supply of Sevelamer
CRAMS API 10.7%Supply of ED drug from Jan 2013
onwards, $ 5 million opportunity15.4%
Healthy ramp up may lead to ~$10 mn annual
revenue from supply of ED drug.
CRAMS Formulation 18.0%Increase in capacity & high value product
addition22.0%
Formulation entry into US market through
partners (own ANDAs) before expectations.
Biotech 48.1%Incremental revenue growth from new
products84.7% Small business, may ramp up above expectations
Total Revenue 18.2% 22.7%
FY13 15.2% 16.1%
FY14 14.4% 16.1%
FY15 14.6% 16.8%
FY13 15.6 18.7
FY14 17.9 24.6
FY15 22.5 33.1
Base Case
Scenario
Best Case
Scenario
~150-200 bps imrovement in EBITDA margins is
based on the assumtion that revenue is likely to
come from value products.
High sensitivity in EPS is linked with high margin
product addition
EP
S (
Rs)
EB
ITD
A
Ma
rgin
sFY
12
-15
E C
AG
R
CommentComment
Margins may dip in FY14 & FY15 due to
operating losses from domestic
formulation business.
EPS growth is likely to be inline with
Revenue growth.
IndiaNivesh Research October 3, 2012 | 7
Initiating Coverage | Shasun Pharmaceuticals Ltd. Multiple triggers in pipeline….
(300)
(200)
(100)
-
100
200
300
400
500
600
FY14E FY15E FY16E FY17E
Revenue (Rs Mn) Cost (fixed + Var) Profit (Loss)
of Rs 125 million) and break even is likely to be in between FY16E & FY17E.(See the chart given below).
Revenue & breakeven in domestic formulation business
Source: Company Filings; IndiaNivesh Research
C) Vizag (API) facility to start contributing from FY15E onwards:
Shasun is likely to invest Rs 2.5 billion in setting up an API facility in Vizag.This investment is likely to be in phased manner and first phase would becompleted by the end of April 2013. Remaining two phases would completein next one and half year. Accordingly, this facility would require another 6months for validation trials. Hence, we assume that complete benefit wouldaccrue post FY15E. We believe that increase in capacity is in line withmanagement guidance of robust revenue growth.
D) CRAMS APIs (UK) pipeline:
a) Hep-C supply to Innovator likely to sustain in long term.
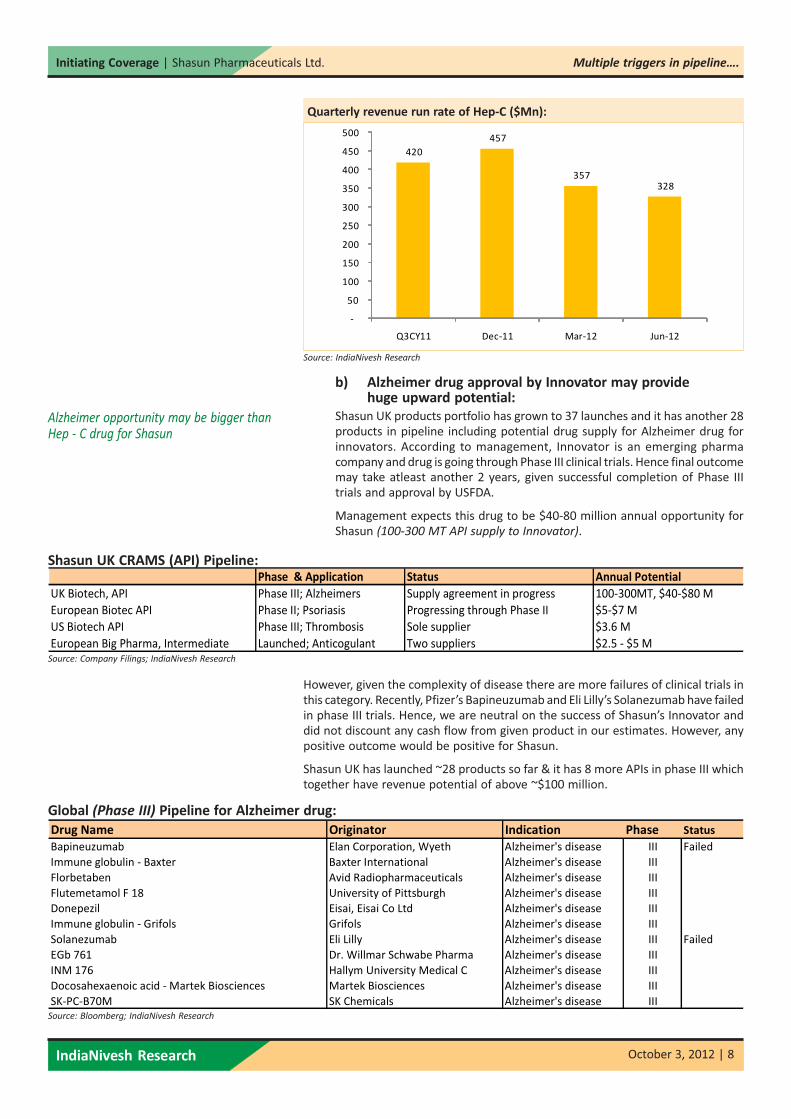
Shasun’s UK division is likely to maintain the growth momentum in the longterm partially on the back of sustainability in revenue from API supply ofHep-C to Innovator and partially on the back of new products in pipeline.
This drug is used for the treatment of Hepatitis C, and is most effective line oftreatment available so far (better effectiveness in treatment). Innovatorreceived NDA approval for the drug in May 2011 and after that this drug hascontributed more than $1.6 billion revenue in last four quarters. However,revenue has declined in last 2 quarters due to saturation in inventories andwe expect this drug to sustain revenue runrate of above $1 billion annually.
Further, Shasun is guaranteed API supplier for US market while J&J has supplytie-up for European markets. Currently Shasun is supplying API of given drugin the range of $20-25 million. Further, due to cost advantage & efficiency ofscale, Shasun UK may be sole supplier of the drug for US as well as for Europenmarkets in the future.
Latest discontinuation of Hepatitis C drug trails by BMS linked with side effects,would be positive in medium term for Innovator and consequently to Shasun.
API’s capacity expansion inline withincreasing demand
CRAMS UK business likely to sustainprofitability on the back of consistent supplyof Hep-C drug
IndiaNivesh Research October 3, 2012 | 8
Initiating Coverage | Shasun Pharmaceuticals Ltd. Multiple triggers in pipeline….
420
457
357
328
-
50
100
150
200
250
300
350
400
450
500
Q3CY11 Dec-11 Mar-12 Jun-12
Quarterly revenue run rate of Hep-C ($Mn):
Source: IndiaNivesh Research
b) Alzheimer drug approval by Innovator may providehuge upward potential:
Shasun UK products portfolio has grown to 37 launches and it has another 28products in pipeline including potential drug supply for Alzheimer drug forinnovators. According to management, Innovator is an emerging pharmacompany and drug is going through Phase III clinical trials. Hence final outcomemay take atleast another 2 years, given successful completion of Phase IIItrials and approval by USFDA.
Management expects this drug to be $40-80 million annual opportunity forShasun (100-300 MT API supply to Innovator).
Shasun UK CRAMS (API) Pipeline:Phase & Application Status Annual Potential
UK Biotech, API Phase III; Alzheimers Supply agreement in progress 100-300MT, $40-$80 M
European Biotec API Phase II; Psoriasis Progressing through Phase II $5-$7 M
US Biotech API Phase III; Thrombosis Sole supplier $3.6 M
European Big Pharma, Intermediate Launched; Anticogulant Two suppliers $2.5 - $5 MSource: Company Filings; IndiaNivesh Research
However, given the complexity of disease there are more failures of clinical trials inthis category. Recently, Pfizer’s Bapineuzumab and Eli Lilly’s Solanezumab have failedin phase III trials. Hence, we are neutral on the success of Shasun’s Innovator anddid not discount any cash flow from given product in our estimates. However, anypositive outcome would be positive for Shasun.
Shasun UK has launched ~28 products so far & it has 8 more APIs in phase III whichtogether have revenue potential of above ~$100 million.
Global (Phase III) Pipeline for Alzheimer drug:
Source: Bloomberg; IndiaNivesh Research
Drug Name Originator Indication Phase Status
Bapineuzumab Elan Corporation, Wyeth Alzheimer's disease III Failed
Immune globulin - Baxter Baxter International Alzheimer's disease III
Florbetaben Avid Radiopharmaceuticals Alzheimer's disease III
Flutemetamol F 18 University of Pittsburgh Alzheimer's disease III
Donepezil Eisai, Eisai Co Ltd Alzheimer's disease III
Immune globulin - Grifols Grifols Alzheimer's disease III
Solanezumab Eli Lilly Alzheimer's disease III Failed
EGb 761 Dr. Willmar Schwabe Pharma Alzheimer's disease III
INM 176 Hallym University Medical C Alzheimer's disease III
Docosahexaenoic acid - Martek Biosciences Martek Biosciences Alzheimer's disease III
SK-PC-B70M SK Chemicals Alzheimer's disease III
Alzheimer opportunity may be bigger thanHep - C drug for Shasun
IndiaNivesh Research October 3, 2012 | 9
Initiating Coverage | Shasun Pharmaceuticals Ltd. Multiple triggers in pipeline….
8.6%
12.8%
15.2%14.4% 14.6%
0.0%
2.0%
4.0%
6.0%
8.0%
10.0%
12.0%
14.0%
16.0%
FY11 FY12 FY13E FY14E FY15E
-
2,000
4,000
6,000
8,000
10,000
12,000
14,000
16,000
18,000
FY11 FY12 FY13E FY14E FY15E
Generic APIs CRAMS API CRAMS Formulations
BIOTECH Domestic Formulations
Financials
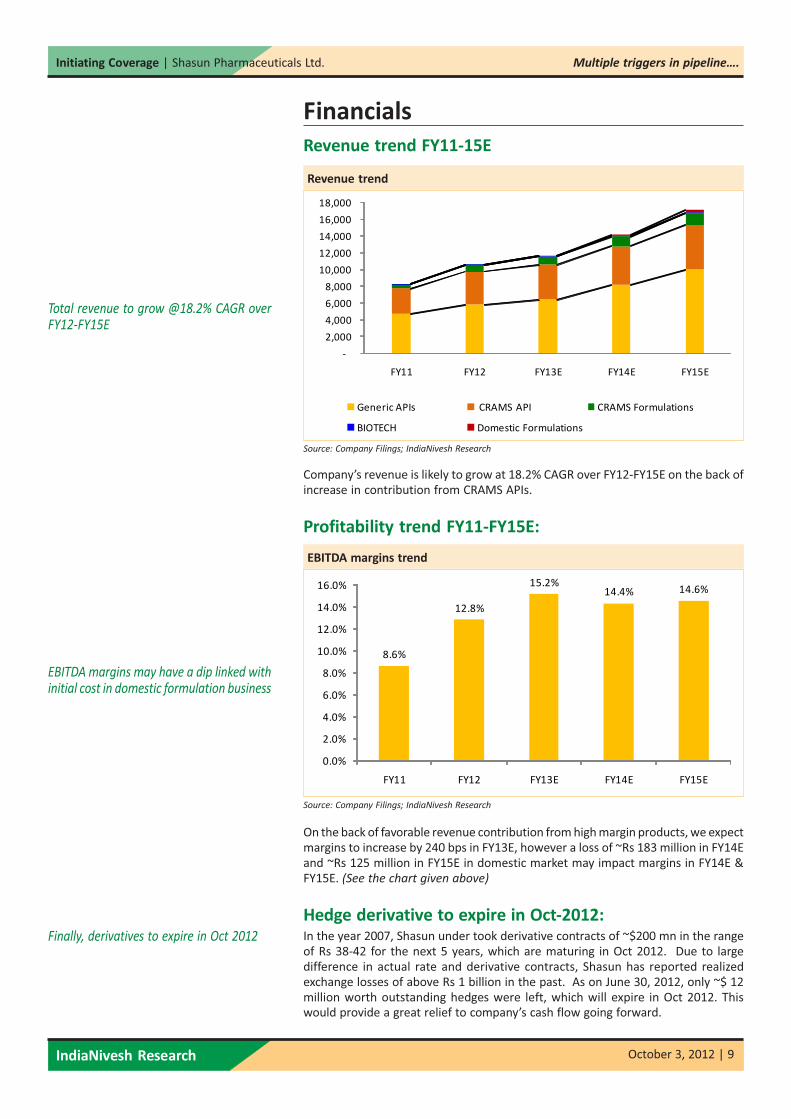
Revenue trend FY11-15E
Revenue trend
Source: Company Filings; IndiaNivesh Research
Company’s revenue is likely to grow at 18.2% CAGR over FY12-FY15E on the back ofincrease in contribution from CRAMS APIs.
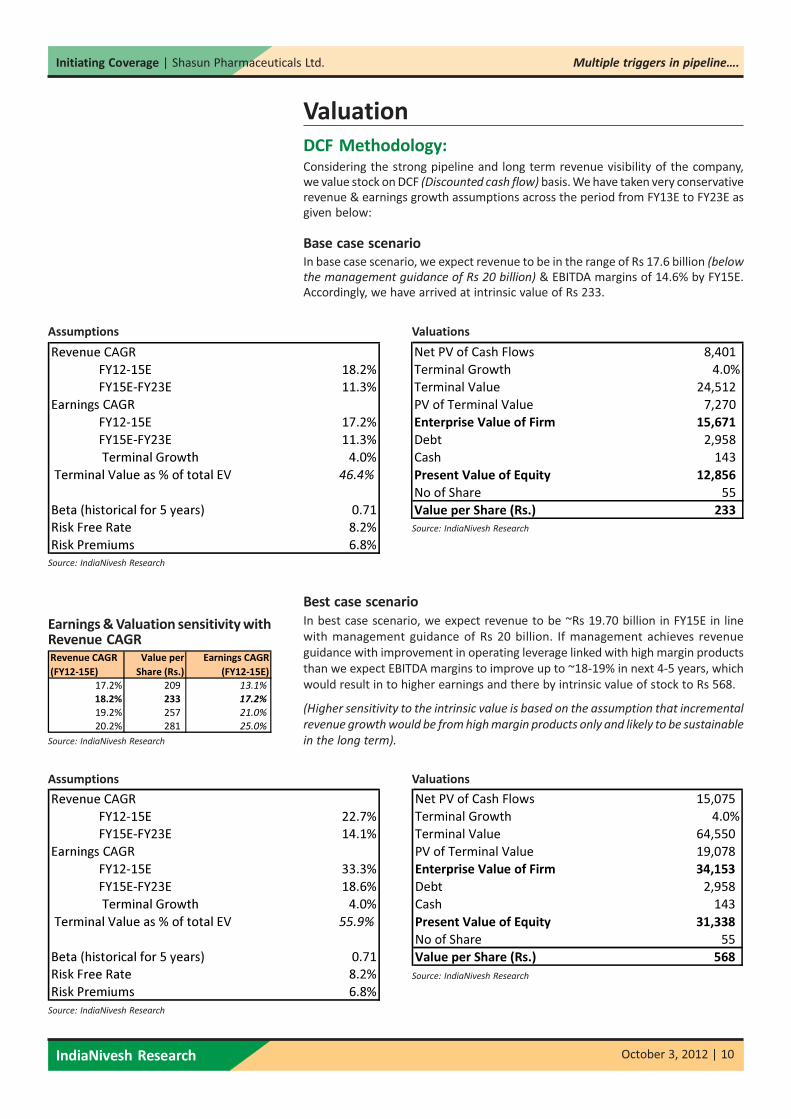
Profitability trend FY11-FY15E:
EBITDA margins trend
Source: Company Filings; IndiaNivesh Research
On the back of favorable revenue contribution from high margin products, we expectmargins to increase by 240 bps in FY13E, however a loss of ~Rs 183 million in FY14Eand ~Rs 125 million in FY15E in domestic market may impact margins in FY14E &FY15E. (See the chart given above)
Hedge derivative to expire in Oct-2012:In the year 2007, Shasun under took derivative contracts of ~$200 mn in the rangeof Rs 38-42 for the next 5 years, which are maturing in Oct 2012. Due to largedifference in actual rate and derivative contracts, Shasun has reported realizedexchange losses of above Rs 1 billion in the past. As on June 30, 2012, only ~$ 12million worth outstanding hedges were left, which will expire in Oct 2012. Thiswould provide a great relief to company’s cash flow going forward.
Total revenue to grow @18.2% CAGR overFY12-FY15E
EBITDA margins may have a dip linked withinitial cost in domestic formulation business
Finally, derivatives to expire in Oct 2012
IndiaNivesh Research October 3, 2012 | 10
Initiating Coverage | Shasun Pharmaceuticals Ltd. Multiple triggers in pipeline….
Valuation
DCF Methodology:Considering the strong pipeline and long term revenue visibility of the company,we value stock on DCF (Discounted cash flow) basis. We have taken very conservativerevenue & earnings growth assumptions across the period from FY13E to FY23E asgiven below:
Base case scenario
In base case scenario, we expect revenue to be in the range of Rs 17.6 billion (below
the management guidance of Rs 20 billion) & EBITDA margins of 14.6% by FY15E.Accordingly, we have arrived at intrinsic value of Rs 233.
Valuations
Source: IndiaNivesh Research
Source: IndiaNivesh Research
Assumptions
Best case scenario
In best case scenario, we expect revenue to be ~Rs 19.70 billion in FY15E in line
with management guidance of Rs 20 billion. If management achieves revenue
guidance with improvement in operating leverage linked with high margin products
than we expect EBITDA margins to improve up to ~18-19% in next 4-5 years, which
would result in to higher earnings and there by intrinsic value of stock to Rs 568.
(Higher sensitivity to the intrinsic value is based on the assumption that incremental
revenue growth would be from high margin products only and likely to be sustainable
in the long term).
Valuations
Source: IndiaNivesh Research
Source: IndiaNivesh Research
Assumptions
Revenue CAGR
FY12-15E 18.2%
FY15E-FY23E 11.3%
Earnings CAGR
FY12-15E 17.2%
FY15E-FY23E 11.3%
Terminal Growth 4.0%
Terminal Value as % of total EV 46.4%
Beta (historical for 5 years) 0.71
Risk Free Rate 8.2%
Risk Premiums 6.8%
Revenue CAGR
FY12-15E 22.7%
FY15E-FY23E 14.1%
Earnings CAGR
FY12-15E 33.3%
FY15E-FY23E 18.6%
Terminal Growth 4.0%
Terminal Value as % of total EV 55.9%
Beta (historical for 5 years) 0.71
Risk Free Rate 8.2%
Risk Premiums 6.8%
Source: IndiaNivesh Research
Earnings & Valuation sensitivity withRevenue CAGR
Revenue CAGR
(FY12-15E)
Value per
Share (Rs.)
Earnings CAGR
(FY12-15E)
17.2% 209 13.1%
18.2% 233 17.2%
19.2% 257 21.0%
20.2% 281 25.0%
Net PV of Cash Flows 8,401
Terminal Growth 4.0%
Terminal Value 24,512
PV of Terminal Value 7,270
Enterprise Value of Firm 15,671
Debt 2,958
Cash 143
Present Value of Equity 12,856
No of Share 55
Value per Share (Rs.) 233
Net PV of Cash Flows 15,075
Terminal Growth 4.0%
Terminal Value 64,550
PV of Terminal Value 19,078
Enterprise Value of Firm 34,153
Debt 2,958
Cash 143
Present Value of Equity 31,338
No of Share 55
Value per Share (Rs.) 568
IndiaNivesh Research October 3, 2012 | 11
Initiating Coverage | Shasun Pharmaceuticals Ltd. Multiple triggers in pipeline….
-150
-100
-50
0
50
100
150
200
250
300
Apr-06 Apr-07 Apr-08 Apr-09 Apr-10 Apr-11 Apr-12 Apr-13 Apr-14
2.0 X 4.0 X 6.0 X 8.0 X Price (Rs)
0
50
100
150
200
250
Apr-06 Apr-07 Apr-08 Apr-09 Apr-10 Apr-11 Apr-12 Apr-13 Apr-14
Price (Rs) 4.0 X 5.0 X 8.0 X 10.0 X 12.0 X
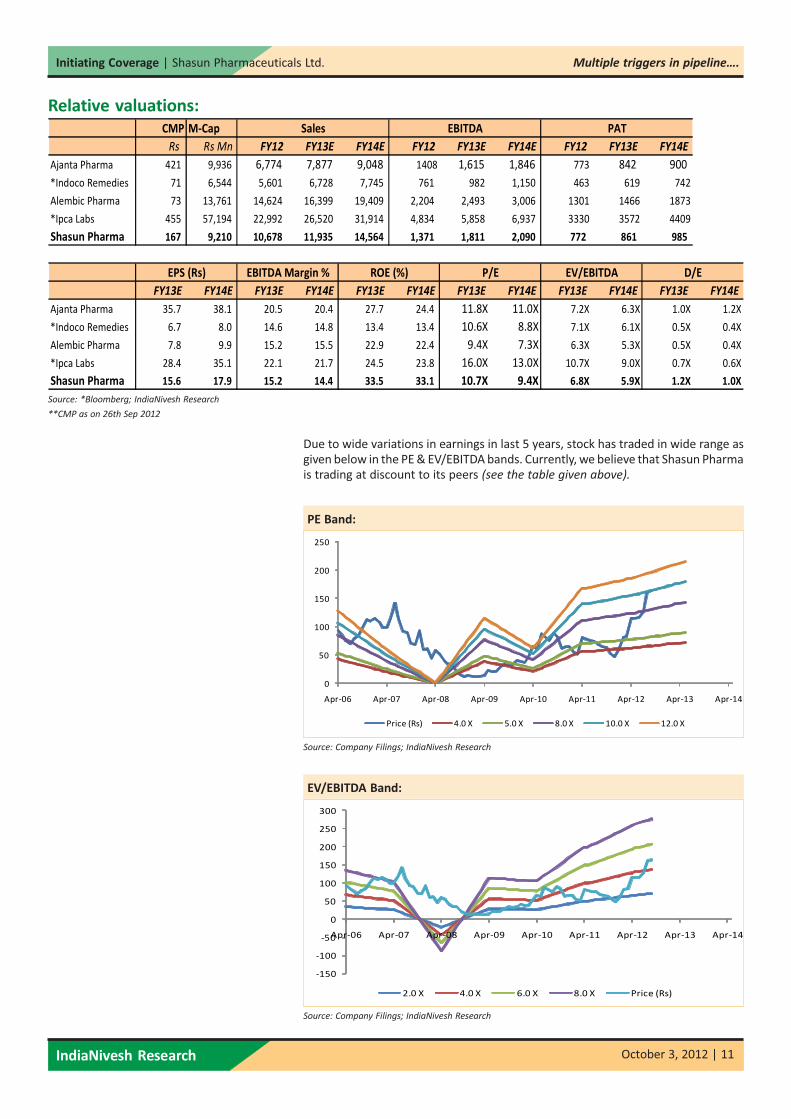
Relative valuations:
Source: *Bloomberg; IndiaNivesh Research
**CMP as on 26th Sep 2012
Due to wide variations in earnings in last 5 years, stock has traded in wide range asgiven below in the PE & EV/EBITDA bands. Currently, we believe that Shasun Pharmais trading at discount to its peers (see the table given above).
PE Band:
Source: Company Filings; IndiaNivesh Research
EV/EBITDA Band:
Source: Company Filings; IndiaNivesh Research
CMP M-Cap
Rs Rs Mn FY12 FY13E FY14E FY12 FY13E FY14E FY12 FY13E FY14E
Ajanta Pharma 421 9,936 6,774 7,877 9,048 1408 1,615 1,846 773 842 900
*Indoco Remedies 71 6,544 5,601 6,728 7,745 761 982 1,150 463 619 742
Alembic Pharma 73 13,761 14,624 16,399 19,409 2,204 2,493 3,006 1301 1466 1873
*Ipca Labs 455 57,194 22,992 26,520 31,914 4,834 5,858 6,937 3330 3572 4409
Shasun Pharma 167 9,210 10,678 11,935 14,564 1,371 1,811 2,090 772 861 985
FY13E FY14E FY13E FY14E FY13E FY14E FY13E FY14E FY13E FY14E FY13E FY14E
Ajanta Pharma 35.7 38.1 20.5 20.4 27.7 24.4 11.8X 11.0X 7.2X 6.3X 1.0X 1.2X
*Indoco Remedies 6.7 8.0 14.6 14.8 13.4 13.4 10.6X 8.8X 7.1X 6.1X 0.5X 0.4X
Alembic Pharma 7.8 9.9 15.2 15.5 22.9 22.4 9.4X 7.3X 6.3X 5.3X 0.5X 0.4X
*Ipca Labs 28.4 35.1 22.1 21.7 24.5 23.8 16.0X 13.0X 10.7X 9.0X 0.7X 0.6X
Shasun Pharma 15.6 17.9 15.2 14.4 33.5 33.1 10.7X 9.4X 6.8X 5.9X 1.2X 1.0X
Sales EBITDA PAT
EPS (Rs) EBITDA Margin % ROE (%) P/E EV/EBITDA D/E
IndiaNivesh Research October 3, 2012 | 12
Initiating Coverage | Shasun Pharmaceuticals Ltd. Multiple triggers in pipeline….
RecommendationWe recommend BUY on the stock with the target price of Rs 233 based on DCFvaluation, which imply P/E multiple of 14.8x of FY13E & 12.9x of FY14E earningsestimates, EV/EBITDA multiple of 9x of FY13E & 7.8x of FY14E EBITDA estimates.
At CMP of Rs 169, the stock is trading at P/E multiple of 10.6x of FY13E & 9.2x ofFY14E earnings estimates, and EV/EBITDA multiple of 7x of FY13E & 6.1x of FY14EEBITDA estimates. (Earlier we had recommended BUY on Shasun on 24th January 2011
at Rs 71 with target price of Rs 112. Further we upgraded our target price to Rs 150 on
3rd May 2012).
Risk & Concerns
Maximum contribution is from matured APIs:Company’s major revenue contribution (~47%) is from three products Ibuprofen,Ranitidine & Gabapentin. These products being matured may report slowdown indemand or increasing competition may erode the margins.
Foray in domestic market may burn cash:Company is likely to enter in to the domestic market with generic branded productsalong with field force of ~250 people in FY14E. Due to high competition and lateentry by Shasun, this market may be challenging for the company.
Liquidity may remain concern:Given the high capex requirement for Vizag facility and cash burn in domesticformulation business, company may witness challenges on managing large debt.Currently, company has debt of ~Rs 3.5 billion (Debt/Equity= 1.4x).
IndiaNivesh Research October 3, 2012 | 13
Initiating Coverage | Shasun Pharmaceuticals Ltd. Multiple triggers in pipeline….
APIs India
55%
APIs UK
0%
CRAMS APIs
(India)
6%
CRAMS APIs (UK)
31%
CRAMS
Formulations
(India)
8%
Biotech (India)
0%
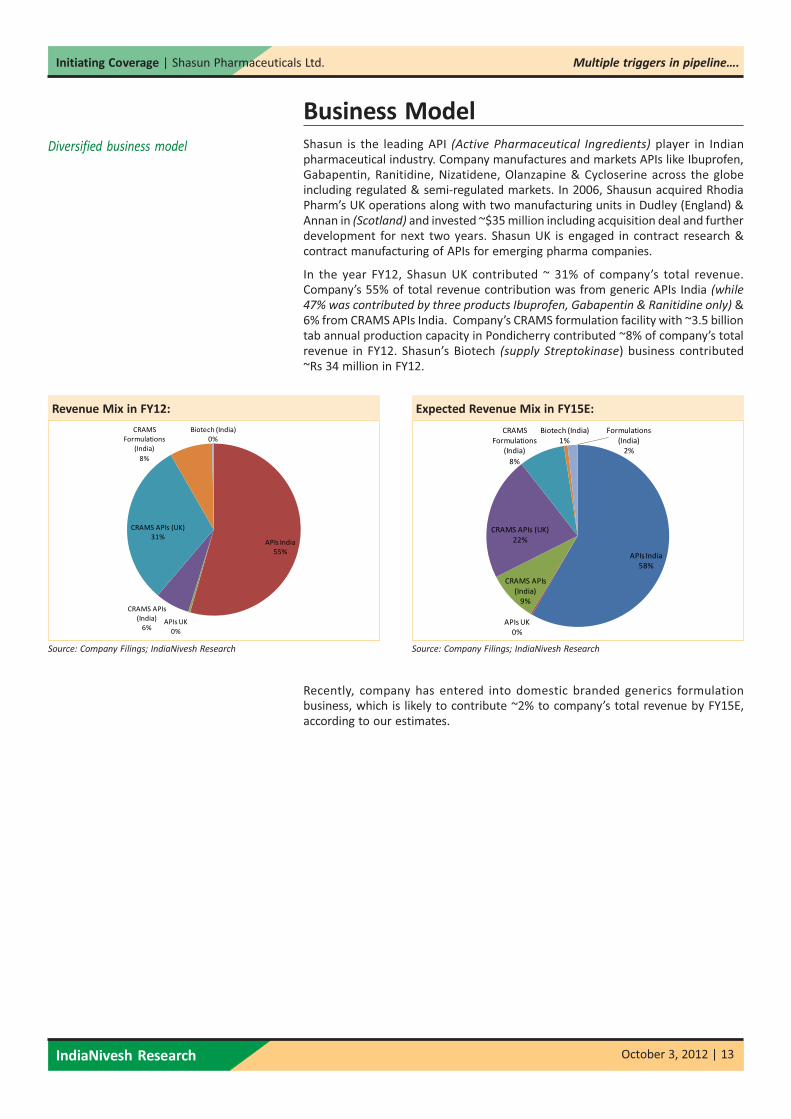
Revenue Mix in FY12:
Source: Company Filings; IndiaNivesh Research
Expected Revenue Mix in FY15E:
Source: Company Filings; IndiaNivesh Research
Recently, company has entered into domestic branded generics formulationbusiness, which is likely to contribute ~2% to company’s total revenue by FY15E,according to our estimates.
APIs India
58%
APIs UK
0%
CRAMS APIs
(India)
9%
CRAMS APIs (UK)
22%
CRAMS
Formulations
(India)
8%
Biotech (India)
1%
Formulations
(India)
2%
Business Model
Shasun is the leading API (Active Pharmaceutical Ingredients) player in Indianpharmaceutical industry. Company manufactures and markets APIs like Ibuprofen,Gabapentin, Ranitidine, Nizatidene, Olanzapine & Cycloserine across the globeincluding regulated & semi-regulated markets. In 2006, Shausun acquired RhodiaPharm’s UK operations along with two manufacturing units in Dudley (England) &Annan in (Scotland) and invested ~$35 million including acquisition deal and furtherdevelopment for next two years. Shasun UK is engaged in contract research &contract manufacturing of APIs for emerging pharma companies.
In the year FY12, Shasun UK contributed ~ 31% of company’s total revenue.Company’s 55% of total revenue contribution was from generic APIs India (while
47% was contributed by three products Ibuprofen, Gabapentin & Ranitidine only) &6% from CRAMS APIs India. Company’s CRAMS formulation facility with ~3.5 billiontab annual production capacity in Pondicherry contributed ~8% of company’s totalrevenue in FY12. Shasun’s Biotech (supply Streptokinase) business contributed~Rs 34 million in FY12.
Diversified business model
IndiaNivesh Research October 3, 2012 | 14
Initiating Coverage | Shasun Pharmaceuticals Ltd. Multiple triggers in pipeline….
Income statement
Y E March (Rs m) FY11 FY12 FY13E FY14E FY15E
Net sales 8,350 10,678 11,935 14,564 17,600
Growth % 3.6% 27.9% 11.8% 22.0% 20.8%
Expenditure
Raw Material 4,316 5,613 5,794 6,957 8,372
Employee cost 1,418 1,602 1,869 2,154 2,500
Other expenses 1,895 2,092 2,461 3,363 4,164
EBITDA 721 1,371 1,811 2,090 2,564
Growth % -7.6% 90.1% 32.1% 15.4% 22.7%
EBITDA Margin % 8.6% 12.8% 15.2% 14.4% 14.6%
Deprecaition 376 406 500 628 727
EBIT 345 965 1,311 1,463 1,837
EBIT Margin % 4.1% 9.0% 11.0% 10.0% 10.4%
Other Income 175 109 105 121 139
Interest 298 346 403 425 425
PBT 223 728 1,013 1,158 1,551
Tax (30) (209) 152 174 310
Effective tax rate % -13.6% -28.7% 15.0% 15.0% 20.0%
Extraordinary items 13 68 - - -
Less: Minority Interest
Adjusted PAT 253 772 861 985 1,241
Growth% -45.8% 204.9% 11.6% 14.4% 26.0%
PAT margin % 3.0% 7.2% 7.2% 6.8% 7.1%
Reported PAT 266 1,006 861 985 1,241
Growth% 608.1% 277.8% -14.4% 14.4% 26.0%
Balance sheet
Y E March (Rs m) FY11 FY12 FY13E FY14E FY15E
Share Capital 97 110 110 110 110
Reserves & Surplus 742 2,113 2,823 3,577 4,528
Net Worth 839 2,223 2,933 3,687 4,638
Non Current Liabilities
Long term borrowing 672 779 779 779 779
Deferred Tax liabilities 130 15 15 15 15
Other Loang Term Liabilities 158 52 52 52 52
Long term Provisions - - - - -
960 846 846 846 846
Current Liabilities
Short term borrowings 2,150 2,286 2,886 3,086 3,086
Trade payables 1,623 2,169 2,222 2,668 3,211
Other current liabilities 815 860 869 1,061 1,281
Short term provisions 159 230 232 283 342
4,746 5,546 6,209 7,098 7,920
Total Liabilities 6,545 8,615 9,989 11,631 13,405
Assets
Net Block 2,604 3,308 4,083 4,445 4,402
Non Current Investments 3 3 3 3 3
Long term laons & Advances 213 514 514 514 514
Current Assets
Inventories 1,282 1,379 1,587 1,937 2,341
Sundry Debtors 1,570 2,318 2,603 3,177 3,839
Cash & Banak Balances 123 143 155 283 769
Other Current Assets 512 678 753 919 1,111
Loans & Advances 238 273 290 354 427
3,724 4,790 5,389 6,670 8,486
Total assets 6,544 8,615 9,988 11,631 13,404
Cash flow
Y E March (Rs m) FY11 FY12 FY13E FY14E FY15E
PBT 236 797 1,013 1,158 1,551
Depreciation 376 406 500 628 727
Interest 257 300 403 425 425
Other non cash charges (339) (493) - - -
Changes in working capital 69 (408) (523) (464) (508)
Tax (8) (109) (152) (174) (310)
Cash flow fromoperations 590 492 1,241 1,573 1,885
Capital expenditure (355) (1,109) (1,275) (990) (683)
Free Cash Flow 235 (616) (34) 583 1,202
Other income 34 335 - - -
Investments
Cash flow from investments (321) (774) (1,275) (990) (683)
Equity capital raised 5 518 - - -
Loans availed or (repaid) 24 241 600 200 -
Interest paid (252) (306) (403) (425) (425)
Dividend paid (incl tax) (56) (126) (151) (230) (290)
Cash flow from Financing (279) 326 46 (456) (716)
Net change in cash (10) 44 12 128 486
Cash at the beginning of the year 98 123 143 155 283
Adjust 35 (24) - - -
Cash at the end of the year 123 143 155 283 769
Key ratios
Y E March FY11 FY12 FY13E FY14E FY15E
EPS (Rs) Core 5.2 14.0 15.6 17.9 22.5
EPS Reported 5.5 18.2 15.6 17.9 22.5
Cash EPS (Rs) 13.0 21.3 24.7 29.2 35.7
DPS (Rs) 1.0 2.0 2.3 3.6 4.5
BVPS (Rs) 134.8 156.2 181.1 210.9 243.1
ROCE 3.9% 9.0% 8.6% 8.5% 9.3%
ROE 26.6% 32.8% 34.5% 31.4% 33.5%
Inventories Days 59 49 50 50 50
Sundry Debtors Days 72 82 82 82 82
Trades Payable Days 137 141 140 140 140
PER (x) 12.9 7.9 10.6 9.2 7.3
P/BV (x) 0.5 0.7 0.9 0.8 0.7
EV/EBITDA (x) 8.3 6.6 7.0 6.1 4.8
Dividend Yield % 1.5% 1.8% 1.4% 2.2% 2.7%
m cap/sales (x) 0.4 0.6 0.8 0.6 0.5
net debt/equity (x) 3.4 1.4 1.2 1.0 0.8
net debt/ebitda (x) 3.7 2.1 1.9 1.7 1.2
Source: Company Filings; IndiaNivesh Research
Consolidated Financial Statements
IndiaNivesh Research October 3, 2012 | 15
Initiating Coverage | Shasun Pharmaceuticals Ltd. Multiple triggers in pipeline….
Disclaimer:
The projections and the forecasts described in this report were based upon a number of estimates and assumptions and are inherently subject to significant
uncertainties and contingencies. Projections and forecasts are necessarily speculative in nature, and it can be expected that one or more of the estimates on which
the projections are forecasts were based will not materialize or will vary significantly from actual results and such variations will likely increase over the period of
time. All the projections and forecasts described in this report have been prepared solely by authors of this report independently. All the forecasts were not
prepared with a view towards compliance with published guidelines or generally accepted accounting principles.
This report is for information purpose only and this document / material should not be construed as an offer to sell or the solicitation of an offer to buy, purchase or
subscribe to any securities, and neither this document nor anything contained therein shall form the basis of or be relied upon in connection with any contract or
commitment whatsoever. This document does not solicit any action based on material contained herein. It is for the general information of the clients of INSPL.
Though disseminated to the clients simultaneously, not all clients may receive this report at the same time. It does not constitute a personal recommendation or
take into account the particular investment objective, financial situation or needs of individual clients. Persons who may receive this document should consider and
independently evaluate whether it is suitable for its/ his/ her / their particular circumstances and if necessary seek professional / financial advice. Any such person
shall be responsible for conducting his / her/ its/ their own investigation and analysis of the information contained or referred to in this document and of evaluating
the merits and risks involved in securities forming the subject matter of this document. The price and value of the investment referred to in this document / material
and income from them may go up as well as down, and investors may realize profit / loss on their investments. Past performance is not a guide for future performance.
Actual results may differ materially from those set forth in the projection. Forward-looking statements are not predictions and may be subjected to change without
notice. INSPL accepts no liabilities for any loss or damage of any kind arising out of use of this report.
This report / document has been prepared by INSPL based upon the information available to the public and sources believed to be reliable. Though utmost care has
been taken to ensure its accuracy, no representation or warranty, express or implied is made that it is accurate. INSPL has reviewed this report and, in so far as it
includes current and historical information, it is believed to be reliable, although its accuracy and completeness cannot be guaranteed.
Following table contains the disclosure of interest in order to adhere to utmost transparency in the matter;
This information is subject to change without any prior notice. INSPL reserves the right to make modifications and alternations to this statement as may be required
from time to time. Nevertheless, INSPL is committed to providing independent and transparent recommendations to its clients, and would be happy to provide
information in response to specific client queries.
Disclosure of Interest Statement
1. Analyst ownership of the stock No
2. Group/Directors ownership of the stock Yes
3. Broking relationship with company covered No
4. Investment Banking relationship with company covered No
IndiaNivesh Securities Private Limited
601 & 602, Sukh Sagar, N. S. Patkar Marg, Girgaum Chowpatty, Mumbai 400 007.
Tel: (022) 66188800 / Fax: (022) 66188899
e-mail: [email protected] | Website: www.indianivesh.in
Home
IndiaNivesh Research is also available on Bloomberg INNS, Thomson First Call, Reuters and Factiva INDNIV.


![Strides Shasun to acquire controlling stake in Universal Corporation, Kenya [Company Update]](https://img.pdfslide.net/doc/110x75/577ca5091a28abea748b5d5c/strides-shasun-to-acquire-controlling-stake-in-universal-corporation-kenya.jpg)