Embed Size (px)
DESCRIPTION
cebbco coverage
Citation preview
Sailing on synergies
Adani Power
Nalin Bhatt ([email protected]) +91 22 3982 5429 / Satyam Agarwal ([email protected]); Tel: +91 22 3982 5410
Vishal Periwal ([email protected]) +91 22 3982 5417
Base Report | April 2011
Sector: Utilities
Adani Power
211 April 2011
Adani Power: Sailing on synergies
Page No.
Summary .......................................................................................................... 3-4
Accelerated project execution; comfortably positioned on
several parameters .......................................................................................... 5-7
Well placed to fund 6.6GW of initial projects pipeline ................................... 8-9
PPA structure exposes to fuel price/availability risks .................................10-11
Merchant contribution to profitability sizable, exposes to
near term earnings volatility ....................................................................... 12-13
Multi-fold earnings growth; initiate coverage with Neutral ...................... 14-15
Annexure 1: APL's project portfolio .................................................................16
Financials and valuation .............................................................................. 17-18
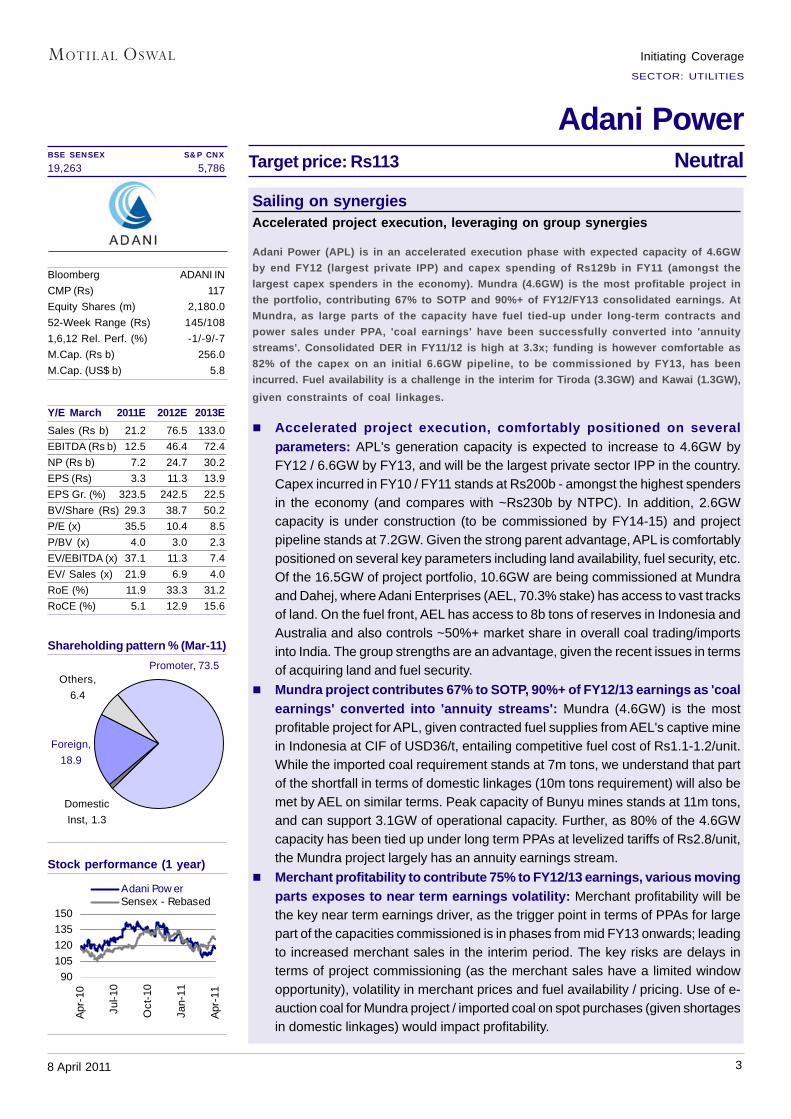
Adani PowerTarget price: Rs113 NeutralBSE SENSEX S&P CNX
19,263 5,786
Sailing on synergiesAccelerated project execution, leveraging on group synergies
Adani Power (APL) is in an accelerated execution phase with expected capacity of 4.6GW
by end FY12 (largest private IPP) and capex spending of Rs129b in FY11 (amongst the
largest capex spenders in the economy). Mundra (4.6GW) is the most profitable project in
the portfolio, contributing 67% to SOTP and 90%+ of FY12/FY13 consolidated earnings. At
Mundra, as large parts of the capacity have fuel tied-up under long-term contracts and
power sales under PPA, 'coal earnings' have been successfully converted into 'annuity
streams'. Consolidated DER in FY11/12 is high at 3.3x; funding is however comfortable as
82% of the capex on an initial 6.6GW pipeline, to be commissioned by FY13, has been
incurred. Fuel availability is a challenge in the interim for Tiroda (3.3GW) and Kawai (1.3GW),
given constraints of coal linkages.
Accelerated project execution, comfortably positioned on several
parameters: APL's generation capacity is expected to increase to 4.6GW by
FY12 / 6.6GW by FY13, and will be the largest private sector IPP in the country.
Capex incurred in FY10 / FY11 stands at Rs200b - amongst the highest spenders
in the economy (and compares with ~Rs230b by NTPC). In addition, 2.6GW
capacity is under construction (to be commissioned by FY14-15) and project
pipeline stands at 7.2GW. Given the strong parent advantage, APL is comfortably
positioned on several key parameters including land availability, fuel security, etc.
Of the 16.5GW of project portfolio, 10.6GW are being commissioned at Mundra
and Dahej, where Adani Enterprises (AEL, 70.3% stake) has access to vast tracks
of land. On the fuel front, AEL has access to 8b tons of reserves in Indonesia and
Australia and also controls ~50%+ market share in overall coal trading/imports
into India. The group strengths are an advantage, given the recent issues in terms
of acquiring land and fuel security.
Mundra project contributes 67% to SOTP, 90%+ of FY12/13 earnings as 'coal
earnings' converted into 'annuity streams': Mundra (4.6GW) is the most
profitable project for APL, given contracted fuel supplies from AEL's captive mine
in Indonesia at CIF of USD36/t, entailing competitive fuel cost of Rs1.1-1.2/unit.
While the imported coal requirement stands at 7m tons, we understand that part
of the shortfall in terms of domestic linkages (10m tons requirement) will also be
met by AEL on similar terms. Peak capacity of Bunyu mines stands at 11m tons,
and can support 3.1GW of operational capacity. Further, as 80% of the 4.6GW
capacity has been tied up under long term PPAs at levelized tariffs of Rs2.8/unit,
the Mundra project largely has an annuity earnings stream.
Merchant profitability to contribute 75% to FY12/13 earnings, various moving
parts exposes to near term earnings volatility: Merchant profitability will be
the key near term earnings driver, as the trigger point in terms of PPAs for large
part of the capacities commissioned is in phases from mid FY13 onwards; leading
to increased merchant sales in the interim period. The key risks are delays in
terms of project commissioning (as the merchant sales have a limited window
opportunity), volatility in merchant prices and fuel availability / pricing. Use of e-
auction coal for Mundra project / imported coal on spot purchases (given shortages
in domestic linkages) would impact profitability.
Stock performance (1 year)
Shareholding pattern % (Mar-11)
Bloomberg ADANI IN
CMP (Rs) 117
Equity Shares (m) 2,180.0
52-Week Range (Rs) 145/108
1,6,12 Rel. Perf. (%) -1/-9/-7
M.Cap. (Rs b) 256.0
M.Cap. (US$ b) 5.8
Y/E March 2011E 2012E 2013E
Sales (Rs b) 21.2 76.5 133.0
EBITDA (Rs b) 12.5 46.4 72.4
NP (Rs b) 7.2 24.7 30.2
EPS (Rs) 3.3 11.3 13.9
EPS Gr. (%) 323.5 242.5 22.5
BV/Share (Rs) 29.3 38.7 50.2
P/E (x) 35.5 10.4 8.5
P/BV (x) 4.0 3.0 2.3
EV/EBITDA (x) 37.1 11.3 7.4
EV/ Sales (x) 21.9 6.9 4.0
RoE (%) 11.9 33.3 31.2
RoCE (%) 5.1 12.9 15.6
Domestic
Inst, 1.3
Others,
6.4
Foreign,
18.9
Promoter, 73.5
Initiating Coverage
SECTOR: UTILITIES
38 April 2011
90
105
120
135
150
Apr
-10
Jul-1
0
Oct
-10
Jan-
11
Apr
-11
Adani Pow erSensex - Rebased
Adani Power
411 April 2011
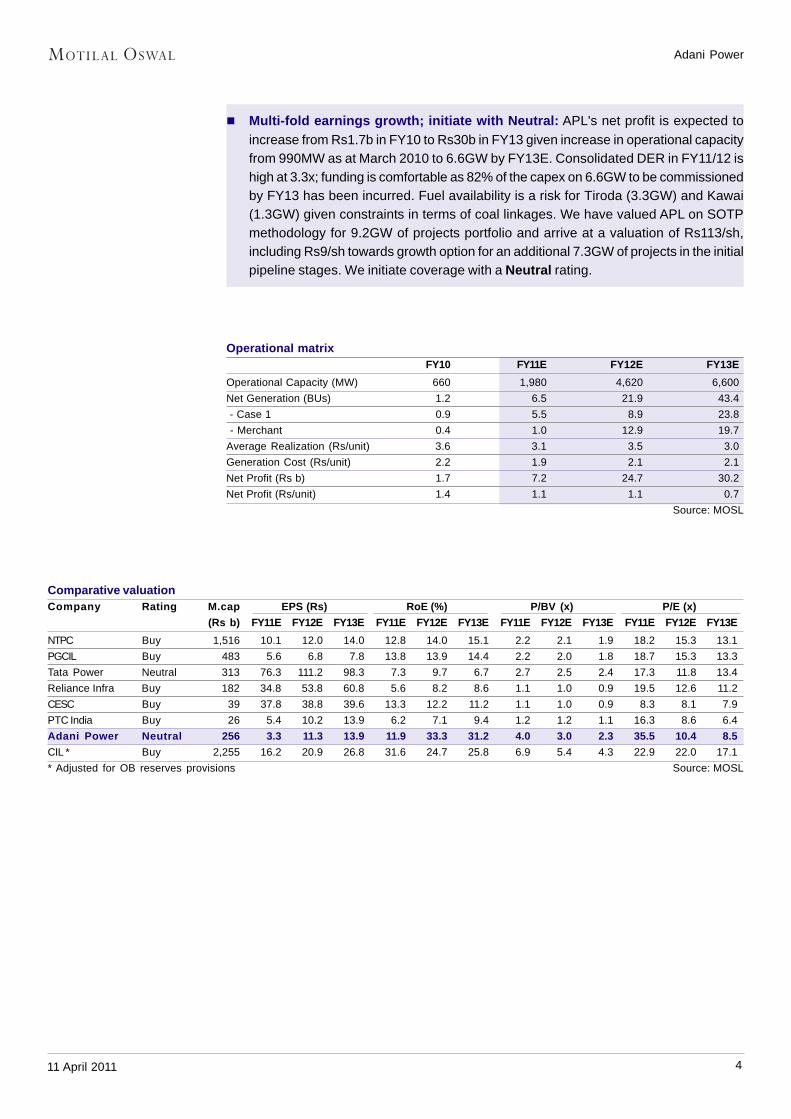
Multi-fold earnings growth; initiate with Neutral: APL's net profit is expected to
increase from Rs1.7b in FY10 to Rs30b in FY13 given increase in operational capacity
from 990MW as at March 2010 to 6.6GW by FY13E. Consolidated DER in FY11/12 is
high at 3.3x; funding is comfortable as 82% of the capex on 6.6GW to be commissioned
by FY13 has been incurred. Fuel availability is a risk for Tiroda (3.3GW) and Kawai
(1.3GW) given constraints in terms of coal linkages. We have valued APL on SOTP
methodology for 9.2GW of projects portfolio and arrive at a valuation of Rs113/sh,
including Rs9/sh towards growth option for an additional 7.3GW of projects in the initial
pipeline stages. We initiate coverage with a Neutral rating.
Operational matrixFY10 FY11E FY12E FY13E
Operational Capacity (MW) 660 1,980 4,620 6,600
Net Generation (BUs) 1.2 6.5 21.9 43.4
- Case 1 0.9 5.5 8.9 23.8
- Merchant 0.4 1.0 12.9 19.7
Average Realization (Rs/unit) 3.6 3.1 3.5 3.0
Generation Cost (Rs/unit) 2.2 1.9 2.1 2.1
Net Profit (Rs b) 1.7 7.2 24.7 30.2
Net Profit (Rs/unit) 1.4 1.1 1.1 0.7
Source: MOSL
Comparative valuationCompany Rating M.cap EPS (Rs) RoE (%) P/BV (x) P/E (x)
(Rs b) FY11E FY12E FY13E FY11E FY12E FY13E FY11E FY12E FY13E FY11E FY12E FY13E
NTPC Buy 1,516 10.1 12.0 14.0 12.8 14.0 15.1 2.2 2.1 1.9 18.2 15.3 13.1
PGCIL Buy 483 5.6 6.8 7.8 13.8 13.9 14.4 2.2 2.0 1.8 18.7 15.3 13.3
Tata Power Neutral 313 76.3 111.2 98.3 7.3 9.7 6.7 2.7 2.5 2.4 17.3 11.8 13.4
Reliance Infra Buy 182 34.8 53.8 60.8 5.6 8.2 8.6 1.1 1.0 0.9 19.5 12.6 11.2
CESC Buy 39 37.8 38.8 39.6 13.3 12.2 11.2 1.1 1.0 0.9 8.3 8.1 7.9
PTC India Buy 26 5.4 10.2 13.9 6.2 7.1 9.4 1.2 1.2 1.1 16.3 8.6 6.4
Adani Power Neutral 256 3.3 11.3 13.9 11.9 33.3 31.2 4.0 3.0 2.3 35.5 10.4 8.5
CIL * Buy 2,255 16.2 20.9 26.8 31.6 24.7 25.8 6.9 5.4 4.3 22.9 22.0 17.1
* Adjusted for OB reserves provisions Source: MOSL
Adani Power
511 April 2011
Accelerated project execution; comfortably positioned onseveral parameters
APL's generation capacity is expected to increase to 4.6GW by FY12 / 6.6GW by FY13, and will
be the largest private sector IPP in India. Capex incurred in FY10 / FY11 stands at Rs200b -
amongst the highest spenders in the economy (and compares with ~Rs230b by NTPC). In
addition, 2.6GW capacity is under construction (to be commissioned by FY14-15) and project
pipeline stands at 7.3GW. Given the strong parent advantage, APL is comfortably positioned
on several key parameters including land availability, fuel security, etc. Of the 16.5GW of
project portfolio, 10.6GW are being commissioned at Mundra and Dahej, where Adani
Enterprises (AEL, 70.3% stake) has access to vast tracks of land. On the fuel front, AEL has
access to 8b tons of reserves in Indonesia and Australia and controls ~50%+ market share
in overall coal trading/imports into India. The group strengths are an advantage, given the
recent issues in terms of acquiring land and fuel security.
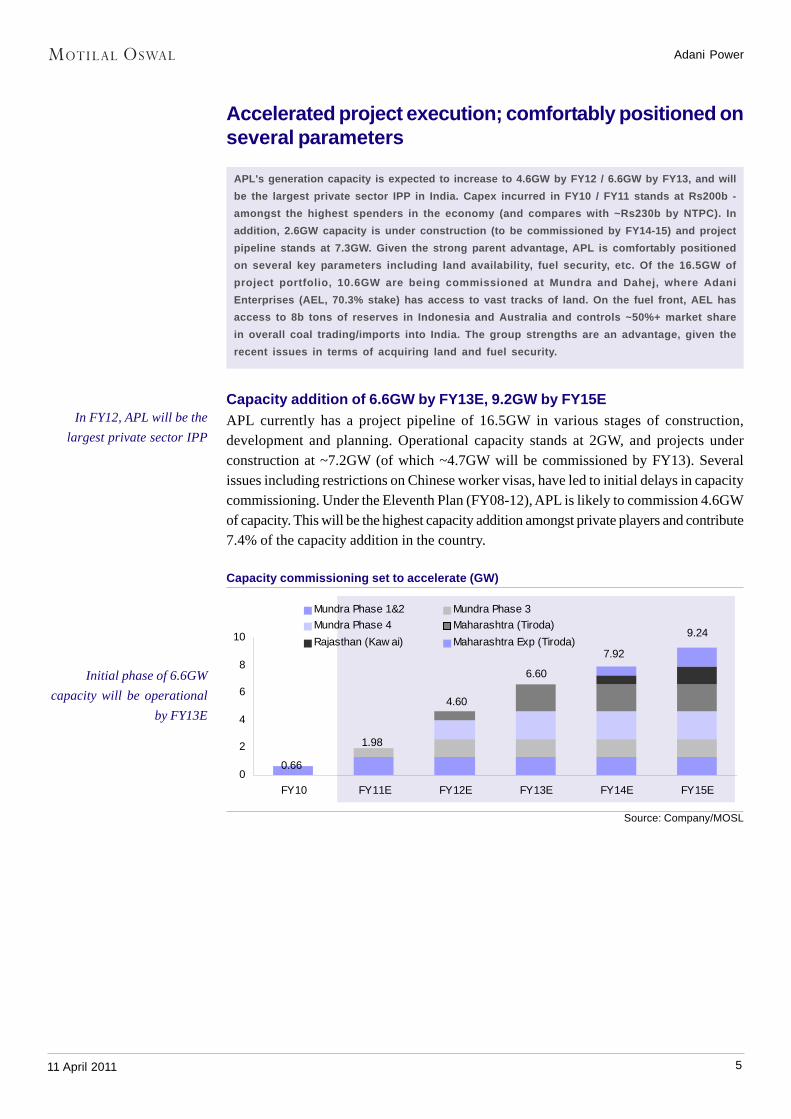
Capacity addition of 6.6GW by FY13E, 9.2GW by FY15E
APL currently has a project pipeline of 16.5GW in various stages of construction,development and planning. Operational capacity stands at 2GW, and projects underconstruction at ~7.2GW (of which ~4.7GW will be commissioned by FY13). Severalissues including restrictions on Chinese worker visas, have led to initial delays in capacitycommissioning. Under the Eleventh Plan (FY08-12), APL is likely to commission 4.6GWof capacity. This will be the highest capacity addition amongst private players and contribute7.4% of the capacity addition in the country.
Capacity commissioning set to accelerate (GW)
Initial phase of 6.6GW
capacity will be operational
by FY13E
Source: Company/MOSL
0
2
4
6
8
10
FY10 FY11E FY12E FY13E FY14E FY15E
Mundra Phase 1&2 Mundra Phase 3
Mundra Phase 4 Maharashtra (Tiroda)
Rajasthan (Kaw ai) Maharashtra Exp (Tiroda)
0.66
9.24
7.92
6.60
4.60
1.98
In FY12, APL will be the
largest private sector IPP
Adani Power
611 April 2011
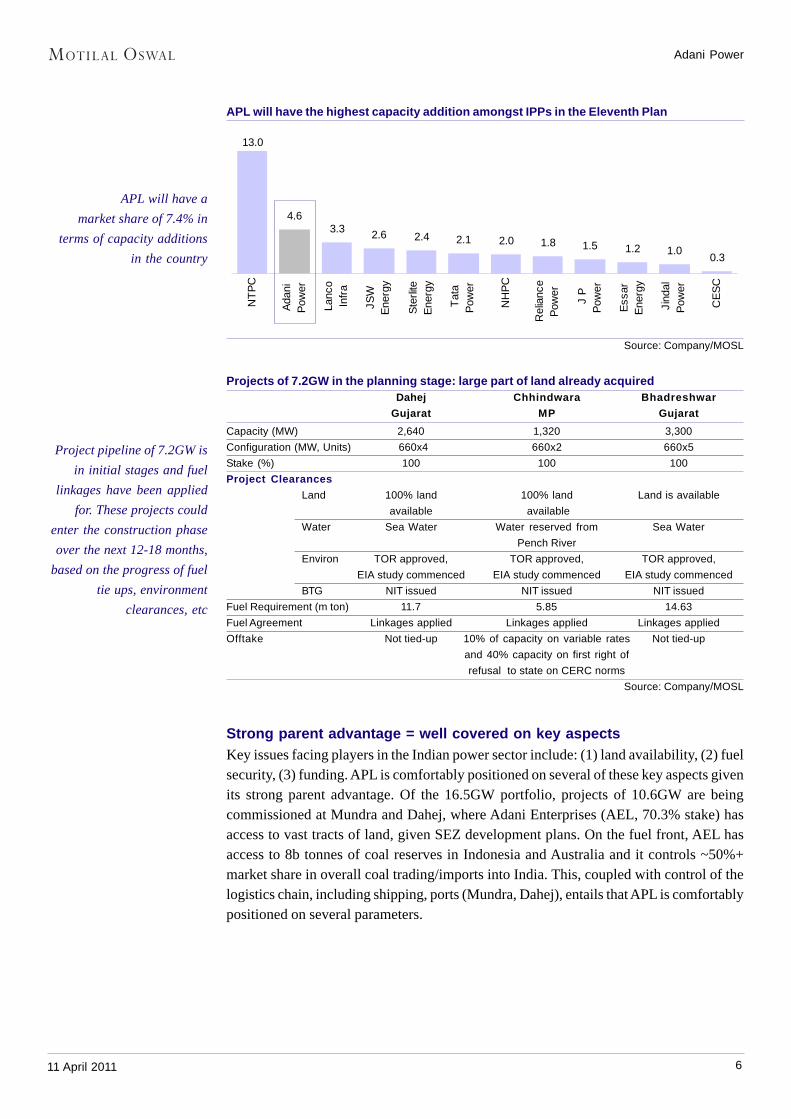
APL will have the highest capacity addition amongst IPPs in the Eleventh Plan
APL will have a
market share of 7.4% in
terms of capacity additions
in the country
Source: Company/MOSL
Projects of 7.2GW in the planning stage: large part of land already acquiredDahej Chhindwara Bhadreshwar
Gujarat MP Gujarat
Capacity (MW) 2,640 1,320 3,300
Configuration (MW, Units) 660x4 660x2 660x5
Stake (%) 100 100 100
Project Clearances
Land 100% land 100% land Land is available
available available
Water Sea Water Water reserved from Sea Water
Pench River
Environ TOR approved, TOR approved, TOR approved,
EIA study commenced EIA study commenced EIA study commenced
BTG NIT issued NIT issued NIT issued
Fuel Requirement (m ton) 11.7 5.85 14.63
Fuel Agreement Linkages applied Linkages applied Linkages applied
Offtake Not tied-up 10% of capacity on variable rates Not tied-up
and 40% capacity on first right of
refusal to state on CERC norms
Source: Company/MOSL
Strong parent advantage = well covered on key aspects
Key issues facing players in the Indian power sector include: (1) land availability, (2) fuelsecurity, (3) funding. APL is comfortably positioned on several of these key aspects givenits strong parent advantage. Of the 16.5GW portfolio, projects of 10.6GW are beingcommissioned at Mundra and Dahej, where Adani Enterprises (AEL, 70.3% stake) hasaccess to vast tracts of land, given SEZ development plans. On the fuel front, AEL hasaccess to 8b tonnes of coal reserves in Indonesia and Australia and it controls ~50%+market share in overall coal trading/imports into India. This, coupled with control of thelogistics chain, including shipping, ports (Mundra, Dahej), entails that APL is comfortablypositioned on several parameters.
Project pipeline of 7.2GW is
in initial stages and fuel
linkages have been applied
for. These projects could
enter the construction phase
over the next 12-18 months,
based on the progress of fuel
tie ups, environment
clearances, etc
13.0
4.63.3 2.6 2.4 2.1 2.0 1.8 1.5 1.2 1.0
0.3N
TP
C
Ada
niP
ower
Lanc
oIn
fra
JSW
Ene
rgy
Ste
rlite
Ene
rgy
Tat
aP
ower
NH
PC
Rel
ianc
eP
ower
J P
Pow
er
Ess
arE
nerg
y
Jind
alP
ower
CE
SC
Adani Power
711 April 2011
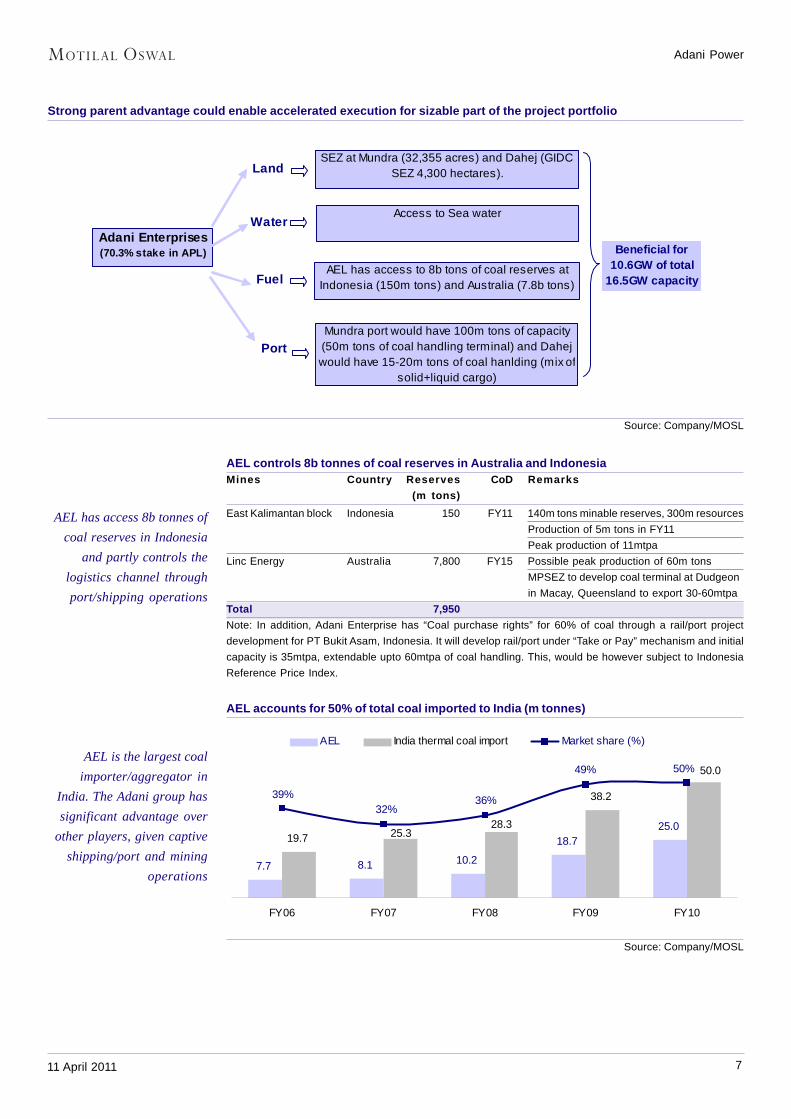
Strong parent advantage could enable accelerated execution for sizable part of the project portfolio
AEL controls 8b tonnes of coal reserves in Australia and IndonesiaMines Country Reserves CoD Remarks
(m tons)
East Kalimantan block Indonesia 150 FY11 140m tons minable reserves, 300m resources
Production of 5m tons in FY11
Peak production of 11mtpa
Linc Energy Australia 7,800 FY15 Possible peak production of 60m tons
MPSEZ to develop coal terminal at Dudgeon
in Macay, Queensland to export 30-60mtpa
Total 7,950
Note: In addition, Adani Enterprise has “Coal purchase rights” for 60% of coal through a rail/port project
development for PT Bukit Asam, Indonesia. It will develop rail/port under “Take or Pay” mechanism and initial
capacity is 35mtpa, extendable upto 60mtpa of coal handling. This, would be however subject to Indonesia
Reference Price Index.
AEL accounts for 50% of total coal imported to India (m tonnes)
AEL has access 8b tonnes of
coal reserves in Indonesia
and partly controls the
logistics channel through
port/shipping operations
AEL is the largest coal
importer/aggregator in
India. The Adani group has
significant advantage over
other players, given captive
shipping/port and mining
operations
Source: Company/MOSL
7.7 8.1 10.2
18.725.0
19.7
38.2
50.0
28.325.3
39%32%
36%
49% 50%
FY06 FY07 FY08 FY09 FY10
AEL India thermal coal import Market share (%)
SEZ at Mundra (32,355 acres) and Dahej (GIDC SEZ 4,300 hectares).
Access to Sea water
AEL has access to 8b tons of coal reserves at Indonesia (150m tons) and Australia (7.8b tons)
Mundra port would have 100m tons of capacity (50m tons of coal handling terminal) and Dahej would have 15-20m tons of coal hanlding (mix of
solid+liquid cargo)
Land
Water
Fuel
Port
Adani Enterprises(70.3% stake in APL) Beneficial for
10.6GW of total 16.5GW capacity
Source: Company/MOSL
Adani Power
811 April 2011
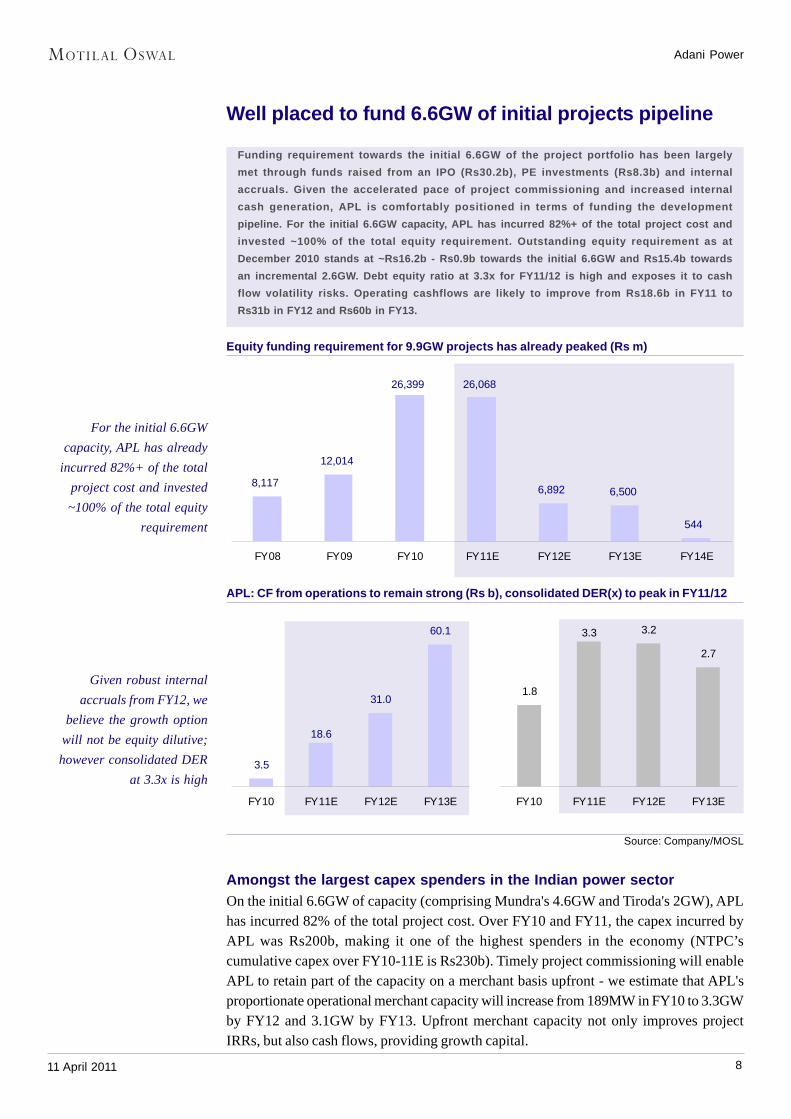
Well placed to fund 6.6GW of initial projects pipeline
Funding requirement towards the initial 6.6GW of the project portfolio has been largely
met through funds raised from an IPO (Rs30.2b), PE investments (Rs8.3b) and internal
accruals. Given the accelerated pace of project commissioning and increased internal
cash generation, APL is comfortably positioned in terms of funding the development
pipeline. For the initial 6.6GW capacity, APL has incurred 82%+ of the total project cost and
invested ~100% of the total equity requirement. Outstanding equity requirement as at
December 2010 stands at ~Rs16.2b - Rs0.9b towards the initial 6.6GW and Rs15.4b towards
an incremental 2.6GW. Debt equity ratio at 3.3x for FY11/12 is high and exposes it to cash
flow volatility risks. Operating cashflows are likely to improve from Rs18.6b in FY11 to
Rs31b in FY12 and Rs60b in FY13.
Equity funding requirement for 9.9GW projects has already peaked (Rs m)
For the initial 6.6GW
capacity, APL has already
incurred 82%+ of the total
project cost and invested
~100% of the total equity
requirement
APL: CF from operations to remain strong (Rs b), consolidated DER(x) to peak in FY11/12
Given robust internal
accruals from FY12, we
believe the growth option
will not be equity dilutive;
however consolidated DER
at 3.3x is high
Source: Company/MOSL
Amongst the largest capex spenders in the Indian power sector
On the initial 6.6GW of capacity (comprising Mundra's 4.6GW and Tiroda's 2GW), APLhas incurred 82% of the total project cost. Over FY10 and FY11, the capex incurred byAPL was Rs200b, making it one of the highest spenders in the economy (NTPC’scumulative capex over FY10-11E is Rs230b). Timely project commissioning will enableAPL to retain part of the capacity on a merchant basis upfront - we estimate that APL'sproportionate operational merchant capacity will increase from 189MW in FY10 to 3.3GWby FY12 and 3.1GW by FY13. Upfront merchant capacity not only improves projectIRRs, but also cash flows, providing growth capital.
8,117
12,014
26,399 26,068
6,892 6,500
544
FY08 FY09 FY10 FY11E FY12E FY13E FY14E
3.5
31.0
60.1
18.6
FY10 FY11E FY12E FY13E
1.8
3.2
2.7
3.3
FY10 FY11E FY12E FY13E
Adani Power
911 April 2011
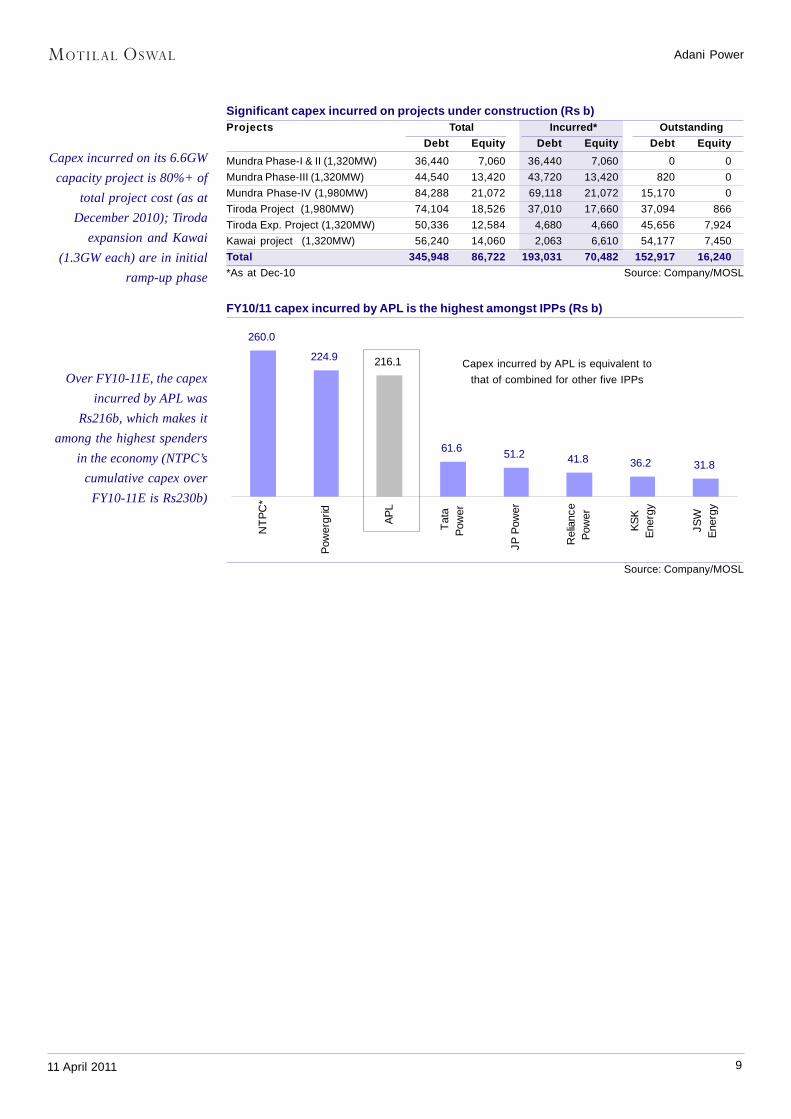
Capex incurred on its 6.6GW
capacity project is 80%+ of
total project cost (as at
December 2010); Tiroda
expansion and Kawai
(1.3GW each) are in initial
ramp-up phase
Over FY10-11E, the capex
incurred by APL was
Rs216b, which makes it
among the highest spenders
in the economy (NTPC’s
cumulative capex over
FY10-11E is Rs230b)
260.0
224.9
61.6 51.2 41.8 36.2 31.8
216.1
NT
PC
*
Pow
ergr
id
AP
L
Tat
aP
ower
JP P
ower
Rel
ianc
eP
ower
KS
KE
nerg
y
JSW
Ene
rgy
Significant capex incurred on projects under construction (Rs b)Projects Total Incurred* Outstanding
Debt Equity Debt Equity Debt Equity
Mundra Phase-I & II (1,320MW) 36,440 7,060 36,440 7,060 0 0
Mundra Phase-III (1,320MW) 44,540 13,420 43,720 13,420 820 0
Mundra Phase-IV (1,980MW) 84,288 21,072 69,118 21,072 15,170 0
Tiroda Project (1,980MW) 74,104 18,526 37,010 17,660 37,094 866
Tiroda Exp. Project (1,320MW) 50,336 12,584 4,680 4,660 45,656 7,924
Kawai project (1,320MW) 56,240 14,060 2,063 6,610 54,177 7,450
Total 345,948 86,722 193,031 70,482 152,917 16,240
*As at Dec-10 Source: Company/MOSL
FY10/11 capex incurred by APL is the highest amongst IPPs (Rs b)
Capex incurred by APL is equivalent to
that of combined for other five IPPs
Source: Company/MOSL
Adani Power
1011 April 2011
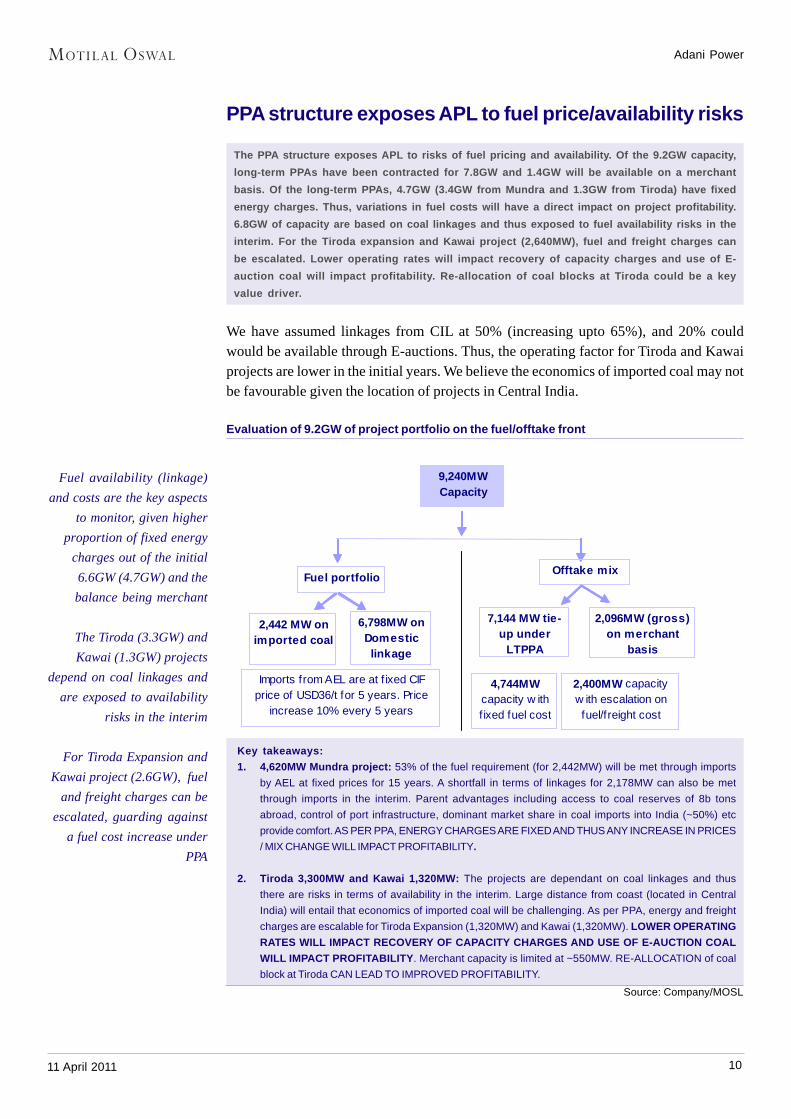
PPA structure exposes APL to fuel price/availability risks
The PPA structure exposes APL to risks of fuel pricing and availability. Of the 9.2GW capacity,
long-term PPAs have been contracted for 7.8GW and 1.4GW will be available on a merchant
basis. Of the long-term PPAs, 4.7GW (3.4GW from Mundra and 1.3GW from Tiroda) have fixed
energy charges. Thus, variations in fuel costs will have a direct impact on project profitability.
6.8GW of capacity are based on coal linkages and thus exposed to fuel availability risks in the
interim. For the Tiroda expansion and Kawai project (2,640MW), fuel and freight charges can
be escalated. Lower operating rates will impact recovery of capacity charges and use of E-
auction coal will impact profitability. Re-allocation of coal blocks at Tiroda could be a key
value driver.
We have assumed linkages from CIL at 50% (increasing upto 65%), and 20% couldwould be available through E-auctions. Thus, the operating factor for Tiroda and Kawaiprojects are lower in the initial years. We believe the economics of imported coal may notbe favourable given the location of projects in Central India.
Evaluation of 9.2GW of project portfolio on the fuel/offtake front
Fuel availability (linkage)
and costs are the key aspects
to monitor, given higher
proportion of fixed energy
charges out of the initial
6.6GW (4.7GW) and the
balance being merchant
The Tiroda (3.3GW) and
Kawai (1.3GW) projects
depend on coal linkages and
are exposed to availability
risks in the interim
For Tiroda Expansion and
Kawai project (2.6GW), fuel
and freight charges can be
escalated, guarding against
a fuel cost increase under
PPA
Source: Company/MOSL
9,240MW Capacity
Fuel portfolio
2,442 MW on imported coal
Offtake mix
6,798MW on Domestic linkage
Imports from AEL are at f ixed CIF price of USD36/t for 5 years. Price
increase 10% every 5 years
7,144 MW tie-up under
LTPPA
2,096MW (gross) on merchant
basis
2,400MW capacity w ith escalation on fuel/freight cost
4,744MW capacity w ith f ixed fuel cost
Key takeaways:
1. 4,620MW Mundra project: 53% of the fuel requirement (for 2,442MW) will be met through imports
by AEL at fixed prices for 15 years. A shortfall in terms of linkages for 2,178MW can also be met
through imports in the interim. Parent advantages including access to coal reserves of 8b tons
abroad, control of port infrastructure, dominant market share in coal imports into India (~50%) etc
provide comfort. AS PER PPA, ENERGY CHARGES ARE FIXED AND THUS ANY INCREASE IN PRICES
/ MIX CHANGE WILL IMPACT PROFITABILITY.
2. Tiroda 3,300MW and Kawai 1,320MW: The projects are dependant on coal linkages and thus
there are risks in terms of availability in the interim. Large distance from coast (located in Central
India) will entail that economics of imported coal will be challenging. As per PPA, energy and freight
charges are escalable for Tiroda Expansion (1,320MW) and Kawai (1,320MW). LOWER OPERATING
RATES WILL IMPACT RECOVERY OF CAPACITY CHARGES AND USE OF E-AUCTION COAL
WILL IMPACT PROFITABILITY. Merchant capacity is limited at ~550MW. RE-ALLOCATION of coal
block at Tiroda CAN LEAD TO IMPROVED PROFITABILITY.
Adani Power
1111 April 2011
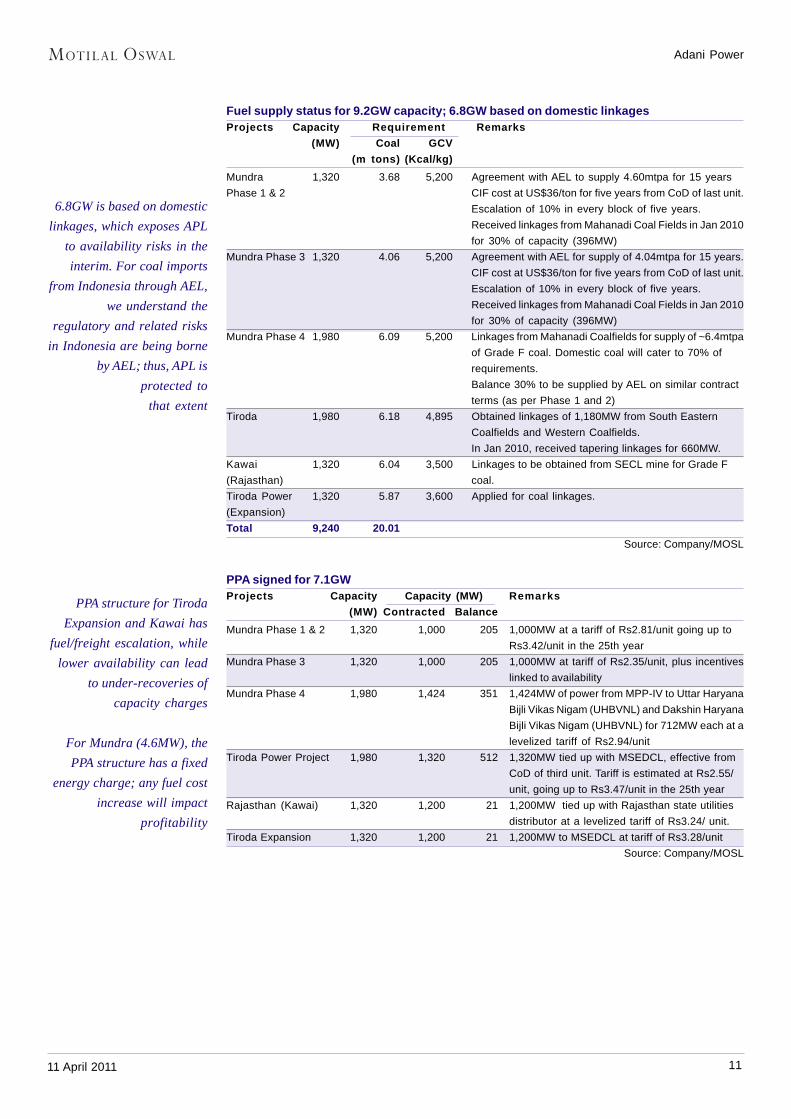
Fuel supply status for 9.2GW capacity; 6.8GW based on domestic linkagesProjects Capacity Requirement Remarks
(MW) Coal GCV
(m tons) (Kcal/kg)
Mundra 1,320 3.68 5,200 Agreement with AEL to supply 4.60mtpa for 15 years
Phase 1 & 2 CIF cost at US$36/ton for five years from CoD of last unit.
Escalation of 10% in every block of five years.
Received linkages from Mahanadi Coal Fields in Jan 2010
for 30% of capacity (396MW)
Mundra Phase 3 1,320 4.06 5,200 Agreement with AEL for supply of 4.04mtpa for 15 years.
CIF cost at US$36/ton for five years from CoD of last unit.
Escalation of 10% in every block of five years.
Received linkages from Mahanadi Coal Fields in Jan 2010
for 30% of capacity (396MW)
Mundra Phase 4 1,980 6.09 5,200 Linkages from Mahanadi Coalfields for supply of ~6.4mtpa
of Grade F coal. Domestic coal will cater to 70% of
requirements.
Balance 30% to be supplied by AEL on similar contract
terms (as per Phase 1 and 2)
Tiroda 1,980 6.18 4,895 Obtained linkages of 1,180MW from South Eastern
Coalfields and Western Coalfields.
In Jan 2010, received tapering linkages for 660MW.
Kawai 1,320 6.04 3,500 Linkages to be obtained from SECL mine for Grade F
(Rajasthan) coal.
Tiroda Power 1,320 5.87 3,600 Applied for coal linkages.
(Expansion)
Total 9,240 20.01
Source: Company/MOSL
PPA signed for 7.1GWProjects Capacity Capacity (MW) Remarks
(MW) Contracted Balance
Mundra Phase 1 & 2 1,320 1,000 205 1,000MW at a tariff of Rs2.81/unit going up to
Rs3.42/unit in the 25th year
Mundra Phase 3 1,320 1,000 205 1,000MW at tariff of Rs2.35/unit, plus incentives
linked to availability
Mundra Phase 4 1,980 1,424 351 1,424MW of power from MPP-IV to Uttar Haryana
Bijli Vikas Nigam (UHBVNL) and Dakshin Haryana
Bijli Vikas Nigam (UHBVNL) for 712MW each at a
levelized tariff of Rs2.94/unit
Tiroda Power Project 1,980 1,320 512 1,320MW tied up with MSEDCL, effective from
CoD of third unit. Tariff is estimated at Rs2.55/
unit, going up to Rs3.47/unit in the 25th year
Rajasthan (Kawai) 1,320 1,200 21 1,200MW tied up with Rajasthan state utilities
distributor at a levelized tariff of Rs3.24/ unit.
Tiroda Expansion 1,320 1,200 21 1,200MW to MSEDCL at tariff of Rs3.28/unit
Source: Company/MOSL
6.8GW is based on domestic
linkages, which exposes APL
to availability risks in the
interim. For coal imports
from Indonesia through AEL,
we understand the
regulatory and related risks
in Indonesia are being borne
by AEL; thus, APL is
protected to
that extent
PPA structure for Tiroda
Expansion and Kawai has
fuel/freight escalation, while
lower availability can lead
to under-recoveries of
capacity charges
For Mundra (4.6MW), the
PPA structure has a fixed
energy charge; any fuel cost
increase will impact
profitability
Adani Power
1211 April 2011
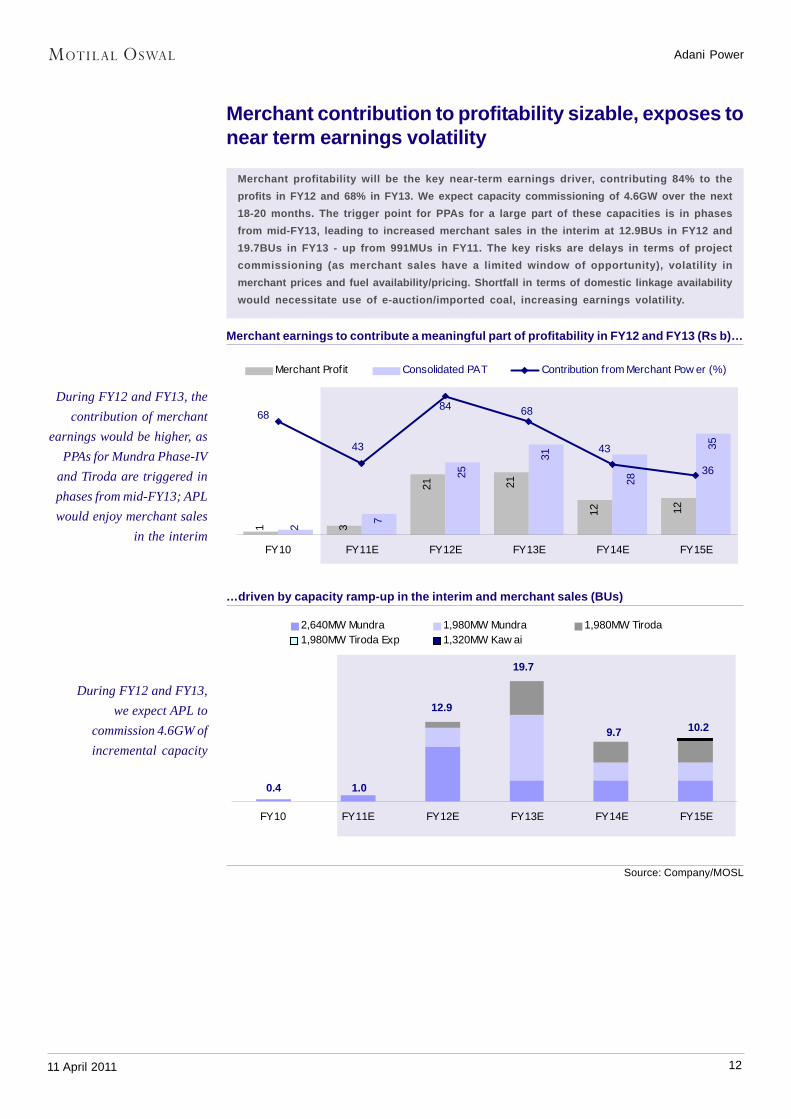
Merchant contribution to profitability sizable, exposes tonear term earnings volatility
Merchant profitability will be the key near-term earnings driver, contributing 84% to the
profits in FY12 and 68% in FY13. We expect capacity commissioning of 4.6GW over the next
18-20 months. The trigger point for PPAs for a large part of these capacities is in phases
from mid-FY13, leading to increased merchant sales in the interim at 12.9BUs in FY12 and
19.7BUs in FY13 - up from 991MUs in FY11. The key risks are delays in terms of project
commissioning (as merchant sales have a limited window of opportunity), volatility in
merchant prices and fuel availability/pricing. Shortfall in terms of domestic linkage availability
would necessitate use of e-auction/imported coal, increasing earnings volatility.
Merchant earnings to contribute a meaningful part of profitability in FY12 and FY13 (Rs b)…
During FY12 and FY13, the
contribution of merchant
earnings would be higher, as
PPAs for Mundra Phase-IV
and Tiroda are triggered in
phases from mid-FY13; APL
would enjoy merchant sales
in the interim
…driven by capacity ramp-up in the interim and merchant sales (BUs)
During FY12 and FY13,
we expect APL to
commission 4.6GW of
incremental capacity
1 3
21 21
12
2
7
25
31
35
12
28
36
43
6884
43
68
FY10 FY11E FY12E FY13E FY14E FY15E
Merchant Profit Consolidated PAT Contribution from Merchant Pow er (%)
Source: Company/MOSL
FY10 FY11E FY12E FY13E FY14E FY15E
2,640MW Mundra 1,980MW Mundra 1,980MW Tiroda1,980MW Tiroda Exp 1,320MW Kaw ai
0.4 1.0
12.9
19.7
9.7 10.2
Adani Power
1311 April 2011
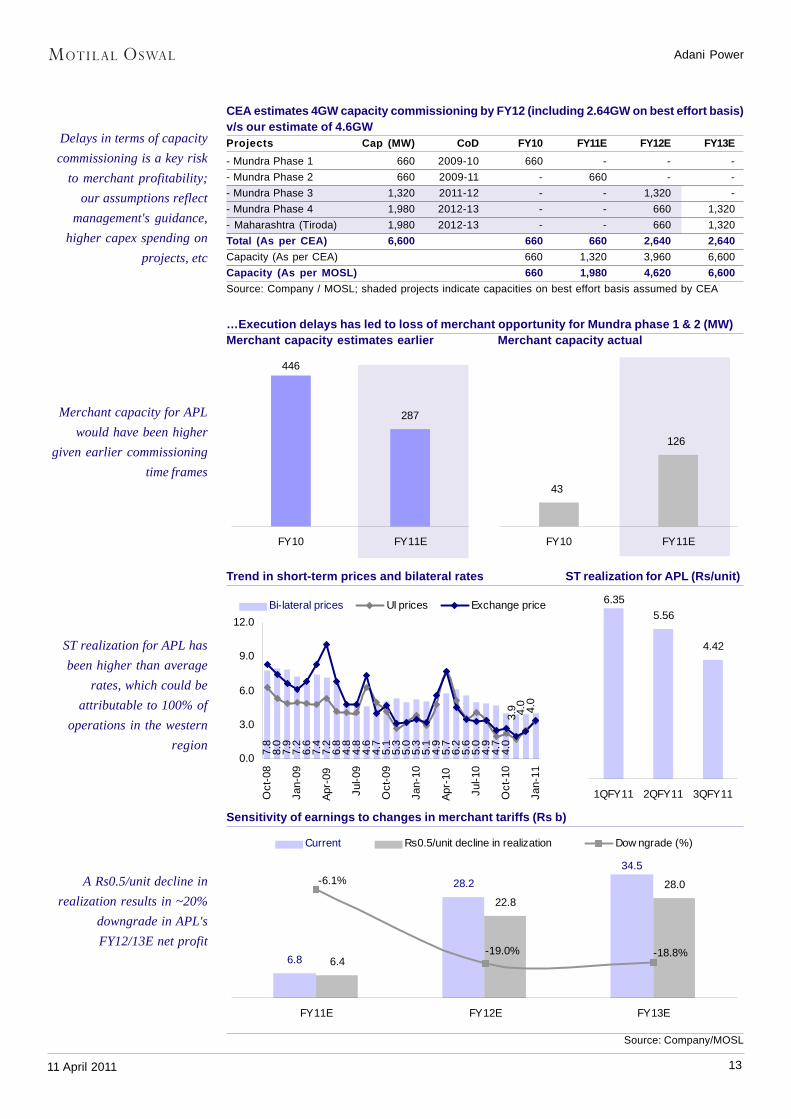
CEA estimates 4GW capacity commissioning by FY12 (including 2.64GW on best effort basis)v/s our estimate of 4.6GWProjects Cap (MW) CoD FY10 FY11E FY12E FY13E
- Mundra Phase 1 660 2009-10 660 - - -
- Mundra Phase 2 660 2009-11 - 660 - -
- Mundra Phase 3 1,320 2011-12 - - 1,320 -
- Mundra Phase 4 1,980 2012-13 - - 660 1,320
- Maharashtra (Tiroda) 1,980 2012-13 - - 660 1,320
Total (As per CEA) 6,600 660 660 2,640 2,640
Capacity (As per CEA) 660 1,320 3,960 6,600
Capacity (As per MOSL) 660 1,980 4,620 6,600
Source: Company / MOSL; shaded projects indicate capacities on best effort basis assumed by CEA
…Execution delays has led to loss of merchant opportunity for Mundra phase 1 & 2 (MW)Merchant capacity estimates earlier Merchant capacity actual
Delays in terms of capacity
commissioning is a key risk
to merchant profitability;
our assumptions reflect
management's guidance,
higher capex spending on
projects, etc
Merchant capacity for APL
would have been higher
given earlier commissioning
time frames
ST realization for APL has
been higher than average
rates, which could be
attributable to 100% of
operations in the western
region
446
287
FY10 FY11E
43
126
FY10 FY11E
6.35
5.56
4.42
1QFY11 2QFY11 3QFY11
7.8
8.0
7.9
7.2
6.6
7.4
7.2
6.8
4.8
4.8
4.6
4.7
5.1
5.3
5.0
5.3
5.1
4.9
5.7
6.2
5.6
5.0
4.9
4.7
4.0
4.0
4.0
3.9
0.0
3.0
6.0
9.0
12.0
Oct
-08
Jan-
09
Apr
-09
Jul-0
9
Oct
-09
Jan-
10
Apr
-10
Jul-1
0
Oct
-10
Jan-
11
Bi-lateral prices UI prices Exchange price
Sensitivity of earnings to changes in merchant tariffs (Rs b)
A Rs0.5/unit decline in
realization results in ~20%
downgrade in APL's
FY12/13E net profit6.8
28.2
6.4
22.8
28.0
34.5
-18.8%-19.0%
-6.1%
FY11E FY12E FY13E
Current Rs0.5/unit decline in realization Dow ngrade (%)
Trend in short-term prices and bilateral rates ST realization for APL (Rs/unit)
Source: Company/MOSL
Adani Power
1411 April 2011
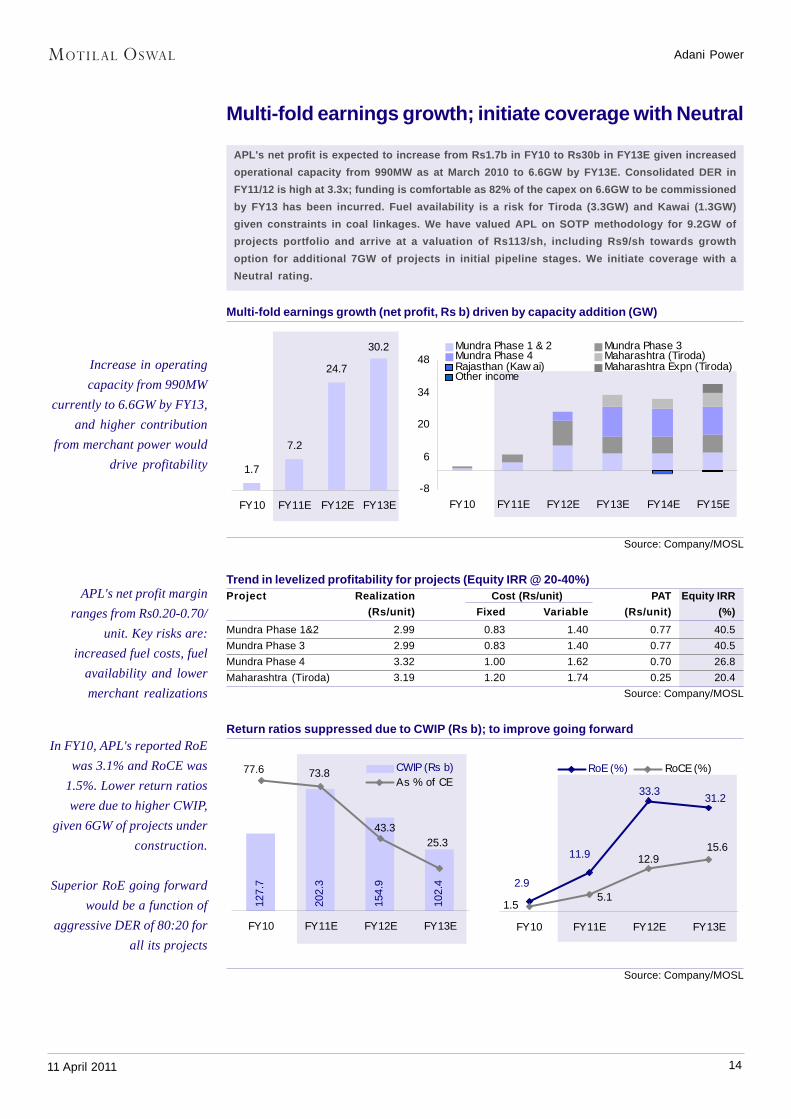
Multi-fold earnings growth; initiate coverage with Neutral
APL's net profit is expected to increase from Rs1.7b in FY10 to Rs30b in FY13E given increased
operational capacity from 990MW as at March 2010 to 6.6GW by FY13E. Consolidated DER in
FY11/12 is high at 3.3x; funding is comfortable as 82% of the capex on 6.6GW to be commissioned
by FY13 has been incurred. Fuel availability is a risk for Tiroda (3.3GW) and Kawai (1.3GW)
given constraints in coal linkages. We have valued APL on SOTP methodology for 9.2GW of
projects portfolio and arrive at a valuation of Rs113/sh, including Rs9/sh towards growth
option for additional 7GW of projects in initial pipeline stages. We initiate coverage with a
Neutral rating.
Multi-fold earnings growth (net profit, Rs b) driven by capacity addition (GW)
Increase in operating
capacity from 990MW
currently to 6.6GW by FY13,
and higher contribution
from merchant power would
drive profitability
Source: Company/MOSL
Trend in levelized profitability for projects (Equity IRR @ 20-40%)Project Realization Cost (Rs/unit) PAT Equity IRR
(Rs/unit) Fixed Variable (Rs/unit) (%)
Mundra Phase 1&2 2.99 0.83 1.40 0.77 40.5
Mundra Phase 3 2.99 0.83 1.40 0.77 40.5
Mundra Phase 4 3.32 1.00 1.62 0.70 26.8
Maharashtra (Tiroda) 3.19 1.20 1.74 0.25 20.4
Source: Company/MOSL
Return ratios suppressed due to CWIP (Rs b); to improve going forward
APL's net profit margin
ranges from Rs0.20-0.70/
unit. Key risks are:
increased fuel costs, fuel
availability and lower
merchant realizations
In FY10, APL's reported RoE
was 3.1% and RoCE was
1.5%. Lower return ratios
were due to higher CWIP,
given 6GW of projects under
construction.
Superior RoE going forward
would be a function of
aggressive DER of 80:20 for
all its projects
24.7
30.2
7.2
1.7
FY10 FY11E FY12E FY13E
-8
6
20
34
48
FY10 FY11E FY12E FY13E FY14E FY15E
Mundra Phase 1 & 2 Mundra Phase 3Mundra Phase 4 Maharashtra (Tiroda)Rajasthan (Kaw ai) Maharashtra Expn (Tiroda)Other income
127.
7
202.
3
154.
9
102.
4
43.3
73.8
25.3
77.6
FY10 FY11E FY12E FY13E
CWIP (Rs b)As % of CE
2.9
11.9
31.233.3
1.5
15.612.9
5.1
FY10 FY11E FY12E FY13E
RoE (%) RoCE (%)
Source: Company/MOSL
Adani Power
1511 April 2011
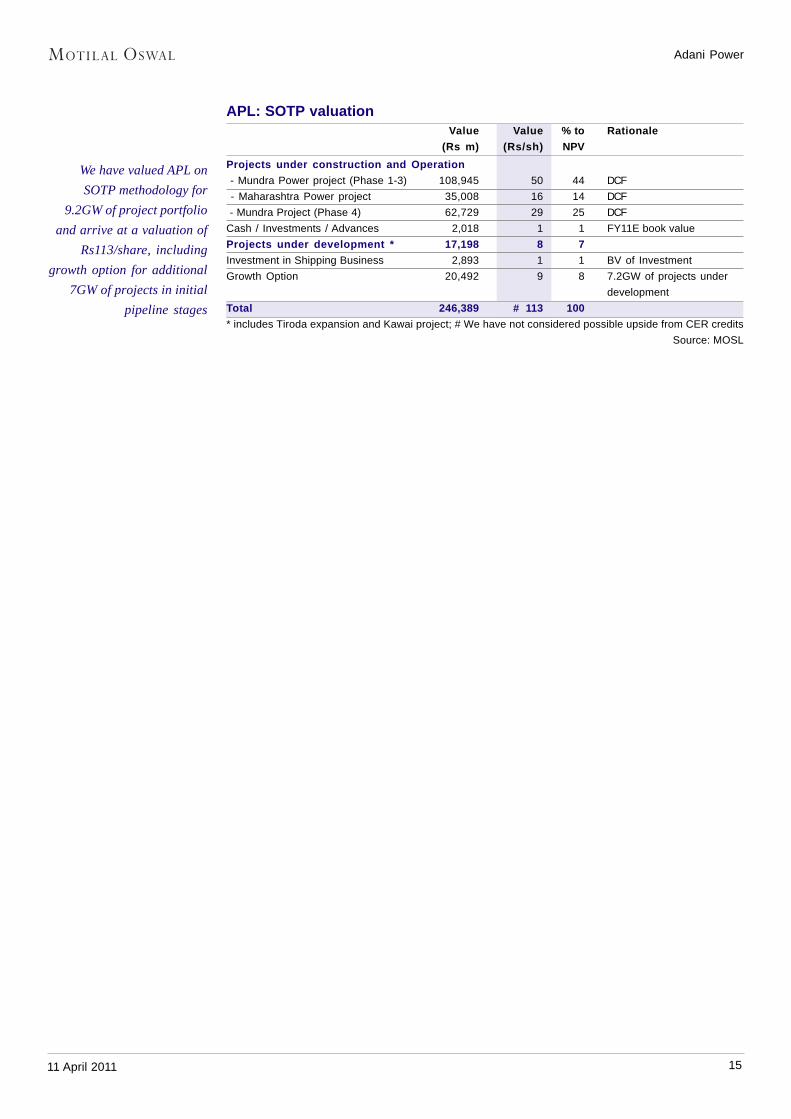
APL: SOTP valuationValue Value % to Rationale
(Rs m) (Rs/sh) NPV
Projects under construction and Operation
- Mundra Power project (Phase 1-3) 108,945 50 44 DCF
- Maharashtra Power project 35,008 16 14 DCF
- Mundra Project (Phase 4) 62,729 29 25 DCF
Cash / Investments / Advances 2,018 1 1 FY11E book value
Projects under development * 17,198 8 7
Investment in Shipping Business 2,893 1 1 BV of Investment
Growth Option 20,492 9 8 7.2GW of projects under
development
Total 246,389 # 113 100
* includes Tiroda expansion and Kawai project; # We have not considered possible upside from CER credits
Source: MOSL
We have valued APL on
SOTP methodology for
9.2GW of project portfolio
and arrive at a valuation of
Rs113/share, including
growth option for additional
7GW of projects in initial
pipeline stages
Adani Power
1611 April 2011
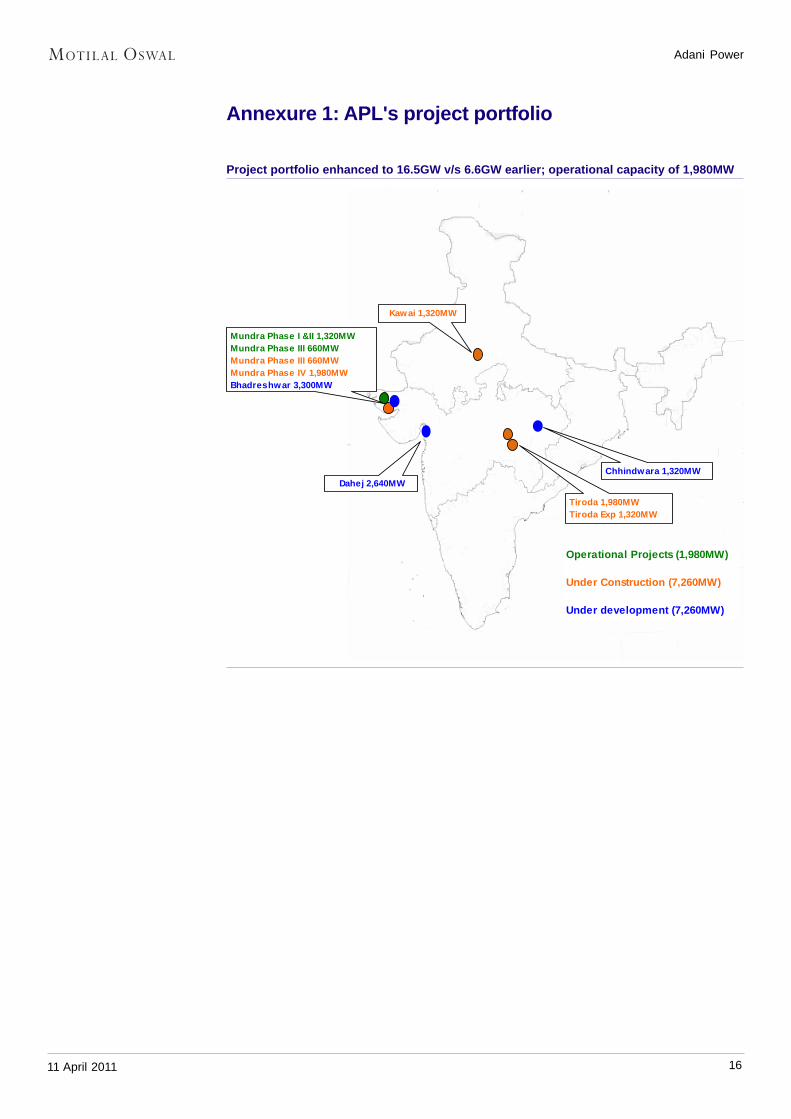
Annexure 1: APL's project portfolio
Project portfolio enhanced to 16.5GW v/s 6.6GW earlier; operational capacity of 1,980MW
Operational Projects (1,980MW)
Under Construction (7,260MW)
Under development (7,260MW)
Mundra Phase I &II 1,320MWMundra Phase III 660MWMundra Phase III 660MWMundra Phase IV 1,980MWBhadreshwar 3,300MW
Kawai 1,320MW
Dahej 2,640MW
Tiroda 1,980MWTiroda Exp 1,320MW
Chhindwara 1,320MW
Adani Power
1711 April 2011
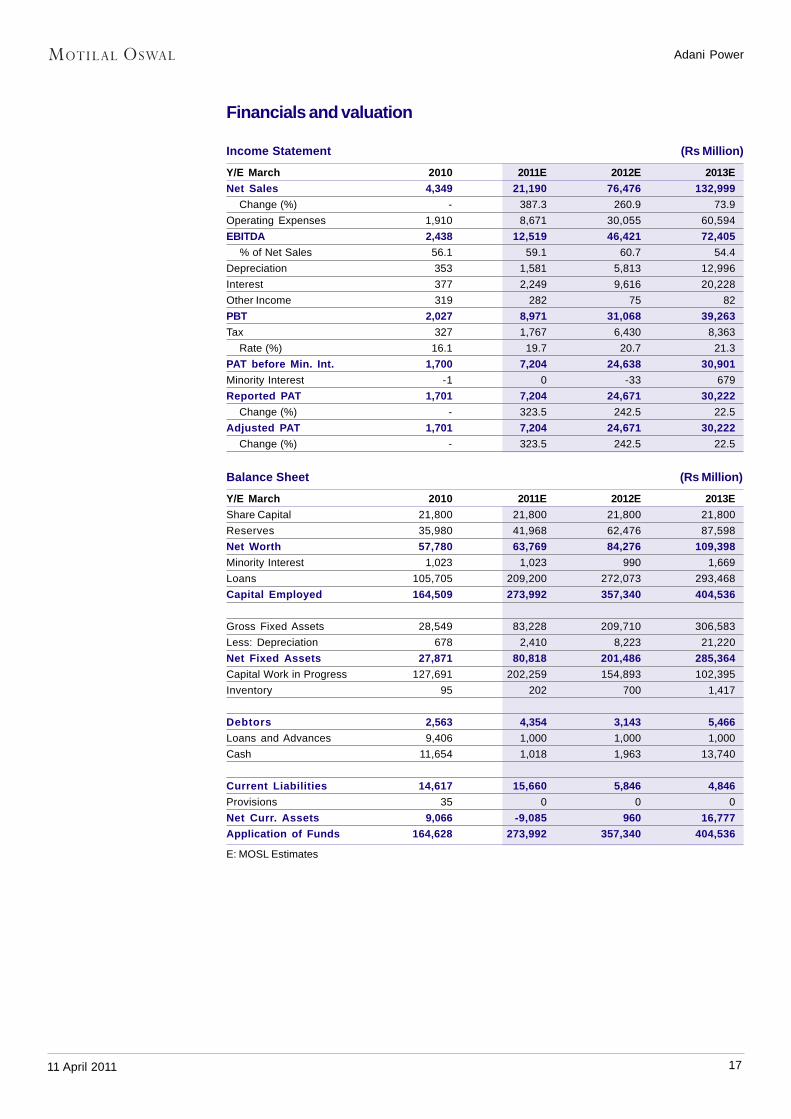
Financials and valuation
Income Statement (Rs Million)
Y/E March 2010 2011E 2012E 2013E
Net Sales 4,349 21,190 76,476 132,999
Change (%) - 387.3 260.9 73.9
Operating Expenses 1,910 8,671 30,055 60,594
EBITDA 2,438 12,519 46,421 72,405
% of Net Sales 56.1 59.1 60.7 54.4
Depreciation 353 1,581 5,813 12,996
Interest 377 2,249 9,616 20,228
Other Income 319 282 75 82
PBT 2,027 8,971 31,068 39,263
Tax 327 1,767 6,430 8,363
Rate (%) 16.1 19.7 20.7 21.3
PAT before Min. Int. 1,700 7,204 24,638 30,901
Minority Interest -1 0 -33 679
Reported PAT 1,701 7,204 24,671 30,222
Change (%) - 323.5 242.5 22.5
Adjusted PAT 1,701 7,204 24,671 30,222
Change (%) - 323.5 242.5 22.5
Balance Sheet (Rs Million)
Y/E March 2010 2011E 2012E 2013E
Share Capital 21,800 21,800 21,800 21,800
Reserves 35,980 41,968 62,476 87,598
Net Worth 57,780 63,769 84,276 109,398
Minority Interest 1,023 1,023 990 1,669
Loans 105,705 209,200 272,073 293,468
Capital Employed 164,509 273,992 357,340 404,536
Gross Fixed Assets 28,549 83,228 209,710 306,583
Less: Depreciation 678 2,410 8,223 21,220
Net Fixed Assets 27,871 80,818 201,486 285,364
Capital Work in Progress 127,691 202,259 154,893 102,395
Inventory 95 202 700 1,417
Debtors 2,563 4,354 3,143 5,466
Loans and Advances 9,406 1,000 1,000 1,000
Cash 11,654 1,018 1,963 13,740
Current Liabilities 14,617 15,660 5,846 4,846
Provisions 35 0 0 0
Net Curr. Assets 9,066 -9,085 960 16,777
Application of Funds 164,628 273,992 357,340 404,536
E: MOSL Estimates
Adani Power
1811 April 2011
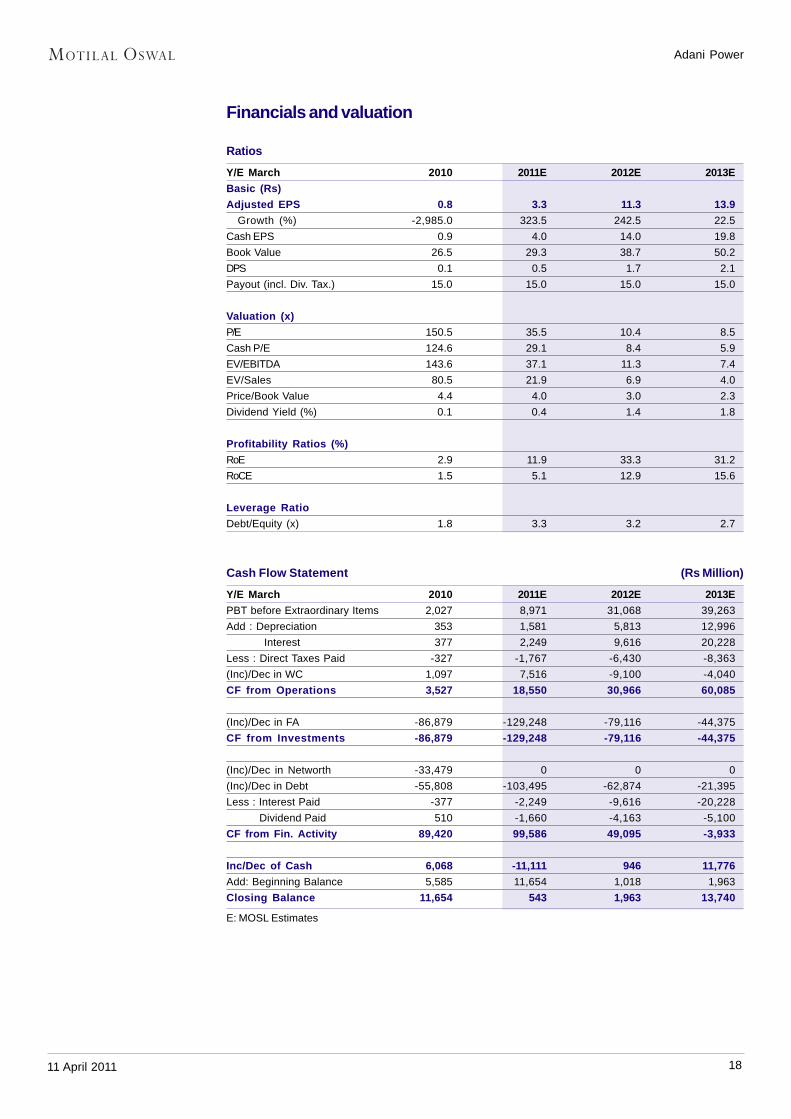
Financials and valuation
Ratios
Y/E March 2010 2011E 2012E 2013E
Basic (Rs)
Adjusted EPS 0.8 3.3 11.3 13.9
Growth (%) -2,985.0 323.5 242.5 22.5
Cash EPS 0.9 4.0 14.0 19.8
Book Value 26.5 29.3 38.7 50.2
DPS 0.1 0.5 1.7 2.1
Payout (incl. Div. Tax.) 15.0 15.0 15.0 15.0
Valuation (x)
P/E 150.5 35.5 10.4 8.5
Cash P/E 124.6 29.1 8.4 5.9
EV/EBITDA 143.6 37.1 11.3 7.4
EV/Sales 80.5 21.9 6.9 4.0
Price/Book Value 4.4 4.0 3.0 2.3
Dividend Yield (%) 0.1 0.4 1.4 1.8
Profitability Ratios (%)
RoE 2.9 11.9 33.3 31.2
RoCE 1.5 5.1 12.9 15.6
Leverage Ratio
Debt/Equity (x) 1.8 3.3 3.2 2.7
Cash Flow Statement (Rs Million)
Y/E March 2010 2011E 2012E 2013E
PBT before Extraordinary Items 2,027 8,971 31,068 39,263
Add : Depreciation 353 1,581 5,813 12,996
Interest 377 2,249 9,616 20,228
Less : Direct Taxes Paid -327 -1,767 -6,430 -8,363
(Inc)/Dec in WC 1,097 7,516 -9,100 -4,040
CF from Operations 3,527 18,550 30,966 60,085
(Inc)/Dec in FA -86,879 -129,248 -79,116 -44,375
CF from Investments -86,879 -129,248 -79,116 -44,375
(Inc)/Dec in Networth -33,479 0 0 0
(Inc)/Dec in Debt -55,808 -103,495 -62,874 -21,395
Less : Interest Paid -377 -2,249 -9,616 -20,228
Dividend Paid 510 -1,660 -4,163 -5,100
CF from Fin. Activity 89,420 99,586 49,095 -3,933
Inc/Dec of Cash 6,068 -11,111 946 11,776
Add: Beginning Balance 5,585 11,654 1,018 1,963
Closing Balance 11,654 543 1,963 13,740
E: MOSL Estimates
Adani Power
1911 April 2011
This report is for the personal information of the authorized recipient and does not construe to be any investment, legal or taxation advice to you. Motilal OswalSecurities Limited (hereinafter referred as MOSt) is not soliciting any action based upon it. This report is not for public distribution and has been furnished to you solelyfor your information and should not be reproduced or redistributed to any other person in any form.
The report is based upon information that we consider reliable, but we do not represent that it is accurate or complete, and it should not be relied upon such. MOSt orany of its affiliates or employees shall not be in any way responsible for any loss or damage that may arise to any person from any inadvertent error in theinformation contained in this report. MOSt or any of its affiliates or employees do not provide, at any time, any express or implied warranty of any kind, regardingany matter pertaining to this report, including without limitation the implied warranties of merchantability, fitness for a particular purpose, and non-infringement. Therecipients of this report should rely on their own investigations.
MOSt and/or its affiliates and/or employees may have interests/ positions, financial or otherwise in the securities mentioned in this report. To enhance transparency,MOSt has incorporated a Disclosure of Interest Statement in this document. This should, however, not be treated as endorsement of the views expressed in the report.
Disclosure of Interest Statement Adani Power1. Analyst ownership of the stock No2. Group/Directors ownership of the stock No3. Broking relationship with company covered No4. Investment Banking relationship with company covered No
This information is subject to change without any prior notice. MOSt reserves the right to make modifications and alternations to this statement as may be requiredfrom time to time. Nevertheless, MOSt is committed to providing independent and transparent recommendations to its clients, and would be happy to provideinformation in response to specific client queries.
For more copies or other information, contactInstitutional: Navin Agarwal. Retail: Manish Shah
Phone: (91-22) 39825500 Fax: (91-22) 22885038. E-mail: [email protected]
Motilal Oswal Securities Ltd, 3rd Floor, Hoechst House, Nariman Point, Mumbai 400 021

Motilal Oswal Company Gallery