Embed Size (px)
Citation preview
1
Inland-coastal bifurcation of southern East Asians revealed by
Hmong-Mien genomic history
Zi-Yang Xia1, Shi Yan
1, 2 ✉, Chuan-Chao Wang3, Hong-Xiang Zheng
1, Fan Zhang
4,
Yu-Chi Liu5, Ge Yu
1, Bin-Xia Yu
5, Li-Li Shu
5, Li Jin
1, 2, 6 ✉
1 Department of Anthropology and Human Genetics, School of Life Sciences, Fudan University, Shanghai, China.
2 Human Phenome Institute, Fudan University, Shanghai, China. 3 Department of Anthropology and Ethnology, Institute of Anthropology, Xiamen University, Xiamen, China. 4 School of Life Science, Jilin University, Chuangchun, Jilin, China. 5 Hunan Provincial Museum, Changsha, Hunan, China. 6 Chinese Academy of Sciences Key Laboratory of Computational Biology, CAS-MPG Partner Institute for
Computational Biology, SIBS, CAS, Shanghai, China.
✉ Corresponding Authors: Shi Yan ([email protected]), Li Jin ([email protected]).
ABSTRACT
The early history of the Hmong-Mien language family and its speakers is elusive. A good
variety of Hmong-Mien-speaking groups distribute in Central China. Here, we report 903
high-resolution Y-chromosomal, 624 full-sequencing mitochondrial, and 415 autosomal
samples from 20 populations in Central China, mainly Húnán Province. We identify an
autosomal component which is commonly seen in all the Hmong-Mien-speaking populations,
with nearly unmixed composition in Pahng. In contrast, Hmong and Mien respectively
demonstrate additional genomic affinity to Tibeto-Burman and Kra-Dai speakers. We also
discover two prevalent uniparental lineages of Hmong-Mien speakers. Y-chromosomal
haplogroup O2a2a1b1a1b-N5 diverged ~2,330 years before present (BP), approximately
coinciding with the estimated time of Proto-Hmong-Mien (~2,500 BP), whereas mitochondrial
haplogroup B5a1c1a significantly correlates with Pahng and Mien. All the evidence indicates a
founding population substantially contributing to present-day Hmong-Mien speakers.
Consistent with the two distinct routes of agricultural expansion from southern China, this
Hmong-Mien founding ancestry is phylogenetically closer to the founding ancestry of Neolithic
Mainland Southeast Asians and present-day isolated Austroasiatic-speaking populations than
Austronesians. The spatial and temporal distribution of the southern East Asian lineage is also
compatible with the scenario of out-of-southern-China farming dispersal. Thus, our finding
reveals an inland-coastal genetic discrepancy related to the farming pioneers in southern China
and supports an inland southern China origin of an ancestral meta-population contributing to
both Hmong-Mien and Austroasiatic speakers.
.CC-BY-NC-ND 4.0 International licenseavailable under anot certified by peer review) is the author/funder, who has granted bioRxiv a license to display the preprint in perpetuity. It is made
The copyright holder for this preprint (which wasthis version posted August 9, 2019. ; https://doi.org/10.1101/730903doi: bioRxiv preprint
2
INTRODUCTION
Starting ~9,000 years before present (BP), China is the second earliest birthplace of agriculture,
following the Near East1,2
. Subsequently, farming dispersed into adjacent areas of East Asia,
especially Southeast Asia, the Korean Peninsula, and the Japanese archipelago. However, it is still
not fully settled whether and to what extent human migration propelled the dispersal of agriculture.
Particularly for Southeast Asia, recent archaeogenetic studies support that the East Asian ancestry of
the first farmers in Southeast Asia can be traced to southern China3,4
, raising the further issue on the
deeper demographic prehistory of both regions.
The movement of farming populations has also been presumed to facilitate the expansion of
their languages5. Seven major language families in East Asia are involved in this hypothesis:
Austroasiatic, Austronesian, Hmong-Mien, Japonic, Kra-Dai (formerly known as Tai-Kadai),
Koreanic, and Sino-Tibetan6. Compared with the others, the Hmong-Mien language family lacked
writing system until the recent centuries, hence its notably obscure history, and most of the history
was conserved either by oral legends, or literature documented in Chinese, which often confused
different populations. Therefore, linguistic and genetic studies are crucial to the reconstruction of the
Hmong-Mien prehistory. Some linguists have attempted to connect Hmong-Mien with other
language families genealogically, but none of the hypotheses are widely accepted7. Likewise, in
contrast to previous studies based on mitochondrial8 or Y-chromosomal
9 data, there has been no
genome-wide studies concentrating on Hmong-Mien-speaking populations up to date.
Currently, Hmong-Mien speakers mainly dwell in South Central and Southwest China, with
sporadic distribution in Mainland Southeast Asia (MSEA) due to the migration within the recent
centuries7. The linguistic phylogeny of the Hmong-Mien languages remains controversial, while a
common hypothesis categorizes them into two sub-branches: Hmongic and Mienic. Whereas the
Hmongic languages receive more influence from Tibeto-Burman languages, the Mienic languages
show more impact from Chinese. In Húnán Province of Central China, both clades distribute,
including two Hmongic languages: Hmong (to be specific, Qo Xiong) in the northwest Húnán and
Pahng (Hm Nai) in the southwest, as well as a Mienic language (Mien, or specifically, Iu Mien) in
the southeast. Along with a high variety of other Sino-Tibetan- and Kra-Dai-speaking groups (Fig.
1B), especially Sinitic Tǔhuà and Wǎxiāng (known for its retentions of Old Chinese10
), Tǔjiā of
Tibeto-Burman, and Kam of Kam-Sui, Central China is an appropriate field to depict a fine-scale
genetic landscape of Hmong-Mien speakers with neighboring populations.
RESULTS
To comprehensively represent the genetic diversity of Central China, we sampled and genotyped 903
high-resolution Y-chromosomal samples, 624 full-sequencing mitochondrial samples, and 415
autosomal samples from Central China, mainly in Húnán Province, covering all the 11 officially
recognized ethnic groups of this region (Fig. 1). Given the criteria of both the officially recognized
ethnicity and linguistic affiliation, we subdivided these groups into 20 populations. We then analyzed
our data along with genetic data of ancient and modern populations from published studies (see
Method).
.CC-BY-NC-ND 4.0 International licenseavailable under anot certified by peer review) is the author/funder, who has granted bioRxiv a license to display the preprint in perpetuity. It is made
The copyright holder for this preprint (which wasthis version posted August 9, 2019. ; https://doi.org/10.1101/730903doi: bioRxiv preprint
3
Genetic structure of Húnán Province
The pattern of principal component analysis (PCA) of East-Asia-wide populations11
(Fig. 2B) shows
that at least three meta-populations contribute to the genomic diversity of populations in Húnán: one
represented by northern East Asians [Northern Hàn, Mongolic and Tungusic speakers, Japanese,
Korean, Tibeto-Burmans (except Lāhù and Burmese), and the Devil’s Cave sample (referred as
“Devil’s Cave” for short below)12
; right], one by southeast Asians [Austronesians, Austroasiatic and
Kra-Dai speakers, and a Neolithic Laotian individual (labelled as “Laos_LN_BA”)3; left], and one by
Hmong-Mien-speaking Hmong and Pahng (top). Compared with other Kra-Dai- (Dǎi and Thai) and
Tibeto-Burman-speaking (Tibetan, Sherpa, Nàxī, and Yí) populations, Kam and Tǔjiā in Húnán shift
towards Hmong and Pahng, suggesting an additional genomic impact on them from Hmong-Mien
speakers, or/and gene flow between Kam and Tǔjiā. Including subpopulations of Hàn in Húnán (Gàn,
Xiāng, Hakka, and Southwest Mandarin), Southern Hàn clusters between northern East Asians and
Southeast Asians, consistent with the “Yellow/Yangtze River Ghost Population” theory and the
inference that Hàn Chinese is the admixture of both proposed populations13
.
To present a finer-scale genomic structure within this region, we performed PCA11
(Fig. 2A)
and model-based clustering14
(K = 3, Fig. 2C) exclusively for populations in Húnán. We observe that
the genomic structure is highly associated with the linguistic affiliation of populations. Northern
Tǔjiā, Kam, and Pahng construct three extremes in the PCA of populations in Húnán (top, bottom,
and right, respectively, Fig. 2A), matching their highest proportion of ancestral components
respectively related to Sino-Tibetan, Kra-Dai, and Hmong-Mien in ADMIXTURE plot (green, red,
and blue, respectively, Fig. 2C). Gàn, Xiāng, and Hakka are modeled with nearly equivalent
proportion of Sino-Tibetan- and Kra-Dai-related ancestral components (Fig. 2C) and cluster with
each other in the PCA plot (Fig. 2A) with non-positive pairwise FST to each other (all < 0.000,
Extended Data Fig. 1), indicating that intermarriage among main subpopulations of Hàn is not
significantly fewer than marriage within a subpopulation. On the contrary, Wǎxiāng and Tǔhuà
significantly deviate from the main subpopulations of Hàn and cluster with Tǔjiā and Kam in PCA
(Fig. 2A) and TreeMix15
(Fig. 3A) plot and harbor additional Sino-Tibetan- and Kra-Dai-related
components in PCA plot (Fig. 2C), respectively, consistent with the particularity of their languages
distinct from other Sinitic ones.
Focusing on the genomic relationship among Hmong-Mien speakers, we find that Pahng,
Hmong, and Mien cluster together in the TreeMix plot for populations in Húnán (Fig. 3A). In
ADMIXTURE plot (Fig. 2C), Pahng is modeled with a nearly unmixed form of Hmong-Mien-related
component, consistent with the results of admixture f3-statistics (Table 1) and pairwise FST (Extended
Data Fig. 1). The significant positive values of all the f3(Pahng; Hmong, Other Central Chinese)16
(all
Z > 14.7) support that Pahng has not received substantial gene flow from non-Hmong-Mien-speaking
populations and shows that Pahng has undergone a strong and unique genetic drift. Supporting the
latter inference, all the pairs of FST between Pahng and other populations (all ≥ 0.018) are higher than
the ones among other population themselves (all ≤ 0.017). The analyses above confirm that Pahng
represents a Hmong-Mien-sharing ancestry that is absent, or at least with fewer amounts, in
non-Hmong-Mien populations. Corresponding to the intermediate position between Pahng and Tǔjiā
.CC-BY-NC-ND 4.0 International licenseavailable under anot certified by peer review) is the author/funder, who has granted bioRxiv a license to display the preprint in perpetuity. It is made
The copyright holder for this preprint (which wasthis version posted August 9, 2019. ; https://doi.org/10.1101/730903doi: bioRxiv preprint
4
in the PCA plot (Fig. 2A) and a substantial contribution of Sino-Tibetan-related component in
ADMIXTURE plot (Fig. 2C), we find an additional migration to Hmong from Tibeto-Burman source
modeled by TreeMix (Nàxī and Yí, Fig. 3B), supporting an additional genomic affinity of Hmong to
Tibeto-Burman speakers. Meanwhile, Mien approximately clusters with Kam in the PCA plot (Fig.
2A), confirming that Mien carries both Hmong-Mien-related and Kra-Dai-related ancestries. Other
than Hmong-Mien-speaking populations, Southern Tǔjiā is the only one who harbors significant
Hmong-Mien-related ancestral component (Fig. 2C), which is explainable due to its geographic
proximity to Hmong and possible intermarriage (Fig 1A). Key findings of admixture f3-statistics of
populations in Húnán (Table 1) are compatible with the inference above. Given that some Sinitic
populations, especially Tǔhuà, also have a substantial Kra-Dai-related ancestry, we suggest that the
dispersal and subsequent admixture associated with Hmong-Mien-related ancestry are highly parallel
to the dissemination and language contact of different Hmong-Mien languages.
We then identify a series of motif Y-chromosomal lineages reflecting the demographic history
(Fig. 4A and Extended Data Fig. 2A). Fitting their common linguistic affiliations, Hmong and Pahng
share the patrilineage O2a2a1b1a1b-N5 (included in O2a2a1b-M7) with the second-highest (18/95 =
18.9%) and the highest frequency (7/21 = 33.3%), respectively. This patrilineage is also present in
Shē17
, a population in southeastern China who once spoke Hmong-Mien. The highest frequency
patrilineage for Hmong, O1b1a1a2a-F5506 (23/95 = 24.2%, included in O1b1a-PK4), is also
exclusive for Hmong. Three dominant patrilineages for Hàn Chinese18
, Oα-F5, Oβ-F46, and Oγ-F11
(respectively included in O2a2b1a1-M117, O2a2b1*-M134(xM117), and O2a1b-IMS-JST002611),
have a considerable proportion (57/463 = 12.3%, 44/463 = 9.5%, 58/463 = 12.5%, respectively)
within main subpopulations of Hàn in Húnán, partly supporting a demic diffusion of Sinitic
languages in this region. Compared with that, Wǎxiāng and Tǔhuà respectively have a noticeable
frequency of Y-haplogroup N2a1-F1833 (6/39 = 15.4%, included in N-M231) and D1a2-F1531 (3/17
= 17.6%, included in D1a-M15), following their special linguistic and autosomal history. Intriguingly,
Tǔjiā and Kam share Y-haplogroup Cα2a1-F5477 (included in C2a-F1067) with a high frequency
(24/90 = 26.7% and 13/71 = 18.3%, respectively), despite their different linguistic affiliations,
supporting a history of gene flow between both on the paternal side. In contrast, mitochondrial
haplogroups present a uniform distribution among populations (Fig. 4B and Extended Data Fig. 2B),
indicating the practice of exogamy on the maternal side. The very exceptions are Pahng and Mien,
both Hmong-Mien-speaking, with the significant correlation with mitochondrial haplogroup B5 (χ2 =
1.03×10⁻¹¹
and 1.73×10⁻⁵
, respectively, whereas Bonferroni corrected p = 2.3×10⁻⁴
).
We also performed coalescent time estimation (see Method) to calibrate the separation of some
uniparentally inherited lineages (Fig. 5). Approximately synchronous with the time estimation of
Proto-Hmong-Mien (~2,500 BP)19
, we estimate the most recent common ancestor (TMRCA) of
O2a2a1b1a1b-N5 as ~2,330 BP (Fig. 5B), consistent with slight precedence of the divergence of
patrilineage than the dispersal of language and ancestral population. By phylogenetic analysis (Fig.
5A), most of the Pahng (with one exception) and Mien (with two exceptions) samples affiliated to
mitochondrial haplogroup B5 are identified as the subclade B5a1c1a (TMRCA in ~9,800 BP). Given
the substantially higher frequency of Hmong-Mien speakers (63.6%, 21 out of 33) than the others in
.CC-BY-NC-ND 4.0 International licenseavailable under anot certified by peer review) is the author/funder, who has granted bioRxiv a license to display the preprint in perpetuity. It is made
The copyright holder for this preprint (which wasthis version posted August 9, 2019. ; https://doi.org/10.1101/730903doi: bioRxiv preprint
5
B5a1c1a, we propose a Hmong-Mien origin of this subclade.
In summary, we find strong evidence from genomic and uniparental analyses for a founding
population who is responsible for the dispersal of Proto-Hmong-Mien and thus has a substantial
genetic impact on present-day Hmong-Mien speakers, hence naming it as “Ancestral Hmong-Mien”
(AHM).
Inland-coastal bifurcation of southern East Asians
One of the core issues regarding the history of the Hmong-Mien language family is its place of origin.
Whereas linguistic evidence, such as the reconstructed vocabulary related to wet-rice cultivation,
supports a Yangtze Basin origin of Hmong-Mien7, archaeological record reveals a quite more
complex scenario. During the Neolithic, there were two independent agricultural centers in southern
China: Yangtze Delta and the middle Yangtze1,20
(here we definite the northern boundary of
“southern China” as Qín Mountains and Huái River). The former partly explains the coastal route for
farming expansion as far as Taiwan and Luzon, while the latter accounts for another inland
expansion of agriculture into Southwest China and MSEA21
. In particular, there is a strong bond
between the material culture of Neolithic Yangtze Delta and later Austronesian Pacific islands
previously described22
. Nevertheless, it is still ambiguous about the relationship between
Proto-Hmong-Mien and these agricultural centers. Therefore, to determine the genomic relationship
between AHM and other populations is pivotal to the resolution of the issue.
Besides AHM, previous genetic studies have already distinguished two other ancestral
populations highly associated with the farming dispersal from southern China3,4,23
. One of them is
represented by the East Asian ancestry of Neolithic farmers in MSEA, as well as present-day isolated
Austroasiatic-speaking groups (e.g., Htin and Mlabri), who largely maintain genetic continuity with
the former4, hence responsible for Austroasiatic expansion and named as “Ancestral Austroasiatic”
(AAA). The other is represented by Austronesian-speakers in Taiwan (e.g., Amis and Atayal) in
nearly unmixed form23
and accounts for the dissemination of Austronesian languages, hence
addressed as “Ancestral Austronesian” (AAN).
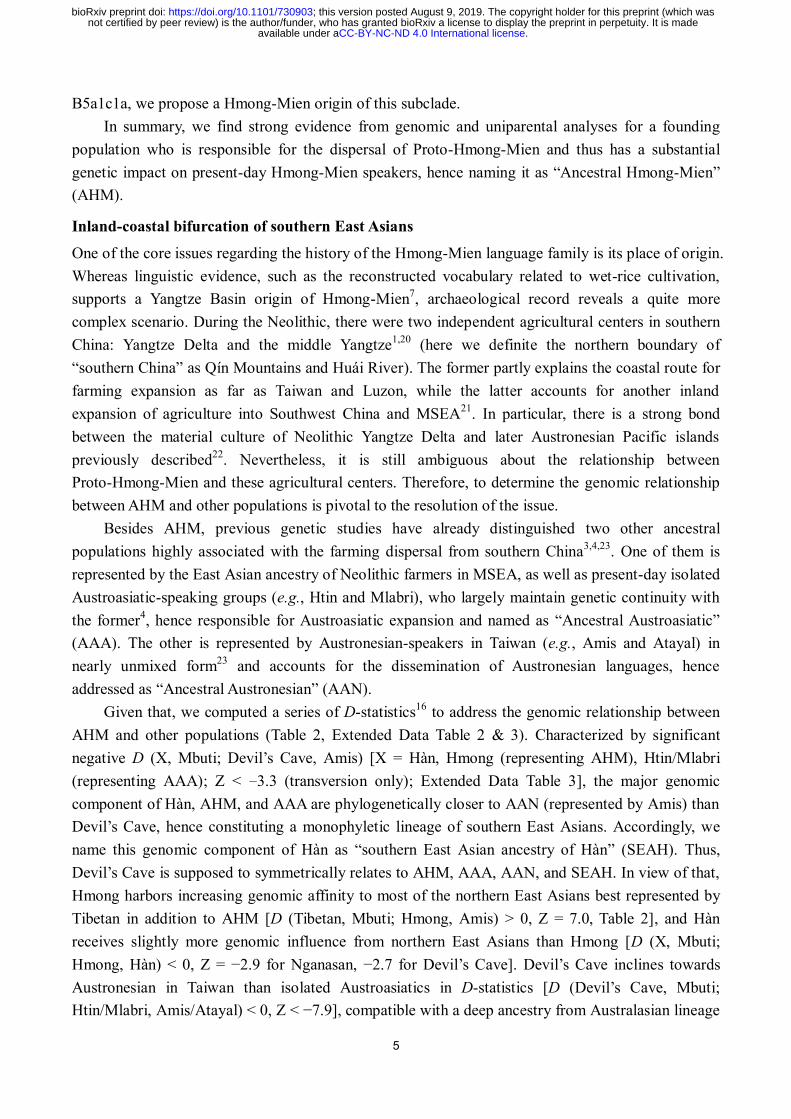
Given that, we computed a series of D-statistics16
to address the genomic relationship between
AHM and other populations (Table 2, Extended Data Table 2 & 3). Characterized by significant
negative D (X, Mbuti; Devil’s Cave, Amis) [X = Hàn, Hmong (representing AHM), Htin/Mlabri
(representing AAA); Z < −3.3 (transversion only); Extended Data Table 3], the major genomic
component of Hàn, AHM, and AAA are phylogenetically closer to AAN (represented by Amis) than
Devil’s Cave, hence constituting a monophyletic lineage of southern East Asians. Accordingly, we
name this genomic component of Hàn as “southern East Asian ancestry of Hàn” (SEAH). Thus,
Devil’s Cave is supposed to symmetrically relates to AHM, AAA, AAN, and SEAH. In view of that,
Hmong harbors increasing genomic affinity to most of the northern East Asians best represented by
Tibetan in addition to AHM [D (Tibetan, Mbuti; Hmong, Amis) > 0, Z = 7.0, Table 2], and Hàn
receives slightly more genomic influence from northern East Asians than Hmong [D (X, Mbuti;
Hmong, Hàn) < 0, Z = −2.9 for Nganasan, −2.7 for Devil’s Cave]. Devil’s Cave inclines towards
Austronesian in Taiwan than isolated Austroasiatics in D-statistics [D (Devil’s Cave, Mbuti;
Htin/Mlabri, Amis/Atayal) < 0, Z < −7.9], compatible with a deep ancestry from Australasian lineage
.CC-BY-NC-ND 4.0 International licenseavailable under anot certified by peer review) is the author/funder, who has granted bioRxiv a license to display the preprint in perpetuity. It is made
The copyright holder for this preprint (which wasthis version posted August 9, 2019. ; https://doi.org/10.1101/730903doi: bioRxiv preprint
6
harbored by isolated Austroasiatics as previously proposed4.
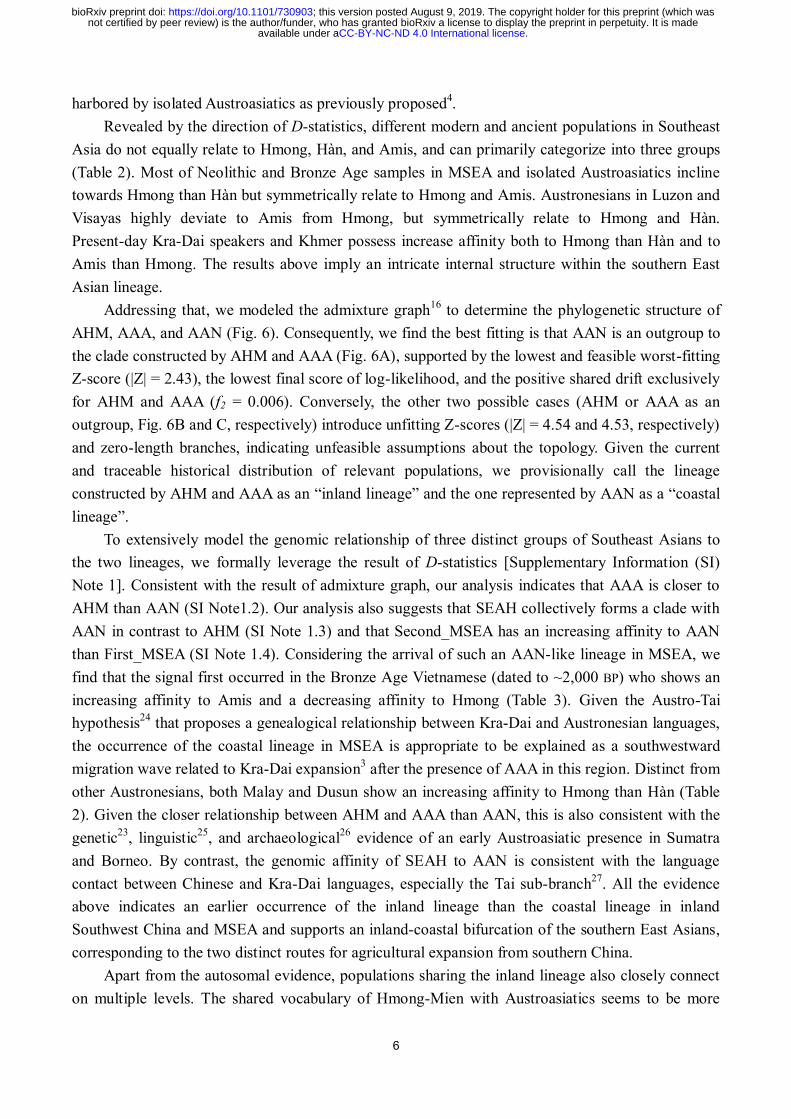
Revealed by the direction of D-statistics, different modern and ancient populations in Southeast
Asia do not equally relate to Hmong, Hàn, and Amis, and can primarily categorize into three groups
(Table 2). Most of Neolithic and Bronze Age samples in MSEA and isolated Austroasiatics incline
towards Hmong than Hàn but symmetrically relate to Hmong and Amis. Austronesians in Luzon and
Visayas highly deviate to Amis from Hmong, but symmetrically relate to Hmong and Hàn.
Present-day Kra-Dai speakers and Khmer possess increase affinity both to Hmong than Hàn and to
Amis than Hmong. The results above imply an intricate internal structure within the southern East
Asian lineage.
Addressing that, we modeled the admixture graph16
to determine the phylogenetic structure of
AHM, AAA, and AAN (Fig. 6). Consequently, we find the best fitting is that AAN is an outgroup to
the clade constructed by AHM and AAA (Fig. 6A), supported by the lowest and feasible worst-fitting
Z-score (|Z| = 2.43), the lowest final score of log-likelihood, and the positive shared drift exclusively
for AHM and AAA (f2 = 0.006). Conversely, the other two possible cases (AHM or AAA as an
outgroup, Fig. 6B and C, respectively) introduce unfitting Z-scores (|Z| = 4.54 and 4.53, respectively)
and zero-length branches, indicating unfeasible assumptions about the topology. Given the current
and traceable historical distribution of relevant populations, we provisionally call the lineage
constructed by AHM and AAA as an “inland lineage” and the one represented by AAN as a “coastal
lineage”.
To extensively model the genomic relationship of three distinct groups of Southeast Asians to
the two lineages, we formally leverage the result of D-statistics [Supplementary Information (SI)
Note 1]. Consistent with the result of admixture graph, our analysis indicates that AAA is closer to
AHM than AAN (SI Note1.2). Our analysis also suggests that SEAH collectively forms a clade with
AAN in contrast to AHM (SI Note 1.3) and that Second_MSEA has an increasing affinity to AAN
than First_MSEA (SI Note 1.4). Considering the arrival of such an AAN-like lineage in MSEA, we
find that the signal first occurred in the Bronze Age Vietnamese (dated to ~2,000 BP) who shows an
increasing affinity to Amis and a decreasing affinity to Hmong (Table 3). Given the Austro-Tai
hypothesis24
that proposes a genealogical relationship between Kra-Dai and Austronesian languages,
the occurrence of the coastal lineage in MSEA is appropriate to be explained as a southwestward
migration wave related to Kra-Dai expansion3 after the presence of AAA in this region. Distinct from
other Austronesians, both Malay and Dusun show an increasing affinity to Hmong than Hàn (Table
2). Given the closer relationship between AHM and AAA than AAN, this is also consistent with the
genetic23
, linguistic25
, and archaeological26
evidence of an early Austroasiatic presence in Sumatra
and Borneo. By contrast, the genomic affinity of SEAH to AAN is consistent with the language
contact between Chinese and Kra-Dai languages, especially the Tai sub-branch27
. All the evidence
above indicates an earlier occurrence of the inland lineage than the coastal lineage in inland
Southwest China and MSEA and supports an inland-coastal bifurcation of the southern East Asians,
corresponding to the two distinct routes for agricultural expansion from southern China.
Apart from the autosomal evidence, populations sharing the inland lineage also closely connect
on multiple levels. The shared vocabulary of Hmong-Mien with Austroasiatics seems to be more
.CC-BY-NC-ND 4.0 International licenseavailable under anot certified by peer review) is the author/funder, who has granted bioRxiv a license to display the preprint in perpetuity. It is made
The copyright holder for this preprint (which wasthis version posted August 9, 2019. ; https://doi.org/10.1101/730903doi: bioRxiv preprint
7
fundamental than one with other neighboring language families7,28
, implying an arguably common
history in an earlier stage. Regarding uniparental lineages, Hmong-Mien speakers and Austroasiatics
(or Neolithic farmers in MSEA) also share a series of Y-chromosomal and mitochondrial motif
haplogroups, such as Y-haplogroup O1b1a1-M95 [O1b1a1a2a-F5506 for Hmong; O1b1a1b-F789 for
Malaysia_LN, Laos_LN_BA3, and various present-day Austroasiatic-speaking populations
29] and
O2a2a1b1-M209 [O2a2a1b1a1b-N5 for Hmong-Mien speakers; O2a2a1b1a1*-F2309(xM113, xN5)
for Kinh17
; compared with O2a2a1b2-F5511 for Amis17
], and mitochondrial haplogroup B5a1
[B5a1c1a for Hmong-Mien speakers; B5a1a for Vietnam_N and Thailand_LN_IA4; B5a1c for
Thailand_LN_IA4]. Especially for O2a2a1b-M7 (Fig. 5B), the divergence time of O2a2a1b-M7
[~14,710 BP, TMRCA for O2a2a1b1a1-F2309 (lineage shared by Hmong-Mien and Austroasiatic
speakers) and O2a2a1b2-F5511 (Amis-related lineage)] is significantly older than the divergence
time of O2a2a1b1a1-F2309 (11,460 BP), consistent with the closer relationship of AHM and AAA
than AAN. Besides, the divergence time for O2a2a1b1a1-F2309 and O1b1a1-M95 (~11,660 BP) and
rapid diversification [O1b1a1a-F1252, ~11,170 BP; O1b1a1a1-F2924, ~10,080 BP] for subgroups of
the latter (Extended Data Fig. 4) may approximately synchronize with the dawn of Neolithic
revolution in inland southern China (~9,000 BP2,21
).
Diffusion of the southern East Asian lineage
Neolithic agriculture in Yangtze Basin is famous for its earliest domestication of sinica/japonica rice
(Oryza japonica), which later spread into the vast tract of land ranging from Japan to Madagascar1,30
.
To test whether the agricultural diffusion from southern China is concomitant with the emigration
from the same region, we used the qpAdm31
to model the spatial and temporal distribution of the
southern East Asian lineage, comprising both the inland (i.e., AHM and AAA) and coastal (i.e., AAN)
lineages (Fig. 7 & Extended Data Table 4).
We started from the two-way model of Amis (representing the southern East Asian lineage) and
Devil’s Cave (representing the northern East Asian lineage), adding additional reference populations
(Hòabìnhian, Afanasievo, Namazga, and Kolyma) when the initial model fails (see Method). In
addition to MSEA populations (9.5–30.0%)3,4
, South Asia32,33
(Kharia, 61.6 ± 2.2%), and the Jōmon
individual (58.1 ± 2.7%) dated to ~2,600 BP3, Hòabìnhian-like component also occurs in present-day
Tibetans (32.3 ± 2.0%), suggesting a once wide-ranging distribution of the Australasian lineage in
these regions prior to the agricultural expansion in East Asia. Regarding the East Asian lineage, there
is no significant difference in fitness of Jōmon using either Devil’s Cave (p =0.619) or Amis (p
=0.558) as the proxy of East Asian, suggesting that the East Asian ancestry of Jōmon may
phylogenetically be basal to the mainstream northern or southern East Asians. By contrast, the East
Asian ancestry of Tibetan, which is probably related to the Tibeto-Burman dissemination in Tibetan
Plateau, can be represented by Devil’s Cave (67.7 ± 2.0%, p = 0.178) rather than Amis (p =
1.24×10⁻⁴
), consistent with the North China origin of the Sino-Tibetan language family34,35
.
Fitting the scenario of the expansion of Neolithic farmers in southern China, southern East
Asian lineage represented by Amis predominates in Hàn (69.3 ± 2.8%), other populations in southern
China (69.2–78.6%), and populations in MSEA (54.3–76.7%). Hàn and Tibeto-Burman-speaking
populations (Nàxī, Yí, and Tǔjiā) tend to have more Devil’s Cave ancestry (23.5–30.7%) than their
.CC-BY-NC-ND 4.0 International licenseavailable under anot certified by peer review) is the author/funder, who has granted bioRxiv a license to display the preprint in perpetuity. It is made
The copyright holder for this preprint (which wasthis version posted August 9, 2019. ; https://doi.org/10.1101/730903doi: bioRxiv preprint
8
neighbors, consistent with our previous inference. Compared with isolated Austroasiatics, Kinh and
Thai/Khmer respectively harbor additional Devil’s Cave (18.7 ± 7.5%) and Namazga (8.4 ± 1.0% for
Thai, 3.7 ± 1.1% for Khmer) ancestry, likely reflecting immigration from Hàn Chinese and South
Asians in the historical period, accordingly. Apart from MSEA, Austroasiatic-speaking Kharia in
Central India is also estimated with Ami-like component (18.5 ± 3.0%), indicating a southern East
Asian origin of the Muṇḍā branch.
Although the Devil’s Cave ancestry is generally the predominant East Asian lineage in North
Asia and adjacent areas, there is an intriguing discrepancy between the eastern [Korean, Japanese,
Tungusic (except northernmost Oroqen), and Mongolic (except westernmost Kalmyk) speakers] and
the western part [West Xiōngnú (~2,150 BP)36
, Tiānshān Hun (~1,500 BP)36
, Turkic-speaking
Karakhanid (~1,000 BP)36
and Tuva, and Kalmyk]. Whereas the East Asian ancestry of populations in
the western part has entirely belonged to the Devil’s Cave lineage till now, populations in the eastern
part have received the genomic influence from an Amis-related lineage (17.4–52.1%) posterior to the
presence of the Devil’s Cave population roughly in the same region (~7,600 BP)12
. Analogically,
archaeological record has documented the transmission of wet-rice cultivation from coastal China
(Shāndōng and/or Liáoníng Peninsula) to Northeast Asia, notably the Korean Peninsula (Mumun
pottery period, since ~3,500 BP) and the Japanese archipelago (Yayoi period, since ~2,900 BP)2.
Especially for Japanese, the Austronesian-related linguistic influence in Japanese37
may indicate a
potential contact between the Proto-Japonic speakers and population(s) affiliating to the coastal
lineage. Thus, our results imply that a southern-East-Asian-related lineage could be arguably
associated with the dispersal of wet-rice agriculture in Northeast Asia at least to some extent.
DISCUSSION
In this study, we discover an explicit genomic pattern regarding Hmong-Mien speakers and other
southern East Asians, which has been established in Neolithic and is still detectable in present-day
populations. After the separation from the northern East Asians, southern East Asians further divided
into two lineages genetically, concordant with archaeological and linguistic evidence. While the
inland lineage is associated with the farming dispersal from the middle Yangtze and the
dissemination of the Austroasiatic and Hmong-Mien language family, the coastal lineage is more
correlated with the agriculture expansion out of Yangtze Delta and the diffusion of the Austronesian
and (at least partially) Kra-Dai language family. Especially for Hmong-Mien speakers, the dispersal
from inland southern China and subsequent genetic contact with neighboring populations
(particularly Tibeto-Burman- and Kra-Dai-speaking ones) majorly form the demographic history of
Hmong-Mien-speaking populations.
It has been long debated how the Neolithic cultures relate to major language families in East
Asian, and several assumptions have been proposed, notably the connection between the Dàxī
culture and Proto-Hmong-Mien30
, the Dàwènkǒu culture and Pre-Austronesian30
, as well as the
Yǎngsháo34
/Císhān35
culture and Proto-Sino-Tibetan. Even though the ancient genomic data from the
Neolithic farming heartlands in China have not been sufficiently reported yet, we still recover a
general demographic pattern using both the genetic diversity preserved in present-day populations
.CC-BY-NC-ND 4.0 International licenseavailable under anot certified by peer review) is the author/funder, who has granted bioRxiv a license to display the preprint in perpetuity. It is made
The copyright holder for this preprint (which wasthis version posted August 9, 2019. ; https://doi.org/10.1101/730903doi: bioRxiv preprint
9
and ancient samples from peripheral regions of East Asia, which can be served as a foothold for
further archaeogenetic studies on the demographic dynamic of the southern East Asia. Although we
observe a good matching among the evidence from genetics, linguistics, and archaeology, we still
cautiously refer the proposed ancestral populations to an approximate geographical range instead of
determined archaeological sites. Thus, we predict further studies on directly sampled ancient
genomes from these sites will shed new light on resolving a clearer genetic landscape of this region,
especially the demographic history since the Neolithic revolution.
.CC-BY-NC-ND 4.0 International licenseavailable under anot certified by peer review) is the author/funder, who has granted bioRxiv a license to display the preprint in perpetuity. It is made
The copyright holder for this preprint (which wasthis version posted August 9, 2019. ; https://doi.org/10.1101/730903doi: bioRxiv preprint
10
REFERENCE
1 Stevens, C. J. & Fuller, D. Q. The spread of agriculture in Eastern Asia: Archaeological bases for hypothetical
farmer/language dispersals. Language Dynamics and Change 7, 152-186 (2017).
2 Barnes, G. L. Archaeology of East Asia: the rise of civilization in China, Korea and Japan. (Oxbow Books,
2015).
3 McColl, H. et al. The prehistoric peopling of Southeast Asia. Science 361, 88-92 (2018). 4 Lipson, M. et al. Ancient genomes document multiple waves of migration in Southeast Asian prehistory. Science
361, 92-95 (2018).
5 Diamond, J. & Bellwood, P. Farmers and their languages: the first expansions. Science 300, 597-603 (2003).
6 Bellwood, P. in The peopling of East Asia 41-54 (Routledge, 2005).
7 Ratliff, M. Hmong-Mien language history. (Pacific linguistics, Research School of Pacific and Asian Studies,
The …, 2010).
8 Wen, B. et al. Genetic structure of Hmong-Mien speaking populations in East Asia as revealed by mtDNA
lineages. Molecular biology and evolution 22, 725-734 (2004).
9 Cai, X. et al. Human Migration through Bottlenecks from Southeast Asia into East Asia during Last Glacial
Maximum Revealed by Y Chromosomes. PLoS One 6, e24282, doi:10.1371/journal.pone.0024282 (2011).
10 Baxter, W. H. & Sagart, L. Old Chinese: A new reconstruction. (Oxford University Press, 2014). 11 Patterson, N., Price, A. L. & Reich, D. Population structure and eigenanalysis. PLoS genetics 2, e190 (2006).
12 Sikora, M. et al. The population history of northeastern Siberia since the Pleistocene. Nature,
doi:10.1038/s41586-019-1279-z (2019).
13 Reich, D. Who We Are and How We Got Here: Ancient DNA and the new science of the human past. (Oxford
University Press, 2018).
14 Alexander, D. H., Novembre, J. & Lange, K. Fast model-based estimation of ancestry in unrelated individuals.
Genome research 19, 1655-1664 (2009).
15 Pickrell, J. K. & Pritchard, J. K. Inference of population splits and mixtures from genome-wide allele frequency
data. PLoS genetics 8, e1002967 (2012).
16 Patterson, N. J. et al. Ancient admixture in human history. Genetics, genetics. 112.145037 (2012).
17 Mallick, S. et al. The Simons genome diversity project: 300 genomes from 142 diverse populations. Nature 538,
201 (2016). 18 Yan, S. et al. Y Chromosomes of 40% Chinese Descend from Three Neolithic Super-Grandfathers. PLoS One 9,
e105691, doi:10.1371/journal.pone.0105691 (2014).
19 Blench, R., Sagart, L. & Sanchez-Mazas, A. The peopling of East Asia: putting together archaeology, linguistics
and genetics. (Routledge, 2005).
20 Silva, F. et al. Modelling the Geographical Origin of Rice Cultivation in Asia Using the Rice Archaeological
Database. PLOS ONE 10, e0137024, doi:10.1371/journal.pone.0137024 (2015).
21 Chi, Z. & Hung, H.-c. The emergence of agriculture in southern China. Antiquity 84, 11-25 (2010).
22 Bellwood, P. S. First farmers: the origins of agricultural societies. (2005).
23 Lipson, M. et al. Reconstructing Austronesian population history in island Southeast Asia. Nature
communications 5, 4689 (2014).
24 Ostapirat, W. in 23rd Annual Meeting of the Southeast Asian Linguistic Society, Chulalongkorn University. 25 Blench, R. Was there an Austroasiatic presence in Island Southeast Asia prior to the Austronesian expansion?
Bulletin of the Indo-Pacific Prehistory Association 30, 133-144 (2010).
26 Simanjuntak, T. The western route migration: A second probable Neolithic diffusion to Indonesia. Terra
Australis 45, 201-212 (2017).
27 Luo, Y. in The Tai-Kadai Languages 25-44 (Routledge, 2004).
28 Ostapirat, W. 7. Macrophyletic Trees of East Asian Languages Re examined. Senri Ethnological Studies 98,
107-121 (2018).
29 Zhang, X. et al. An updated phylogeny of the human Y-chromosome lineage O2a-M95 with novel SNPs. PLoS
One 9, e101020 (2014).
30 Fuller, D. Q. Pathways to Asian civilizations: Tracing the origins and spread of rice and rice cultures. Rice 4, 78
(2011). 31 Haak, W. et al. Massive migration from the steppe was a source for Indo-European languages in Europe. Nature
522, 207 (2015).
32 de Barros Damgaard, P. et al. The first horse herders and the impact of early Bronze Age steppe expansions into
Asia. Science 360, eaar7711 (2018).
33 Reich, D., Thangaraj, K., Patterson, N., Price, A. L. & Singh, L. Reconstructing Indian population history.
Nature 461, 489-U450, doi:10.1038/nature08365 (2009).
34 Zhang, M., Yan, S., Pan, W. & Jin, L. Phylogenetic evidence for Sino-Tibetan origin in northern China in the
Late Neolithic. Nature, doi:10.1038/s41586-019-1153-z (2019).
.CC-BY-NC-ND 4.0 International licenseavailable under anot certified by peer review) is the author/funder, who has granted bioRxiv a license to display the preprint in perpetuity. It is made
The copyright holder for this preprint (which wasthis version posted August 9, 2019. ; https://doi.org/10.1101/730903doi: bioRxiv preprint
11
35 Sagart, L. et al. Dated language phylogenies shed light on the ancestry of Sino-Tibetan. Proceedings of the
National Academy of Sciences, 201817972 (2019).
36 de Barros Damgaard, P. et al. 137 ancient human genomes from across the Eurasian steppes. Nature 557, 369
(2018).
37 Robbeets, M. Austronesian influence and Transeurasian ancestry in Japanese: A case of farming/language
dispersal. Language Dynamics and Change 7, 210-251 (2017).
.CC-BY-NC-ND 4.0 International licenseavailable under anot certified by peer review) is the author/funder, who has granted bioRxiv a license to display the preprint in perpetuity. It is made
The copyright holder for this preprint (which wasthis version posted August 9, 2019. ; https://doi.org/10.1101/730903doi: bioRxiv preprint
12
METHOD
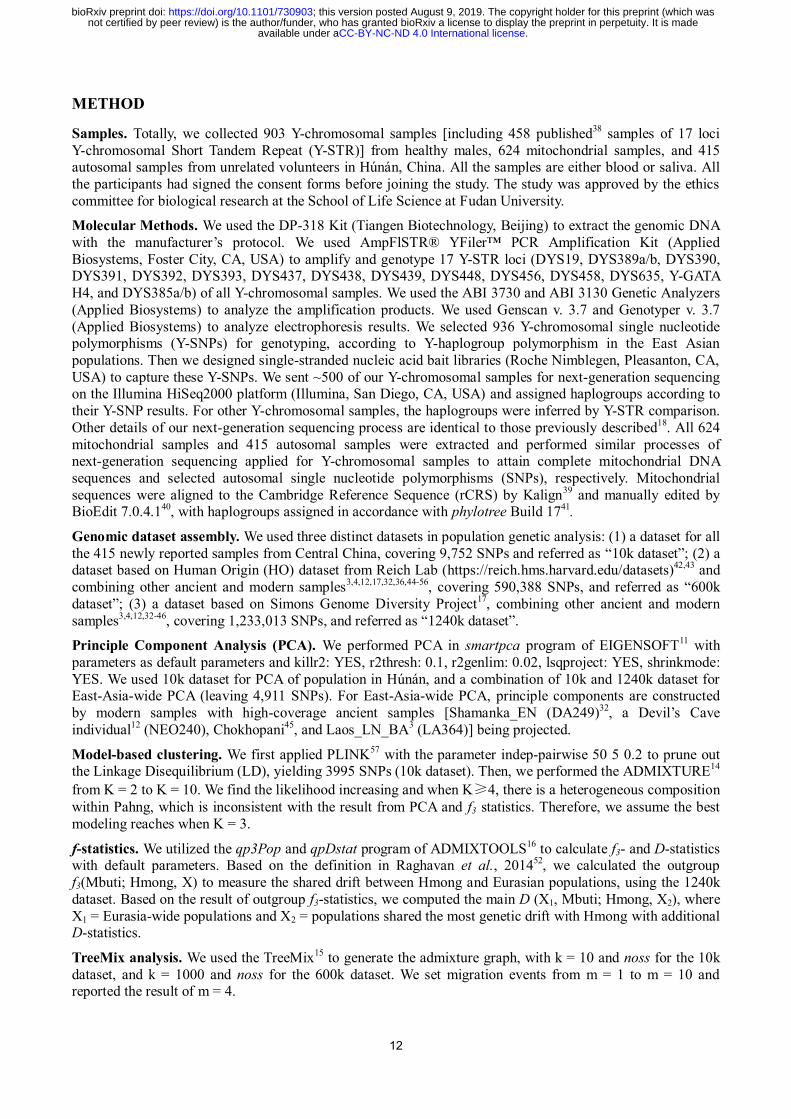
Samples. Totally, we collected 903 Y-chromosomal samples [including 458 published38
samples of 17 loci
Y-chromosomal Short Tandem Repeat (Y-STR)] from healthy males, 624 mitochondrial samples, and 415 autosomal samples from unrelated volunteers in Húnán, China. All the samples are either blood or saliva. All
the participants had signed the consent forms before joining the study. The study was approved by the ethics
committee for biological research at the School of Life Science at Fudan University.
Molecular Methods. We used the DP-318 Kit (Tiangen Biotechnology, Beijing) to extract the genomic DNA
with the manufacturer’s protocol. We used AmpFlSTR® YFiler™ PCR Amplification Kit (Applied
Biosystems, Foster City, CA, USA) to amplify and genotype 17 Y-STR loci (DYS19, DYS389a/b, DYS390, DYS391, DYS392, DYS393, DYS437, DYS438, DYS439, DYS448, DYS456, DYS458, DYS635, Y-GATA
H4, and DYS385a/b) of all Y-chromosomal samples. We used the ABI 3730 and ABI 3130 Genetic Analyzers
(Applied Biosystems) to analyze the amplification products. We used Genscan v. 3.7 and Genotyper v. 3.7
(Applied Biosystems) to analyze electrophoresis results. We selected 936 Y-chromosomal single nucleotide polymorphisms (Y-SNPs) for genotyping, according to Y-haplogroup polymorphism in the East Asian
populations. Then we designed single-stranded nucleic acid bait libraries (Roche Nimblegen, Pleasanton, CA,
USA) to capture these Y-SNPs. We sent ~500 of our Y-chromosomal samples for next-generation sequencing on the Illumina HiSeq2000 platform (Illumina, San Diego, CA, USA) and assigned haplogroups according to
their Y-SNP results. For other Y-chromosomal samples, the haplogroups were inferred by Y-STR comparison.
Other details of our next-generation sequencing process are identical to those previously described18
. All 624
mitochondrial samples and 415 autosomal samples were extracted and performed similar processes of next-generation sequencing applied for Y-chromosomal samples to attain complete mitochondrial DNA
sequences and selected autosomal single nucleotide polymorphisms (SNPs), respectively. Mitochondrial
sequences were aligned to the Cambridge Reference Sequence (rCRS) by Kalign39
and manually edited by BioEdit 7.0.4.1
40, with haplogroups assigned in accordance with phylotree Build 17
41.
Genomic dataset assembly. We used three distinct datasets in population genetic analysis: (1) a dataset for all
the 415 newly reported samples from Central China, covering 9,752 SNPs and referred as “10k dataset”; (2) a dataset based on Human Origin (HO) dataset from Reich Lab (https://reich.hms.harvard.edu/datasets)
42,43 and
combining other ancient and modern samples3,4,12,17,32,36,44-56
, covering 590,388 SNPs, and referred as “600k
dataset”; (3) a dataset based on Simons Genome Diversity Project17
, combining other ancient and modern
samples3,4,12,32-46
, covering 1,233,013 SNPs, and referred as “1240k dataset”.
Principle Component Analysis (PCA). We performed PCA in smartpca program of EIGENSOFT11
with
parameters as default parameters and killr2: YES, r2thresh: 0.1, r2genlim: 0.02, lsqproject: YES, shrinkmode:
YES. We used 10k dataset for PCA of population in Húnán, and a combination of 10k and 1240k dataset for East-Asia-wide PCA (leaving 4,911 SNPs). For East-Asia-wide PCA, principle components are constructed
by modern samples with high-coverage ancient samples [Shamanka_EN (DA249)32
, a Devil’s Cave
individual12
(NEO240), Chokhopani45
, and Laos_LN_BA3 (LA364)] being projected.
Model-based clustering. We first applied PLINK57
with the parameter indep-pairwise 50 5 0.2 to prune out the Linkage Disequilibrium (LD), yielding 3995 SNPs (10k dataset). Then, we performed the ADMIXTURE
14
from K = 2 to K = 10. We find the likelihood increasing and when K≥4, there is a heterogeneous composition
within Pahng, which is inconsistent with the result from PCA and f3 statistics. Therefore, we assume the best
modeling reaches when K = 3.
f-statistics. We utilized the qp3Pop and qpDstat program of ADMIXTOOLS16
to calculate f3- and D-statistics with default parameters. Based on the definition in Raghavan et al., 2014
52, we calculated the outgroup
f3(Mbuti; Hmong, X) to measure the shared drift between Hmong and Eurasian populations, using the 1240k
dataset. Based on the result of outgroup f3-statistics, we computed the main D (X1, Mbuti; Hmong, X2), where
X1 = Eurasia-wide populations and X2 = populations shared the most genetic drift with Hmong with additional D-statistics.
TreeMix analysis. We used the TreeMix15
to generate the admixture graph, with k = 10 and noss for the 10k
dataset, and k = 1000 and noss for the 600k dataset. We set migration events from m = 1 to m = 10 and reported the result of m = 4.
.CC-BY-NC-ND 4.0 International licenseavailable under anot certified by peer review) is the author/funder, who has granted bioRxiv a license to display the preprint in perpetuity. It is made
The copyright holder for this preprint (which wasthis version posted August 9, 2019. ; https://doi.org/10.1101/730903doi: bioRxiv preprint
13
Coalescence time estimation. In total, 93 complete mitochondrial sequences were selected for phylogenetic
analysis of haplogroup B5, including 52 sequences from this study and 41 sequences [33 of B5, 1 of B4’5*58
(Tiányuán), 1 of B4, and 6 of outgroup of B4’5] from phylotree Build 17
41. The mutations of C indels
309.1C(C)-315.1C, AC indels at 515-522, C indels at 956-960, 3107, 8281-8289, A16182c, A16183c, 16189
and 16193.1C(C) were excluded from phylogeny reconstruction, manually performed using BioEdit 7.0.4.140
.
We applied ARB59
to generate the phylogeny using the Maximum Parsimony (MP) method. Bayesian time estimation for the most recent common ancestor (TMRCA) of B5 and its subclades were performed by
BEAST v1.10.060
. The monophyletic option was set according to the previously generated MP phylogeny. The
age of 40.0 kya for Tiányuán belonging to mitochondrial haplogroup B4’5* was chosen for time calibration58
. For substitution model, HKY model was chosen with estimated base frequencies and Site Heterogeneity
Model was set to eight Gamma categories. Strict clock model was set, and Bayesian skyline model was
applied as prior61
. The run was conducted 10 million iterations with sampling every 1000 steps, with the first 10% burnt in. All the effective sample sizes (ESS) were higher than 200. We applied similar procedure to the
full-sequencing Y-chromosomal data for Bayesian TMRCA estimation.
Admixture graph fitting by qpGraph. We used the qpGraph program of ADMIXTOOLS16
to create the
admixture graph based on the result of D-statistics, with the default parameters and useallsnps: YES, outpop: NULL. We used 600k dataset to fit the admixture graph, leaving 496,352 SNPs. We used the backbone graph
described in McColl et al., 20183 as the initial graph. To avoid the case of a “basal” admixture, only Mbuti and
Eurasian samples without significant Denisovan ancestry retained in the graph. Since all the Eurasian samples in the graph (except Ust’-Ishim and Tiányuán) do not harbor significantly excess Neanderthal ancestry
compared with each other3, we suppose that the interference of Neanderthal ancestry can only affect fitness
between Mbuti and Eurasian samples, and Tiányuán or Ust’-Ishim with the others. Thus, such interference cannot significantly bias the main result of our qpGraph fitting.
Inference of mixture proportions. We used the qpWave62
and qpAdm31
program of ADMIXTOOLS to
estimate the fitness and proportion of admixture components. We used the Devil’s Cave samples12
, Amis, the
Laotian Hòabìnhian individual (LA368)3, Afanasievo
56, Namazga
32, and Kolyma
12 as reference populations.
We used Mbuti, Peștera cu Oase153
, Ust’-Ishim48
, Tiányuán47
, Kostenki49
, Yana_UP12
, Naṭūfian_N43
,
Anatolia_N54
, Motala_HG54,55
, Önge17
, Papuan, Eskimo, and Mixe as outgroups.
Inbreeding coefficient FST. Using 10k dataset, we performed smartpca program of EIGENSOFT11
to estimate pairwise FST with default parameters and fstonly: YES.
Abbreviations. We use the following abbreviated labels addressing populations throughout the paper: AAA,
Ancestral Austroasiatic; AAN, Ancestral Austronesian; AHM, Ancestral Hmong-Mien; AKD, Ancestral
Kra-Dai; South_EA, southern East Asian; North_EA, northern East Asians; First_MSEA, First Mainland Southeast Asian; Second_MSEA, Second Mainland Southeast Asian; Insular_AN, Insular Austronesian;
SEAH, southern East Asian ancestry of Hàn; Aus, Australasian; UP, Upper Pleistocene; N, Neolithic; EN,
Early Neolithic; LN, Late Neolithic; BA, Bronze Age; IA, Iron Age; HG, hunter-gatherer.
.CC-BY-NC-ND 4.0 International licenseavailable under anot certified by peer review) is the author/funder, who has granted bioRxiv a license to display the preprint in perpetuity. It is made
The copyright holder for this preprint (which wasthis version posted August 9, 2019. ; https://doi.org/10.1101/730903doi: bioRxiv preprint
14
38 Shu, L. et al. Genetic analysis of 17 Y-STR loci in Han, Dong, Miao and Tujia populations from Hunan province,
central-southern China. Forensic science international. Genetics 19, 250 (2015).
39 Lassmann, T. & Sonnhammer, E. L. Kalign–an accurate and fast multiple sequence alignment algorithm. BMC
bioinformatics 6, 298 (2005).
40 Hall, T. A. in Nucleic acids symposium series. 95-98 ([London]: Information Retrieval Ltd., c1979-c2000.). 41 van Oven, M. & Kayser, M. Updated Comprehensive Phylogenetic Tree of Global Human Mitochondrial DNA
Variation. Human Mutation 30, E386-E394, doi:10.1002/humu.20921 (2009).
42 Lazaridis, I. et al. Ancient human genomes suggest three ancestral populations for present-day Europeans.
Nature 513, 409 (2014).
43 Lazaridis, I. et al. Genomic insights into the origin of farming in the ancient Near East. Nature 536, 419 (2016).
44 Consortium, G. P. A global reference for human genetic variation. Nature 526, 68 (2015).
45 Jeong, C. et al. Long-term genetic stability and a high-altitude East Asian origin for the peoples of the high
valleys of the Himalayan arc. Proceedings of the National Academy of Sciences 113, 7485-7490 (2016).
46 Rasmussen, M. et al. The genome of a Late Pleistocene human from a Clovis burial site in western Montana.
Nature 506, 225 (2014).
47 Yang, M. A. et al. 40,000-year-old individual from Asia provides insight into early population structure in
Eurasia. Current Biology 27, 3202-3208. e3209 (2017). 48 Fu, Q. et al. Genome sequence of a 45,000-year-old modern human from western Siberia. Nature 514, 445
(2014).
49 Fu, Q. et al. The genetic history of ice age Europe. Nature 534, 200 (2016).
50 Meyer, M. et al. A high-coverage genome sequence from an archaic Denisovan individual. Science 338, 222-226
(2012).
51 Prüfer, K. et al. The complete genome sequence of a Neanderthal from the Altai Mountains. Nature 505, 43
(2014).
52 Raghavan, M. et al. Upper Palaeolithic Siberian genome reveals dual ancestry of Native Americans. Nature 505,
87 (2014).
53 Fu, Q. et al. An early modern human from Romania with a recent Neanderthal ancestor. Nature 524, 216 (2015).
54 Mathieson, I. et al. Genome-wide patterns of selection in 230 ancient Eurasians. Nature 528, 499 (2015). 55 Mittnik, A. et al. The genetic prehistory of the Baltic Sea region. Nature communications 9, 442 (2018).
56 Allentoft, M. E. et al. Population genomics of bronze age Eurasia. Nature 522, 167 (2015).
57 Purcell, S. et al. PLINK: a tool set for whole-genome association and population-based linkage analyses. The
American journal of human genetics 81, 559-575 (2007).
58 Fu, Q. et al. A Revised Timescale for Human Evolution Based on Ancient Mitochondrial Genomes. Current
Biology 23, 1-7 (2013).
59 Ludwig, W. et al. ARB: a software environment for sequence data. Nucleic Acids Research 32, 1363-1371
(2004).
60 Suchard, M. A. et al. Bayesian phylogenetic and phylodynamic data integration using BEAST 1.10. Virus
Evolution 4, vey016 (2018).
61 Drummond, A. J., Rambaut, A., Shapiro, B. & Pybus, O. G. Bayesian coalescent inference of past population
dynamics from molecular sequences. Molecular biology and evolution 22, 1185-1192 (2005). 62 Reich, D. et al. Reconstructing Native American population history. Nature 488, 370-+,
doi:10.1038/nature11258 (2012).
.CC-BY-NC-ND 4.0 International licenseavailable under anot certified by peer review) is the author/funder, who has granted bioRxiv a license to display the preprint in perpetuity. It is made
The copyright holder for this preprint (which wasthis version posted August 9, 2019. ; https://doi.org/10.1101/730903doi: bioRxiv preprint
15
(A)
(B)
Population Ethnicity Language Language
branch Language
family Xiāng
Hàn
Chinese, Xiāng Dialect
Sinitic
Sino- Tibetan
Gàn Chinese, Gàn Dialect
Hakka Chinese, Hakka Dialect
MandarinSW Chinese, Southwest Mandarin Dialect
Tǔhuà Hàn or Yáo Chinese, Tǔhuà Dialect
Wǎxiāng Hàn, Miáo or Yáo Wǎxiāng
BáiH Bái in Húnán Chinese, Southwest Mandarin Dialect
TǔjiāN
Tǔjiā
Tǔjiā, Northern Dialect Tibeto- Burman
TǔjiāS Tǔjiā, Southern Dialect
TǔjiāM Tǔjiā (historical), Southwest Mandarin (present)
Hmong Miáo (Hmong) Xiong Hmongic Hmong-
Mien Pahng
Yáo Hm Nai
Mien Iu Mien Mienic
Kam Dòng (Kam) Kam, Southern Dialect Kam-Sui Kra-Dai
Zhuàng Zhuàng Zhuàng Tai
Huí Huí Southwest Mandarin or Xiāng (present) Sinitic
Sino- Tibetan Uyghur Uyghur Old Uyghur (historical), Southwest Mandarin (present)
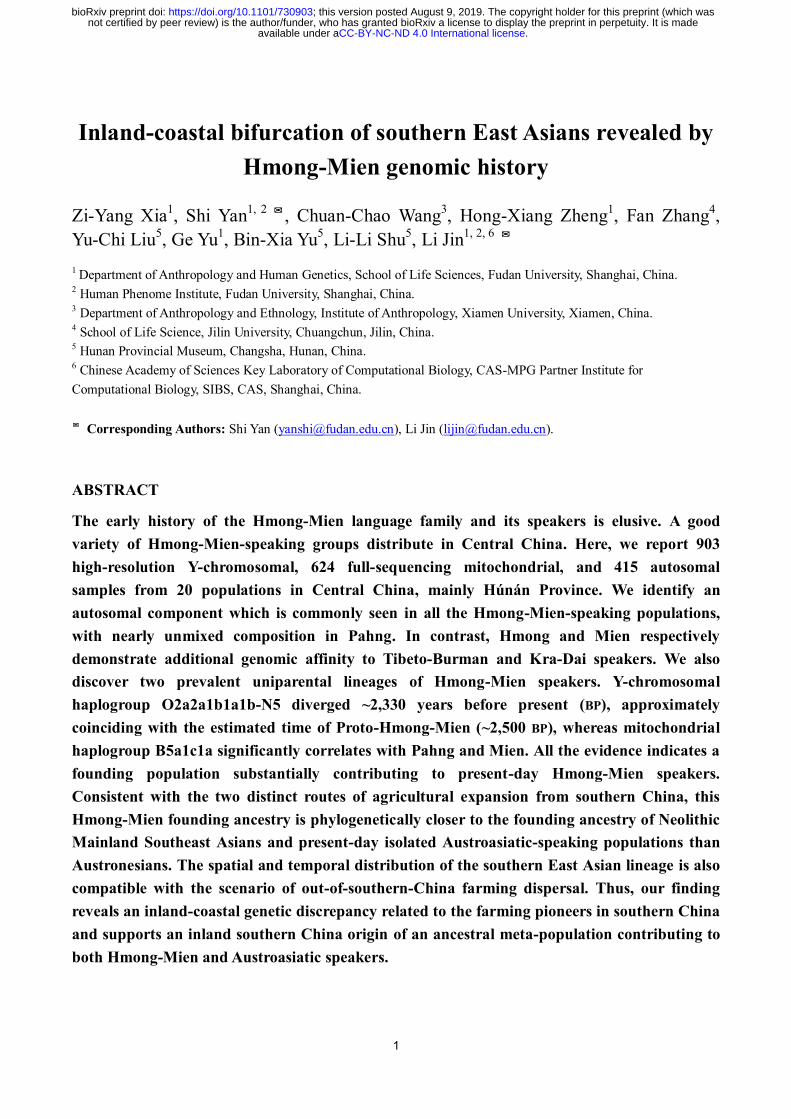
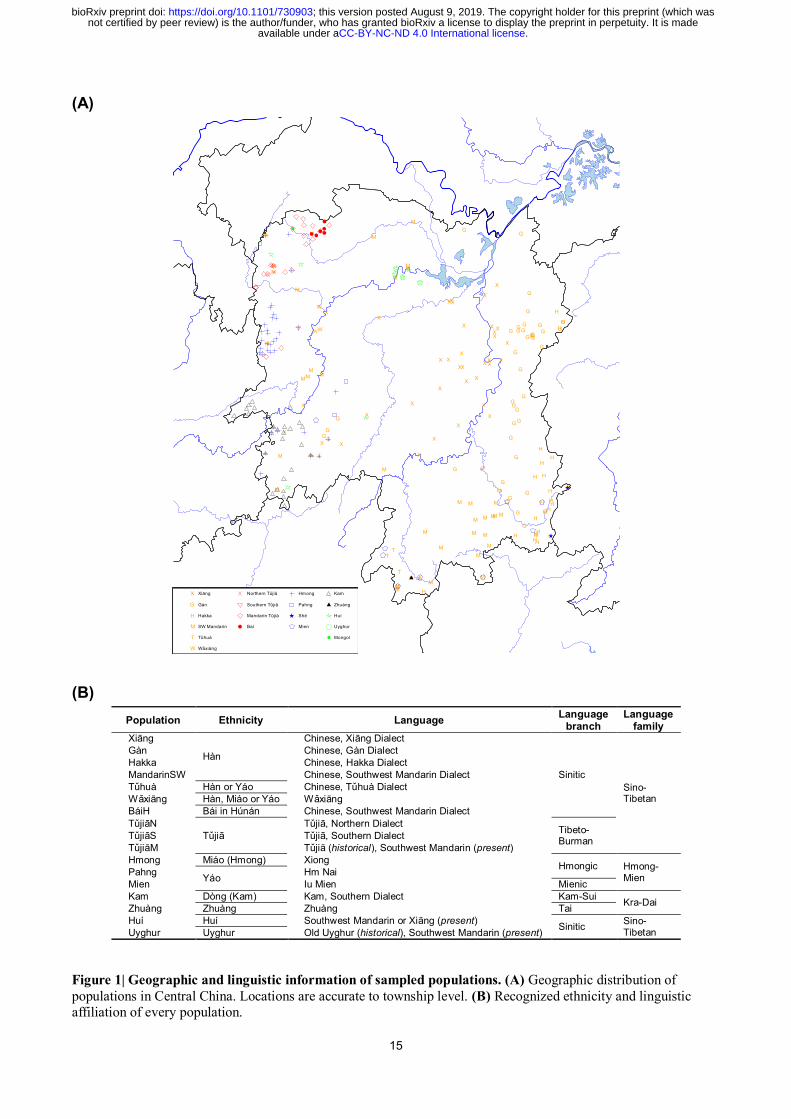
Figure 1| Geographic and linguistic information of sampled populations. (A) Geographic distribution of
populations in Central China. Locations are accurate to township level. (B) Recognized ethnicity and linguistic
affiliation of every population.
XX X
XX
X
X
X
X
X
X
X
X
X
X
X
X
X X
X
X
X
XX
X
X
X
X
X
X
XXX
X
X
X
X
X
X
G
G
G
G
G
G
G
GG GG
G
GGG
G
G
G
G
G
G
G
G
GG
GG
G
G
GG
G
G
G
G
G
G
G
G
G
GG
H
H
H
H
H
H H
H
HH
HHH
H
HH
H
HH
H
H
H
H
H
H
M
M
M
M
M
M
M
M MM
M M
M
M
M
M
M
M
M
M
M
M
MMM
MM
M
M
M
M
M
M
M
MM
MM
T
T
TT
W
W
W
Xiāng Northern Tǔjiā Hmong Kam
Gàn Southern Tǔjiā Pahng Zhuàng
Hakka Mandarin Tǔjiā Shē Huí
SW Mandarin Baí Mien Uyghur
Tǔhuà Mongol
Wǎxiāng
H
M
X
G
T
W
.CC-BY-NC-ND 4.0 International licenseavailable under anot certified by peer review) is the author/funder, who has granted bioRxiv a license to display the preprint in perpetuity. It is made
The copyright holder for this preprint (which wasthis version posted August 9, 2019. ; https://doi.org/10.1101/730903doi: bioRxiv preprint
16
(A) (C)
(B)
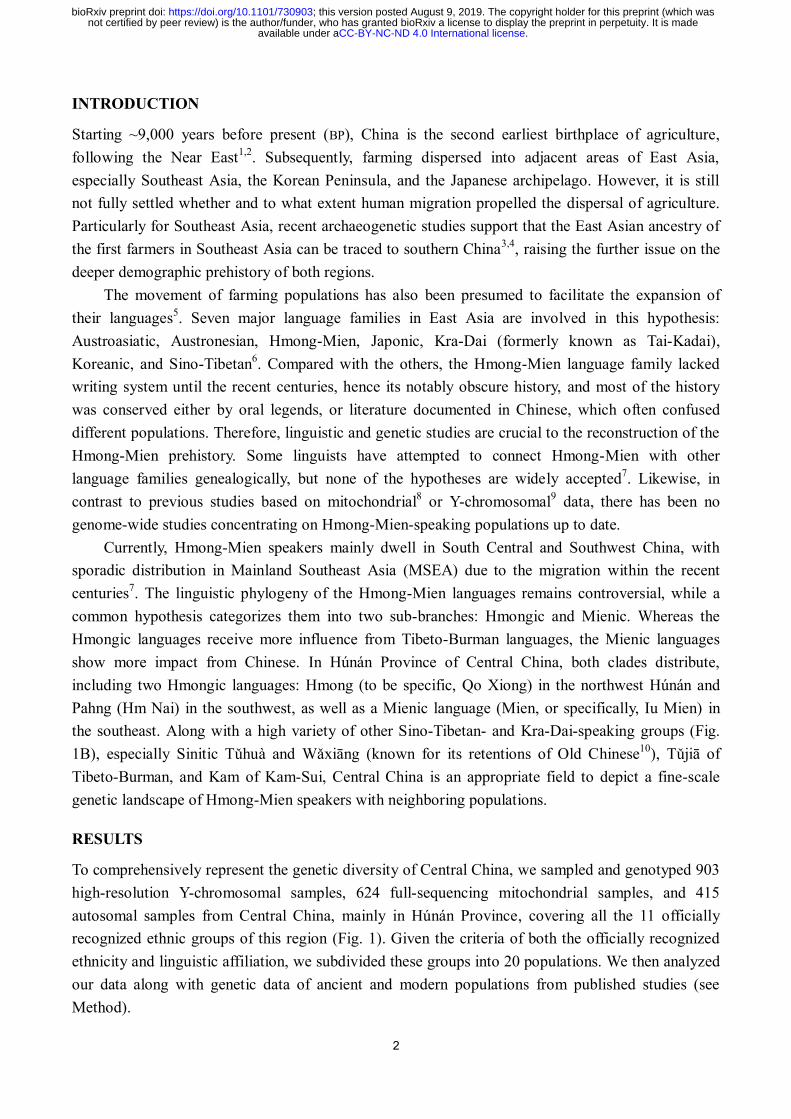
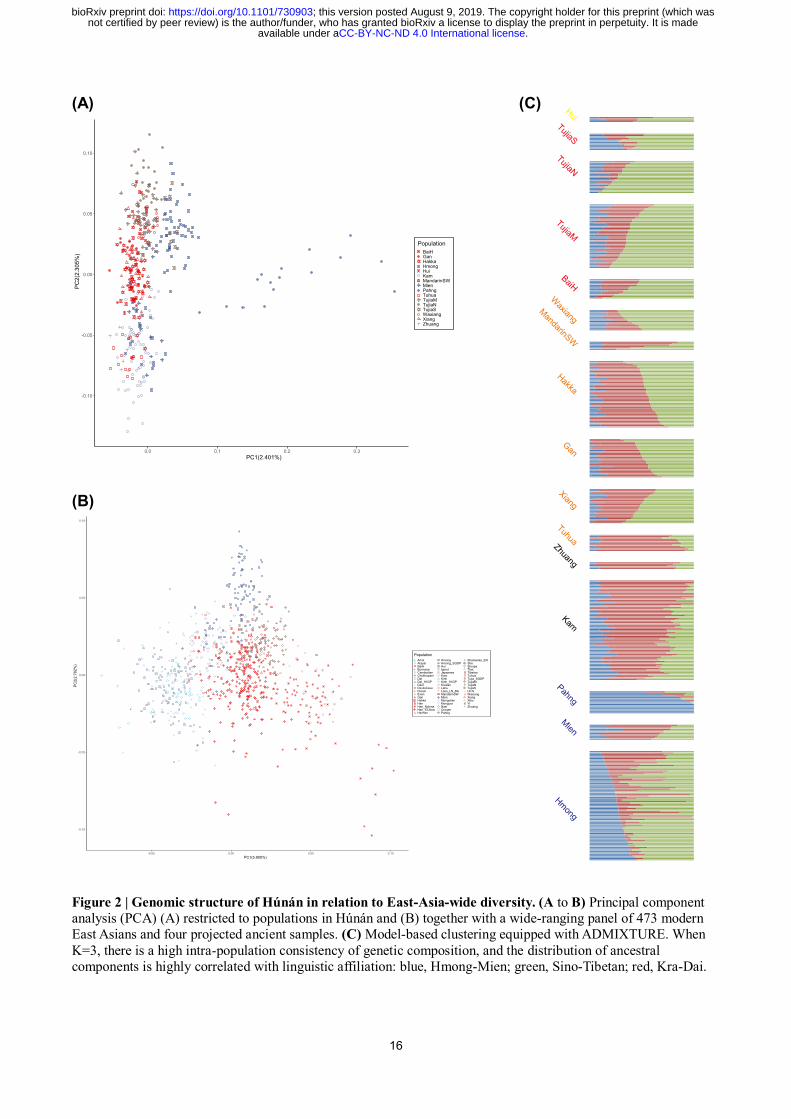
Figure 2 | Genomic structure of Húnán in relation to East-Asia-wide diversity. (A to B) Principal component
analysis (PCA) (A) restricted to populations in Húnán and (B) together with a wide-ranging panel of 473 modern
East Asians and four projected ancient samples. (C) Model-based clustering equipped with ADMIXTURE. When
K=3, there is a high intra-population consistency of genetic composition, and the distribution of ancestral
components is highly correlated with linguistic affiliation: blue, Hmong-Mien; green, Sino-Tibetan; red, Kra-Dai.
.CC-BY-NC-ND 4.0 International licenseavailable under anot certified by peer review) is the author/funder, who has granted bioRxiv a license to display the preprint in perpetuity. It is made
The copyright holder for this preprint (which wasthis version posted August 9, 2019. ; https://doi.org/10.1101/730903doi: bioRxiv preprint
17
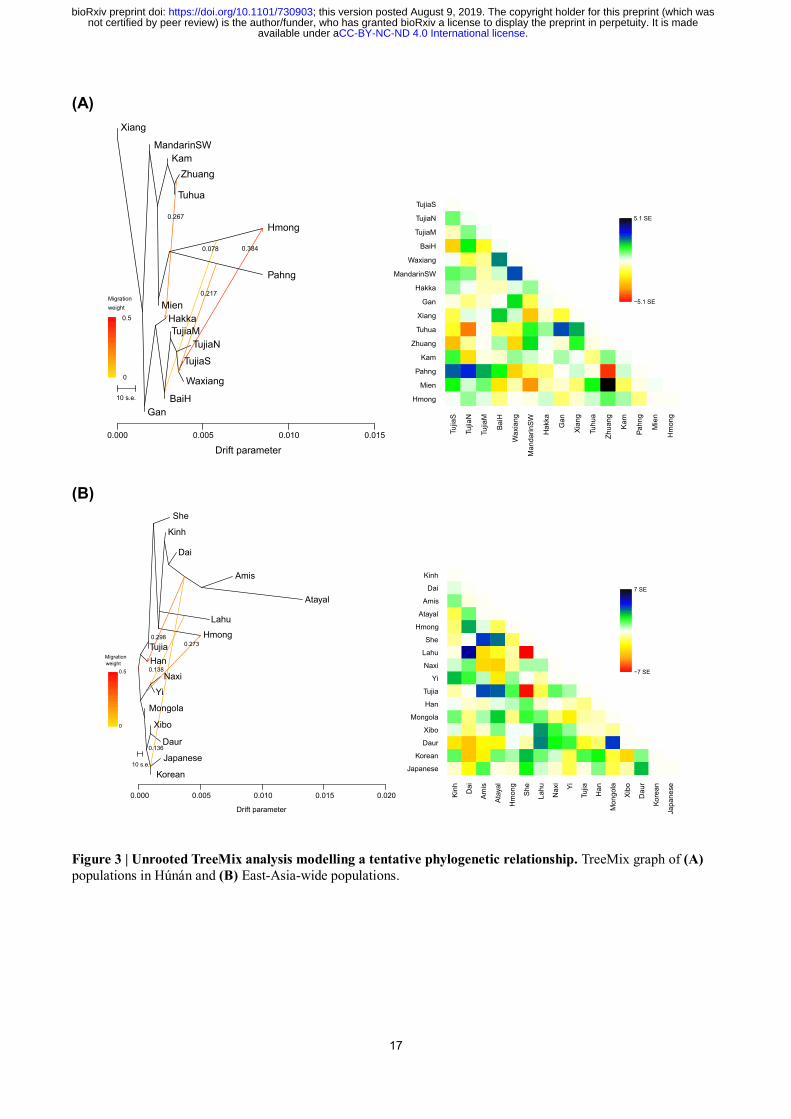
(A)
(B)
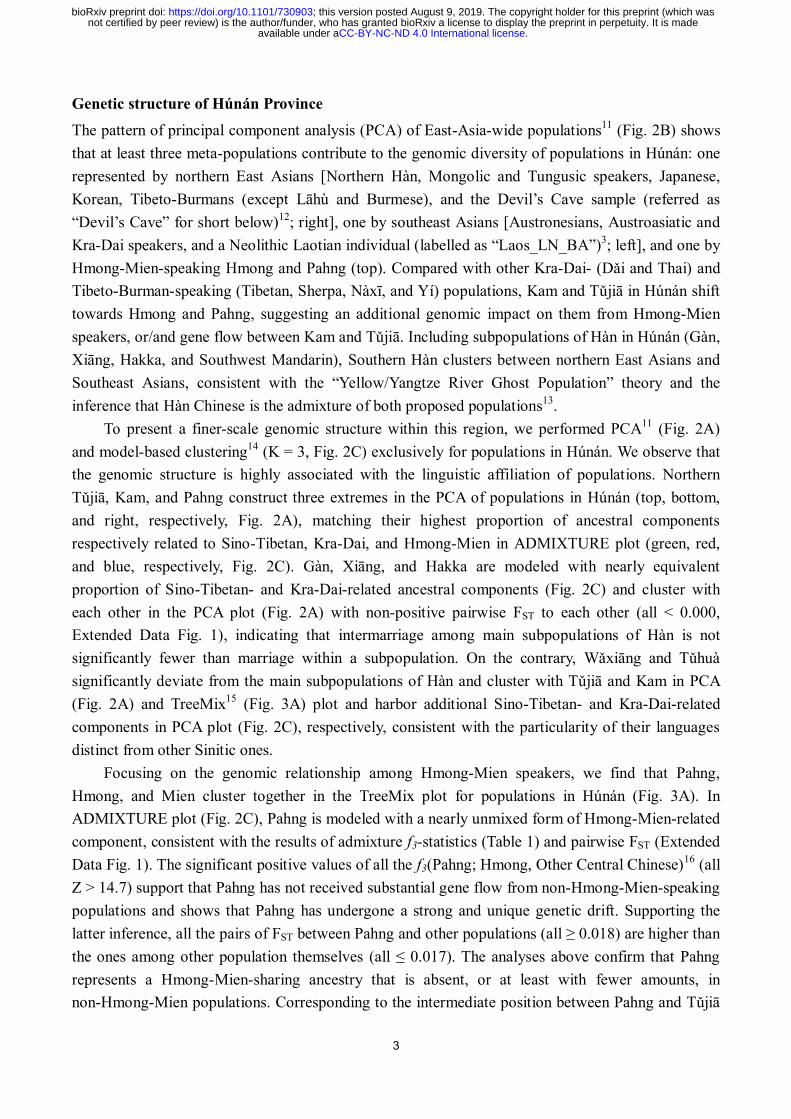
Figure 3 | Unrooted TreeMix analysis modelling a tentative phylogenetic relationship. TreeMix graph of (A)
populations in Húnán and (B) East-Asia-wide populations.
Drift parameter
0.000 0.005 0.010 0.015
MandarinSW
Kam
Hmong
Xiang
TujiaN
Gan
TujiaS
Hakka
TujiaM
Waxiang
Pahng
BaiH
Tuhua
Zhuang
Mien
10 s.e.
0
0.5
Migration
weight
0.267
0.3840.078
0.217
TujiaS
Tu
jiaS
TujiaN
Tu
jiaN
TujiaM
Tu
jiaM
BaiH
Ba
iH
Waxiang
Wa
xia
ng
MandarinSW
Ma
nd
ari
nS
W
Hakka
Ha
kka
Gan
Ga
n
Xiang
Xia
ng
Tuhua
Tu
hu
a
Zhuang
Zh
ua
ng
Kam
Ka
m
Pahng
Pa
hn
g
Mien
Mie
n
Hmong
Hm
on
g
−5.1 SE
5.1 SE
Drift parameter
0.000 0.005 0.010 0.015 0.020
Han
Korean
Mongola
Daur
Atayal
She
Kinh
Xibo
Lahu
Naxi
Japanese
Dai
Amis
Hmong
Yi
Tujia
10 s.e.
0
0.5
Migration
weight
0.138
0.2730.298
0.136
Kinh
Kin
h
Dai
Da
i
Amis
Am
is
Atayal
Ata
ya
l
Hmong
Hm
on
g
She
Sh
e
Lahu
La
hu
Naxi
Na
xi
Yi
Yi
Tujia
Tu
jia
Han
Ha
n
Mongola
Mo
ng
ola
Xibo
Xib
o
Daur
Da
ur
Korean
Ko
rea
n
Japanese
Ja
pa
ne
se
−7 SE
7 SE
.CC-BY-NC-ND 4.0 International licenseavailable under anot certified by peer review) is the author/funder, who has granted bioRxiv a license to display the preprint in perpetuity. It is made
The copyright holder for this preprint (which wasthis version posted August 9, 2019. ; https://doi.org/10.1101/730903doi: bioRxiv preprint
18
(A)
(B)
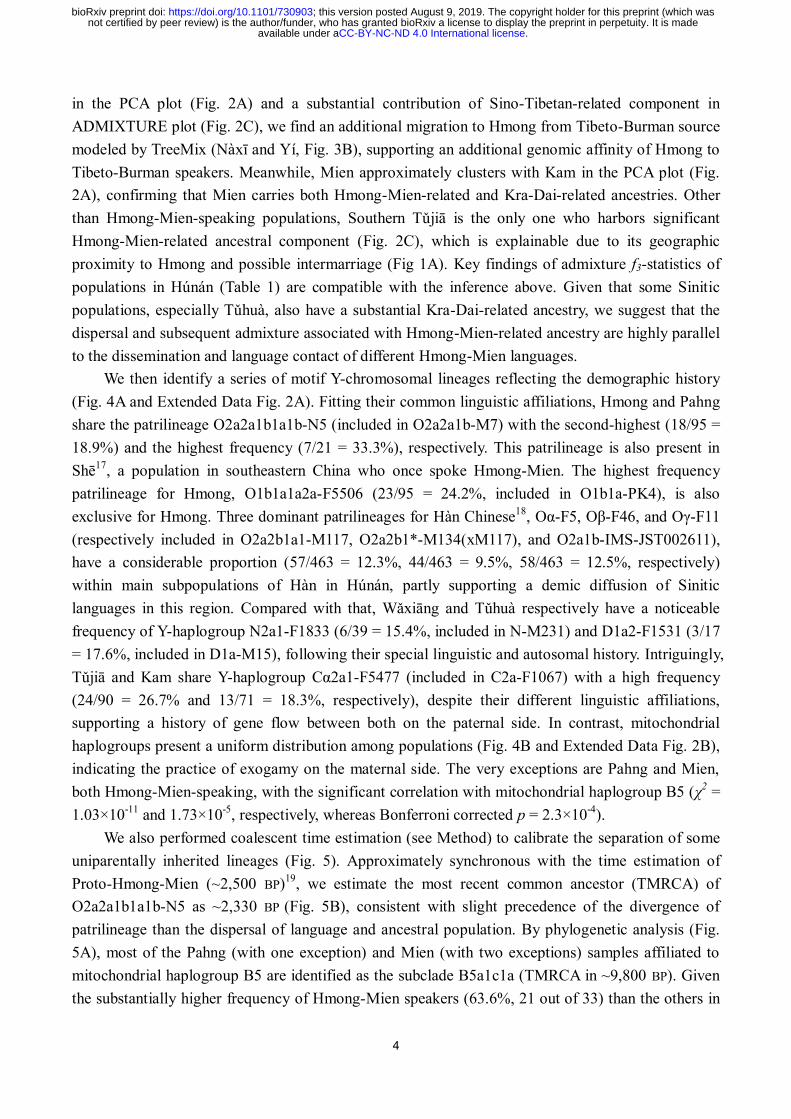
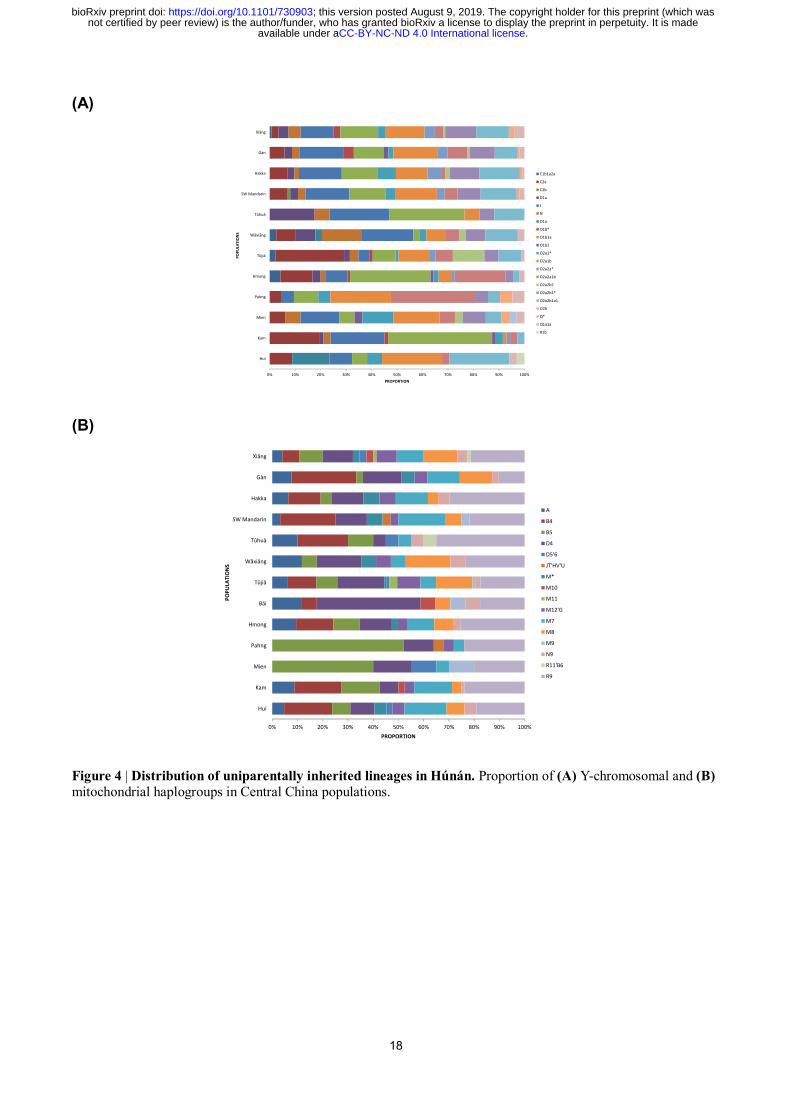
Figure 4 | Distribution of uniparentally inherited lineages in Húnán. Proportion of (A) Y-chromosomal and (B)
mitochondrial haplogroups in Central China populations.
0% 10% 20% 30% 40% 50% 60% 70% 80% 90% 100%
Huí
Kam
Mien
Pahng
Hmong
Tǔjiā
Wǎxiāng
Tǔhuà
SW Mandarin
Hakka
Gàn
Xiāng
PROPORTION
POPULA
TIONS
C1b1a2a
C2a
C2b
D1a
J
N
O1a
O1b*
O1b1a
O1b2
O2a1*
O2a1b
O2a2a*
O2a2a1b
O2a2b2
O2a2b1*
O2a2b1a1
O2b
Q*
Q1a1a
R1b
0% 10% 20% 30% 40% 50% 60% 70% 80% 90% 100%
Huí
Kam
Mien
Pahng
Hmong
Bái
Tǔjiā
Wǎxiāng
Tǔhuà
SW Mandarin
Hakka
Gàn
Xiāng
PROPORTION
POPULA
TIONS
A
B4
B5
D4
D5'6
JT'HV'U
M*
M10
M11
M12'G
M7
M8
M9
N9
R11'B6
R9
.CC-BY-NC-ND 4.0 International licenseavailable under anot certified by peer review) is the author/funder, who has granted bioRxiv a license to display the preprint in perpetuity. It is made
The copyright holder for this preprint (which wasthis version posted August 9, 2019. ; https://doi.org/10.1101/730903doi: bioRxiv preprint
19
(A)
(B)
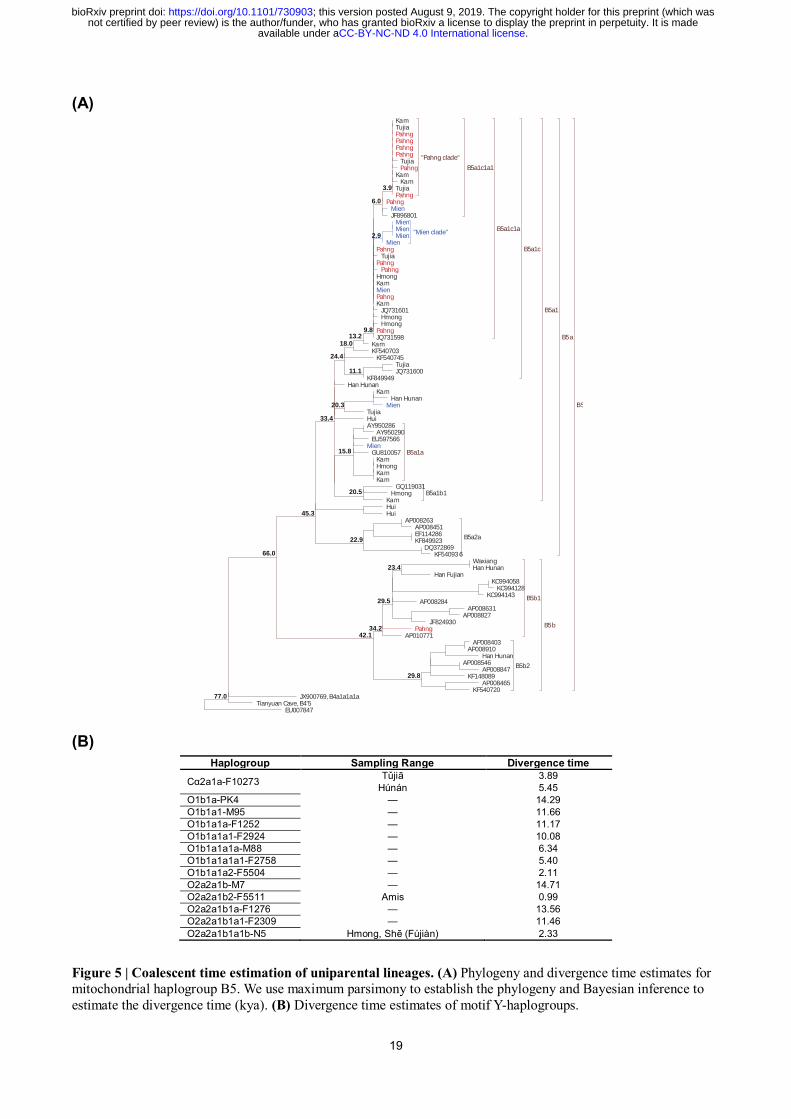
Haplogroup Sampling Range Divergence time
Cα2a1a-F10273 Tǔjiā 3.89
Húnán 5.45
O1b1a-PK4 — 14.29
O1b1a1-M95 — 11.66
O1b1a1a-F1252 — 11.17
O1b1a1a1-F2924 — 10.08
O1b1a1a1a-M88 — 6.34
O1b1a1a1a1-F2758 — 5.40
O1b1a1a2-F5504 — 2.11
O2a2a1b-M7 — 14.71
O2a2a1b2-F5511 Amis 0.99
O2a2a1b1a-F1276 — 13.56
O2a2a1b1a1-F2309 — 11.46
O2a2a1b1a1b-N5 Hmong, Shē (Fújiàn) 2.33
Figure 5 | Coalescent time estimation of uniparental lineages. (A) Phylogeny and divergence time estimates for mitochondrial haplogroup B5. We use maximum parsimony to establish the phylogeny and Bayesian inference to
estimate the divergence time (kya). (B) Divergence time estimates of motif Y-haplogroups.
.CC-BY-NC-ND 4.0 International licenseavailable under anot certified by peer review) is the author/funder, who has granted bioRxiv a license to display the preprint in perpetuity. It is made
The copyright holder for this preprint (which wasthis version posted August 9, 2019. ; https://doi.org/10.1101/730903doi: bioRxiv preprint
20
(A) (B) (C)
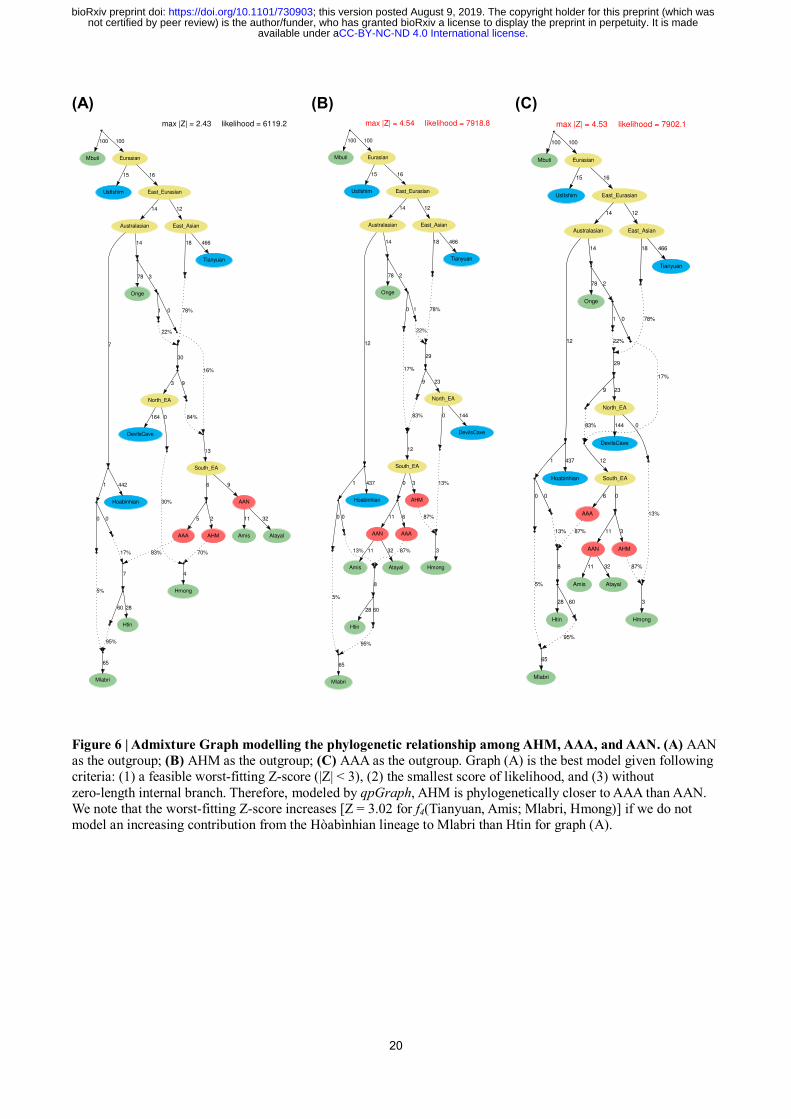
Figure 6 | Admixture Graph modelling the phylogenetic relationship among AHM, AAA, and AAN. (A) AAN
as the outgroup; (B) AHM as the outgroup; (C) AAA as the outgroup. Graph (A) is the best model given following
criteria: (1) a feasible worst-fitting Z-score (|Z| < 3), (2) the smallest score of likelihood, and (3) without
zero-length internal branch. Therefore, modeled by qpGraph, AHM is phylogenetically closer to AAA than AAN.
We note that the worst-fitting Z-score increases [Z = 3.02 for f4(Tianyuan, Amis; Mlabri, Hmong)] if we do not
model an increasing contribution from the Hòabìnhian lineage to Mlabri than Htin for graph (A).
.CC-BY-NC-ND 4.0 International licenseavailable under anot certified by peer review) is the author/funder, who has granted bioRxiv a license to display the preprint in perpetuity. It is made
The copyright holder for this preprint (which wasthis version posted August 9, 2019. ; https://doi.org/10.1101/730903doi: bioRxiv preprint
21
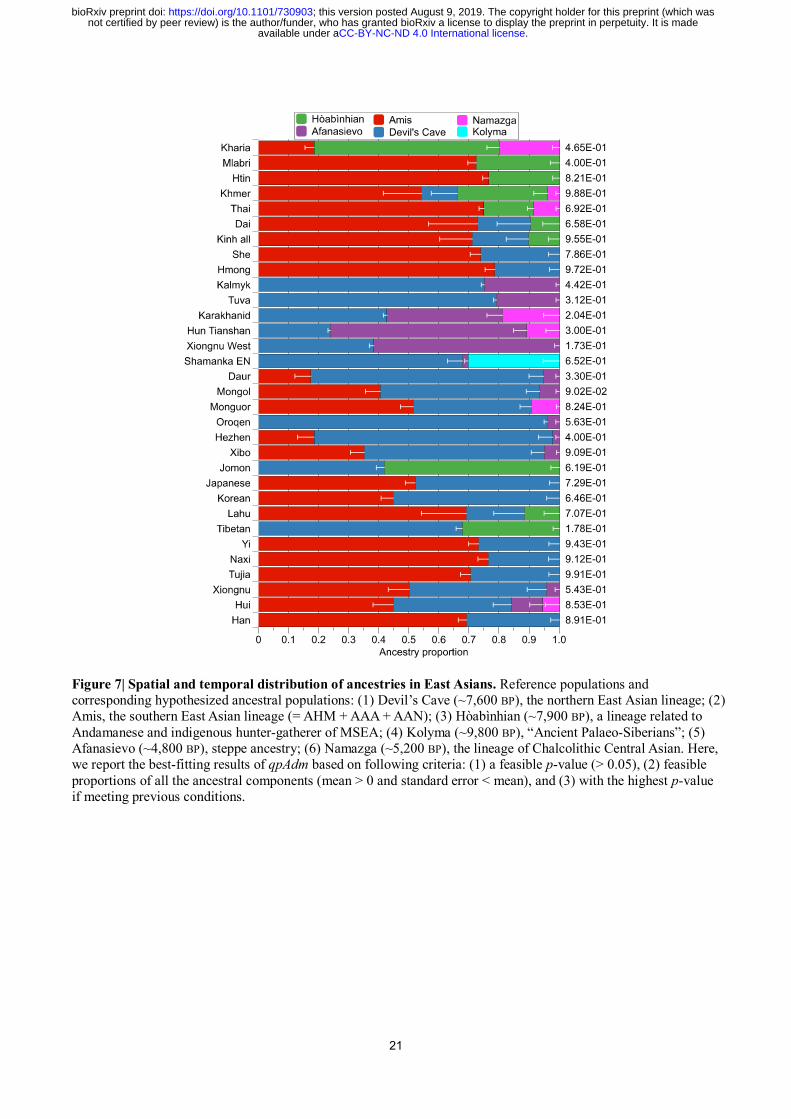
Figure 7| Spatial and temporal distribution of ancestries in East Asians. Reference populations and
corresponding hypothesized ancestral populations: (1) Devil’s Cave (~7,600 BP), the northern East Asian lineage; (2)
Amis, the southern East Asian lineage (= AHM + AAA + AAN); (3) Hòabìnhian (~7,900 BP), a lineage related to
Andamanese and indigenous hunter-gatherer of MSEA; (4) Kolyma (~9,800 BP), “Ancient Palaeo-Siberians”; (5)
Afanasievo (~4,800 BP), steppe ancestry; (6) Namazga (~5,200 BP), the lineage of Chalcolithic Central Asian. Here,
we report the best-fitting results of qpAdm based on following criteria: (1) a feasible p-value (> 0.05), (2) feasible
proportions of all the ancestral components (mean > 0 and standard error < mean), and (3) with the highest p-value
if meeting previous conditions.
.CC-BY-NC-ND 4.0 International licenseavailable under anot certified by peer review) is the author/funder, who has granted bioRxiv a license to display the preprint in perpetuity. It is made
The copyright holder for this preprint (which wasthis version posted August 9, 2019. ; https://doi.org/10.1101/730903doi: bioRxiv preprint
22
Populations
Pahng does not have significant
non-Hmong-Mien ancestry
Hmong has extra
Sino-Tibetan- related ancestry
Mien has both Kra-Dai- and
Hmong-Mien-related ancestries
TujiaS has extra
Hmong-Mien- related ancestry
Han in Hunan has both Sino-Tibetan- and Kra-Dai-related
ancestries
f3(Pahng; Hmong, X)
f3(Hmong; Pahng, X)
f3(Mien; Pahng, X)
f3(Mien; Hmong, X)
f3(TujiaS; TujiaN, X)
f3(Xiang; TujiaN, X)
f3(Gan; TujiaN, X)
f3(Hakka; TujiaN, X)
mean Z-
score mean
Z- score
mean Z-
score mean
Z- score
mean Z-
score mean
Z- score
mean Z-
score mean
Z- score
Xiang 0.01854 16.911 0.00125 2.109 0.00035 0.401 0.00075 1.015 0.00186 1.876 n/a n/a -0.00060 -0.875 -0.00041 -0.689
Gan 0.01825 17.307 0.00128 2.094 0.00044 0.480 0.00071 0.957 0.00117 1.180 -0.00124 -2.264 n/a n/a -0.00154 -2.636
Hakka 0.01906 18.564 -0.00002 -0.043 -0.00017 -0.171 0.00062 0.746 0.00144 1.539 0.00046 0.728 -0.00022 -0.324 n/a n/a
MandarinSW 0.01949 16.510 0.00104 1.544 0.00093 0.876 0.00179 2.202 0.00096 0.911 0.00053 0.827 -0.00016 -0.254 -0.00036 -0.546
Waxiang 0.02084 16.973 -0.00044 -0.759 0.00106 1.060 0.00343 3.930 0.00092 1.051 0.00342 4.520 0.00279 3.246 0.00224 3.571
Tuhua 0.01814 16.581 0.00176 3.265 -0.00026 -0.249 -0.00052 -0.633 0.00019 0.163 -0.00296 -4.489 -0.00270 -3.499 -0.00285 -3.909
BaiH 0.01957 16.032 -0.00002 -0.037 0.00159 1.554 0.00293 3.392 0.00343 3.530 0.00207 2.743 0.00297 4.047 0.00187 3.336
TujiaM 0.01987 17.592 -0.00045 -0.805 0.00023 0.258 0.00159 1.957 0.00264 3.045 0.00315 3.468 0.00326 3.732 0.00230 4.393
TujiaN 0.01991 17.382 -0.00043 -0.606 0.00066 0.663 0.00222 2.675 n/a n/a n/a n/a n/a n/a n/a n/a
TujiaS 0.02031 17.996 0.00027 0.454 0.00263 2.510 0.00375 4.121 n/a n/a 0.00387 4.047 0.00418 4.559 0.00315 5.160
Hmong n/a n/a n/a n/a 0.00132 1.505 n/a n/a -0.00002 -0.019 0.00082 1.334 0.00161 2.280 0.00066 1.374
Pahng n/a n/a n/a n/a n/a n/a 0.00132 1.505 -0.00094 -0.863 -0.00030 -0.426 0.00007 0.083 0.00012 0.164
Mien 0.01813 15.537 0.00172 2.735 n/a n/a n/a n/a 0.00077 0.685 -0.00047 -0.711 -0.00032 -0.436 -0.00051 -0.715
Kam 0.01726 16.128 0.00187 3.255 0.00041 0.444 -0.00024 -0.291 -0.00038 -0.368 -0.00242 -4.433 -0.00220 -2.996 -0.00272 -4.304
Zhuang 0.02046 14.722 -0.00013 -0.157 -0.00243 -1.932 -0.00084 -0.846 0.00177 1.362 -0.00189 -2.360 -0.00040 -0.456 -0.00256 -3.405
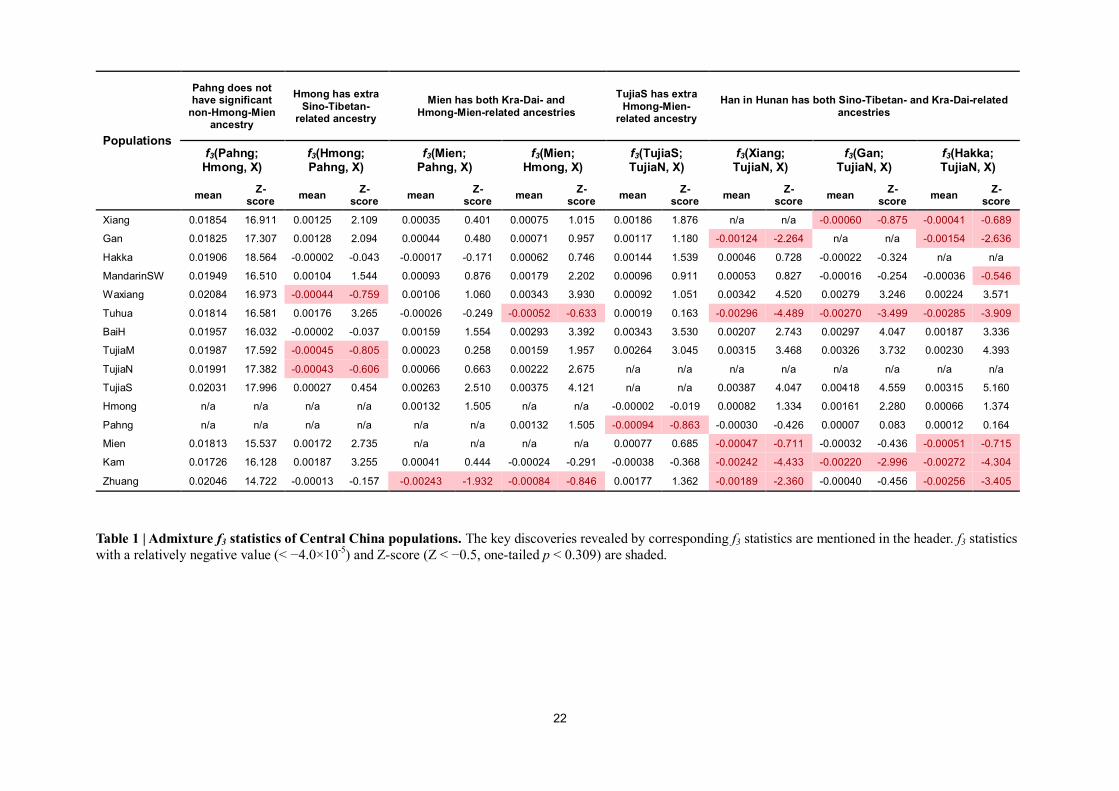
Table 1 | Admixture f3 statistics of Central China populations. The key discoveries revealed by corresponding f3 statistics are mentioned in the header. f3 statistics
with a relatively negative value (< −4.0×10⁻⁵
) and Z-score (Z < −0.5, one-tailed p < 0.309) are shaded.
.CC-BY-NC-ND 4.0 International licenseavailable under anot certified by peer review) is the author/funder, who has granted bioRxiv a license to display the preprint in perpetuity. It is made
The copyright holder for this preprint (which wasthis version posted August 9, 2019. ; https://doi.org/10.1101/730903doi: bioRxiv preprint
23
Categories Populations
D (X, Mbuti;
Hmong, Tǔjia)
D (X, Mbuti;
Hmong, Hàn)
D (X, Mbuti;
Hmong, Shē)
D (X, Mbuti;
Hmong, Dǎi)
D (X, Mbuti;
Hmong, Amis)
Northern East Asia
Ancient
DevilsCave_N -1.222 -2.650 -0.891 6.072 2.989
Shamanka_EN -1.139 -1.170 0.023 7.279 5.465
Lokomotiv_EN -0.243 -0.680 0.401 6.830 4.916
Ust'-Ida_LN -2.159 -2.262 -1.060 5.550 2.721
Shamanka_EBA -1.610 -1.767 -0.558 6.948 3.581
Okunevo_BA -1.035 -1.586 -0.650 3.005 2.269
Xiōngnú -0.167 -1.582 -1.652 4.974 1.621
Xiōngnú_West -0.049 -0.616 0.019 3.319 1.340
Chokhopani -0.119 0.540 -0.229 6.869 4.886
Turkic
Yakut -1.925 -2.163 -1.062 7.832 4.562
Tubalar -1.217 -1.677 -0.403 5.636 4.532
Kyrgyz -2.010 -2.170 -1.224 6.142 4.140
Tuva -2.210 -2.467 -1.259 7.276 3.952
Altai -1.048 -2.341 -0.799 6.118 3.696
Dolgan -1.886 -2.107 -0.599 6.205 3.054
Uyghur -1.654 -1.881 -1.871 4.073 2.554
Uzbek -0.961 -1.533 -0.745 3.580 2.787
Mongolic
Monguor -1.661 -1.152 -1.194 7.569 4.871
Daur -1.348 -1.805 -1.336 7.870 4.578
Kalmyk -2.231 -2.222 -1.247 6.982 3.947
Mongol -2.169 -2.555 -2.672 6.460 3.304
Hazāra -0.427 -1.204 -0.506 4.803 3.426
Tungusic
Hezhen -1.561 -1.968 -1.501 8.084 4.397
Xībó -1.888 -2.120 -1.677 7.016 4.126
Oroqen -1.807 -2.307 -1.691 7.378 4.116
Ulchi -1.838 -2.565 -1.502 7.429 3.598
Even -1.343 -2.450 -0.867 5.763 3.409
Uralic Mansi -1.342 -1.473 -1.062 4.654 2.289
Nganasan -1.409 -2.900 -1.157 7.147 3.431
Tibeto- Burman
Sherpa -0.318 0.006 0.921 7.438 5.681
Tibetan -0.024 0.507 0.329 7.954 7.028
Nàxī -1.222 -0.412 -1.059 6.224 5.054
Yí -0.229 0.699 -0.130 6.873 4.628
Japan & Korea
Japanese -1.668 -2.676 -2.654 5.857 1.359
Korean -1.886 -2.454 -2.289 6.472 2.650
Eastern and Central China
Tǔjiā n/a 1.243 -0.842 5.149 1.663
Hàn -0.915 n/a -2.637 3.693 0.981
Shē 0.257 0.537 n/a 3.069 -0.113
Austronesian
Taiwan Amis -0.019 1.016 -3.040 -3.614 n/a
Atayal -0.529 -0.049 -3.206 -4.252 -21.719
Luzon & Visayas
Phl534 -0.627 0.627 -1.322 -0.214 -5.286
Kankanaey 0.381 1.427 -2.066 -3.016 -22.350
Tagalog -0.238 -0.327 -2.762 -2.669 -15.202
Ilocano 1.220 1.767 -1.631 -1.738 -18.687
Visayan 0.182 1.336 -1.202 -3.034 -17.044
Sumatra & Borneo
Malay 2.008 3.305 -0.288 -4.763 -8.919
Dusun 1.401 2.726 -1.283 -4.454 -16.001
Murut 1.617 2.565 -1.108 -4.711 -17.170
Southwest China & Mainland
Southeast Asia
Ancient
Laos_LN_BA (LA364) 2.992 5.101 0.672 -4.926 -0.642
Laos_BA 3.116 4.087 1.049 -3.434 -1.627
Vietnam_N (Mán Bạc) 2.719 3.928 -0.578 -4.646 -1.283
Thailand_LN_IA (Ban Chiang)
2.137 3.822 1.342 -1.310 0.136
Vietnam_LN 1.678 2.825 -0.220 -3.525 -2.090
Vietnam_BA (Đông Sơn)
1.713 2.482 -0.545 -3.726 -2.932
Vietnam_BA (Núi Nạp) 1.834 1.879 0.636 -1.392 -2.918
Austroasiatic
Htin 3.951 5.650 1.239 -4.880 -0.870
Mlabri 2.020 4.469 1.195 -5.482 -1.497
Khmer 2.087 3.068 -0.292 -4.304 -3.289
Kinh_all 1.273 2.418 -1.334 -2.412 -3.132
Kra-Dai Dǎi 2.466 3.009 -0.795 n/a -3.758
Thai 1.478 2.590 -1.533 -3.869 -3.236
Tibeto- Burman
Burmese 0.346 1.691 -0.292 1.983 2.118
Lāhù 1.525 3.307 0.274 -0.596 0.485
Eastern Siberia Chukotko-
Kamchatkan
Chukchi -1.598 -2.341 -1.125 6.332 3.555
Itelmen -2.329 -2.755 -1.384 5.799 2.955
.CC-BY-NC-ND 4.0 International licenseavailable under anot certified by peer review) is the author/funder, who has granted bioRxiv a license to display the preprint in perpetuity. It is made
The copyright holder for this preprint (which wasthis version posted August 9, 2019. ; https://doi.org/10.1101/730903doi: bioRxiv preprint
24
Koryak -2.540 -2.531 -1.867 6.060 3.581
Yukaghir Yukaghir -1.713 -2.513 -1.249 6.758 3.910
North America
Eskimo- Aleut
Aleut -0.338 -1.485 -0.237 2.992 1.798
Eskimo -2.067 -2.793 -1.776 5.238 3.634
Na-Dene Tlingit -0.261 -0.994 0.312 3.881 2.791
First Americas
Anzick 1.153 0.381 0.114 3.686 2.078
Pima -1.026 -2.173 -1.722 3.924 1.560
Mayan -1.070 -1.880 -1.739 4.807 1.648
Mixe -0.452 -1.488 -1.204 5.097 2.502
Mixtec -0.552 -1.874 -1.448 4.913 1.803
Zapotec -0.892 -1.907 -1.399 4.712 2.180
Quechua -1.124 -2.304 -1.561 3.990 1.619
Karitiâna -0.786 -1.156 -2.063 3.938 1.107
Piapoco -0.049 -1.528 -1.581 3.560 1.260
Surui -0.299 -1.108 -0.789 4.059 1.621
Australasians
Hòabìnhian (LA368) 0.552 0.230 -1.673 -2.048 -2.084
Önge -0.446 -0.139 -0.399 -1.984 -1.556
Australian 0.506 1.068 -1.062 0.507 -1.311
Papuan 0.391 0.804 -0.747 -0.409 -1.088
Ancient East Asians Tiányuán -0.637 -1.206 -0.998 -2.754 -0.683
Jōmon -0.676 -0.104 -0.717 1.263 -3.153
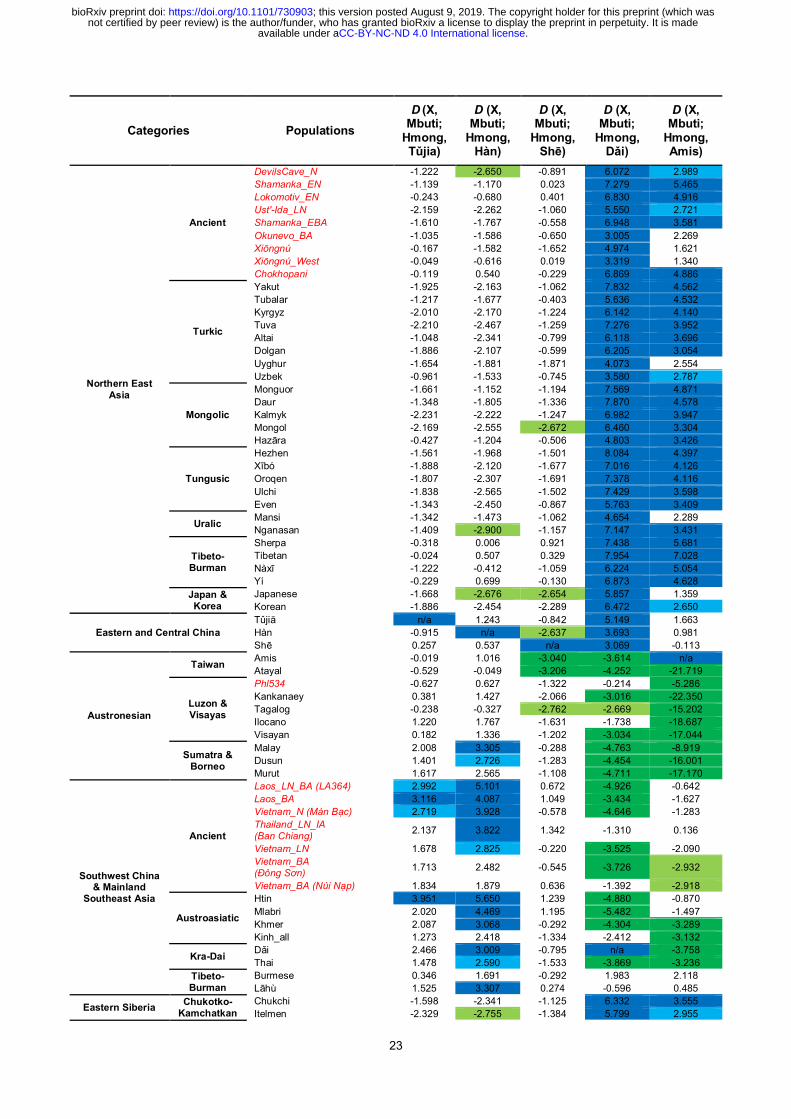
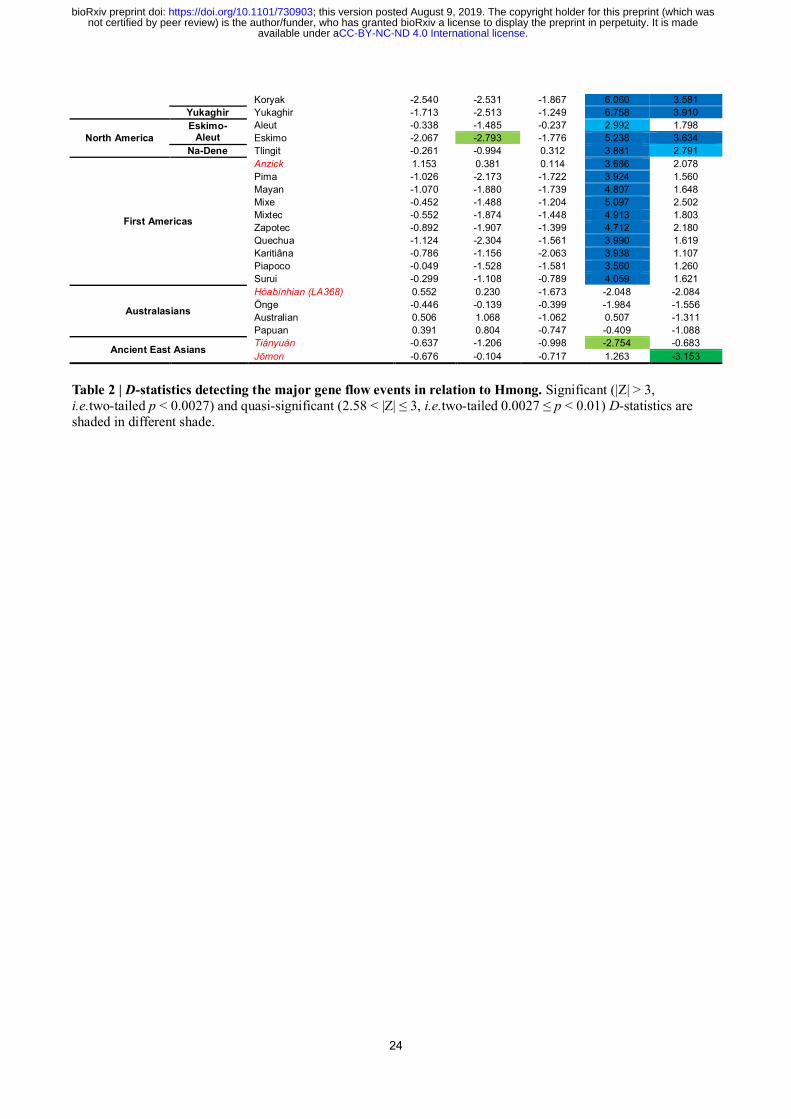
Table 2 | D-statistics detecting the major gene flow events in relation to Hmong. Significant (|Z| > 3,
i.e.two-tailed p < 0.0027) and quasi-significant (2.58 < |Z| ≤ 3, i.e.two-tailed 0.0027 ≤ p < 0.01) D-statistics are
shaded in different shade.
.CC-BY-NC-ND 4.0 International licenseavailable under anot certified by peer review) is the author/funder, who has granted bioRxiv a license to display the preprint in perpetuity. It is made
The copyright holder for this preprint (which wasthis version posted August 9, 2019. ; https://doi.org/10.1101/730903doi: bioRxiv preprint
25
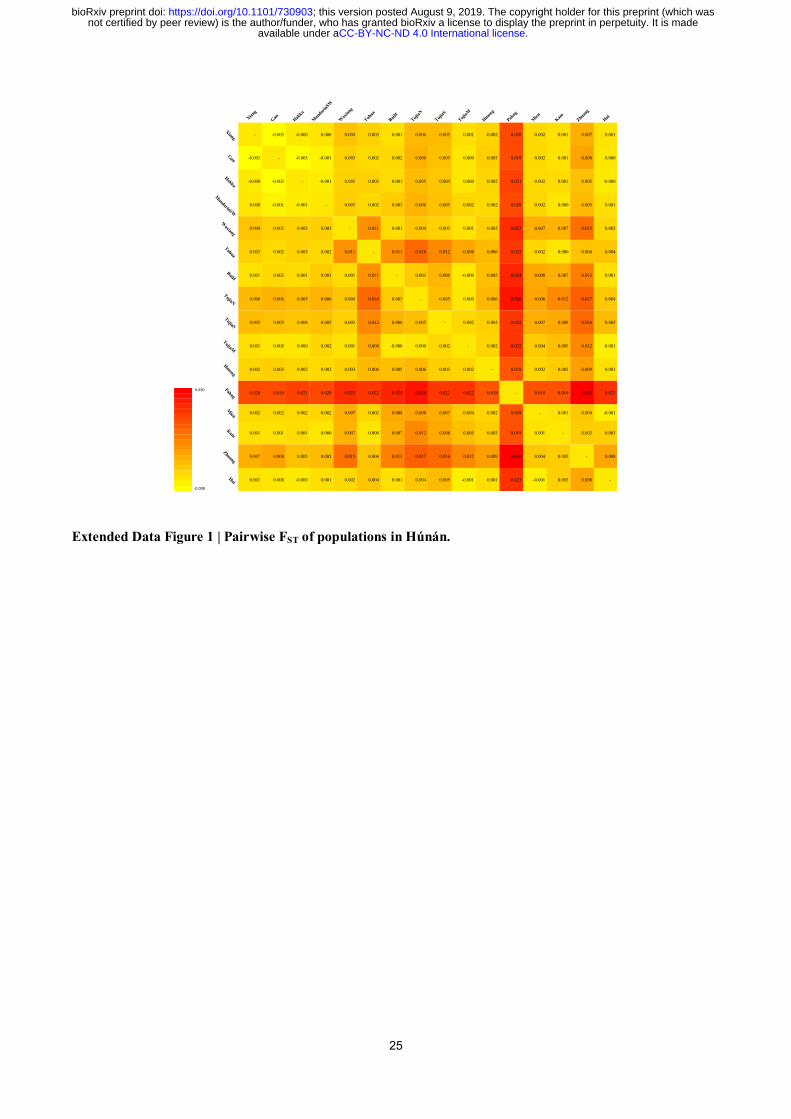
Extended Data Figure 1 | Pairwise FST of populations in Húnán.
0.030
-0.008
Xia
ng
Gan
Hak
ka
Man
darinS
W
Wax
iang
Tuh
ua
Bai
HTuj
iaN
Tuj
iaS
Tuj
iaM
Hm
ong
Pahng
Mien
Kam
Zhu
ang
Hui
Xiang
- -0.003 -0.000 0.000 0.004 0.003 0.001 0.006 0.005 0.001 0.002 0.020 0.002 0.001 0.007 0.001
Gan -0.003 - -0.003 -0.001 0.003 0.002 0.002 0.006 0.005 0.000 0.003 0.019 0.002 0.001 0.008 0.000
Hakka
-0.000 -0.003 - -0.001 0.003 0.003 0.001 0.005 0.004 0.000 0.002 0.021 0.002 0.001 0.005 -0.000
MandarinSW
0.000 -0.001 -0.001 - 0.003 0.002 0.003 0.006 0.005 0.002 0.002 0.020 0.002 0.000 0.005 0.001
Waxiang
0.004 0.003 0.003 0.003 - 0.011 0.001 0.004 0.003 0.001 0.003 0.023 0.007 0.007 0.015 0.002
Tuhua
0.003 0.002 0.003 0.002 0.011 - 0.011 0.016 0.012 0.008 0.006 0.022 0.002 0.000 0.004 0.004
BaiH 0.001 0.002 0.001 0.003 0.001 0.011 - 0.003 0.006 -0.000 0.005 0.024 0.008 0.007 0.013 0.001
TujiaN
0.006 0.006 0.005 0.006 0.004 0.016 0.003 - 0.005 0.000 0.006 0.026 0.008 0.012 0.017 0.004
TujiaS
0.005 0.005 0.004 0.005 0.003 0.012 0.006 0.005 - 0.002 0.003 0.022 0.007 0.008 0.016 0.005
TujiaM
0.001 0.000 0.000 0.002 0.001 0.008 -0.000 0.000 0.002 - 0.002 0.022 0.004 0.005 0.012 -0.001
Hm
ong0.002 0.003 0.002 0.002 0.003 0.006 0.005 0.006 0.003 0.002 - 0.018 0.002 0.003 0.009 0.001
Pahng0.020 0.019 0.021 0.020 0.023 0.022 0.024 0.026 0.022 0.022 0.018 - 0.018 0.019 0.029 0.023
Mien 0.002 0.002 0.002 0.002 0.007 0.002 0.008 0.008 0.007 0.004 0.002 0.018 - 0.001 0.004 -0.001
Kam 0.001 0.001 0.001 0.000 0.007 0.000 0.007 0.012 0.008 0.005 0.003 0.019 0.001 - 0.003 0.003
Zhuang
0.007 0.008 0.005 0.005 0.015 0.004 0.013 0.017 0.016 0.012 0.009 0.029 0.004 0.003 - 0.008
Hui 0.001 0.000 -0.000 0.001 0.002 0.004 0.001 0.004 0.005 -0.001 0.001 0.023 -0.001 0.003 0.008 -
.CC-BY-NC-ND 4.0 International licenseavailable under anot certified by peer review) is the author/funder, who has granted bioRxiv a license to display the preprint in perpetuity. It is made
The copyright holder for this preprint (which wasthis version posted August 9, 2019. ; https://doi.org/10.1101/730903doi: bioRxiv preprint
26
(A)
(B)
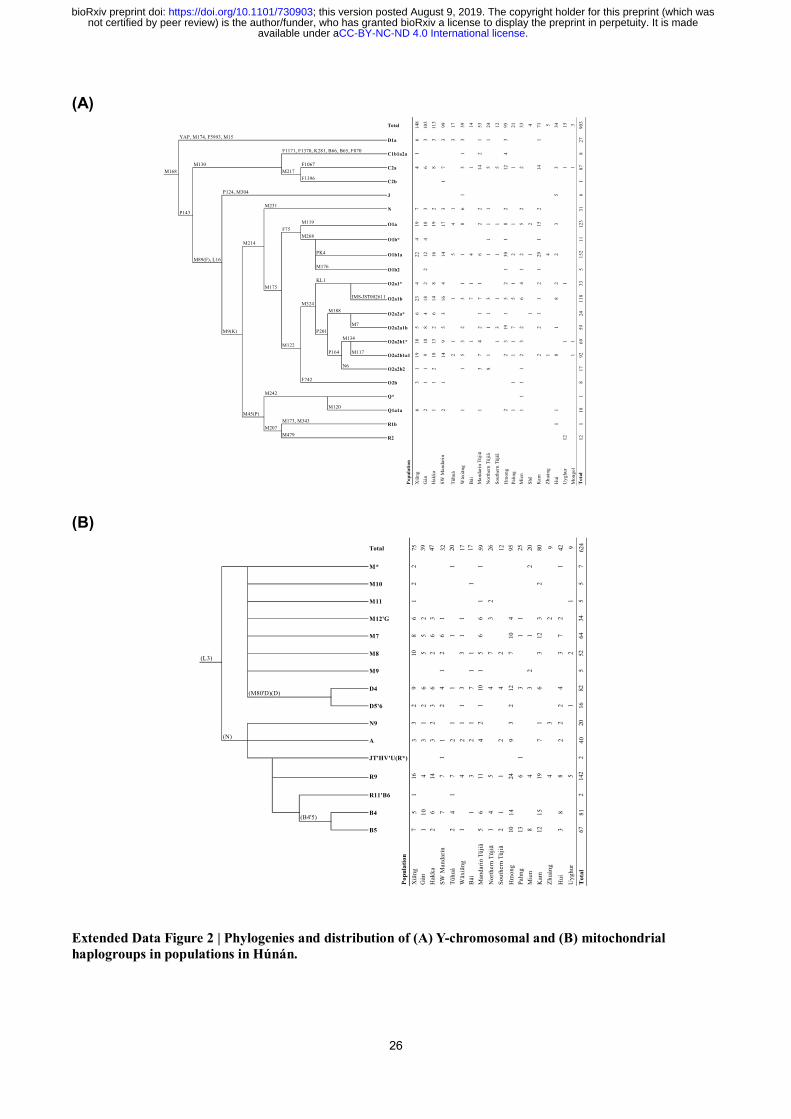
Extended Data Figure 2 | Phylogenies and distribution of (A) Y-chromosomal and (B) mitochondrial
haplogroups in populations in Húnán.
YAP, M174, F5993, M15
F1171, F1370, K281, B66, B65, F870
M130 F1067
M168 M217
F1396
P124, M304
M231
P143
M119
F75
M268
M214
PK4
M89(F), L16
M176
KL1
M175
IMS-JST002611
M324
M188
M7
M9(K) P201
M134
M122
P164 M117
N6
F742
M242
M120
M45(P)
M173, M343
M207
M479
Population
Xiā
ng
Gàn
Hak
ka
SW
Man
dari
n
Tǔ
hu
à
Wǎx
iān
g
Bái
Man
dari
nTǔ
jiā
No
rth
ern
Tǔ
jiā
So
uth
ern
Tǔ
jiā
Hm
on
g
Pah
ng
Mie
n
Sh
ē
Kam
Zh
uàn
g
Hu
í
Uy
gh
ur
Mo
ng
ol
To
tal
12
12
1
R2
18
R1b
1 1 11 1 2Q1a1a 6
1
2 1 2
11
8
Q*
17
O2b 3 1 1 1
13 8
7 1
1 1
O2a2b1a1 19 9 18
14 2
O2a2b2 1 1 2 1
1 2 2 15
1 691 3 1 3
2 1 928
59
O2a2b1* 18
10
13 9 1 3 1 4
2 12 1 3 19 7 2
1
1 11 1 1
O2a2a1b 5 8 2 5 2
118
O2a2a* 6 4 6 3
5 6 1 83 7 7 3 1 5O2a1b 23
24
18
14
16 1
2 2 1 332 1 4
5
O2a1* 4 2 8 4 1 1 1
1
152
O1b2 2
2 1 29 4 24 6 1
1
1 1
O1b* 4 4
15
1 30 2O1b1a 22
12
16
14 5 1
1
123
1 1 8 1 5 2
1 11
31
O1a 19
18
19
17 4 8 2
22 1 2 2
35
N 7 3 2 3 1 6
1
J 1
C2b
6
1
14 3 1 1 875 5 12 1 2
8
C2a 4 6 8 7 3 1 14
2 4
27
C1b1a2a 1 1
11 1D1a 6 3 3 3 3 3
21
33
39
14
53
24
12
95Total 148
103
113
99
17
3
15 3
903
4 71 5 34
Total 75
39
47
32
20
17
17
59
26
12
95
25
20
80 9 42 9
624
(L3)
(M80'D)(D)
(N)
(B4'5)
Population
Xiā
ng
Gàn
Hak
ka
SW
Man
dari
n
Tǔ
hu
à
Wǎx
iān
g
Bái
Man
dari
nTǔ
jiā
No
rth
ern
Tǔ
jiā
So
uth
ern
Tǔ
jiā
Hm
on
g
Pah
ng
Mie
n
Kam
Zh
uàn
g
Hu
í
Uy
gh
ur
To
tal
1 7M10 2 1
2 11M* 2
5
M11 1
2
5
M12'G 6 2 3 1 1 6
11 2
2 2 34
M7 8 5 6 6 1
3 4 1 3
641 1 12 71 6 10
3 2 5231 5
M9 1
7 2 7M8 10 5 2 2 3
5
D4 9 6 6 4 1 3 7 10
21 1
4 82
D5'6 2 2 3 2
4 4 12 3 3 6
162 11 1
N9 3 1 2 1 1 1 2
2
3 2 20
A 3 3 3 1 2
3 1
407
JT'HV'U(R*) 1
22 2 4 2 9
2
R9 16 4 14 7 7
1
142
6 4 19 4 8 54 3 11 5
R11'B6 1 1
1 24
2
B4 5 10 6 7 4 81
15 81 6 4 1 14
31 5 671 2 10
13 8 12B5 7 1 2 2
.CC-BY-NC-ND 4.0 International licenseavailable under anot certified by peer review) is the author/funder, who has granted bioRxiv a license to display the preprint in perpetuity. It is made
The copyright holder for this preprint (which wasthis version posted August 9, 2019. ; https://doi.org/10.1101/730903doi: bioRxiv preprint
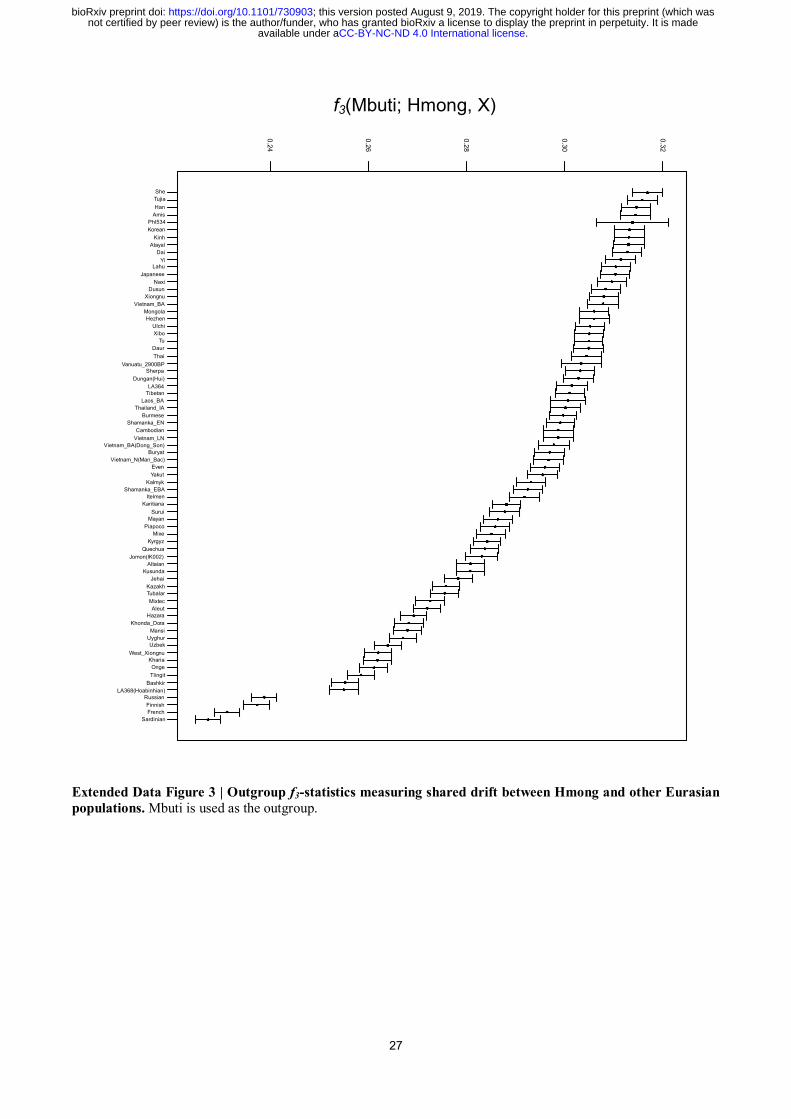
27
f3(Mbuti; Hmong, X)
Extended Data Figure 3 | Outgroup f3-statistics measuring shared drift between Hmong and other Eurasian
populations. Mbuti is used as the outgroup.
••
••
••
••
••
••
••
••
••
••
••
••
••
••
••
••
••
••
••
•
••
•
••
••
••
••
••
•
••
••
••
••
•
••
•
•
••
••
•
•
0.2
4
0.2
6
0.2
8
0.3
0
0.3
2
f3(Mbuti; Hmong, X)
She
Tujia
Han
Amis
Phl534
Korean
Kinh
Atayal
Dai
YiLahu
Japanese
Naxi
Dusun
Xiongnu
Vietnam_BA
Mongola
Hezhen
Ulchi
Xibo
Tu
Daur
Thai
Vanuatu_2900BP
Sherpa
Dungan(Hui)
LA364
Tibetan
Laos_BA
Thailand_IA
Burmese
Shamanka_EN
Cambodian
Vietnam_LN
Vietnam_BA(Dong_Son)
Buryat
Vietnam_N(Man_Bac)
Even
Yakut
Kalmyk
Shamanka_EBA
Itelmen
Karitiana
Surui
Mayan
Piapoco
Mixe
Kyrgyz
Quechua
Jomon(IK002)
Altaian
Kusunda
Jehai
Kazakh
Tubalar
Mixtec
Aleut
Hazara
Khonda_Dora
Mansi
Uyghur
Uzbek
West_Xiongnu
Kharia
Onge
Tlingit
Bashkir
LA368(Hoabinhian)
Russian
Finnish
French
Sardinian
.CC-BY-NC-ND 4.0 International licenseavailable under anot certified by peer review) is the author/funder, who has granted bioRxiv a license to display the preprint in perpetuity. It is made
The copyright holder for this preprint (which wasthis version posted August 9, 2019. ; https://doi.org/10.1101/730903doi: bioRxiv preprint
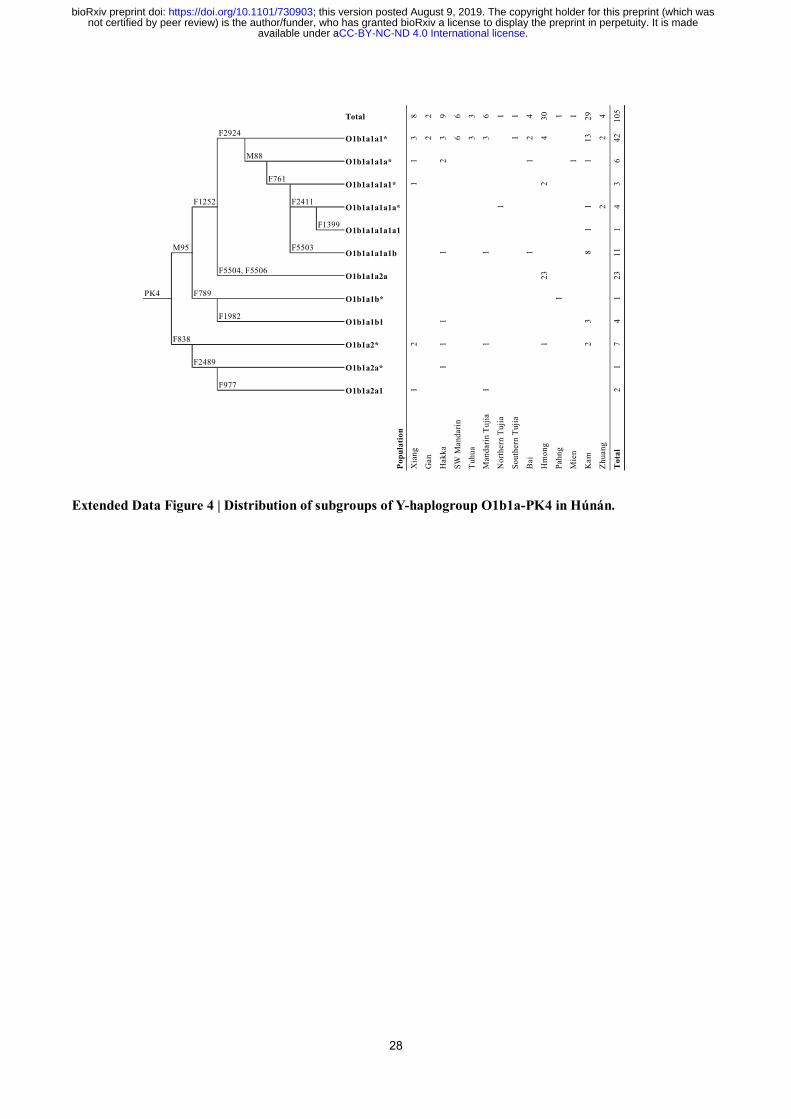
28
Extended Data Figure 4 | Distribution of subgroups of Y-haplogroup O1b1a-PK4 in Húnán.
(F)Total 8 2 9 6 3 6 1 1 4 3
0 1 1 29 4
10
5
F2924
M88
F761
F1252 F2411
F1399
M95 F5503
F5504, F5506
PK4 F789
F1982
F838
F2489
F977
Po
pu
lati
on
Xia
ng
Gan
Hak
ka
SW
Man
dari
n
Tu
hu
a
Man
dari
nT
uji
a
No
rth
ern
Tu
jia
So
uth
ern
Tu
jia
Bai
Hm
on
g
Pah
ng
Mie
n
Kam
Zh
uan
g
To
tal
13 2 42
O1b1a1a1a* 1 2
3 1 2 4O1b1a1a1* 3 2 3 6 3
1 1 6
O1b1a1a1a1* 1
1
3
O1b1a1a1a1a*
2
1 2 4
O1b1a1a1a1a1
1
1 1
O1b1a1a1a1b 1 8 11
O1b1a1a2a
1 1
23
O1b1a1b*
23
1
O1b1a1b1 1
1
3 4
O1b1a2* 2 1 2 7
O1b1a2a* 1
1 1
1
O1b1a2a1 1 21
.CC-BY-NC-ND 4.0 International licenseavailable under anot certified by peer review) is the author/funder, who has granted bioRxiv a license to display the preprint in perpetuity. It is made
The copyright holder for this preprint (which wasthis version posted August 9, 2019. ; https://doi.org/10.1101/730903doi: bioRxiv preprint
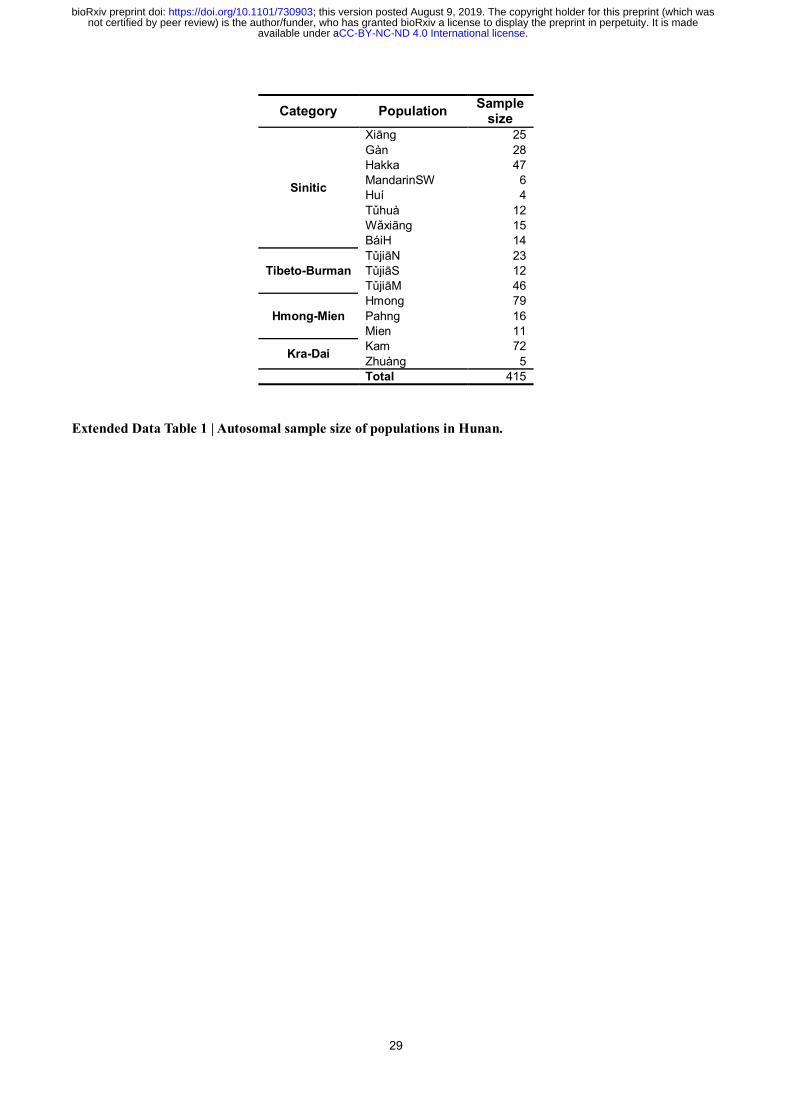
29
Category Population Sample
size
Sinitic
Xiāng 25
Gàn 28
Hakka 47
MandarinSW 6
Huí 4
Tǔhuà 12
Wǎxiāng 15
BáiH 14
Tibeto-Burman
TǔjiāN 23
TǔjiāS 12
TǔjiāM 46
Hmong-Mien
Hmong 79
Pahng 16
Mien 11
Kra-Dai Kam 72
Zhuàng 5
Total 415
Extended Data Table 1 | Autosomal sample size of populations in Hunan.
.CC-BY-NC-ND 4.0 International licenseavailable under anot certified by peer review) is the author/funder, who has granted bioRxiv a license to display the preprint in perpetuity. It is made
The copyright holder for this preprint (which wasthis version posted August 9, 2019. ; https://doi.org/10.1101/730903doi: bioRxiv preprint
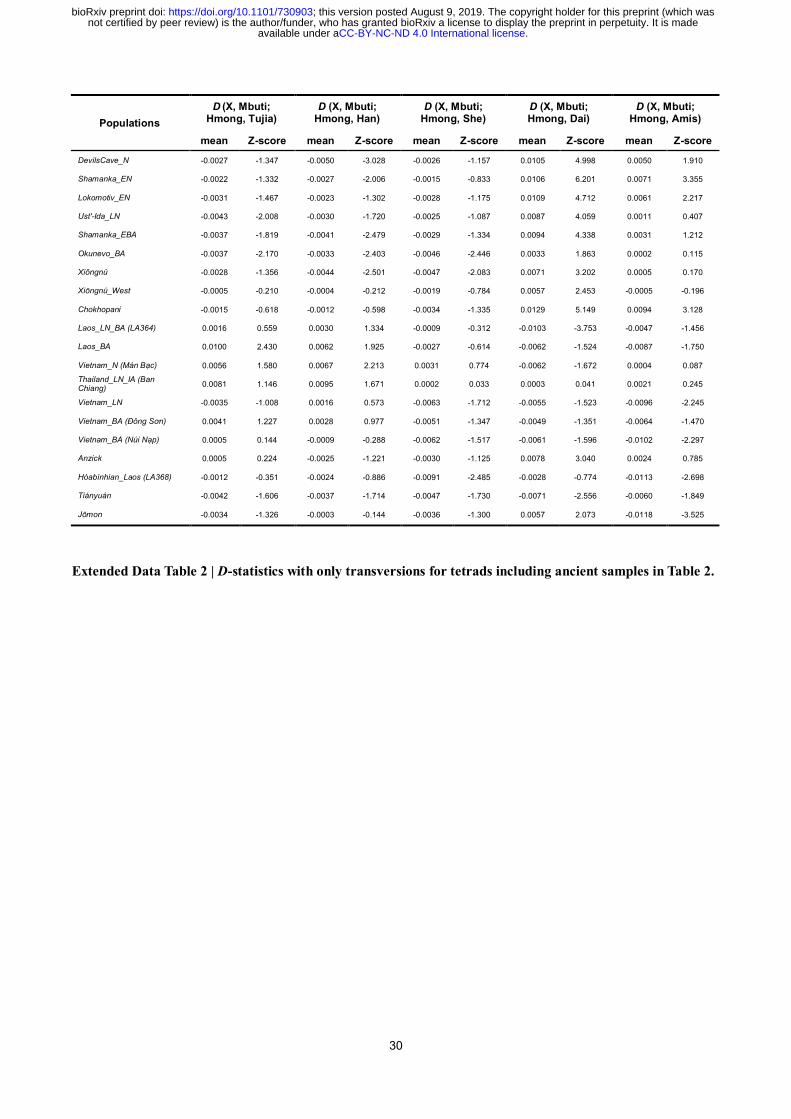
30
Populations
D (X, Mbuti; Hmong, Tujia)
D (X, Mbuti; Hmong, Han)
D (X, Mbuti; Hmong, She)
D (X, Mbuti; Hmong, Dai)
D (X, Mbuti; Hmong, Amis)
mean Z-score mean Z-score mean Z-score mean Z-score mean Z-score
DevilsCave_N -0.0027 -1.347 -0.0050 -3.028 -0.0026 -1.157 0.0105 4.998 0.0050 1.910
Shamanka_EN -0.0022 -1.332 -0.0027 -2.006 -0.0015 -0.833 0.0106 6.201 0.0071 3.355
Lokomotiv_EN -0.0031 -1.467 -0.0023 -1.302 -0.0028 -1.175 0.0109 4.712 0.0061 2.217
Ust'-Ida_LN -0.0043 -2.008 -0.0030 -1.720 -0.0025 -1.087 0.0087 4.059 0.0011 0.407
Shamanka_EBA -0.0037 -1.819 -0.0041 -2.479 -0.0029 -1.334 0.0094 4.338 0.0031 1.212
Okunevo_BA -0.0037 -2.170 -0.0033 -2.403 -0.0046 -2.446 0.0033 1.863 0.0002 0.115
Xiōngnú -0.0028 -1.356 -0.0044 -2.501 -0.0047 -2.083 0.0071 3.202 0.0005 0.170
Xiōngnú_West -0.0005 -0.210 -0.0004 -0.212 -0.0019 -0.784 0.0057 2.453 -0.0005 -0.196
Chokhopani -0.0015 -0.618 -0.0012 -0.598 -0.0034 -1.335 0.0129 5.149 0.0094 3.128
Laos_LN_BA (LA364) 0.0016 0.559 0.0030 1.334 -0.0009 -0.312 -0.0103 -3.753 -0.0047 -1.456
Laos_BA 0.0100 2.430 0.0062 1.925 -0.0027 -0.614 -0.0062 -1.524 -0.0087 -1.750
Vietnam_N (Mán Bạc) 0.0056 1.580 0.0067 2.213 0.0031 0.774 -0.0062 -1.672 0.0004 0.087
Thailand_LN_IA (Ban Chiang)
0.0081 1.146 0.0095 1.671 0.0002 0.033 0.0003 0.041 0.0021 0.245
Vietnam_LN -0.0035 -1.008 0.0016 0.573 -0.0063 -1.712 -0.0055 -1.523 -0.0096 -2.245
Vietnam_BA (Đông Sơn) 0.0041 1.227 0.0028 0.977 -0.0051 -1.347 -0.0049 -1.351 -0.0064 -1.470
Vietnam_BA (Núi Nạp) 0.0005 0.144 -0.0009 -0.288 -0.0062 -1.517 -0.0061 -1.596 -0.0102 -2.297
Anzick 0.0005 0.224 -0.0025 -1.221 -0.0030 -1.125 0.0078 3.040 0.0024 0.785
Hòabìnhian_Laos (LA368) -0.0012 -0.351 -0.0024 -0.886 -0.0091 -2.485 -0.0028 -0.774 -0.0113 -2.698
Tiányuán -0.0042 -1.606 -0.0037 -1.714 -0.0047 -1.730 -0.0071 -2.556 -0.0060 -1.849
Jōmon -0.0034 -1.326 -0.0003 -0.144 -0.0036 -1.300 0.0057 2.073 -0.0118 -3.525
Extended Data Table 2 | D-statistics with only transversions for tetrads including ancient samples in Table 2.
.CC-BY-NC-ND 4.0 International licenseavailable under anot certified by peer review) is the author/funder, who has granted bioRxiv a license to display the preprint in perpetuity. It is made
The copyright holder for this preprint (which wasthis version posted August 9, 2019. ; https://doi.org/10.1101/730903doi: bioRxiv preprint
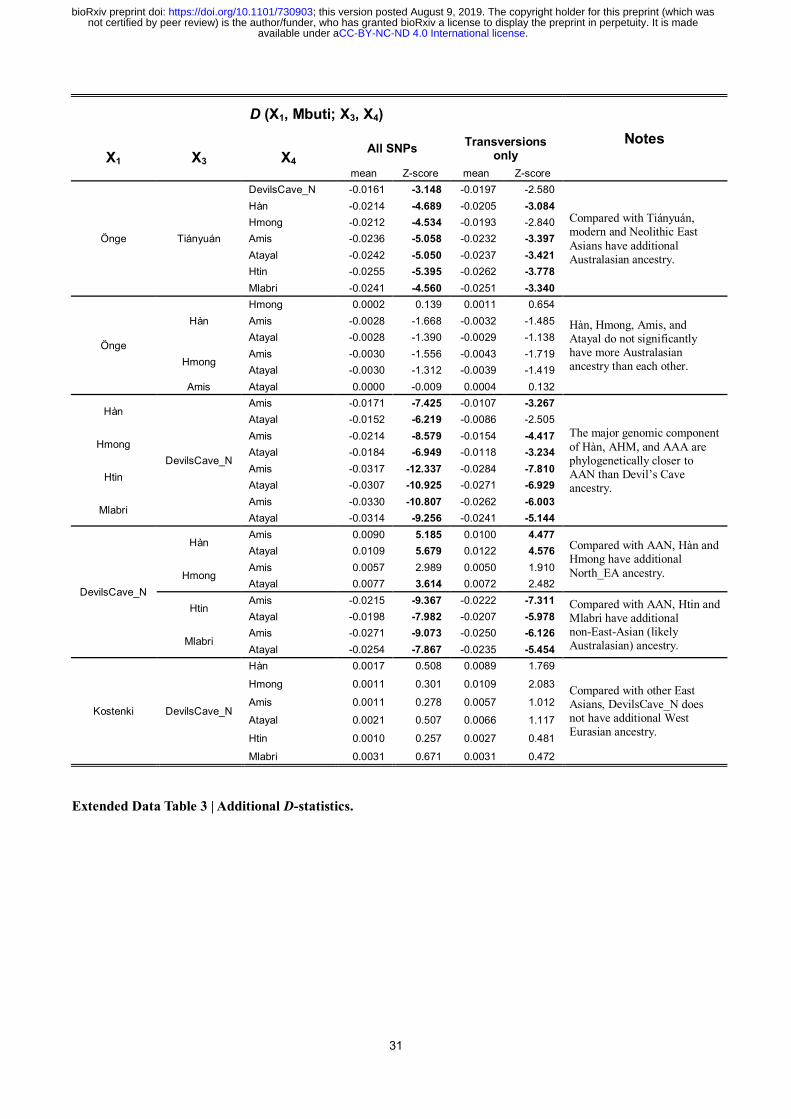
31
D (X1, Mbuti; X3, X4)
Notes
X1 X3 X4 All SNPs
Transversions only
mean Z-score mean Z-score
Önge Tiányuán
DevilsCave_N -0.0161 -3.148 -0.0197 -2.580
Compared with Tiányuán, modern and Neolithic East
Asians have additional Australasian ancestry.
Hàn -0.0214 -4.689 -0.0205 -3.084
Hmong -0.0212 -4.534 -0.0193 -2.840
Amis -0.0236 -5.058 -0.0232 -3.397
Atayal -0.0242 -5.050 -0.0237 -3.421
Htin -0.0255 -5.395 -0.0262 -3.778
Mlabri -0.0241 -4.560 -0.0251 -3.340
Önge
Hàn
Hmong 0.0002 0.139 0.0011 0.654
Hàn, Hmong, Amis, and Atayal do not significantly have more Australasian ancestry than each other.
Amis -0.0028 -1.668 -0.0032 -1.485
Atayal -0.0028 -1.390 -0.0029 -1.138
Hmong Amis -0.0030 -1.556 -0.0043 -1.719
Atayal -0.0030 -1.312 -0.0039 -1.419
Amis Atayal 0.0000 -0.009 0.0004 0.132
Hàn
DevilsCave_N
Amis -0.0171 -7.425 -0.0107 -3.267
The major genomic component
of Hàn, AHM, and AAA are phylogenetically closer to AAN than Devil’s Cave ancestry.
Atayal -0.0152 -6.219 -0.0086 -2.505
Hmong Amis -0.0214 -8.579 -0.0154 -4.417
Atayal -0.0184 -6.949 -0.0118 -3.234
Htin Amis -0.0317 -12.337 -0.0284 -7.810
Atayal -0.0307 -10.925 -0.0271 -6.929
Mlabri Amis -0.0330 -10.807 -0.0262 -6.003
Atayal -0.0314 -9.256 -0.0241 -5.144
DevilsCave_N
Hàn Amis 0.0090 5.185 0.0100 4.477
Compared with AAN, Hàn and Hmong have additional
North_EA ancestry.
Atayal 0.0109 5.679 0.0122 4.576
Hmong Amis 0.0057 2.989 0.0050 1.910
Atayal 0.0077 3.614 0.0072 2.482
Htin Amis -0.0215 -9.367 -0.0222 -7.311 Compared with AAN, Htin and
Mlabri have additional non-East-Asian (likely Australasian) ancestry.
Atayal -0.0198 -7.982 -0.0207 -5.978
Mlabri Amis -0.0271 -9.073 -0.0250 -6.126
Atayal -0.0254 -7.867 -0.0235 -5.454
Kostenki DevilsCave_N
Hàn 0.0017 0.508 0.0089 1.769
Compared with other East Asians, DevilsCave_N does not have additional West Eurasian ancestry.
Hmong 0.0011 0.301 0.0109 2.083
Amis 0.0011 0.278 0.0057 1.012
Atayal 0.0021 0.507 0.0066 1.117
Htin 0.0010 0.257 0.0027 0.481
Mlabri 0.0031 0.671 0.0031 0.472
Extended Data Table 3 | Additional D-statistics.
.CC-BY-NC-ND 4.0 International licenseavailable under anot certified by peer review) is the author/funder, who has granted bioRxiv a license to display the preprint in perpetuity. It is made
The copyright holder for this preprint (which wasthis version posted August 9, 2019. ; https://doi.org/10.1101/730903doi: bioRxiv preprint
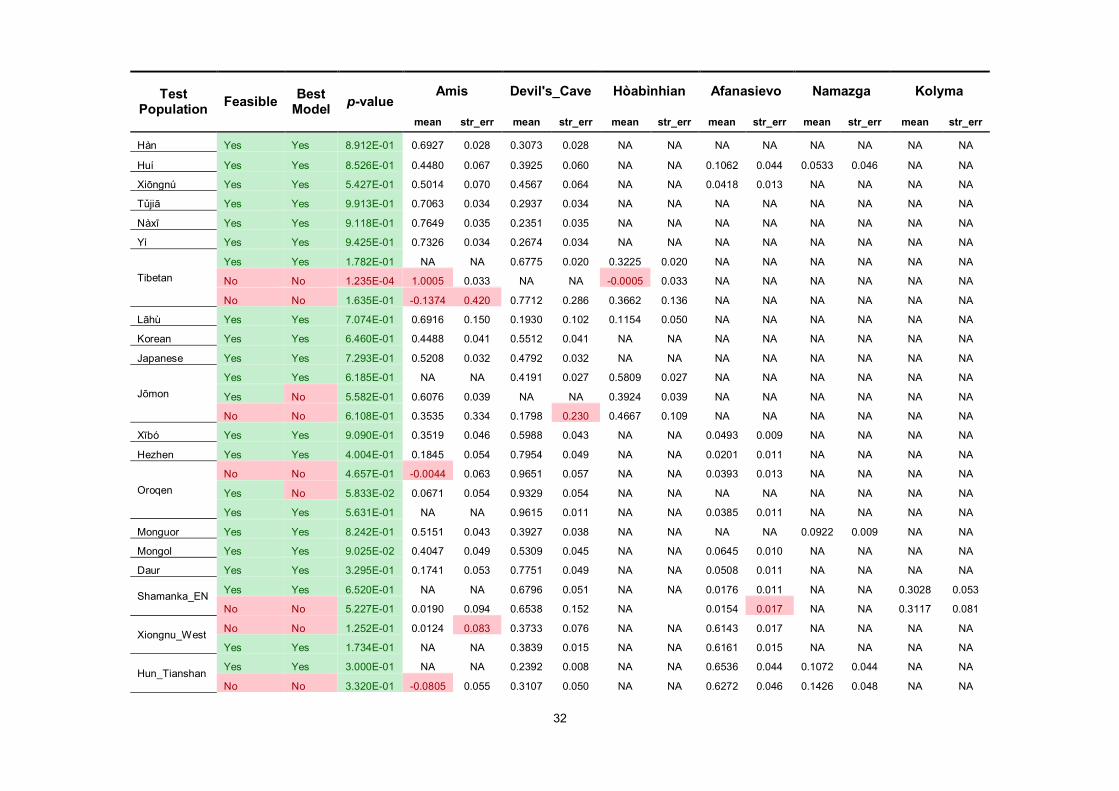
32
Test Population
Feasible Best
Model p-value
Amis Devil's_Cave Hòabìnhian Afanasievo Namazga Kolyma
mean str_err mean str_err mean str_err mean str_err mean str_err mean str_err
Hàn Yes Yes 8.912E-01 0.6927 0.028 0.3073 0.028 NA NA NA NA NA NA NA NA
Huí Yes Yes 8.526E-01 0.4480 0.067 0.3925 0.060 NA NA 0.1062 0.044 0.0533 0.046 NA NA
Xiōngnú Yes Yes 5.427E-01 0.5014 0.070 0.4567 0.064 NA NA 0.0418 0.013 NA NA NA NA
Tǔjiā Yes Yes 9.913E-01 0.7063 0.034 0.2937 0.034 NA NA NA NA NA NA NA NA
Nàxī Yes Yes 9.118E-01 0.7649 0.035 0.2351 0.035 NA NA NA NA NA NA NA NA
Yí Yes Yes 9.425E-01 0.7326 0.034 0.2674 0.034 NA NA NA NA NA NA NA NA
Tibetan
Yes Yes 1.782E-01 NA NA 0.6775 0.020 0.3225 0.020 NA NA NA NA NA NA
No No 1.235E-04 1.0005 0.033 NA NA -0.0005 0.033 NA NA NA NA NA NA
No No 1.635E-01 -0.1374 0.420 0.7712 0.286 0.3662 0.136 NA NA NA NA NA NA
Lāhù Yes Yes 7.074E-01 0.6916 0.150 0.1930 0.102 0.1154 0.050 NA NA NA NA NA NA
Korean Yes Yes 6.460E-01 0.4488 0.041 0.5512 0.041 NA NA NA NA NA NA NA NA
Japanese Yes Yes 7.293E-01 0.5208 0.032 0.4792 0.032 NA NA NA NA NA NA NA NA
Jōmon
Yes Yes 6.185E-01 NA NA 0.4191 0.027 0.5809 0.027 NA NA NA NA NA NA
Yes No 5.582E-01 0.6076 0.039 NA NA 0.3924 0.039 NA NA NA NA NA NA
No No 6.108E-01 0.3535 0.334 0.1798 0.230 0.4667 0.109 NA NA NA NA NA NA
Xībó Yes Yes 9.090E-01 0.3519 0.046 0.5988 0.043 NA NA 0.0493 0.009 NA NA NA NA
Hezhen Yes Yes 4.004E-01 0.1845 0.054 0.7954 0.049 NA NA 0.0201 0.011 NA NA NA NA
Oroqen
No No 4.657E-01 -0.0044 0.063 0.9651 0.057 NA NA 0.0393 0.013 NA NA NA NA
Yes No 5.833E-02 0.0671 0.054 0.9329 0.054 NA NA NA NA NA NA NA NA
Yes Yes 5.631E-01 NA NA 0.9615 0.011 NA NA 0.0385 0.011 NA NA NA NA
Monguor Yes Yes 8.242E-01 0.5151 0.043 0.3927 0.038 NA NA NA NA 0.0922 0.009 NA NA
Mongol Yes Yes 9.025E-02 0.4047 0.049 0.5309 0.045 NA NA 0.0645 0.010 NA NA NA NA
Daur Yes Yes 3.295E-01 0.1741 0.053 0.7751 0.049 NA NA 0.0508 0.011 NA NA NA NA
Shamanka_EN Yes Yes 6.520E-01 NA NA 0.6796 0.051 NA NA 0.0176 0.011 NA NA 0.3028 0.053
No No 5.227E-01 0.0190 0.094 0.6538 0.152 NA
0.0154 0.017 NA NA 0.3117 0.081
Xiongnu_West No No 1.252E-01 0.0124 0.083 0.3733 0.076 NA NA 0.6143 0.017 NA NA NA NA
Yes Yes 1.734E-01 NA NA 0.3839 0.015 NA NA 0.6161 0.015 NA NA NA NA
Hun_Tianshan Yes Yes 3.000E-01 NA NA 0.2392 0.008 NA NA 0.6536 0.044 0.1072 0.044 NA NA
No No 3.320E-01 -0.0805 0.055 0.3107 0.050 NA NA 0.6272 0.046 0.1426 0.048 NA NA
.CC-BY-NC-ND 4.0 International licenseavailable under anot certified by peer review) is the author/funder, who has granted bioRxiv a license to display the preprint in perpetuity. It is made
The copyright holder for this preprint (which wasthis version posted August 9, 2019. ; https://doi.org/10.1101/730903doi: bioRxiv preprint
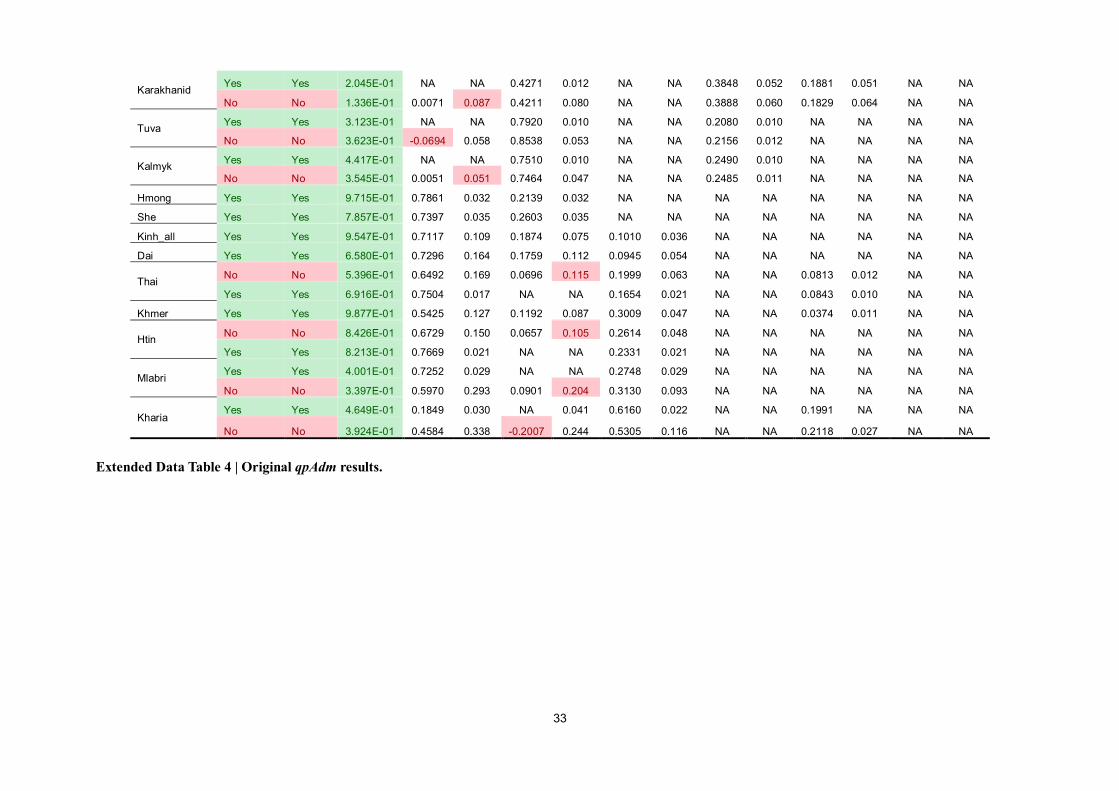
33
Karakhanid Yes Yes 2.045E-01 NA NA 0.4271 0.012 NA NA 0.3848 0.052 0.1881 0.051 NA NA
No No 1.336E-01 0.0071 0.087 0.4211 0.080 NA NA 0.3888 0.060 0.1829 0.064 NA NA
Tuva
Yes Yes 3.123E-01 NA NA 0.7920 0.010 NA NA 0.2080 0.010 NA NA NA NA
No No 3.623E-01 -0.0694 0.058 0.8538 0.053 NA NA 0.2156 0.012 NA NA NA NA
Kalmyk
Yes Yes 4.417E-01 NA NA 0.7510 0.010 NA NA 0.2490 0.010 NA NA NA NA
No No 3.545E-01 0.0051 0.051 0.7464 0.047 NA NA 0.2485 0.011 NA NA NA NA
Hmong Yes Yes 9.715E-01 0.7861 0.032 0.2139 0.032 NA NA NA NA NA NA NA NA
She Yes Yes 7.857E-01 0.7397 0.035 0.2603 0.035 NA NA NA NA NA NA NA NA
Kinh_all Yes Yes 9.547E-01 0.7117 0.109 0.1874 0.075 0.1010 0.036 NA NA NA NA NA NA
Dai Yes Yes 6.580E-01 0.7296 0.164 0.1759 0.112 0.0945 0.054 NA NA NA NA NA NA
Thai No No 5.396E-01 0.6492 0.169 0.0696 0.115 0.1999 0.063 NA NA 0.0813 0.012 NA NA
Yes Yes 6.916E-01 0.7504 0.017 NA NA 0.1654 0.021 NA NA 0.0843 0.010 NA NA
Khmer Yes Yes 9.877E-01 0.5425 0.127 0.1192 0.087 0.3009 0.047 NA NA 0.0374 0.011 NA NA
Htin No No 8.426E-01 0.6729 0.150 0.0657 0.105 0.2614 0.048 NA NA NA NA NA NA
Yes Yes 8.213E-01 0.7669 0.021 NA NA 0.2331 0.021 NA NA NA NA NA NA
Mlabri Yes Yes 4.001E-01 0.7252 0.029 NA NA 0.2748 0.029 NA NA NA NA NA NA
No No 3.397E-01 0.5970 0.293 0.0901 0.204 0.3130 0.093 NA NA NA NA NA NA
Kharia Yes Yes 4.649E-01 0.1849 0.030 NA 0.041 0.6160 0.022 NA NA 0.1991 NA NA NA
No No 3.924E-01 0.4584 0.338 -0.2007 0.244 0.5305 0.116 NA NA 0.2118 0.027 NA NA
Extended Data Table 4 | Original qpAdm results.
.CC-BY-NC-ND 4.0 International licenseavailable under anot certified by peer review) is the author/funder, who has granted bioRxiv a license to display the preprint in perpetuity. It is made
The copyright holder for this preprint (which wasthis version posted August 9, 2019. ; https://doi.org/10.1101/730903doi: bioRxiv preprint