Embed Size (px)
Citation preview
Innovation Premium and the Survival of Entrepreneurial
Firms∗
Elena Cefisa University of Bergamo and Utrecht School of Economics, Utrecht University
Orietta Marsilib
Rotterdam School of Management, Erasmus University
October 2005
Abstract:
This paper examines the difference in survival probability between innovators and non-innovators (the ‘innovation premium’), for different types of firms and technological environments. In particular, we compared the innovation premiums for high-tech and low-tech manufacturing to discover whether innovation plays a different role as a strategy for survival depending on the technological environment. In addition, we analysed whether different patterns emerge when we contrast entrepreneurial firms and established firms. We estimated survival probabilities with an approach based on TPM, using data from the Business Register of the population of manufacturing firms in the Netherlands and the CIS-2. Among established firms, the highest premium in survival (whether an innovator or not) lies in being active in a high-tech sector. Thus, to increase survival probability, innovation must be complemented by firm specific organisational and commercial capabilities. For entrepreneurial firms it is crucial to either be an innovator or at least to be active in a high-tech sector; in a low-tech sector, innovative activity is a “matter of life or death”. Indeed, innovation increases the survival probability of entrepreneurial firms in low-tech sectors by 58 per cent compared to non-innovative firms. This is the highest innovation premium amongst all the categories of firms and sectors studied.
Keywords: Firm Survival; Innovation; Entrepreneurship; High technology industries.
JEL codes: L11; O30; D21; C14; L25
∗ We would like to thank, Michael Dahl, Giovanni Dosi, Toke Reichstein, Ammon Salter, and participants at ESSID 2005, Cargese. Elena Cefis gratefully acknowledges the financial support of the University of Bergamo (grant ex 60%, n. 60CEFI04, Department of Economics). The empirical part of this research was carried out at the Centre for Research of Economic Microdata at Statistics Netherlands. The views expressed in this paper are those of the authors and do not necessarily reflect the policies of Statistics Netherlands. a Corrisponding author: Elena Cefis, Utrecht School of Economics, Utrecht University, Vredenburg 138, 3511 BG Utrecht, The Netherlands. Tel. +31 (0)30 2539856; Fax +31 (0)30 2537373 [email protected] b Orietta Marsili, RSM, Erasmus University, PO box 1738, 3000 DR Rotterdam, The Netherlands. Tel. +31.010.4081979; Fax +31.010.4089015 [email protected]
1. Introduction
This study explores the effects of innovation on the survival of manufacturing firms in
different technological environments in the Netherlands. Previous studies have related the
survival of firms to firm-specific characteristics and industry features. Several studies identify
firm size and age as determinants of survival. It is accepted as a stylised fact that increasing
age and size exert a positive effect on the likelihood that firms will survive (Geroski, 1995).
Other studies have focused on the role of innovative activities, looking at the intensity of
R&D expenditure (Hall, 1987; Esteve Perez et al., 2004) and indicators of innovative
performance (Cefis and Marsili, 2005). In general, these studies find that innovative activities
are beneficial for firm survival, regardless of the industry in which firms are active. Across
sectors, a number of variables have been associated with the likelihood of survival, such as
market size and growth rates (Mata and Portugal, 1994), the characteristics of technology
(Audretsch, 1995; Agarwal, 1996; Agarwal, 1998) and the life cycle (Agarwal and Audretsch,
2001). These studies emphasise the heterogeneity of sectors and how the effects of firm
specific characteristics vary across them (Audretsch et al., 1999).
In this study we analyse the determinants of firms’ survival probability by combining
firm level and industry level features. We examine the role of innovation within the firm in
shaping its survival probability, and contrast this effect across different technological
environments; specifically we compare innovative and non-innovative firms in high- and low-
tech industries. In addition, we control for the characteristics of the firm, size and age, which
are generally pointed to in the literature as being important. Thus, we distinguish between
entrepreneurial and established firms in an industry.
The empirical analysis combines economic and demographic data from the Business
Register of all firms active in the Netherlands with data on innovation derived from the
3
second Community Innovation Survey (CIS-2). Integration of these two datasets produced a
sample of 3,275 firms for which information on innovation, number of employees, date of
entry, date of exit and industrial sector were available. The survival probability of a firm was
estimated using an approach based on Transition Probability Matrices. We then statistically
tested for the significance of differences in survival probability between different categories
of firms.
Our results show that, as expected, entrepreneurial firms are more exposed to the risk of
failure than established firms, confirming earlier results of the effects of firm age and size on
the likelihood of survival. However, entrepreneurial firms benefit relatively more than
established firms from a technology rich environment, which in general favours survival.
Also, in low-tech industries entrepreneurial firms that innovate have significantly higher
(58%) chances of survival than non-innovative firms. In other words, the innovation premium
for survival is highest for entrepreneurial firms in low-tech industries.
This study is organised as follows. Section 2 focuses on the determinants of firm survival
identified in the related literature. Sections 3 and 4 respectively present the data used in the
empirical analysis, and the survival analysis methodology. We discuss the results of the
analysis in Section 5. Section 6 concludes.
2. The determinants of firm survival
It is well known that the survival probability of firms varies across industrial sectors
(Geroski, 1995; Audretsch et al., 1999; Audretsch et al., 2000). The survival differences
across industrial sectors vary less over time when compared to more volatile entry rates. This
fact has been interpreted as evidence that barriers to survival are more effective than barriers
to entry (Geroski, 1995). These barriers to survival have been related to traditional market
4
structure variables, such as the presence of scale economies, other cost advantages of
established firms, and the growth rate of sector specific demand (Audretsch, 1991; Audretsch
and Mahmood, 1994; Dunne and Hughes, 1994; Mata and Portugal, 1994; Wagner, 1994).
Some studies have highlighted the role of technological conditions in an industry as a
determinant of firm survival (Audretsch, 1991; 1995; Agarwal, 1998).
There are two interpretations of the relationship between the level of technological
intensity in a sector and the survival probability of firms active in that sector (Agarwal, 1996).
One argument maintains that a fast changing environment hampers firm survival. Geroski
(1995) argues that it is the ability of new firms to learn about the environment and to adapt
their strategies to changes in it, which ultimately determine their chances of survival. Because
of the uncertainty associated with innovation (Ericson and Pakes, 1995), the risk of exit is
higher for firms in high-tech sectors. Consistent with this interpretation, Mahmood (1992)
observes greater hazard rates for new establishments in high-tech industries than in low-tech
industries. Also, in high-tech industries the hazard rate is more sensitive to external factors
such as scale economies and the intensity of R&D expenditure in the sector. Thus, high levels
of innovative activity in a sector render the survival probability of a firm lower and more
constrained by structural barriers, such as scale economies.
The second argument sees the technological activities of a sector as being a source of
opportunity for innovation for new entrants. Highly innovative sectors may enable new firms
to introduce new products and successfully compete with established firms. This increases the
likelihood of survival of new firms. In addition, in a fast changing environment the
cumulative processes of learning within established firms may be less relevant, and may
facilitate the survival of new firms (Agarwal, 1996). In this interpretation, it is not only the
existence of a general pool of technological opportunities that matters for survival, but also
5
the ease with which these opportunities can be exploited by new or established firms (Winter,
1984). The ‘evolutionary’ approach to industrial dynamics characterises these conditions in
terms of a ‘technological regime’. Following Schumpeter’s insight, Nelson and Winter (1982)
distinguish two opposing regimes: an entrepreneurial regime (also labelled Schumpeter Mark
I) in which new firms are the main drivers of innovation, and a routinised regime (or
Schumpeter Mark II) in which established firms are the main sources of innovation. In
elaborating Nelson and Winter’s model, Marsili (2001) shows that, in general, the chances of
survival of established firms increase with the level of technological opportunity within an
industry; survival prospects are lower when opportunities can be exploited by entrant firms
(that is, when technological entry barriers are low). In addition, the effect is conditional on the
age of the firm: survival of young firms increases and survival of older firms decreases as the
level of technological opportunity for entrants increases (Dosi et al., 1995).
Following the ‘evolutionary’ approach, Audretsch and Mahmood (1994; 1995), in their
study of US manufacturing, separate the two components by taking the total innovation rate in
an industry (as a measure of the general level of technological opportunity) and the relative
innovation rate of small firms (as indicative of the presence of a an ‘entrepreneurial’ as
opposed to a ‘routinised’ regime). After controlling for the latter effect, they show that the
likelihood of failure of new establishments is greater in highly innovative environments,
confirming earlier results where this factor was not controlled for. Thus, these results support
the hypothesis that high-tech sectors, because of their high degree of uncertainty, have a
negative effect on the survival probabilities of firms.
Audretsch (1995) refines this evidence by demonstrating that the effects of technological
conditions vary with firm age. In more innovative industries, new firms have a lower
probability of survival within a limited period after entry; but, after a certain number of years
6
(8 years in the cited study) after entry, their probability of survival increases. Similar effects
can be found for the level of innovation of small firms in the industry, which approximates
the ‘entrepreneurial’ or ‘routinised’ nature of the innovation regime. When based on firms’
experience, the effects of technology on survival are the opposite to those for newly created
firms. Technological opportunities influence firm survival relative to whether the firm is an
entrepreneurial or an established firm. High-tech industries negatively affect the survival of
newly created firms, but favour the survival of incumbents (Audretsch et al., 2000).
However, Agarwal’s (1996) empirical study of US manufacturing produces contrasting
results to Audretsch (1995). Agarwal classifies a set of industries into the five stages of the
product life cycle (PLC) and into technical and non-technical industry categories, based on
the intensity of R&D expenditure. She finds that intense technological activities favour the
survival of new firms in the 4 years after entry, while this advantage tends to disappear by 12
years after entry. In addition, she shows there is a non-linear relationship between firm age,
technological activity and survival. Across all five stages of the PLC, ‘infant’ firms (6 or less
years old) are exposed to greater risk of failure in non-technical industries. In contrast,
‘incumbent’ firms (older than 6 years) encounter greater risk of failure in technical industries.
Focusing on firm size, Agarwal (1998) observed that small firms have greater likelihood of
survival in high-tech than low-tech industries. In sum, technological activities seem to
enhance the survival probability of new and small firms, while they tend to limit the survival
chances of incumbent firms (Agarwal, 1996; Agarwal, 1998).
Despite the role attributed to the technological environment for a firm’s survival, there
are few studies linking survival to the innovative activities carried out by the firm.
Introducing new products and processes is considered to be a key source of competitive
advantage in the market (Schumpeter, 1942; Baumol, 2002). With regard to the innovative
7
effort of firms, investing more intensively in R&D activities positively influences their
survival prospects (Hall, 1987; Esteve Perez et al., 2004). With regard to innovative
performance, in an earlier study (Cefis and Marsili, 2005), we show that innovation does
indeed enhance the survival probability of a firm and for young and small firms in the
Netherlands, this effect is especially evident.
Our contribution to this field of the literature is to analyse the interaction between firm
specific effects of innovation on survival according to the different levels of technological
intensity in the external environment.
3. Data
This study is based on two micro-economic databases collected by the Central Bureau of
Statistics Netherlands (CBS): the Business Register database and the CIS-2 in the
Netherlands. By combining these datasets, we were able to integrate at firm level,
comprehensive data on innovation and the demography of firms.
The Business Register database consists of all firms registered in the Netherlands for
fiscal purposes. The database reports number of employees, sector of activity and the date
expressed as month of entry and exit in the datasets. Because the dataset includes all
registered firms in the population, these dates can be considered as close approximations of
the actual dates of entry and exit of firms. For compatibility with the CIS-2, we considered all
manufacturing firms present in the Business Register at year 1996. The number of firms in the
Business Register at 1996, including firms with zero employees, that is self-employment, is
61,177.
The second wave of the CIS provides information on innovation activities in the
Netherlands for the period 1994–96. This survey includes private sector firms with at least 10
employees. The CIS firms were extracted from those present in the Business Register in order
8
to constitute a stratified random sample, based on size class, region and industrial sector at the
2-digit Standard Industrial Classification (SIC) code level. The number of manufacturing
sector respondents to CIS-2 was 3,299 firms, with a response rate of 71 per cent.
Our variable of interest is the survival probability of a firm. To estimate this variable, we
use the date of exit of a firm from the population of manufacturing firms in the Business
Register. The exit date is expressed in months and ranges from January 1996 to December
2003. The dataset thus covers 96 months of possible existence. For each month, we built a
dummy variable that was equal to 1 if the firm existed in the database and 0 otherwise.
The first condition that we want to relate to survival probability is the technological
environment in which a firm is active. On the basis of the SIC code, each firm is assigned to
two broad areas of activity: high-tech manufacturing or low-tech manufacturing. We thus
adopt the OECD (2001) classification of industries based on level of technological intensity.
Given some broad technological conditions, our interest is to establish whether the
innovative activity of a firm enhances its chances of survival, and whether such an
environment shapes this effect. To measure innovation at firm level, we use the CIS-2 for the
Netherlands. For this CIS sample of firms, we distinguish between innovators and non-
innovators. An innovator is defined as a firm that has introduced in the period 1994–1996
either a product or a process innovation. These variables reflect the respondent’s subjective
perception of ‘being an innovator’ and may lead to an overestimation of the actual innovative
activity of a firm.
As we assume that technology, and the innovative activity may have different impacts on
the survival probability, depending on the age and size of a firm, we built two opposite
categories of firms. We define ‘entrepreneurial’ firms as those that, at 1996, are between 0
and 4 years old (where the age 0 identifies the firms that have entered during the year 1996),
9
and have less than 50 employees. They are both young and small firms. We define
‘established’ firms those that, at 1996, are 5 or more years old and have more than 50
employees. They are both old and large firms. Firm age and size are derived from the
Business Register of the population. The estimate of firm age relies on the entry date, while
firm size is measured by number of employees, including the 0 value of self-employment.
By matching the two datasets, we are able to link innovation at the firm level (from the
CIS-2 dataset) to firm performance, namely the survival probability (as estimated from the
Business Register of the population), while also controlling for the effects of different
typologies of firms (entrepreneurial and established) and industries (high-tech and low-tech
manufacturing) (both derived from the Business Register). The resulting dataset comprises
3,275 firms.
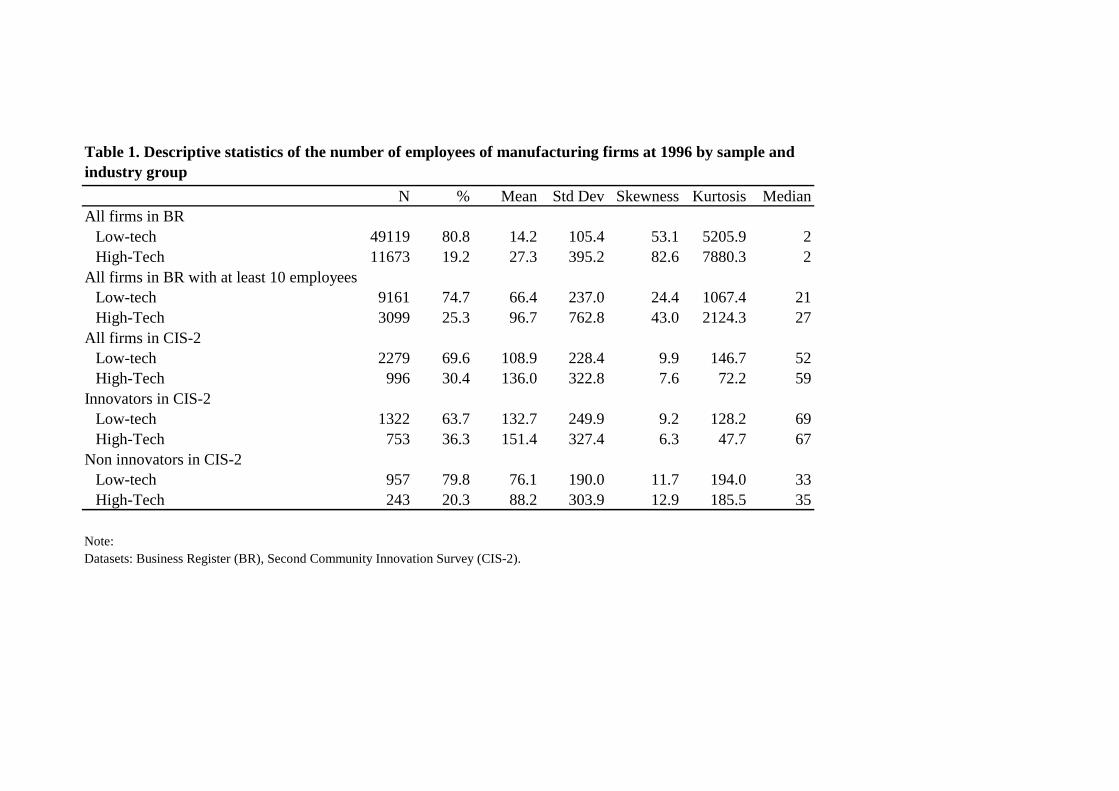
Table 1 reports the descriptive statistics of the different sets of firms used in the analysis.
Firms in low-tech sectors are on average (both mean and median) smaller than firms in high-
tech sectors independent of the category of firms reported in Table 1. Innovators are of larger
size than non-innovators, both in low-tech and high-tech industries. These characteristics are
in line with the more general observation that innovators are larger than non-innovators (Cefis
and Marsili, 2004).
--- Insert Table 1 ---
4. Methodology
We used a non-parametric approach based on Transition Probability Matrices to analyse
the survival probabilities among different groups of firms. We measure survival probability as
the firm probability of remaining in the state in which the firm actually exists, while the
10
probability of exiting the market is given by the probability to go from the state of existence
to the one of non-existence.
Among the firms that were in existence when the second wave of CIS data were
collected, namely 1996, this being the finite population of firms, at each point in time (after
1996) there is a cross-section distribution of firms that exist and firms that have ceased to
exist. The objective is to describe the evolution of this distribution over time, to enable the
intra-distribution mobility of firms to be analysed. The intra-distribution mobility gives
information about the firm’s relative situation, and its movement over time (Cefis, 2003).
To study the evolution of this distribution it is necessary to hypothesise a law of motion
for the cross-section distribution within a more formal structure. Let Ft denote the distribution
of firms at time t; and let us describe the evolution of the distribution using the law of motion:
Ft+m = P · Ft (1)
where P maps one distribution into another, and tracks where points in Ft end up in Ft+m.
Equation (1) is a useful first step for analysing the dynamics of { Ft }. Operator P of equation
(1) can be approximated by assuming a finite state space for firms S={s1 s2 ... sr}, where
si(i=1,...,r) are the possible states. In this case P is simply a Transition Probability Matrix
(TPM). P encodes the relevant information about mobility and persistence of firms within the
cross section distributions. Therefore, the one-step transition probability is defined by:
)( iXjXPp tmtij === + (2)
where t denotes discrete moments of time and m different discrete transition periods.
The TPM P is the matrix with pij as elements measuring the probability of moving from
state i to state j in one period m. (Hoel P.G. et al., 1987).
11
The focus of our analysis is the probability of firm survival. Therefore, we consider a
state space constituted by two states identified by the condition of existence of the firm.
More precisely, the first state is defined as the non-existing state (state 0), in which firms are
non-active in the market (they have in fact exited the market), and the second is defined as the
existing state in which firms are actually present in the market (state 1). The transition
probabilities between the two states provide information useful for analysing survival since
they measure the probability that a firm remains in existence or exits the market in a particular
period.
We estimate the following probabilities:
ˆ ˆ( 1 1)t m tP X X p+ = = = (3)
ˆ ˆ( 1 0) 1t m tP X X p+ = = = − (4)
The probabilities 3 and are computed on different period lengths (for different m, ranging
from 12 to 84 months). These different transition periods allow us to capture the dynamics of
the survival probability of firms, and to study how it evolves over time.
It should be noted that in order to perform the persistence analysis we have assumed that
firms are homogeneous. In this context, heterogeneity among firms, due to belonging to
different sectors or having different sizes or ages, is accounted for by breaking down the
overall sample into sub-samples according to industrial classification, and size and age
classes. Nevertheless, in our sub-samples firms are assumed to be homogeneous and, using
our methodology, it is not possible to control for heterogeneity at the firm level.
12
We conducted the analysis dividing the sample into entrepreneurial and established
firms, and according to whether they were categorised as high-tech or low-tech
manufacturing.
In order to test whether the differences between two estimated probabilities were
statistically significant, we applied the following test. Let 1̂P and 2̂P be the survival
probabilities estimated in the samples of size 1n and 2n (for example the survival
probabilities for innovators and non-innovators in the CIS) drawn from their respective
populations with probabilities 1p and 2p . The null hypothesis is that there is no difference
between the survival probabilities of the populations, that is 210 : ppH = , and thus the
samples are really drawn from the same population with survival probability p . The test
statistic is the difference in the estimated probabilities: 1 2ˆ ˆP P− . Given the fact that the size of
our samples is sufficiently large (with at least 80>n ), under the null hypothesis, the
standardised variable
1 2
1 2
ˆ ˆ
ˆ ˆ 0
P P
P PZσ
−
− −= is approximately distributed N(0,1), where
1 2
1 1 2 2ˆ ˆ
1 2
(1 ) (1 )P P
p p p pn n
σ−
− −= +
Given that 1p and 2p . are unknown and for the null hypothesis ppp == 21 , the estimator of
1 2ˆ ˆP Pσ−
is
1 2ˆ ˆ
1 2
1 1(1 )P PS P Pn n−
⎛ ⎞= − +⎜ ⎟
⎝ ⎠
where P is the estimator of the survival probability of the population given by the arithmetic
weighted average of 1p and 2p :
13
21
2211
nnPnPn
P++
= .
We tested the differences in the survival probabilities of different sub-groups of firms and the
test results (in parentheses) are reported in Tables 2 and 3.
5. Empirical Results
We first examine the differences in survival probability of the firms that responded to the
CIS-2 of high-tech manufacturing and low-tech manufacturing. Here we focus on the general
‘structural’ conditions for the survival of entrepreneurial and established firms independent of
their specific innovative behaviour.
As expected, in general survival probability is higher for established than for
entrepreneurial firms. Indeed, the percentage differences in survival probability between
established and entrepreneurial firms increases from 3.1 in the first year to 22.2 in the last
year. This shows that firm age and firm size have a positive effect on the survival probability.
An earlier study (Cefis and Marsili, 2004) carried out for the entire Dutch manufacturing
sector that explored the relationship between firm survival, age and size in more detail,
produced similar evidence.
--- Insert Figure 1---
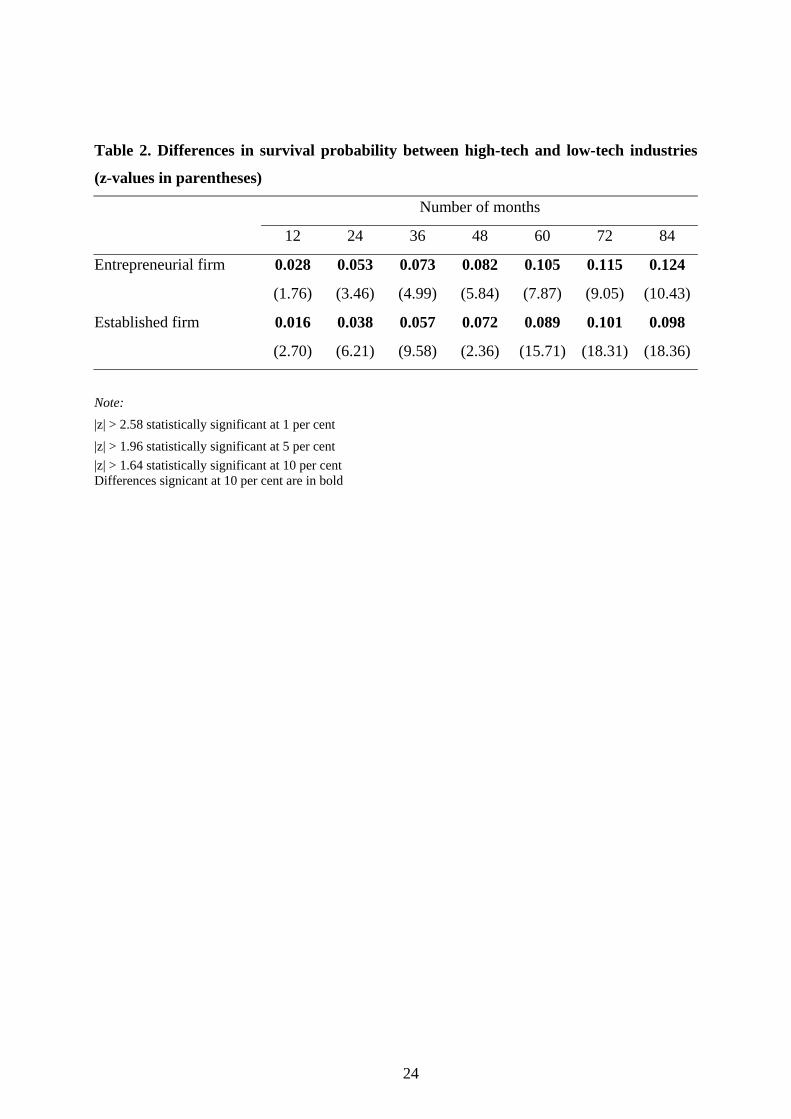
As Figure 1 shows, survival probability is higher in high-tech than in low-tech industries.
In general, this holds for both entrepreneurial and established firms, and more particularly, the
difference between high tech and low-tech industries increases over time and is higher for
entrepreneurial firms than for established firms. Survival probability for an entrepreneurial
firm in the high-tech sector is 3.3 per cent higher than in the low-tech sector over a one-year
period, and 19.8 per cent higher over a 7 year period. For an established firm, the differences
14
are smaller, 1.7 per cent and 12.7 per cent respectively (see Table 2 for the statistical test of
significance for the differences in survival probability between high-tech and low-tech
industries)1. Therefore, while the survival probability for entrepreneurial firms is generally
lower than for established firms, entrepreneurial firms benefit more from a high intensity
technological environment than do established firms.
--- Insert Table 2 ---
We next examine survival in relation to innovators versus non-innovators. In particular,
we are interested in comparing the innovation premium between high-tech and low-tech
manufacturing, and whether the role of innovation as a strategy for survival differs according
to technological intensity of the environment. In addition, we contrast entrepreneurial firms
and established firms to see whether a different pattern emerges.
At first glance, innovation can be seen to have a positive effect on survival probability.
However, its magnitude varies according to the technological characteristics of the
environment.
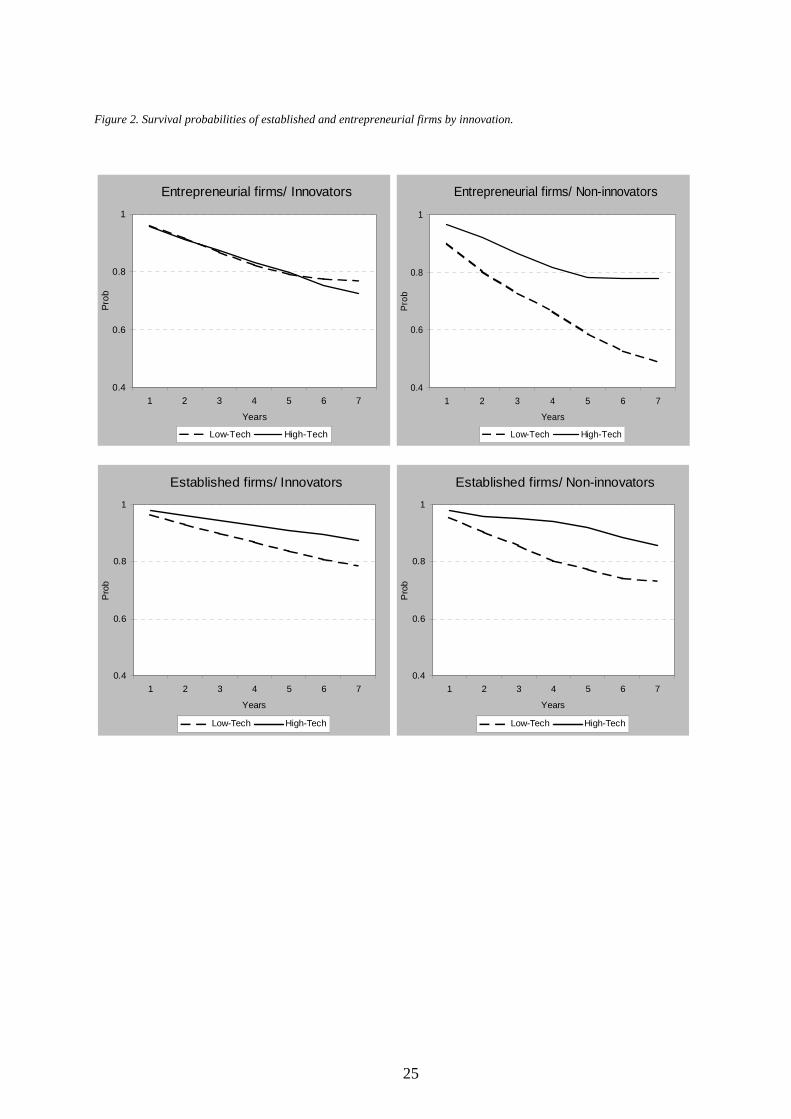
--- Insert Figure 2 ---
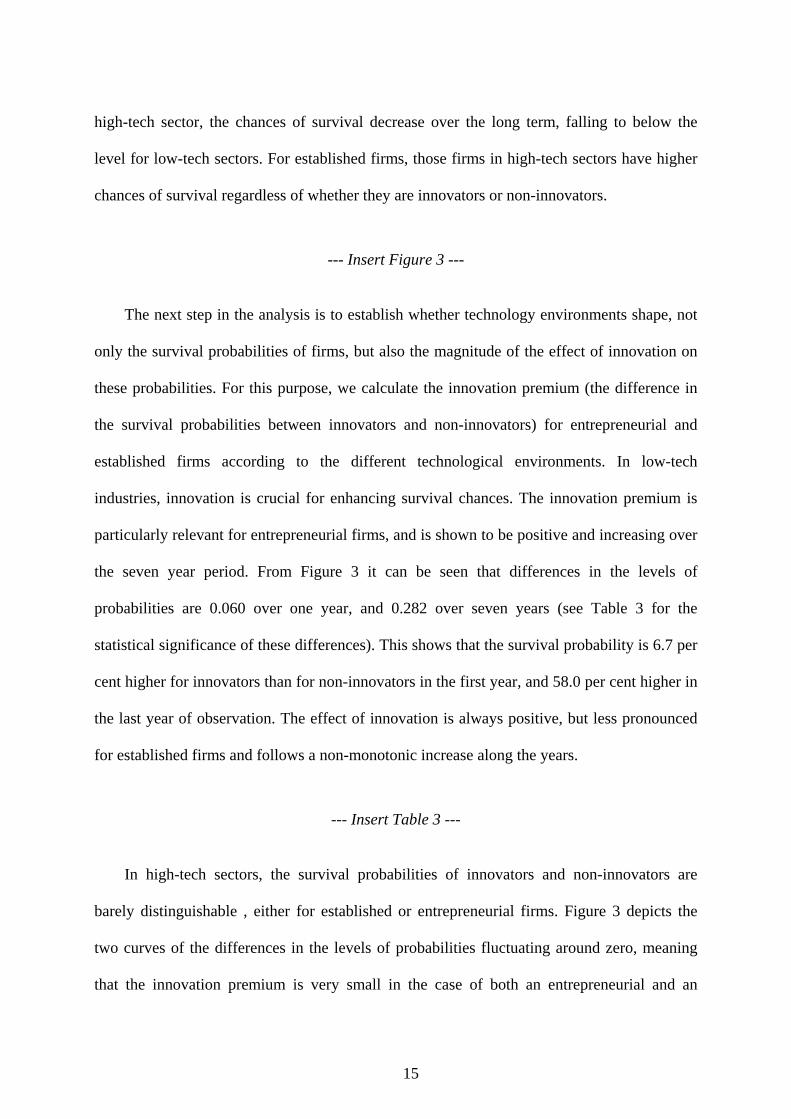
Figure 2 depicts the effects of the technology on the survival probabilities of innovators
and non-innovators. The survival probabilities of entrepreneurial and established firms are
plotted according to their innovative status in low-tech and high-tech industries. Among the
entrepreneurial firms, innovators do not seem to be affected by sectoral differences in their
survival probability, while non-innovators in high-tech sectors have better survival probability
than those in low-tech sectors. It should be noted that for entrepreneurial innovators in the
1 Table 2 reports the difference in the level of survival probability and its statistical significance. In the text, we also refer to the percentage variation in probability.
15
high-tech sector, the chances of survival decrease over the long term, falling to below the
level for low-tech sectors. For established firms, those firms in high-tech sectors have higher
chances of survival regardless of whether they are innovators or non-innovators.
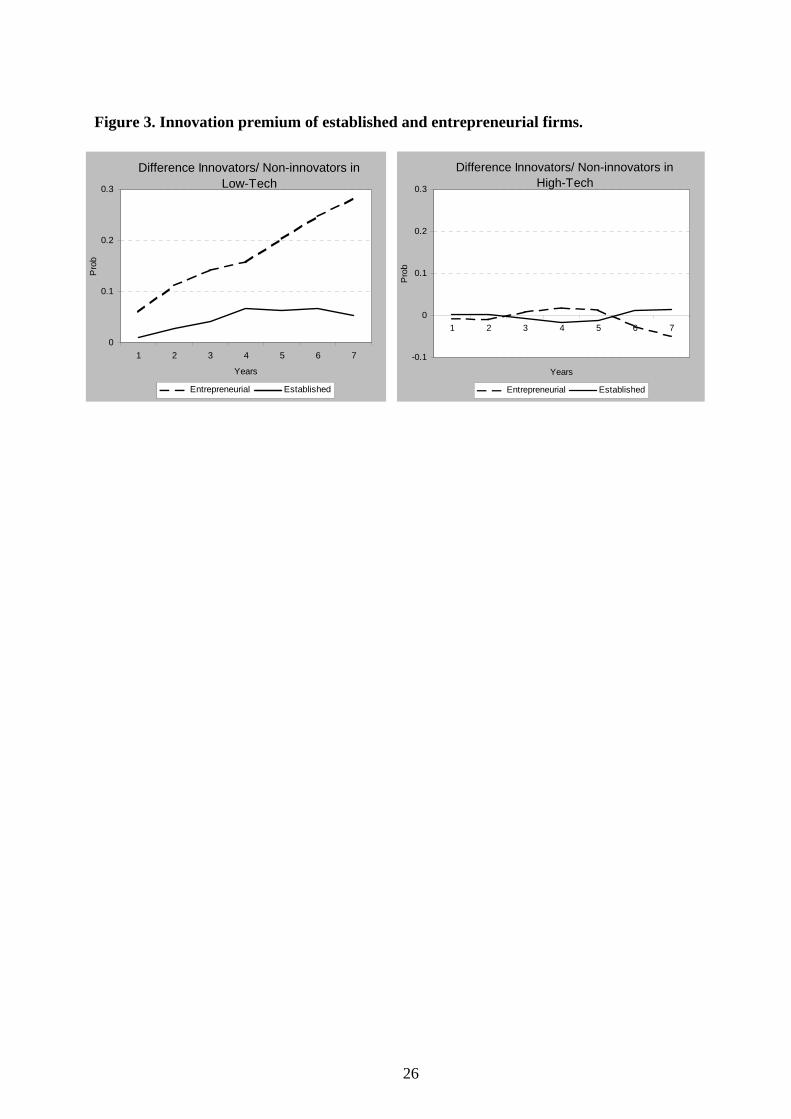
--- Insert Figure 3 ---
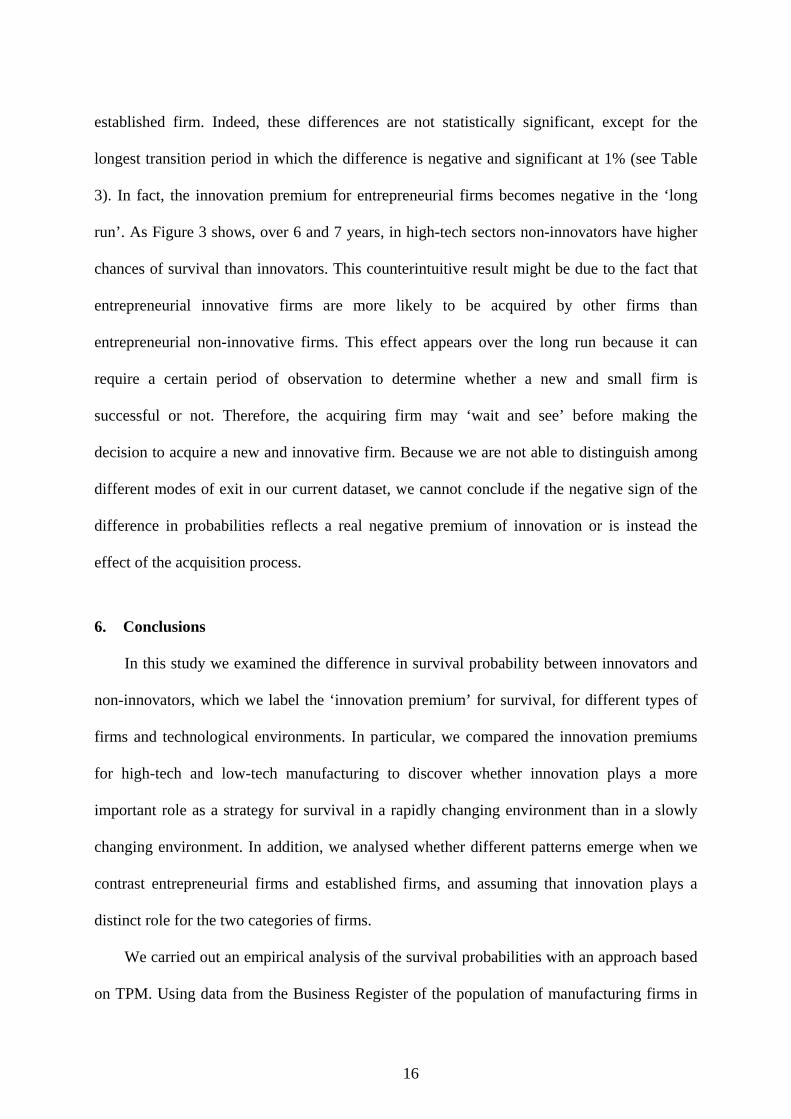
The next step in the analysis is to establish whether technology environments shape, not
only the survival probabilities of firms, but also the magnitude of the effect of innovation on
these probabilities. For this purpose, we calculate the innovation premium (the difference in
the survival probabilities between innovators and non-innovators) for entrepreneurial and
established firms according to the different technological environments. In low-tech
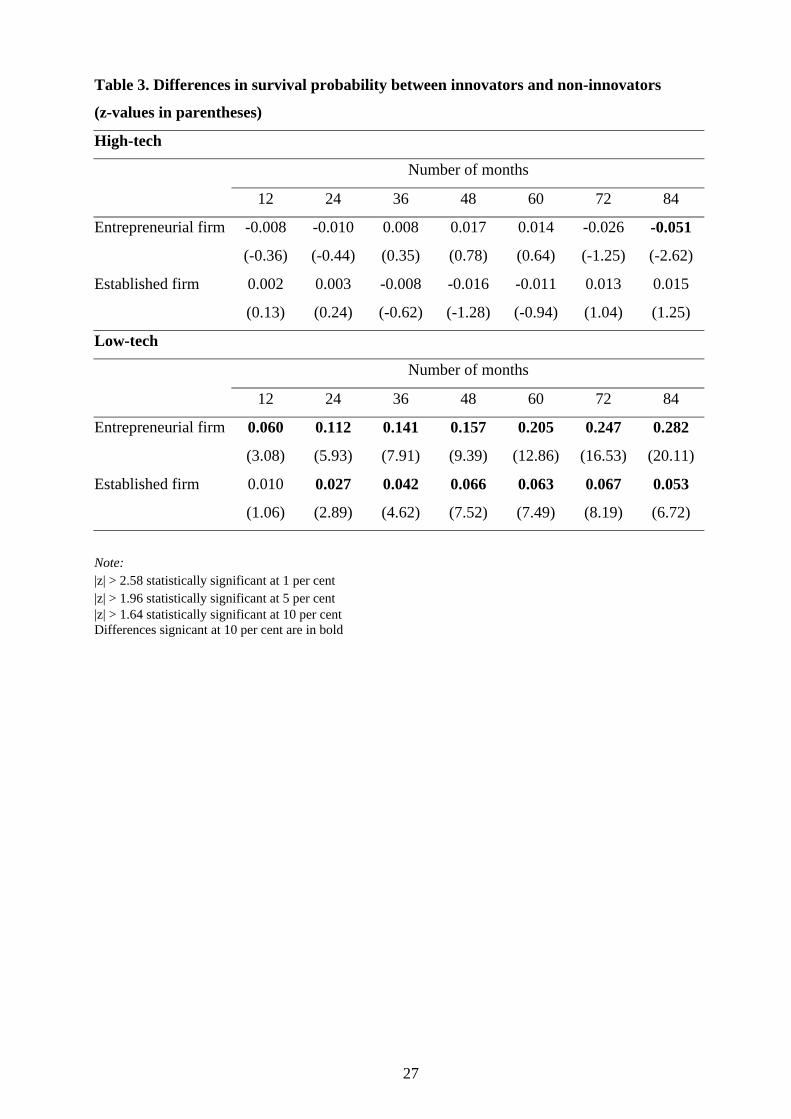
industries, innovation is crucial for enhancing survival chances. The innovation premium is
particularly relevant for entrepreneurial firms, and is shown to be positive and increasing over
the seven year period. From Figure 3 it can be seen that differences in the levels of
probabilities are 0.060 over one year, and 0.282 over seven years (see Table 3 for the
statistical significance of these differences). This shows that the survival probability is 6.7 per
cent higher for innovators than for non-innovators in the first year, and 58.0 per cent higher in
the last year of observation. The effect of innovation is always positive, but less pronounced
for established firms and follows a non-monotonic increase along the years.
--- Insert Table 3 ---
In high-tech sectors, the survival probabilities of innovators and non-innovators are
barely distinguishable , either for established or entrepreneurial firms. Figure 3 depicts the
two curves of the differences in the levels of probabilities fluctuating around zero, meaning
that the innovation premium is very small in the case of both an entrepreneurial and an
16
established firm. Indeed, these differences are not statistically significant, except for the
longest transition period in which the difference is negative and significant at 1% (see Table
3). In fact, the innovation premium for entrepreneurial firms becomes negative in the ‘long
run’. As Figure 3 shows, over 6 and 7 years, in high-tech sectors non-innovators have higher
chances of survival than innovators. This counterintuitive result might be due to the fact that
entrepreneurial innovative firms are more likely to be acquired by other firms than
entrepreneurial non-innovative firms. This effect appears over the long run because it can
require a certain period of observation to determine whether a new and small firm is
successful or not. Therefore, the acquiring firm may ‘wait and see’ before making the
decision to acquire a new and innovative firm. Because we are not able to distinguish among
different modes of exit in our current dataset, we cannot conclude if the negative sign of the
difference in probabilities reflects a real negative premium of innovation or is instead the
effect of the acquisition process.
6. Conclusions
In this study we examined the difference in survival probability between innovators and
non-innovators, which we label the ‘innovation premium’ for survival, for different types of
firms and technological environments. In particular, we compared the innovation premiums
for high-tech and low-tech manufacturing to discover whether innovation plays a more
important role as a strategy for survival in a rapidly changing environment than in a slowly
changing environment. In addition, we analysed whether different patterns emerge when we
contrast entrepreneurial firms and established firms, and assuming that innovation plays a
distinct role for the two categories of firms.
We carried out an empirical analysis of the survival probabilities with an approach based
on TPM. Using data from the Business Register of the population of manufacturing firms in
17
the Netherlands and the CIS-2, we estimated the survival probabilities for different categories
of firms. These categories were based on firm age and size, firm specific innovative
performance, and industry specific technology intensity.
Among the group of established firms, we observed that firms with the highest survival
probabilities are those active in technology intensive environments, regardless of whether
they are innovators or non-innovators. On the other hand, in low-tech sectors, being an
innovator is a decisive factor in firm survival increasing survival probability by 7.2 per cent.
This result suggests that the highest premium in survival for an established firm (whether an
innovator or not) lies in being active in a high-tech sector. Thus, to increase survival
probability, innovation must be complemented by firm specific organisational and
commercial capabilities.
Our results show that for entrepreneurial firms it is crucial to either be an innovator or at
least to be active in a high-tech sector; in a low-tech sector, innovative activity is a “matter of
life or death”. Indeed, innovation increases the survival probability of entrepreneurial firms in
low-tech sectors by 58 per cent compared to non-innovative firms. This is the highest
innovation premium amongst all the categories of firms and sectors studied.
18
References
Agarwal, R. (1996), 'Technological activity and survival of firms', Economics Letters, 52,
101-108.
Agarwal, R. (1998), 'Evolutionary trends of industry variables', International Journal of
Industrial Organization, 16(4), 511-525.
Agarwal, R. (1998), 'Small firm survival and technological activity', Small Business
Economics, 11, 215-224.
Agarwal, R. and D. B. Audretsch (2001), 'Does entry size matter? The impact of the life cycle
and technology on firm survival', The Journal of Industrial Economics, 49(1), 21-43.
Audretsch, D. B. (1991), 'New-firm survival and the technological regime', Review of
Economics and Statistics, 73(3), 441-450.
Audretsch, D. B. (1995), 'Innovation, growth and survival', International Journal of Industrial
Organization, 13(4), 441-457.
Audretsch, D. B., P. Houweling and R. Thurik (2000), 'Firm survival in the Netherlands',
Review of Industrial Organization, 16, 1-11.
Audretsch, D. B. and T. Mahmood (1994), 'The rate of hazard confronting new firms and
plants in U.S. manufacturing', Review of Industrial Organization, 9(1), 41-56.
Audretsch, D. B. and T. Mahmood (1995), 'New firm survival: new results using a hazard
function', Review of Economics and Statistics, 77(1), 97-103.
Audretsch, D. B., E. Santarelli and M. Vivarelli (1999), 'Start-up size and industrial dynamics:
some evidence from Italian manufacturing', International Journal of Industrial Organization,
17(7), 965-983.
19
Baumol, W. J. (2002), Free Market Innovation Machine: Analyzing the Growth Miracle of
Capitalism. Princeton University Press.
Cefis, E. (2003), 'Is there persistence in innovative activities?' International Journal of
Industrial Organization, 21(4), 489-515.
Cefis, E. and O. Marsili (2004), 'Survivor: The role of innovation in firm's survival', WP T.
Koopmans Institute, USE, Utrecht University. No. 03-18.
Cefis, E. and O. Marsili (2005), 'A matter of life and death: Innovation and firm survival.'
Industrial and Corporate Change, 14(6), 1-26.
Dosi, G., O. Marsili, L. Orsenigo and R. Salvatore (1995), 'Learning, market selection and the
evolution of industrial structures', Small Business Economics, 7(6), 411-436.
Dunne, P. and A. Hughes (1994), 'Age, size, growth and survival: UK companies in the
1980s', The Journal of Industrial Economics, 42(2), 115-139.
Ericson, R. and A. Pakes (1995), 'Markov-perfect industry dynamics: A framework for
empirical work', Review of Economic Studies, 62(1), 53-82.
Esteve Perez, S., A. Sanchis LLopis and J. A. Sanchis LLops (2004). The determinants of
survival of Spanish manufacturing firms. Review of Industrial Organization. 25, 251-273.
Geroski, P. A. (1995), 'What do we know about entry?' International Journal of Industrial
Organization, 13(4), 421-440.
Hall, B. H. (1987), 'The relationship between firm size and firm growth in the US
manufacturing sector', The Journal of Industrial Economics, 35(4), 583-606.
Hoel P.G., S. C. Port and a. C. J. Stone (1987), Introduction to Stochastic Processes.
Waveland Press, Inc.: Prospect Heights, Illinois.
20
Mahmood, T. (1992), 'Does the hazard rate for new plants vary between low- and high-tech
industries?' Small Business Economics, 4, 201-209.
Marsili, O. (2001), The Anatomy and Evolution of Industries: Technological Change and
Industrial Dynamics. Edward Elgar: Cheltenham, UK and Northampton, MA, USA.
Mata, J. and P. Portugal (1994), 'Life duration of new firms', The Journal of Industrial
Economics, 42(3), 227-245.
Nelson, R. R. and S. G. Winter (1982), An Evolutionary Theory of Economic Change.
Belknap Press of Harvard University Press: Cambridge, MA.
Schumpeter, J. A. (1942), Capitalism, Socialism and Democracy. Harper & Row: New York.
Wagner, J. (1994), 'The post-entry performance of new small firms in German manufacturing
industries', The Journal of Industrial Economics, 42(2), 141-154.
Winter, S. G. (1984), 'Schumpeterian competition in alternative technological regimes',
Journal of Economic Behavior and Organization, 5(3-4), 287-320.
N % Mean Std Dev Skewness Kurtosis MedianAll firms in BR
Low-tech 49119 80.8 14.2 105.4 53.1 5205.9 2High-Tech 11673 19.2 27.3 395.2 82.6 7880.3 2
All firms in BR with at least 10 employeesLow-tech 9161 74.7 66.4 237.0 24.4 1067.4 21High-Tech 3099 25.3 96.7 762.8 43.0 2124.3 27
All firms in CIS-2Low-tech 2279 69.6 108.9 228.4 9.9 146.7 52High-Tech 996 30.4 136.0 322.8 7.6 72.2 59
Innovators in CIS-2Low-tech 1322 63.7 132.7 249.9 9.2 128.2 69High-Tech 753 36.3 151.4 327.4 6.3 47.7 67
Non innovators in CIS-2Low-tech 957 79.8 76.1 190.0 11.7 194.0 33High-Tech 243 20.3 88.2 303.9 12.9 185.5 35
Note:Datasets: Business Register (BR), Second Community Innovation Survey (CIS-2).
Table 1. Descriptive statistics of the number of employees of manufacturing firms at 1996 by sample and industry group

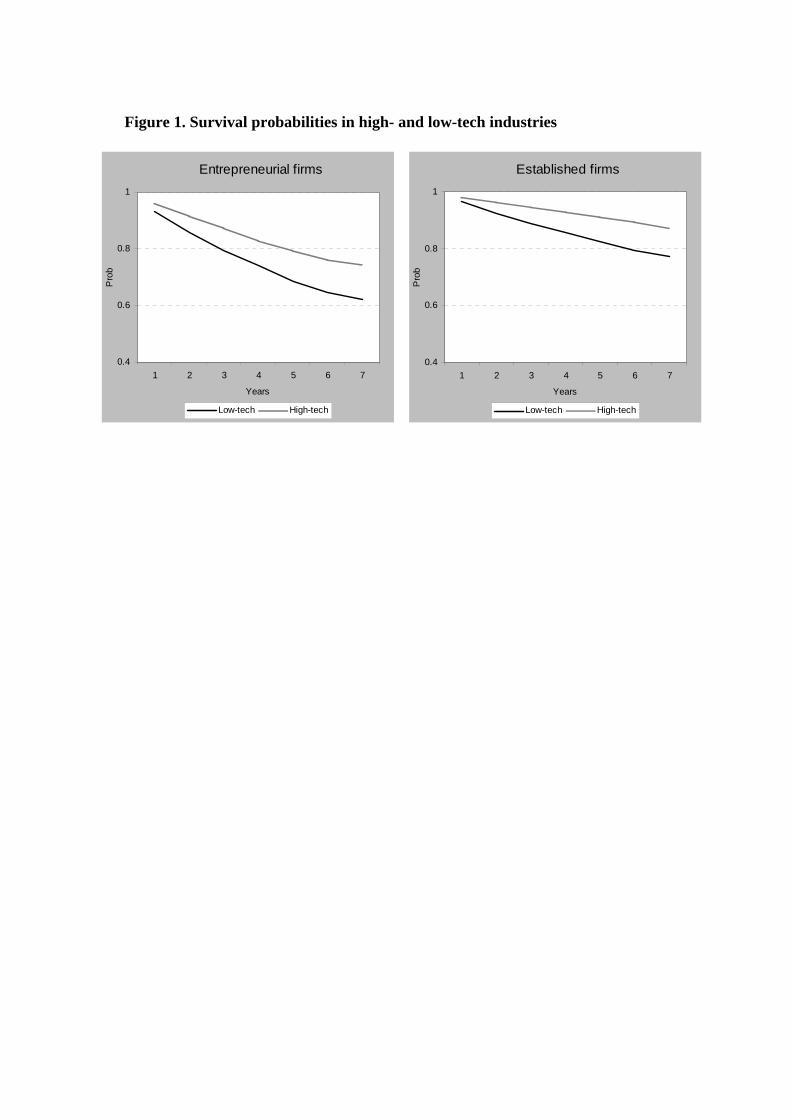
Figure 1. Survival probabilities in high- and low-tech industries
Entrepreneurial firms
0.4
0.6
0.8
1
1 2 3 4 5 6 7
Years
Pro
b
Low-tech High-tech
Established firms
0.4
0.6
0.8
1
1 2 3 4 5 6 7
Years
Pro
bLow-tech High-tech
24
Table 2. Differences in survival probability between high-tech and low-tech industries
(z-values in parentheses)
Number of months
12 24 36 48 60 72 84
Entrepreneurial firm 0.028 0.053 0.073 0.082 0.105 0.115 0.124
(1.76) (3.46) (4.99) (5.84) (7.87) (9.05) (10.43)
Established firm 0.016 0.038 0.057 0.072 0.089 0.101 0.098
(2.70) (6.21) (9.58) (2.36) (15.71) (18.31) (18.36)
Note: |z| > 2.58 statistically significant at 1 per cent |z| > 1.96 statistically significant at 5 per cent |z| > 1.64 statistically significant at 10 per cent Differences signicant at 10 per cent are in bold
25
Figure 2. Survival probabilities of established and entrepreneurial firms by innovation.
Entrepreneurial firms/ Innovators
0.4
0.6
0.8
1
1 2 3 4 5 6 7
Years
Prob
Low-Tech High-Tech
Entrepreneurial firms/ Non-innovators
0.4
0.6
0.8
1
1 2 3 4 5 6 7
YearsPr
ob
Low-Tech High-Tech
Established firms/ Innovators
0.4
0.6
0.8
1
1 2 3 4 5 6 7
Years
Pro
b
Low-Tech High-Tech
Established firms/ Non-innovators
0.4
0.6
0.8
1
1 2 3 4 5 6 7
Years
Pro
b
Low-Tech High-Tech
26
Figure 3. Innovation premium of established and entrepreneurial firms.
Difference Innovators/ Non-innovators in High-Tech
-0.1
0
0.1
0.2
0.3
1 2 3 4 5 6 7
Years
Pro
bEntrepreneurial Established
Difference Innovators/ Non-innovators in Low-Tech
0
0.1
0.2
0.3
1 2 3 4 5 6 7
Years
Pro
b
Entrepreneurial Established
27
Table 3. Differences in survival probability between innovators and non-innovators
(z-values in parentheses)
High-tech
Number of months
12 24 36 48 60 72 84
Entrepreneurial firm -0.008 -0.010 0.008 0.017 0.014 -0.026 -0.051
(-0.36) (-0.44) (0.35) (0.78) (0.64) (-1.25) (-2.62)
Established firm 0.002 0.003 -0.008 -0.016 -0.011 0.013 0.015
(0.13) (0.24) (-0.62) (-1.28) (-0.94) (1.04) (1.25)
Low-tech
Number of months
12 24 36 48 60 72 84
Entrepreneurial firm 0.060 0.112 0.141 0.157 0.205 0.247 0.282
(3.08) (5.93) (7.91) (9.39) (12.86) (16.53) (20.11)
Established firm 0.010 0.027 0.042 0.066 0.063 0.067 0.053
(1.06) (2.89) (4.62) (7.52) (7.49) (8.19) (6.72)
Note: |z| > 2.58 statistically significant at 1 per cent |z| > 1.96 statistically significant at 5 per cent |z| > 1.64 statistically significant at 10 per cent Differences signicant at 10 per cent are in bold