Embed Size (px)
DESCRIPTION
Inservice Inspection Techniques for Nuclear Power Plants
Citation preview
ELSEVIER
ht. J. Pres. Ves. & Piping 73 (1991) 59-68 0 1997 Published by Elsrvier Science Limited
Printed in Northern Ireland. All rights reserved PII:SO308-0161(97)00035-5 030%0161/97/$17.00
Development of In-service Inspection techniques for nuclear power plants in India
Placid Rodriguez Indira Gandhi Centre for Atomic Research, Kalpakkan, India
Baldev Raj Metallurgy and Materials Group. Indira Gandhi Centre for Atomic Research, Kalpakkam, India
Nondestructive Evaluation (NDE) plays a major role in ensuring the safe and reliable operation of Pressurised Heavy Water Reactors (PHWRs) which are the mainstays of the nuclear power programme in India. This paper discusses the significant developments made over the last two decades which have contributed towards establishing novel methodologies and techniques for In-service Inspection (ISI). The techniques covered are broadly divided into two classes viz. (a) magnetic and electromagnetic, (b) acoustic techniques. Techniques discussed under the first category include eddy current testing (along with the various developments linked with it such as the remote field eddy current testing, eddy current imaging and the phased array eddy current testing), Magnetic Barkhausen Noise and Infrared Imaging. Under the second category, the emphasis is on ultrasonics (for defect detection with high sensitivity and for characterisation of microstructures) and acoustic emission techniques. Developments on the software front, including the application of concepts of Artificial Intelligence and knowledge-based systems in the form of validated expert systems for ultrasonic testing and radiography are described. The expert systems would improve interpretations to a large extent leading to reliable inspections. 01997 Published by Elsevier Science Ltd.
1 INTRODUCTION
The mainstays of the Indian Nuclear Power programme presently are the Pressurised Heavy Water Reactors (PHWRs) of 235 MWe capacity; eight reactors are under operation and two under construction. PHWRs of 500 MWe capacity have been designed and will be constructed in the near future. Apart from the PHWRs, there are two 235 MWe capacity Boiling Water Reactors (BWRs), which have been operating since 1969. India also has a very active Fast Breeder Reactor (FBR) programme; a fast breeder test reactor (FBTR) of 15 MWe capacity has been in operation since 1985 and a 500 MWe prototype FBR is in an advanced stage of design.
In-service Inspection (ISI) is one of the important tools for the safe and reliable operation of a nuclear power plant. IS1 is implemented in the various nuclear
59
power plants in India, by a judicious choice of a number of available Non-Destructive Testing (NDT) techniques. The R & D activities with specific emphasis on IS1 are carried out by several groups at the Bhabha Atomic Research Centre (BARC), Bombay, Indira Gandhi Centre for Atomic Research (IGCAR), Kalpakkam and the Nuclear Power Corporation of India Ltd. (NPCIL). In addition to conventional Non-Destructive Evaluation (NDE) parameters, advanced signal analysis of the NDT signals is very important for detection of defects with high sensitivity under demanding conditions. For example, in the case of IS1 of nuclear power plants, the data are often acquired remotely because operator access is not available, and the data are acquired in a short time. Thus the data are often corrupted beyond what would have been contributed by the un- favourable material characteristics of the component
60 P. Rodriguez, B. Raj
alone. Therefore, a lot of emphasis has been given at IGCAR in developing methodologies based on advanced signal analysis concepts.
This paper describes some of the important achievements in the development of NDT techniques and procedures for the IS1 of a few critical nuclear power plant components. A few of the ongoing developmental activities related to improving the reliability of IS1 are also discussed.
2 MAGNETIC AND ELECTROMAGNETIC TECHNIQUES
This section discusses some of the key developments carried out in the area of magnetic and electromag- netic NDT techniques as applied to IS1 of nuclear power plant components.
2.1 Eddy current testing (ECT) for structural integrity of pressure tube (PT)/calandria tube (CT) assemblies
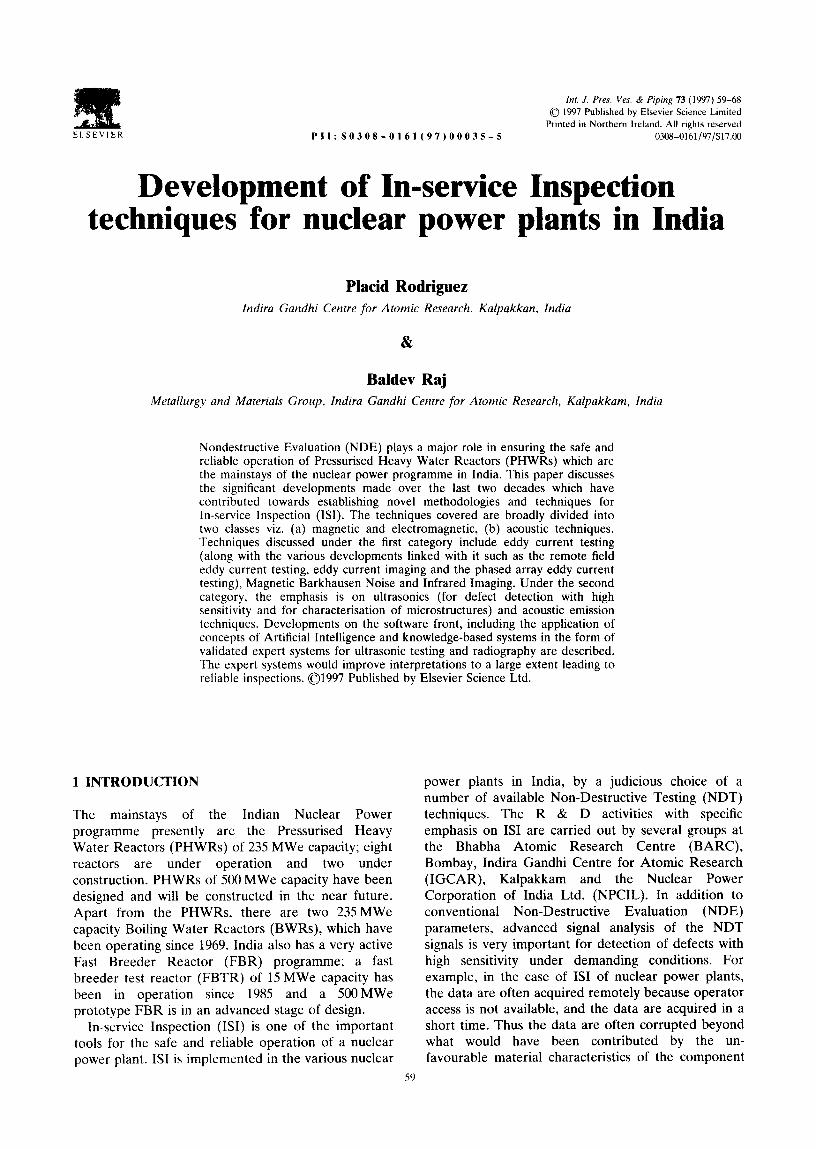
Figure 1 shows the general layout of a typical 235 MW PHWR which consists of 306 channels. Each of these channels consists of a PT (9220 mm long, 82.6 mm dia and 4 mm thick) made of Zircaloy-2 which is positioned horiozntally between two tube sheets. Each PT contains 12 fuel bundles and heavy water coolant passes through it. All the 306 PTs form part of the primary heat transport (PHT) system. Each PT is surrounded by a CT (107.8mm dia and 1 mm thick) again made of Zircaloy-2 leaving a nominal gap of 8.5 mm. The interspace between the CTs is filled with moderator (Heavy water). Garter springs (two in earlier reactors and four in more recent reactors) are positioned in each of the annular channels so that gaps between the PT and CT are maintained (i.e. they do not touch each other during reactor operation) to prevent heat transfer from primary heat transport system to moderator system.
Fig. 1. General layout of a PHWR.
The garter springs are made of an alloy of zirconium. niobium and copper. First six PHWRs have the PTs made of an alloy of Zircaloy-2; the two reactors at Kakrapara and all future reactors will have PTs made of Zr-2.5% Nb alloy with better irradiation creep resistance and corrosion resistance properties than Zircaloy-2.
Subsequent to the failure of a PT in Pickering-2 reactor. in Canada in 1983, it was realised that the garter springs could get displaced during hot conditioning and/or during the operation of the reactor. This displacement increases the unsupported length of the PTs. This increase, coupled with the in-reactor creep of the PTs may make the outer surface of the PTs (at a max. temp of 548 K) touch the cold inner surface of the CTs (at a temperature of 333 K) leading to the formation of a cold spot and further, to the generation of massive hydrides through intense hydrogen diffusion to the cold spot region. This, in turn, results in formation of blisters and cracks leading to ultimate failure of the PT. In view of this, the structural integrity of PTs needs to be considered not only with respect to their own properties, but together with the CTs and the garter springs as well. This can be accomplished by performing NDE at various stages viz. during pre-hot conditioning, post-hot conditioning and in-service, to monitor the following: (a) Location of garter springs between PT and CT. (b) Profiling of the gap between PT and CT. (c) Defect detection in PT.
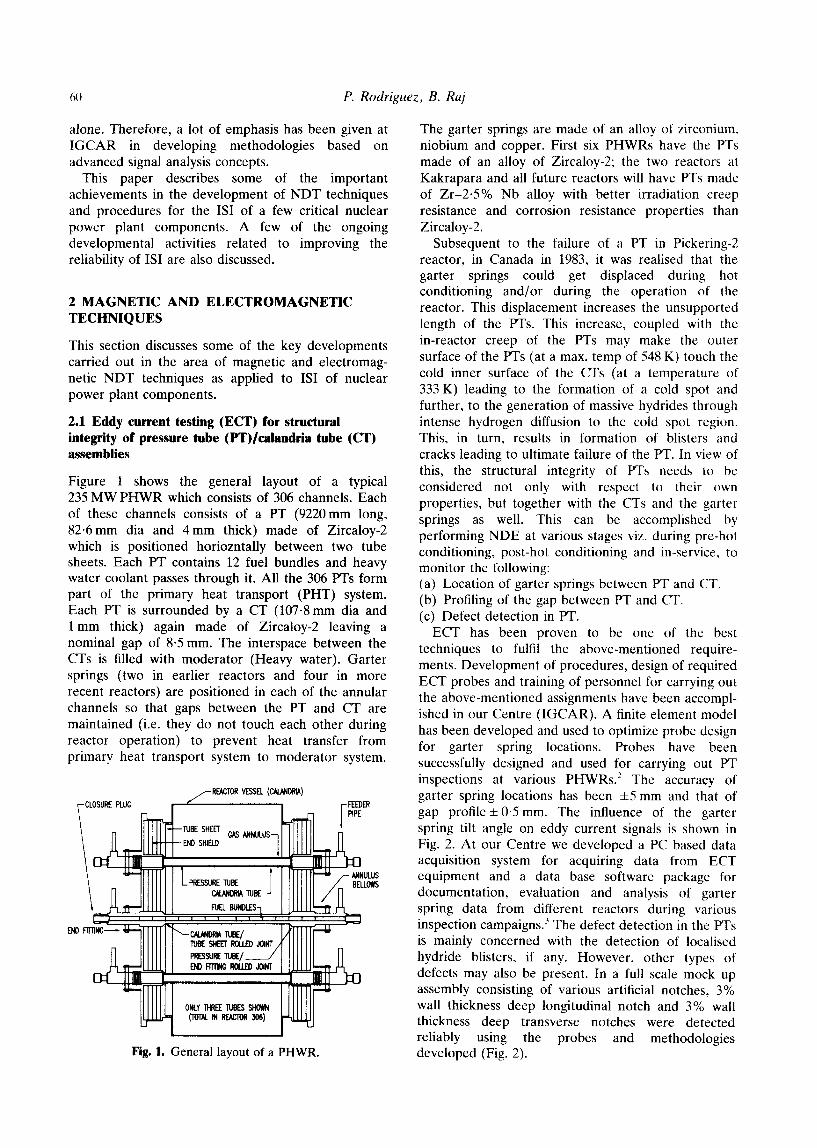
ECT has been proven to be one of the best techniques to fulfil the above-mentioned require- ments. Development of procedures, design of required ECT probes and training of personnel for carrying out the above-mentioned assignments have been accompl- ished in our Centre (IGCAR). A finite element model has been developed and used to optimize probe design for garter spring locations. Probes have been successfully designed and used for carrying out PT inspections at various PHWRs.’ The accuracy of garter spring locations has been *5 mm and that of gap profile + 0.5 mm. The influence of the garter spring tilt angle on eddy current signals is shown in Fig. 2. At our Centre we developed a PC based data acquisition system for acquiring data from ECT equipment and a data base software package for documentation, evaluation and analysis of garter spring data from different reactors during various inspection campaigns.” The defect detection in the PTs is mainly concerned with the detection of localised hydride blisters, if any. However, other types of defects may also be present. In a full scale mock up assembly consisting of various artificial notches, 3% wall thickness deep longitudinal notch and 3% wall thickness deep transverse notches were detected reliably using the probes and methodologies developed (Fig. 2).
In-service Inspection techniques 61
Further to the above developments, a completely automated channel inspection named BARCIS (Bh- abha Atomic Research Centre Channel Inspection System) has been developed and commissioned by BARC, Bombay and is currently being used at all the PHWRs in India for various IS1 campaigns. The system is designed with the aim of minimising radiation exposure to inspection personnel and to minimize reactor downtime. The BARCIS inspection head contains various ultrasonic and eddy current transducers enabling it to collect the following data: (a) Location and tilt of garter spring. (b) Presence of flaws in the PT. (c) Profile of the gap between PT and CT. (d) Profile of wall thickness of PT.
2.2 Eddy current testing of heat exchanger tubes
Stress corrosion cracking is the major failure mode observed in the case of heat exchanger tubes, since they are subjected to continuous flow of high temperature fluids, steam, and other aggressive environments. The deterioration of the tube material leads to the possibility of leaks. ECT is the most popular technique for periodic monitoring of these tubes because of its ease of operation, versatility and reliability. Conventional single frequency ECT is inadequate when interferences arise from such sources as support plates and other interferences/structures. Often, it is under the support plates that corrosion damage takes place. Multi-frequency techniques which eliminate signals from unwanted parameters like support plate, probe wobble, etc. are widely used. This technique involves, simultaneously, excitation of more than one frequency in ECT probes and
GARTER SPRING TILT ANGLE
I
I I
CIRCUM. LONG. NOTCH NOTCH
3X W.T. 3% W.T.
CIRCUMFERENTIAL
ALL DIMENSIONS IN mm
Fig. 2. Typical eddy current signals obtained from a garter spring and an artificial notch in a coolant channel of a
PHWR.
processing of the corresponding analog signals to eliminate signals due to unwanted parameters. At our Centre, we have standardised procedures for condi- tion monitoring of steam generators and condensers using two frequency ECT and successfully carried out inspection of such components. Procedures have also been developed to eliminate three parameters (support plates, probe wobble and sodium deposits) that would be present during ECT of heat exchangers of fast breeder reactors.
ECT of ferromagnetic heat exchanger tubes is difficult due to their high and continuously varying magnetic permeability. These variations produce high amplitude ECT signals that mask the signals from defects. The use of magnetic saturation can overcome these difficulties to a large extent. The ferromagnetic tubes can be satisfactorily inspected by ECT if they are magnetically saturated. Magnetic saturation essentially indicates a condition where all magnetic dipoles are aligned in the same direction parallel to each other and the material starts behaving as non-ferromagnetic. Magnetic saturation is easily achieved during tube manufacture using an external DC saturation coil and eddy current testing is carried out using an encircling eddy current probe. However, the same cannot be implemented during In-service Inspection (ISI) of heat exchangers or steam generators due to limited space from the boreside of the tube. In-service Inspection of ferromagnetic tubes by eddy current testing (ECT) is a major challenge. In this area, IGCAR has successfully designed an eddy current probe using a high strength SmCo, permanent magnet and the performance of the probe was evaluated using an ASME calibration tube (made of 2.25Cr-l.OMo steel) of a steam generator with artificial defects.’ As a further development to this, a compact probe using Nd-Fe-B permanent magnets has been fabricated and is currently under testing. This new probe is expected to have high sensitivity in addition to being compact.
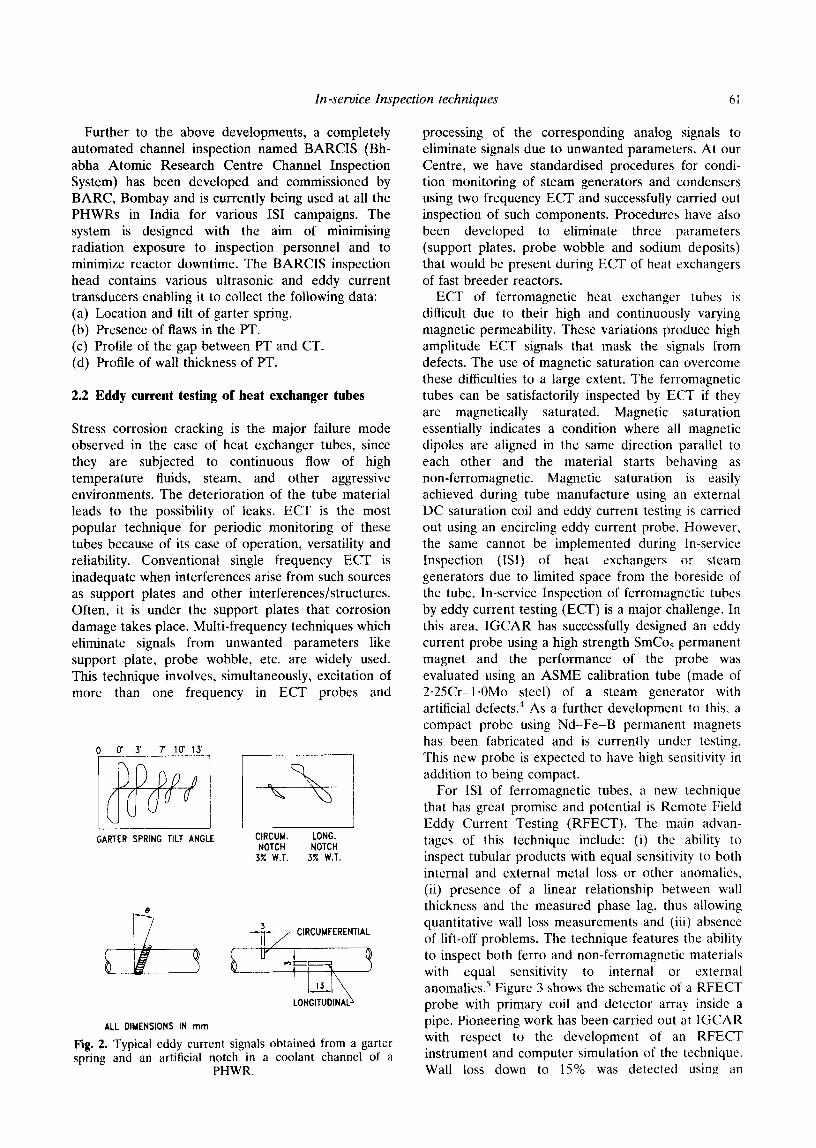
For ISI of ferromagnetic tubes, a new technique that has great promise and potential is Remote Field Eddy Current Testing (RFECT). The main advan- tages of this technique include: (i) the ability to inspect tubular products with equal sensitivity to both internal and external metal loss or other anomalies, (ii) presence of a linear relationship between wall thickness and the measured phase lag, thus allowing quantitative wall loss measurements and (iii) absence of lift-off problems. The technique features the ability to inspect both ferro and non-ferromagnetic materials with equal sensitivity to internal or external anomalies.’ Figure 3 shows the schematic of a RFECT probe with primary coil and detector array inside a pipe. Pioneering work has been carried out at IGCAR with respect to the development of an RFECT instrument and computer simulation of the technique. Wall loss down to 15% was detected using an
P. Rodriguez, B. Raj
INDIRECT
DETECTOR ARRAY
DIRECT COUPLING ZONE REMOTE FIELD ZONE
Fig. 3. Probe arrangement for remote field eddy current testing.
indigenously developed RFECT instrument. The presence of transition and remote field zone and the effect of tube diameter and wall thickness on them have been studied using a 2D-FEM code.6 Efforts are underway to optimise the frequency and other parameters to obtain better detection sensitivity.
One recent technique that has shown tremendous potential in detecting defects in expansion transition zones and rolled joints of heat exchangers, with equal sensitivity to both longitudinal and transverse defects,
(4
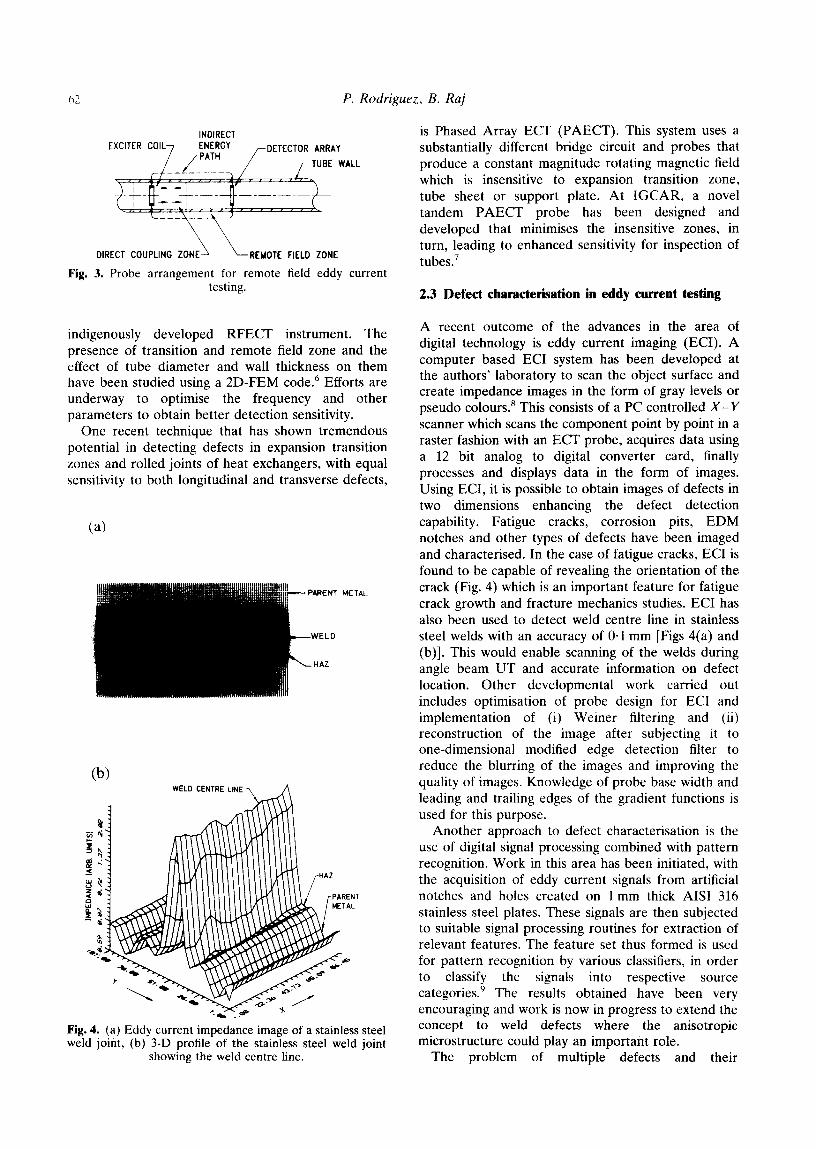
(b) WELD CENTRE LINE -, A
Fig. 4. (a) Eddy current impedance image of a stainless steel weld joint, (b) 3-D profile of the stainless steel weld joint
showing the weld centre line.
is Phased Array ECT (PAECT). This system uses a substantially different bridge circuit and probes that produce a constant magnitude rotating magnetic field which is insensitive to expansion transition zone, tube sheet or support plate. At IGCAR, a novel tandem PAECT probe has been designed and developed that minimises the insensitive zones, in turn, leading to enhanced sensitivity for inspection of tubes.’
2.3 Defect characterisation in eddy current testing
A recent outcome of the advances in the area of digital technology is eddy current imaging (ECI). A computer based EC1 system has been developed at the authors’ laboratory to scan the object surface and create impedance images in the form of gray levels or pseudo colours.’ This consists of a PC controlled X-Y scanner which scans the component point by point in a raster fashion with an ECT probe, acquires data using a 12 bit analog to digital converter card, finally processes and displays data in the form of images. Using ECI, it is possible to obtain images of defects in two dimensions enhancing the defect detection capability. Fatigue cracks, corrosion pits, EDM notches and other types of defects have been imaged and characterised. In the case of fatigue cracks, EC1 is found to be capable of revealing the orientation of the crack (Fig. 4) which is an important feature for fatigue crack growth and fracture mechanics studies. EC1 has also been used to detect weld centre line in stainless steel welds with an accuracy of O-1 mm [Figs 4(a) and (b)]. This would enable scanning of the welds during angle beam UT and accurate information on defect location. Other developmental work carried out includes optimisation of probe design for EC1 and implementation of (i) Weiner filtering and (ii) reconstruction of the image after subjecting it to one-dimensional modified edge detection filter to reduce the blurring of the images and improving the quality of images. Knowledge of probe base width and leading and trailing edges of the gradient functions is used for this purpose.
Another approach to defect characterisation is the use of digital signal processing combined with pattern recognition. Work in this area has been initiated, with the acquisition of eddy current signals from artificial notches and holes created on 1 mm thick AISI 316 stainless steel plates. These signals are then subjected to suitable signal processing routines for extraction of relevant features. The feature set thus formed is used for pattern recognition by various classifiers, in order to classify the signals into respective source categories.” The results obtained have been very encouraging and work is now in progress to extend the concept to weld defects where the anisotropic microstructure could play an important role.
The problem of multiple defects and their
In -service Inspection techniques 63
behaviour with respect to eddy current testing of heat exchangers and other similar components has always attracted the researcher’s attention. To effectively evaluate and understand the presence of multiple defects and their interactions, simulations of a number of practical situations (combination of axi-symmetric ID and OD defects of different sizes and depths) have been carried out using a 2D finite element model and validated experimentally.‘” The following observations were made from this study: (a) the signal amplitude of defect combinations is larger than that of individual ones, (b) the signal is complex in nature when the inter-defect spacing is less than two times the coil width, (c) the presence of a defect on or near the outer surface tends to shift the overall phase of the signal towards that of the defect present on the outer surface. Similarly, the presence of a defect on or near the inner surface tends to shift the overall phase of the signal trajectory towards that of the defect present in the inner surface.
2.4 Magnetic Barkhausen noise
Magnetic Barkhausen Noise (MBN) discovered in 1919 has been extensively investigated and its analysis is now an important NDT technique. The main mechanism of generation of this signal is the irreversible domain wall motions across energy barriers when a ferromagnetic material is subjected to a cyclic magnetic field. Such signals are acquired by pick up coils. Acoustic signals called Acoustic Barkhausen Noise (ABN) are also generated during cyclic magnetisation due to the rotation of the 90 domain walls.
Evaluation of the effectiveness of post weld heat treatment (PWHT) for releasing the residual stresses in 2-25Cr-1Mo steel tube sheet weld joint of a steam generator of a typical fast breeder reactor has been carried out by MBN analysis.” Apart from the requirement in the quality control procedure that the tube to tube sheet weld joints should be free from unacceptable defects that may lead to leakage paths as discussed earlier, it is also considered essential that post weld heat treatment (PWHT) should be used for removing most of the residual stresses whose presence, may also lead to the failure of the tube to tube-sheet weld joint. MBN measurements have been used to assess the residual stresses. MBN measure- ments were made at the weld centre, 5, 15, and 25 mm from the weld centre on both sides of the weldment. The measurement positions were selected in such a way as to cover weld, HAZ and base metal regions. After the measurements in the as-welded condition, the tubes were post weld heat treated at 973 K for one hour followed by air cooling. Again the MBN measurements were repeated at the same locations after removing the oxide layer. It was observed that,
after PWHT, the MBN peak height becomes more or less the same at all locations. There is a large increase in the MBN peak height in the weld and HAZ regions after PWHT as compared to base metal regions. This is attributed to the removal of residual stresses and reduction in dislocation density in the weld and HAZ during PWHT. It is possible to evolve an acceptance criterion based on MBN peak height values to ensure the effectiveness of PWHT.
Measurement of ABN has been found to be useful in the estimation of residual stresses in carbon steel weld pads. The rms voltage of the ABN signal has been used as a parameter for studying the influence of stress relief annealing on the stress distribution in the carbon steel weld pads. Increase in rms voltage of the ABN signal corresponding to the decrease in the residual stresses could be observed. The utilisation of magnetic parameters derived from hysteresis loop measurements and magnetic and acoustic Barkhausen noise signals for the assessment of microstructures, are emerging as a very promising technique for condition assessment of components.”
2.5 Infrared thermography
Infrared Thermography (IRT) refers to the mapping of the temperature profiles on the surface of an object. IRT has several important features which make it attractive for the inspection of components and plants. the method is non-contacting, dry, safe. fast and displays results of the inspection in a convenient visual format. It has been proved to be a very important tool for predictive maintenance in electrical systems, The technique, being non-contact, is very promising for remote applications. In the field of materials evaluation, IRT has been applied for monitoring fatigue damage and for mapping stress fields during cyclic mechanical testing. The technique holds great promise as a potential IS1 tool for damage assessment and condition monitoring.13
A number of IS1 campaigns have been successfully performed by the authors’ laboratory, including the 230 kV main transformer of a PHWR, 33 kV switchyard at Indira Gandhi Centre for Atomic Research (IGCAR) and concrete wall of turbine building of Fast Breeder Test Reactor.‘” The 230 kV main transformer of the Madras Atomic Power Station II was scanned on both the low voltage (16.6 kV) side and the high voltage (230 kV) side. The condition of the insulators on the top of the transformer and the connectors was also observed. The entire surface of the transformer was mapped using a 7” lens. Hot spots were observed on the low voltage (LV) side. The curved portions on the LV side indicated higher temperatures with the hottest point in the area around the bolts. The temperature distribution in the entire LV side was not even, indicating that there was no uniform gradient.
64 P. Rodriguez, B. Raj
Investigation on HV side indicated a peak tempera- ture of 313 K, and an almost uniform temperature distribution. Mapping of the bushings on the transformers indicated that the B phase bushing top had a maximum temperature of about 449 K and the connector about 423 K, followed by the R phase bushing top with about 433 K and the connector at 413 K, while the Y phase bushing top had a maximum temperature of about 383 K and the connector about 343 K. Subsequent investigations during shutdown indicated that the difference in the temperature among the connectors was due to loose connections in the B and R phase connectors.
3 ACOUSTIC TECHNIQUES
3.1 Acoustic emission technique (AET) for leak detection in an end shield of a PHWR
AET has been successfully applied for the detection and location of leak paths present in an inaccessible side of an end shield of unit 1 of Rajasthan Atomic Power Station (RAPS). This methodology was based on the facts that air and water leak AE signals have different characteristic features. Baseline data was generated from a sound end shield of a PHWR for characterising the background noise. A mock up end
-500.0~ 0 ' 0 0 1 0 1 0 1 1 0
FREOUENCY (MHz) 1.02
(4
-500.0~ ' 1 ' 1 ' 1 1 0
FREOUENCY (MHz) 1.02
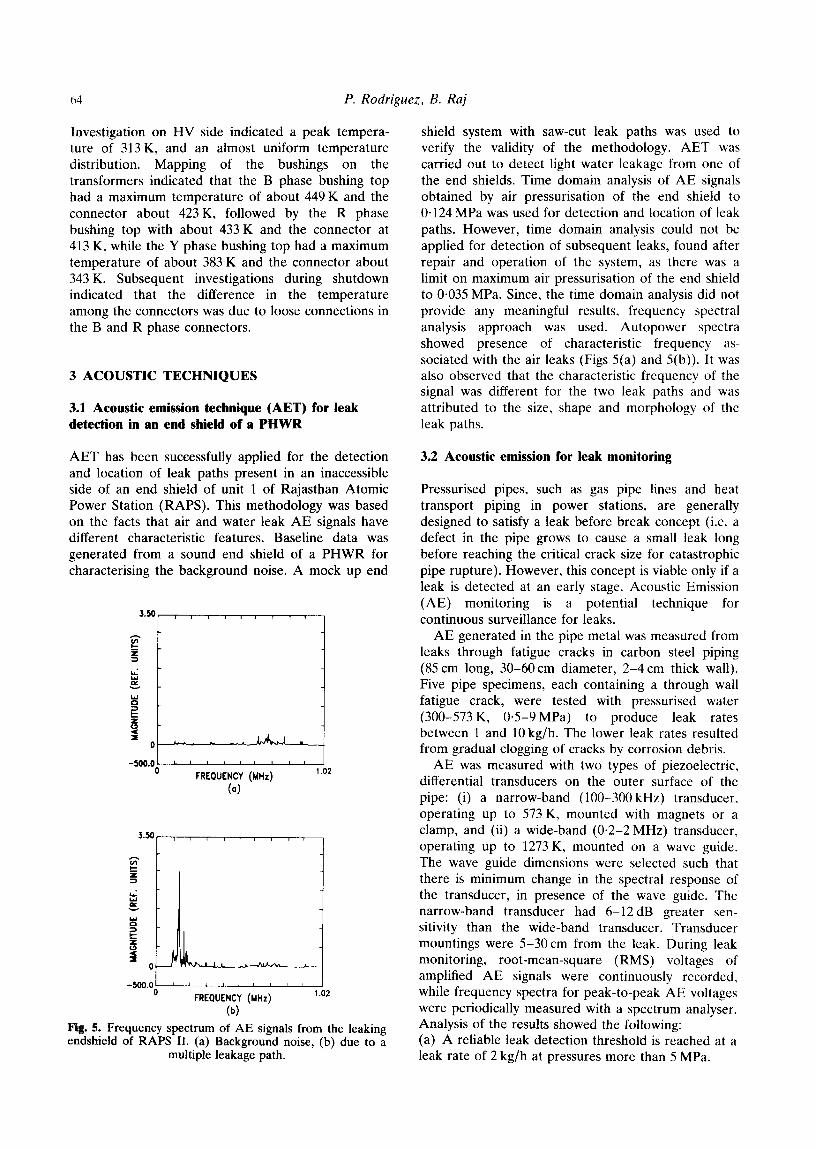
(b) Fig. 5. Frequency spectrum of AE signals from the leaking endshield of RAPS II. (a) Background noise, (b) due to a
multiple leakage path.
shield system with saw-cut leak paths was used to verify the validity of the methodology. AET was carried out to detect light water leakage from one of the end shields. Time domain analysis of AE signals obtained by air pressurisation of the end shield to 0.124 MPa was used for detection and location of leak paths. However, time domain analysis could not be applied for detection of subsequent leaks, found after repair and operation of the system, as there was a limit on maximum air pressurisation of the end shield to 0.035 MPa. Since, the time domain analysis did not provide any meaningful results. frequency spectral analysis approach was used. Autopower spectra showed presence of characteristic frequency as- sociated with the air leaks (Figs 5(a) and S(b)). It was also observed that the characteristic frequency of the signal was different for the two leak paths and was attributed to the size, shape and morphology of the leak paths.
3.2 Acoustic emission for leak monitoring
Pressurised pipes, such as gas pipe lines and heat transport piping in power stations, are generally designed to satisfy a leak before break concept (i.e. a defect in the pipe grows to cause a small leak long before reaching the critical crack size for catastrophic pipe rupture). However, this concept is viable only if a leak is detected at an early stage. Acoustic Emission (AE) monitoring is a potential technique for continuous surveillance for leaks.
AE generated in the pipe metal was measured from leaks through fatigue cracks in carbon steel piping (85 cm long, 30-60 cm diameter, 2-4 cm thick wall). Five pipe specimens, each containing a through wall fatigue crack, were tested with pressurised water (300-573 K, 0.5-9 MPa) to produce leak rates between 1 and 10 kg/h. The lower leak rates resulted from gradual clogging of cracks by corrosion debris.
AE was measured with two types of piezoelectric, differential transducers on the outer surface of the pipe: (i) a narrow-band (100-300 kHz) transducer, operating up to 573 K, mounted with magnets or a clamp, and (ii) a wide-band (O-2-2 MHz) transducer, operating up to 1273 K, mounted on a wave guide. The wave guide dimensions were selected such that there is minimum change in the spectral response of the transducer, in presence of the wave guide. The narrow-band transducer had 6-12 dB greater sen- sitivity than the wide-band transducer. Transducer mountings were 5-30cm from the leak. fiuring leak monitoring, root-mean-square (RMS) voltages of amplified AE signals were continuously recorded, while frequency spectra for peak-to-peak AE voltages were periodically measured with a spectrum analyser. Analysis of the results showed the following: (a) A reliable leak detection threshold is reached at a leak rate of 2 kg/h at pressures more than 5 MPa.
In-service Inspection techniques 65
(b) Observed AE does not relate quantitatively to a leak rate; clogged leaks with lower leak rates generate as much AE as large unclogged leaks, this effect is beneficial because it enhances AE leak detection capability. (c) The pressure drop across a leak contributes more to the metal-borne AE from a leak than the temperature of the leaking fluid.
3.3 Leak detection in pressure tubes of PHWRs
In a condition assessment campaign undertaken, two possible leaking pressure tubes among the 306 pressure tubes in the unit 1 of Madras Atomic Power Station were detected using acoustic emission technique (AET) coupled with signal analysis. It would not have been possible to identify the two suspect channels, but for signal analysis, as there is no ready-made methodology for this problem. Failure of regular time domain methodology, was expected, because of a poor signal to noise ratio of the leak signal. Hence advanced signal analysis approaches became essential. There was an added difficulty of carrying out the campaign with minimum man-rem consumption.
Plant personnel had observed heavy water leakage in the Calandria vault. Investigations revealed that the leakage is from one of the 306 pressure tubes. The only possible technique to identify the leaking pressure tube is the AET because of its potential for leak detection even in inaccessible locations by having a direct acoustic contact between the leak location and the accessible part of the component/system. Applica- tion of this technique for this problem is difficult and challenging due to the necessity for adopting methods for reducing the man-rem consumption and to handle leak signals with a poor signal to noise ratio.
The high background noise associated with a leak signal, particularly due to operation of primary heat transport (PHT) pumps did not permit use of simple and routinely used time domain parametric approach. Additionally, the characteristics of the signals from different channels due to background noise are not similar and hence it was not easy to identify the leaking channel. Therefore, the first task was to segregate the channels with similar signal characteris- tics into different groups and to select the group containing the suspected leaking channel. Accord- ingly, a group of 15 channels was short listed as the possible leaking channels from the 306 channels using the criterion that the leaking channel should have signals with frequencies above 200 kHz.
In order to further narrow down the number of suspect channels, signals from these channels were obtained at two different pressure levels. The ratio of the spectral energy between two different frequency bands, namely 700-1000 kHz and 40-175 kHz, and its variation with an increase in pressure was used to
narrow down the number of suspect channels to two. For both these two channels, this ratio increased with an increase in the pressure. Thus, AET had identified two suspect channels. Subsequent investigations by the plant personnel using vacuum testing and hydro testing confirmed that one of the channels identified by the AET has the heavy water leakage. The possible reason for false alarm in the second channel is attributed to the lack of mock up studies to determine the transfer function of the coolant channel assembly as well as associate systems, which is a frequency dependent function, which could have been used as a weightage factor on the AE parameter used for identifying the leaking channel. Since this information was not available, the spectra in the present study were considered with unit weightage for the bandwidth of interest. The use of methodologies of signal processing and analysis, in this case, has helped in not only detecting the leak (in the presence of background noise) among 306 channels, but has also instilled confidence among the inspecting personnel on the reliability of their results and interpretation.”
3.4 Cbaracterisation of microstructures using ultrasonics
Ultrasonic parameters can be used for determination of material properties and characterisation of microstructures. For example, ultrasonic attenuation can be used to monitor material properties. Empirical correlations have been obtained between ultrasonic attenuation and the impact strength, fracture tough- ness, grain size and tensile strength of steels. Similarly, ultrasonic velocity measurements can be used to measure residual stresses in materials. This methodol- ogy uses shear waves polarised in two mutually perpendicular directions. These waves have slightly different velocities and therefore interfere, so that as the transducer is rotated, the interference vanishes when the polarising planes are parallel and perpen- dicular to the stress axis. Once this axis is known, the actual stress can be computed from the velocities. Stress measurements using ultrasonic technique are also dependent on the acousto-elastic effect, i.e. strain-induced change in ultrasonic wave velocity in materials. By precise measurement of ultrasonic velocity, information about stress can be obtained.
In the area of microstructural characterisation, ultrasonic velocity and attenuation measurements have been successfully adopted at IGCAR in the following applications: (i) characterisation of pre- cipitation behaviour and estimation of volume fractions of y’ in Nimonic alloy PE16, (ii) assessment of microstructural degradation (dissolution of tem- pered martensite structure to ferrite and carbides) in 9Cr-1Mo steel, (iii) characterisation of precipitation hardening behaviour in 17-4 PH (precipitation hardenable) steel. (iv) characterisation of various
hh P. Rodriguez, B. Raj
microstructures in A533B pressure vessel steel, (v) estimation of porosity in aluminium alloy weldments, (vi) determination of texture coefficients in cold worked 304 stainless steel and (vii) assessment of creep damage in low alloy ferritic steels. Many of these results would be useful in developing procedures for microstructural degradation.” It should be pointed out that the changes in the microstructures, many a time, change the velocity by as little as 0.2%. Therefore, for studying such changes in the mic- restructures. high resolution techniques for ultrasonic velocity measurements are necessary. At IGCAR, a methodology has been implemented for precise ultrasonic velocity measurements by using pulse echo overlap technique. In this technique, for accurate overlapping of the selected back-wall echoes, cross- correlating the selected back-wall echoes and then cubic spline fitting of the cross-correlated function have been employed.
3.5 Ultrasonic inspection of feed water nozzle joints in boiling water reactors
A very important IS1 technique in the BWR is the utlrasonic monitoring of a reactor vessel to nozzle joint areas through which feed water enters into the reactor vessel. In the two BWRs in India, the reactor vessel of 0.1238 m thickness made of carbon steel is clad inside by type 304 austenitic stainless steel of 0.005 m thickness to prevent corrosion. There has been great concern of the possibility of the initiation of stress corrosion cracks in the stainless steel cladding and their propagation into the carbon steel vessel. The complicated geometry and the inaccessibility at the inside region of the nozzles from where the crack initiates make the inspection particularly difficult. A systematic study has been carried out on this problem and an ultrasonic test procedure with optimised transducers has been standardised through the use of a mock up system. The manual manipulation of the transducers is proposed to be replaced by an automatic remote controlled system.
3.6 Digital signal analysis in ultrasonic testing
Analysis of NDT data by digital signal analysis techniques is often found to be essential to characterise a defect unambiguously. A very impor- tant example is the ultrasonic testing of austenitic stainless steel weld joints with large grains and a high degree of texture and anisotropy. Such microstruc- lures pose a great difficulty for detection of defects using ultrasonic testing because of poor signal-to-noise ratios. The noise due to grain scattering dominates the signal from a defect. Advanced signal analysis concepts like spectral analysis, pattern recognition, neural network analysis, etc. are employed in such cases. Dendritic (hence anisotropic) microstructures of
these weldments, especially in the thickness range of lo-40 mm pose problems for ultrasonic testing. Therefore, the ASME boiler and pressure vessel code is based on the criterion that the minimum defect that could be detected using ultrasonic testing is equivalent to 10% of the wall thickness in the case of austenitic stainless steel weldments. If reliable methodologies are available for detection of defects smaller than 10% wall thickness, then it would be possible to make more economic design of the components by reducing the wall thickness. This would also help in detection of incipient defects in service and monitor their growth to avoid unanticipated failures. In this connection, signal analysis (SA) procedures, by using effective cluster and pattern analysis algorithms have been developed, at IGCAR. These algorithms use cluster elements derived from the cross power spectrum obtained from the signals from the weld noise and those from the defects. The pattern analysis method generates a pattern called demodulated autocorrelo- gram (DMAC) from the autocorrelation function of a signal. Features of DMAC are studied for interpreta- tion and evaluation. These SA methodologies have enabled detection and characterisation of defects down to 1% of weld thickness in austenitic stainless steel weldments fabricated from plates of 14 mm thickness.”
4 ROLE OF ARTIFICIAL INTELLIGENCE IN IS1
In view of the increased number of testing techniques being put to practice in ISI, a very large amount of data, knowledge, expertise and heuristics are now available in the field of Nondestructive Testing and Evaluation (NDE). Though efforts are made to achieve more efficient data management, correlation and presentation, most of the critical information lies scattered without consolidation. Proper organisation and effective use of the available NDE knowledge, in the form of Knowledge Based Systems (KBS), will help taking quick and reliable decisions in the procedures to be adopted for efficient ISI. Such KBS can also distribute knowledge and expertise through- out any organisation.‘”
Some of the drawbacks of present day KBS for NDE can be summarised as follows: firstly, use of KBS for NDT&E, is being approached on a case to case basis. A uniform approach in the design of KBSs, which are valid for a host of NDE techniques, needs to be attempted. Secondly, KBS for NDE are realised in specific domains, making generalisation and learning difficult. Except in a few cases, no broad-based approach is attempted. Thirdly, there is no attempt to relate an algorithm or methodology adopted to solve a specific task, to a global/common intelligence required to solve a class of such problems.
In -service Inspection techniques 67
of which the specific task is just one member. Very subtle differences exist among the three aspects mentioned above.
These drawbacks call for a detailed study of KBSs, their scope and limitations for use in NDT&E. With these important aspects in mind, our Centre has embarked on a project for the development of comprehensive knowledge based systems in NDT&E. For the correct application of ultrasonic testing of austenitic stainless steel weldments, a knowledge based system has been developed at our Centre.‘” Named ULTREX, this system takes into account the requirement of the user, details about the weldment and the ultrasonic testing (UT) facilities available to him. before constructing a comprehensive advice on how to perform UT effectively. Similar KBSs are also currently under development for X- and gamma- radiography and eddy current testing. Each of these KBS is constructed on a modular basis in order tc facilitate communication among them for a total advice, comprising of all these three techniques, for a given problem.
Austenitic stainless steel (AUSS) components and structures find extensive applications in FBR prog- ramme. This is chiefly because of high level of fabricability and corrosion resistance both in sodium and water. UT is the most widely used NDE technique for the assessment of AUSS and their welds. As discussed in Section 3.6, UT of AUSS welds is very difficult. A whole range of new UT methodologies have been investigated in order to improve the UT inspection of AUSS welds. Some of them include ultrasonic spectroscopy, acoustic holog- raphy and synthetic aperture focussing technique (SAFT), etc. Automated systems are now available for the inspection of pipe welds with limited access in critical components in nuclear, oil and other industries. An integrated prototype knowledge based system (KBS) which helps in taking quick and reliable decisions in the UT procedures to be adopted for efficient NDE of AUSS welds has been developed at the authors’ laboratory. This KBS considers the following details before making a decision; dendritic microstructure of the weld, weld dimensions, ge- ometry, joint type, welding procedure, metallurgical history, reflective characteristics of various types of defects, equipment parameters, etc. Inspection of inaccessible regions and complex geometries would become simpler if an ultrasonic beam path is known. Visualisation software for simulating the path taken by an acoustic/ultrasonic wave inside the weld is currently under development at IGCAR.
The knowledge and data bases pertaining to these aspects are very large, but the expertise to assimilate and apply this large amount of knowledge is scarce. Intelligent and timely application of this knowledge is the key for improving the efficiency of UT of AUSS welds. Human experts have expertise in specific areas:
the complete problem of ultrasonic testing of AUSS welds requires the right combination of expertise in many of these areas. In this respect, there is already an acute and growing shortage of human experts. This is an example, where an evolving technology like knowledge based systems’ development and computer aided visualisation, can contribute to enhance the assessment of the condition of critical components through ISI.
5 CONCLUSION
An overview on some of the developments for IS1 of nuclear power plant components using magnetic, electromagnetic and acoustic NDT methods have been discussed with a few relevant case studies. The possible role of artificial intelligence and expert systems for effective IS1 is explored. A few ongoing developments both for PHWRs as well as FBRs are also indicated. The potentials of some of the newer techniques and philosophies to enhance the reliability of IS1 are explored. Some of the important developments that are currently under progress at IGCAR and have a significant potential as IS1 tools in the near future, include, electromagnetic acoustic transducer (EMAT) for detection of defects and material characterisation, automated defect charac- terisation by application of neural networks to eddy current signals, and an expert system for eddy current testing (EDDYEX). Efforts are also underway to use more than one NDT technique in supplementary and complementary ways for complete characterisation of defects through data fusion and analysis of signal parameters obtained from multiple NDT techniques.
ACKNOWLEDGEMENTS
The authors wish to acknowledge the contributions made by Mr P. Kalyanasundaram, Dr T. Jayakumar, Mr M. T. Shyamsunder, Mr C. Rajagopalan, and Mr A. S. Ramesh of the Division for PIE and NDT Development, IGCAR, during the preparation of the manuscript.
REFERENCES
1. Rao, B. P. C., Shyamsunder, M. T., Kalyanasundaram. P., Bhattacharya, D. K. and Raj, B.. &it&h J. of NDT, 1991, 33,437.
2. Rao, B. P. C., Shyamsunder, M. T., Bhattacharya, D. K. and Raj, B., Nuclear Technology, 199O,W, 389.
3. Shyamsunder, M. T. and Rao, B. P. C., Proc. of NDE-92, ed. C. R. L. Murthy, R. Baldev, 0. Prabahkar and A. Sreenivasulu. Interline Publishing, Bangalore. 1992, p. 141.
4. Shyamsunder, M. T., Rao. B. P. C., Babu Rao, C..
P. Rodriguez, B. Raj
Bhattacharya, D. K. and Raj, B., Proc. National Seminar err NDE, Madras, 1993, 31.
5. Schimdt. T. R., Materials Evaluation, 1989, 42, 225. 6. Rao, B. P. C., Babu Rao, C. and Raj, B., Proc. National
Seminur on NDE, NDE-93, ISNT, Madras, 1993. 7. Shyamsunder, M. T., Rao, B. P. C., Babu Rao, C.,
Bhattacharya, D. K. and Raj, B., Insight, 1994, 36, 434. 8. Rao, B. P. C., Shyamsunder, M. T., Babu Rao, C. and
Raj, B.. Proc. of 7th Asia-Pacific Conf: on NDT, Shanghai, China, 1994, p. 687.
9. Shyamsunder, M. T., Rajagopalan, C., Ray, K. K. and Raj, B., Insight. 1995, 37, 26.
10. Rao, B. P. C., Shyamsunder, M. T., Babu Rao, C. and Raj, B., Proc. 6th European Conf: on NDT, Nice, France, 1994, p. 251.
11. Moorthy, V., Vaidyanathan, S., Jayakumar, T. and Raj, B., Proc. National Welding Seminar (NWS-95), Cochin, India, 1995, p. 23.
12. Bhattacharya, D. K., Jayakumar, T. and Raj, B., Proc. of NDE-92, ed. C. R. L. Murthy, R. Baldev, 0. Prabhakar and A. Sreenivasulu. Interline Publishing, Bangalore, 1992, p. 110.
13. Raj, B., Venkatraman, B. and Babu Rao, C.. J. of NDE, 1990, 10, 1.
14. Venkatraman, B., Kanmani, S.. Babu Rao, C.. Bhattacharya, D. K. and Raj, B.. Proc. of NDE-92. ed. C. R. L. Murthy, R. Baldev, 0. Prabhakar and A. Sreenivasulu. Interline Publishing, Bangalore, 1992. p. 102.
15. Kalyanasundaram, P., Raj, B., Kasiviswanathan, K. V., Jayakumar, T. and Murthy, C. R. L., British J. of NDT, 1992,34,539.
16. Jayakumar, T.. Raj, B. and Rodriguez, P., Proc. Int. Symp. on Inelastic Deformation, Damage and Life Analysis (ICES-95). Hawaii, USA, 1995.
17. Kalyanasundaram, P., Rajagopalan, C., Raj, B.. Prabhakar, 0. and Sarma, D. G. R.. &it. J. of NDT, 1991, 33, 290.
18. Raj, B.. Proc. of the 7th Aisa-Pacific Con& on NDT, Shanghai, China, 1993, 18.
19. Rajagopalan, C., Kalyanasundaram, P. and Raj, B., Proc. NDE-92. ed. C. R. L. Murthy, R. Baldev, 0. Prabhakar and A. Sreenivasulu. Interline Pub. Ban- galore, 1992, 1.55.