Embed Size (px)
Citation preview
Institut für Halle Institute for Economic Research
Wirtschaftsforschung Halle
EU-Project ECFIN/2004/A3-02
“The performance of European labour markets on the basis of data obtained from the June 2004 ad hoc labour
market survey“
Final Report
Contractor: Halle Institute for Economic Research (IWH)
Kleine Märkerstrasse 8 06108 Halle (Saale) Tel.: +49 (345) 7753770 Contacting person: Dr. Herbert Buscher
Co-authors: Dr. Cornelia Lang Gabriele Hardt
Halle (Saale), Oktober 2005
Research team: Dr. Herbert S. Buscher (Coordinator)
Dr. Cornelia Lang Gabriele Hardt Acknowledgements We especially thank Jan Sauermann for writing the part on age-specific topics as well as for valuable suggestions. We would also like to thank Katrin Konrad for her valuable assistance in preparing the data, constructing the tables and carefully reading the final version. Any remaining errors are our responsibility. Contact: Dr. Herbert S. Buscher
Halle Institute for Economic Research (IWH)
Kleine Märkerstrasse 8 06108 Halle (Saale) Tel.: +49 (345) 7753-770 Fax: +49 (345) 7753-825 Email: [email protected] Web: http://www.iwh-halle.de
Abbreviations used at Austria
be Belgium
cy Cyprus
cz Czech Republic
de Germany
dk Denmark
ee Estonia
el Greece
es Spain
fi Finland
fr France
hu Hungary
ie Ireland
it Italy
lt Lithuania
lu Luxembourg
lv Latvia
mt Malta
nl Netherlands
pl Poland
pt Portugal
se Sweden
si Slovenia
sk Slovakia
uk United Kingdom

I
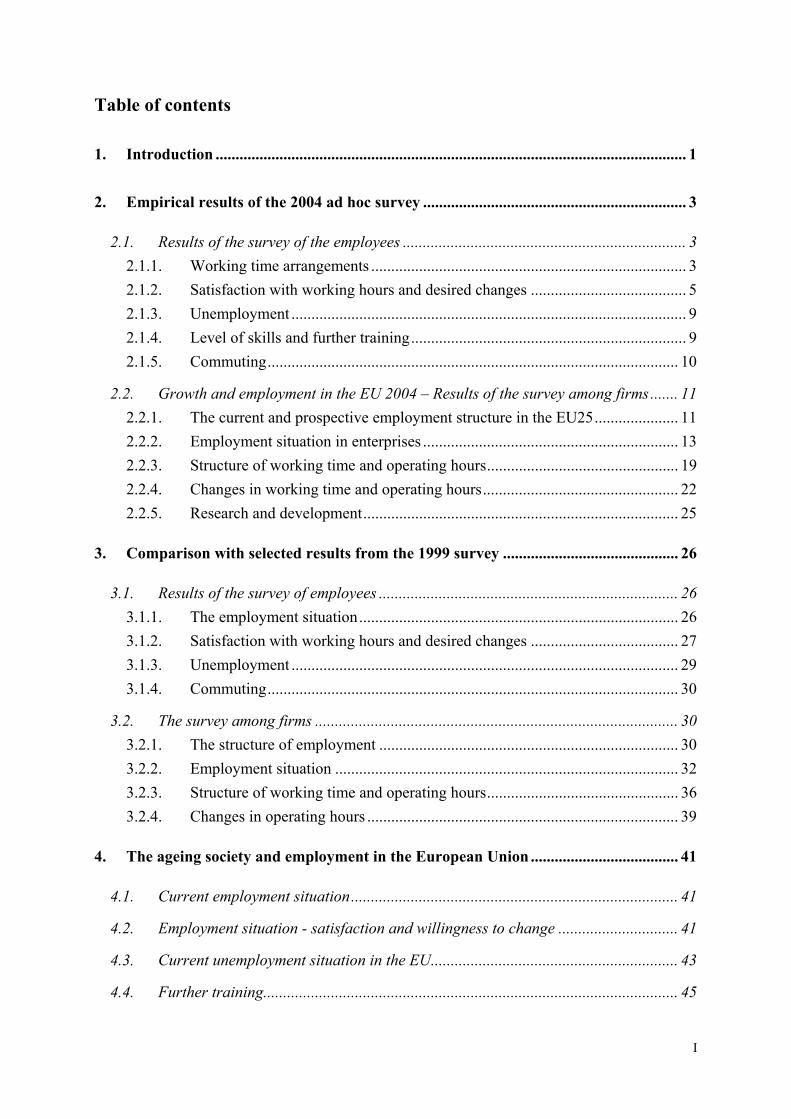
Table of contents
1. Introduction ...................................................................................................................... 1
2. Empirical results of the 2004 ad hoc survey .................................................................. 3
2.1. Results of the survey of the employees ....................................................................... 3 2.1.1. Working time arrangements ............................................................................... 3 2.1.2. Satisfaction with working hours and desired changes ....................................... 5 2.1.3. Unemployment ................................................................................................... 9 2.1.4. Level of skills and further training..................................................................... 9 2.1.5. Commuting....................................................................................................... 10
2.2. Growth and employment in the EU 2004 – Results of the survey among firms....... 11 2.2.1. The current and prospective employment structure in the EU25..................... 11 2.2.2. Employment situation in enterprises ................................................................ 13 2.2.3. Structure of working time and operating hours................................................ 19 2.2.4. Changes in working time and operating hours................................................. 22 2.2.5. Research and development............................................................................... 25
3. Comparison with selected results from the 1999 survey ............................................ 26
3.1. Results of the survey of employees ........................................................................... 26 3.1.1. The employment situation................................................................................ 26 3.1.2. Satisfaction with working hours and desired changes ..................................... 27 3.1.3. Unemployment ................................................................................................. 29 3.1.4. Commuting....................................................................................................... 30
3.2. The survey among firms ........................................................................................... 30 3.2.1. The structure of employment ........................................................................... 30 3.2.2. Employment situation ...................................................................................... 32 3.2.3. Structure of working time and operating hours................................................ 36 3.2.4. Changes in operating hours .............................................................................. 39
4. The ageing society and employment in the European Union ..................................... 41
4.1. Current employment situation.................................................................................. 41
4.2. Employment situation - satisfaction and willingness to change .............................. 41
4.3. Current unemployment situation in the EU.............................................................. 43
4.4. Further training........................................................................................................ 45
II
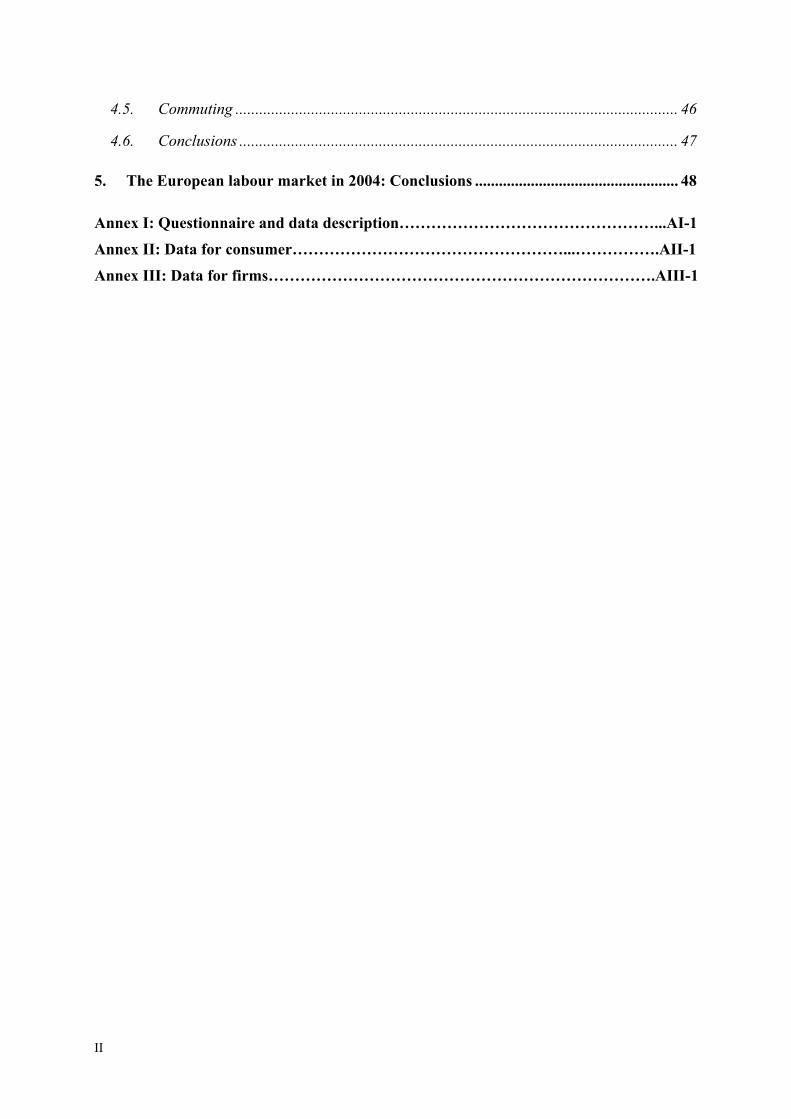
4.5. Commuting ............................................................................................................... 46
4.6. Conclusions .............................................................................................................. 47
5. The European labour market in 2004: Conclusions ................................................... 48
Annex I: Questionnaire and data description…………………………………………...AI-1
Annex II: Data for consumer……………………………………………...…………….AII-1
Annex III: Data for firms……………………………………………………………….AIII-1
III
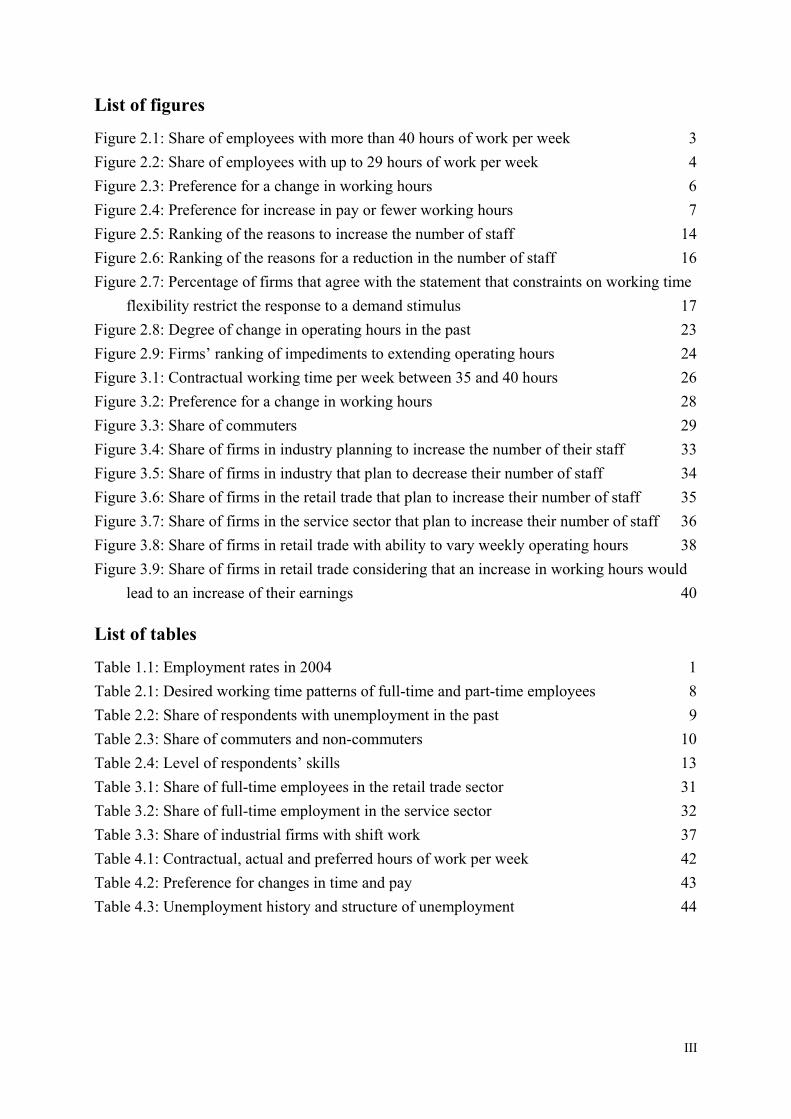
List of figures
Figure 2.1: Share of employees with more than 40 hours of work per week 3 Figure 2.2: Share of employees with up to 29 hours of work per week 4 Figure 2.3: Preference for a change in working hours 6 Figure 2.4: Preference for increase in pay or fewer working hours 7 Figure 2.5: Ranking of the reasons to increase the number of staff 14 Figure 2.6: Ranking of the reasons for a reduction in the number of staff 16 Figure 2.7: Percentage of firms that agree with the statement that constraints on working time
flexibility restrict the response to a demand stimulus 17 Figure 2.8: Degree of change in operating hours in the past 23 Figure 2.9: Firms’ ranking of impediments to extending operating hours 24 Figure 3.1: Contractual working time per week between 35 and 40 hours 26 Figure 3.2: Preference for a change in working hours 28 Figure 3.3: Share of commuters 29 Figure 3.4: Share of firms in industry planning to increase the number of their staff 33 Figure 3.5: Share of firms in industry that plan to decrease their number of staff 34 Figure 3.6: Share of firms in the retail trade that plan to increase their number of staff 35 Figure 3.7: Share of firms in the service sector that plan to increase their number of staff 36 Figure 3.8: Share of firms in retail trade with ability to vary weekly operating hours 38 Figure 3.9: Share of firms in retail trade considering that an increase in working hours would
lead to an increase of their earnings 40 List of tables
Table 1.1: Employment rates in 2004 1 Table 2.1: Desired working time patterns of full-time and part-time employees 8 Table 2.2: Share of respondents with unemployment in the past 9 Table 2.3: Share of commuters and non-commuters 10 Table 2.4: Level of respondents’ skills 13 Table 3.1: Share of full-time employees in the retail trade sector 31 Table 3.2: Share of full-time employment in the service sector 32 Table 3.3: Share of industrial firms with shift work 37 Table 4.1: Contractual, actual and preferred hours of work per week 42 Table 4.2: Preference for changes in time and pay 43 Table 4.3: Unemployment history and structure of unemployment 44

1
1. Introduction
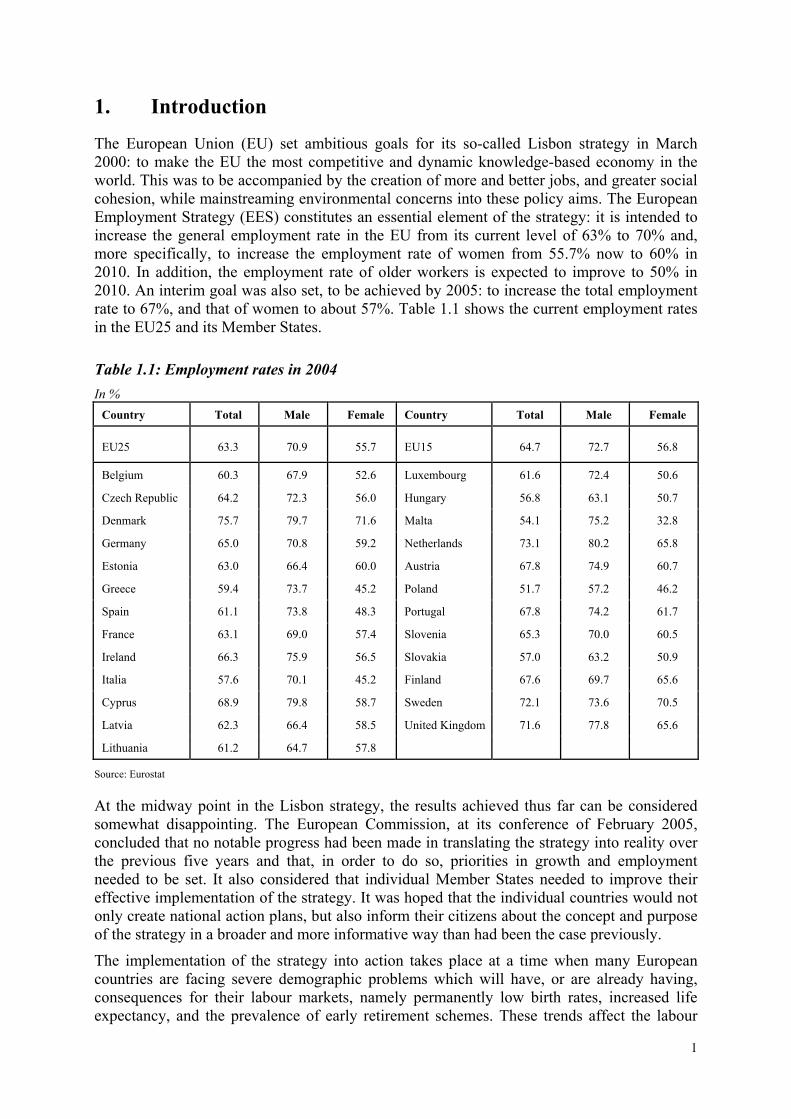
The European Union (EU) set ambitious goals for its so-called Lisbon strategy in March 2000: to make the EU the most competitive and dynamic knowledge-based economy in the world. This was to be accompanied by the creation of more and better jobs, and greater social cohesion, while mainstreaming environmental concerns into these policy aims. The European Employment Strategy (EES) constitutes an essential element of the strategy: it is intended to increase the general employment rate in the EU from its current level of 63% to 70% and, more specifically, to increase the employment rate of women from 55.7% now to 60% in 2010. In addition, the employment rate of older workers is expected to improve to 50% in 2010. An interim goal was also set, to be achieved by 2005: to increase the total employment rate to 67%, and that of women to about 57%. Table 1.1 shows the current employment rates in the EU25 and its Member States.
Table 1.1: Employment rates in 2004 In %
Country Total Male Female Country Total Male Female
EU25 63.3 70.9 55.7 EU15 64.7 72.7 56.8
Belgium 60.3 67.9 52.6 Luxembourg 61.6 72.4 50.6
Czech Republic 64.2 72.3 56.0 Hungary 56.8 63.1 50.7
Denmark 75.7 79.7 71.6 Malta 54.1 75.2 32.8
Germany 65.0 70.8 59.2 Netherlands 73.1 80.2 65.8
Estonia 63.0 66.4 60.0 Austria 67.8 74.9 60.7
Greece 59.4 73.7 45.2 Poland 51.7 57.2 46.2
Spain 61.1 73.8 48.3 Portugal 67.8 74.2 61.7
France 63.1 69.0 57.4 Slovenia 65.3 70.0 60.5
Ireland 66.3 75.9 56.5 Slovakia 57.0 63.2 50.9
Italia 57.6 70.1 45.2 Finland 67.6 69.7 65.6
Cyprus 68.9 79.8 58.7 Sweden 72.1 73.6 70.5
Latvia 62.3 66.4 58.5 United Kingdom 71.6 77.8 65.6
Lithuania 61.2 64.7 57.8
Source: Eurostat
At the midway point in the Lisbon strategy, the results achieved thus far can be considered somewhat disappointing. The European Commission, at its conference of February 2005, concluded that no notable progress had been made in translating the strategy into reality over the previous five years and that, in order to do so, priorities in growth and employment needed to be set. It also considered that individual Member States needed to improve their effective implementation of the strategy. It was hoped that the individual countries would not only create national action plans, but also inform their citizens about the concept and purpose of the strategy in a broader and more informative way than had been the case previously.
The implementation of the strategy into action takes place at a time when many European countries are facing severe demographic problems which will have, or are already having, consequences for their labour markets, namely permanently low birth rates, increased life expectancy, and the prevalence of early retirement schemes. These trends affect the labour
2
markets in various ways. Early retirement schemes waste human capital and increase the burden on social security systems. Lower birth rates will lead to a lack of qualified employees entering the labour market in the long run, and increased life expectancy together with better health will extend people’s working lives, as older workers in particular stay on longer in the labour market. Finally, as women nowadays are as well educated as men, they will make up a progressively increasing share of the labour force.
Bringing more people into the labour market, including those who have hitherto been “inactive”, requires two conditions for success. First, the economy must create new and better jobs, and, second, working hours must become more flexible to meet the needs of certain segments of the labour force, e.g. women. This may include more part-time work, flexible working hours with respect to both the workweek and annual working time, sabbaticals, etc. More flexible working hours, over the week as well as over the year, enable parents – especially mothers with young children – to participate actively in the labour market. Existing working time regulations, by contrast, such as shift work, weekend work, and night work often lead to difficulties in reconciling work and family life. A work–life balance can only be achieved if the framework makes allowance for both. In the face of all the thinking about how to activate and enlarge the existing labour force, the EU unemployment rate has risen slightly over the last few years, to 9.1% in 2004. Thus the labour market faces a further struggle, namely how to reduce unemployment permanently. This report provides some background information on how employees assess their work situation and how employers assess potential problems for growth and employment creation. It is based on a survey which was conducted in June 2004 as an extension to the Joint Harmonised EU Programme of Business and Consumer Surveys1.
The 2004 survey was carried out among both employees and employers in the industry, retail trade, and service sectors. Section 2.1 reports the results of the survey among employees while section 2.2 presents the results of the surveys among employers.
A similar survey was carried out in June 1999. Chapter 3 of this report provides a comparison of selected results of the 2004 survey with those of 1999. Since the 1999 survey was carried out only among the countries, which were members of EU at the time, the comparison is limited to these countries.
As a special focus topic we present data on the current situation of older employees in the EU in chapter 4.
Three country aggregates are considered: the whole EU (EU25), the EU before the latest enlargement (EU15), and the recently acceded Member States (EU10). The weights used for aggregating the country results are the same as those used for the aggregation of the monthly results of the Joint Harmonised EU Programme of Business and Consumer Surveys.2 Concerning the analysis of the data on individual countries, for the sake of clarity we round the results to the nearest integer. When considering either the EU25 as a whole or the EU15, however, we sometimes deviate from this principle in order to present more detailed information at the aggregate level.
1 A description of the Joint Harmonised EU Programme of Business and Consumer Surveys is available from
http://ec.europa.eu/comm/economy_finance/indicators/businessandconsumer_en.htm 2 Cf. Joint Harmonised EU Programme of Business and Consumer Surveys: User Guide,
http://ec.europa.eu.int/comm/economy_finance/indicators/business_consumer_surveys/userguide_en.pdf
3
2. Empirical results of the 2004 ad hoc survey
2.1. Results of the survey of the employees 2.1.1. Working time arrangements In the EU15, around two thirds of the employees have contractual working hours of between 35 and 40 hours per week. Only 10% of the interviewees have a contractual working week of more than 40 hours in the EU15. A noteworthy result is shown for the United Kingdom where some 17% of employed men report to work longer than 45 hours a week. In the EU10, working hours are somewhat longer than in the former EU15. In particular, the proportion of employees with a contractual working time of between 35 and 40 hours per week is 70%. Moreover, 20% of the respondents have work contracts of more than 40 hours. The Czech Republic and Slovakia have the highest proportion of respondents with a contractual working week of more than 40 hours (39% and 31% of employees, respectively).
Whereas in many countries the share of employees with “normal” weekly working hours (i.e. 35 to 40 hours a week) is clearly higher for men than for women, the situation is more balanced in the EU10, particularly in Slovenia (88% male compared to 86% female), Estonia (84% compared to 81%) and Poland (69% compared to 71%). Among the EU15 countries, a relatively equal gender balance can be reported for Portugal (83% male compared to 74% female) and Finland (90% compared to 80%).
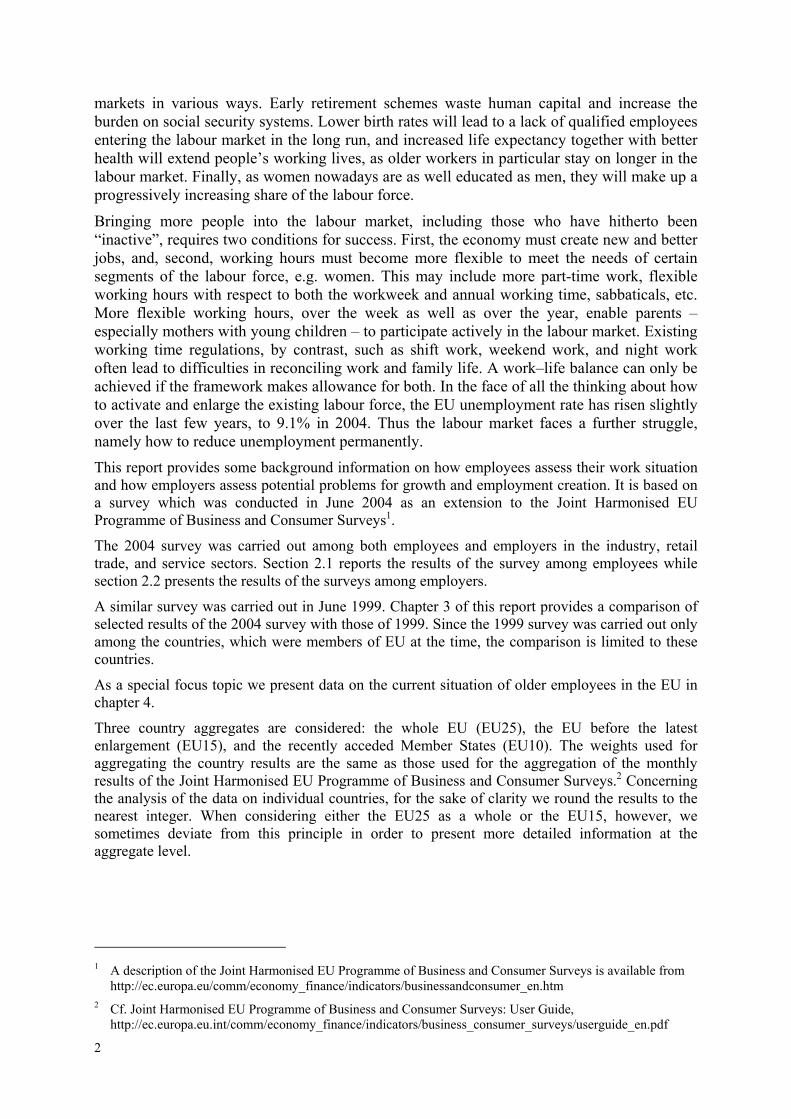
For some EU countries, considerable discrepancies are shown between the share of employees who are contracted to work more than 40 hours per week and those who actually do so. For example, in Austria the figures are 8% versus 42%, and in Germany 6% versus 36%, respectively. In the EU10, on average 20% of the employees have working contracts of more than 40 hours but 41% actually work more than 40 hours. In Slovenia and Lithuania, in particular, 9% and 6% of the employees have working contracts of more than 40 hours per week, but in practice 41% and 44%, respectively, work more than 40 hours. The figures for the Czech Republic are 39% versus 66% and for Slovakia 31% versus 49%. The corresponding figures for Poland and Hungary are 17% versus 35% and 15% versus 39%, respectively (see figure 2.1).
Figure 2.1: Share of employees with more than 40 hours of work per week Question 1a/consumer; total; in %
Source: Ad hoc labour market survey EU 2004
These discrepancies between contract and actual working hours also hold for female employees. In Germany, for instance, even though only 2% of female employees have
0
10
20
30
40
50
60
70
de fr it uk es se nl be at fi dk pt ie el lu pl cz hu si sk lt lv cy ee mt EU15
EU10
EU25
Contractual working time
Actual working time
4
working contracts of over 40 hours, 20% still answered that they actually work more than 40 hours per week. A similar situation holds for female employees in the United Kingdom, Spain, Sweden, Austria, and Greece. In the EU10, the percentage of women working more than 40 hours, both contractual and actual, is higher than in the EU15. For example, in the Czech Republic, 34% of female employees are contracted to work more than 40 hours and 57% do so in practice, the highest figure in the EU.
Contrary to full-time employees, for part-time employees contractual and actual working hours move more closely together. In the EU as a whole, 15% of the respondents answer that they have work contracts of up to 24 hours a week, and 14% actually work no more than this limit. Thus, overtime tends to affect mainly full-time rather than part-time workers.
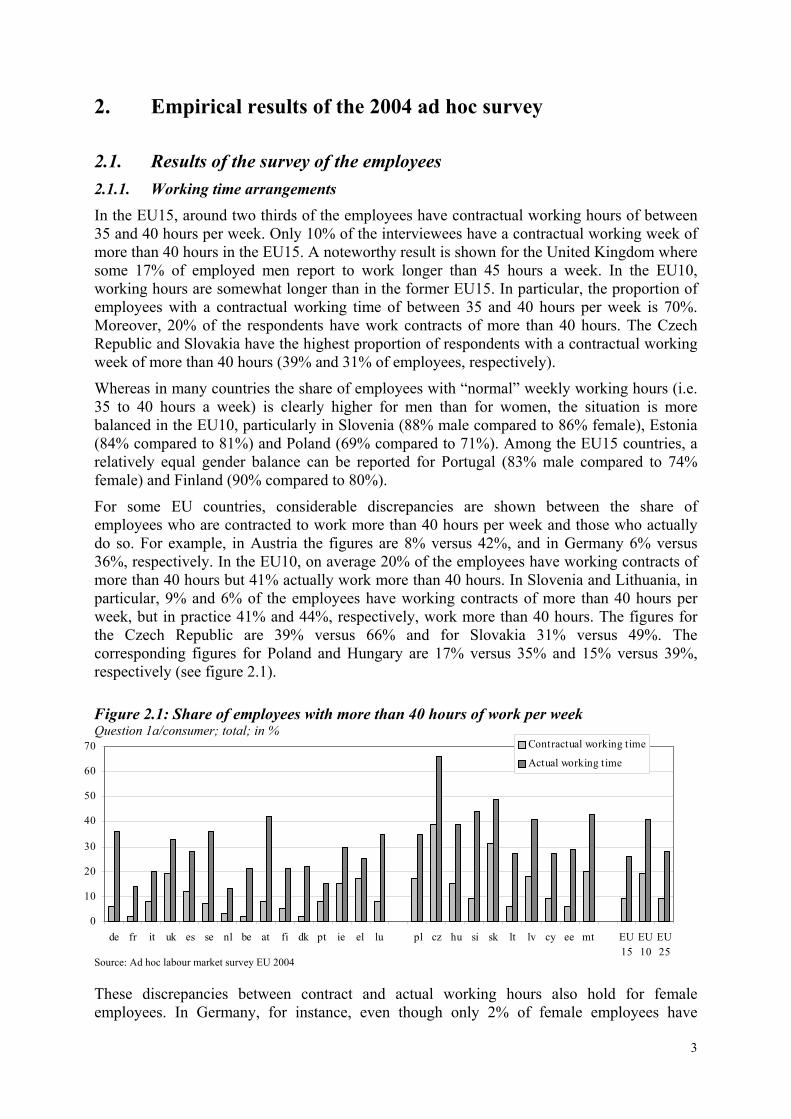
Broken down by gender, the figures for the EU25 indicate that part-time work is still dominated by women. 33% of female respondents report a work contract of up to 29 hours per week, and 32% actually work those hours. In the EU10, where women’s working hours are generally higher, the percentage of female employees working contractually up to 29 hours is more moderate at 10%. As it is the case in general, differences between contractual and actual working hours are considerably smaller for the segment of female employees working up to 29 hours per week than it is for female employees working more than 40 hours (figure 2.2).
Figure 2.2: Share of employees with up to 29 hours of work per week Question 1a/consumer; female employees; in %
Source: Ad hoc labour market survey EU 2004
The survey results indicate that, as workers get older their contractual working hours decline, and this is especially true for female employees. Women in the EU10 are again an exception, i.e. they are more likely to retain their longer working hours as they get older.
There are no noteworthy differences between the public and the private sector regarding weekly working hours.
As to the number of work days per week, the majority of respondents (71%) state that they work five days a week. Only 13% work 6 days a week. At the country level, some strong differences emerge for the group of employees who work less than 5 days. Whereas, EU-wide, only 14% of employees work less than five days per week, this percentage is 37% in the Netherlands, 29% in Spain and 26% in Italy. For female employees, this percentage rises to 61% in the Netherlands. In the EU as whole, only slightly more women than men work less than five days per week.
In the public sector, the 5-day workweek appears to be more prevalent than in the private sector. This is particularly so for female employees: in the public sector only 9% of the
0
10
20
30
40
50
60
de fr it uk es se nl be at fi dk pt ie el lu pl cz hu si sk lt lv cy ee mt EU15
EU10
EU25
Contractual working timeActual working time
5
respondents work six days per week while it is 15% in the private sector. In the EU10, 22% of private-sector employees have a 6-day week.
In the EU15, 18% of the employees regularly work shifts as compared to 28% in the EU10. 74% of all respondents do not work shifts, and 80% do not work at night. 29% of the interviewees in the EU15 and 41% in the EU10 sometimes work on Saturdays, and roughly one third in both areas “sometimes” or “regularly” work on Sundays. These results relate to weekend work as part of the regular work and not due to additional employment. There is little difference between the EU15 and the EU10 countries on this question.
Looking at individual countries, Luxembourg leads the field in shift work, with 63% of the employees regularly and 17% occasionally working shifts. The Netherlands are on the other end, with 93% of the respondents never working shifts, followed by France and Denmark. One third of the respondents in Spain and the United Kingdom report that they regularly work on Saturdays. The UK has the highest number of people working also on Sundays (24%), followed by Spain and Cyprus with 20%.
Working overtime is a regular experience for 18% of the employees in the EU as a whole. An additional 41% “sometimes” work overtime while 41% responded that they never work overtime. The latter percentage is significantly smaller in the Czech Republic (19%) and in Germany (22%). The highest share of employees working overtime can be found in Austria (32%) and the Netherlands (31%), the lowest in Lithuania (7%) and Portugal (5%). If those who “sometimes” work overtime and those who “regularly” work overtime are added together, 81% of Czech employees, 78% of German employees and 75% of Slovakian employees fall into this category - but “only” 41% in Britain and 40% in Ireland.
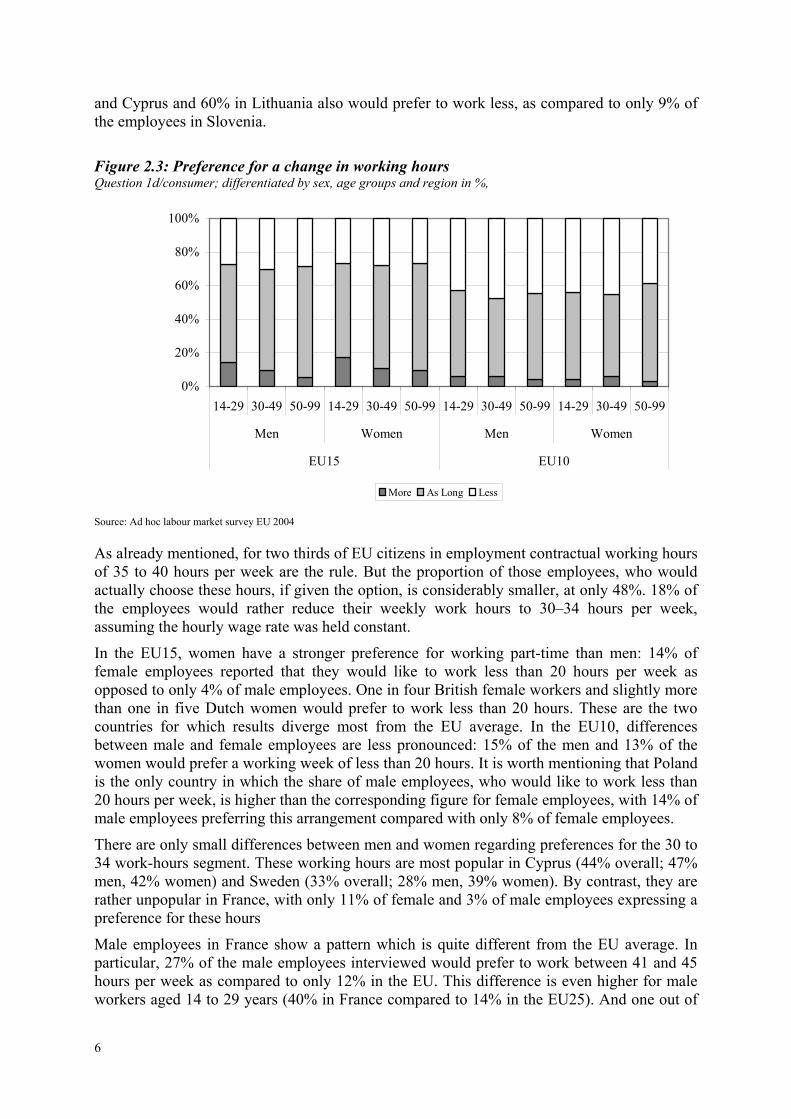
2.1.2. Satisfaction with working hours and desired changes The survey included also questions about the degree of employees’ satisfaction with their current working hours. Assuming that their hourly wage rate stayed the same, 10% of the interviewees replied that they wish to work more hours, 29% responded they would prefer to work less, while 61% would like their working hours to remain unchanged. It has already been mentioned that working hours are longer in the EU10. It is perhaps for this reason that 45% of the interviewees in the EU10 would prefer to work less and only 6% more. This result holds for both male and female employees.
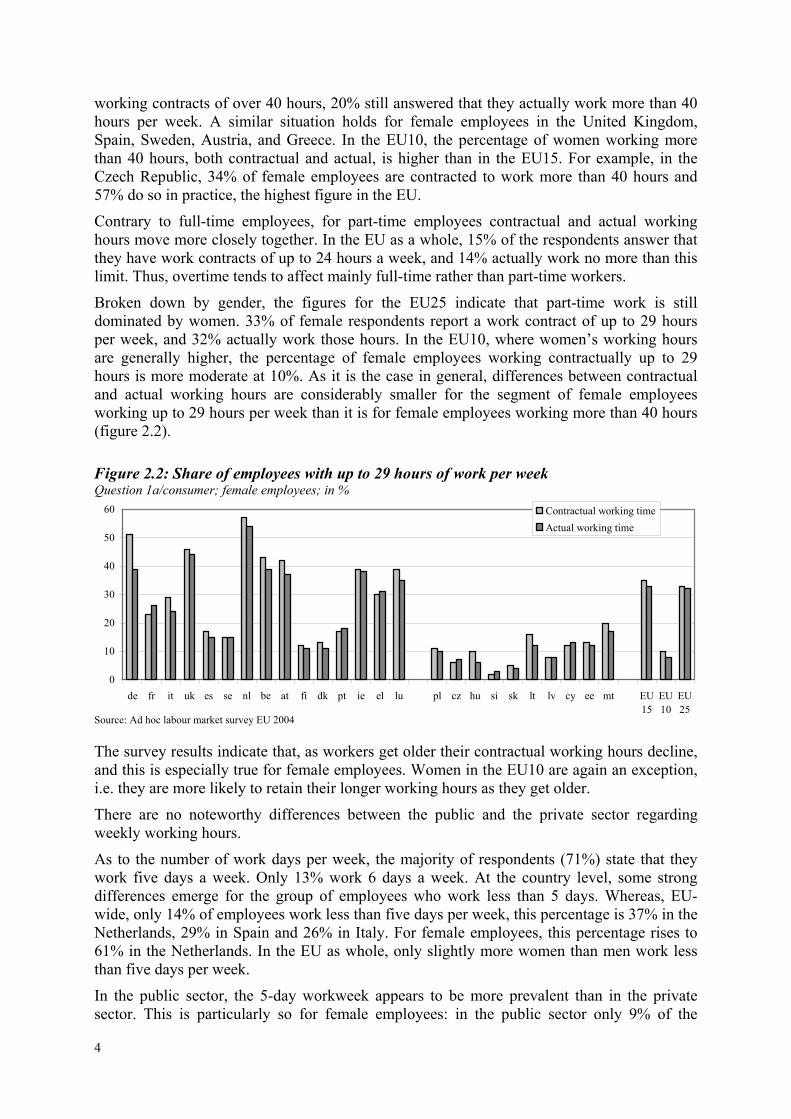
Broken down by age, the figures show that there is greater willingness to work longer hours among younger employees in the EU15, i.e. those aged between 14 and 29 (see figure 2.3). One reason may be that younger employees actually work less than older employees. Another possible interpretation of this result might be the life cycle effect: a tendency to work more when young, and less when older. It is also worth noting that individuals’ preference for working more or less seems to be more strongly related to their economic and social situation than to the sector they are employed in, since the results do not show significantly divergent patterns for different sectors.
In the EU15, Dutch employees seem to have the highest satisfaction with their current working hours, with 87% of the respondents not wanting to change their current situation because they already work less than others. Italian and French employees also show a high degree of satisfaction with their current working hours, with roughly two thirds not wishing a change. By contrast, 58% of Greek employees would like to work less, followed by 48% of Swedish and 47% of Spanish workers, with French workers at the opposite end of the spectrum – only 3% of the French employees would prefer to work less. In the EU10, Hungarian employees are the least satisfied: only 27% want their current situation unchanged, whereas 69% would like to work less at a constant wage rate. 62% of the employees in Malta
6
0%
20%
40%
60%
80%
100%
14-29 30-49 50-99 14-29 30-49 50-99 14-29 30-49 50-99 14-29 30-49 50-99
Men Women Men Women
EU15 EU10
More As Long Less
and Cyprus and 60% in Lithuania also would prefer to work less, as compared to only 9% of the employees in Slovenia.
Figure 2.3: Preference for a change in working hours Question 1d/consumer; differentiated by sex, age groups and region in %,
Source: Ad hoc labour market survey EU 2004
As already mentioned, for two thirds of EU citizens in employment contractual working hours of 35 to 40 hours per week are the rule. But the proportion of those employees, who would actually choose these hours, if given the option, is considerably smaller, at only 48%. 18% of the employees would rather reduce their weekly work hours to 30–34 hours per week, assuming the hourly wage rate was held constant.
In the EU15, women have a stronger preference for working part-time than men: 14% of female employees reported that they would like to work less than 20 hours per week as opposed to only 4% of male employees. One in four British female workers and slightly more than one in five Dutch women would prefer to work less than 20 hours. These are the two countries for which results diverge most from the EU average. In the EU10, differences between male and female employees are less pronounced: 15% of the men and 13% of the women would prefer a working week of less than 20 hours. It is worth mentioning that Poland is the only country in which the share of male employees, who would like to work less than 20 hours per week, is higher than the corresponding figure for female employees, with 14% of male employees preferring this arrangement compared with only 8% of female employees.
There are only small differences between men and women regarding preferences for the 30 to 34 work-hours segment. These working hours are most popular in Cyprus (44% overall; 47% men, 42% women) and Sweden (33% overall; 28% men, 39% women). By contrast, they are rather unpopular in France, with only 11% of female and 3% of male employees expressing a preference for these hours
Male employees in France show a pattern which is quite different from the EU average. In particular, 27% of the male employees interviewed would prefer to work between 41 and 45 hours per week as compared to only 12% in the EU. This difference is even higher for male workers aged 14 to 29 years (40% in France compared to 14% in the EU25). And one out of
7
EU 10
22
6
73
increasein pay
shorterworkingtime
don'tknow
EU 15
63
3
34
five French male workers would like to work even more than 45 hours per week as compared to only 7% for the EU as a whole.
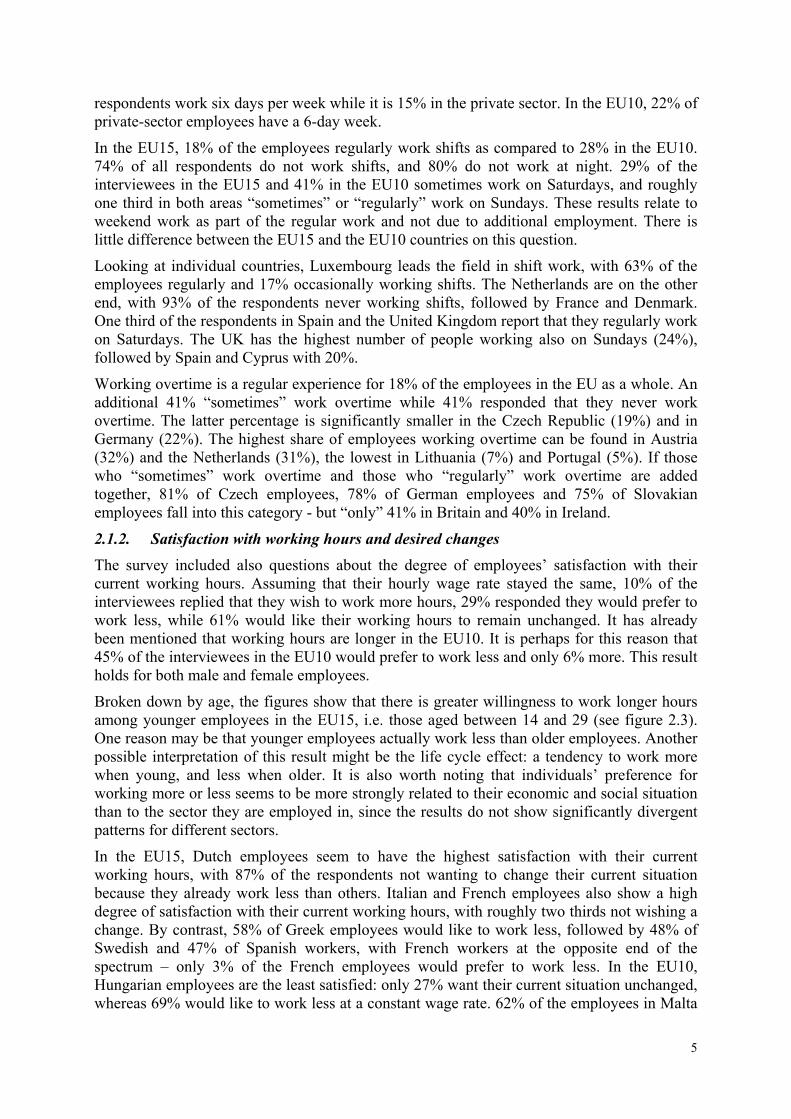
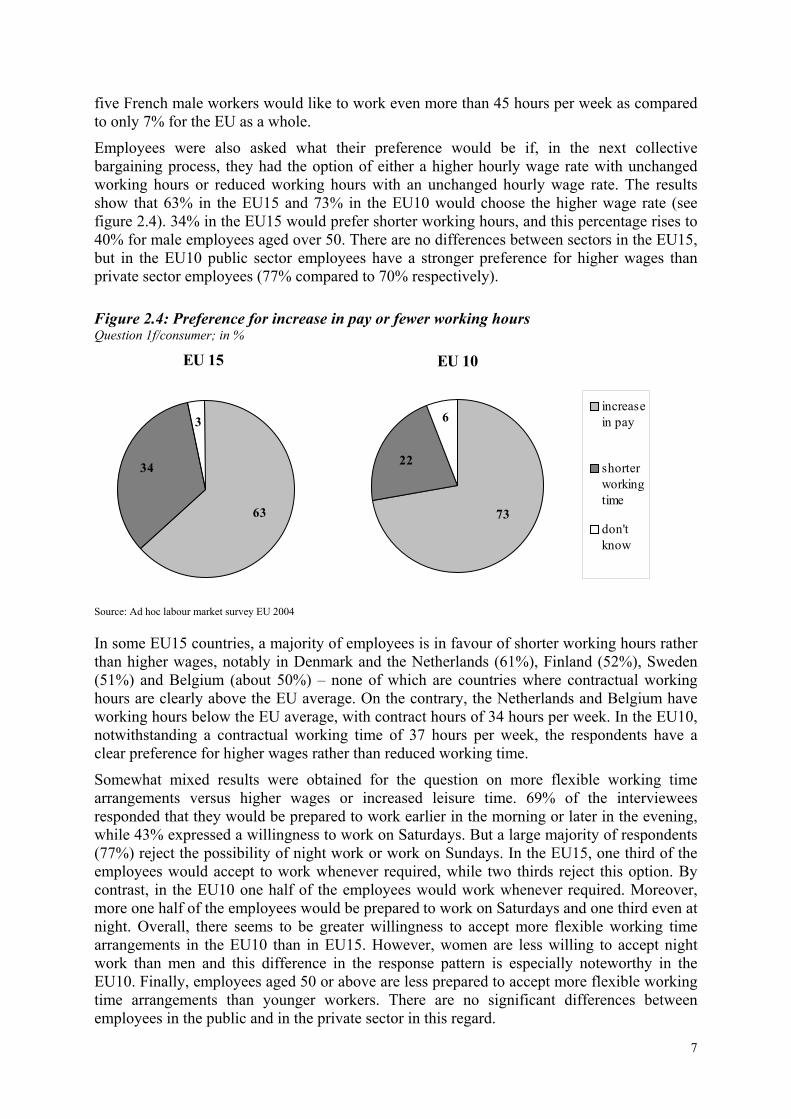
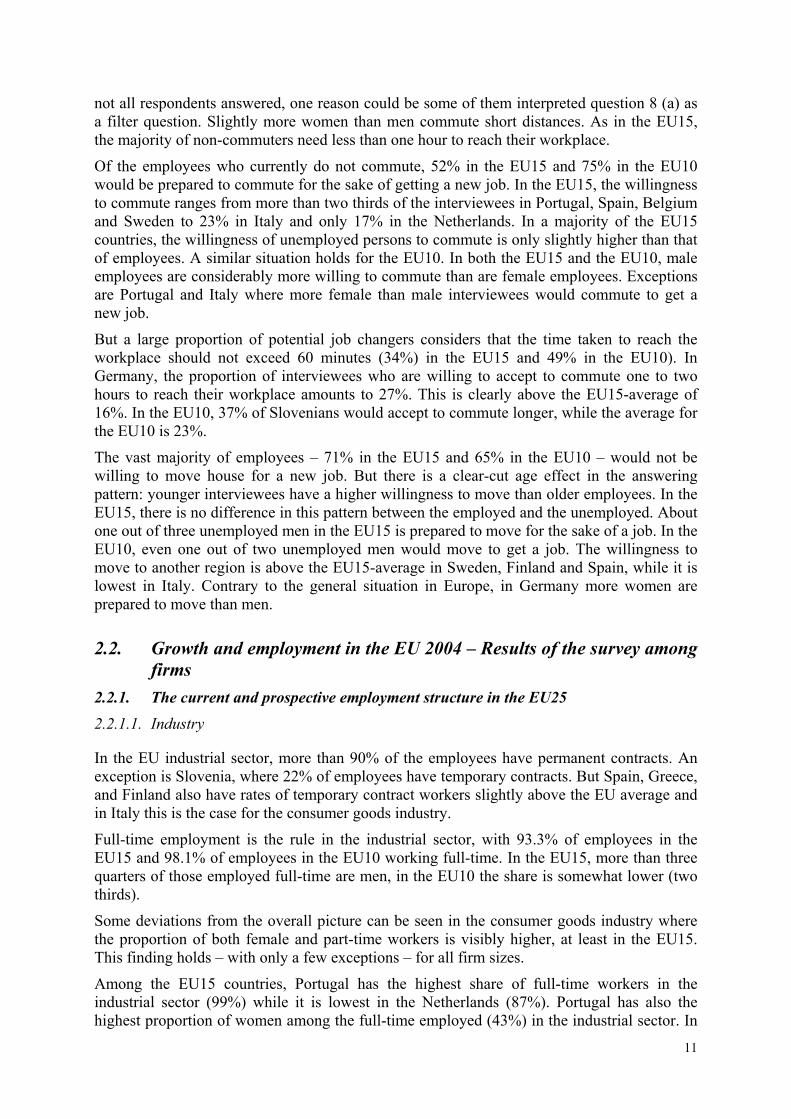
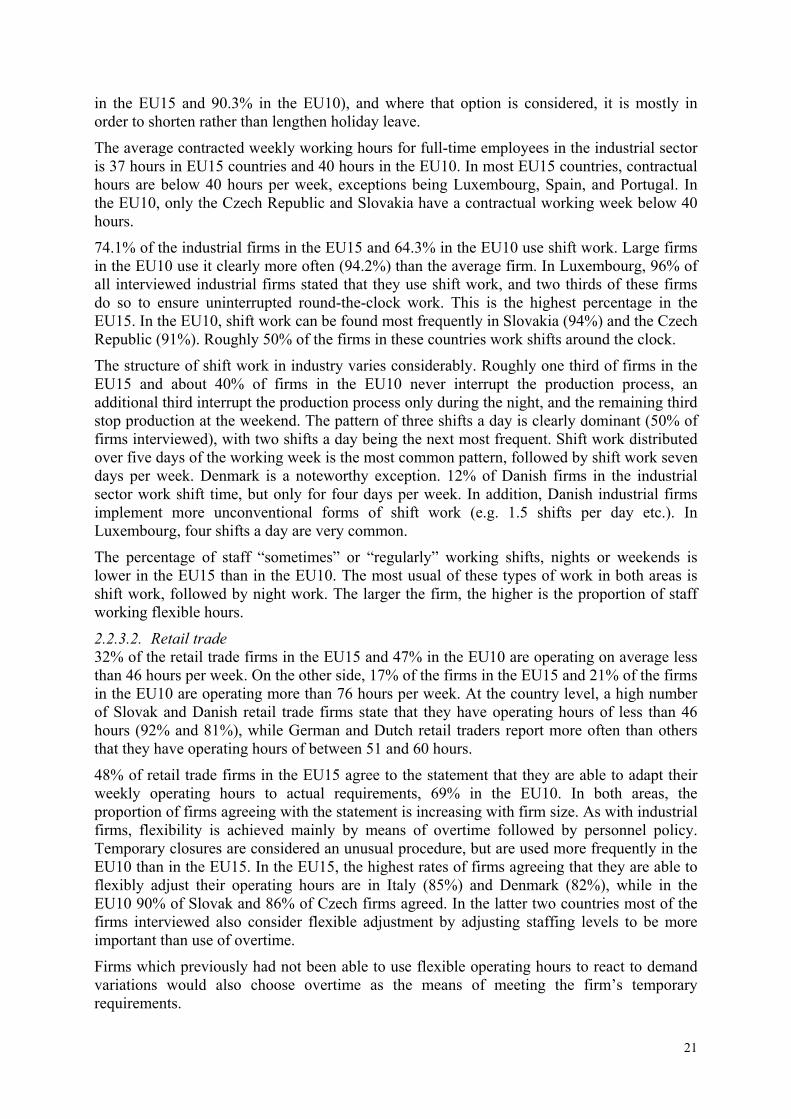
Employees were also asked what their preference would be if, in the next collective bargaining process, they had the option of either a higher hourly wage rate with unchanged working hours or reduced working hours with an unchanged hourly wage rate. The results show that 63% in the EU15 and 73% in the EU10 would choose the higher wage rate (see figure 2.4). 34% in the EU15 would prefer shorter working hours, and this percentage rises to 40% for male employees aged over 50. There are no differences between sectors in the EU15, but in the EU10 public sector employees have a stronger preference for higher wages than private sector employees (77% compared to 70% respectively).
Figure 2.4: Preference for increase in pay or fewer working hours Question 1f/consumer; in %
Source: Ad hoc labour market survey EU 2004
In some EU15 countries, a majority of employees is in favour of shorter working hours rather than higher wages, notably in Denmark and the Netherlands (61%), Finland (52%), Sweden (51%) and Belgium (about 50%) – none of which are countries where contractual working hours are clearly above the EU average. On the contrary, the Netherlands and Belgium have working hours below the EU average, with contract hours of 34 hours per week. In the EU10, notwithstanding a contractual working time of 37 hours per week, the respondents have a clear preference for higher wages rather than reduced working time.
Somewhat mixed results were obtained for the question on more flexible working time arrangements versus higher wages or increased leisure time. 69% of the interviewees responded that they would be prepared to work earlier in the morning or later in the evening, while 43% expressed a willingness to work on Saturdays. But a large majority of respondents (77%) reject the possibility of night work or work on Sundays. In the EU15, one third of the employees would accept to work whenever required, while two thirds reject this option. By contrast, in the EU10 one half of the employees would work whenever required. Moreover, more one half of the employees would be prepared to work on Saturdays and one third even at night. Overall, there seems to be greater willingness to accept more flexible working time arrangements in the EU10 than in EU15. However, women are less willing to accept night work than men and this difference in the response pattern is especially noteworthy in the EU10. Finally, employees aged 50 or above are less prepared to accept more flexible working time arrangements than younger workers. There are no significant differences between employees in the public and in the private sector in this regard.
8
Looking at the country level, we find the highest degree of acceptance of flexible working time arrangements in Austria, with high levels of acceptance also in Germany, Greece, and Finland. In Cyprus, Latvia, and the Czech Republic, by contrast, the degree of acceptance is fairly low.
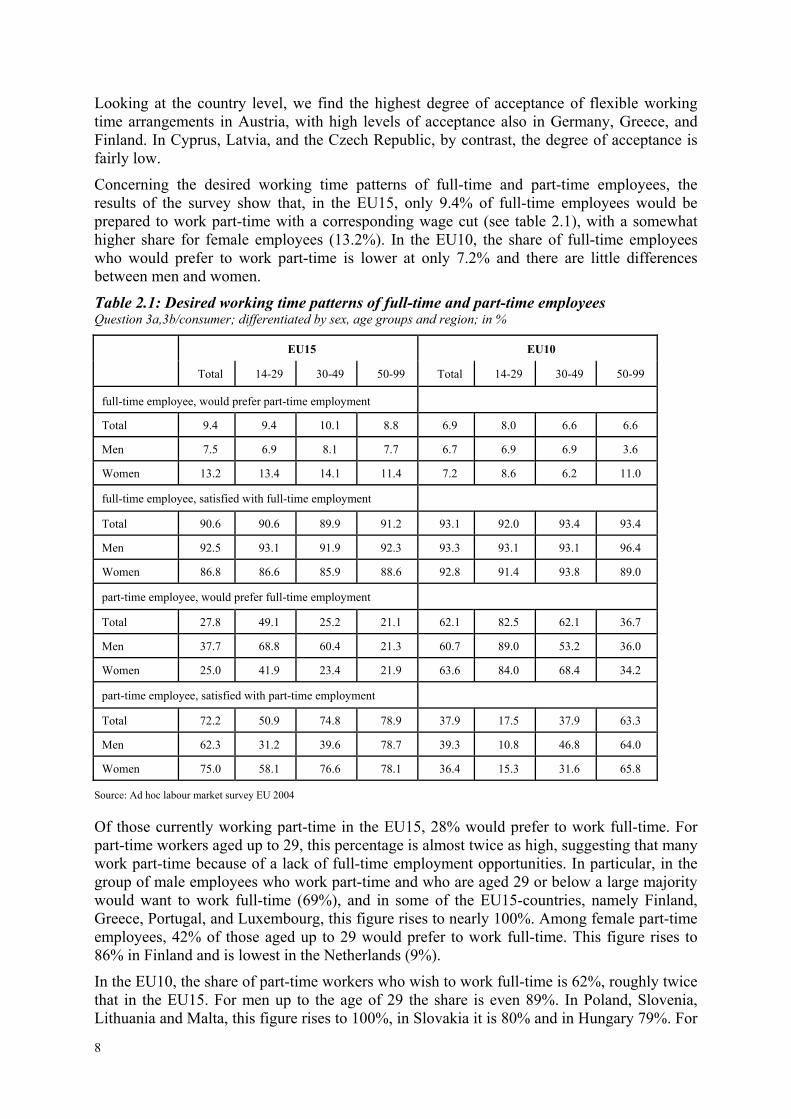
Concerning the desired working time patterns of full-time and part-time employees, the results of the survey show that, in the EU15, only 9.4% of full-time employees would be prepared to work part-time with a corresponding wage cut (see table 2.1), with a somewhat higher share for female employees (13.2%). In the EU10, the share of full-time employees who would prefer to work part-time is lower at only 7.2% and there are little differences between men and women.
Table 2.1: Desired working time patterns of full-time and part-time employees Question 3a,3b/consumer; differentiated by sex, age groups and region; in %
EU15 EU10
Total 14-29 30-49 50-99 Total 14-29 30-49 50-99
full-time employee, would prefer part-time employment Total 9.4 9.4 10.1 8.8 6.9 8.0 6.6 6.6
Men 7.5 6.9 8.1 7.7 6.7 6.9 6.9 3.6
Women 13.2 13.4 14.1 11.4 7.2 8.6 6.2 11.0
full-time employee, satisfied with full-time employment
Total 90.6 90.6 89.9 91.2 93.1 92.0 93.4 93.4
Men 92.5 93.1 91.9 92.3 93.3 93.1 93.1 96.4
Women 86.8 86.6 85.9 88.6 92.8 91.4 93.8 89.0
part-time employee, would prefer full-time employment
Total 27.8 49.1 25.2 21.1 62.1 82.5 62.1 36.7
Men 37.7 68.8 60.4 21.3 60.7 89.0 53.2 36.0
Women 25.0 41.9 23.4 21.9 63.6 84.0 68.4 34.2
part-time employee, satisfied with part-time employment
Total 72.2 50.9 74.8 78.9 37.9 17.5 37.9 63.3
Men 62.3 31.2 39.6 78.7 39.3 10.8 46.8 64.0
Women 75.0 58.1 76.6 78.1 36.4 15.3 31.6 65.8
Source: Ad hoc labour market survey EU 2004
Of those currently working part-time in the EU15, 28% would prefer to work full-time. For part-time workers aged up to 29, this percentage is almost twice as high, suggesting that many work part-time because of a lack of full-time employment opportunities. In particular, in the group of male employees who work part-time and who are aged 29 or below a large majority would want to work full-time (69%), and in some of the EU15-countries, namely Finland, Greece, Portugal, and Luxembourg, this figure rises to nearly 100%. Among female part-time employees, 42% of those aged up to 29 would prefer to work full-time. This figure rises to 86% in Finland and is lowest in the Netherlands (9%).
In the EU10, the share of part-time workers who wish to work full-time is 62%, roughly twice that in the EU15. For men up to the age of 29 the share is even 89%. In Poland, Slovenia, Lithuania and Malta, this figure rises to 100%, in Slovakia it is 80% and in Hungary 79%. For
9
women of the same age group the figure is 84%. All young female part-time employees interviewed in Poland and Hungary, 83% in Slovenia, and 71% in Malta have a preference for full-time work.
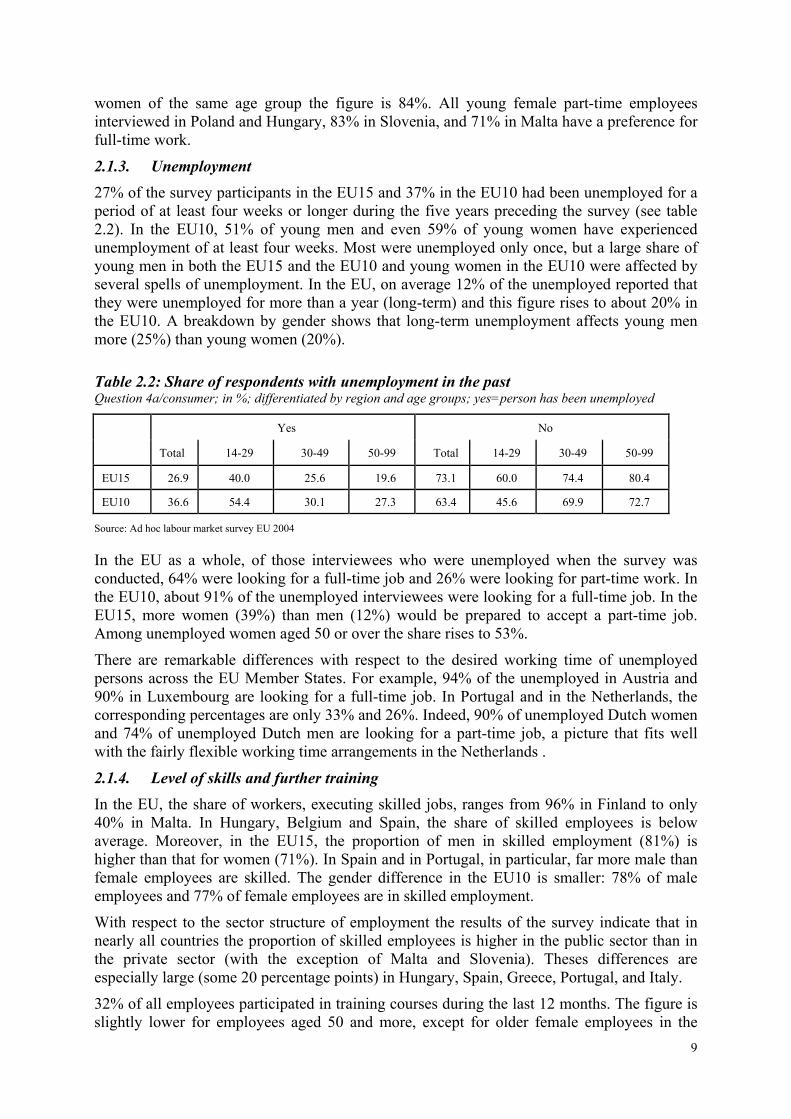
2.1.3. Unemployment 27% of the survey participants in the EU15 and 37% in the EU10 had been unemployed for a period of at least four weeks or longer during the five years preceding the survey (see table 2.2). In the EU10, 51% of young men and even 59% of young women have experienced unemployment of at least four weeks. Most were unemployed only once, but a large share of young men in both the EU15 and the EU10 and young women in the EU10 were affected by several spells of unemployment. In the EU, on average 12% of the unemployed reported that they were unemployed for more than a year (long-term) and this figure rises to about 20% in the EU10. A breakdown by gender shows that long-term unemployment affects young men more (25%) than young women (20%).
Table 2.2: Share of respondents with unemployment in the past Question 4a/consumer; in %; differentiated by region and age groups; yes=person has been unemployed
Yes No
Total 14-29 30-49 50-99 Total 14-29 30-49 50-99
EU15 26.9 40.0 25.6 19.6 73.1 60.0 74.4 80.4
EU10 36.6 54.4 30.1 27.3 63.4 45.6 69.9 72.7
Source: Ad hoc labour market survey EU 2004
In the EU as a whole, of those interviewees who were unemployed when the survey was conducted, 64% were looking for a full-time job and 26% were looking for part-time work. In the EU10, about 91% of the unemployed interviewees were looking for a full-time job. In the EU15, more women (39%) than men (12%) would be prepared to accept a part-time job. Among unemployed women aged 50 or over the share rises to 53%.
There are remarkable differences with respect to the desired working time of unemployed persons across the EU Member States. For example, 94% of the unemployed in Austria and 90% in Luxembourg are looking for a full-time job. In Portugal and in the Netherlands, the corresponding percentages are only 33% and 26%. Indeed, 90% of unemployed Dutch women and 74% of unemployed Dutch men are looking for a part-time job, a picture that fits well with the fairly flexible working time arrangements in the Netherlands .
2.1.4. Level of skills and further training In the EU, the share of workers, executing skilled jobs, ranges from 96% in Finland to only 40% in Malta. In Hungary, Belgium and Spain, the share of skilled employees is below average. Moreover, in the EU15, the proportion of men in skilled employment (81%) is higher than that for women (71%). In Spain and in Portugal, in particular, far more male than female employees are skilled. The gender difference in the EU10 is smaller: 78% of male employees and 77% of female employees are in skilled employment.
With respect to the sector structure of employment the results of the survey indicate that in nearly all countries the proportion of skilled employees is higher in the public sector than in the private sector (with the exception of Malta and Slovenia). Theses differences are especially large (some 20 percentage points) in Hungary, Spain, Greece, Portugal, and Italy.
32% of all employees participated in training courses during the last 12 months. The figure is slightly lower for employees aged 50 and more, except for older female employees in the
10
EU10, 37% of whom participated in training. Public sector employees do more training than those in the private sector or the unemployed. In most cases, the training was paid by the employer. It is not common for workers to pay for training out of their own pocket. Although, in the EU10, roughly 25% of public sector employees did so, compared with only 10% in the EU15. Half of all unemployed persons – one third of those from the EU10 – who participated in a training course received funding from some other source, presumably from funds of active labour market programmes.
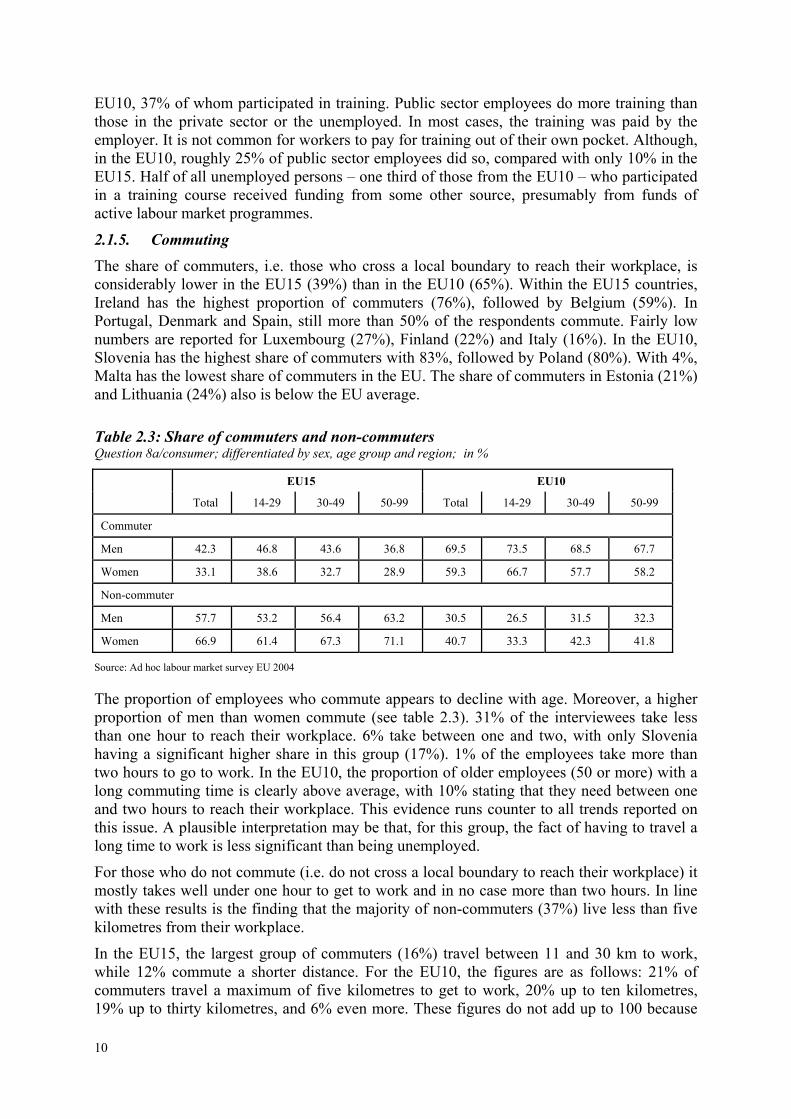
2.1.5. Commuting The share of commuters, i.e. those who cross a local boundary to reach their workplace, is considerably lower in the EU15 (39%) than in the EU10 (65%). Within the EU15 countries, Ireland has the highest proportion of commuters (76%), followed by Belgium (59%). In Portugal, Denmark and Spain, still more than 50% of the respondents commute. Fairly low numbers are reported for Luxembourg (27%), Finland (22%) and Italy (16%). In the EU10, Slovenia has the highest share of commuters with 83%, followed by Poland (80%). With 4%, Malta has the lowest share of commuters in the EU. The share of commuters in Estonia (21%) and Lithuania (24%) also is below the EU average.
Table 2.3: Share of commuters and non-commuters Question 8a/consumer; differentiated by sex, age group and region; in %
EU15 EU10
Total 14-29 30-49 50-99 Total 14-29 30-49 50-99
Commuter
Men 42.3 46.8 43.6 36.8 69.5 73.5 68.5 67.7
Women 33.1 38.6 32.7 28.9 59.3 66.7 57.7 58.2
Non-commuter
Men 57.7 53.2 56.4 63.2 30.5 26.5 31.5 32.3
Women 66.9 61.4 67.3 71.1 40.7 33.3 42.3 41.8
Source: Ad hoc labour market survey EU 2004
The proportion of employees who commute appears to decline with age. Moreover, a higher proportion of men than women commute (see table 2.3). 31% of the interviewees take less than one hour to reach their workplace. 6% take between one and two, with only Slovenia having a significant higher share in this group (17%). 1% of the employees take more than two hours to go to work. In the EU10, the proportion of older employees (50 or more) with a long commuting time is clearly above average, with 10% stating that they need between one and two hours to reach their workplace. This evidence runs counter to all trends reported on this issue. A plausible interpretation may be that, for this group, the fact of having to travel a long time to work is less significant than being unemployed.
For those who do not commute (i.e. do not cross a local boundary to reach their workplace) it mostly takes well under one hour to get to work and in no case more than two hours. In line with these results is the finding that the majority of non-commuters (37%) live less than five kilometres from their workplace.
In the EU15, the largest group of commuters (16%) travel between 11 and 30 km to work, while 12% commute a shorter distance. For the EU10, the figures are as follows: 21% of commuters travel a maximum of five kilometres to get to work, 20% up to ten kilometres, 19% up to thirty kilometres, and 6% even more. These figures do not add up to 100 because
11
not all respondents answered, one reason could be some of them interpreted question 8 (a) as a filter question. Slightly more women than men commute short distances. As in the EU15, the majority of non-commuters need less than one hour to reach their workplace.
Of the employees who currently do not commute, 52% in the EU15 and 75% in the EU10 would be prepared to commute for the sake of getting a new job. In the EU15, the willingness to commute ranges from more than two thirds of the interviewees in Portugal, Spain, Belgium and Sweden to 23% in Italy and only 17% in the Netherlands. In a majority of the EU15 countries, the willingness of unemployed persons to commute is only slightly higher than that of employees. A similar situation holds for the EU10. In both the EU15 and the EU10, male employees are considerably more willing to commute than are female employees. Exceptions are Portugal and Italy where more female than male interviewees would commute to get a new job.
But a large proportion of potential job changers considers that the time taken to reach the workplace should not exceed 60 minutes (34%) in the EU15 and 49% in the EU10). In Germany, the proportion of interviewees who are willing to accept to commute one to two hours to reach their workplace amounts to 27%. This is clearly above the EU15-average of 16%. In the EU10, 37% of Slovenians would accept to commute longer, while the average for the EU10 is 23%.
The vast majority of employees – 71% in the EU15 and 65% in the EU10 – would not be willing to move house for a new job. But there is a clear-cut age effect in the answering pattern: younger interviewees have a higher willingness to move than older employees. In the EU15, there is no difference in this pattern between the employed and the unemployed. About one out of three unemployed men in the EU15 is prepared to move for the sake of a job. In the EU10, even one out of two unemployed men would move to get a job. The willingness to move to another region is above the EU15-average in Sweden, Finland and Spain, while it is lowest in Italy. Contrary to the general situation in Europe, in Germany more women are prepared to move than men.
2.2. Growth and employment in the EU 2004 – Results of the survey among firms
2.2.1. The current and prospective employment structure in the EU25
2.2.1.1. Industry
In the EU industrial sector, more than 90% of the employees have permanent contracts. An exception is Slovenia, where 22% of employees have temporary contracts. But Spain, Greece, and Finland also have rates of temporary contract workers slightly above the EU average and in Italy this is the case for the consumer goods industry.
Full-time employment is the rule in the industrial sector, with 93.3% of employees in the EU15 and 98.1% of employees in the EU10 working full-time. In the EU15, more than three quarters of those employed full-time are men, in the EU10 the share is somewhat lower (two thirds).
Some deviations from the overall picture can be seen in the consumer goods industry where the proportion of both female and part-time workers is visibly higher, at least in the EU15. This finding holds – with only a few exceptions – for all firm sizes.
Among the EU15 countries, Portugal has the highest share of full-time workers in the industrial sector (99%) while it is lowest in the Netherlands (87%). Portugal has also the highest proportion of women among the full-time employed (43%) in the industrial sector. In
12
the EU10, the share of female full-time workers is generally higher than in the EU15. In Estonia, full-time employed women even outnumber men.
Part-time work plays only a minor role in industry. The Netherlands, where 13% of the industrial workers work part-time (19% in the consumer goods industry), leads the field in the EU, followed by Italy and Belgium. Portugal has the lowest rate of part-time workers.
In the EU15, 61.8% of the employees in industry are employed directly in the production process, in the EU10 this share is somewhat higher at 69.8%. With 84%, Lithuania has the highest share in the EU. It is lowest in the Netherlands at only 37%.
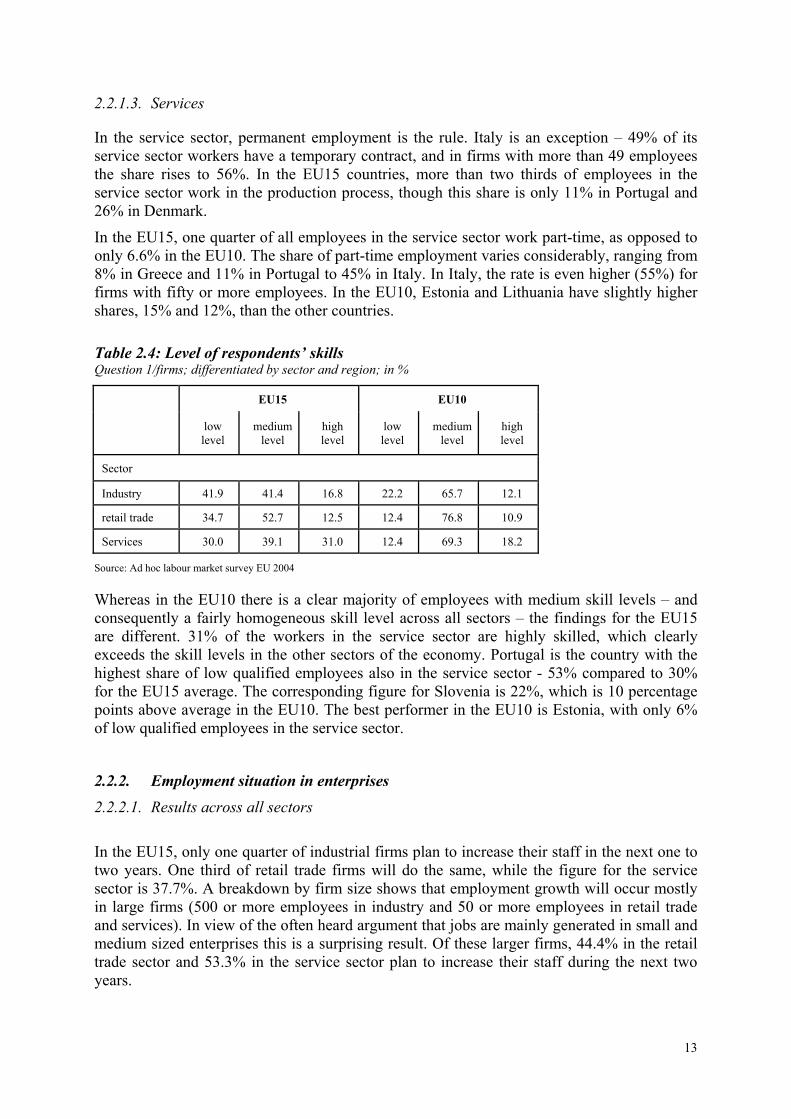
Regarding skill-levels, in the EU15 17% of the employees in the industrial sector are high-skilled. In the EU10, this percentage is a little lower at 12%. (see table 2.4)However, among all EU Member States Lithuania is the country with the highest share of high-skilled workers, while Portugal has the lowest share. 42% of all industrial workers in the EU15 are medium-skilled. In the EU10, this share is clearly higher at 66%. By contrast, the share of low-skilled industrial worker is clearly higher in the EU15 than in the EU10 (41% versus 22%). The countries with the highest shares of low-skilled workers are Portugal (at 71%), the United Kingdom (60%) and Finland (54%). The lowest shares of low-skilled workers are registered in Ireland, Sweden and Germany.
2.2.1.2. Retail trade In the EU as a whole, the retail trade sector employs more women than men, and this feature is particularly pronounced in the EU10. About 10% of employees in the retail trade sector work under fixed-term contracts. The lowest percentages of employees with permanent contracts are 74% in Slovenia, 73% in Ireland, and 67% in Lithuania. About two thirds of the employees in the retail trade sector work in the production process, but only 38% do so in Portugal and Slovenia.
The share of part-time workers is clearly higher in the retail trade sector than in the industrial sector. This is particularly so in the EU15, where the share of part-time workers amounts to 36.1%. In the United Kingdom, as many as 57% work part-time, with the Netherlands and Ireland following. In Spain, Portugal and Sweden, the proportion of part-time employees is below average. In Spain, just 10% of retail trade sector employees are part-time, the lowest rate in the EU. In the EU10, the share of part-time workers is lower than in the EU15, amounting to 15%. In the Czech Republic and in Slovenia, the share of part-time workers is, at 28% and 25%, clearly above the EU10 average. In both the EU15 and the EU10, around 4 out of 5 part-time workers are female. Women heavily dominate part-time work in all countries, only Denmark stands out with share of male part-time employees that is close to the female one. The proportion between male and female full-time workers differs between the EU15 and the EU10. In the EU15, more men are full-time employed than women, whereas it is the opposite in the EU10. In both areas, the proportion of part-time employees increases with firm size.
The proportion of low-skilled workers in retail trade lies slightly below the figure for industry. (see table 2.4) On average, the formal skill level is higher in the EU10 than in the EU15, as it is the case in the industrial sector. The proportion of low-skilled workers increases with firm size in the EU15. Similar to the industrial sector, Portugal has the highest share of low-skilled workers in retail trade (53% compared to 10% in Belgium and 18% in Greece). Austria also diverges from the rest of the EU: only 1% of the employees in the retail trade sector are highly skilled. As regards the EU10, 38% of retail trade employees are highly skilled in Lithuania (and even over 50% in large retail trade firms) and 23% in Latvia.
13
2.2.1.3. Services
In the service sector, permanent employment is the rule. Italy is an exception – 49% of its service sector workers have a temporary contract, and in firms with more than 49 employees the share rises to 56%. In the EU15 countries, more than two thirds of employees in the service sector work in the production process, though this share is only 11% in Portugal and 26% in Denmark.
In the EU15, one quarter of all employees in the service sector work part-time, as opposed to only 6.6% in the EU10. The share of part-time employment varies considerably, ranging from 8% in Greece and 11% in Portugal to 45% in Italy. In Italy, the rate is even higher (55%) for firms with fifty or more employees. In the EU10, Estonia and Lithuania have slightly higher shares, 15% and 12%, than the other countries.
Table 2.4: Level of respondents’ skills Question 1/firms; differentiated by sector and region; in %
EU15 EU10
low level
medium level
high level
low level
mediumlevel
high level
Sector
Industry 41.9 41.4 16.8 22.2 65.7 12.1
retail trade 34.7 52.7 12.5 12.4 76.8 10.9
Services 30.0 39.1 31.0 12.4 69.3 18.2
Source: Ad hoc labour market survey EU 2004
Whereas in the EU10 there is a clear majority of employees with medium skill levels – and consequently a fairly homogeneous skill level across all sectors – the findings for the EU15 are different. 31% of the workers in the service sector are highly skilled, which clearly exceeds the skill levels in the other sectors of the economy. Portugal is the country with the highest share of low qualified employees also in the service sector - 53% compared to 30% for the EU15 average. The corresponding figure for Slovenia is 22%, which is 10 percentage points above average in the EU10. The best performer in the EU10 is Estonia, with only 6% of low qualified employees in the service sector.
2.2.2. Employment situation in enterprises
2.2.2.1. Results across all sectors
In the EU15, only one quarter of industrial firms plan to increase their staff in the next one to two years. One third of retail trade firms will do the same, while the figure for the service sector is 37.7%. A breakdown by firm size shows that employment growth will occur mostly in large firms (500 or more employees in industry and 50 or more employees in retail trade and services). In view of the often heard argument that jobs are mainly generated in small and medium sized enterprises this is a surprising result. Of these larger firms, 44.4% in the retail trade sector and 53.3% in the service sector plan to increase their staff during the next two years.
14
0 5 10 15 20 25 30 35 40
Other reasons
Goverment measures
Introduction of newtechnologies or products
Present and expected levels of labor costs
Present and expected level of demand for your products
EU15 Industry EU15 Retail Trade EU15 Service Sector
EU10 Industry EU10 Retail Trade EU10 Service Sector
There are considerable differences between the EU15 countries. For example, German retail trade firms rank last with respect to plans of increasing their staff, with only 9% of all firms and only 8% of the largest retail trade firms intending to do so. In the Netherlands, only 13% and in Ireland just 15% of retail trade firms plan to expand their staff. Completely different results can be seen for the United Kingdom: three out of four retail trade firms and as many as 99% of the largest retail trade firms plan to increase their personnel, with nearly all firms giving as the reason for this expansion the current and expected demand for their products. In Italy and in Greece, 70% and 67% of retail trade firms plan to increase their employment.
In the EU10, 27% of firms in industry or the service sector plan to increase employment, while for firms in the retail trade sector the figure is 30.3%. Firms in the industrial investment goods sector are more likely (37.8%) to increase their staff than firms in other sub-sectors of industry. The marked discrepancies in the results for different firm sizes observed for the EU15 are not found in the EU10.
In Estonia, considerably more industrial and service sector firms than in the other EU10 plan to increase their employment (40% and 46%, respectively). The Slovenian service sector also intends to increase employment above the EU10 average, 45% of the firms reporting that they would do so. In Cyprus, most respondents indicate that the current situation will prevail: 78% of the firms in industry, 92% in the retail trade sector, and 81% in the service sector state that their employment situation will not change during the next one to two years.
In the EU15, it is the retail trade and service sectors that are providing a positive stimulus for employment. In the EU10, it is the industrial sector and especially the investment goods industry which is doing so. More than 58% of the large firms (1000 employees or more) in the investment goods sector in the EU10 plan to increase their staff, and this figure is as high as 100% for Hungary.
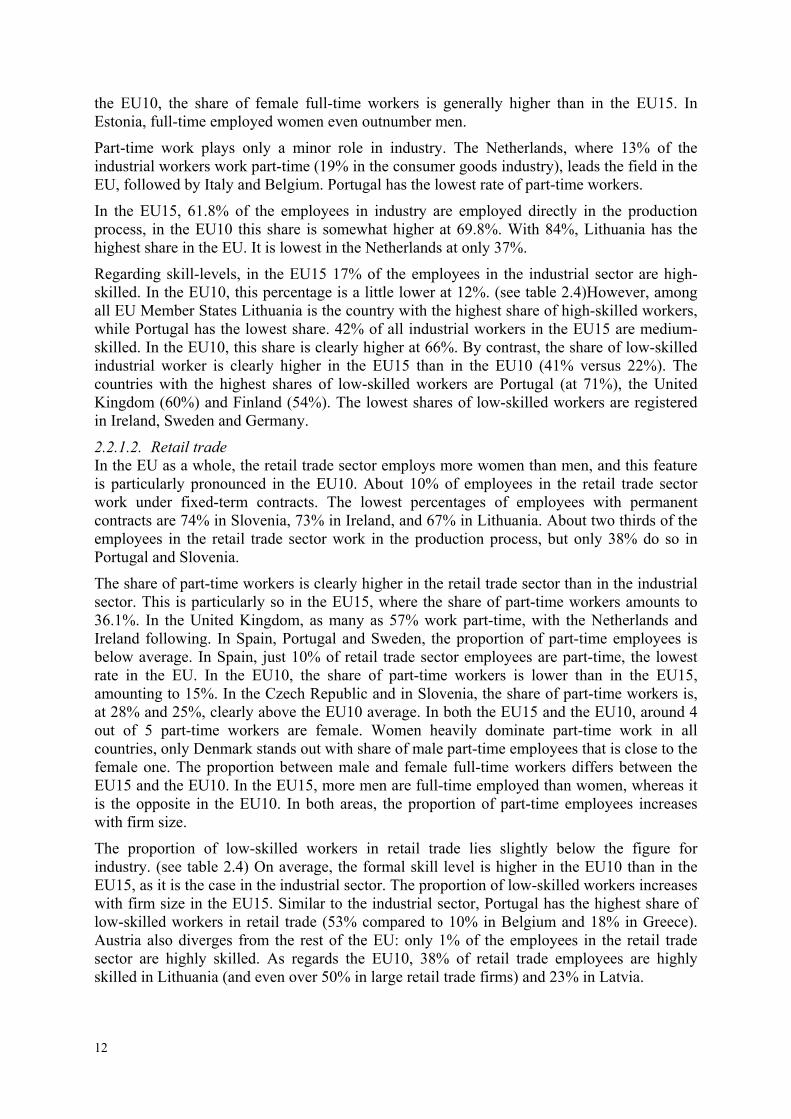
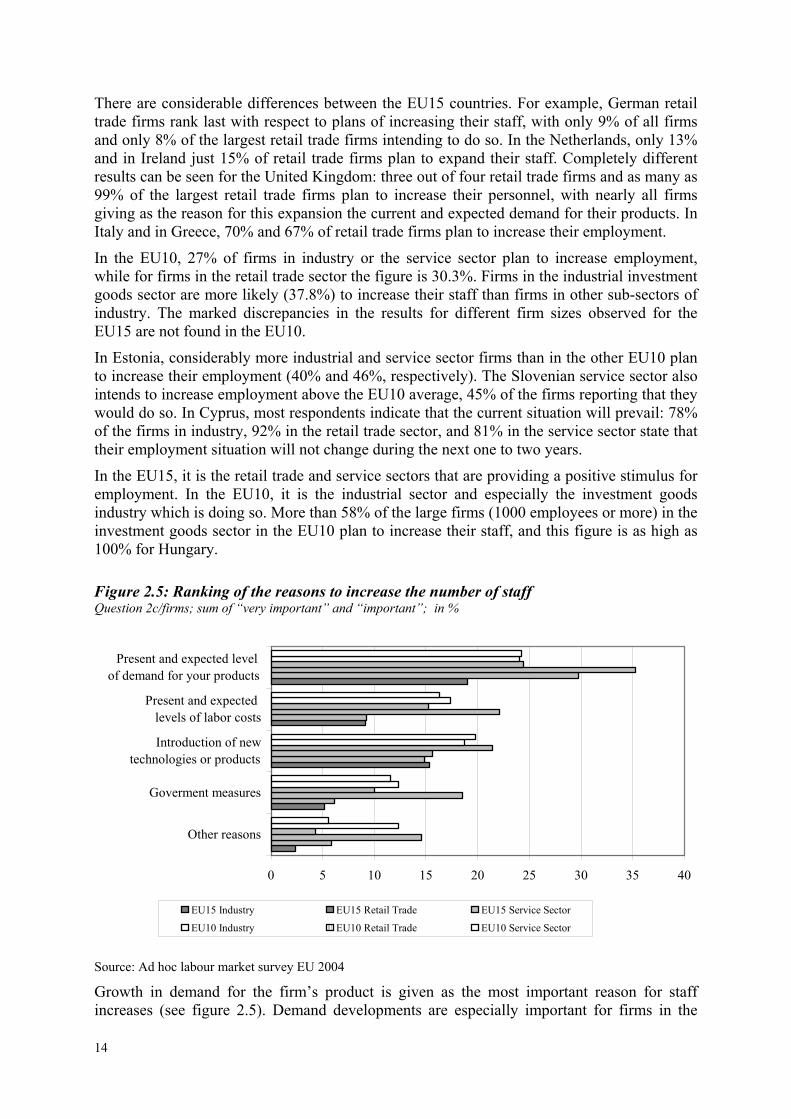
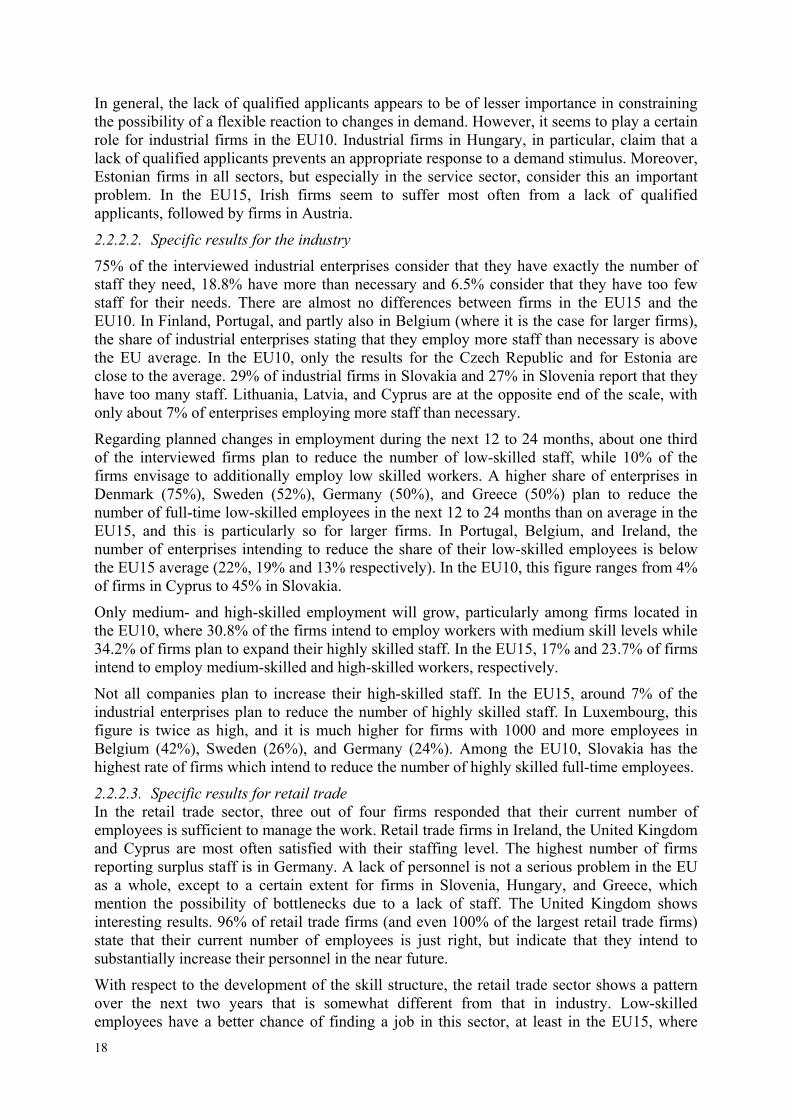
Figure 2.5: Ranking of the reasons to increase the number of staff Question 2c/firms; sum of “very important” and “important”; in %
Source: Ad hoc labour market survey EU 2004 Growth in demand for the firm’s product is given as the most important reason for staff increases (see figure 2.5). Demand developments are especially important for firms in the
15
retail trade and the services sectors. The second major reason is the introduction of new technologies and/or new products, especially for firms in the investment goods industry. In the EU15, service firms in particular mention present and expected levels of labour cost as an argument for increasing the number of staff. “Other reasons” play only a minor role, with a few exceptions. In Spain, 15% of firms in retail trade 18% in the service sector answer that they consider the category “other reasons” very important; 17% of Slovak and 16% of Hungarian retail trades also do so.
Regarding the reasons for reducing staff, most firms planning staff reduction do not consider government measures to be an important factor. Only for small and medium-sized companies government measures do seem to play a certain role. Moreover, government measures are slightly more important in the EU10. Particularly Hungarian enterprises across all sectors mention government measures, along with labour costs, as having a significant impact. Firms in the industrial sector planning to reduce their staff tend to ascribe this to national and international price competition, followed by wage levels and non-wage labour costs.
The most important reasons why retail traders plan staff cuts are high non-wage labour costs, high wage rates, and a lack of demand for their products. In the EU15, service sector firms mention lack of demand most often as being behind a planned reduction in employment followed by high non-wage labour costs and a high wage level.
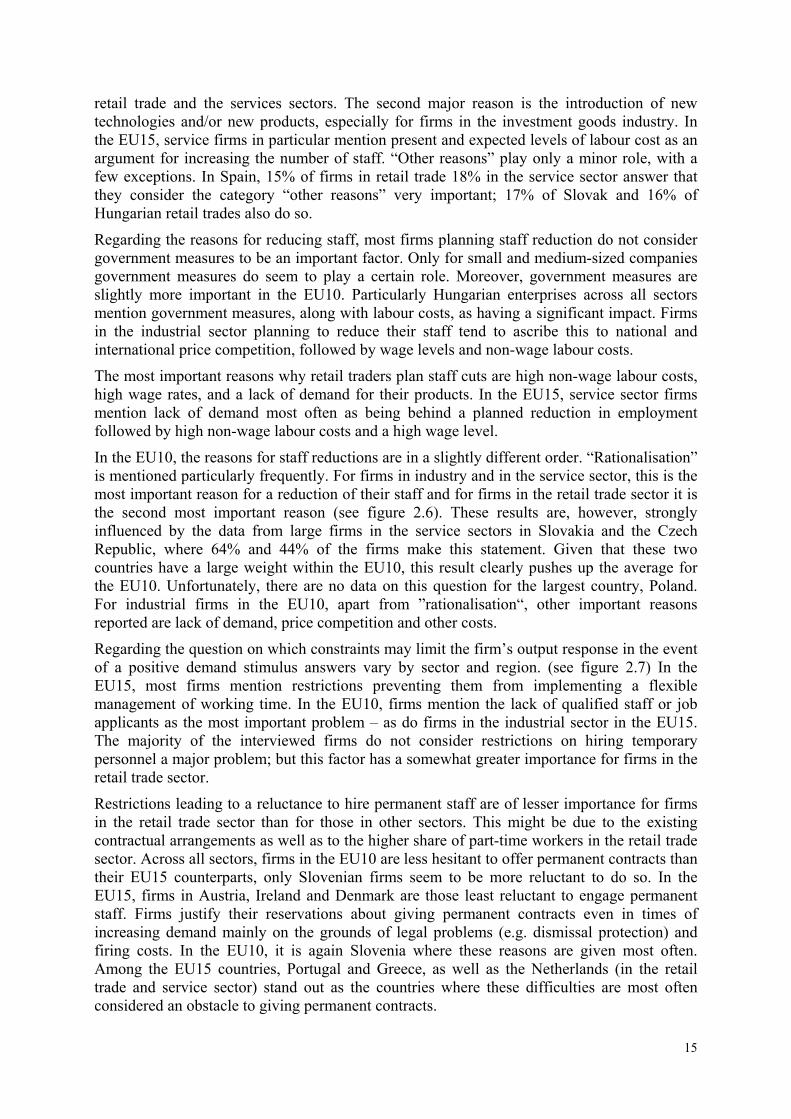
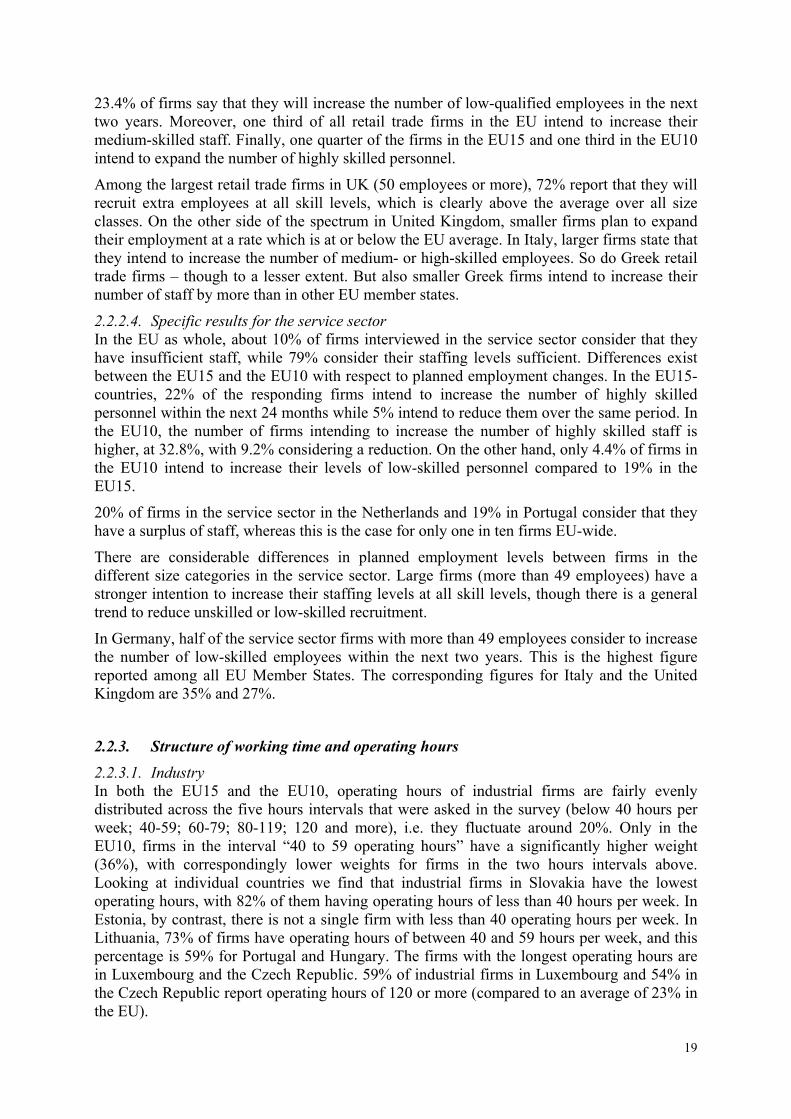
In the EU10, the reasons for staff reductions are in a slightly different order. “Rationalisation” is mentioned particularly frequently. For firms in industry and in the service sector, this is the most important reason for a reduction of their staff and for firms in the retail trade sector it is the second most important reason (see figure 2.6). These results are, however, strongly influenced by the data from large firms in the service sectors in Slovakia and the Czech Republic, where 64% and 44% of the firms make this statement. Given that these two countries have a large weight within the EU10, this result clearly pushes up the average for the EU10. Unfortunately, there are no data on this question for the largest country, Poland. For industrial firms in the EU10, apart from ”rationalisation“, other important reasons reported are lack of demand, price competition and other costs.
Regarding the question on which constraints may limit the firm’s output response in the event of a positive demand stimulus answers vary by sector and region. (see figure 2.7) In the EU15, most firms mention restrictions preventing them from implementing a flexible management of working time. In the EU10, firms mention the lack of qualified staff or job applicants as the most important problem – as do firms in the industrial sector in the EU15. The majority of the interviewed firms do not consider restrictions on hiring temporary personnel a major problem; but this factor has a somewhat greater importance for firms in the retail trade sector.
Restrictions leading to a reluctance to hire permanent staff are of lesser importance for firms in the retail trade sector than for those in other sectors. This might be due to the existing contractual arrangements as well as to the higher share of part-time workers in the retail trade sector. Across all sectors, firms in the EU10 are less hesitant to offer permanent contracts than their EU15 counterparts, only Slovenian firms seem to be more reluctant to do so. In the EU15, firms in Austria, Ireland and Denmark are those least reluctant to engage permanent staff. Firms justify their reservations about giving permanent contracts even in times of increasing demand mainly on the grounds of legal problems (e.g. dismissal protection) and firing costs. In the EU10, it is again Slovenia where these reasons are given most often. Among the EU15 countries, Portugal and Greece, as well as the Netherlands (in the retail trade and service sector) stand out as the countries where these difficulties are most often considered an obstacle to giving permanent contracts.
16
Figure 2.6: Ranking of the reasons for a reduction in the number of staff Question 2c/firms; sum of “very important” and “important”; in %
Source: Ad hoc labour market survey EU 2004
Restrictions on changing the job assignment of existing personnel is another constraint that may prevent firms from reacting flexibly to demand fluctuations. This factor is less important in the retail trade sector than in other sectors. Moreover, it appears to be more of an issue in the EU15 and less so in the EU10. Within the EU15, it seems to be especially problematic in Portugal, where two thirds to three quarters of the firms consider limitations to changes in the job assignment of existing staff an important constraint. In the EU10, a relatively high percentage of Slovenian firms consider this of importance too, with a lack of qualified staff among the existing personnel being the main factor behind it. In Slovakia, firms seem to be relatively little affected by this problem.
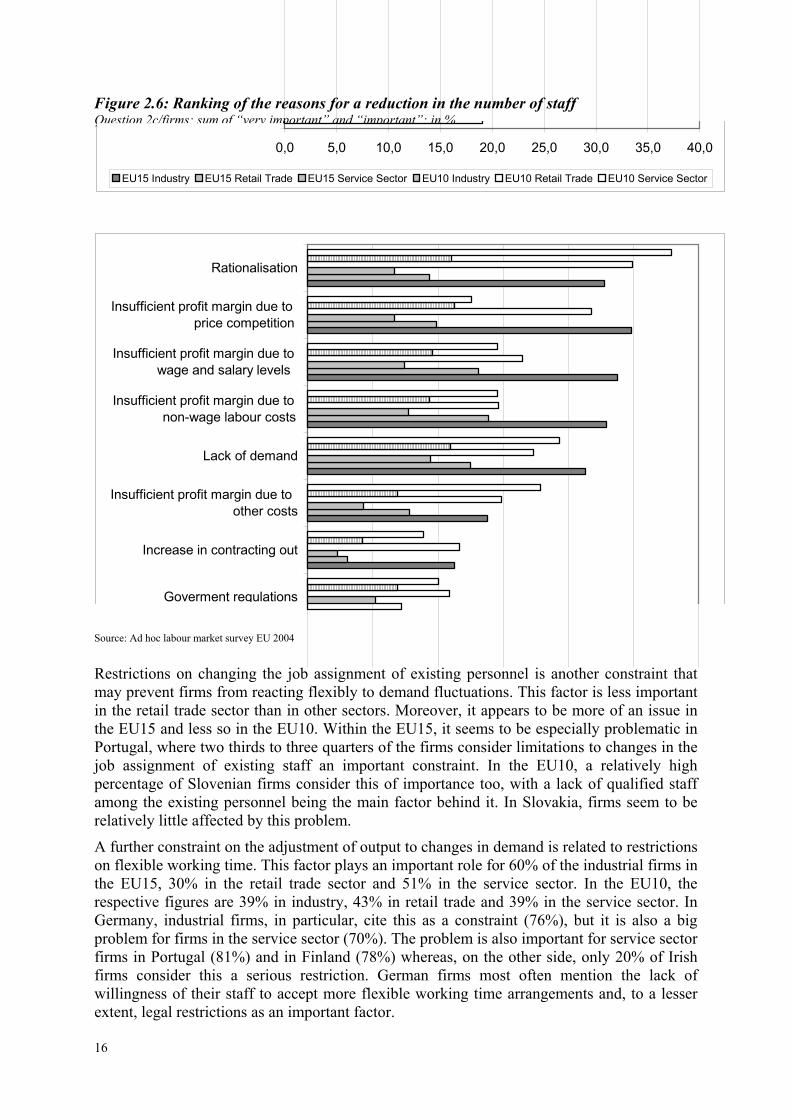
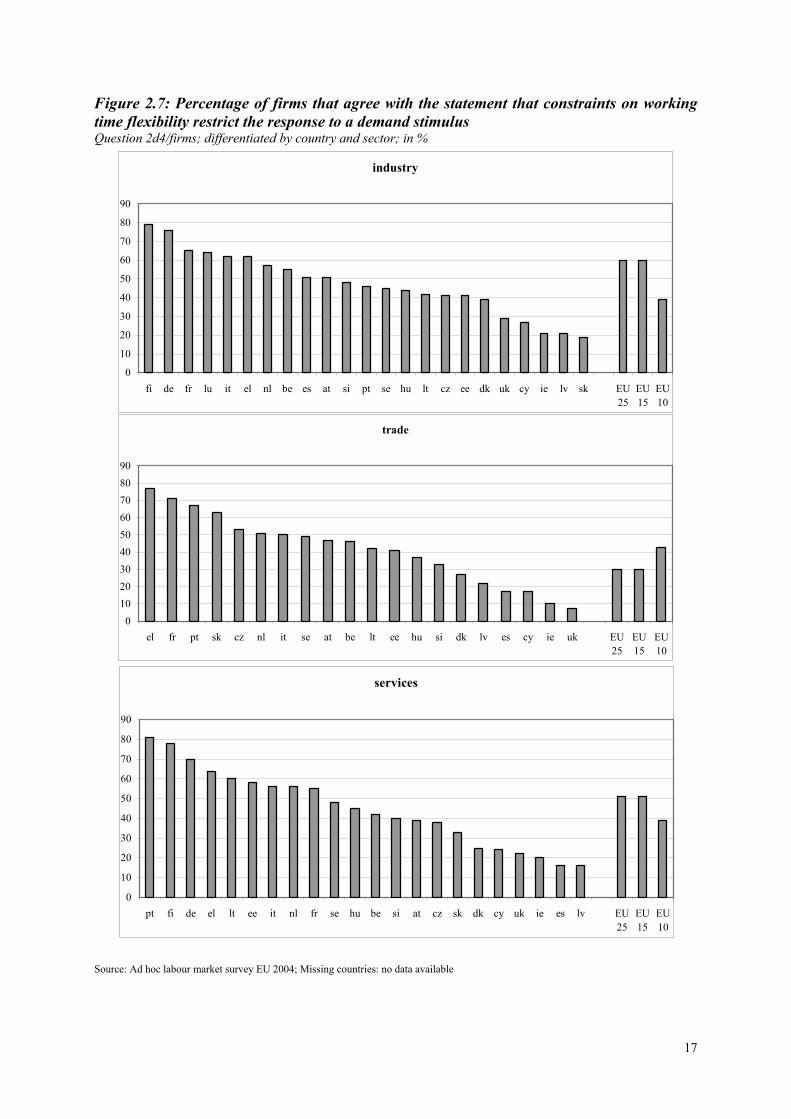
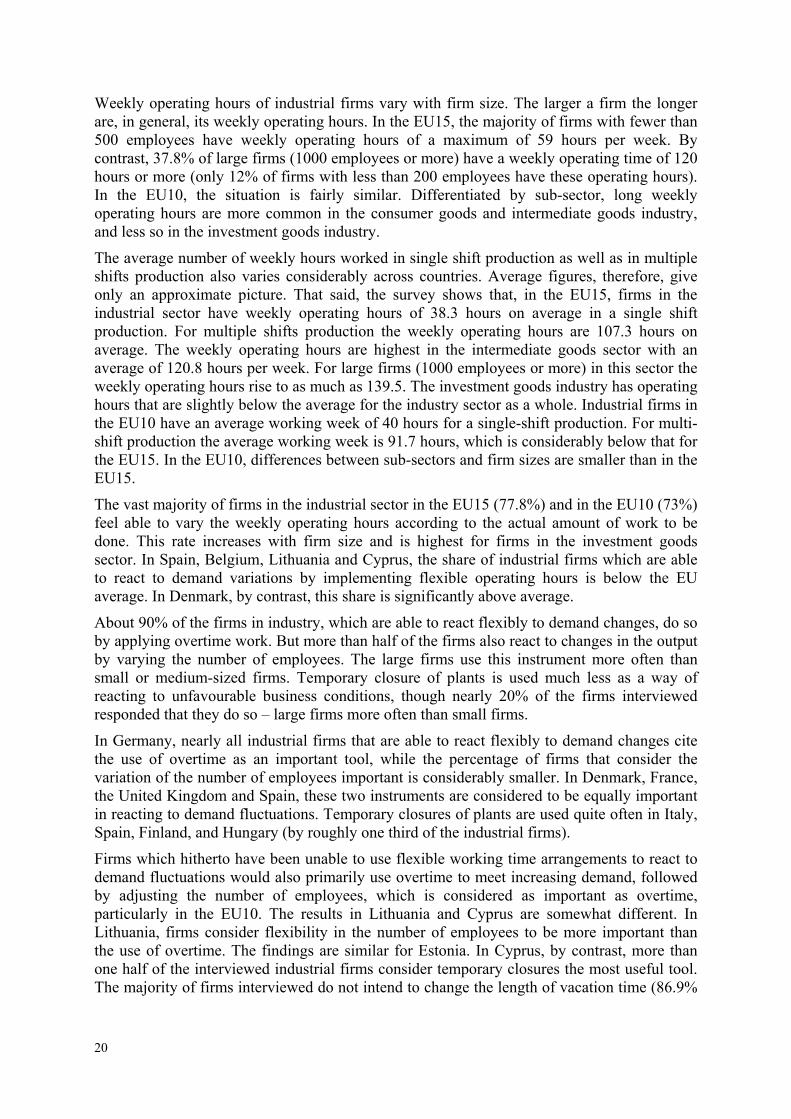
A further constraint on the adjustment of output to changes in demand is related to restrictions on flexible working time. This factor plays an important role for 60% of the industrial firms in the EU15, 30% in the retail trade sector and 51% in the service sector. In the EU10, the respective figures are 39% in industry, 43% in retail trade and 39% in the service sector. In Germany, industrial firms, in particular, cite this as a constraint (76%), but it is also a big problem for firms in the service sector (70%). The problem is also important for service sector firms in Portugal (81%) and in Finland (78%) whereas, on the other side, only 20% of Irish firms consider this a serious restriction. German firms most often mention the lack of willingness of their staff to accept more flexible working time arrangements and, to a lesser extent, legal restrictions as an important factor.
0,0 5,0 10,0 15,0 20,0 25,0 30,0 35,0 40,0
EU15 Industry EU15 Retail Trade EU15 Service Sector EU10 Industry EU10 Retail Trade EU10 Service Sector
Goverment regulations
Increase in contracting out
Insufficient profit margin due to other costs
Lack of demand
Insufficient profit margin due to non-wage labour costs
Insufficient profit margin due to wage and salary levels
Insufficient profit margin due to price competition
Rationalisation
17
industry
0
10
20
30
40
50
60
70
80
90
fi de fr lu it el nl be es at si pt se hu lt cz ee dk uk cy ie lv sk EU25
EU15
EU10
trade
0102030405060708090
el fr pt sk cz nl it se at be lt ee hu si dk lv es cy ie uk EU25
EU15
EU10
services
0
10
20
30
40
50
60
70
80
90
pt fi de el lt ee it nl fr se hu be si at cz sk dk cy uk ie es lv EU25
EU15
EU10
Figure 2.7: Percentage of firms that agree with the statement that constraints on working time flexibility restrict the response to a demand stimulus Question 2d4/firms; differentiated by country and sector; in %
Source: Ad hoc labour market survey EU 2004; Missing countries: no data available
18
In general, the lack of qualified applicants appears to be of lesser importance in constraining the possibility of a flexible reaction to changes in demand. However, it seems to play a certain role for industrial firms in the EU10. Industrial firms in Hungary, in particular, claim that a lack of qualified applicants prevents an appropriate response to a demand stimulus. Moreover, Estonian firms in all sectors, but especially in the service sector, consider this an important problem. In the EU15, Irish firms seem to suffer most often from a lack of qualified applicants, followed by firms in Austria.
2.2.2.2. Specific results for the industry
75% of the interviewed industrial enterprises consider that they have exactly the number of staff they need, 18.8% have more than necessary and 6.5% consider that they have too few staff for their needs. There are almost no differences between firms in the EU15 and the EU10. In Finland, Portugal, and partly also in Belgium (where it is the case for larger firms), the share of industrial enterprises stating that they employ more staff than necessary is above the EU average. In the EU10, only the results for the Czech Republic and for Estonia are close to the average. 29% of industrial firms in Slovakia and 27% in Slovenia report that they have too many staff. Lithuania, Latvia, and Cyprus are at the opposite end of the scale, with only about 7% of enterprises employing more staff than necessary.
Regarding planned changes in employment during the next 12 to 24 months, about one third of the interviewed firms plan to reduce the number of low-skilled staff, while 10% of the firms envisage to additionally employ low skilled workers. A higher share of enterprises in Denmark (75%), Sweden (52%), Germany (50%), and Greece (50%) plan to reduce the number of full-time low-skilled employees in the next 12 to 24 months than on average in the EU15, and this is particularly so for larger firms. In Portugal, Belgium, and Ireland, the number of enterprises intending to reduce the share of their low-skilled employees is below the EU15 average (22%, 19% and 13% respectively). In the EU10, this figure ranges from 4% of firms in Cyprus to 45% in Slovakia.
Only medium- and high-skilled employment will grow, particularly among firms located in the EU10, where 30.8% of the firms intend to employ workers with medium skill levels while 34.2% of firms plan to expand their highly skilled staff. In the EU15, 17% and 23.7% of firms intend to employ medium-skilled and high-skilled workers, respectively.
Not all companies plan to increase their high-skilled staff. In the EU15, around 7% of the industrial enterprises plan to reduce the number of highly skilled staff. In Luxembourg, this figure is twice as high, and it is much higher for firms with 1000 and more employees in Belgium (42%), Sweden (26%), and Germany (24%). Among the EU10, Slovakia has the highest rate of firms which intend to reduce the number of highly skilled full-time employees.
2.2.2.3. Specific results for retail trade In the retail trade sector, three out of four firms responded that their current number of employees is sufficient to manage the work. Retail trade firms in Ireland, the United Kingdom and Cyprus are most often satisfied with their staffing level. The highest number of firms reporting surplus staff is in Germany. A lack of personnel is not a serious problem in the EU as a whole, except to a certain extent for firms in Slovenia, Hungary, and Greece, which mention the possibility of bottlenecks due to a lack of staff. The United Kingdom shows interesting results. 96% of retail trade firms (and even 100% of the largest retail trade firms) state that their current number of employees is just right, but indicate that they intend to substantially increase their personnel in the near future.
With respect to the development of the skill structure, the retail trade sector shows a pattern over the next two years that is somewhat different from that in industry. Low-skilled employees have a better chance of finding a job in this sector, at least in the EU15, where
19
23.4% of firms say that they will increase the number of low-qualified employees in the next two years. Moreover, one third of all retail trade firms in the EU intend to increase their medium-skilled staff. Finally, one quarter of the firms in the EU15 and one third in the EU10 intend to expand the number of highly skilled personnel.
Among the largest retail trade firms in UK (50 employees or more), 72% report that they will recruit extra employees at all skill levels, which is clearly above the average over all size classes. On the other side of the spectrum in United Kingdom, smaller firms plan to expand their employment at a rate which is at or below the EU average. In Italy, larger firms state that they intend to increase the number of medium- or high-skilled employees. So do Greek retail trade firms – though to a lesser extent. But also smaller Greek firms intend to increase their number of staff by more than in other EU member states.
2.2.2.4. Specific results for the service sector In the EU as whole, about 10% of firms interviewed in the service sector consider that they have insufficient staff, while 79% consider their staffing levels sufficient. Differences exist between the EU15 and the EU10 with respect to planned employment changes. In the EU15-countries, 22% of the responding firms intend to increase the number of highly skilled personnel within the next 24 months while 5% intend to reduce them over the same period. In the EU10, the number of firms intending to increase the number of highly skilled staff is higher, at 32.8%, with 9.2% considering a reduction. On the other hand, only 4.4% of firms in the EU10 intend to increase their levels of low-skilled personnel compared to 19% in the EU15.
20% of firms in the service sector in the Netherlands and 19% in Portugal consider that they have a surplus of staff, whereas this is the case for only one in ten firms EU-wide.
There are considerable differences in planned employment levels between firms in the different size categories in the service sector. Large firms (more than 49 employees) have a stronger intention to increase their staffing levels at all skill levels, though there is a general trend to reduce unskilled or low-skilled recruitment.
In Germany, half of the service sector firms with more than 49 employees consider to increase the number of low-skilled employees within the next two years. This is the highest figure reported among all EU Member States. The corresponding figures for Italy and the United Kingdom are 35% and 27%.
2.2.3. Structure of working time and operating hours
2.2.3.1. Industry In both the EU15 and the EU10, operating hours of industrial firms are fairly evenly distributed across the five hours intervals that were asked in the survey (below 40 hours per week; 40-59; 60-79; 80-119; 120 and more), i.e. they fluctuate around 20%. Only in the EU10, firms in the interval “40 to 59 operating hours” have a significantly higher weight (36%), with correspondingly lower weights for firms in the two hours intervals above. Looking at individual countries we find that industrial firms in Slovakia have the lowest operating hours, with 82% of them having operating hours of less than 40 hours per week. In Estonia, by contrast, there is not a single firm with less than 40 operating hours per week. In Lithuania, 73% of firms have operating hours of between 40 and 59 hours per week, and this percentage is 59% for Portugal and Hungary. The firms with the longest operating hours are in Luxembourg and the Czech Republic. 59% of industrial firms in Luxembourg and 54% in the Czech Republic report operating hours of 120 or more (compared to an average of 23% in the EU).
20
Weekly operating hours of industrial firms vary with firm size. The larger a firm the longer are, in general, its weekly operating hours. In the EU15, the majority of firms with fewer than 500 employees have weekly operating hours of a maximum of 59 hours per week. By contrast, 37.8% of large firms (1000 employees or more) have a weekly operating time of 120 hours or more (only 12% of firms with less than 200 employees have these operating hours). In the EU10, the situation is fairly similar. Differentiated by sub-sector, long weekly operating hours are more common in the consumer goods and intermediate goods industry, and less so in the investment goods industry.
The average number of weekly hours worked in single shift production as well as in multiple shifts production also varies considerably across countries. Average figures, therefore, give only an approximate picture. That said, the survey shows that, in the EU15, firms in the industrial sector have weekly operating hours of 38.3 hours on average in a single shift production. For multiple shifts production the weekly operating hours are 107.3 hours on average. The weekly operating hours are highest in the intermediate goods sector with an average of 120.8 hours per week. For large firms (1000 employees or more) in this sector the weekly operating hours rise to as much as 139.5. The investment goods industry has operating hours that are slightly below the average for the industry sector as a whole. Industrial firms in the EU10 have an average working week of 40 hours for a single-shift production. For multi-shift production the average working week is 91.7 hours, which is considerably below that for the EU15. In the EU10, differences between sub-sectors and firm sizes are smaller than in the EU15.
The vast majority of firms in the industrial sector in the EU15 (77.8%) and in the EU10 (73%) feel able to vary the weekly operating hours according to the actual amount of work to be done. This rate increases with firm size and is highest for firms in the investment goods sector. In Spain, Belgium, Lithuania and Cyprus, the share of industrial firms which are able to react to demand variations by implementing flexible operating hours is below the EU average. In Denmark, by contrast, this share is significantly above average.
About 90% of the firms in industry, which are able to react flexibly to demand changes, do so by applying overtime work. But more than half of the firms also react to changes in the output by varying the number of employees. The large firms use this instrument more often than small or medium-sized firms. Temporary closure of plants is used much less as a way of reacting to unfavourable business conditions, though nearly 20% of the firms interviewed responded that they do so – large firms more often than small firms.
In Germany, nearly all industrial firms that are able to react flexibly to demand changes cite the use of overtime as an important tool, while the percentage of firms that consider the variation of the number of employees important is considerably smaller. In Denmark, France, the United Kingdom and Spain, these two instruments are considered to be equally important in reacting to demand fluctuations. Temporary closures of plants are used quite often in Italy, Spain, Finland, and Hungary (by roughly one third of the industrial firms).
Firms which hitherto have been unable to use flexible working time arrangements to react to demand fluctuations would also primarily use overtime to meet increasing demand, followed by adjusting the number of employees, which is considered as important as overtime, particularly in the EU10. The results in Lithuania and Cyprus are somewhat different. In Lithuania, firms consider flexibility in the number of employees to be more important than the use of overtime. The findings are similar for Estonia. In Cyprus, by contrast, more than one half of the interviewed industrial firms consider temporary closures the most useful tool. The majority of firms interviewed do not intend to change the length of vacation time (86.9%
21
in the EU15 and 90.3% in the EU10), and where that option is considered, it is mostly in order to shorten rather than lengthen holiday leave.
The average contracted weekly working hours for full-time employees in the industrial sector is 37 hours in EU15 countries and 40 hours in the EU10. In most EU15 countries, contractual hours are below 40 hours per week, exceptions being Luxembourg, Spain, and Portugal. In the EU10, only the Czech Republic and Slovakia have a contractual working week below 40 hours.
74.1% of the industrial firms in the EU15 and 64.3% in the EU10 use shift work. Large firms in the EU10 use it clearly more often (94.2%) than the average firm. In Luxembourg, 96% of all interviewed industrial firms stated that they use shift work, and two thirds of these firms do so to ensure uninterrupted round-the-clock work. This is the highest percentage in the EU15. In the EU10, shift work can be found most frequently in Slovakia (94%) and the Czech Republic (91%). Roughly 50% of the firms in these countries work shifts around the clock.
The structure of shift work in industry varies considerably. Roughly one third of firms in the EU15 and about 40% of firms in the EU10 never interrupt the production process, an additional third interrupt the production process only during the night, and the remaining third stop production at the weekend. The pattern of three shifts a day is clearly dominant (50% of firms interviewed), with two shifts a day being the next most frequent. Shift work distributed over five days of the working week is the most common pattern, followed by shift work seven days per week. Denmark is a noteworthy exception. 12% of Danish firms in the industrial sector work shift time, but only for four days per week. In addition, Danish industrial firms implement more unconventional forms of shift work (e.g. 1.5 shifts per day etc.). In Luxembourg, four shifts a day are very common.
The percentage of staff “sometimes” or “regularly” working shifts, nights or weekends is lower in the EU15 than in the EU10. The most usual of these types of work in both areas is shift work, followed by night work. The larger the firm, the higher is the proportion of staff working flexible hours.
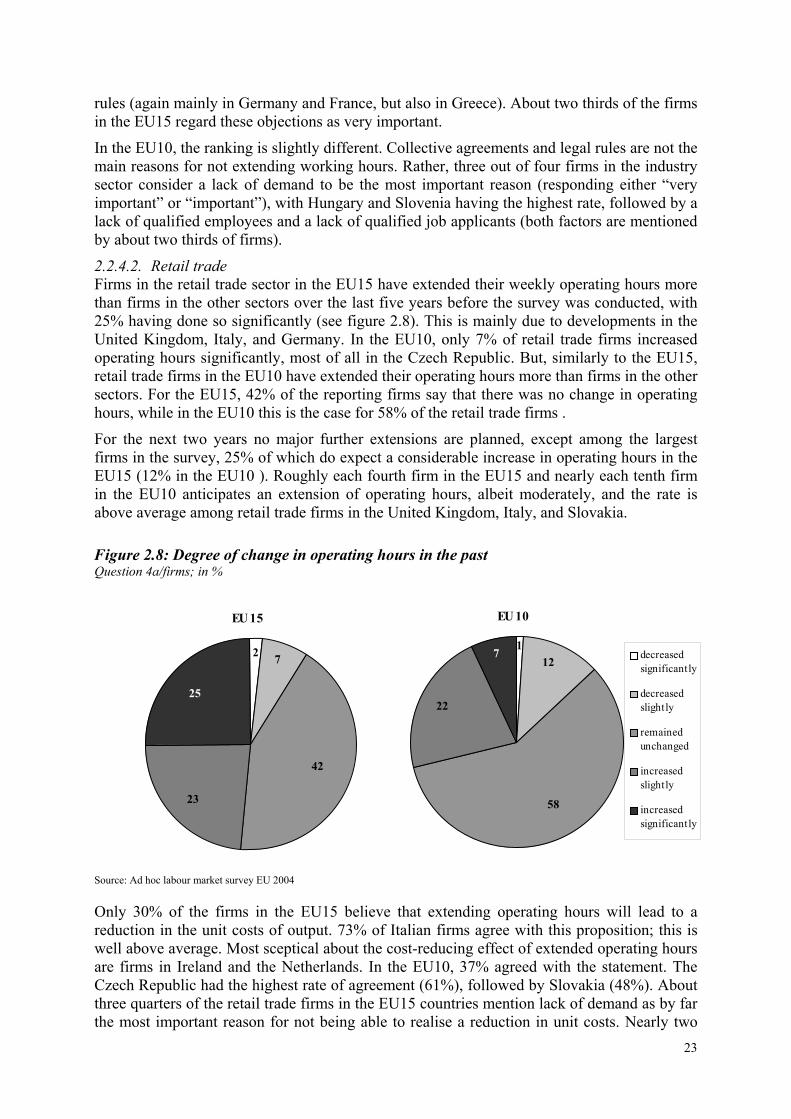
2.2.3.2. Retail trade 32% of the retail trade firms in the EU15 and 47% in the EU10 are operating on average less than 46 hours per week. On the other side, 17% of the firms in the EU15 and 21% of the firms in the EU10 are operating more than 76 hours per week. At the country level, a high number of Slovak and Danish retail trade firms state that they have operating hours of less than 46 hours (92% and 81%), while German and Dutch retail traders report more often than others that they have operating hours of between 51 and 60 hours.
48% of retail trade firms in the EU15 agree to the statement that they are able to adapt their weekly operating hours to actual requirements, 69% in the EU10. In both areas, the proportion of firms agreeing with the statement is increasing with firm size. As with industrial firms, flexibility is achieved mainly by means of overtime followed by personnel policy. Temporary closures are considered an unusual procedure, but are used more frequently in the EU10 than in the EU15. In the EU15, the highest rates of firms agreeing that they are able to flexibly adjust their operating hours are in Italy (85%) and Denmark (82%), while in the EU10 90% of Slovak and 86% of Czech firms agreed. In the latter two countries most of the firms interviewed also consider flexible adjustment by adjusting staffing levels to be more important than use of overtime.
Firms which previously had not been able to use flexible operating hours to react to demand variations would also choose overtime as the means of meeting the firm’s temporary requirements.
22
2.2.3.3. Services In the service sector, the average weekly working time of up to 45 hours is more widespread than in the retail trade sector or in industry, with 57% of service firms in the EU15 and 62% in the EU10 reporting this figure. Nevertheless, in this sector there are also enterprises with considerably higher weekly hours. 17% of the firms in the EU15 and 16% of the firms in the EU10 have weekly working hours of 76 or more. And among the large firms in the service sector (those with more than 49 employees) the proportion is 23% in the EU15 and 21% in the EU10.
In Greece, 56% of firms work more than 75 hours, which is the highest value in the EU. But also in Sweden, 44% of firms do so, and 37% in Finland. In the EU10, Cyprus is a special case. 30% of service firms have operating hours of at least 76 hours per week, which is twice the average in the EU10.
Firms in the service sector also consider themselves better able than other firms to react flexibly with respect to the working hours in the event of fluctuations in their business. This is the case for 61% of the firms in the EU15 and for 72% in the EU10. In the service sector of the EU10, the same countries as for the retail trade sector show an above-average capacity to implement flexible operating hours, namely Slovakia (93% of firms) and the Czech Republic (89%). However, 80% of firms in Estonia also agree with the statement. In the EU15, the rate is highest in Denmark (88%), followed by Finland (83%).
Also in the service sector, the most frequently used tool to meet changing demand conditions is overtime, and this would also be the tool of choice for those firms which are not able to adjust flexibly to demand fluctuations.
2.2.4. Changes in working time and operating hours
2.2.4.1. Industry For about one half of the firms in the industrial sector in the EU15 and for 58.3% in the EU10 weekly working hours had not changed in the five years before the survey (i.e. 1999-2004). In the EU15, 24.5% of the firms reduced their weekly working hours (9% significantly) as opposed to 24.7% in the EU10 (3% significantly). Small enterprises reduced the weekly working time more often than larger ones. The data shows that relatively more enterprises in Spain and France have experienced a reduction in working hours than in other countries. An increase in weekly working hours is reported by about 25% of the firms in the EU15 area (8% significantly), and by 17% in the EU10 (4% significantly). Among all EU Member States, Denmark has the highest share of industrial firms that increased their working hours (67%, of which 25% significantly). 51% of Danish firms in the investment sector increased their working hours even significantly.
Two thirds of firms in the EU15 and more than 80% of the firms in the EU10 do not plan to increase their current weekly working hours in the next two years. About 20% of industrial firms in the EU15 (25% in the investment goods sector) and 10% of firms in the EU10 intend to increase the weekly working hours (either slightly or more significantly).
Half of the industrial firms in the EU15 and a quarter of those in the EU10 believe that an extension of weekly working hours could help reduce unit costs. In the EU15, this belief is most often expressed in Germany (70% of firms) and in France (61%), and least often in Italy (29%) and in Ireland (23%). Among the countries in the EU10 this percentage ranges from 43% for industrial firms in Slovenia to 7% in Cyprus and Slovakia. But there are several reasons why firms do not extend their hours. From the firms’ viewpoint the most important objections to changing working hours are binding collective agreements (mainly in Germany), a lack of demand (mainly in Germany and in France), and country-specific administrative
23
rules (again mainly in Germany and France, but also in Greece). About two thirds of the firms in the EU15 regard these objections as very important.
In the EU10, the ranking is slightly different. Collective agreements and legal rules are not the main reasons for not extending working hours. Rather, three out of four firms in the industry sector consider a lack of demand to be the most important reason (responding either “very important” or “important”), with Hungary and Slovenia having the highest rate, followed by a lack of qualified employees and a lack of qualified job applicants (both factors are mentioned by about two thirds of firms).
2.2.4.2. Retail trade Firms in the retail trade sector in the EU15 have extended their weekly operating hours more than firms in the other sectors over the last five years before the survey was conducted, with 25% having done so significantly (see figure 2.8). This is mainly due to developments in the United Kingdom, Italy, and Germany. In the EU10, only 7% of retail trade firms increased operating hours significantly, most of all in the Czech Republic. But, similarly to the EU15, retail trade firms in the EU10 have extended their operating hours more than firms in the other sectors. For the EU15, 42% of the reporting firms say that there was no change in operating hours, while in the EU10 this is the case for 58% of the retail trade firms .
For the next two years no major further extensions are planned, except among the largest firms in the survey, 25% of which do expect a considerable increase in operating hours in the EU15 (12% in the EU10 ). Roughly each fourth firm in the EU15 and nearly each tenth firm in the EU10 anticipates an extension of operating hours, albeit moderately, and the rate is above average among retail trade firms in the United Kingdom, Italy, and Slovakia.
Figure 2.8: Degree of change in operating hours in the past Question 4a/firms; in %
Source: Ad hoc labour market survey EU 2004
Only 30% of the firms in the EU15 believe that extending operating hours will lead to a reduction in the unit costs of output. 73% of Italian firms agree with this proposition; this is well above average. Most sceptical about the cost-reducing effect of extended operating hours are firms in Ireland and the Netherlands. In the EU10, 37% agreed with the statement. The Czech Republic had the highest rate of agreement (61%), followed by Slovakia (48%). About three quarters of the retail trade firms in the EU15 countries mention lack of demand as by far the most important reason for not being able to realise a reduction in unit costs. Nearly two
EU 15
2 7
42
23
25
EU 10
22
58
127
1decreasedsignificantly
decreasedslightly
remainedunchanged
increasedslightly
increasedsignificantly
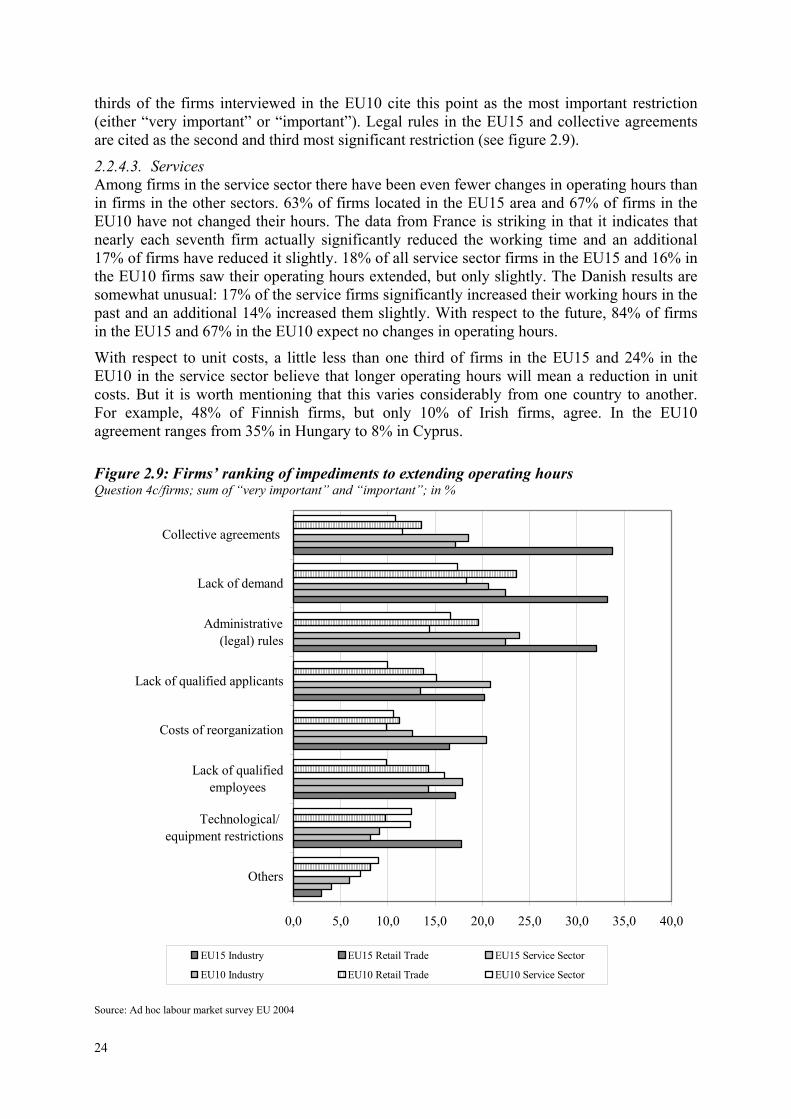
24
0,0 5,0 10,0 15,0 20,0 25,0 30,0 35,0 40,0
Others
Technological/equipment restrictions
Lack of qualifiedemployees
Costs of reorganization
Lack of qualified applicants
Administrative (legal) rules
Lack of demand
Collective agreements
EU15 Industry EU15 Retail Trade EU15 Service Sector
EU10 Industry EU10 Retail Trade EU10 Service Sector
thirds of the firms interviewed in the EU10 cite this point as the most important restriction (either “very important” or “important”). Legal rules in the EU15 and collective agreements are cited as the second and third most significant restriction (see figure 2.9).
2.2.4.3. Services Among firms in the service sector there have been even fewer changes in operating hours than in firms in the other sectors. 63% of firms located in the EU15 area and 67% of firms in the EU10 have not changed their hours. The data from France is striking in that it indicates that nearly each seventh firm actually significantly reduced the working time and an additional 17% of firms have reduced it slightly. 18% of all service sector firms in the EU15 and 16% in the EU10 firms saw their operating hours extended, but only slightly. The Danish results are somewhat unusual: 17% of the service firms significantly increased their working hours in the past and an additional 14% increased them slightly. With respect to the future, 84% of firms in the EU15 and 67% in the EU10 expect no changes in operating hours.
With respect to unit costs, a little less than one third of firms in the EU15 and 24% in the EU10 in the service sector believe that longer operating hours will mean a reduction in unit costs. But it is worth mentioning that this varies considerably from one country to another. For example, 48% of Finnish firms, but only 10% of Irish firms, agree. In the EU10 agreement ranges from 35% in Hungary to 8% in Cyprus.
Figure 2.9: Firms’ ranking of impediments to extending operating hours Question 4c/firms; sum of “very important” and “important”; in %
Source: Ad hoc labour market survey EU 2004
25
Concerning the factors that might prevent longer operating hours, 72% of the service firms in the EU15 mention legal rules first, followed by a lack of qualified applicants (63%) and a lack of qualified employees as well as collective agreements (54% each). In the EU10 a lack of demand and legal rules are mentioned by 70% of service firms, followed by technological and equipment restrictions (50%).
2.2.5. Research and development 69% of industrial firms in the EU15 report that they spend on research and development activities (R&D), 58% in the EU10. In the EU15, Swedish (89%), Finnish (88%) and Danish (81%) industrial firms are most often reporting that they are engaged in R&D. According to their self-indication, Italian firms (39%) in industry are less often engaged in R&D than firms from other EU15 countries. In the EU10, industrial firms have a high level of R&D activity in Slovenia (77%) and the Czech Republic (71%), while the opposite holds for Hungary, Lithuania, and Cyprus. Of the industrial sub-sectors, research activities are highest in the investment sector. The survey results suggest that proportionately more firms in industry are engaged in R&D than firms in retail trade and the services sector. In the retail trade sector, 17.2% of firms in the EU15 engage in R&D activities and 11.8% in the EU10. In the service sector, the figure is 28% for the EU15 and 34.1% for the EU10. As a general rule, R&D activities increase with firm size.
The majority of those firms which are engaged in research activities judge their activities to be sufficient. This holds for about 80% of the retail trade firms, 75% of the industrial firms, and nearly three quarters of service firms in the EU15. In the EU10 retail trade firms in particular have a slightly more pessimistic view. Only about two thirds of them agreed with the statement, but one quarter believe that their current research activities are not yet sufficient. Hungary stands out in that about one third of the firms in its retail trade and service sectors which are engaged in research activities judge it to be more than sufficient.
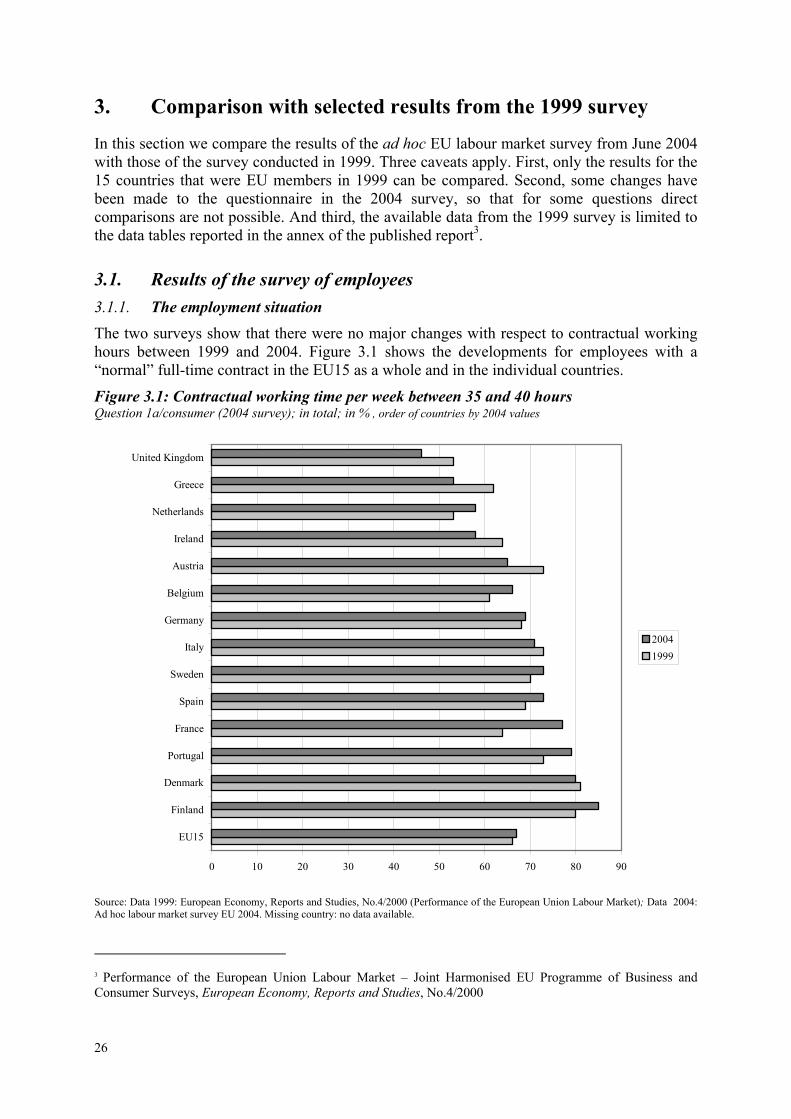
26
0 10 20 30 40 50 60 70 80 90
EU15
Finland
Denmark
Portugal
France
Spain
Sweden
Italy
Germany
Belgium
Austria
Ireland
Netherlands
Greece
United Kingdom
20041999
3. Comparison with selected results from the 1999 survey
In this section we compare the results of the ad hoc EU labour market survey from June 2004 with those of the survey conducted in 1999. Three caveats apply. First, only the results for the 15 countries that were EU members in 1999 can be compared. Second, some changes have been made to the questionnaire in the 2004 survey, so that for some questions direct comparisons are not possible. And third, the available data from the 1999 survey is limited to the data tables reported in the annex of the published report3.
3.1. Results of the survey of employees 3.1.1. The employment situation The two surveys show that there were no major changes with respect to contractual working hours between 1999 and 2004. Figure 3.1 shows the developments for employees with a “normal” full-time contract in the EU15 as a whole and in the individual countries.
Figure 3.1: Contractual working time per week between 35 and 40 hours Question 1a/consumer (2004 survey); in total; in % , order of countries by 2004 values
Source: Data 1999: European Economy, Reports and Studies, No.4/2000 (Performance of the European Union Labour Market); Data 2004: Ad hoc labour market survey EU 2004. Missing country: no data available.
3 Performance of the European Union Labour Market – Joint Harmonised EU Programme of Business and Consumer Surveys, European Economy, Reports and Studies, No.4/2000
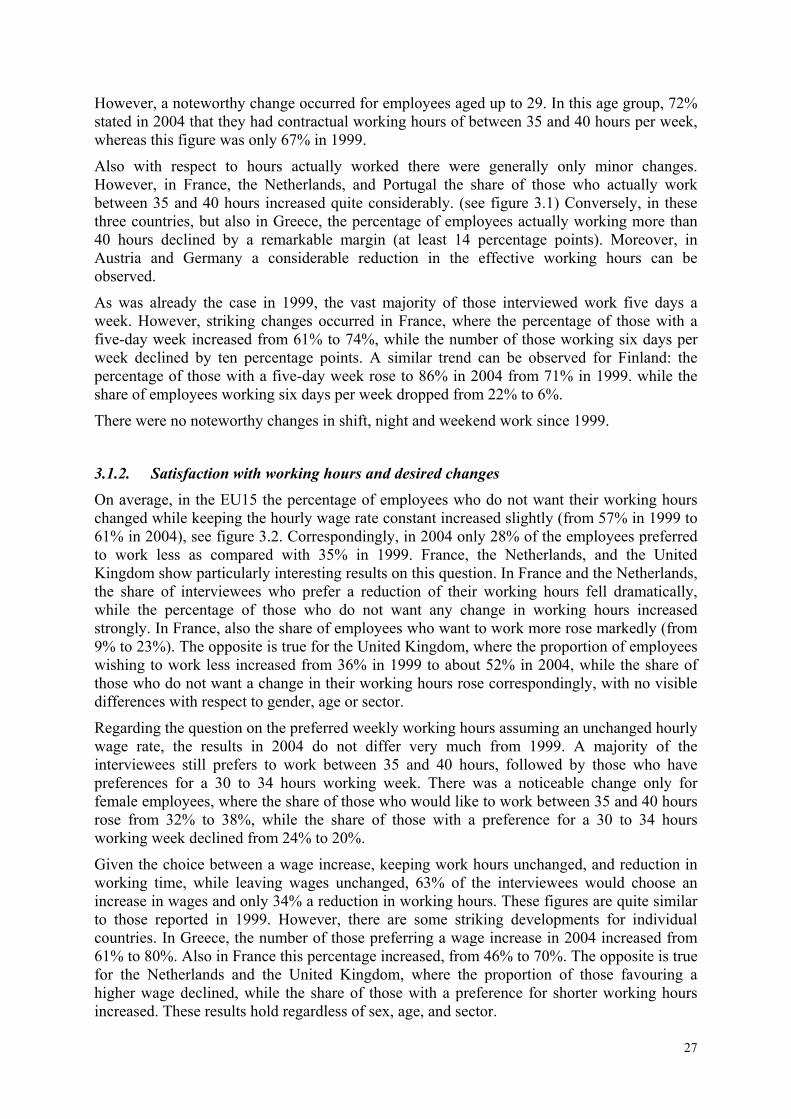
27
However, a noteworthy change occurred for employees aged up to 29. In this age group, 72% stated in 2004 that they had contractual working hours of between 35 and 40 hours per week, whereas this figure was only 67% in 1999.
Also with respect to hours actually worked there were generally only minor changes. However, in France, the Netherlands, and Portugal the share of those who actually work between 35 and 40 hours increased quite considerably. (see figure 3.1) Conversely, in these three countries, but also in Greece, the percentage of employees actually working more than 40 hours declined by a remarkable margin (at least 14 percentage points). Moreover, in Austria and Germany a considerable reduction in the effective working hours can be observed.
As was already the case in 1999, the vast majority of those interviewed work five days a week. However, striking changes occurred in France, where the percentage of those with a five-day week increased from 61% to 74%, while the number of those working six days per week declined by ten percentage points. A similar trend can be observed for Finland: the percentage of those with a five-day week rose to 86% in 2004 from 71% in 1999. while the share of employees working six days per week dropped from 22% to 6%.
There were no noteworthy changes in shift, night and weekend work since 1999.
3.1.2. Satisfaction with working hours and desired changes On average, in the EU15 the percentage of employees who do not want their working hours changed while keeping the hourly wage rate constant increased slightly (from 57% in 1999 to 61% in 2004), see figure 3.2. Correspondingly, in 2004 only 28% of the employees preferred to work less as compared with 35% in 1999. France, the Netherlands, and the United Kingdom show particularly interesting results on this question. In France and the Netherlands, the share of interviewees who prefer a reduction of their working hours fell dramatically, while the percentage of those who do not want any change in working hours increased strongly. In France, also the share of employees who want to work more rose markedly (from 9% to 23%). The opposite is true for the United Kingdom, where the proportion of employees wishing to work less increased from 36% in 1999 to about 52% in 2004, while the share of those who do not want a change in their working hours rose correspondingly, with no visible differences with respect to gender, age or sector.
Regarding the question on the preferred weekly working hours assuming an unchanged hourly wage rate, the results in 2004 do not differ very much from 1999. A majority of the interviewees still prefers to work between 35 and 40 hours, followed by those who have preferences for a 30 to 34 hours working week. There was a noticeable change only for female employees, where the share of those who would like to work between 35 and 40 hours rose from 32% to 38%, while the share of those with a preference for a 30 to 34 hours working week declined from 24% to 20%.
Given the choice between a wage increase, keeping work hours unchanged, and reduction in working time, while leaving wages unchanged, 63% of the interviewees would choose an increase in wages and only 34% a reduction in working hours. These figures are quite similar to those reported in 1999. However, there are some striking developments for individual countries. In Greece, the number of those preferring a wage increase in 2004 increased from 61% to 80%. Also in France this percentage increased, from 46% to 70%. The opposite is true for the Netherlands and the United Kingdom, where the proportion of those favouring a higher wage declined, while the share of those with a preference for shorter working hours increased. These results hold regardless of sex, age, and sector.
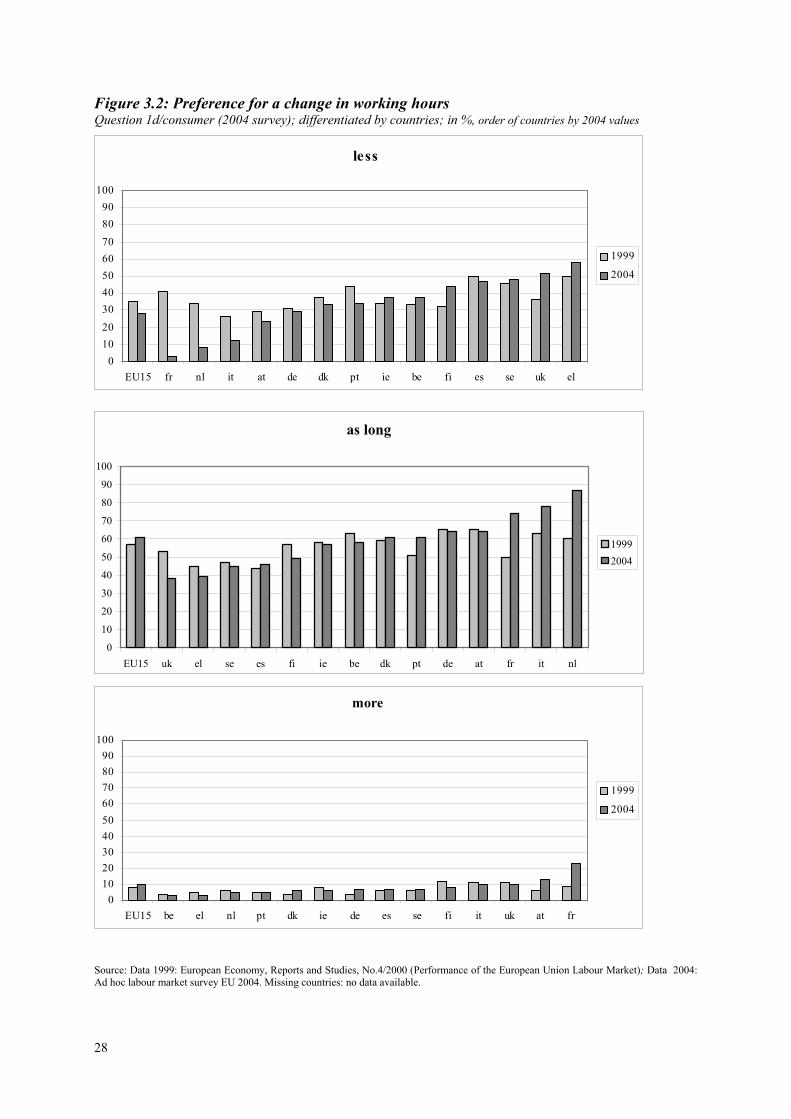
28
Figure 3.2: Preference for a change in working hours Question 1d/consumer (2004 survey); differentiated by countries; in %, order of countries by 2004 values
Source: Data 1999: European Economy, Reports and Studies, No.4/2000 (Performance of the European Union Labour Market); Data 2004: Ad hoc labour market survey EU 2004. Missing countries: no data available.
less
01020
3040506070
8090
100
EU15 fr nl it at de dk pt ie be fi es se uk el
1999
2004
as long
0
10
20
30
40
50
60
70
80
90
100
EU15 uk el se es fi ie be dk pt de at fr it nl
19992004
more
0102030405060708090
100
EU15 be el nl pt dk ie de es se fi it uk at fr
1999
2004
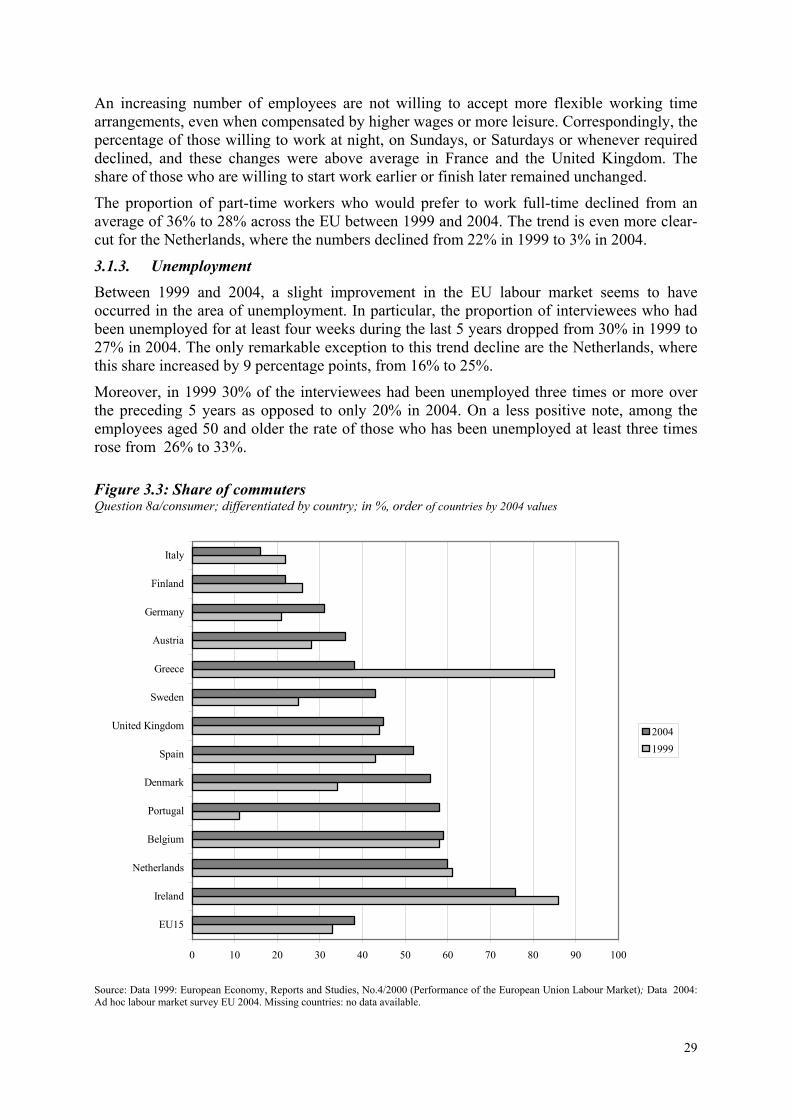
29
0 10 20 30 40 50 60 70 80 90 100
EU15
Ireland
Netherlands
Belgium
Portugal
Denmark
Spain
United Kingdom
Sweden
Greece
Austria
Germany
Finland
Italy
20041999
An increasing number of employees are not willing to accept more flexible working time arrangements, even when compensated by higher wages or more leisure. Correspondingly, the percentage of those willing to work at night, on Sundays, or Saturdays or whenever required declined, and these changes were above average in France and the United Kingdom. The share of those who are willing to start work earlier or finish later remained unchanged.
The proportion of part-time workers who would prefer to work full-time declined from an average of 36% to 28% across the EU between 1999 and 2004. The trend is even more clear-cut for the Netherlands, where the numbers declined from 22% in 1999 to 3% in 2004.
3.1.3. Unemployment Between 1999 and 2004, a slight improvement in the EU labour market seems to have occurred in the area of unemployment. In particular, the proportion of interviewees who had been unemployed for at least four weeks during the last 5 years dropped from 30% in 1999 to 27% in 2004. The only remarkable exception to this trend decline are the Netherlands, where this share increased by 9 percentage points, from 16% to 25%.
Moreover, in 1999 30% of the interviewees had been unemployed three times or more over the preceding 5 years as opposed to only 20% in 2004. On a less positive note, among the employees aged 50 and older the rate of those who has been unemployed at least three times rose from 26% to 33%.
Figure 3.3: Share of commuters Question 8a/consumer; differentiated by country; in %, order of countries by 2004 values
Source: Data 1999: European Economy, Reports and Studies, No.4/2000 (Performance of the European Union Labour Market); Data 2004: Ad hoc labour market survey EU 2004. Missing countries: no data available.
30
The general improvement in the EU labour market between 1999 and 2004 can also be seen in terms of the duration of unemployment. Whereas in 1999 about 33% had been unemployed for more than 24 months, this figure dropped to 25% in 2004, while the share of those who had been unemployed for up to eleven months increased.
3.1.4. Commuting Commuting became more common between 1999 and 2004. The share of commuters increased from 33% to 38%. Figure 3.3 shows the changes in the commuter figures in the individual countries. Commuting increased particularly strongly in Portugal, but also in Sweden, Denmark, Germany, Austria and Spain.
As in 1999, the vast majority of the interviewees had a commuting time of less than one hour. And, again as in the 1999 survey, 46% of the interviewees stated that they were not willing to commute for the sake of a new job. The share of those who are willing to move to another region to find a new job decreased from 38% to 29%. This tendency is especially pronounced in France and Italy. Whereas in 1999 about 41% (France) and 56% (Italy) were willing to move, the corresponding figures for 2004 are 29% and 18%, respectively.
3.2. The survey among firms 3.2.1. The structure of employment
3.2.1.1. Industry According to the results of the surveys in 1999 and 2004, the number of full-time employees industrial firms declined slightly, from 95% to 93% in 2004. In the individual countries, there were also only small changes. Nevertheless, among these the results for Italy, Sweden, and Belgium are worth noting. In Italy, the share of full-time workers decreased from 98% to 89%. In Belgium, 96% of the staff of industrial firms worked full-time in 1999 – whereas this was down to 90% in 2004. The reverse occurred in Sweden, where the share of full-time employees rose from 89% in 1999 to 97% in 2004. There are no differences in the tendencies between male and female employees. This statement generally also holds for different sub-sectors and firm sizes. The only exception are firms with 1000 and more employees, where the number of female full-time employees declined considerably from 90% in 1999 to 82% in 2004.
Unfortunately, no comparison can be made with respect to workers’ skill levels. While the 1999 survey distinguished between two skills levels (“skilled” and “unskilled”), in the 2004 survey three categories were distinguished (“low”, “medium” and “high”). Furthermore, unlike the 1999 survey, which allowed firms’ owners or managers to answer this question subjectively, in the 2004 survey the different categories were defined precisely (see the questionnaire in the annex). For the sake of comparison we added the “medium skilled” and “high skilled” categories in 2004 and equated them with the “skilled” category of 1999. However, when doing so it turned out that the share of skilled workers defined in such a way for 2004 was lower for all sectors, i.e. industry, retail trade and services, which is a highly implausible result. The conclusion is that due to strong deviations in the definition of the level of skills the results of the two surveys are not comparable.
In 2004, as in 1999, 93% of the employees had a permanent work contract. Except for Italy, where there was a slight reduction in the share of permanent contracts from 96% to 89%, and Sweden, where the share increased from 89% to 95%, only minor changes occurred. This trend holds for all industrial sectors as well as for all sizes of firms. Only with respect to female employment some notable changes occurred in certain countries. For example, in Spain the number of permanent work contracts for women increased by eight percentage
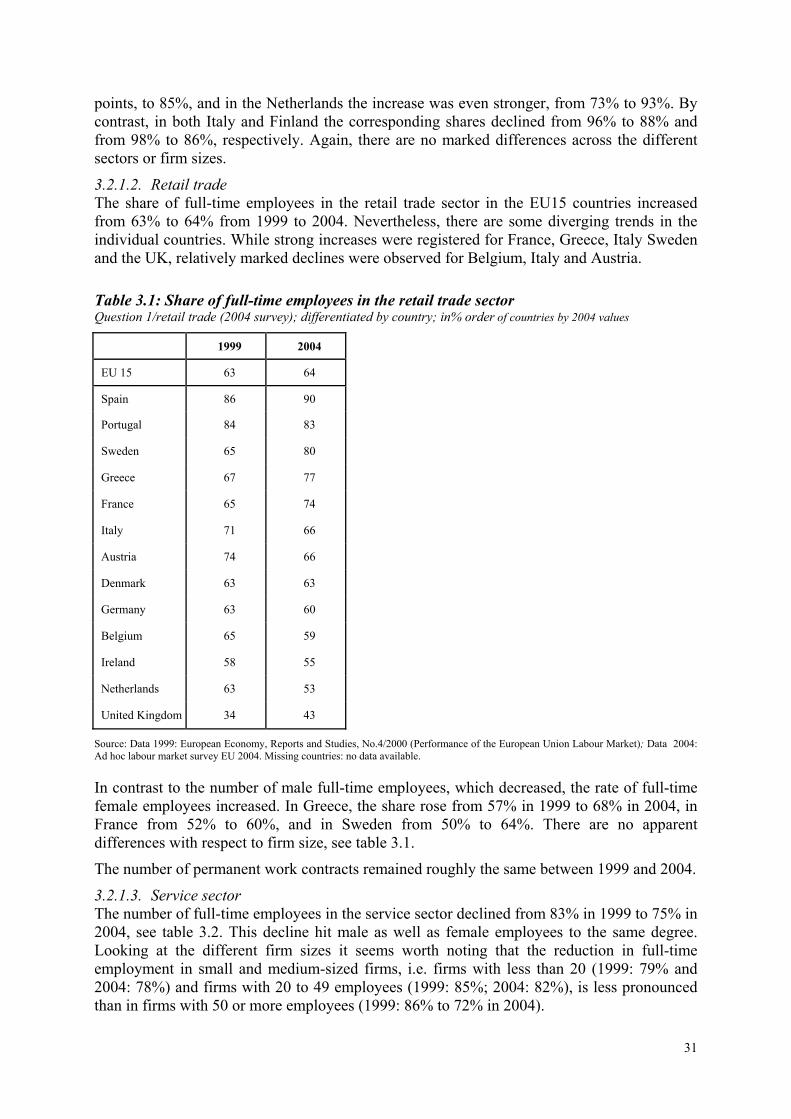
31
points, to 85%, and in the Netherlands the increase was even stronger, from 73% to 93%. By contrast, in both Italy and Finland the corresponding shares declined from 96% to 88% and from 98% to 86%, respectively. Again, there are no marked differences across the different sectors or firm sizes.
3.2.1.2. Retail trade The share of full-time employees in the retail trade sector in the EU15 countries increased from 63% to 64% from 1999 to 2004. Nevertheless, there are some diverging trends in the individual countries. While strong increases were registered for France, Greece, Italy Sweden and the UK, relatively marked declines were observed for Belgium, Italy and Austria.
Table 3.1: Share of full-time employees in the retail trade sector Question 1/retail trade (2004 survey); differentiated by country; in% order of countries by 2004 values
1999 2004
EU 15 63 64
Spain 86 90
Portugal 84 83
Sweden 65 80
Greece 67 77
France 65 74
Italy 71 66
Austria 74 66
Denmark 63 63
Germany 63 60
Belgium 65 59
Ireland 58 55
Netherlands 63 53
United Kingdom 34 43
Source: Data 1999: European Economy, Reports and Studies, No.4/2000 (Performance of the European Union Labour Market); Data 2004: Ad hoc labour market survey EU 2004. Missing countries: no data available.
In contrast to the number of male full-time employees, which decreased, the rate of full-time female employees increased. In Greece, the share rose from 57% in 1999 to 68% in 2004, in France from 52% to 60%, and in Sweden from 50% to 64%. There are no apparent differences with respect to firm size, see table 3.1.
The number of permanent work contracts remained roughly the same between 1999 and 2004.
3.2.1.3. Service sector The number of full-time employees in the service sector declined from 83% in 1999 to 75% in 2004, see table 3.2. This decline hit male as well as female employees to the same degree. Looking at the different firm sizes it seems worth noting that the reduction in full-time employment in small and medium-sized firms, i.e. firms with less than 20 (1999: 79% and 2004: 78%) and firms with 20 to 49 employees (1999: 85%; 2004: 82%), is less pronounced than in firms with 50 or more employees (1999: 86% to 72% in 2004).
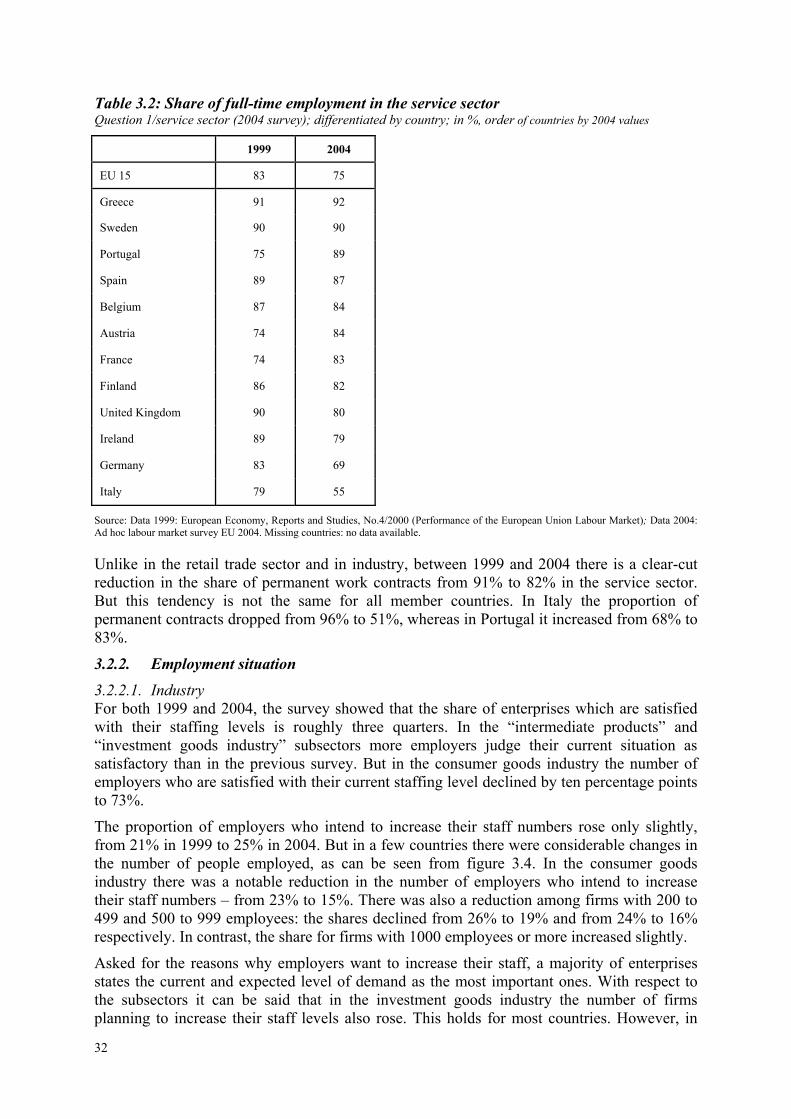
32
Table 3.2: Share of full-time employment in the service sector Question 1/service sector (2004 survey); differentiated by country; in %, order of countries by 2004 values
1999 2004
EU 15 83 75
Greece 91 92
Sweden 90 90
Portugal 75 89
Spain 89 87
Belgium 87 84
Austria 74 84
France 74 83
Finland 86 82
United Kingdom 90 80
Ireland 89 79
Germany 83 69
Italy 79 55
Source: Data 1999: European Economy, Reports and Studies, No.4/2000 (Performance of the European Union Labour Market); Data 2004: Ad hoc labour market survey EU 2004. Missing countries: no data available.
Unlike in the retail trade sector and in industry, between 1999 and 2004 there is a clear-cut reduction in the share of permanent work contracts from 91% to 82% in the service sector. But this tendency is not the same for all member countries. In Italy the proportion of permanent contracts dropped from 96% to 51%, whereas in Portugal it increased from 68% to 83%.
3.2.2. Employment situation
3.2.2.1. Industry For both 1999 and 2004, the survey showed that the share of enterprises which are satisfied with their staffing levels is roughly three quarters. In the “intermediate products” and “investment goods industry” subsectors more employers judge their current situation as satisfactory than in the previous survey. But in the consumer goods industry the number of employers who are satisfied with their current staffing level declined by ten percentage points to 73%.
The proportion of employers who intend to increase their staff numbers rose only slightly, from 21% in 1999 to 25% in 2004. But in a few countries there were considerable changes in the number of people employed, as can be seen from figure 3.4. In the consumer goods industry there was a notable reduction in the number of employers who intend to increase their staff numbers – from 23% to 15%. There was also a reduction among firms with 200 to 499 and 500 to 999 employees: the shares declined from 26% to 19% and from 24% to 16% respectively. In contrast, the share for firms with 1000 employees or more increased slightly.
Asked for the reasons why employers want to increase their staff, a majority of enterprises states the current and expected level of demand as the most important ones. With respect to the subsectors it can be said that in the investment goods industry the number of firms planning to increase their staff levels also rose. This holds for most countries. However, in
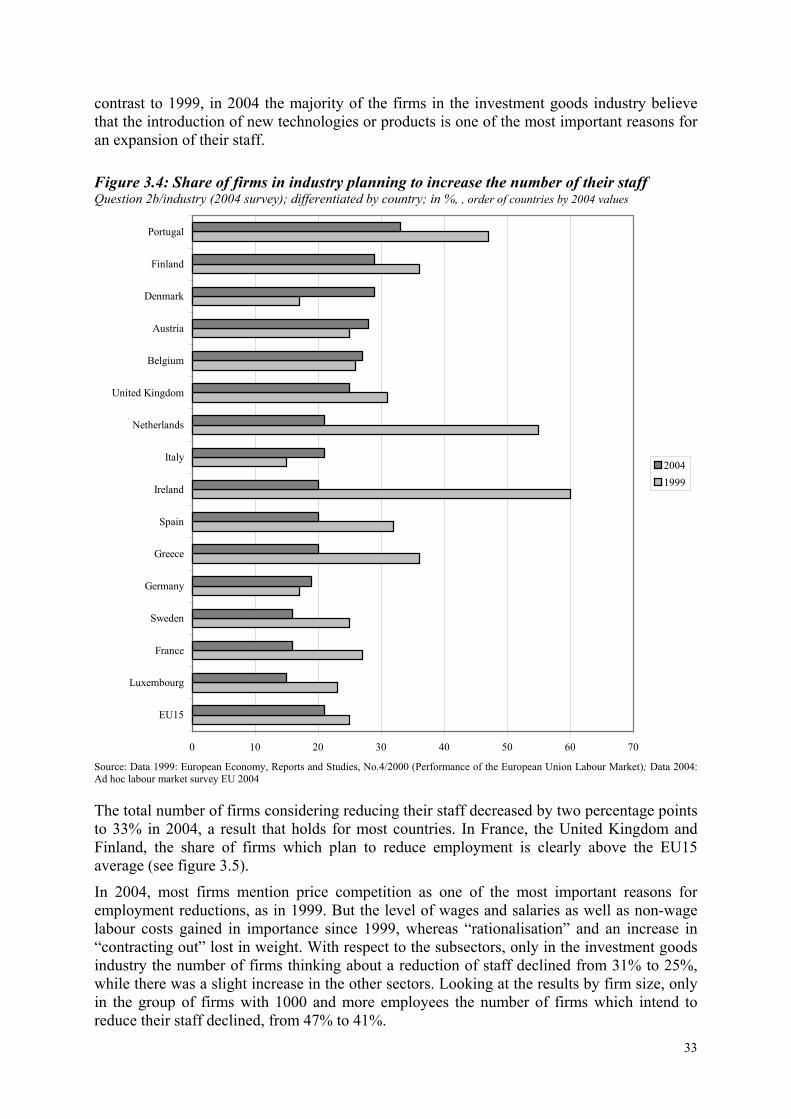
33
0 10 20 30 40 50 60 70
EU15
Luxembourg
France
Sweden
Germany
Greece
Spain
Ireland
Italy
Netherlands
United Kingdom
Belgium
Austria
Denmark
Finland
Portugal
20041999
contrast to 1999, in 2004 the majority of the firms in the investment goods industry believe that the introduction of new technologies or products is one of the most important reasons for an expansion of their staff.
Figure 3.4: Share of firms in industry planning to increase the number of their staff Question 2b/industry (2004 survey); differentiated by country; in %, , order of countries by 2004 values
Source: Data 1999: European Economy, Reports and Studies, No.4/2000 (Performance of the European Union Labour Market); Data 2004: Ad hoc labour market survey EU 2004
The total number of firms considering reducing their staff decreased by two percentage points to 33% in 2004, a result that holds for most countries. In France, the United Kingdom and Finland, the share of firms which plan to reduce employment is clearly above the EU15 average (see figure 3.5).
In 2004, most firms mention price competition as one of the most important reasons for employment reductions, as in 1999. But the level of wages and salaries as well as non-wage labour costs gained in importance since 1999, whereas “rationalisation” and an increase in “contracting out” lost in weight. With respect to the subsectors, only in the investment goods industry the number of firms thinking about a reduction of staff declined from 31% to 25%, while there was a slight increase in the other sectors. Looking at the results by firm size, only in the group of firms with 1000 and more employees the number of firms which intend to reduce their staff declined, from 47% to 41%.
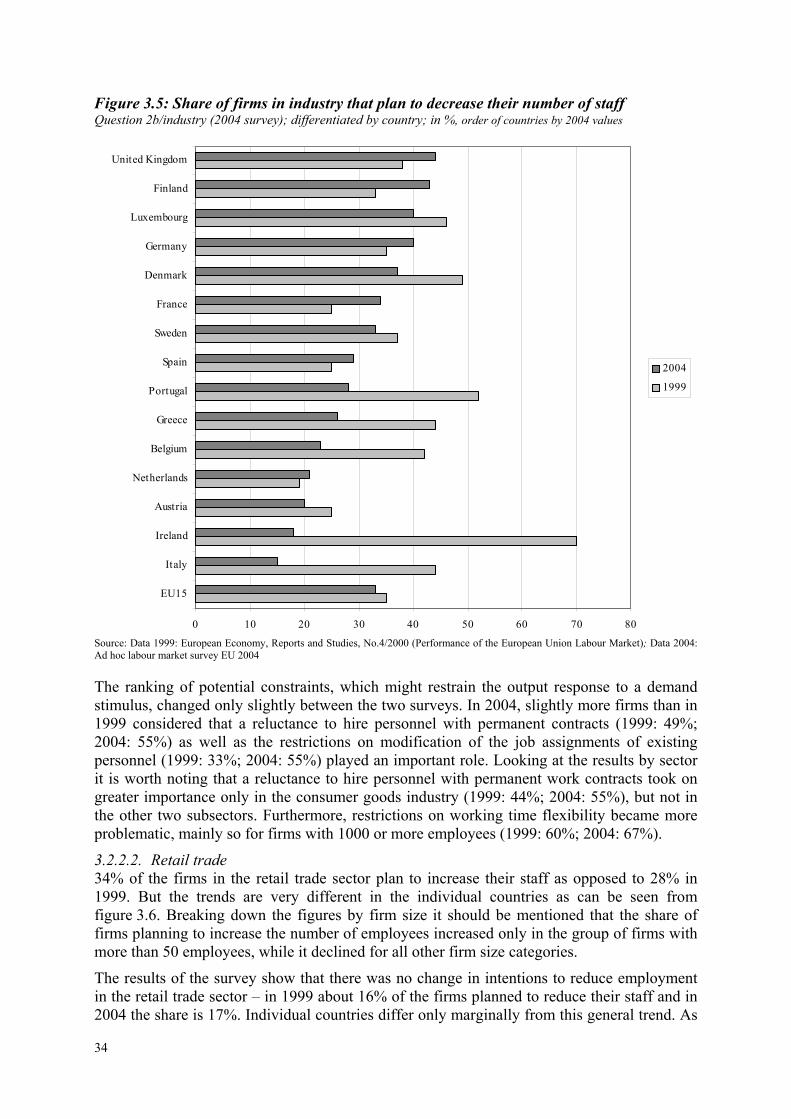
34
0 10 20 30 40 50 60 70 80
EU15
Italy
Ireland
Austria
Netherlands
Belgium
Greece
Portugal
Spain
Sweden
France
Denmark
Germany
Luxembourg
Finland
United Kingdom
2004
1999
Figure 3.5: Share of firms in industry that plan to decrease their number of staff Question 2b/industry (2004 survey); differentiated by country; in %, order of countries by 2004 values
Source: Data 1999: European Economy, Reports and Studies, No.4/2000 (Performance of the European Union Labour Market); Data 2004: Ad hoc labour market survey EU 2004
The ranking of potential constraints, which might restrain the output response to a demand stimulus, changed only slightly between the two surveys. In 2004, slightly more firms than in 1999 considered that a reluctance to hire personnel with permanent contracts (1999: 49%; 2004: 55%) as well as the restrictions on modification of the job assignments of existing personnel (1999: 33%; 2004: 55%) played an important role. Looking at the results by sector it is worth noting that a reluctance to hire personnel with permanent work contracts took on greater importance only in the consumer goods industry (1999: 44%; 2004: 55%), but not in the other two subsectors. Furthermore, restrictions on working time flexibility became more problematic, mainly so for firms with 1000 or more employees (1999: 60%; 2004: 67%).
3.2.2.2. Retail trade 34% of the firms in the retail trade sector plan to increase their staff as opposed to 28% in 1999. But the trends are very different in the individual countries as can be seen from figure 3.6. Breaking down the figures by firm size it should be mentioned that the share of firms planning to increase the number of employees increased only in the group of firms with more than 50 employees, while it declined for all other firm size categories.
The results of the survey show that there was no change in intentions to reduce employment in the retail trade sector – in 1999 about 16% of the firms planned to reduce their staff and in 2004 the share is 17%. Individual countries differ only marginally from this general trend. As
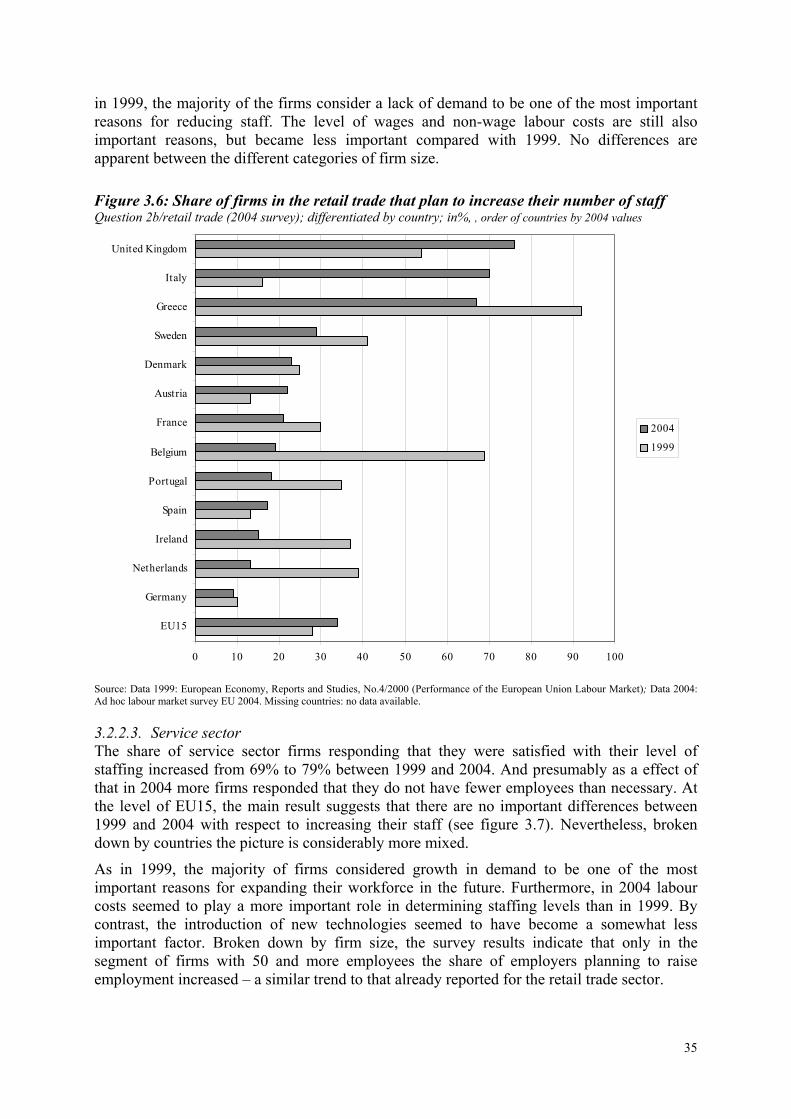
35
0 10 20 30 40 50 60 70 80 90 100
EU15
Germany
Netherlands
Ireland
Spain
Portugal
Belgium
France
Austria
Denmark
Sweden
Greece
Italy
United Kingdom
2004
1999
in 1999, the majority of the firms consider a lack of demand to be one of the most important reasons for reducing staff. The level of wages and non-wage labour costs are still also important reasons, but became less important compared with 1999. No differences are apparent between the different categories of firm size.
Figure 3.6: Share of firms in the retail trade that plan to increase their number of staff Question 2b/retail trade (2004 survey); differentiated by country; in%, , order of countries by 2004 values
Source: Data 1999: European Economy, Reports and Studies, No.4/2000 (Performance of the European Union Labour Market); Data 2004: Ad hoc labour market survey EU 2004. Missing countries: no data available.
3.2.2.3. Service sector The share of service sector firms responding that they were satisfied with their level of staffing increased from 69% to 79% between 1999 and 2004. And presumably as a effect of that in 2004 more firms responded that they do not have fewer employees than necessary. At the level of EU15, the main result suggests that there are no important differences between 1999 and 2004 with respect to increasing their staff (see figure 3.7). Nevertheless, broken down by countries the picture is considerably more mixed.
As in 1999, the majority of firms considered growth in demand to be one of the most important reasons for expanding their workforce in the future. Furthermore, in 2004 labour costs seemed to play a more important role in determining staffing levels than in 1999. By contrast, the introduction of new technologies seemed to have become a somewhat less important factor. Broken down by firm size, the survey results indicate that only in the segment of firms with 50 and more employees the share of employers planning to raise employment increased – a similar trend to that already reported for the retail trade sector.
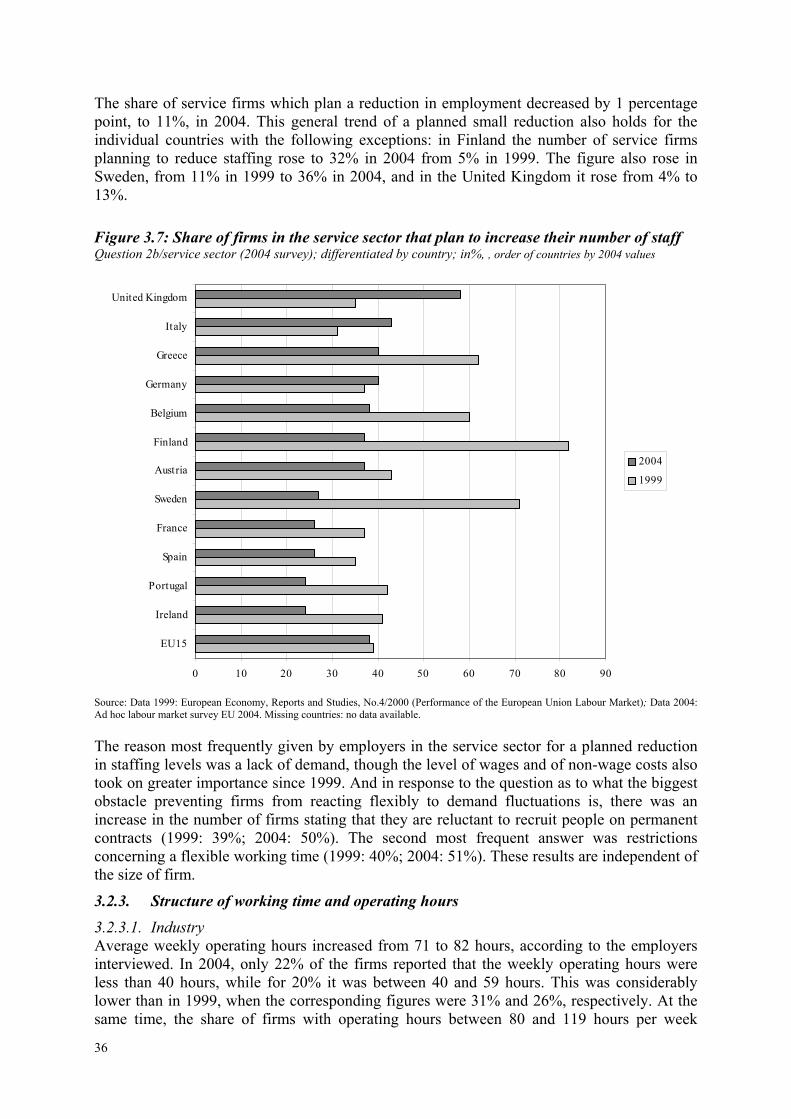
36
0 10 20 30 40 50 60 70 80 90
EU15
Ireland
Portugal
Spain
France
Sweden
Austria
Finland
Belgium
Germany
Greece
Italy
United Kingdom
2004
1999
The share of service firms which plan a reduction in employment decreased by 1 percentage point, to 11%, in 2004. This general trend of a planned small reduction also holds for the individual countries with the following exceptions: in Finland the number of service firms planning to reduce staffing rose to 32% in 2004 from 5% in 1999. The figure also rose in Sweden, from 11% in 1999 to 36% in 2004, and in the United Kingdom it rose from 4% to 13%.
Figure 3.7: Share of firms in the service sector that plan to increase their number of staff Question 2b/service sector (2004 survey); differentiated by country; in%, , order of countries by 2004 values
Source: Data 1999: European Economy, Reports and Studies, No.4/2000 (Performance of the European Union Labour Market); Data 2004: Ad hoc labour market survey EU 2004. Missing countries: no data available.
The reason most frequently given by employers in the service sector for a planned reduction in staffing levels was a lack of demand, though the level of wages and of non-wage costs also took on greater importance since 1999. And in response to the question as to what the biggest obstacle preventing firms from reacting flexibly to demand fluctuations is, there was an increase in the number of firms stating that they are reluctant to recruit people on permanent contracts (1999: 39%; 2004: 50%). The second most frequent answer was restrictions concerning a flexible working time (1999: 40%; 2004: 51%). These results are independent of the size of firm.
3.2.3. Structure of working time and operating hours
3.2.3.1. Industry Average weekly operating hours increased from 71 to 82 hours, according to the employers interviewed. In 2004, only 22% of the firms reported that the weekly operating hours were less than 40 hours, while for 20% it was between 40 and 59 hours. This was considerably lower than in 1999, when the corresponding figures were 31% and 26%, respectively. At the same time, the share of firms with operating hours between 80 and 119 hours per week
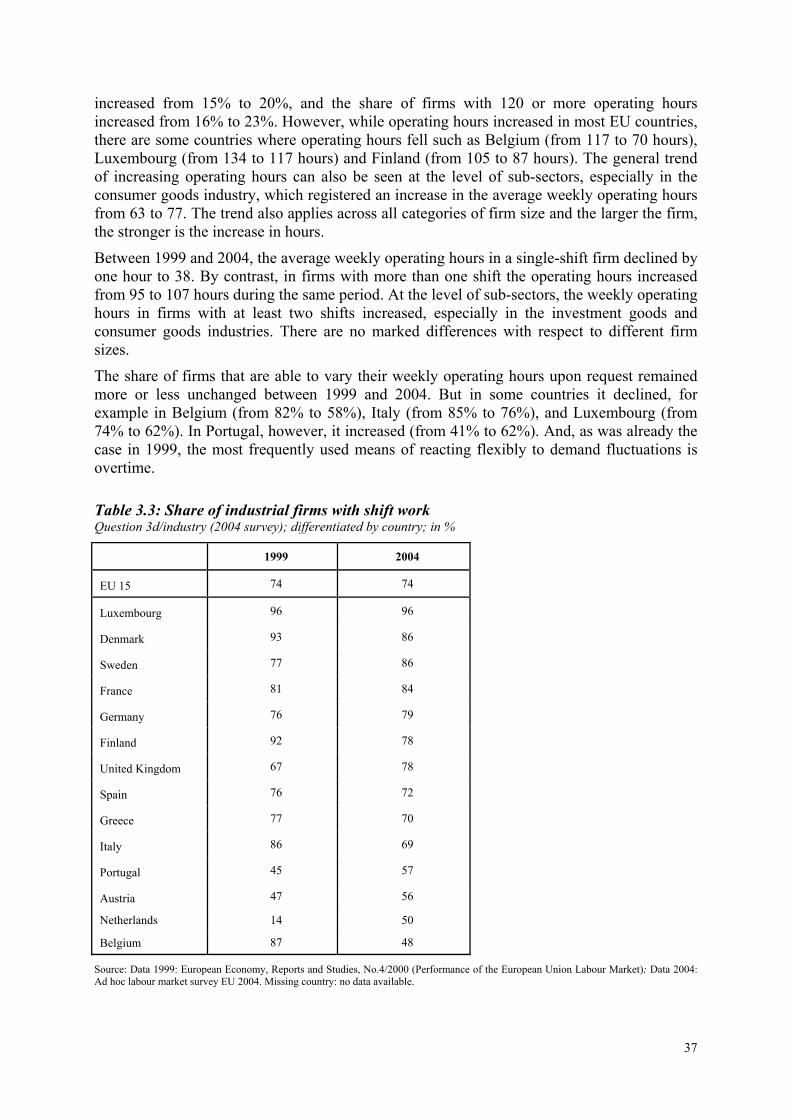
37
increased from 15% to 20%, and the share of firms with 120 or more operating hours increased from 16% to 23%. However, while operating hours increased in most EU countries, there are some countries where operating hours fell such as Belgium (from 117 to 70 hours), Luxembourg (from 134 to 117 hours) and Finland (from 105 to 87 hours). The general trend of increasing operating hours can also be seen at the level of sub-sectors, especially in the consumer goods industry, which registered an increase in the average weekly operating hours from 63 to 77. The trend also applies across all categories of firm size and the larger the firm, the stronger is the increase in hours.
Between 1999 and 2004, the average weekly operating hours in a single-shift firm declined by one hour to 38. By contrast, in firms with more than one shift the operating hours increased from 95 to 107 hours during the same period. At the level of sub-sectors, the weekly operating hours in firms with at least two shifts increased, especially in the investment goods and consumer goods industries. There are no marked differences with respect to different firm sizes.
The share of firms that are able to vary their weekly operating hours upon request remained more or less unchanged between 1999 and 2004. But in some countries it declined, for example in Belgium (from 82% to 58%), Italy (from 85% to 76%), and Luxembourg (from 74% to 62%). In Portugal, however, it increased (from 41% to 62%). And, as was already the case in 1999, the most frequently used means of reacting flexibly to demand fluctuations is overtime.
Table 3.3: Share of industrial firms with shift work Question 3d/industry (2004 survey); differentiated by country; in %
1999 2004
EU 15 74 74
Luxembourg 96 96
Denmark 93 86
Sweden 77 86
France 81 84
Germany 76 79
Finland 92 78
United Kingdom 67 78
Spain 76 72
Greece 77 70
Italy 86 69
Portugal 45 57
Austria 47 56
Netherlands 14 50
Belgium 87 48
Source: Data 1999: European Economy, Reports and Studies, No.4/2000 (Performance of the European Union Labour Market); Data 2004: Ad hoc labour market survey EU 2004. Missing country: no data available.
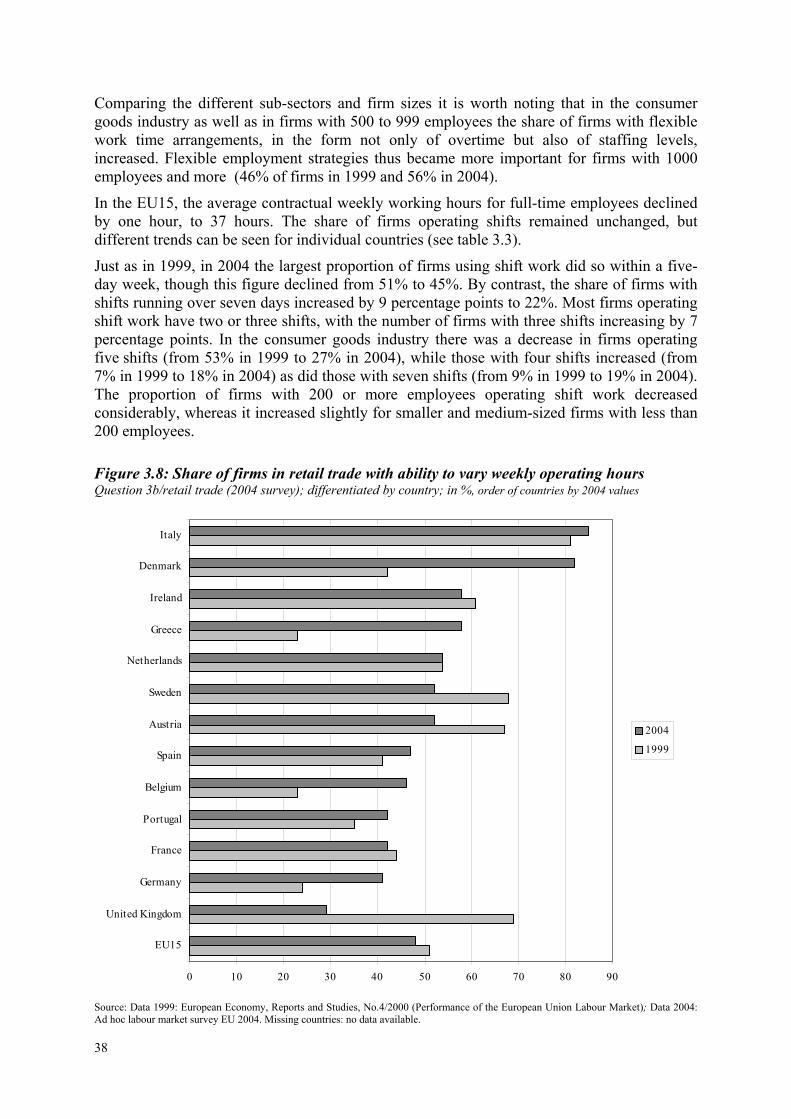
38
0 10 20 30 40 50 60 70 80 90
EU15
United Kingdom
Germany
France
Portugal
Belgium
Spain
Austria
Sweden
Netherlands
Greece
Ireland
Denmark
Italy
2004
1999
Comparing the different sub-sectors and firm sizes it is worth noting that in the consumer goods industry as well as in firms with 500 to 999 employees the share of firms with flexible work time arrangements, in the form not only of overtime but also of staffing levels, increased. Flexible employment strategies thus became more important for firms with 1000 employees and more (46% of firms in 1999 and 56% in 2004).
In the EU15, the average contractual weekly working hours for full-time employees declined by one hour, to 37 hours. The share of firms operating shifts remained unchanged, but different trends can be seen for individual countries (see table 3.3).
Just as in 1999, in 2004 the largest proportion of firms using shift work did so within a five-day week, though this figure declined from 51% to 45%. By contrast, the share of firms with shifts running over seven days increased by 9 percentage points to 22%. Most firms operating shift work have two or three shifts, with the number of firms with three shifts increasing by 7 percentage points. In the consumer goods industry there was a decrease in firms operating five shifts (from 53% in 1999 to 27% in 2004), while those with four shifts increased (from 7% in 1999 to 18% in 2004) as did those with seven shifts (from 9% in 1999 to 19% in 2004). The proportion of firms with 200 or more employees operating shift work decreased considerably, whereas it increased slightly for smaller and medium-sized firms with less than 200 employees.
Figure 3.8: Share of firms in retail trade with ability to vary weekly operating hours Question 3b/retail trade (2004 survey); differentiated by country; in %, order of countries by 2004 values
Source: Data 1999: European Economy, Reports and Studies, No.4/2000 (Performance of the European Union Labour Market); Data 2004: Ad hoc labour market survey EU 2004. Missing countries: no data available.
39
The proportion of employees regularly working shift time fell from 38% in 1999 to 32% in 2004. But the share of firms sometimes working shift time increased by 7 percentage points. The same trend can be seen for employees who regularly or sometimes work on Saturdays.
3.2.3.2. Retail trade Weekly operating hours did not change very much in the retail trade sector; they increased marginally by one hour to 57 hours per week. However, the share of firms with less than 45 operating hours and the share of those with more than 76 operating hours increased by 8 percentage points. In the individual EU countries, only Belgium, Denmark, Greece, and United Kingdom show larger differences in comparison with the 1999 results. There is no difference between firms of different sizes.
In 2004, 48% of retail trade firms were able to vary their weekly working time if necessary. This is 3 percentage points below the result reported in the 1999. The differences between countries can be seen in figure 3.8.
Compared with 1999, in 2004 adjustments to the staffing level and temporary closures were less often used as a tool for a flexible capacity utilisation.
The contractual workweek of full-time employees remained unchanged at 39 hours per week for all sizes of firm. The only exceptions are Belgium, where the average contractual work time increased from 32 to 38 hours, and Portugal, where it decreased from 51 to 40 hours per week.
3.2.4. Changes in operating hours
3.2.4.1. Industry On average across the EU15, 50% of the firms reported that they had no changes in their weekly operating hours over the preceding five years. This is very similar to the results in 1999, when 48% reported that there had been no change in their weekly operating hours. By contrast, in 2004 8% said that they had increased the operating hours, whereas this figure was 15% in 1999. For most EU countries the operating hours remained broadly unchanged over the observation period.
Changes in EU firms’ expectations of prospective weekly operating hours were also fairly small between 1999 and 2004. At the level of sub-sectors, the number of firms which did not expect any changes increased (from 68% in 1999 to 74% in 2004) in the intermediate goods industry. In the investment goods industry, the number of firms expecting no changes decreased (from 66% in 1999 to 58% in 2004), while the number of those expecting slight or even significant increases increased. Regarding this question, there is little difference between firm sizes, an exception being firms employing 500 to 999 workers. For this firm size, the number of employers expecting operating hours to remain the same increased (from 63% in 1999 to 69% in 2004), while slightly fewer expected a small reduction in operating hours in 2004 compared to 1999.
In 2004, about half of the responding firms believe that an extension of weekly operating hours might help to reduce unit costs, as in 1999. This percentage is higher in the consumer goods industry and for firms with 1000 and more employees. For firms with 200 to 499 and with 500 to 999 employees, however, the number of firms holding the view that an extension of weekly operating hours might help to reduce unit costs declined. Concerning reasons acting as obstacles to an extension of operating hours there was little change between 1999 and 2004. The most frequently mentioned reasons were collective agreements, lack of demand, and legal rules in the country in question.
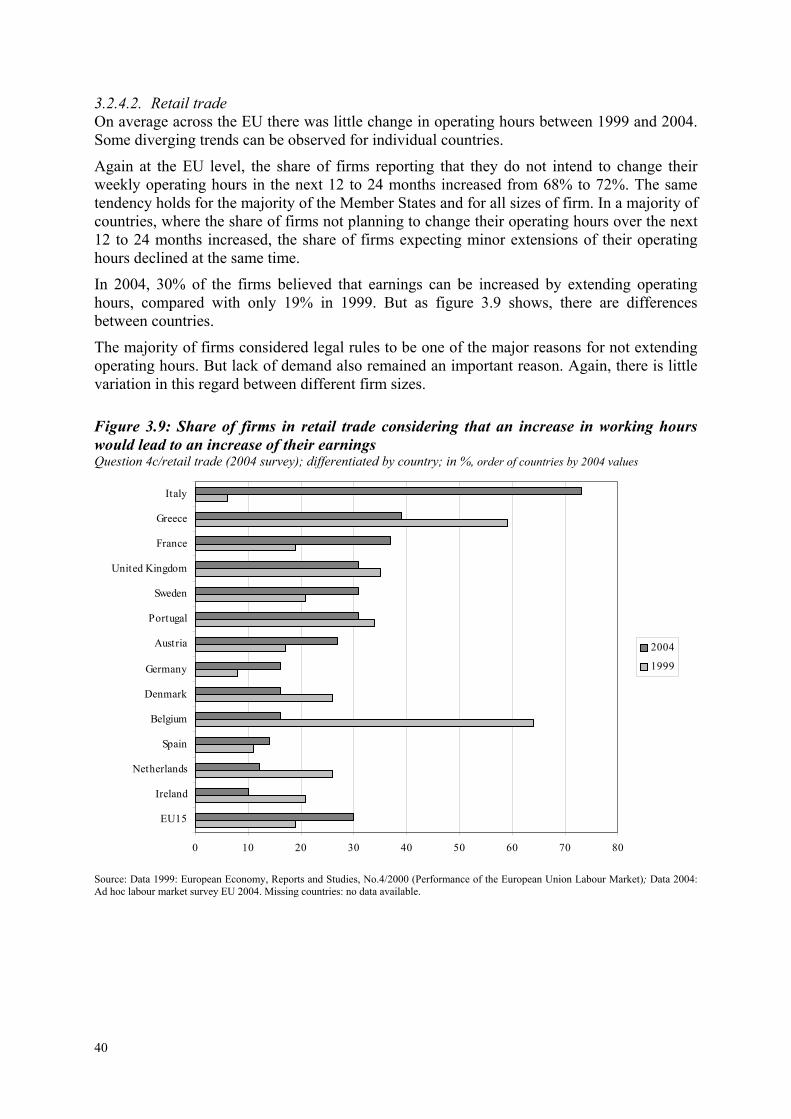
40
0 10 20 30 40 50 60 70 80
EU15
Ireland
Netherlands
Spain
Belgium
Denmark
Germany
Austria
Portugal
Sweden
United Kingdom
France
Greece
Italy
2004
1999
3.2.4.2. Retail trade On average across the EU there was little change in operating hours between 1999 and 2004. Some diverging trends can be observed for individual countries.
Again at the EU level, the share of firms reporting that they do not intend to change their weekly operating hours in the next 12 to 24 months increased from 68% to 72%. The same tendency holds for the majority of the Member States and for all sizes of firm. In a majority of countries, where the share of firms not planning to change their operating hours over the next 12 to 24 months increased, the share of firms expecting minor extensions of their operating hours declined at the same time.
In 2004, 30% of the firms believed that earnings can be increased by extending operating hours, compared with only 19% in 1999. But as figure 3.9 shows, there are differences between countries.
The majority of firms considered legal rules to be one of the major reasons for not extending operating hours. But lack of demand also remained an important reason. Again, there is little variation in this regard between different firm sizes.
Figure 3.9: Share of firms in retail trade considering that an increase in working hours would lead to an increase of their earnings Question 4c/retail trade (2004 survey); differentiated by country; in %, order of countries by 2004 values
Source: Data 1999: European Economy, Reports and Studies, No.4/2000 (Performance of the European Union Labour Market); Data 2004: Ad hoc labour market survey EU 2004. Missing countries: no data available.
41
4. The ageing society and employment in the European Union
The ongoing demographic change in European countries has forced a rethink about employment policy with respect to older people. As demographic changes lead to a decrease in the economically active population, one of the EU’s Lisbon targets is to increase not only the labour market participation rate overall, but especially that of older people. However, this group often presents problems within the labour market, notably insufficiently up-to-date skills, as investments in human capital are less cost-effective for this age group than for younger workers. Regardless of whether early retirement schemes are in place or not, therefore, younger workers are likely to replace older workers. In addition, older unemployed persons are a problematic group among the unemployed. It can be difficult to integrate them into employment, again because of a lack of up-to-date skills as well as the prospect of early retirement.
What does the data of the 2004 ad hoc survey tell us about older employed and unemployed people? This chapter looks at how the age groups at the opposite ends of the spectrum of working life fare in respect of their current and preferred employment situation, unemployment history, human capital, and regional flexibility. “Older people” are defined as people aged 50 and upwards. “Younger people” are those aged 14 to 29. Due to historical and institutional differences between the EU15 and the EU10 the European Union is not considered as a whole.
4.1. Current employment situation Employed respondents were asked for their contractual and actual hours of work. While there are no age-related differences for male employees, a significant proportion of female employees, and among them particularly older ones, work part-time (i.e. no more than 29 hours per week), both contractually and actually (see table 4.1, columns a1/2 and b1/2). These age-related differences between the sexes are, however, mainly observable in the EU15. In the EU10, the percentage of older female employees working part-time is only slightly higher than the average. The fact that part-time work is less common among older female employees in the EU10 in the use of part-time work between the EU15 and the EU10 could be the result either of a short supply of part-time jobs by firms or low demand on the side of employees or a lack of legal rules for part-time work. As persons in any kind of retirement arrangement were excluded from the interviews, part-time work among older people cannot be attributed to the existence of early retirement schemes.
Older employees in the EU15 differ hardly from younger employees with respect to non-standard working hours, e.g. Saturday or Sunday, night, overtime or shift work, although some differences can be observed concerning overtime. Compared to younger employees, older employees more often do not make any overtime. The results for the EU10 show differences between men and women: the percentage of women, who is not working “non-standard” in one of these forms of flexibility, is higher for older compared to younger employees, while there are no age effects among men.
4.2. Employment situation - satisfaction and willingness to change In the EU15, more employees would choose to work part-time than the number actually having part-time contracts. Correspondingly, the proportion of employees that would choose to work more than 35 hours per week is smaller than the proportion of employees actually working more than 35 hours per week. This result holds across all age and gender groups (table 4.1, cols. a3 and b3). On average, 9% of all full-time employees would be willing to
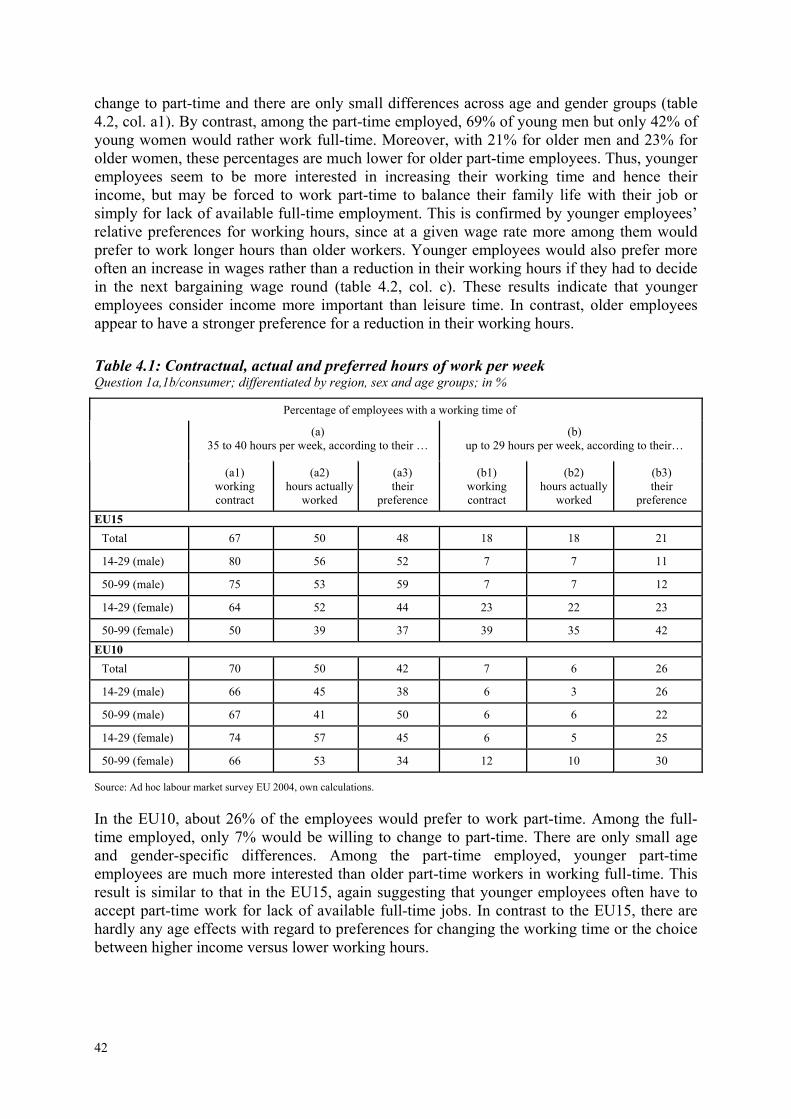
42
change to part-time and there are only small differences across age and gender groups (table 4.2, col. a1). By contrast, among the part-time employed, 69% of young men but only 42% of young women would rather work full-time. Moreover, with 21% for older men and 23% for older women, these percentages are much lower for older part-time employees. Thus, younger employees seem to be more interested in increasing their working time and hence their income, but may be forced to work part-time to balance their family life with their job or simply for lack of available full-time employment. This is confirmed by younger employees’ relative preferences for working hours, since at a given wage rate more among them would prefer to work longer hours than older workers. Younger employees would also prefer more often an increase in wages rather than a reduction in their working hours if they had to decide in the next bargaining wage round (table 4.2, col. c). These results indicate that younger employees consider income more important than leisure time. In contrast, older employees appear to have a stronger preference for a reduction in their working hours.
Table 4.1: Contractual, actual and preferred hours of work per week Question 1a,1b/consumer; differentiated by region, sex and age groups; in %
Percentage of employees with a working time of
(a) 35 to 40 hours per week, according to their …
(b) up to 29 hours per week, according to their…
(a1) working contract
(a2) hours actually
worked
(a3) their
preference
(b1) working contract
(b2) hours actually
worked
(b3) their
preference EU15
Total 67 50 48 18 18 21
14-29 (male) 80 56 52 7 7 11
50-99 (male) 75 53 59 7 7 12
14-29 (female) 64 52 44 23 22 23
50-99 (female) 50 39 37 39 35 42 EU10
Total 70 50 42 7 6 26
14-29 (male) 66 45 38 6 3 26
50-99 (male) 67 41 50 6 6 22
14-29 (female) 74 57 45 6 5 25
50-99 (female) 66 53 34 12 10 30
Source: Ad hoc labour market survey EU 2004, own calculations.
In the EU10, about 26% of the employees would prefer to work part-time. Among the full-time employed, only 7% would be willing to change to part-time. There are only small age and gender-specific differences. Among the part-time employed, younger part-time employees are much more interested than older part-time workers in working full-time. This result is similar to that in the EU15, again suggesting that younger employees often have to accept part-time work for lack of available full-time jobs. In contrast to the EU15, there are hardly any age effects with regard to preferences for changing the working time or the choice between higher income versus lower working hours.
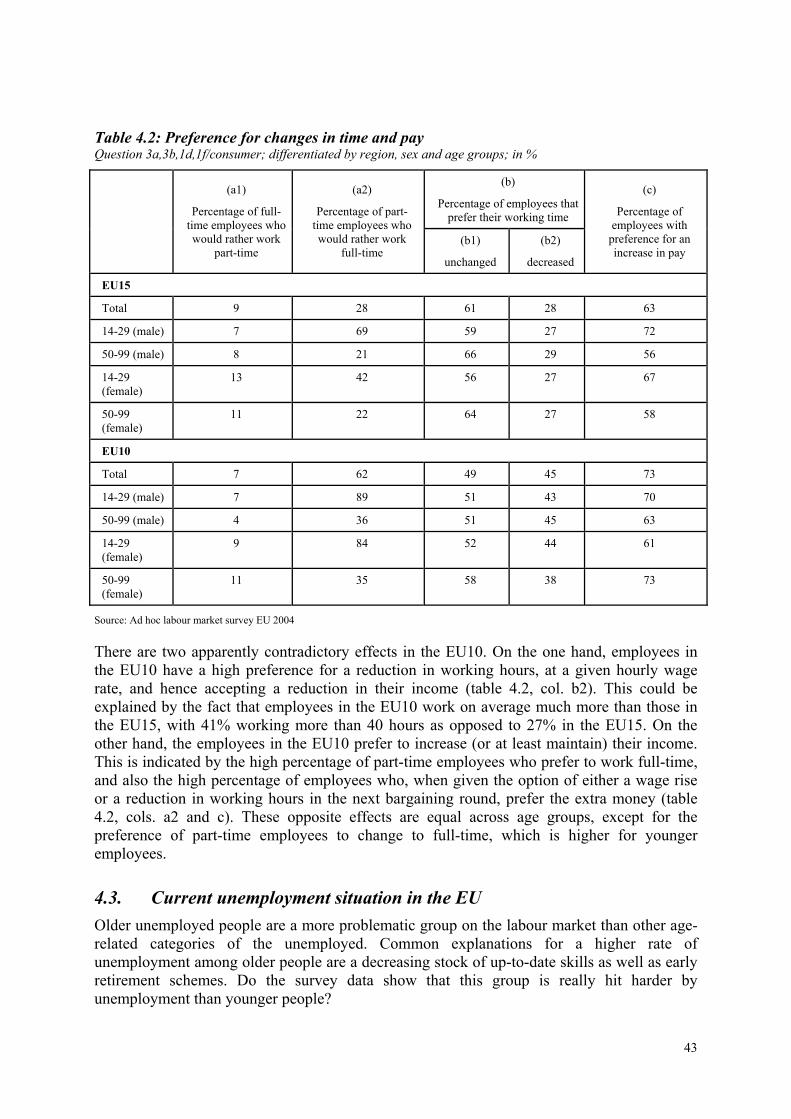
43
Table 4.2: Preference for changes in time and pay Question 3a,3b,1d,1f/consumer; differentiated by region, sex and age groups; in %
(b)
Percentage of employees that prefer their working time
(a1)
Percentage of full-time employees who would rather work
part-time
(a2)
Percentage of part- time employees who would rather work
full-time (b1)
unchanged
(b2)
decreased
(c)
Percentage of employees with
preference for an increase in pay
EU15
Total 9 28 61 28 63
14-29 (male) 7 69 59 27 72
50-99 (male) 8 21 66 29 56
14-29 (female)
13 42 56 27 67
50-99 (female)
11 22 64 27 58
EU10
Total 7 62 49 45 73
14-29 (male) 7 89 51 43 70
50-99 (male) 4 36 51 45 63
14-29 (female)
9 84 52 44 61
50-99 (female)
11 35 58 38 73
Source: Ad hoc labour market survey EU 2004
There are two apparently contradictory effects in the EU10. On the one hand, employees in the EU10 have a high preference for a reduction in working hours, at a given hourly wage rate, and hence accepting a reduction in their income (table 4.2, col. b2). This could be explained by the fact that employees in the EU10 work on average much more than those in the EU15, with 41% working more than 40 hours as opposed to 27% in the EU15. On the other hand, the employees in the EU10 prefer to increase (or at least maintain) their income. This is indicated by the high percentage of part-time employees who prefer to work full-time, and also the high percentage of employees who, when given the option of either a wage rise or a reduction in working hours in the next bargaining round, prefer the extra money (table 4.2, cols. a2 and c). These opposite effects are equal across age groups, except for the preference of part-time employees to change to full-time, which is higher for younger employees.
4.3. Current unemployment situation in the EU Older unemployed people are a more problematic group on the labour market than other age-related categories of the unemployed. Common explanations for a higher rate of unemployment among older people are a decreasing stock of up-to-date skills as well as early retirement schemes. Do the survey data show that this group is really hit harder by unemployment than younger people?
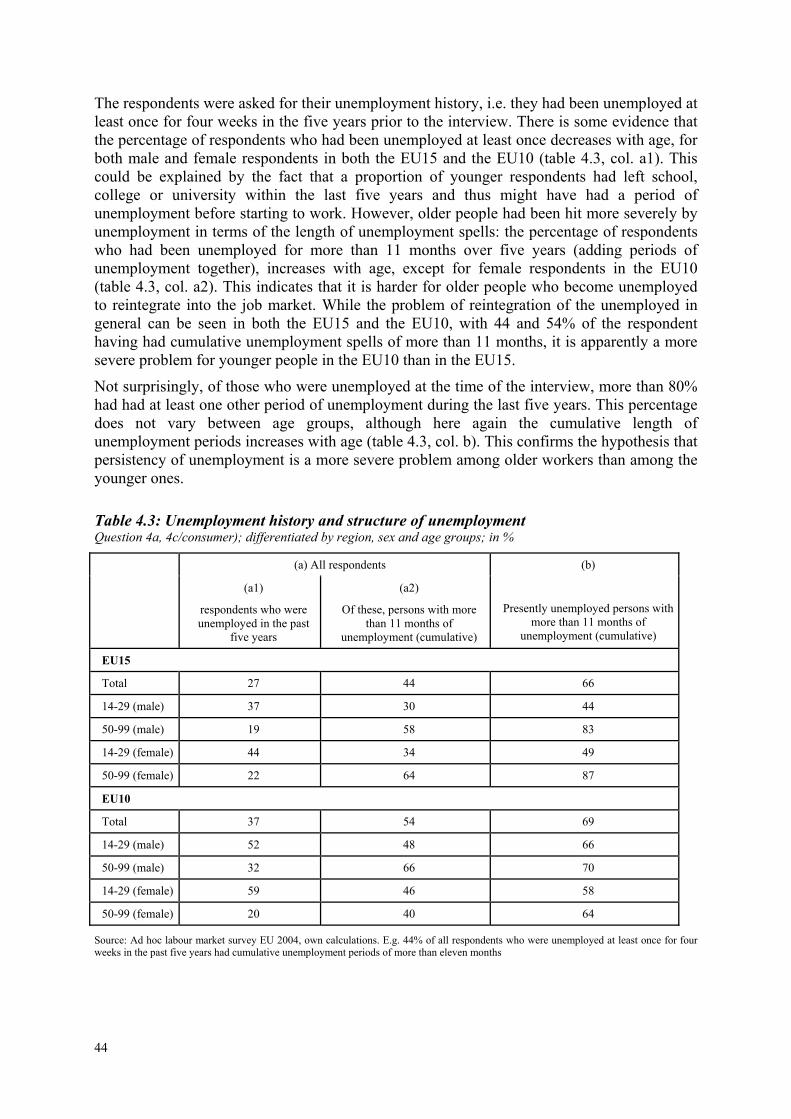
44
The respondents were asked for their unemployment history, i.e. they had been unemployed at least once for four weeks in the five years prior to the interview. There is some evidence that the percentage of respondents who had been unemployed at least once decreases with age, for both male and female respondents in both the EU15 and the EU10 (table 4.3, col. a1). This could be explained by the fact that a proportion of younger respondents had left school, college or university within the last five years and thus might have had a period of unemployment before starting to work. However, older people had been hit more severely by unemployment in terms of the length of unemployment spells: the percentage of respondents who had been unemployed for more than 11 months over five years (adding periods of unemployment together), increases with age, except for female respondents in the EU10 (table 4.3, col. a2). This indicates that it is harder for older people who become unemployed to reintegrate into the job market. While the problem of reintegration of the unemployed in general can be seen in both the EU15 and the EU10, with 44 and 54% of the respondent having had cumulative unemployment spells of more than 11 months, it is apparently a more severe problem for younger people in the EU10 than in the EU15.
Not surprisingly, of those who were unemployed at the time of the interview, more than 80% had had at least one other period of unemployment during the last five years. This percentage does not vary between age groups, although here again the cumulative length of unemployment periods increases with age (table 4.3, col. b). This confirms the hypothesis that persistency of unemployment is a more severe problem among older workers than among the younger ones.
Table 4.3: Unemployment history and structure of unemployment Question 4a, 4c/consumer); differentiated by region, sex and age groups; in %
(a) All respondents
(a1)
respondents who were unemployed in the past
five years
(a2)
Of these, persons with more than 11 months of
unemployment (cumulative)
(b)
Presently unemployed persons with more than 11 months of
unemployment (cumulative)
EU15
Total 27 44 66
14-29 (male) 37 30 44
50-99 (male) 19 58 83
14-29 (female) 44 34 49
50-99 (female) 22 64 87
EU10
Total 37 54 69
14-29 (male) 52 48 66
50-99 (male) 32 66 70
14-29 (female) 59 46 58
50-99 (female) 20 40 64
Source: Ad hoc labour market survey EU 2004, own calculations. E.g. 44% of all respondents who were unemployed at least once for four weeks in the past five years had cumulative unemployment periods of more than eleven months
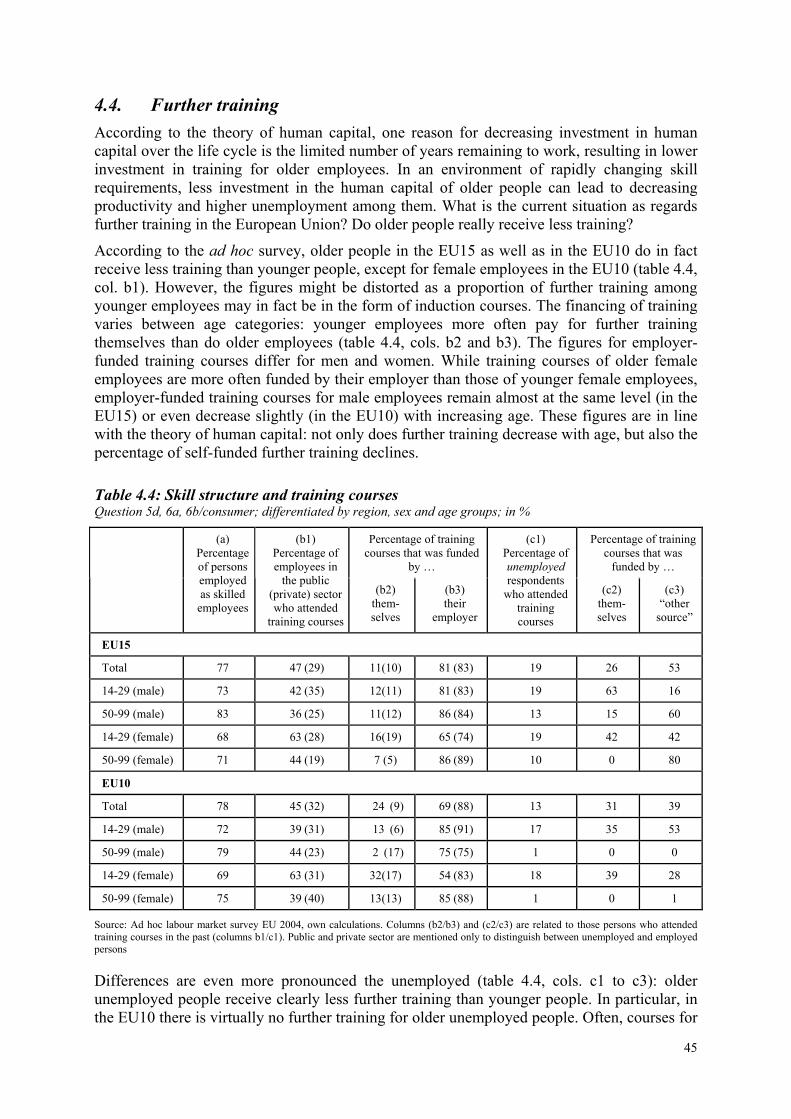
45
4.4. Further training According to the theory of human capital, one reason for decreasing investment in human capital over the life cycle is the limited number of years remaining to work, resulting in lower investment in training for older employees. In an environment of rapidly changing skill requirements, less investment in the human capital of older people can lead to decreasing productivity and higher unemployment among them. What is the current situation as regards further training in the European Union? Do older people really receive less training?
According to the ad hoc survey, older people in the EU15 as well as in the EU10 do in fact receive less training than younger people, except for female employees in the EU10 (table 4.4, col. b1). However, the figures might be distorted as a proportion of further training among younger employees may in fact be in the form of induction courses. The financing of training varies between age categories: younger employees more often pay for further training themselves than do older employees (table 4.4, cols. b2 and b3). The figures for employer-funded training courses differ for men and women. While training courses of older female employees are more often funded by their employer than those of younger female employees, employer-funded training courses for male employees remain almost at the same level (in the EU15) or even decrease slightly (in the EU10) with increasing age. These figures are in line with the theory of human capital: not only does further training decrease with age, but also the percentage of self-funded further training declines.
Table 4.4: Skill structure and training courses Question 5d, 6a, 6b/consumer; differentiated by region, sex and age groups; in %
Percentage of training courses that was funded
by …
Percentage of training courses that was
funded by …
(a) Percentage of persons employed as skilled
employees
(b1) Percentage of employees in
the public (private) sector who attended
training courses
(b2) them-selves
(b3) their
employer
(c1) Percentage of unemployed respondents
who attended training courses
(c2) them-selves
(c3) “other
source”
EU15
Total 77 47 (29) 11(10) 81 (83) 19 26 53
14-29 (male) 73 42 (35) 12(11) 81 (83) 19 63 16
50-99 (male) 83 36 (25) 11(12) 86 (84) 13 15 60
14-29 (female) 68 63 (28) 16(19) 65 (74) 19 42 42
50-99 (female) 71 44 (19) 7 (5) 86 (89) 10 0 80
EU10
Total 78 45 (32) 24 (9) 69 (88) 13 31 39
14-29 (male) 72 39 (31) 13 (6) 85 (91) 17 35 53
50-99 (male) 79 44 (23) 2 (17) 75 (75) 1 0 0
14-29 (female) 69 63 (31) 32(17) 54 (83) 18 39 28
50-99 (female) 75 39 (40) 13(13) 85 (88) 1 0 1
Source: Ad hoc labour market survey EU 2004, own calculations. Columns (b2/b3) and (c2/c3) are related to those persons who attended training courses in the past (columns b1/c1). Public and private sector are mentioned only to distinguish between unemployed and employed persons
Differences are even more pronounced the unemployed (table 4.4, cols. c1 to c3): older unemployed people receive clearly less further training than younger people. In particular, in the EU10 there is virtually no further training for older unemployed people. Often, courses for
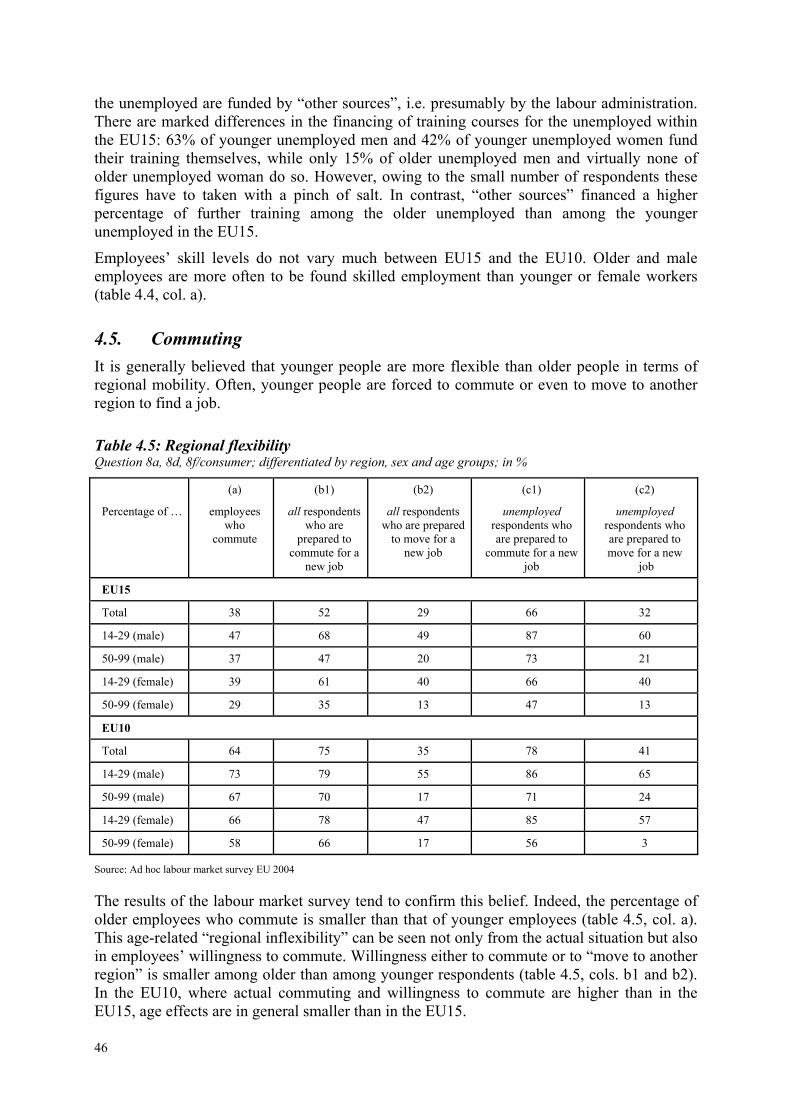
46
the unemployed are funded by “other sources”, i.e. presumably by the labour administration. There are marked differences in the financing of training courses for the unemployed within the EU15: 63% of younger unemployed men and 42% of younger unemployed women fund their training themselves, while only 15% of older unemployed men and virtually none of older unemployed woman do so. However, owing to the small number of respondents these figures have to taken with a pinch of salt. In contrast, “other sources” financed a higher percentage of further training among the older unemployed than among the younger unemployed in the EU15.
Employees’ skill levels do not vary much between EU15 and the EU10. Older and male employees are more often to be found skilled employment than younger or female workers (table 4.4, col. a).
4.5. Commuting It is generally believed that younger people are more flexible than older people in terms of regional mobility. Often, younger people are forced to commute or even to move to another region to find a job.
Table 4.5: Regional flexibility Question 8a, 8d, 8f/consumer; differentiated by region, sex and age groups; in %
Percentage of …
(a)
employees who
commute
(b1)
all respondents who are
prepared to commute for a
new job
(b2)
all respondents who are prepared
to move for a new job
(c1)
unemployed respondents who are prepared to
commute for a new job
(c2)
unemployed respondents who are prepared to move for a new
job
EU15
Total 38 52 29 66 32
14-29 (male) 47 68 49 87 60
50-99 (male) 37 47 20 73 21
14-29 (female) 39 61 40 66 40
50-99 (female) 29 35 13 47 13
EU10
Total 64 75 35 78 41
14-29 (male) 73 79 55 86 65
50-99 (male) 67 70 17 71 24
14-29 (female) 66 78 47 85 57
50-99 (female) 58 66 17 56 3
Source: Ad hoc labour market survey EU 2004
The results of the labour market survey tend to confirm this belief. Indeed, the percentage of older employees who commute is smaller than that of younger employees (table 4.5, col. a). This age-related “regional inflexibility” can be seen not only from the actual situation but also in employees’ willingness to commute. Willingness either to commute or to “move to another region” is smaller among older than among younger respondents (table 4.5, cols. b1 and b2). In the EU10, where actual commuting and willingness to commute are higher than in the EU15, age effects are in general smaller than in the EU15.
47
One might expect that the unemployed would be more willing to commute, and maybe even to relocate, as their need for a job, wherever it might be, is presumably higher than that of the employed. But, interestingly, the unemployed of all age categories and both sexes in the EU15 are actually less willing to commute and equally willing to move, respectively, than the employed. In contrast to these results, the unemployed in the EU10 seem in general to be more prepared to commute for a new job.
4.6. Conclusions Concerning the employment structure with respect to age groups, there are two important points worth mentioning: young employees in both EU15 and EU10 prefer to work longer or to change from part-time to full-time work. This could be explained by the fact, that younger employees are in favour of a higher income or that they are simply more often faced with enforced part-time work. In contrast, older employees are in favour of more leisure time instead of higher income.
According to employment, two conclusions can be drawn. First, younger employees seem to be hit by unemployment more often compared to older employees. But, as mentioned above, this could be due to an unemployment period after leaving university, school, etc. In contrast, older people are hit by unemployment harder, i.e. they are faced with (cumulative) longer periods of unemployment. These problems of reintegration into work can also be seen among younger unemployed people in the EU10.
There are only small differences between EU15 and EU10 regarding further training: older employees seem to receive less training compared to younger employees, whereas the figures could be biased due to inductionary courses for young employees. It is an interesting, that younger people are more often financing their training on their own, e.g. to increase their chances on the labour market. This can not only be seen among employees, but also among unemployed persons.
Regarding commuting and the willingness to commute for a new job, there are only small age effects in the EU10, while older employees in the EU15 are less commuting and are less willing to commute for a new job. In contrast, there is an aversion for older people to move for a new job in both, EU15 and EU10.
48
5. The European labour market in 2004: Conclusions
The 2004 ad hoc labour market survey was carried out shortly after the enlargement of the European Union in May 2004. The results therefore provide a useful at-a-glance overview of potential problems for growth and employment creation in the EU25.
One of the main findings of the previous ad hoc labour market surveys remains valid: despite the general improvement in the EU’s labour market performance, there are still large differences between individual countries. And there are differences in some fields between the pre-enlargement EU Member States and the recently acceded Member States. One explanation for these differences may be that the predominance of former socialist countries with centrally planned economies among new member states determines the results of the whole group.
With respect to more flexible models of working time in the EU in 2004, the following results were found: a working week of between 35 and 40 hours, distributed more or less evenly over the five working days, is the rule for the majority of employees. Part-time work is still dominated by women. Overtime is relatively common for most of the full-time employed. When asked if they would be prepared to accept more flexible working time, the interviewees do not favour all possible types of flexibility to the same extent. The most favoured model is either lengthening or shortening the regular working day. Shift work, night work and weekend work is not highly favoured. The same is true for the proposal to work whenever required. As to compensation, money rather than extra leisure time is preferred. This preference is fairly clear-cut, especially in the recently acceded Member States. In these countries people work longer hours and they are more flexible with respect to how far they have to travel and the hours they have to work in order to keep their job.
The proportion of interviewees who had been unemployed for at least four weeks during the last five years declined, from 30% in 1999 to 27% in 2004. Nevertheless, unemployment remains a very serious problem in the EU. Young people aged 14 to 29 years in the EU10 reveal a clearly above average rate of temporary unemployment: 51% of young men and as many as 59% of young women had been unemployed for at least four weeks. Most of them were unemployed only once. But a high proportion of young men in the EU15 and of young women in the EU10 has been hit by unemployment for several times. The survey results show that youth unemployment is one of the EU’s most serious challenges.
The number of full-time employees in EU15 industrial firms declined slightly from 95% in 1999 to 93% in 2004 and the proportion of full-time employees in the retail trade sector increased from 63% to 64%. The individual Member States also experienced only minor changes. The number of full-time employees in the service sector in the EU15 declined from 83% to 75% between 1999 and 2004.
In both the 1999 and 2004 surveys, roughly three quarters of enterprises in industry were satisfied with their staffing levels. In the “intermediate products” and “investment goods industry” subsectors, more employers now judge their current situation as satisfactory than in the previous survey. But in the consumer goods industry the rate of satisfaction declined by ten percentage points, to 73%. 34% of retail trade firms in the EU15 plan to increase their employment, up from 28% in 1999. But the trends are very different in the individual Member States. In the service sector the percentage of firms which answered that they were satisfied with their staffing situation increased from 69% in 1999 to 79% in 2004.
Average weekly operating hours in industry increased in the EU15 from 71 in 1999 to 82 hours in 2004. Weekly operating hours in the retail trade sector did not change a great deal, having increased by just one hour to 57 hours per week currently. But it should be mentioned

49
that the proportion of firms with less than 45 operating hours and those with more than 76 operating hours increased by eight percentage points from 25% of firms with less than 45 hours to 33 and from 9% of firms with more than 76 hours to 17%.