Embed Size (px)
Citation preview
INSTITUTIONAL EQUITY RESEARCH
Page | 1 | PHILLIPCAPITAL INDIA RESEARCH
Bajaj Electricals (BJE IN) TOC and RREP are coming into play – rerating soon INDIA | MIDCAP ‐ ELECTRICALS | Company Update
11 May 2017
Why read this report? → Bajaj Electricals (BJE) is on the cusp of a rerating → Our channel checks suggest that implementation of TOC (Theory of Constraints, started
two years ago) and RREP (Range and Reach Expansion Program, began a year ago) have started yielding rapid results now.
→ Increasing touch points and product mix under RREP is resulting in improving revenue visibility and margin improvement.
→ Tight control on working capital and channel financing under TOC is resulting in lower working capital needs. BJE’s WC days to fall to 53 by FY19; will lead FCF of Rs 6bn over FY17‐19 – highest in the last seven years.
→ RoE/RoCE improving to 19%/25% by FY19 from 13%/17% in FY16.
What BJE did over the last few years: Its TOC and RREP implementation involved increasing touch points and counters, improving inventory and stocking management, product reach, and increasing SKUs, and reducing working capital needs. It also set out to recreate its brand to ride a revival in the consumer segment – plans to increase its advertising spend to 2.5% of sales by FY19 vs. 1.9% in FY16. In E&P, it became more selective about projects, and increased execution. It also improved margins and reduced WC through lower inventory.
The results of the changes (PC estimates): Consumer Durables (CD, 70% of sales) will start showing growth (10%/13% in FY18/19) based on growing touch points and product reach. E&P (30% of sales) is out from slow‐moving projects and is seeing better execution and project selection; should see 8%/10% growth in FY18/19, backed by healthy order book (Rs 18.5bn in FY17). Margins will improve by 145bps over the next two years (majorly driven by CD) and profits will double (30% CAGR in FY17‐19). Improvement in business mix will ease working capital requirements to 53 days from 75 days in FY16. Free cash will help pay off debt in 3‐4 years. RoE/ROCE will improve dramatically. How is TOC helping: At the beginning of implementation, BJE lost market share in CD, but has now applied TOC in most of its markets. This helped it to increase touch points (retail counters), which resulted in more visibility and availability of its products. We expect this visibility to aid BJE in recovering its market share and in sales picking up from FY18.
Outlook and valuation Historically, BJE has traded at a significant discount to its peers, and rightly so, due to lower margins in CD and value destruction in E&P due to losses. However, over the next two years, we expect the valuation gap between BJE and its peers to narrow as: (1) TOC yields results, (2) BJE focuses on leveraging distribution network through geographical and product expansion, (3) there is strong revenue visibility, with levers for margin expansion, (4) working capital could improve because of TOC and as BJE adopts channel financing, resulting in an FCF generation of Rs 6bn over FY17‐19 (highest in the last seven years), and (5) improving return ratios. Consequently, we have revised our FY18/19 earnings estimates by 4%/6%.
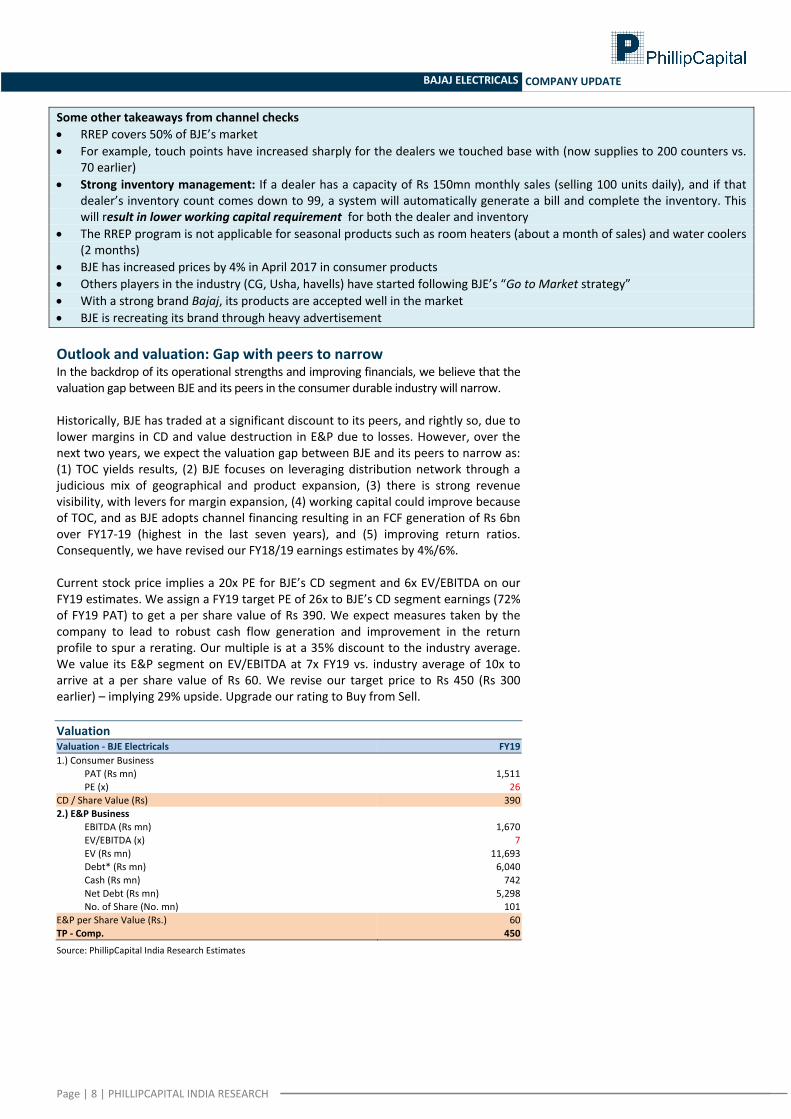
Current stock price implies a 20x PE for BJE’s CD segment and 6x EV/EBITDA on our FY19 estimates. We assign a FY19 target PE of 26x to BJE’s CD segment earnings (72% of FY19 PAT) to get a per share value of Rs 390. We expect measures taken by the company to lead to robust cash flow generation; improvement in the return profile will spur a rerating. Our multiple is at a 35% discount to the industry average. We value its E&P segment on EV/EBITDA at 7x FY19 vs. industry average of 10x to arrive at a per share value of Rs 60. We revise our target price (SOTP) to Rs 450 (Rs 300 earlier) – implying 29% upside. Upgrade our rating to Buy from Sell.
BUY (Upgrade) CMP RS 350 TARGET RS 450 (+29%) COMPANY DATA O/S SHARES (MN) : 101MARKET CAP (RSBN) : 36MARKET CAP (USDBN) : 0.652 – W7K HI/LO (RS) : 388 / 203LIQUIDITY 3M (USDMN) : 2.8PAR VALUE (RS) : 10 SHARE HOLDING PATTERN, % Mar 17 Dec 16 Sep 16PROMOTERS : 63.4 63.4 63.5FII / NRI : 7.6 7.6 7.9FI / MF : 6.8 7.7 7.7NON PRO : 7.4 5.6 5.6PUBLIC & OTHERS : 14.8 15.6 15.3 PRICE PERFORMANCE, %
1MTH 3MTH 1YRABS 1.3 30.0 51.5REL TO BSE ‐1.0 23.2 34.1 PRICE VS. SENSEX
Source: Phillip Capital India Research KEY FINANCIALS Rs mn FY17E FY18E FY19ENet Sales 44,663 48,824 54,688EBIDTA 2,719 3,366 4,121Net Profit 1,108 1,588 2,105EPS, Rs 11.0 15.7 20.8PER, x 31.9 22.2 16.8EV/EBIDTA, x 14.2 11.5 9.3P/BV, x 4.3 3.8 3.3ROE, % 13.4 17.0 19.4Debt/Equity (%) 0.9 0.7 0.5
Source: PhillipCapital India Research Est. Deepak Agarwal (+ 9122 6246 4112) [email protected]
6080
100120140160180200
Apr‐16 Sep‐16 Feb‐17
Bajaj Elec BSE Sensex
Page | 2 | PHILLIPCAPITAL INDIA RESEARCH
BAJAJ ELECTRICALS COMPANY UPDATE
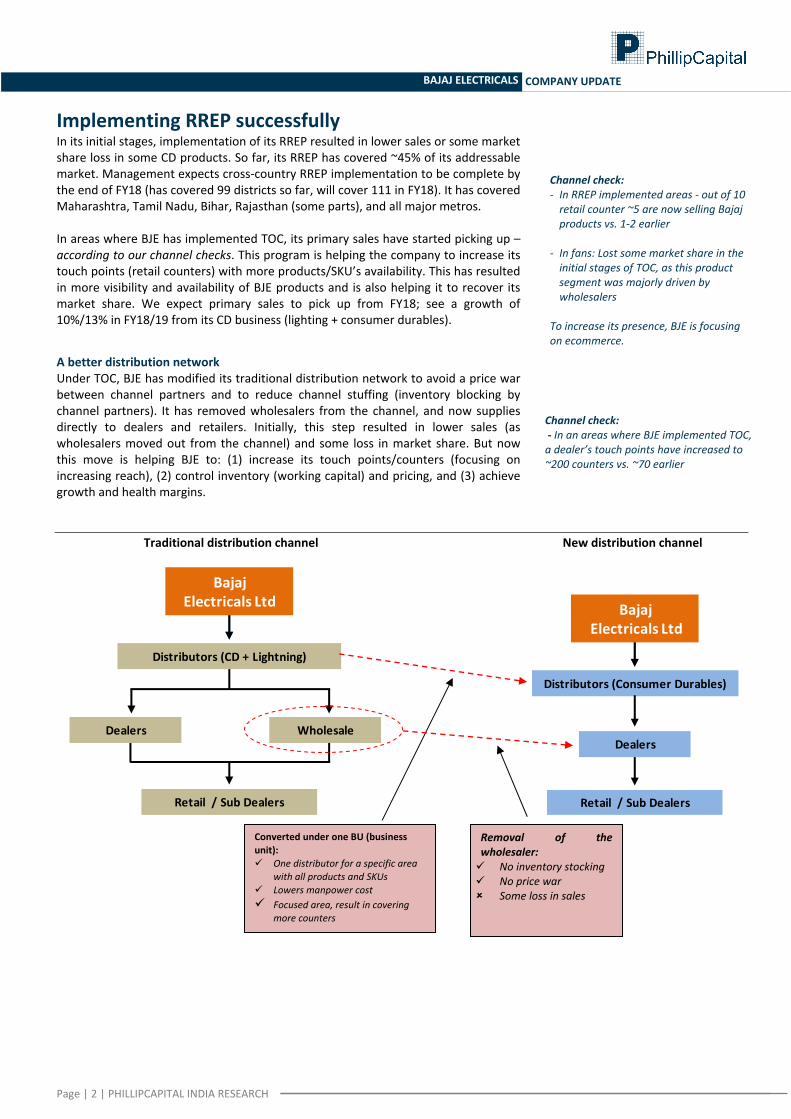
Implementing RREP successfully In its initial stages, implementation of its RREP resulted in lower sales or some market share loss in some CD products. So far, its RREP has covered ~45% of its addressable market. Management expects cross‐country RREP implementation to be complete by the end of FY18 (has covered 99 districts so far, will cover 111 in FY18). It has covered Maharashtra, Tamil Nadu, Bihar, Rajasthan (some parts), and all major metros. In areas where BJE has implemented TOC, its primary sales have started picking up – according to our channel checks. This program is helping the company to increase its touch points (retail counters) with more products/SKU’s availability. This has resulted in more visibility and availability of BJE products and is also helping it to recover its market share. We expect primary sales to pick up from FY18; see a growth of 10%/13% in FY18/19 from its CD business (lighting + consumer durables).
A better distribution network Under TOC, BJE has modified its traditional distribution network to avoid a price war between channel partners and to reduce channel stuffing (inventory blocking by channel partners). It has removed wholesalers from the channel, and now supplies directly to dealers and retailers. Initially, this step resulted in lower sales (as wholesalers moved out from the channel) and some loss in market share. But now this move is helping BJE to: (1) increase its touch points/counters (focusing on increasing reach), (2) control inventory (working capital) and pricing, and (3) achieve growth and health margins. Traditional distribution channel New distribution channel
Retail / Sub Dealers
BajajElectricals Ltd
Distributors (CD + Lightning)
Dealers Wholesale
Retail / Sub Dealers
BajajElectricals Ltd
Distributors (Consumer Durables)
Dealers
Converted under one BU (business unit):
One distributor for a specific area with all products and SKUs
Lowers manpower cost Focused area, result in covering more counters
Removal of the wholesaler: No inventory stocking No price war Some loss in sales
Channel check: ‐ In RREP implemented areas ‐ out of 10 retail counter ~5 are now selling Bajaj products vs. 1‐2 earlier
‐ In fans: Lost some market share in the initial stages of TOC, as this product segment was majorly driven by wholesalers
To increase its presence, BJE is focusing on ecommerce.
Channel check: ‐ In an areas where BJE implemented TOC, a dealer’s touch points have increased to ~200 counters vs. ~70 earlier
Page | 3 | PHILLIPCAPITAL INDIA RESEARCH
BAJAJ ELECTRICALS COMPANY UPDATE
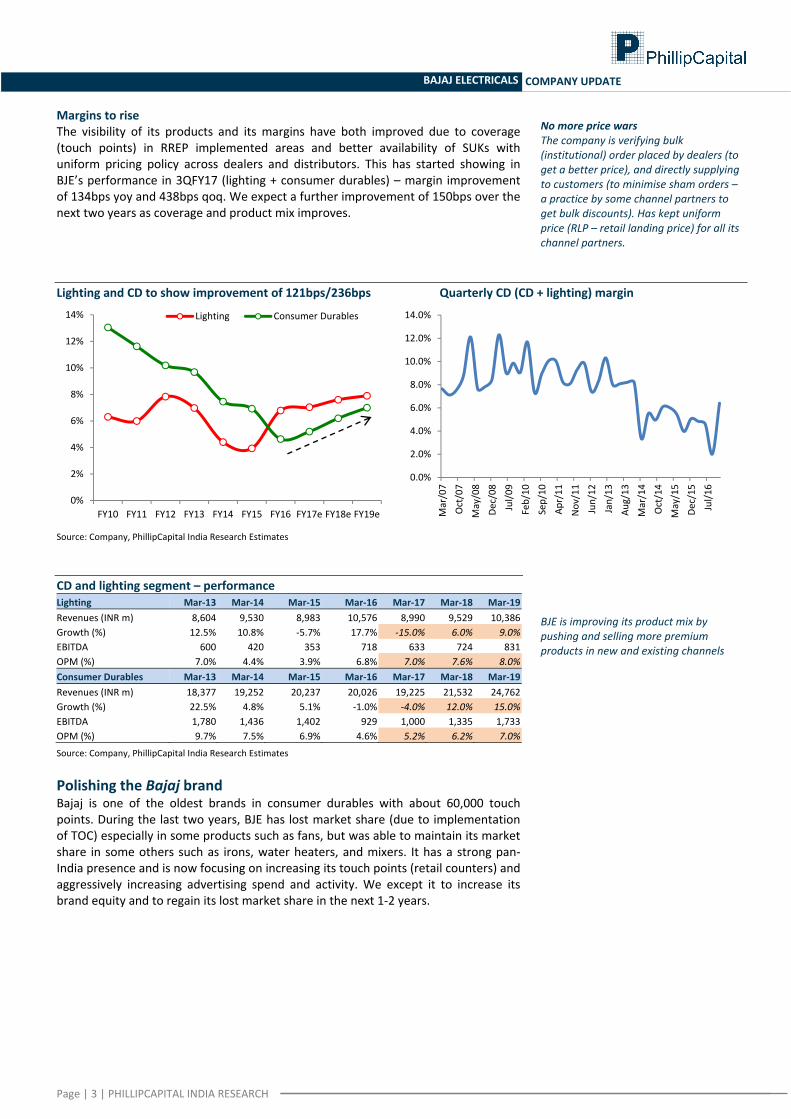
Margins to rise The visibility of its products and its margins have both improved due to coverage (touch points) in RREP implemented areas and better availability of SUKs with uniform pricing policy across dealers and distributors. This has started showing in BJE’s performance in 3QFY17 (lighting + consumer durables) – margin improvement of 134bps yoy and 438bps qoq. We expect a further improvement of 150bps over the next two years as coverage and product mix improves. Lighting and CD to show improvement of 121bps/236bps Quarterly CD (CD + lighting) margin
Source: Company, PhillipCapital India Research Estimates CD and lighting segment – performance Lighting Mar‐13 Mar‐14 Mar‐15 Mar‐16 Mar‐17 Mar‐18 Mar‐19Revenues (INR m) 8,604 9,530 8,983 10,576 8,990 9,529 10,386Growth (%) 12.5% 10.8% ‐5.7% 17.7% ‐15.0% 6.0% 9.0%EBITDA 600 420 353 718 633 724 831OPM (%) 7.0% 4.4% 3.9% 6.8% 7.0% 7.6% 8.0%Consumer Durables Mar‐13 Mar‐14 Mar‐15 Mar‐16 Mar‐17 Mar‐18 Mar‐19Revenues (INR m) 18,377 19,252 20,237 20,026 19,225 21,532 24,762Growth (%) 22.5% 4.8% 5.1% ‐1.0% ‐4.0% 12.0% 15.0%EBITDA 1,780 1,436 1,402 929 1,000 1,335 1,733OPM (%) 9.7% 7.5% 6.9% 4.6% 5.2% 6.2% 7.0%
Source: Company, PhillipCapital India Research Estimates Polishing the Bajaj brand Bajaj is one of the oldest brands in consumer durables with about 60,000 touch points. During the last two years, BJE has lost market share (due to implementation of TOC) especially in some products such as fans, but was able to maintain its market share in some others such as irons, water heaters, and mixers. It has a strong pan‐India presence and is now focusing on increasing its touch points (retail counters) and aggressively increasing advertising spend and activity. We except it to increase its brand equity and to regain its lost market share in the next 1‐2 years.
0%
2%
4%
6%
8%
10%
12%
14%
FY10 FY11 FY12 FY13 FY14 FY15 FY16 FY17e FY18e FY19e
Lighting Consumer Durables
0.0%
2.0%
4.0%
6.0%
8.0%
10.0%
12.0%
14.0%
Mar/07
Oct/07
May/08
Dec/08
Jul/0
9
Feb/10
Sep/10
Apr/11
Nov/11
Jun/12
Jan/13
Aug/13
Mar/14
Oct/14
May/15
Dec/15
Jul/1
6
No more price wars The company is verifying bulk (institutional) order placed by dealers (to get a better price), and directly supplying to customers (to minimise sham orders – a practice by some channel partners to get bulk discounts). Has kept uniform price (RLP – retail landing price) for all its channel partners.
BJE is improving its product mix by pushing and selling more premium products in new and existing channels
Page | 4 | PHILLIPCAPITAL INDIA RESEARCH
BAJAJ ELECTRICALS COMPANY UPDATE
Advertisement spends to increase to 2.5%
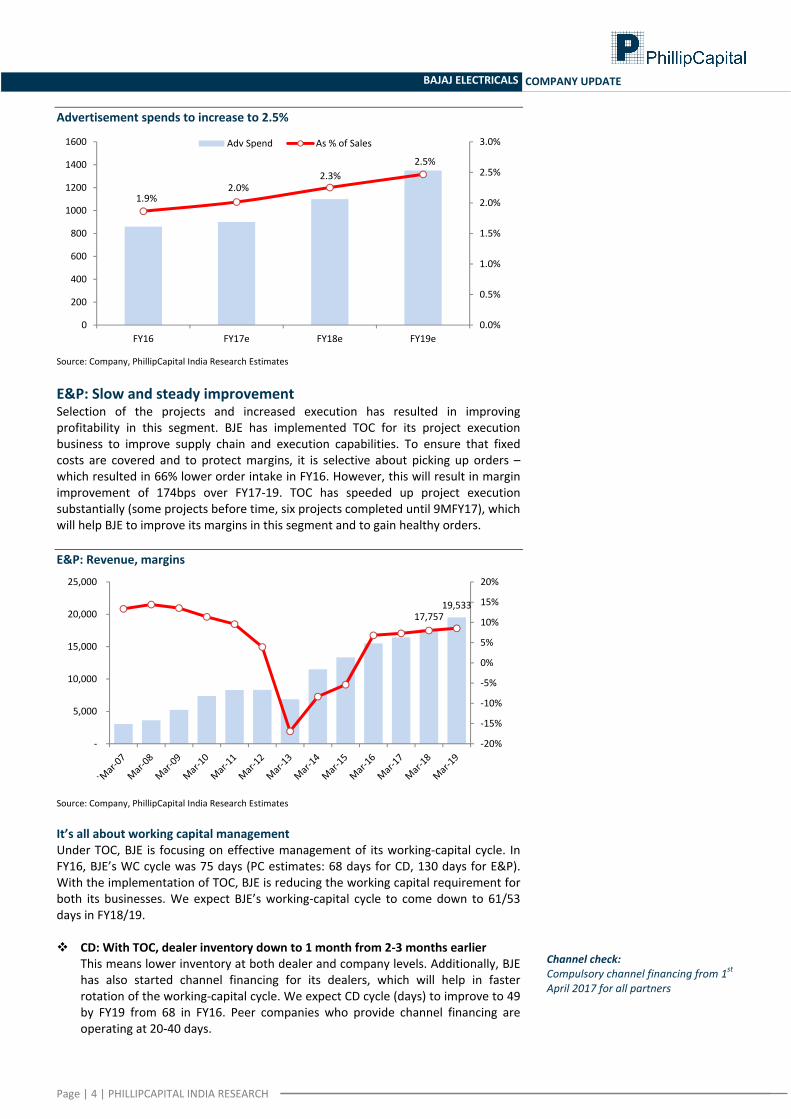
Source: Company, PhillipCapital India Research Estimates E&P: Slow and steady improvement Selection of the projects and increased execution has resulted in improving profitability in this segment. BJE has implemented TOC for its project execution business to improve supply chain and execution capabilities. To ensure that fixed costs are covered and to protect margins, it is selective about picking up orders – which resulted in 66% lower order intake in FY16. However, this will result in margin improvement of 174bps over FY17‐19. TOC has speeded up project execution substantially (some projects before time, six projects completed until 9MFY17), which will help BJE to improve its margins in this segment and to gain healthy orders. E&P: Revenue, margins
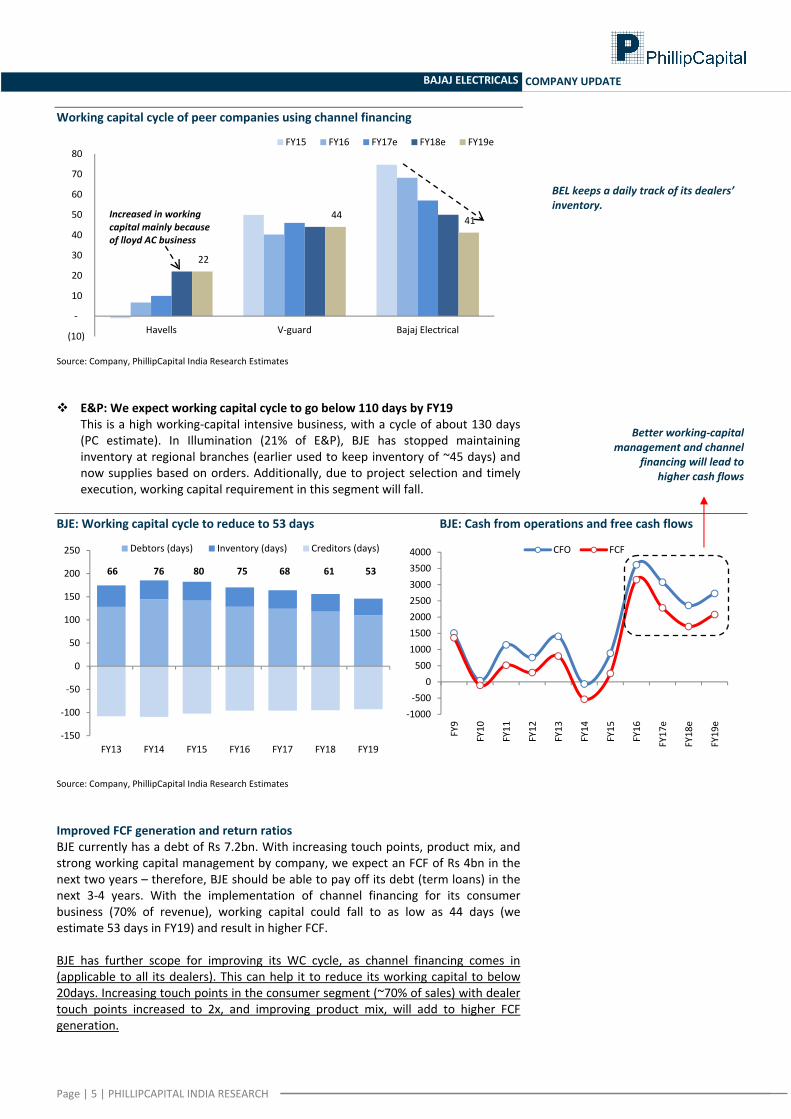
Source: Company, PhillipCapital India Research Estimates It’s all about working capital management Under TOC, BJE is focusing on effective management of its working‐capital cycle. In FY16, BJE’s WC cycle was 75 days (PC estimates: 68 days for CD, 130 days for E&P). With the implementation of TOC, BJE is reducing the working capital requirement for both its businesses. We expect BJE’s working‐capital cycle to come down to 61/53 days in FY18/19.
CD: With TOC, dealer inventory down to 1 month from 2‐3 months earlier This means lower inventory at both dealer and company levels. Additionally, BJE has also started channel financing for its dealers, which will help in faster rotation of the working‐capital cycle. We expect CD cycle (days) to improve to 49 by FY19 from 68 in FY16. Peer companies who provide channel financing are operating at 20‐40 days.
1.9%2.0%
2.3%2.5%
0.0%
0.5%
1.0%
1.5%
2.0%
2.5%
3.0%
0
200
400
600
800
1000
1200
1400
1600
FY16 FY17e FY18e FY19e
Adv Spend As % of Sales
17,757 19,533
‐20%
‐15%
‐10%
‐5%
0%
5%
10%
15%
20%
‐
5,000
10,000
15,000
20,000
25,000
Channel check: Compulsory channel financing from 1st April 2017 for all partners
Page | 5 | PHILLIPCAPITAL INDIA RESEARCH
BAJAJ ELECTRICALS COMPANY UPDATE
Working capital cycle of peer companies using channel financing
Source: Company, PhillipCapital India Research Estimates
E&P: We expect working capital cycle to go below 110 days by FY19 This is a high working‐capital intensive business, with a cycle of about 130 days (PC estimate). In Illumination (21% of E&P), BJE has stopped maintaining inventory at regional branches (earlier used to keep inventory of ~45 days) and now supplies based on orders. Additionally, due to project selection and timely execution, working capital requirement in this segment will fall.
BJE: Working capital cycle to reduce to 53 days BJE: Cash from operations and free cash flows
Source: Company, PhillipCapital India Research Estimates Improved FCF generation and return ratios BJE currently has a debt of Rs 7.2bn. With increasing touch points, product mix, and strong working capital management by company, we expect an FCF of Rs 4bn in the next two years – therefore, BJE should be able to pay off its debt (term loans) in the next 3‐4 years. With the implementation of channel financing for its consumer business (70% of revenue), working capital could fall to as low as 44 days (we estimate 53 days in FY19) and result in higher FCF. BJE has further scope for improving its WC cycle, as channel financing comes in (applicable to all its dealers). This can help it to reduce its working capital to below 20days. Increasing touch points in the consumer segment (~70% of sales) with dealer touch points increased to 2x, and improving product mix, will add to higher FCF generation.
22
44 41
(10)
‐
10
20
30
40
50
60
70
80
Havells V‐guard Bajaj Electrical
FY15 FY16 FY17e FY18e FY19e
Increased in working capital mainly because of lloyd AC business
‐150
‐100
‐50
0
50
100
150
200
250
FY13 FY14 FY15 FY16 FY17 FY18 FY19
Debtors (days) Inventory (days) Creditors (days)
66 76 80 75 68 61 53
‐1000‐500
05001000150020002500300035004000
FY9
FY10
FY11
FY12
FY13
FY14
FY15
FY16
FY17e
FY18e
FY19e
CFO FCF
BEL keeps a daily track of its dealers’ inventory.
Better working‐capitalmanagement and channel
financing will lead tohigher cash flows
Page | 6 | PHILLIPCAPITAL INDIA RESEARCH
BAJAJ ELECTRICALS COMPANY UPDATE
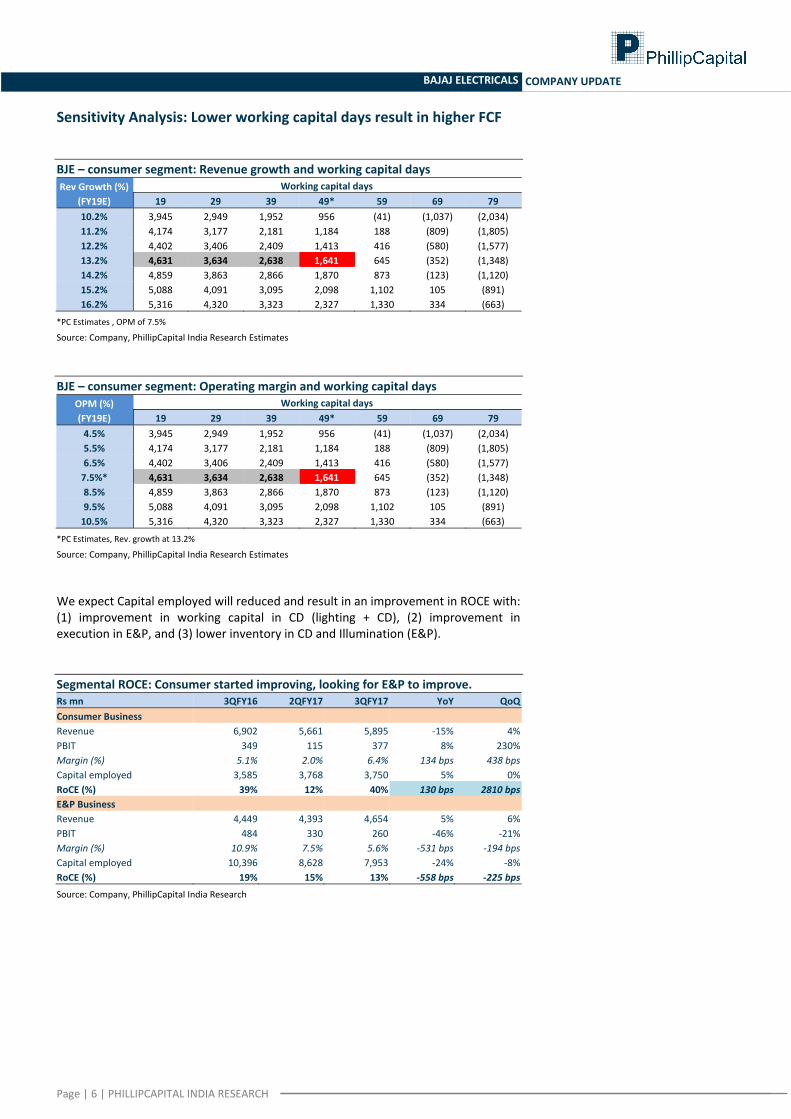
Sensitivity Analysis: Lower working capital days result in higher FCF BJE – consumer segment: Revenue growth and working capital days Rev Growth (%)
(FY19E) Working capital days
19 29 39 49* 59 69 79 10.2% 3,945 2,949 1,952 956 (41) (1,037) (2,034) 11.2% 4,174 3,177 2,181 1,184 188 (809) (1,805) 12.2% 4,402 3,406 2,409 1,413 416 (580) (1,577) 13.2% 4,631 3,634 2,638 1,641 645 (352) (1,348) 14.2% 4,859 3,863 2,866 1,870 873 (123) (1,120) 15.2% 5,088 4,091 3,095 2,098 1,102 105 (891) 16.2% 5,316 4,320 3,323 2,327 1,330 334 (663)
*PC Estimates , OPM of 7.5%
Source: Company, PhillipCapital India Research Estimates BJE – consumer segment: Operating margin and working capital days
OPM (%) (FY19E)
Working capital days 19 29 39 49* 59 69 79
4.5% 3,945 2,949 1,952 956 (41) (1,037) (2,034) 5.5% 4,174 3,177 2,181 1,184 188 (809) (1,805) 6.5% 4,402 3,406 2,409 1,413 416 (580) (1,577) 7.5%* 4,631 3,634 2,638 1,641 645 (352) (1,348) 8.5% 4,859 3,863 2,866 1,870 873 (123) (1,120) 9.5% 5,088 4,091 3,095 2,098 1,102 105 (891) 10.5% 5,316 4,320 3,323 2,327 1,330 334 (663)
*PC Estimates, Rev. growth at 13.2%
Source: Company, PhillipCapital India Research Estimates We expect Capital employed will reduced and result in an improvement in ROCE with: (1) improvement in working capital in CD (lighting + CD), (2) improvement in execution in E&P, and (3) lower inventory in CD and Illumination (E&P). Segmental ROCE: Consumer started improving, looking for E&P to improve. Rs mn 3QFY16 2QFY17 3QFY17 YoY QoQConsumer Business Revenue 6,902 5,661 5,895 ‐15% 4%PBIT 349 115 377 8% 230%Margin (%) 5.1% 2.0% 6.4% 134 bps 438 bpsCapital employed 3,585 3,768 3,750 5% 0%RoCE (%) 39% 12% 40% 130 bps 2810 bpsE&P Business Revenue 4,449 4,393 4,654 5% 6%PBIT 484 330 260 ‐46% ‐21%Margin (%) 10.9% 7.5% 5.6% ‐531 bps ‐194 bpsCapital employed 10,396 8,628 7,953 ‐24% ‐8%RoCE (%) 19% 15% 13% ‐558 bps ‐225 bps
Source: Company, PhillipCapital India Research
Page | 7 | PHILLIPCAPITAL INDIA RESEARCH
BAJAJ ELECTRICALS COMPANY UPDATE
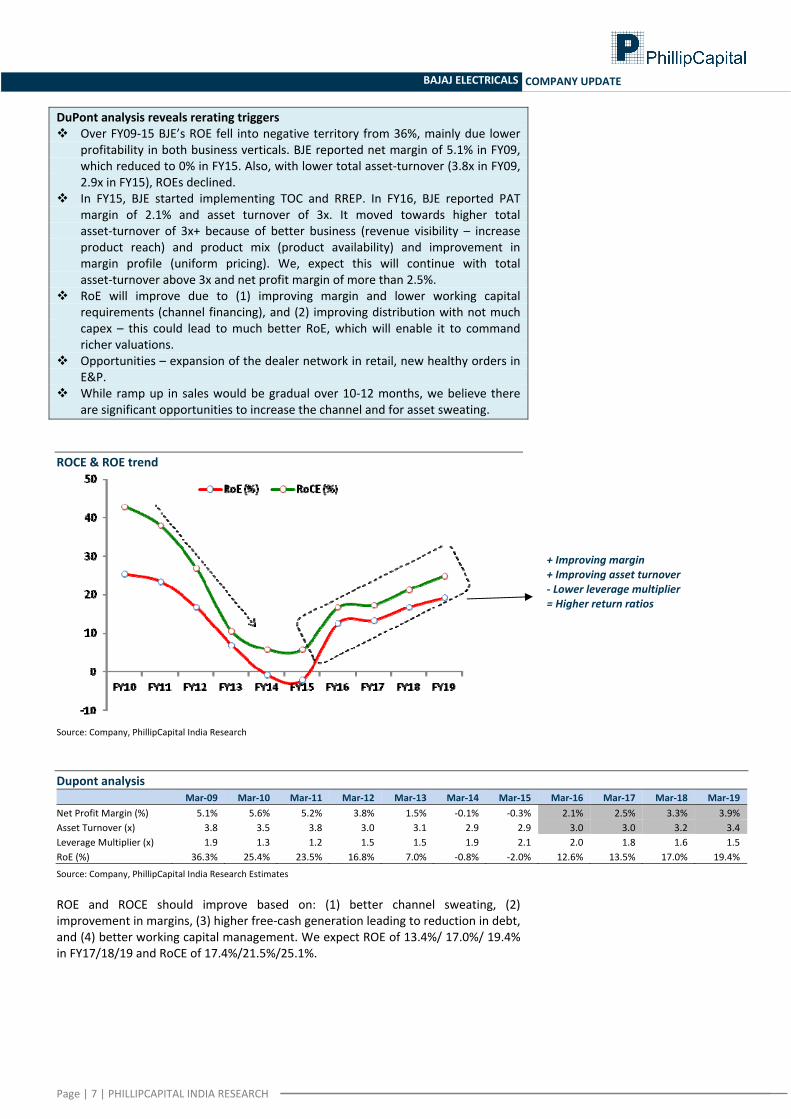
DuPont analysis reveals rerating triggers Over FY09‐15 BJE’s ROE fell into negative territory from 36%, mainly due lower profitability in both business verticals. BJE reported net margin of 5.1% in FY09, which reduced to 0% in FY15. Also, with lower total asset‐turnover (3.8x in FY09, 2.9x in FY15), ROEs declined.
In FY15, BJE started implementing TOC and RREP. In FY16, BJE reported PAT margin of 2.1% and asset turnover of 3x. It moved towards higher total asset‐turnover of 3x+ because of better business (revenue visibility – increase product reach) and product mix (product availability) and improvement in margin profile (uniform pricing). We, expect this will continue with total asset‐turnover above 3x and net profit margin of more than 2.5%.
RoE will improve due to (1) improving margin and lower working capital requirements (channel financing), and (2) improving distribution with not much capex – this could lead to much better RoE, which will enable it to command richer valuations.
Opportunities – expansion of the dealer network in retail, new healthy orders in E&P.
While ramp up in sales would be gradual over 10‐12 months, we believe there are significant opportunities to increase the channel and for asset sweating.
ROCE & ROE trend
Source: Company, PhillipCapital India Research Dupont analysis
Mar‐09 Mar‐10 Mar‐11 Mar‐12 Mar‐13 Mar‐14 Mar‐15 Mar‐16 Mar‐17 Mar‐18 Mar‐19 Net Profit Margin (%) 5.1% 5.6% 5.2% 3.8% 1.5% ‐0.1% ‐0.3% 2.1% 2.5% 3.3% 3.9% Asset Turnover (x) 3.8 3.5 3.8 3.0 3.1 2.9 2.9 3.0 3.0 3.2 3.4 Leverage Multiplier (x) 1.9 1.3 1.2 1.5 1.5 1.9 2.1 2.0 1.8 1.6 1.5 RoE (%) 36.3% 25.4% 23.5% 16.8% 7.0% ‐0.8% ‐2.0% 12.6% 13.5% 17.0% 19.4%
Source: Company, PhillipCapital India Research Estimates ROE and ROCE should improve based on: (1) better channel sweating, (2) improvement in margins, (3) higher free‐cash generation leading to reduction in debt, and (4) better working capital management. We expect ROE of 13.4%/ 17.0%/ 19.4% in FY17/18/19 and RoCE of 17.4%/21.5%/25.1%.
+ Improving margin + Improving asset turnover ‐ Lower leverage multiplier = Higher return ratios
Page | 8 | PHILLIPCAPITAL INDIA RESEARCH
BAJAJ ELECTRICALS COMPANY UPDATE
Some other takeaways from channel checks • RREP covers 50% of BJE’s market • For example, touch points have increased sharply for the dealers we touched base with (now supplies to 200 counters vs.
70 earlier) • Strong inventory management: If a dealer has a capacity of Rs 150mn monthly sales (selling 100 units daily), and if that
dealer’s inventory count comes down to 99, a system will automatically generate a bill and complete the inventory. This will result in lower working capital requirement for both the dealer and inventory
• The RREP program is not applicable for seasonal products such as room heaters (about a month of sales) and water coolers (2 months)
• BJE has increased prices by 4% in April 2017 in consumer products • Others players in the industry (CG, Usha, havells) have started following BJE’s “Go to Market strategy” • With a strong brand Bajaj, its products are accepted well in the market • BJE is recreating its brand through heavy advertisement Outlook and valuation: Gap with peers to narrow In the backdrop of its operational strengths and improving financials, we believe that the valuation gap between BJE and its peers in the consumer durable industry will narrow. Historically, BJE has traded at a significant discount to its peers, and rightly so, due to lower margins in CD and value destruction in E&P due to losses. However, over the next two years, we expect the valuation gap between BJE and its peers to narrow as: (1) TOC yields results, (2) BJE focuses on leveraging distribution network through a judicious mix of geographical and product expansion, (3) there is strong revenue visibility, with levers for margin expansion, (4) working capital could improve because of TOC, and as BJE adopts channel financing resulting in an FCF generation of Rs 6bn over FY17‐19 (highest in the last seven years), and (5) improving return ratios. Consequently, we have revised our FY18/19 earnings estimates by 4%/6%. Current stock price implies a 20x PE for BJE’s CD segment and 6x EV/EBITDA on our FY19 estimates. We assign a FY19 target PE of 26x to BJE’s CD segment earnings (72% of FY19 PAT) to get a per share value of Rs 390. We expect measures taken by the company to lead to robust cash flow generation and improvement in the return profile to spur a rerating. Our multiple is at a 35% discount to the industry average. We value its E&P segment on EV/EBITDA at 7x FY19 vs. industry average of 10x to arrive at a per share value of Rs 60. We revise our target price to Rs 450 (Rs 300 earlier) – implying 29% upside. Upgrade our rating to Buy from Sell.
Valuation Valuation ‐ BJE Electricals FY191.) Consumer Business
PAT (Rs mn) 1,511 PE (x) 26
CD / Share Value (Rs) 3902.) E&P Business
EBITDA (Rs mn) 1,670 EV/EBITDA (x) 7 EV (Rs mn) 11,693 Debt* (Rs mn) 6,040 Cash (Rs mn) 742 Net Debt (Rs mn) 5,298 No. of Share (No. mn) 101
E&P per Share Value (Rs.) 60TP ‐ Comp. 450
Source: PhillipCapital India Research Estimates
Page | 9 | PHILLIPCAPITAL INDIA RESEARCH
BAJAJ ELECTRICALS COMPANY UPDATE
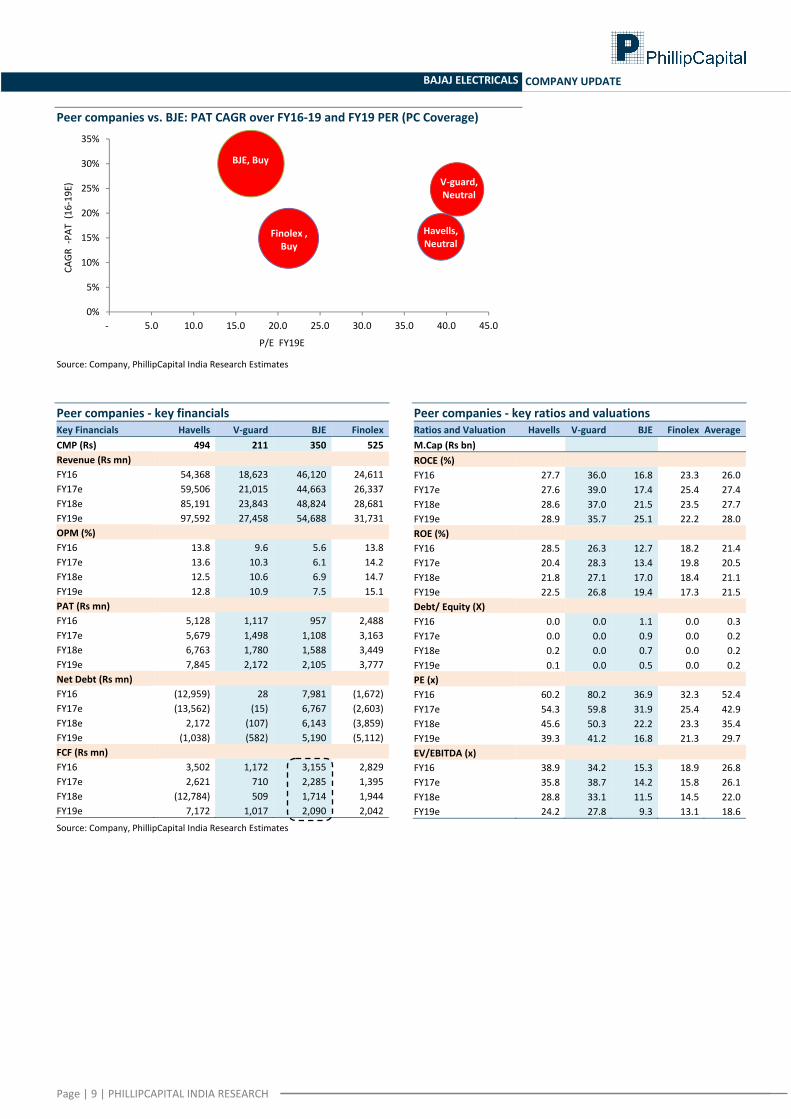
Peer companies vs. BJE: PAT CAGR over FY16‐19 and FY19 PER (PC Coverage)
Source: Company, PhillipCapital India Research Estimates Peer companies ‐ key financials Key Financials Havells V‐guard BJE Finolex CMP (Rs) 494 211 350 525 Revenue (Rs mn) FY16 54,368 18,623 46,120 24,611 FY17e 59,506 21,015 44,663 26,337 FY18e 85,191 23,843 48,824 28,681 FY19e 97,592 27,458 54,688 31,731 OPM (%) FY16 13.8 9.6 5.6 13.8 FY17e 13.6 10.3 6.1 14.2 FY18e 12.5 10.6 6.9 14.7 FY19e 12.8 10.9 7.5 15.1 PAT (Rs mn) FY16 5,128 1,117 957 2,488 FY17e 5,679 1,498 1,108 3,163 FY18e 6,763 1,780 1,588 3,449 FY19e 7,845 2,172 2,105 3,777 Net Debt (Rs mn) FY16 (12,959) 28 7,981 (1,672) FY17e (13,562) (15) 6,767 (2,603) FY18e 2,172 (107) 6,143 (3,859) FY19e (1,038) (582) 5,190 (5,112) FCF (Rs mn) FY16 3,502 1,172 3,155 2,829 FY17e 2,621 710 2,285 1,395 FY18e (12,784) 509 1,714 1,944 FY19e 7,172 1,017 2,090 2,042
Source: Company, PhillipCapital India Research Estimates
Peer companies ‐ key ratios and valuations Ratios and Valuation Havells V‐guard BJE Finolex Average M.Cap (Rs bn) ROCE (%) FY16 27.7 36.0 16.8 23.3 26.0 FY17e 27.6 39.0 17.4 25.4 27.4 FY18e 28.6 37.0 21.5 23.5 27.7 FY19e 28.9 35.7 25.1 22.2 28.0 ROE (%) FY16 28.5 26.3 12.7 18.2 21.4 FY17e 20.4 28.3 13.4 19.8 20.5 FY18e 21.8 27.1 17.0 18.4 21.1 FY19e 22.5 26.8 19.4 17.3 21.5 Debt/ Equity (X) FY16 0.0 0.0 1.1 0.0 0.3 FY17e 0.0 0.0 0.9 0.0 0.2 FY18e 0.2 0.0 0.7 0.0 0.2 FY19e 0.1 0.0 0.5 0.0 0.2 PE (x) FY16 60.2 80.2 36.9 32.3 52.4 FY17e 54.3 59.8 31.9 25.4 42.9 FY18e 45.6 50.3 22.2 23.3 35.4 FY19e 39.3 41.2 16.8 21.3 29.7 EV/EBITDA (x) FY16 38.9 34.2 15.3 18.9 26.8 FY17e 35.8 38.7 14.2 15.8 26.1 FY18e 28.8 33.1 11.5 14.5 22.0 FY19e 24.2 27.8 9.3 13.1 18.6
Havells, Neutral
V‐guard, Neutral
BJE, Buy
Finolex , Buy
0%
5%
10%
15%
20%
25%
30%
35%
‐ 5.0 10.0 15.0 20.0 25.0 30.0 35.0 40.0 45.0
CAGR ‐P
AT (16
‐19E)
P/E FY19E
BUY
BUYHOLD
Page | 10 | PHILLIPCAPITAL INDIA RESEARCH
BAJAJ ELECTRICALS LTD QUARTERLY UPDATE
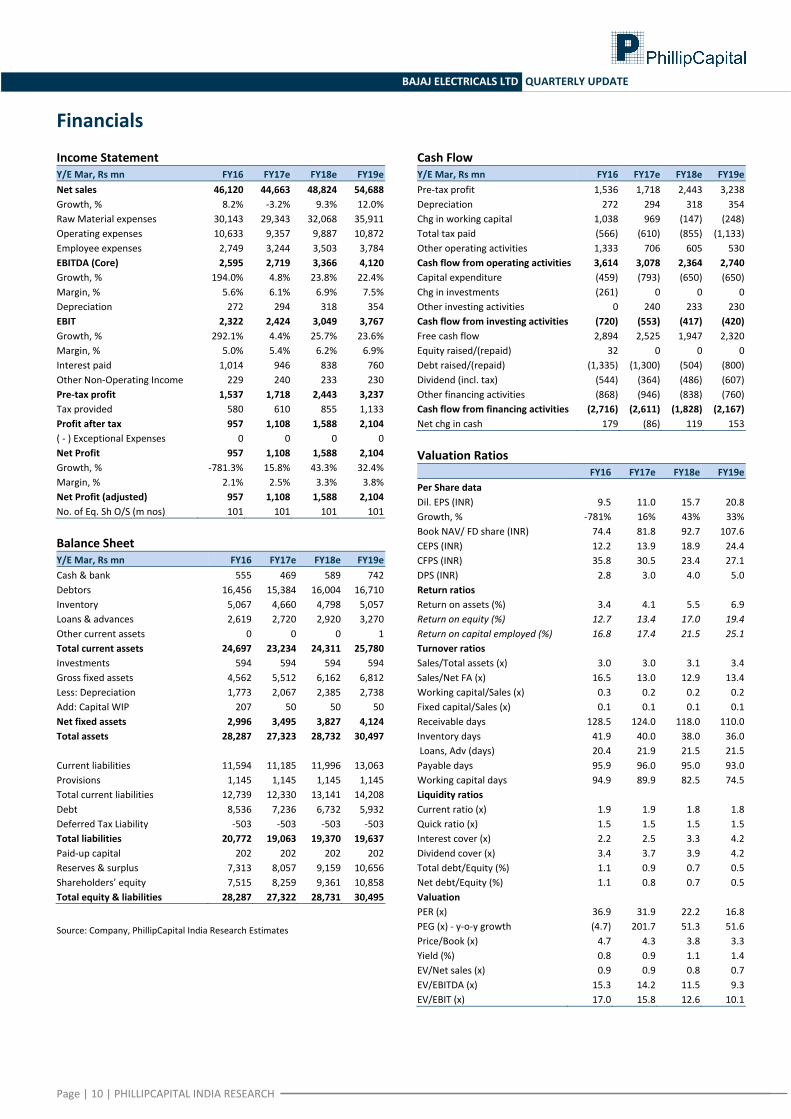
Financials Income Statement Y/E Mar, Rs mn FY16 FY17e FY18e FY19eNet sales 46,120 44,663 48,824 54,688Growth, % 8.2% ‐3.2% 9.3% 12.0%Raw Material expenses 30,143 29,343 32,068 35,911Operating expenses 10,633 9,357 9,887 10,872Employee expenses 2,749 3,244 3,503 3,784EBITDA (Core) 2,595 2,719 3,366 4,120Growth, % 194.0% 4.8% 23.8% 22.4%Margin, % 5.6% 6.1% 6.9% 7.5%Depreciation 272 294 318 354EBIT 2,322 2,424 3,049 3,767Growth, % 292.1% 4.4% 25.7% 23.6%Margin, % 5.0% 5.4% 6.2% 6.9%Interest paid 1,014 946 838 760Other Non‐Operating Income 229 240 233 230Pre‐tax profit 1,537 1,718 2,443 3,237Tax provided 580 610 855 1,133Profit after tax 957 1,108 1,588 2,104( ‐ ) Exceptional Expenses 0 0 0 0Net Profit 957 1,108 1,588 2,104Growth, % ‐781.3% 15.8% 43.3% 32.4%Margin, % 2.1% 2.5% 3.3% 3.8%Net Profit (adjusted) 957 1,108 1,588 2,104No. of Eq. Sh O/S (m nos) 101 101 101 101 Balance Sheet Y/E Mar, Rs mn FY16 FY17e FY18e FY19eCash & bank 555 469 589 742Debtors 16,456 15,384 16,004 16,710Inventory 5,067 4,660 4,798 5,057Loans & advances 2,619 2,720 2,920 3,270Other current assets 0 0 0 1Total current assets 24,697 23,234 24,311 25,780Investments 594 594 594 594Gross fixed assets 4,562 5,512 6,162 6,812Less: Depreciation 1,773 2,067 2,385 2,738Add: Capital WIP 207 50 50 50Net fixed assets 2,996 3,495 3,827 4,124Total assets 28,287 27,323 28,732 30,497 Current liabilities 11,594 11,185 11,996 13,063Provisions 1,145 1,145 1,145 1,145Total current liabilities 12,739 12,330 13,141 14,208Debt 8,536 7,236 6,732 5,932Deferred Tax Liability ‐503 ‐503 ‐503 ‐503Total liabilities 20,772 19,063 19,370 19,637Paid‐up capital 202 202 202 202Reserves & surplus 7,313 8,057 9,159 10,656Shareholders’ equity 7,515 8,259 9,361 10,858Total equity & liabilities 28,287 27,322 28,731 30,495 Source: Company, PhillipCapital India Research Estimates
Cash Flow Y/E Mar, Rs mn FY16 FY17e FY18e FY19ePre‐tax profit 1,536 1,718 2,443 3,238 Depreciation 272 294 318 354 Chg in working capital 1,038 969 (147) (248)Total tax paid (566) (610) (855) (1,133)Other operating activities 1,333 706 605 530 Cash flow from operating activities 3,614 3,078 2,364 2,740 Capital expenditure (459) (793) (650) (650)Chg in investments (261) 0 0 0Other investing activities 0 240 233 230 Cash flow from investing activities (720) (553) (417) (420)Free cash flow 2,894 2,525 1,947 2,320 Equity raised/(repaid) 32 0 0 0Debt raised/(repaid) (1,335) (1,300) (504) (800)Dividend (incl. tax) (544) (364) (486) (607)Other financing activities (868) (946) (838) (760)Cash flow from financing activities (2,716) (2,611) (1,828) (2,167)Net chg in cash 179 (86) 119 153 Valuation Ratios
FY16 FY17e FY18e FY19ePer Share data Dil. EPS (INR) 9.5 11.0 15.7 20.8Growth, % ‐781% 16% 43% 33%Book NAV/ FD share (INR) 74.4 81.8 92.7 107.6CEPS (INR) 12.2 13.9 18.9 24.4CFPS (INR) 35.8 30.5 23.4 27.1DPS (INR) 2.8 3.0 4.0 5.0Return ratios Return on assets (%) 3.4 4.1 5.5 6.9Return on equity (%) 12.7 13.4 17.0 19.4Return on capital employed (%) 16.8 17.4 21.5 25.1Turnover ratios Sales/Total assets (x) 3.0 3.0 3.1 3.4Sales/Net FA (x) 16.5 13.0 12.9 13.4Working capital/Sales (x) 0.3 0.2 0.2 0.2Fixed capital/Sales (x) 0.1 0.1 0.1 0.1Receivable days 128.5 124.0 118.0 110.0Inventory days 41.9 40.0 38.0 36.0 Loans, Adv (days) 20.4 21.9 21.5 21.5Payable days 95.9 96.0 95.0 93.0Working capital days 94.9 89.9 82.5 74.5Liquidity ratios Current ratio (x) 1.9 1.9 1.8 1.8Quick ratio (x) 1.5 1.5 1.5 1.5Interest cover (x) 2.2 2.5 3.3 4.2Dividend cover (x) 3.4 3.7 3.9 4.2Total debt/Equity (%) 1.1 0.9 0.7 0.5Net debt/Equity (%) 1.1 0.8 0.7 0.5Valuation PER (x) 36.9 31.9 22.2 16.8PEG (x) ‐ y‐o‐y growth (4.7) 201.7 51.3 51.6Price/Book (x) 4.7 4.3 3.8 3.3Yield (%) 0.8 0.9 1.1 1.4EV/Net sales (x) 0.9 0.9 0.8 0.7EV/EBITDA (x) 15.3 14.2 11.5 9.3EV/EBIT (x) 17.0 15.8 12.6 10.1
Page | 11 | PHILLIPCAPITAL INDIA RESEARCH
BAJAJ ELECTRICLAS COMPANY UPDATE
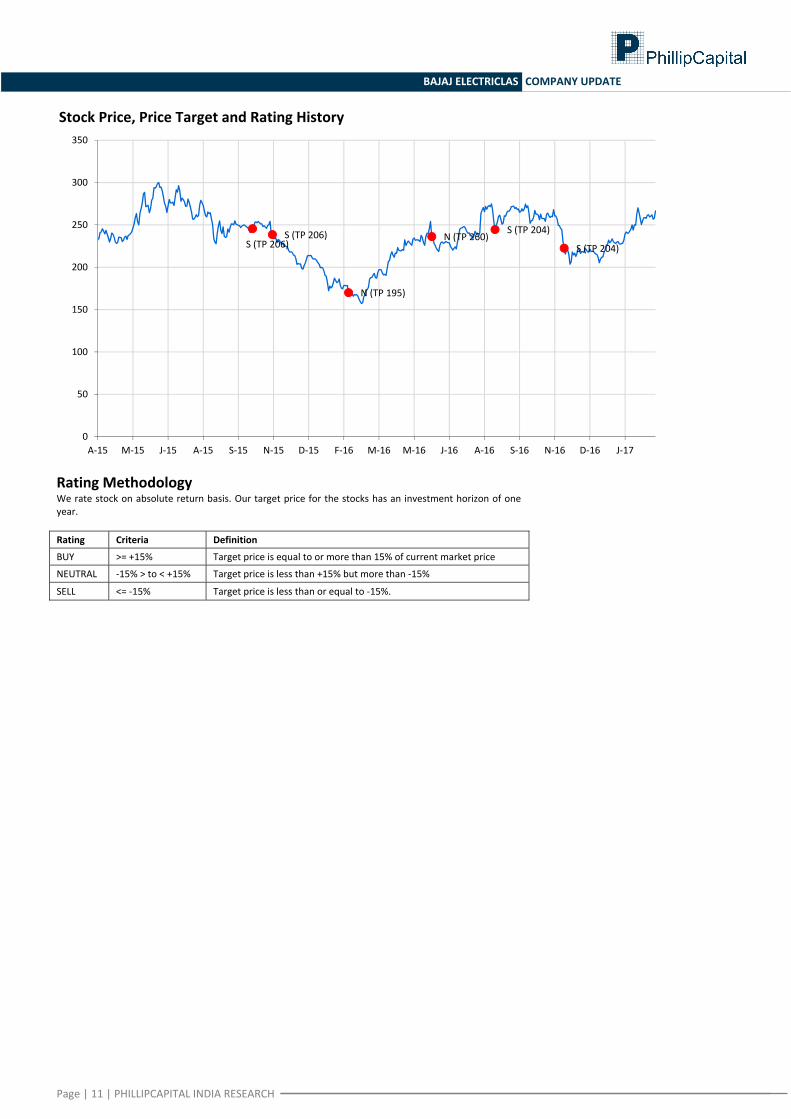
Stock Price, Price Target and Rating History
Rating Methodology We rate stock on absolute return basis. Our target price for the stocks has an investment horizon of one year. Rating Criteria Definition
BUY >= +15% Target price is equal to or more than 15% of current market price
NEUTRAL ‐15% > to < +15% Target price is less than +15% but more than ‐15%
SELL <= ‐15% Target price is less than or equal to ‐15%.
S (TP 206)S (TP 206)
N (TP 195)
N (TP 260)S (TP 204)
S (TP 204)
0
50
100
150
200
250
300
350
A‐15 M‐15 J‐15 A‐15 S‐15 N‐15 D‐15 F‐16 M‐16 M‐16 J‐16 A‐16 S‐16 N‐16 D‐16 J‐17
Page | 12 | PHILLIPCAPITAL INDIA RESEARCH
BAJAJ ELECTRICLAS COMPANY UPDATE
Management Vineet Bhatnagar (Managing Director) (91 22) 2483 1919 Kinshuk Bharti Tiwari (Head – Institutional Equity) (91 22) 6246 4101 Jignesh Shah (Head – Equity Derivatives) (91 22) 6667 9735 Research Automobiles IT Services Pharma & Specialty Chem Dhawal Doshi (9122) 6246 4128 Vibhor Singhal (9122) 6246 4109 Surya Patra (9122) 6246 4121 Nitesh Sharma, CFA (9122) 6246 4126 Shyamal Dhruve (9122) 6246 4110 Mehul Sheth (9122) 6246 4123 Banking, NBFCs Infrastructure Strategy Manish Agarwalla (9122) 6246 4125 Vibhor Singhal (9122) 6246 4109 Naveen Kulkarni, CFA, FRM (9122) 6246 4122 Pradeep Agrawal (9122) 6246 4113 Aashima Mutneja, CFA (9122) 6667 9764 Paresh Jain (9122) 6246 4114 Logistics, Transportation & Midcap Telecom Consumer & Retail Vikram Suryavanshi (9122) 6246 4111 Naveen Kulkarni, CFA, FRM (9122) 6246 4122 Naveen Kulkarni, CFA, FRM (9122) 6246 4122 Media Manoj Behera (9122) 6246 4118 Jubil Jain (9122) 6246 4117 Manoj Behera (9122) 6246 4118 Technicals Preeyam Tolia (9122) 6246 4129 Metals Subodh Gupta, CMT (9122) 6246 4136 Cement Dhawal Doshi (9122) 6246 4128 Production Manager Vaibhav Agarwal (9122) 6246 4124 Yash Doshi (9122) 6246 4127 Ganesh Deorukhkar (9122) 6667 9966 Economics Mid-Caps & Database Manager Editor Anjali Verma (9122) 6246 4115 Deepak Agarwal (9122) 6246 4112 Roshan Sony 98199 72726 Shruti Bajpai (9122) 6246 4135 Oil & Gas Sr. Manager – Equities Support Engineering, Capital Goods Sabri Hazarika (9122) 6667 9756 Rosie Ferns (9122) 6667 9971 Jonas Bhutta (9122) 6246 4119 Vikram Rawat (9122) 6246 4120 Sales & Distribution Corporate Communications Ashvin Patil (9122) 6246 4105 Sales Trader Zarine Damania (9122) 6667 9976 Shubhangi Agrawal (9122) 6246 4103 Dilesh Doshi (9122) 6667 9747 Kishor Binwal (9122) 6246 4106 Suniil Pandit (9122) 6667 9745 Bhavin Shah (9122) 6246 4102 Ashka Mehta Gulati (9122) 6246 4108 Execution Archan Vyas (9122) 6246 4107 Mayur Shah (9122) 6667 9945
Contact Information (Regional Member Companies)
SINGAPORE: Phillip Securities Pte Ltd 250 North Bridge Road, #06‐00 RafflesCityTower,
Singapore 179101 Tel : (65) 6533 6001 Fax: (65) 6535 3834
www.phillip.com.sg
MALAYSIA: Phillip Capital Management Sdn Bhd B‐3‐6 Block B Level 3, Megan Avenue II,
No. 12, Jalan Yap Kwan Seng, 50450 Kuala Lumpur Tel (60) 3 2162 8841 Fax (60) 3 2166 5099
www.poems.com.my
HONG KONG: Phillip Securities (HK) Ltd 11/F United Centre 95 Queensway Hong Kong Tel (852) 2277 6600 Fax: (852) 2868 5307
www.phillip.com.hk
JAPAN: Phillip Securities Japan, Ltd 4‐2 Nihonbashi Kabutocho, Chuo‐ku
Tokyo 103‐0026 Tel: (81) 3 3666 2101 Fax: (81) 3 3664 0141
www.phillip.co.jp
INDONESIA: PT Phillip Securities Indonesia ANZTower Level 23B, Jl Jend Sudirman Kav 33A,
Jakarta 10220, Indonesia Tel (62) 21 5790 0800 Fax: (62) 21 5790 0809
www.phillip.co.id
CHINA: Phillip Financial Advisory (Shanghai) Co. Ltd. No 550 Yan An East Road, OceanTower Unit 2318
Shanghai 200 001 Tel (86) 21 5169 9200 Fax: (86) 21 6351 2940
www.phillip.com.cn THAILAND: Phillip Securities (Thailand) Public Co. Ltd.
15th Floor, VorawatBuilding, 849 Silom Road, Silom, Bangrak, Bangkok 10500 Thailand
Tel (66) 2 2268 0999 Fax: (66) 2 2268 0921 www.phillip.co.th
FRANCE: King & Shaxson Capital Ltd. 3rd Floor, 35 Rue de la Bienfaisance
75008 Paris France Tel (33) 1 4563 3100 Fax : (33) 1 4563 6017
www.kingandshaxson.com
UNITED KINGDOM: King & Shaxson Ltd. 6th Floor, Candlewick House, 120 Cannon Street
London, EC4N 6AS Tel (44) 20 7929 5300 Fax: (44) 20 7283 6835
www.kingandshaxson.com UNITED STATES: Phillip Futures Inc.
141 W Jackson Blvd Ste 3050 The Chicago Board of TradeBuilding
Chicago, IL 60604 USA Tel (1) 312 356 9000 Fax: (1) 312 356 9005
AUSTRALIA: PhillipCapital Australia Level 10, 330 Collins Street
Melbourne, VIC 3000, Australia Tel: (61) 3 8633 9800 Fax: (61) 3 8633 9899
www.phillipcapital.com.au
SRI LANKA: Asha Phillip Securities Limited Level 4, Millennium House, 46/58 Navam Mawatha,
Colombo 2, Sri Lanka Tel: (94) 11 2429 100 Fax: (94) 11 2429 199
www.ashaphillip.net/home.htm INDIA
PhillipCapital (India) Private Limited No. 1, 18th Floor, Urmi Estate, 95 Ganpatrao Kadam Marg, Lower Parel West, Mumbai 400013 Tel: (9122) 2300 2999 Fax: (9122) 6667 9955 www.phillipcapital.in
Page | 13 | PHILLIPCAPITAL INDIA RESEARCH
BAJAJ ELECTRICLAS COMPANY UPDATE
Disclosures and Disclaimers PhillipCapital (India) Pvt. Ltd. has three independent equity research groups: Institutional Equities, Institutional Equity Derivatives, and Private Client Group. This report has been prepared by Institutional Equities Group. The views and opinions expressed in this document may, may not match, or may be contrary at times with the views, estimates, rating, and target price of the other equity research groups of PhillipCapital (India) Pvt. Ltd.
This report is issued by PhillipCapital (India) Pvt. Ltd., which is regulated by the SEBI. PhillipCapital (India) Pvt. Ltd. is a subsidiary of Phillip (Mauritius) Pvt. Ltd. References to "PCIPL" in this report shall mean PhillipCapital (India) Pvt. Ltd unless otherwise stated. This report is prepared and distributed by PCIPL for information purposes only, and neither the information contained herein, nor any opinion expressed should be construed or deemed to be construed as solicitation or as offering advice for the purposes of the purchase or sale of any security, investment, or derivatives. The information and opinions contained in the report were considered by PCIPL to be valid when published. The report also contains information provided to PCIPL by third parties. The source of such information will usually be disclosed in the report. Whilst PCIPL has taken all reasonable steps to ensure that this information is correct, PCIPL does not offer any warranty as to the accuracy or completeness of such information. Any person placing reliance on the report to undertake trading does so entirely at his or her own risk and PCIPL does not accept any liability as a result. Securities and Derivatives markets may be subject to rapid and unexpected price movements and past performance is not necessarily an indication of future performance.
This report does not regard the specific investment objectives, financial situation, and the particular needs of any specific person who may receive this report. Investors must undertake independent analysis with their own legal, tax, and financial advisors and reach their own conclusions regarding the appropriateness of investing in any securities or investment strategies discussed or recommended in this report and should understand that statements regarding future prospects may not be realised. Under no circumstances can it be used or considered as an offer to sell or as a solicitation of any offer to buy or sell the securities mentioned within it. The information contained in the research reports may have been taken from trade and statistical services and other sources, which PCIL believe is reliable. PhillipCapital (India) Pvt. Ltd. or any of its group/associate/affiliate companies do not guarantee that such information is accurate or complete and it should not be relied upon as such. Any opinions expressed reflect judgments at this date and are subject to change without notice.
Important: These disclosures and disclaimers must be read in conjunction with the research report of which it forms part. Receipt and use of the research report is subject to all aspects of these disclosures and disclaimers. Additional information about the issuers and securities discussed in this research report is available on request.
Certifications: The research analyst(s) who prepared this research report hereby certifies that the views expressed in this research report accurately reflect the research analyst’s personal views about all of the subject issuers and/or securities, that the analyst(s) have no known conflict of interest and no part of the research analyst’s compensation was, is, or will be, directly or indirectly, related to the specific views or recommendations contained in this research report.
Additional Disclosures of Interest: Unless specifically mentioned in Point No. 9 below: 1. The Research Analyst(s), PCIL, or its associates or relatives of the Research Analyst does not have any financial interest in the company(ies) covered in
this report. 2. The Research Analyst, PCIL or its associates or relatives of the Research Analyst affiliates collectively do not hold more than 1% of the securities of the
company (ies)covered in this report as of the end of the month immediately preceding the distribution of the research report. 3. The Research Analyst, his/her associate, his/her relative, and PCIL, do not have any other material conflict of interest at the time of publication of this
research report. 4. The Research Analyst, PCIL, and its associates have not received compensation for investment banking or merchant banking or brokerage services or for
any other products or services from the company(ies) covered in this report, in the past twelve months. 5. The Research Analyst, PCIL or its associates have not managed or co‐managed in the previous twelve months, a private or public offering of securities for
the company (ies) covered in this report. 6. PCIL or its associates have not received compensation or other benefits from the company(ies) covered in this report or from any third party, in
connection with the research report. 7. The Research Analyst has not served as an Officer, Director, or employee of the company (ies) covered in the Research report. 8. The Research Analyst and PCIL has not been engaged in market making activity for the company(ies) covered in the Research report. 9. Details of PCIL, Research Analyst and its associates pertaining to the companies covered in the Research report: Sr. no. Particulars Yes/No
1 Whether compensation has been received from the company(ies) covered in the Research report in the past 12 months for investment banking transaction by PCIL
No
2 Whether Research Analyst, PCIL or its associates or relatives of the Research Analyst affiliates collectively hold more than 1% of the company(ies) covered in the Research report
No
3 Whether compensation has been received by PCIL or its associates from the company(ies) covered in the Research report No4 PCIL or its affiliates have managed or co‐managed in the previous twelve months a private or public offering of securities for the
company(ies) covered in the Research report No
5 Research Analyst, his associate, PCIL or its associates have received compensation for investment banking or merchant banking or brokerage services or for any other products or services from the company(ies) covered in the Research report, in the last twelve months
No
Independence: PhillipCapital (India) Pvt. Ltd. has not had an investment banking relationship with, and has not received any compensation for investment banking services from, the subject issuers in the past twelve (12) months, and PhillipCapital (India) Pvt. Ltd does not anticipate receiving or intend to seek compensation for investment banking services from the subject issuers in the next three (3) months. PhillipCapital (India) Pvt. Ltd is not a market maker in the securities mentioned in this research report, although it, or its affiliates/employees, may have positions in, purchase or sell, or be materially interested in any of the securities covered in the report.
Suitability and Risks: This research report is for informational purposes only and is not tailored to the specific investment objectives, financial situation or particular requirements of any individual recipient hereof. Certain securities may give rise to substantial risks and may not be suitable for certain investors. Each investor must make its own determination as to the appropriateness of any securities referred to in this research report based upon the legal, tax and accounting considerations applicable to such investor and its own investment objectives or strategy, its financial situation and its investing experience. The value of any security may be positively or adversely affected by changes in foreign exchange or interest rates, as well as by other financial, economic, or political factors. Past performance is not necessarily indicative of future performance or results.
Page | 14 | PHILLIPCAPITAL INDIA RESEARCH
BAJAJ ELECTRICLAS COMPANY UPDATE
Sources, Completeness and Accuracy: The material herein is based upon information obtained from sources that PCIPL and the research analyst believe to be reliable, but neither PCIPL nor the research analyst represents or guarantees that the information contained herein is accurate or complete and it should not be relied upon as such. Opinions expressed herein are current opinions as of the date appearing on this material, and are subject to change without notice. Furthermore, PCIPL is under no obligation to update or keep the information current. Without limiting any of the foregoing, in no event shall PCIL, any of its affiliates/employees or any third party involved in, or related to computing or compiling the information have any liability for any damages of any kind including but not limited to any direct or consequential loss or damage, however arising, from the use of this document.
Copyright: The copyright in this research report belongs exclusively to PCIPL. All rights are reserved. Any unauthorised use or disclosure is prohibited. No reprinting or reproduction, in whole or in part, is permitted without the PCIPL’s prior consent, except that a recipient may reprint it for internal circulation only and only if it is reprinted in its entirety.
Caution: Risk of loss in trading/investment can be substantial and even more than the amount / margin given by you. Investment in securities market are subject to market risks, you are requested to read all the related documents carefully before investing. You should carefully consider whether trading/investment is appropriate for you in light of your experience, objectives, financial resources and other relevant circumstances. PhillipCapital and any of its employees, directors, associates, group entities, or affiliates shall not be liable for losses, if any, incurred by you. You are further cautioned that trading/investments in financial markets are subject to market risks and are advised to seek independent third party trading/investment advice outside PhillipCapital/group/associates/affiliates/directors/employees before and during your trading/investment. There is no guarantee/assurance as to returns or profits or capital protection or appreciation. PhillipCapital and any of its employees, directors, associates, and/or employees, directors, associates of PhillipCapital’s group entities or affiliates is not inducing you for trading/investing in the financial market(s). Trading/Investment decision is your sole responsibility. You must also read the Risk Disclosure Document and Do’s and Don’ts before investing.
Kindly note that past performance is not necessarily a guide to future performance.
For Detailed Disclaimer: Please visit our website www.phillipcapital.in
For U.S. persons only: This research report is a product of PhillipCapital (India) Pvt Ltd., which is the employer of the research analyst(s) who has prepared the research report. The research analyst(s) preparing the research report is/are resident outside the United States (U.S.) and are not associated persons of any U.S.‐regulated broker‐dealer and therefore the analyst(s) is/are not subject to supervision by a U.S. broker‐dealer, and is/are not required to satisfy the regulatory licensing requirements of FINRA or required to otherwise comply with U.S. rules or regulations regarding, among other things, communications with a subject company, public appearances, and trading securities held by a research analyst account.
This report is intended for distribution by PhillipCapital (India) Pvt Ltd. only to "Major Institutional Investors" as defined by Rule 15a‐6(b)(4) of the U.S. Securities and Exchange Act, 1934 (the Exchange Act) and interpretations thereof by the U.S. Securities and Exchange Commission (SEC) in reliance on Rule 15a 6(a)(2). If the recipient of this report is not a Major Institutional Investor as specified above, then it should not act upon this report and return the same to the sender. Further, this report may not be copied, duplicated, and/or transmitted onward to any U.S. person, which is not a Major Institutional Investor. In reliance on the exemption from registration provided by Rule 15a‐6 of the Exchange Act and interpretations thereof by the SEC in order to conduct certain business with Major Institutional Investors, PhillipCapital (India) Pvt Ltd. has entered into an agreement with a U.S. registered broker‐dealer, Decker & Co, LLC. Transactions in securities discussed in this research report should be effected through Decker & Co, LLC or another U.S. registered broker dealer. If Distribution is to Australian Investors This report is produced by PhillipCapital (India) Pvt Ltd and is being distributed in Australia by Phillip Capital Limited (Australian Financial Services Licence No. 246827). This report contains general securities advice and does not take into account your personal objectives, situation and needs. Please read the Disclosures and Disclaimers set out above. By receiving or reading this report, you agree to be bound by the terms and limitations set out above. Any failure to comply with these terms and limitations may constitute a violation of law. This report has been provided to you for personal use only and shall not be reproduced, distributed or published by you in whole or in part, for any purpose. If you have received this report by mistake, please delete or destroy it, and notify the sender immediately. PhillipCapital (India) Pvt. Ltd. Registered office: No. 1, 18th Floor, Urmi Estate, 95 Ganpatrao Kadam Marg, Lower Parel West, Mumbai 400013