Embed Size (px)
Citation preview
Department of Power Engineering and Turbomachinery
Division of Power Machinery Design and Operation
Silesian University of Technology, Gliwice
INSTRUCTIONS FOR LABORATORY EXERCISES OF
STRENGTH OF MATERIALS
STRAIN MEASURMENTS
Gliwice, 2019
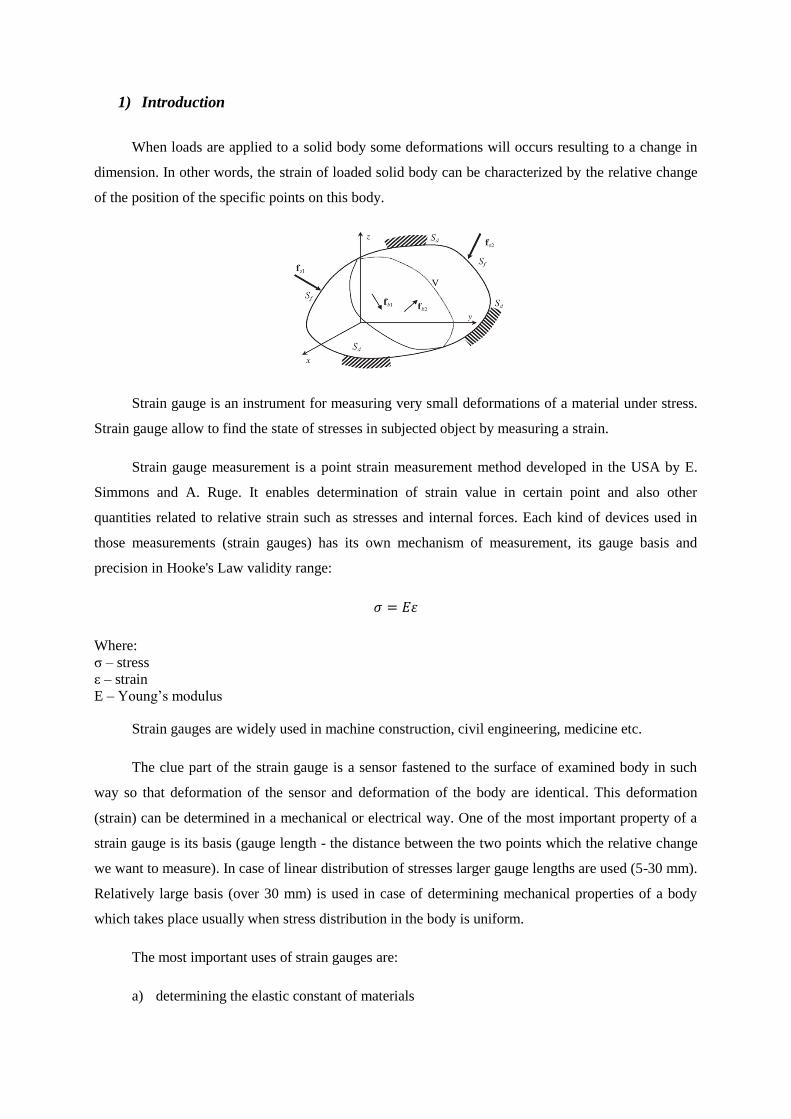
1) Introduction
When loads are applied to a solid body some deformations will occurs resulting to a change in
dimension. In other words, the strain of loaded solid body can be characterized by the relative change
of the position of the specific points on this body.
Strain gauge is an instrument for measuring very small deformations of a material under stress.
Strain gauge allow to find the state of stresses in subjected object by measuring a strain.
Strain gauge measurement is a point strain measurement method developed in the USA by E.
Simmons and A. Ruge. It enables determination of strain value in certain point and also other
quantities related to relative strain such as stresses and internal forces. Each kind of devices used in
those measurements (strain gauges) has its own mechanism of measurement, its gauge basis and
precision in Hooke's Law validity range:
𝜎 = 𝐸𝜀
Where:
σ – stress
ε – strain
E – Young’s modulus
Strain gauges are widely used in machine construction, civil engineering, medicine etc.
The clue part of the strain gauge is a sensor fastened to the surface of examined body in such
way so that deformation of the sensor and deformation of the body are identical. This deformation
(strain) can be determined in a mechanical or electrical way. One of the most important property of a
strain gauge is its basis (gauge length - the distance between the two points which the relative change
we want to measure). In case of linear distribution of stresses larger gauge lengths are used (5-30 mm).
Relatively large basis (over 30 mm) is used in case of determining mechanical properties of a body
which takes place usually when stress distribution in the body is uniform.
The most important uses of strain gauges are:
a) determining the elastic constant of materials
b) experimental determination the state of stress and strain
c) analysis of the state of stresses in the machine parts
2) The purpose of laboratory
The purpose of the exercise is to learn about different types of strain gauges, characteristics
and properties of strain gauges and methods of measurements with the use of strain gauges.
3) Strain gauges
A strain gauge is a device used to measure strain on an object. Strain gages are resistive sensors that
are attached to the surface of an object to determine the surface strain caused by an applied force.
Typical uses of strain gages include test and measurement applications where the strength of the object
is the main consideration and the object under test is a structural component in a machine or device
such as an automobile, an aircraft, or a highway bridge. Strain gages are also used inside precision
transducers where the magnitude of an applied force is the focus of the measurement. A variety of
physical measurements can be made using strain gages attached to metal components including force,
weight, pressure, displacement, and acceleration.
There are several general types of strain gauges depending on their construction and physical
phenomenon used in strain determination:
• mechanical strain gauges
• mechanical-optical strain gauges
• induction strain gauges
• capacitance strain gauges
Example of different types of strain gauges are:
a) Vibrating wire strain gauges are used in geotechnical and civil engineering applications. The
gauge consists of a vibrating, tensioned wire. The strain is calculated by measuring the
resonant frequency of the wire (an increase in tension increases the resonant frequency)
b) Nanoparticle-based strain gauges emerge as a new promising technology. These resistive
sensors whose active area is made by an assembly of conductive nanoparticles, such
as gold or carbon, combine a high gauge factor, a large deformation range and a small
electrical consumption due to their high impedance.
c) In biological measurements, especially blood flow and tissue swelling, a variant
called mercury-in-rubber strain gauge is used. This kind of strain gauge consists of a small
amount of liquid mercury enclosed in a small rubber tube, which is applied around e.g., a toe
or leg. Swelling of the body part results in stretching of the tube, making it both longer and
thinner, which increases electrical resistance
d) Microscale strain gauges are widely used in microelectromechanical systems to measure
strains such as those induced by force, acceleration, pressure or sound.
4) Resistance strain gauges
In stress state analysis of elements of machines glued resistance strain gauges are commonly used.
Those gauges are cheap, universal, very sensitive and precise and can be glued practically in every
place on the machine.
Mechanism of strain determination is very simple – strain gauge is in fact a (relatively) long
electrical conductor. Its resistance depends mainly on its length – any change of length (caused by
deformation of a surface to which strain gauge is attached) causes change of resistance which can be
easily measured.
Resistance of a wire with uniform cross section, A, and resistivity, ρ, can be expressed as is given by a
formula shown below:
𝑅 = 𝜌𝐿
𝐴
where L is the wire length.
The change in resistance can be expressed from:
𝛥𝑅 = 𝜌𝐿
𝐴+ (𝜌 + ∆𝜌)
𝐿 + ∆𝐿
𝐴 + ∆𝐴
where ∆ signifies a change in the quantity.
This is a complicated expression in its present form, however, it should be clear that for metallic wires
subjected to engineering strain levels that ∆L << L and ∆A << A. If ∆ρ<< ρ as well, then we can
simplify the expression by approximating ∆ with the infinitesimal differential change, d():
∆𝑅 = 𝑑 (𝜌𝐿
𝐴)
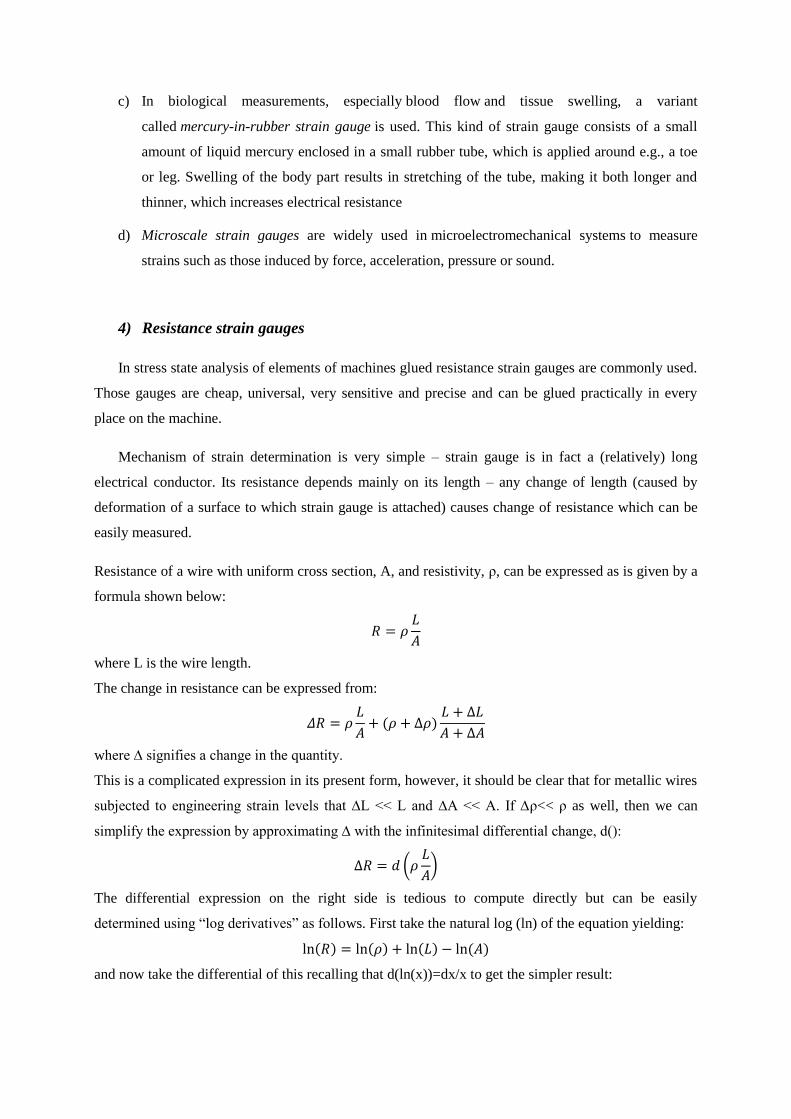
The differential expression on the right side is tedious to compute directly but can be easily
determined using “log derivatives” as follows. First take the natural log (ln) of the equation yielding:
ln(𝑅) = ln(𝜌) + ln(𝐿) − ln(𝐴)
and now take the differential of this recalling that d(ln(x))=dx/x to get the simpler result:
𝑑𝑅
𝑅=𝑑𝜌
𝜌+𝑑𝐿
𝐿−𝑑𝐴
𝐴
In general we may write:
𝐴 = 𝐶𝐷2
where D is a cross section dimension and C is some constant (e.g., D=R and C=π for a circle).
Using the “log derivative” method, it follows that:
𝑑𝐴
𝐴= 2
𝑑𝐷
𝐷
At this point we note that the longitudinal strain can be written in differential form as:
𝜀 =𝑑𝐿
𝐿
Finally, the resistance change per unit resistance (∆R/R) can then be written:
∆𝑅
𝑅= 𝑘
∆𝐿
𝐿= 𝑘𝜀
𝜀 =1
𝑘(∆𝑅
𝑅)
This expresses the basic proportionality between resistance and strain in the gage element material.
So relative deformation (which is an estimation of average strain) is proportional to relative resistance
change and can be calculated in an easy way.
Parameter k is constant and depends only on material the conductor is made of. It is called strain
gauge sensitivity coefficient (usually k = 1,6 – 3,6).
5) Measuring method
A fundamental parameter of the strain gage is its sensitivity to strain, k is the ratio of the fractional
change in electrical resistance to the fractional change in length, or strain. As mentioned above, for
metallic strain gages is usually around 2. You can obtain the actual k of a particular strain gage from
sensor documentation.
In practice, strain measurements rarely involve quantities larger than a few millistrain (e x 10-3
).
Therefore, to measure the strain, you have to accurately measure very small changes in resistance. For
example, suppose a test specimen undergoes a strain of 500 me. A strain gage with a k of 2 exhibits a
change in electrical resistance of only 2 (500 x 10-6
) = 0.1%. For a 120 Ω gage, this is a change of only
0.12 Ω.
To measure such small changes in resistance, strain gage configurations are based on the concept
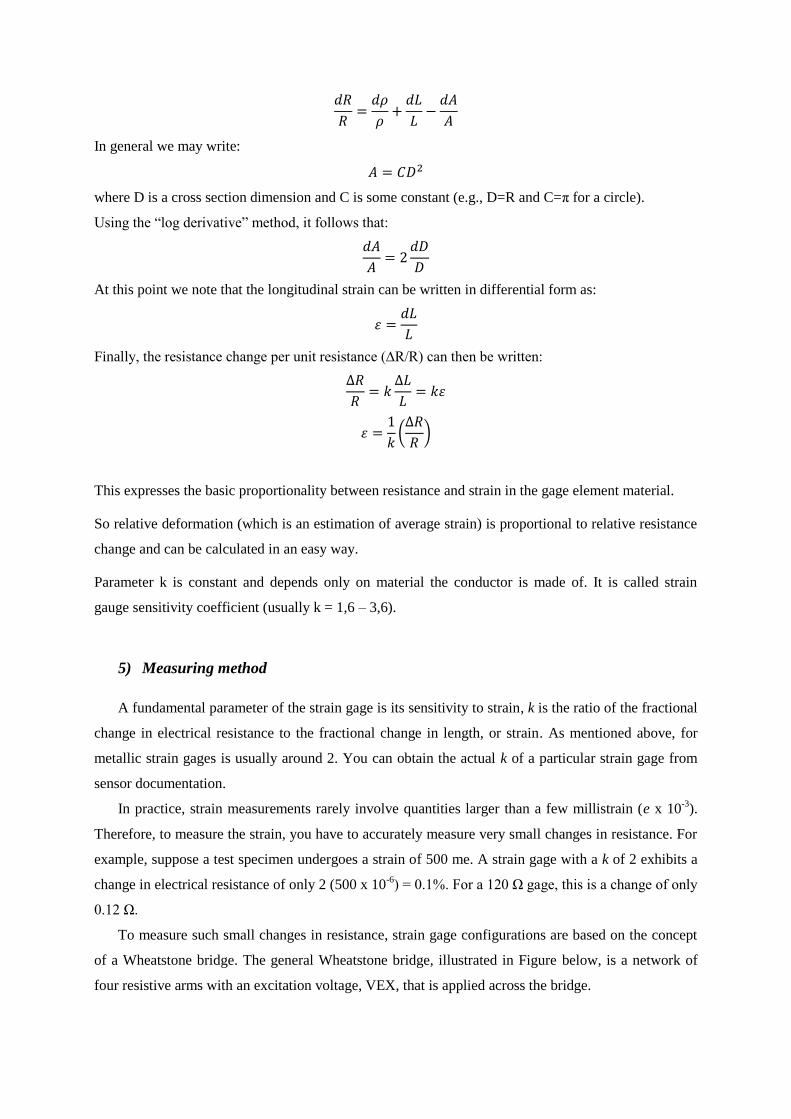
of a Wheatstone bridge. The general Wheatstone bridge, illustrated in Figure below, is a network of
four resistive arms with an excitation voltage, VEX, that is applied across the bridge.
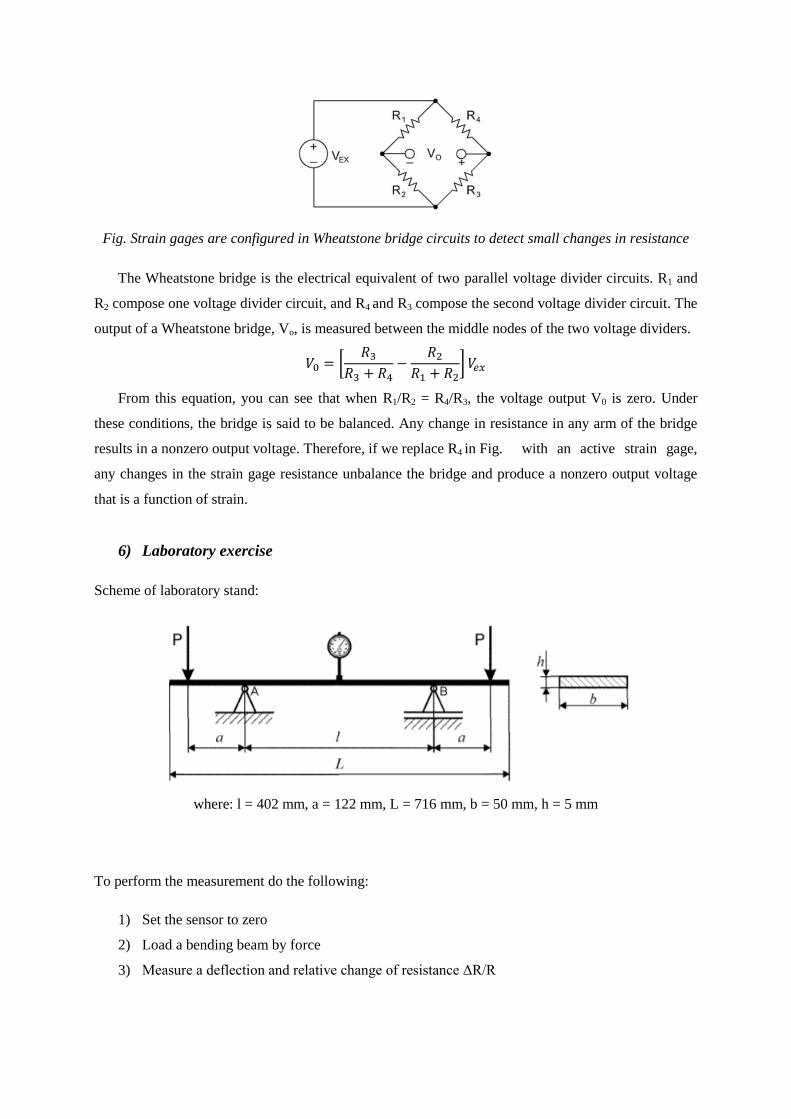
Fig. Strain gages are configured in Wheatstone bridge circuits to detect small changes in resistance
The Wheatstone bridge is the electrical equivalent of two parallel voltage divider circuits. R1 and
R2 compose one voltage divider circuit, and R4 and R3 compose the second voltage divider circuit. The
output of a Wheatstone bridge, Vo, is measured between the middle nodes of the two voltage dividers.
𝑉0 = [𝑅3
𝑅3 + 𝑅4−
𝑅2𝑅1 + 𝑅2
] 𝑉𝑒𝑥
From this equation, you can see that when R1/R2 = R4/R3, the voltage output V0 is zero. Under
these conditions, the bridge is said to be balanced. Any change in resistance in any arm of the bridge
results in a nonzero output voltage. Therefore, if we replace R4 in Fig. with an active strain gage,
any changes in the strain gage resistance unbalance the bridge and produce a nonzero output voltage
that is a function of strain.
6) Laboratory exercise
Scheme of laboratory stand:
where: l = 402 mm, a = 122 mm, L = 716 mm, b = 50 mm, h = 5 mm
To perform the measurement do the following:
1) Set the sensor to zero
2) Load a bending beam by force
3) Measure a deflection and relative change of resistance ΔR/R
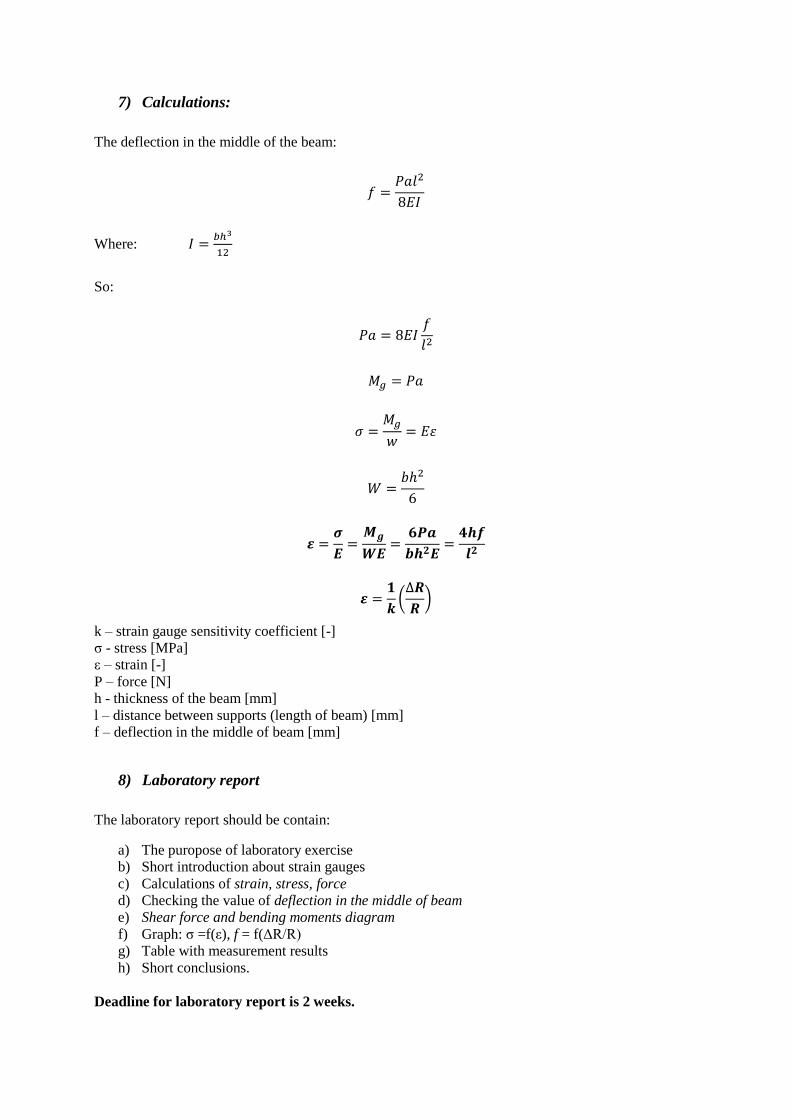
7) Calculations:
The deflection in the middle of the beam:
𝑓 =𝑃𝑎𝑙2
8𝐸𝐼
Where: 𝐼 =𝑏ℎ3
12
So:
𝑃𝑎 = 8𝐸𝐼𝑓
𝑙2
𝑀𝑔 = 𝑃𝑎
𝜎 =𝑀𝑔
𝑤= 𝐸𝜀
𝑊 =𝑏ℎ2
6
𝜺 =𝝈
𝑬=𝑴𝒈
𝑾𝑬=
𝟔𝑷𝒂
𝒃𝒉𝟐𝑬=𝟒𝒉𝒇
𝒍𝟐
𝜺 =𝟏
𝒌(∆𝑹
𝑹)
k – strain gauge sensitivity coefficient [-]
σ - stress [MPa]
ε – strain [-]
P – force [N]
h - thickness of the beam [mm]
l – distance between supports (length of beam) [mm]
f – deflection in the middle of beam [mm]
8) Laboratory report
The laboratory report should be contain:
a) The puropose of laboratory exercise
b) Short introduction about strain gauges
c) Calculations of strain, stress, force
d) Checking the value of deflection in the middle of beam
e) Shear force and bending moments diagram
f) Graph: σ =f(ε), f = f(ΔR/R)
g) Table with measurement results
h) Short conclusions.
Deadline for laboratory report is 2 weeks.

Section A
Date: Name Surname
No.
measurment
deflection
f [mm]
(ΔR/R)
[mV/V] ε [-] σ [MPa] P [N]
1 0,25
2 0,50
3 0,75
4 1,00
5 1,25
6 1,50
7 1,75
8 2,00
9 2,25
10 2,50
11 2,50
12 2,25
13 2,00
14 1,75
15 1,50
16 1,25
17 1,00
18 0,75
19 0,50
20 0,25
21 0,00

Section B
Date: Name Surname
No.
measurment
deflection
f [mm]
(ΔR/R)
[mV/V] ε [-] σ [MPa] P [N]
1 0,30
2 0,60
3 0,90
4 1,20
5 1,50
6 1,80
7 2,10
8 2,40
9 2,70
10 3,00
11 2,70
12 2,40
13 2,10
14 1,80
15 1,50
16 1,20
17 0,90
18 0,60
19 0,30
20 0,00
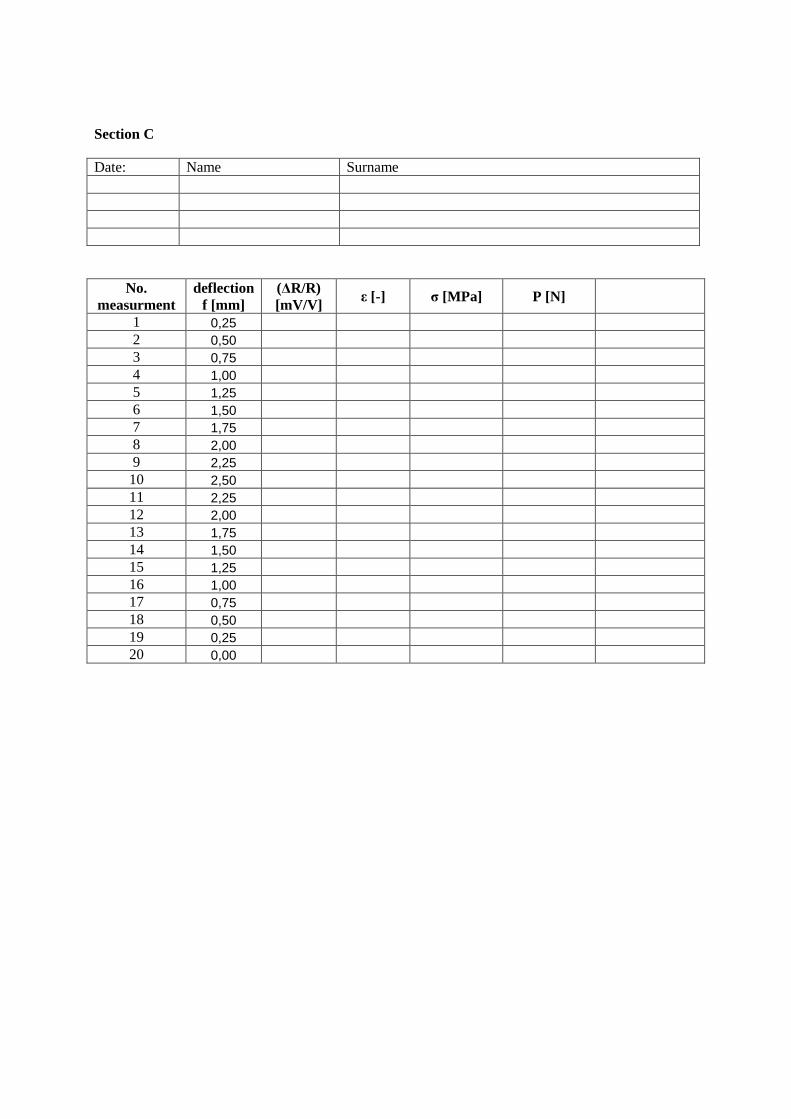
Section C
Date: Name Surname
No.
measurment
deflection
f [mm]
(ΔR/R)
[mV/V] ε [-] σ [MPa] P [N]
1 0,25
2 0,50
3 0,75
4 1,00
5 1,25
6 1,50
7 1,75
8 2,00
9 2,25
10 2,50
11 2,25
12 2,00
13 1,75
14 1,50
15 1,25
16 1,00
17 0,75
18 0,50
19 0,25
20 0,00

Section D
Date: Name Surname
No.
measurment
deflection
f [mm]
(ΔR/R)
[mV/V] ε [-] σ [MPa] P [N]
1 0,20
2 0,40
3 0,60
4 0,80
5 1,00
6 1,20
7 1,40
8 1,60
9 1,80
10 2,00
11 1,80
12 1,60
13 1,40
14 1,20
15 1,00
16 0.80
17 0,60
18 0,40
19 0,20
20 0,00

Section E
Date: Name Surname
No.
measurment
deflection
f [mm]
(ΔR/R)
[mV/V] ε [-] σ [MPa] P [N]
1 0,15
2 0,30
3 0,45
4 0,60
5 0,75
6 0,90
7 1,05
8 1,20
9 1,35
10 1,50
11 1,35
12 1,20
13 1,05
14 0,90
15 0.75
16 0.60
17 0,45
18 0,30
19 0,15
20 0,00

Section F
Date: Name Surname
No.
measurment
deflection
f [mm]
(ΔR/R)
[mV/V] ε [-] σ [MPa] P [N]
1 0,22
2 0,44
3 0,66
4 0,88
5 1,10
6 1,32
7 1,54
8 1,76
9 1,98
10 2,20
11 1,98
12 1,76
13 1,54
14 1,32
15 1,10
16 0.88
17 0,66
18 0,44
19 0,22
20 0,00