Embed Size (px)
Citation preview
INTEGRATED 3D SEISMIC DATA
INTERPRETATION WORKFLOWS
Ken Abdulah and Cl ƴemence Prazuck
URTeC 2018
July 23-25, 2018
Introduction
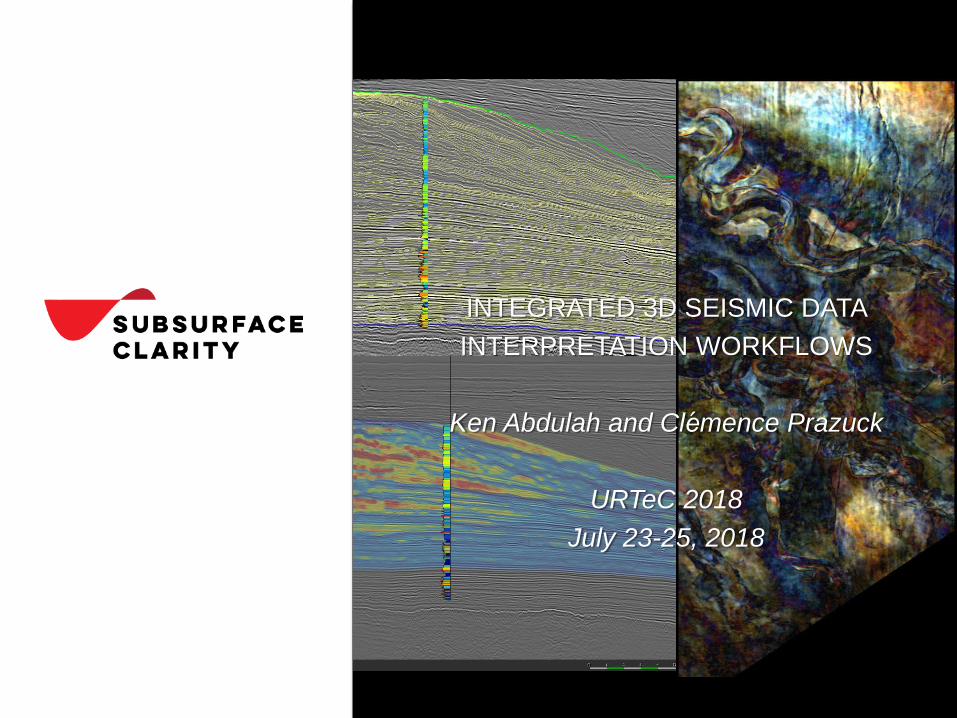
❑ As interpreters, we are often tasked with predicting rapid changes in lithology and reservoir properties across stratigraphically complex basins and their sub-basins.
❑ Our presentation steps through workflows focused on delivering integrated interpretation products in greatly reduced cycle time.
▪ Lithostratigraphy▪ Chronostratigraphy▪ Seismic stratigraphy▪ Sequence stratigraphy
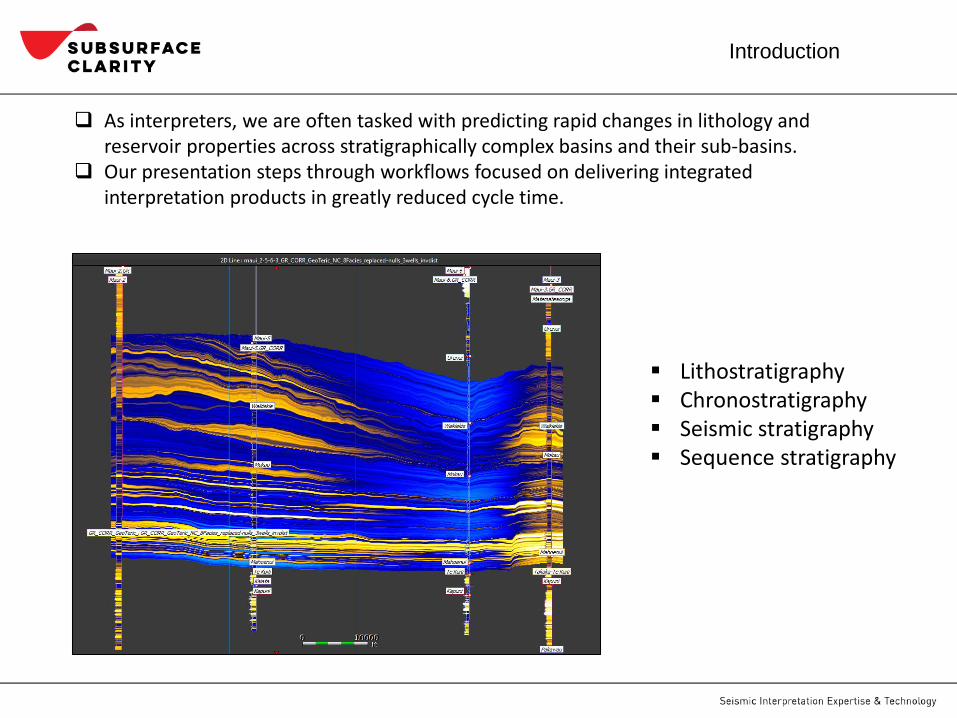
Study Area - Offshore New Zealand
Basement structure map of the Taranaki Basinfrom Yagci, 2016
Plate setting and location map from Yagci, 2016 (after Stogen et al., 2012)
Generalized stratigraphic columnfrom Haque et al., 2016
Project Description
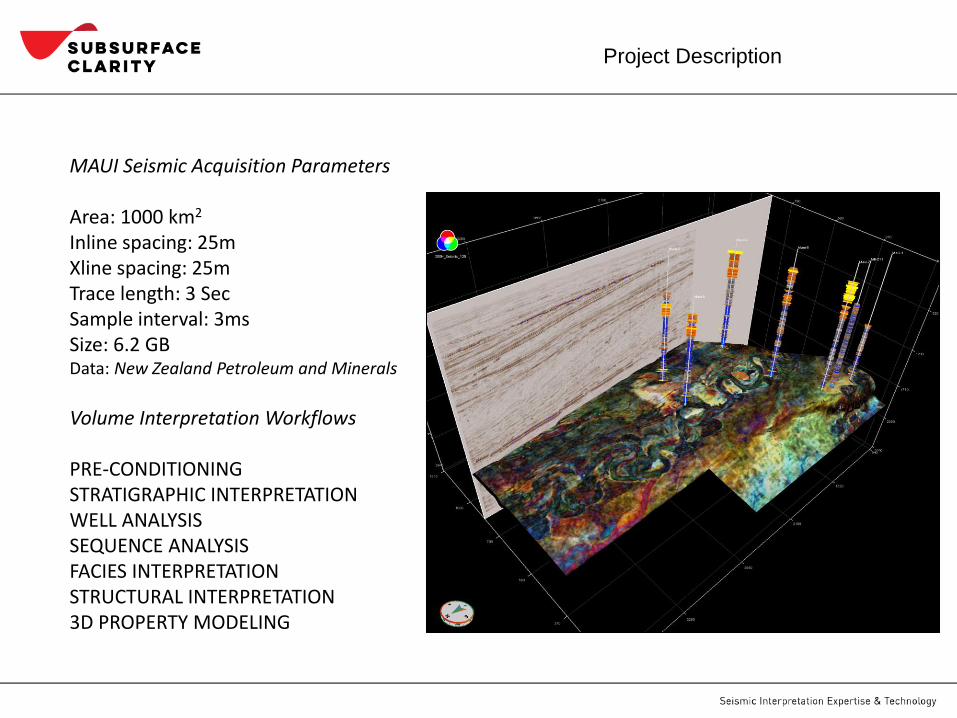
MAUI Seismic Acquisition Parameters
Area: 1000 km2
Inline spacing: 25mXline spacing: 25mTrace length: 3 SecSample interval: 3msSize: 6.2 GBData: New Zealand Petroleum and Minerals
Volume Interpretation Workflows
PRE-CONDITIONINGSTRATIGRAPHIC INTERPRETATIONWELL ANALYSISSEQUENCE ANALYSISFACIES INTERPRETATIONSTRUCTURAL INTERPRETATION3D PROPERTY MODELING
Post-stack Data Conditioning
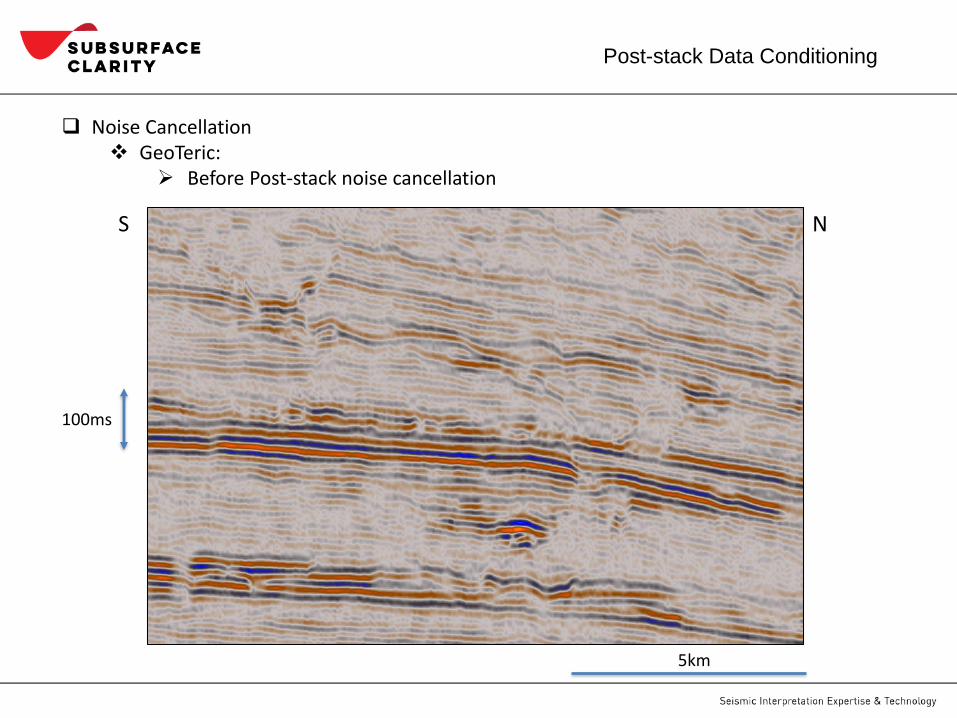
❑ Noise Cancellation❖ GeoTeric:
➢ Before Post-stack noise cancellation
100ms
5km
S N
Post-stack Data Conditioning
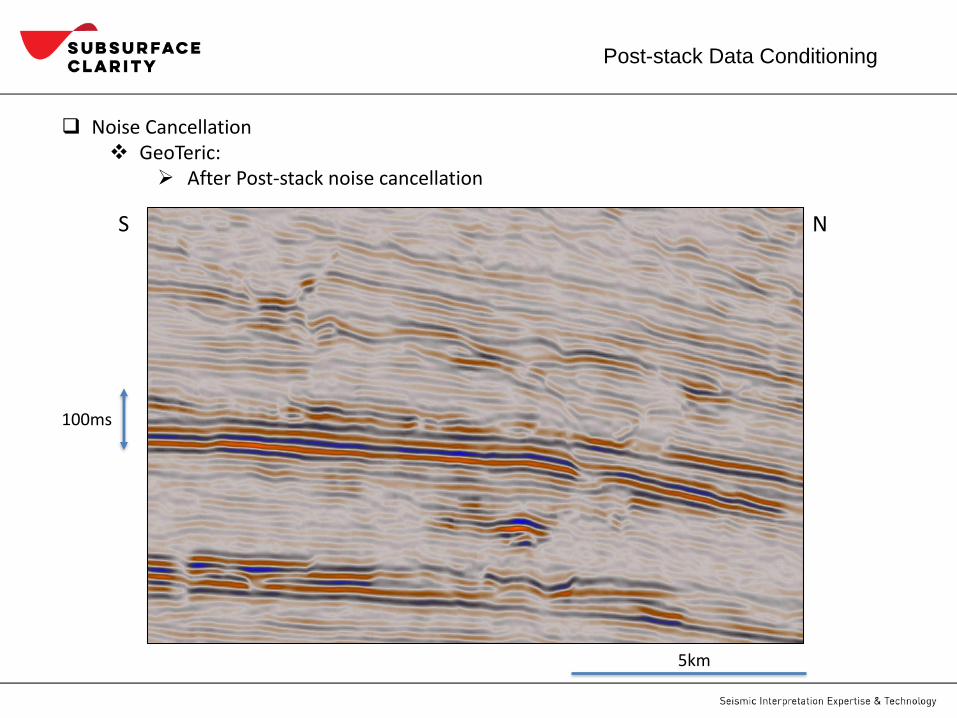
100ms
5km
S N
❑ Noise Cancellation❖ GeoTeric:
➢ After Post-stack noise cancellation
Post-stack Data Conditioning
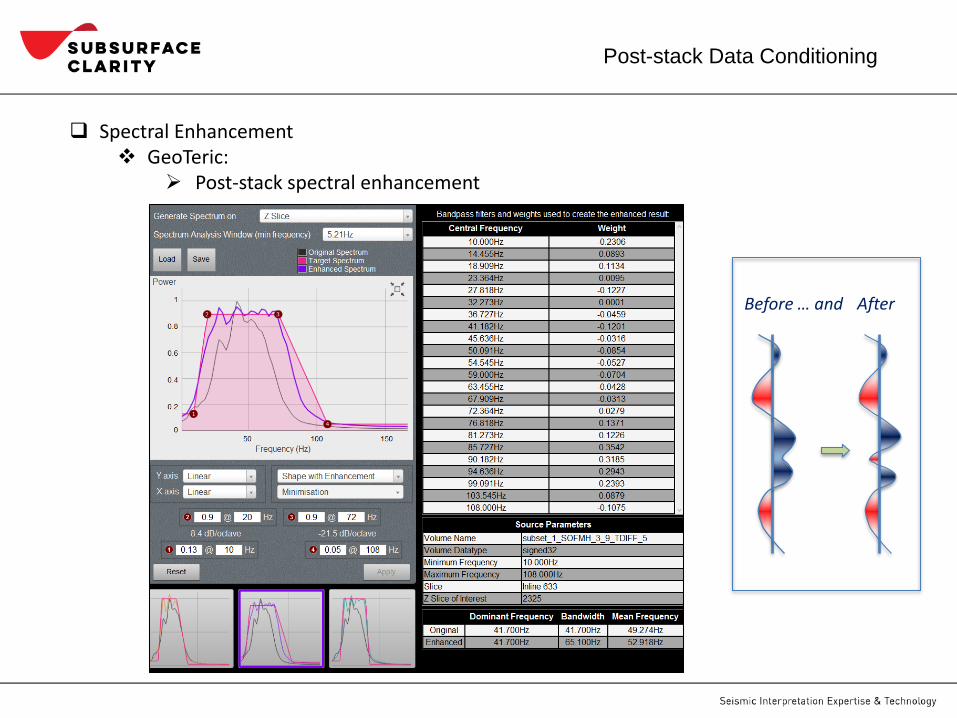
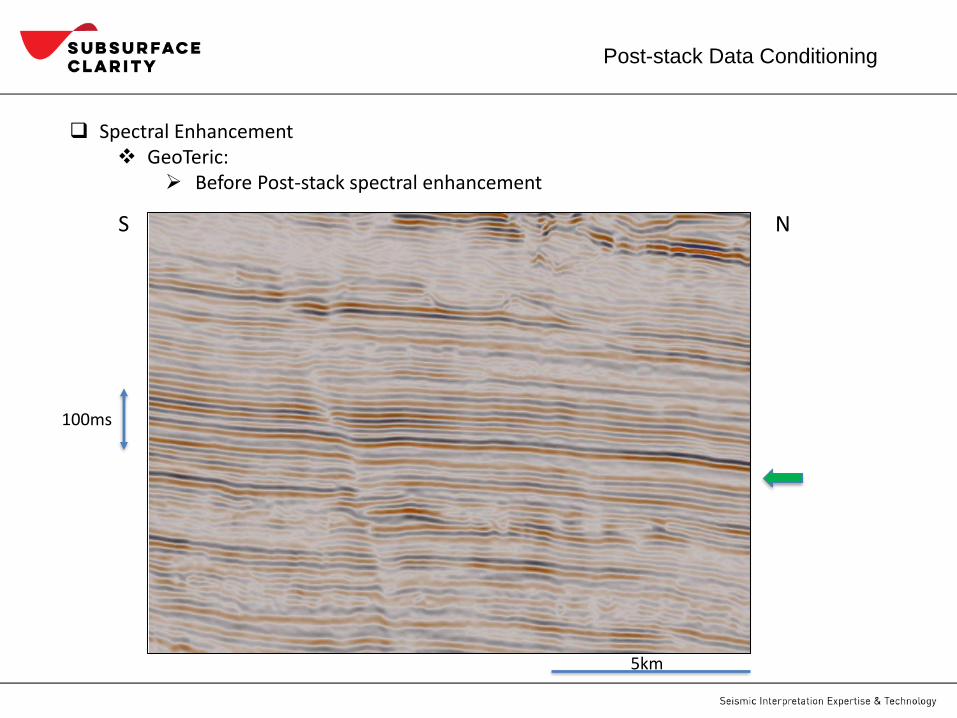
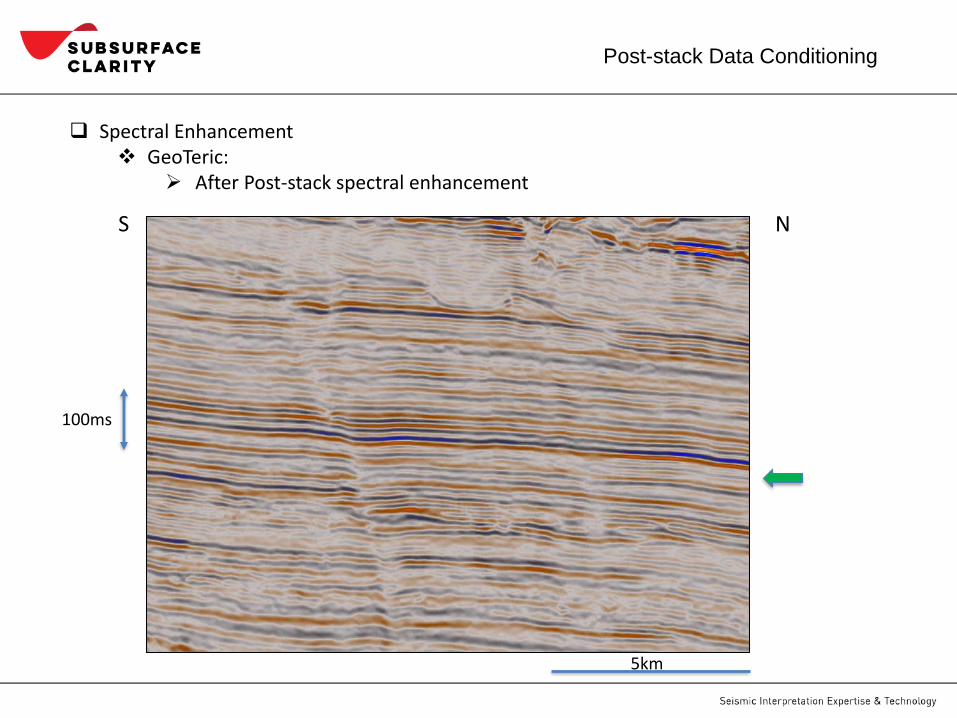
❑ Spectral Enhancement❖ GeoTeric:
➢ Post-stack spectral enhancement
Before … and After
Post-stack Data Conditioning
100ms
5km
S N
❑ Spectral Enhancement❖ GeoTeric:
➢ Before Post-stack spectral enhancement
Post-stack Data Conditioning
100ms
5km
S N
❑ Spectral Enhancement❖ GeoTeric:
➢ After Post-stack spectral enhancement
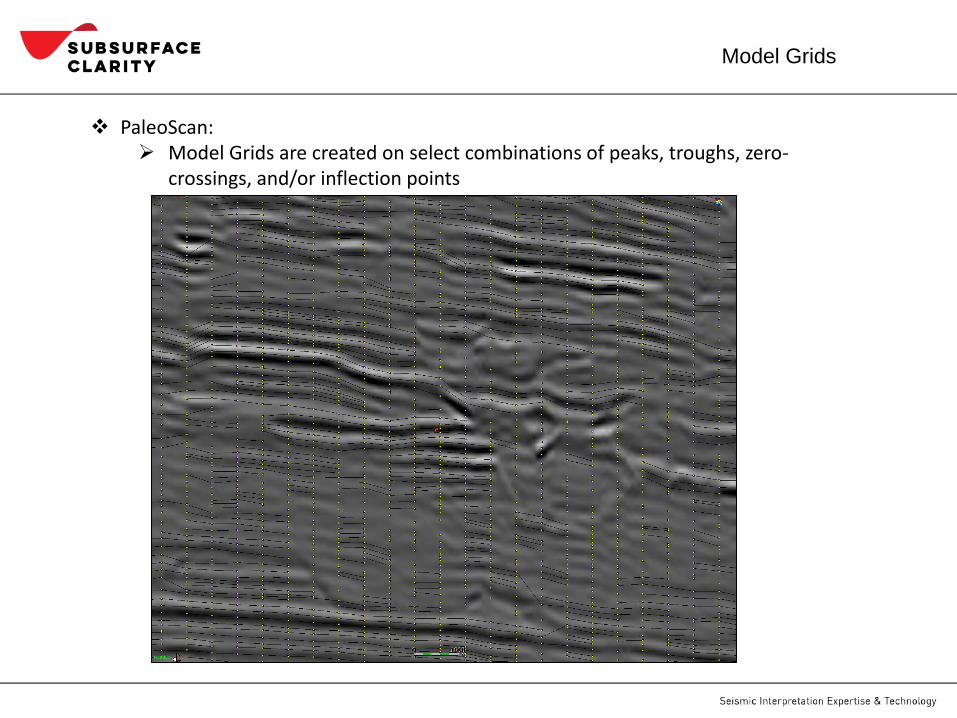
Model Grids
❖ PaleoScan: ➢ Model Grids are created on select combinations of peaks, troughs, zero-
crossings, and/or inflection points
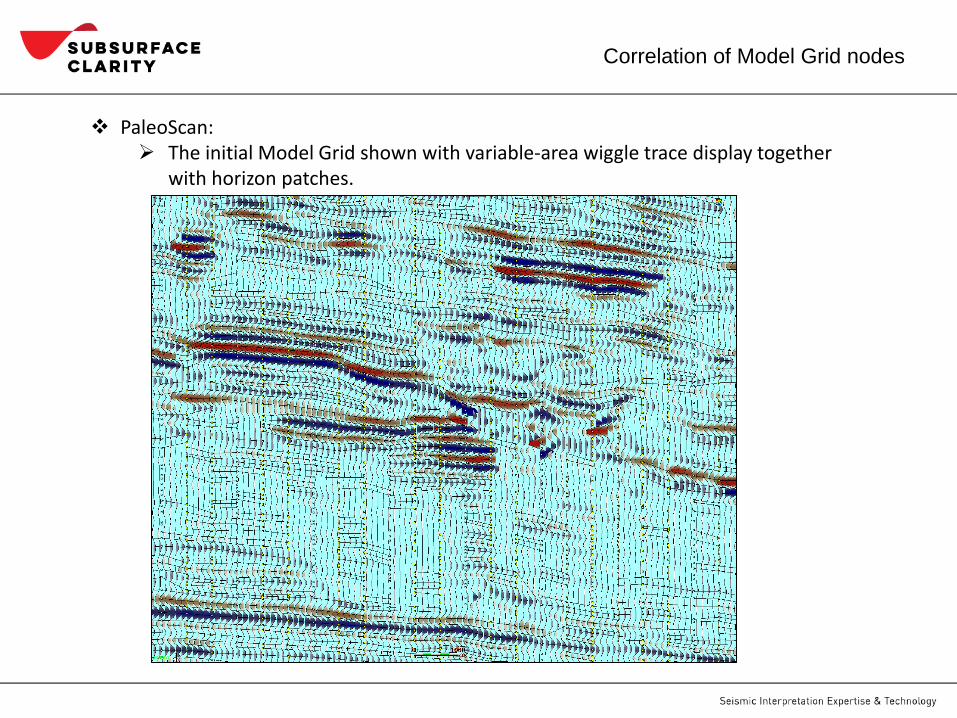
Correlation of Model Grid nodes
❖ PaleoScan: ➢ The initial Model Grid shown with variable-area wiggle trace display together
with horizon patches.
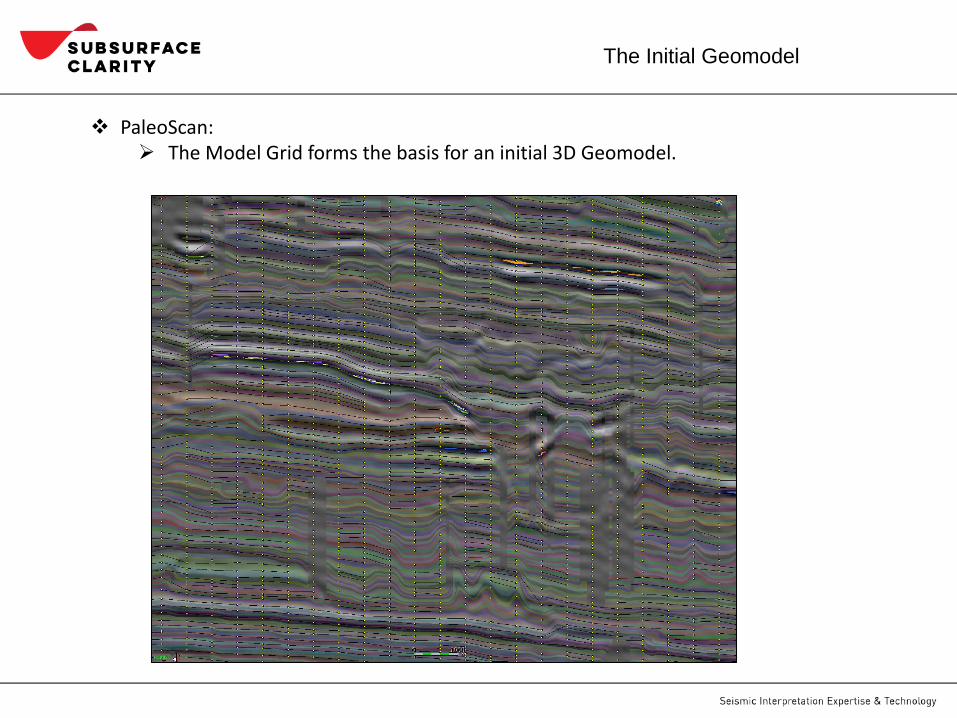
The Initial Geomodel
❖ PaleoScan: ➢ The Model Grid forms the basis for an initial 3D Geomodel.
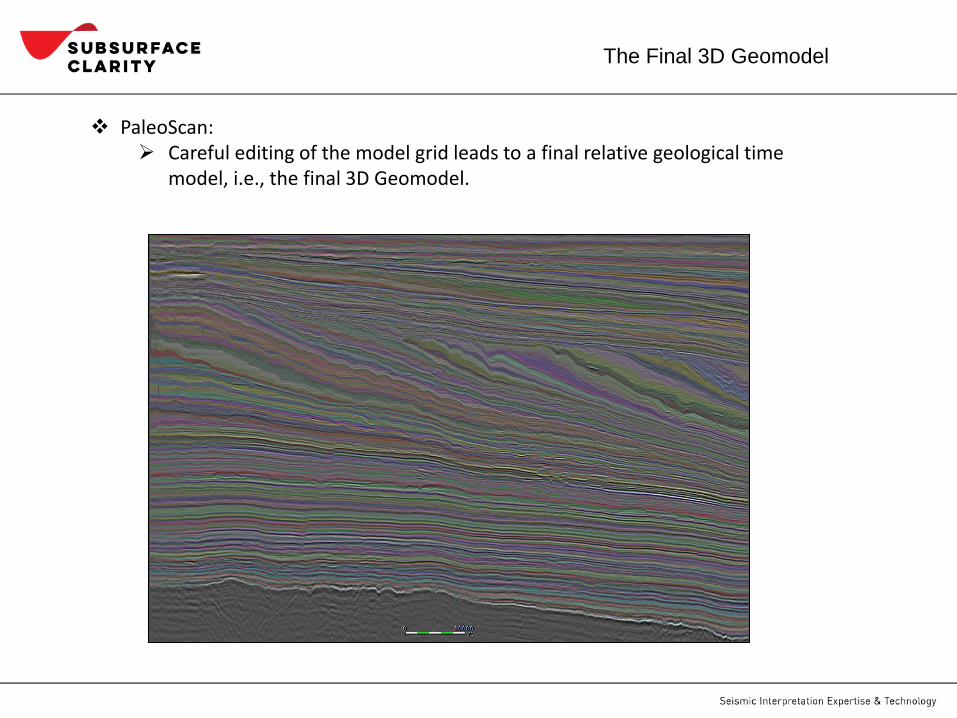
The Final 3D Geomodel
❖ PaleoScan: ➢ Careful editing of the model grid leads to a final relative geological time
model, i.e., the final 3D Geomodel.
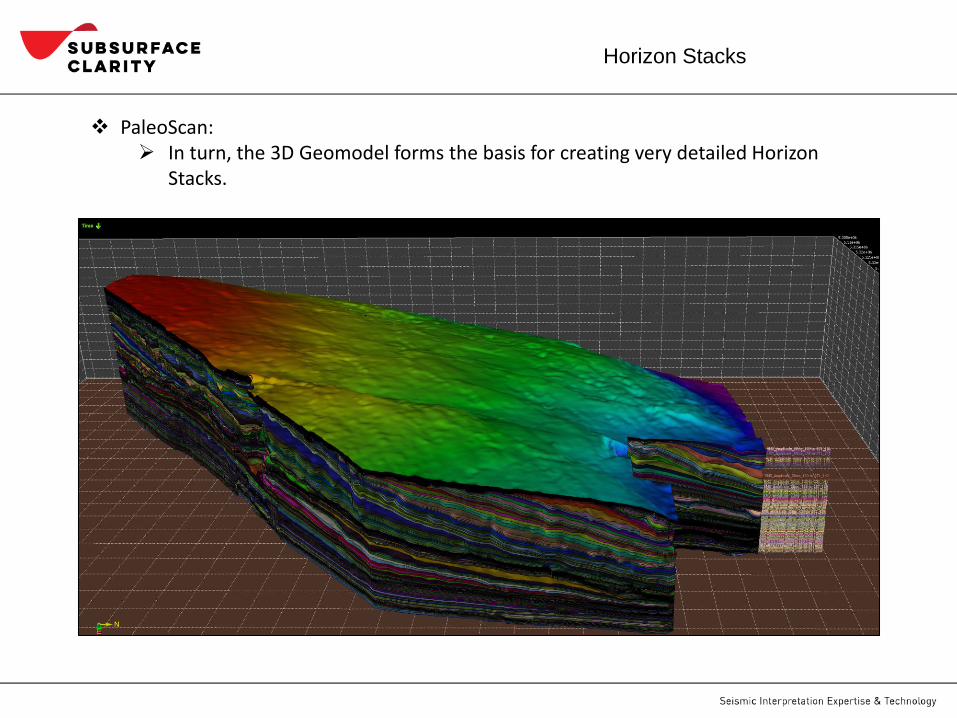
Horizon Stacks
❖ PaleoScan: ➢ In turn, the 3D Geomodel forms the basis for creating very detailed Horizon
Stacks.
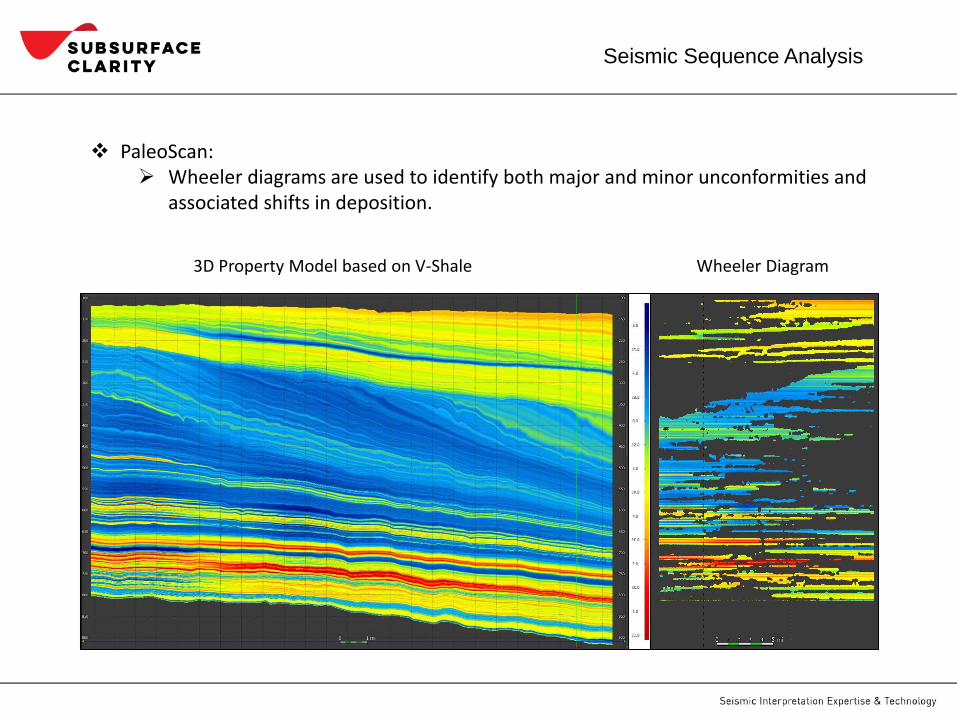
Seismic Sequence Analysis
❖ PaleoScan: ➢ Wheeler diagrams are used to identify both major and minor unconformities and
associated shifts in deposition.
3D Property Model based on V-Shale Wheeler Diagram
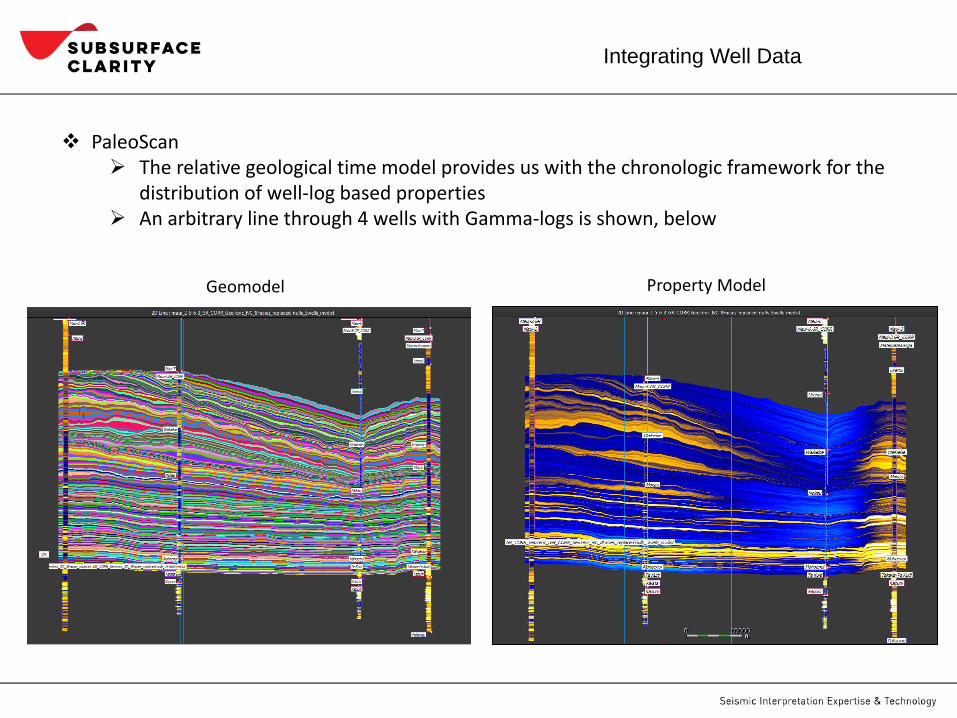
Integrating Well Data
❖ PaleoScan➢ The relative geological time model provides us with the chronologic framework for the
distribution of well-log based properties➢ An arbitrary line through 4 wells with Gamma-logs is shown, below
Geomodel Property Model
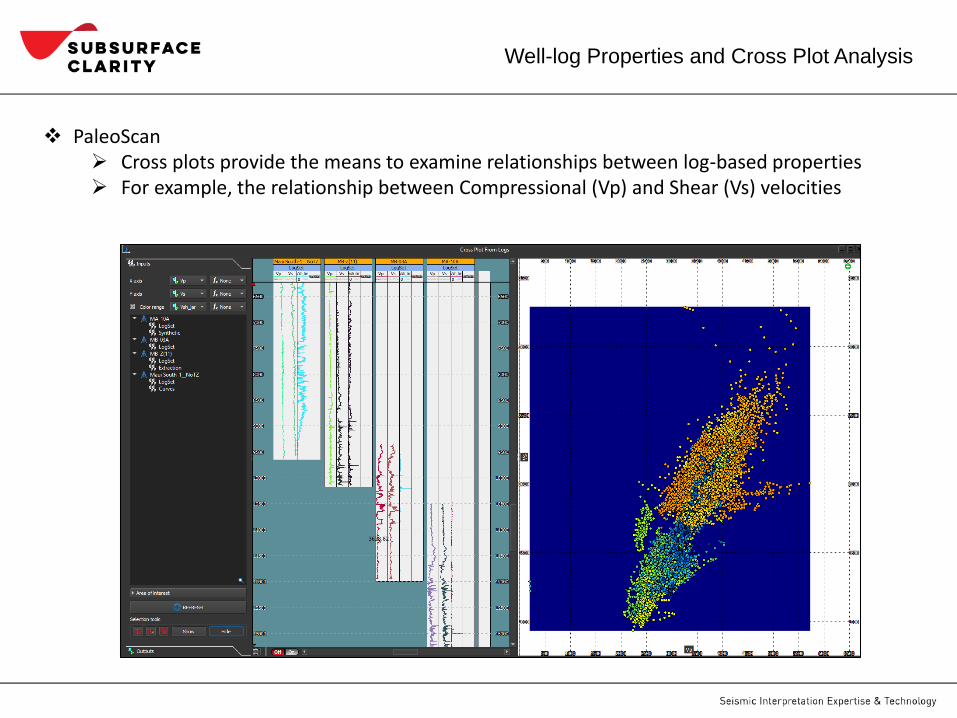
Well-log Properties and Cross Plot Analysis
❖ PaleoScan➢ Cross plots provide the means to examine relationships between log-based properties➢ For example, the relationship between Compressional (Vp) and Shear (Vs) velocities
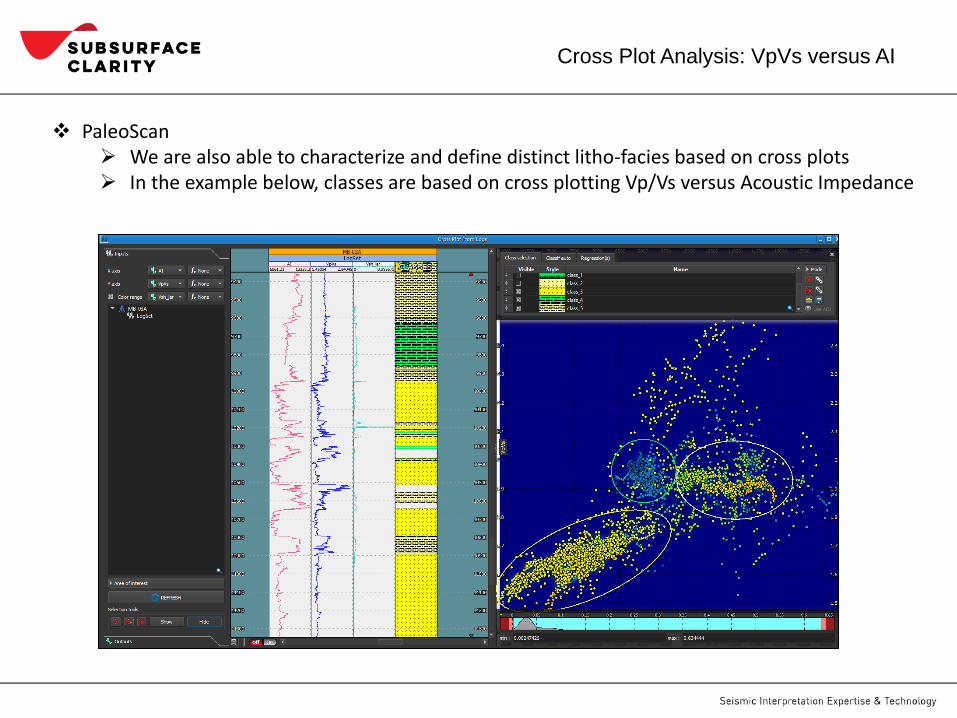
Cross Plot Analysis: VpVs versus AI
❖ PaleoScan➢ We are also able to characterize and define distinct litho-facies based on cross plots ➢ In the example below, classes are based on cross plotting Vp/Vs versus Acoustic Impedance
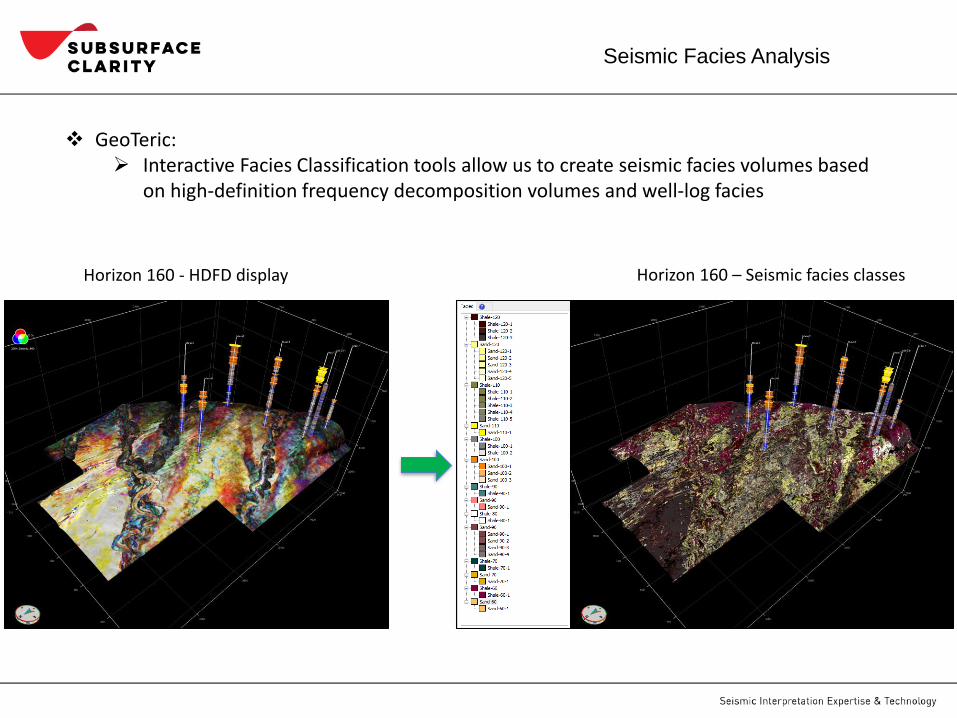
Seismic Facies Analysis
❖ GeoTeric: ➢ Interactive Facies Classification tools allow us to create seismic facies volumes based
on high-definition frequency decomposition volumes and well-log facies
Horizon 160 - HDFD display Horizon 160 – Seismic facies classes
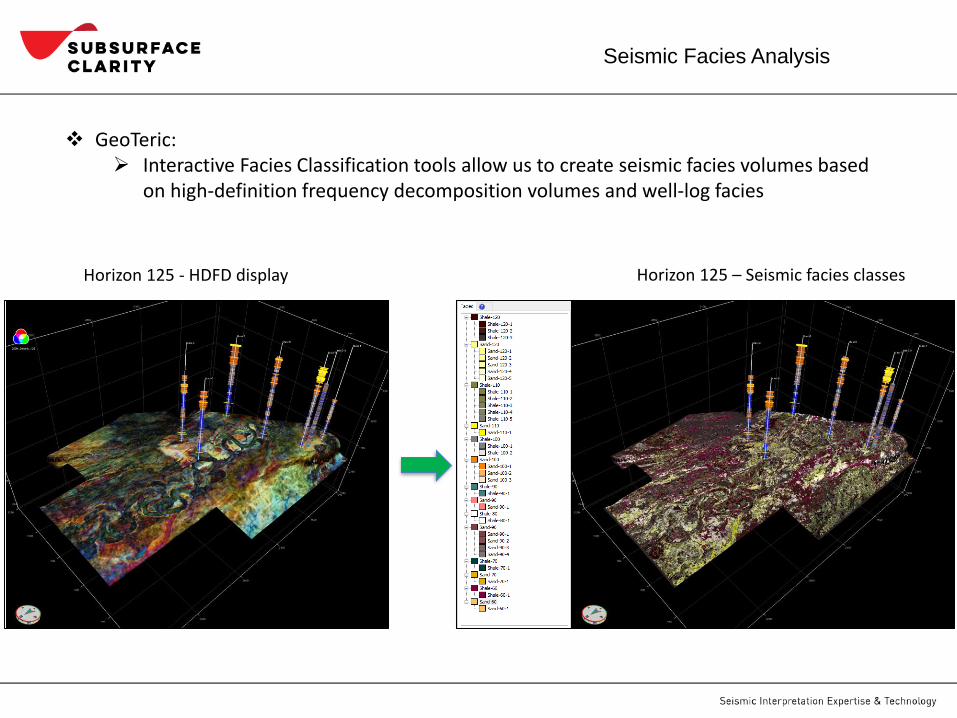
Seismic Facies Analysis
Horizon 125 - HDFD display Horizon 125 – Seismic facies classes
❖ GeoTeric: ➢ Interactive Facies Classification tools allow us to create seismic facies volumes based
on high-definition frequency decomposition volumes and well-log facies
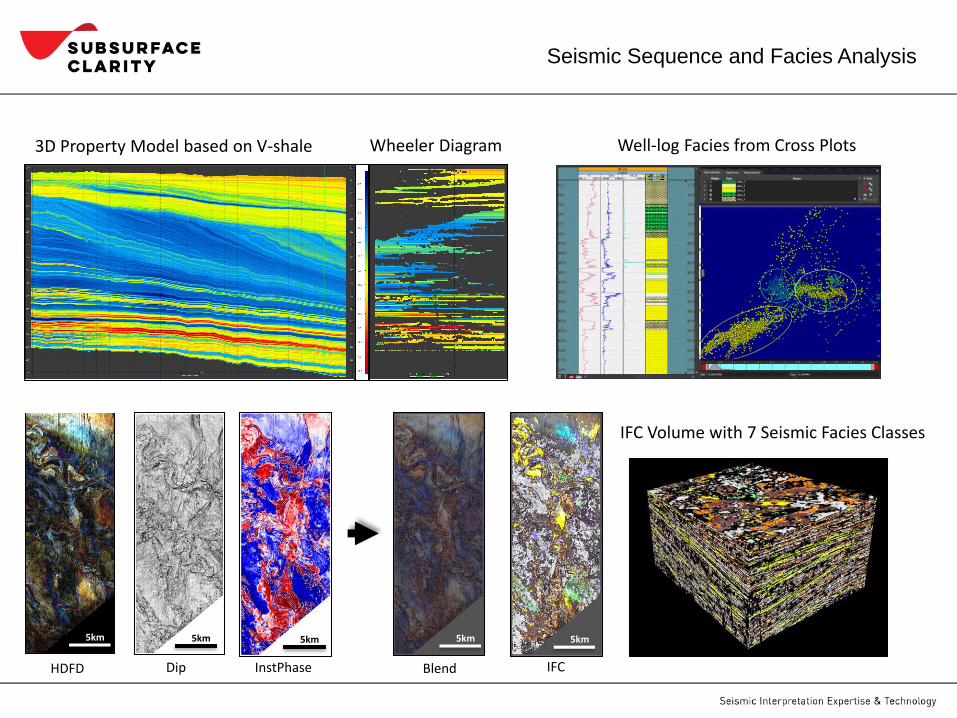
Seismic Sequence and Facies Analysis
HDFD Dip InstPhase Blend
5km5km 5km 5km
IFC
IFC Volume with 7 Seismic Facies Classes
5km
3D Property Model based on V-shale Wheeler Diagram Well-log Facies from Cross Plots
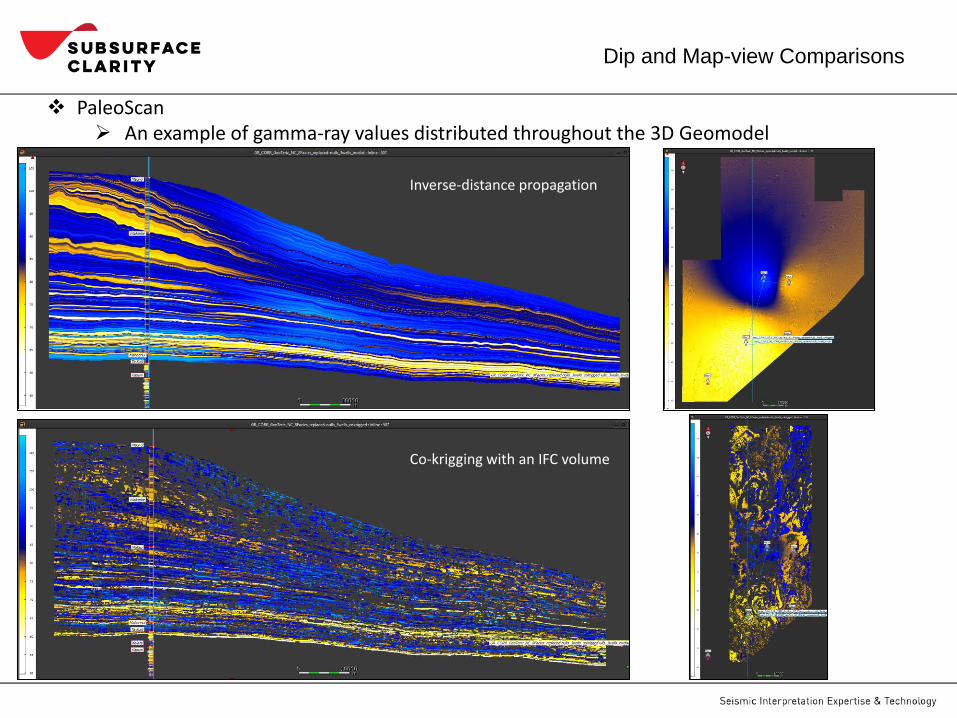
Dip and Map-view Comparisons
Inverse-distance propagation
Co-krigging with an IFC volume
❖ PaleoScan➢ An example of gamma-ray values distributed throughout the 3D Geomodel
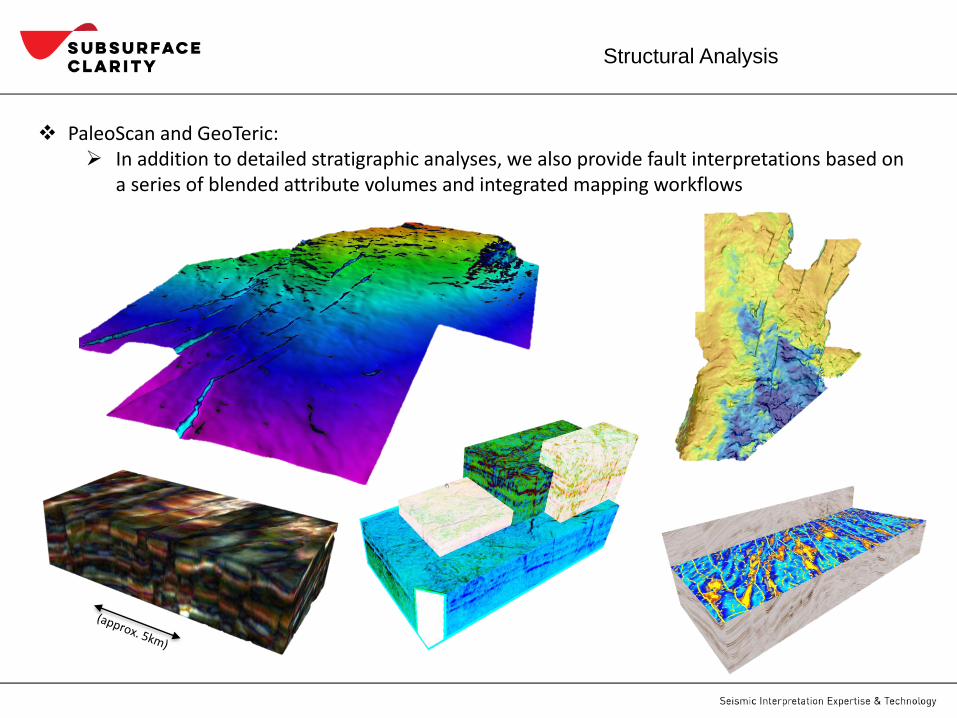
Structural Analysis
❖ PaleoScan and GeoTeric: ➢ In addition to detailed stratigraphic analyses, we also provide fault interpretations based on
a series of blended attribute volumes and integrated mapping workflows
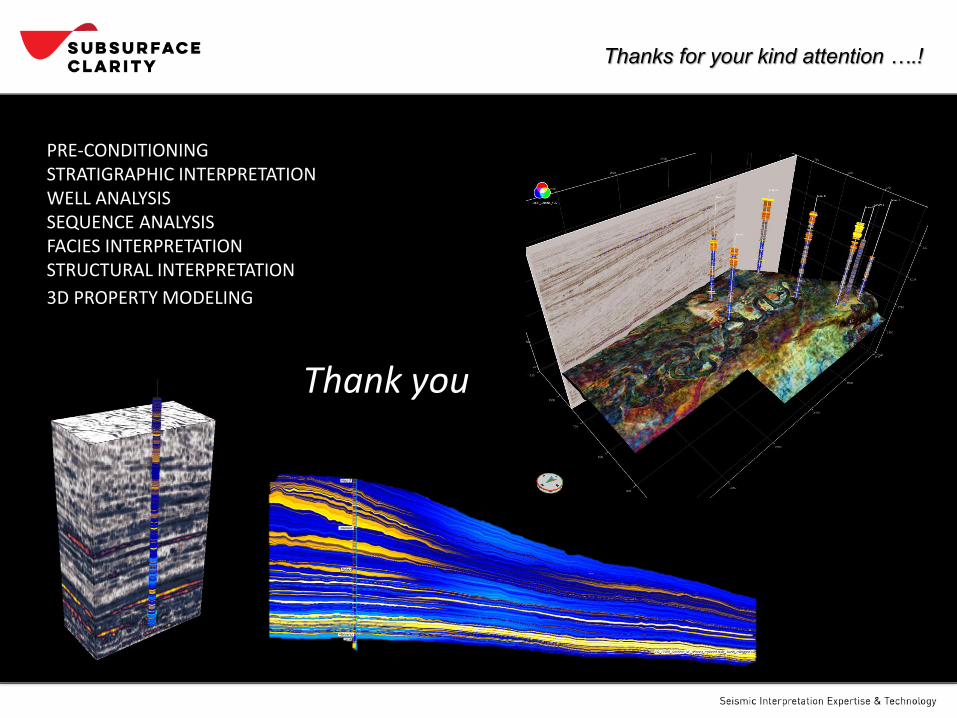
Thanks for your kind attention ….!
Thank you
PRE-CONDITIONINGSTRATIGRAPHIC INTERPRETATIONWELL ANALYSISSEQUENCE ANALYSISFACIES INTERPRETATIONSTRUCTURAL INTERPRETATION
3D PROPERTY MODELING