Embed Size (px)
Citation preview
®
• 2300 East 14 Street • Tulsa, OK 74104 • USA • +1 (918) 749-1119 • •
StatSoft White Paper
Integration Options and Features
to Leverage Specialized R Functionality
in STATISTICA and STATISTICA Enterprise Server
Solutions
Contents at a Glance
Introduction ................................................................................................................................................ 3
Overview and Summary .............................................................................................................................. 5
Basic Architecture and Features of R Support in STATISTICA ..................................................................... 9
R Language Extensions: Passing Data to R and Retrieving Results ........................................................... 15
Executing R Scripts from within STATISTICA Visual Basic ......................................................................... 19
R Support in STATISTICA Enterprise Server ............................................................................................... 23
Creating R-based STATISTICA Workspace Nodes ...................................................................................... 27
Integrating R into STATISTICA Enterprise and STATISTICA Enterprise Server ........................................... 28
Final Comments, and Some Caveats ......................................................................................................... 31
• 2300 East 14 Street • Tulsa, OK 74104 • USA • +1 (918) 749-1119 • •
Integration of R Statistical Environment with STATISTICA Solutions January 2014
StatSoft White Paper Page 2 of 31
Table of Contents
Introduction ................................................................................................................................................ 3
Overview and Summary .............................................................................................................................. 5
Basic Architecture and Features of R Support in STATISTICA ..................................................................... 9
COM Interface to R Environment ......................................................................................................... 10
R Integration Support Macros (R.svb / R.r) .......................................................................................... 11
R Scripts as Native STATISTICA Macros ................................................................................................. 11
Retrieving Results ................................................................................................................................. 12
Unique STATISTICA Capabilities ........................................................................................................ 14
R Language Extensions: Passing Data to R and Retrieving Results ........................................................... 15
ActiveDataSet ........................................................................................................................................ 15
Spreadsheet(FilePathOrName) ............................................................................................................. 15
RouteOutput(RObject,[SpreadsheetName],[SpreadsheetHeader]) ..................................................... 17
Uses(RPackageName,[AttachImports]) ................................................................................................ 18
Executing R Scripts from within STATISTICA Visual Basic ......................................................................... 19
R Scripts are STATISTICA Macros .......................................................................................................... 19
Passing Parameters to R Scripts: Collection Object .............................................................................. 20
Managing Script Results ........................................................................................................................ 22
More Examples ..................................................................................................................................... 23
R Support in STATISTICA Enterprise Server ............................................................................................... 23
STATISTICA Enterprise Server is a Powerful R Server ............................................................................ 25
Off-Loading R Scripts from STATISTICA to STATISTICA Enterprise Server ............................................. 25
Creating R-based STATISTICA Data Miner Nodes ..................................................................................... 27
Integrating R into STATISTICA Enterprise and STATISTICA Enterprise Server ........................................... 28
Creating R-based Analysis Configurations ............................................................................................ 28
Calling R Scripts from SVB Analysis Configurations .............................................................................. 30
Summary ............................................................................................................................................... 30
Final Comments, and Some Caveats ......................................................................................................... 31
Error Handling ....................................................................................................................................... 31
Strengths and Limitations ..................................................................................................................... 31
• 2300 East 14 Street • Tulsa, OK 74104 • USA • +1 (918) 749-1119 • •
Integration of R Statistical Environment with STATISTICA Solutions January 2014
StatSoft White Paper Page 3 of 31
Introduction
R is a programming language and environment for statistical computing (www.r-project.org). Most of the R environment and its source code are currently available under the GNU GPL license (www.r-project.org/licenses). Note that none of the components of the R environment constitute “unrestricted freeware”; instead they are available only under the terms of specific licenses that the users who intend to download those applications need to accept prior to downloading and with which they need to comply. Also, those licenses can change over time and, therefore, users are cautioned to thoroughly familiarize themselves with the terms every time they download any components of the R environment.
STATISTICA can interface with third-party applications (such as Microsoft Office) through certain standards-compliant channels, notably COM, which is an interface for interprocess communication built into Microsoft operating systems.
Even though R itself does not provide a COM interface, StatSoft has created a separate connector application, COMadaptR, licensed under LGPL (>=2.1) (with parts under GPL2) which facilitates communication to the R world. (This package is based on GPL2/LGPL2 version of an earlier application, the statconnDCOM library.)
STATISTICA can interface with R via COMadaptR and (if this library is installed on the system) provides the means for users to open R scripts and submit them for execution to R from within the STATISTICA environment, facilitating bidirectional data transfer and presentation of resulting outputs through a user-adjustable macro that is executed in STATISTICA in place of the R script.
This interface makes it possible for all STATISTICA products, ranging from Desktop to Enterprise and Web solutions, to provide comprehensive support for interaction with the R platform (on systems where necessary third-party components and libraries are present), giving users a way to:
run R scripts within the STATISTICA environment, sending results to STATISTICA Reports, Workbooks, and Graphs
process STATISTICA data sets in R and import tabular results from R into STATISTICA Spreadsheets
call R from STATISTICA Visual Basic (SVB) to create new functionality that leverages R libraries
utilize R in STATISTICA Enterprise, STATISTICA Server, and STATISTICA Workspace
Note: It is the user's responsibility to ensure compliance with terms of all applicable licenses for R and all components of the R environment. Always carefully review all the license agreements before accepting them as they can change over time. Please note that those products are external to the STATISTICA environment, and they are not covered by any StatSoft license agreements.
• 2300 East 14 Street • Tulsa, OK 74104 • USA • +1 (918) 749-1119 • •
Integration of R Statistical Environment with STATISTICA Solutions January 2014
StatSoft White Paper Page 4 of 31
Automatic installation of the COMadaptR support library is included in STATISTICA Version 12.0 SP3 and above, or available with V12A maintenance update UPD008. When the system detects that an R installation is present, it will offer the user an opportunity to automatically install the COMadaptR package in the R environment. This package is included in the STATISTICA distribution.
You can verify that the COMadaptR library is installed correctly (and that all its dependencies are satisfied) by running one of the R examples that accompany STATISTICA. Once all the required third-party components are installed, you should be able to open and execute R scripts within the STATISTICA environment (on the File tab, click Open Examples and browse to the R folder).
R is highly extensible: users can submit libraries (“packages”) implementing a set of functions, usually for a specific area of their expertise/research. The R community maintains several centralized repositories that make hundreds of such packages readily available to all users over the Internet. Many of these packages cater specifically to highly specialized audiences with particular data analysis needs.
• 2300 East 14 Street • Tulsa, OK 74104 • USA • +1 (918) 749-1119 • •
Integration of R Statistical Environment with STATISTICA Solutions January 2014
StatSoft White Paper Page 5 of 31
Overview and Summary
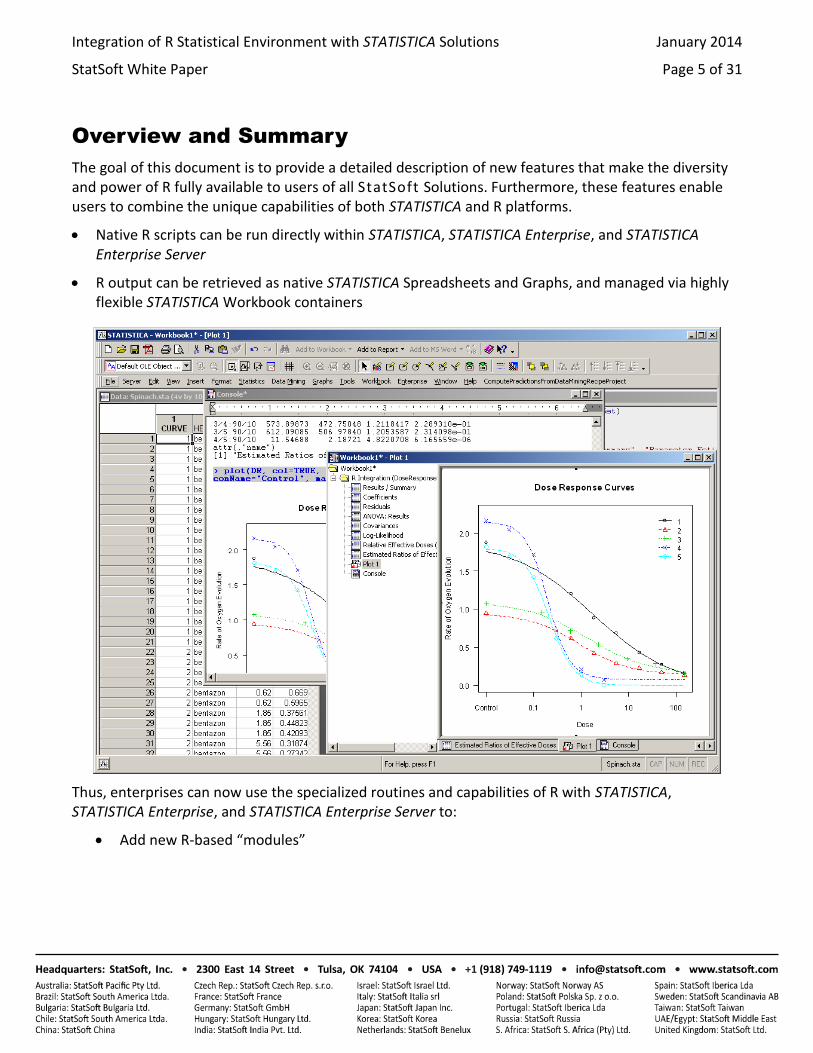
The goal of this document is to provide a detailed description of new features that make the diversity and power of R fully available to users of all StatSoft Solutions. Furthermore, these features enable users to combine the unique capabilities of both STATISTICA and R platforms.
Native R scripts can be run directly within STATISTICA, STATISTICA Enterprise, and STATISTICA Enterprise Server
R output can be retrieved as native STATISTICA Spreadsheets and Graphs, and managed via highly flexible STATISTICA Workbook containers
Thus, enterprises can now use the specialized routines and capabilities of R with STATISTICA, STATISTICA Enterprise, and STATISTICA Enterprise Server to:
Add new R-based “modules”
• 2300 East 14 Street • Tulsa, OK 74104 • USA • +1 (918) 749-1119 • •
Integration of R Statistical Environment with STATISTICA Solutions January 2014
StatSoft White Paper Page 6 of 31
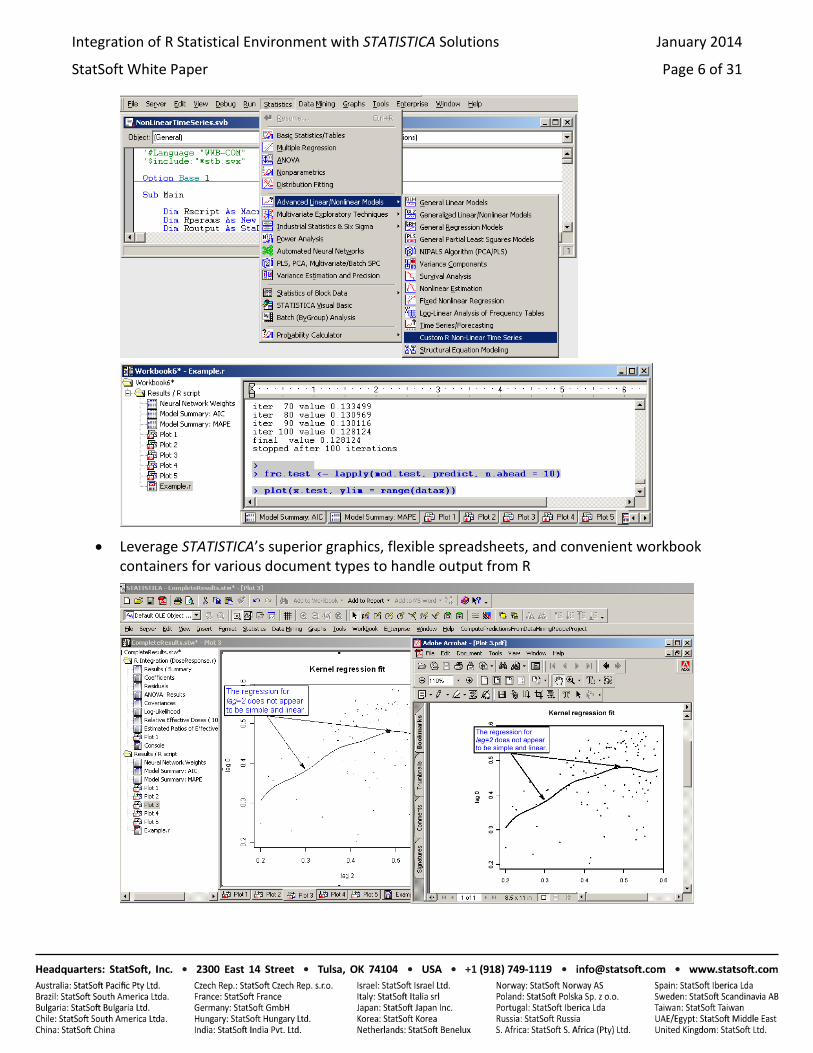
Leverage STATISTICA’s superior graphics, flexible spreadsheets, and convenient workbook containers for various document types to handle output from R
• 2300 East 14 Street • Tulsa, OK 74104 • USA • +1 (918) 749-1119 • •
Integration of R Statistical Environment with STATISTICA Solutions January 2014
StatSoft White Paper Page 7 of 31
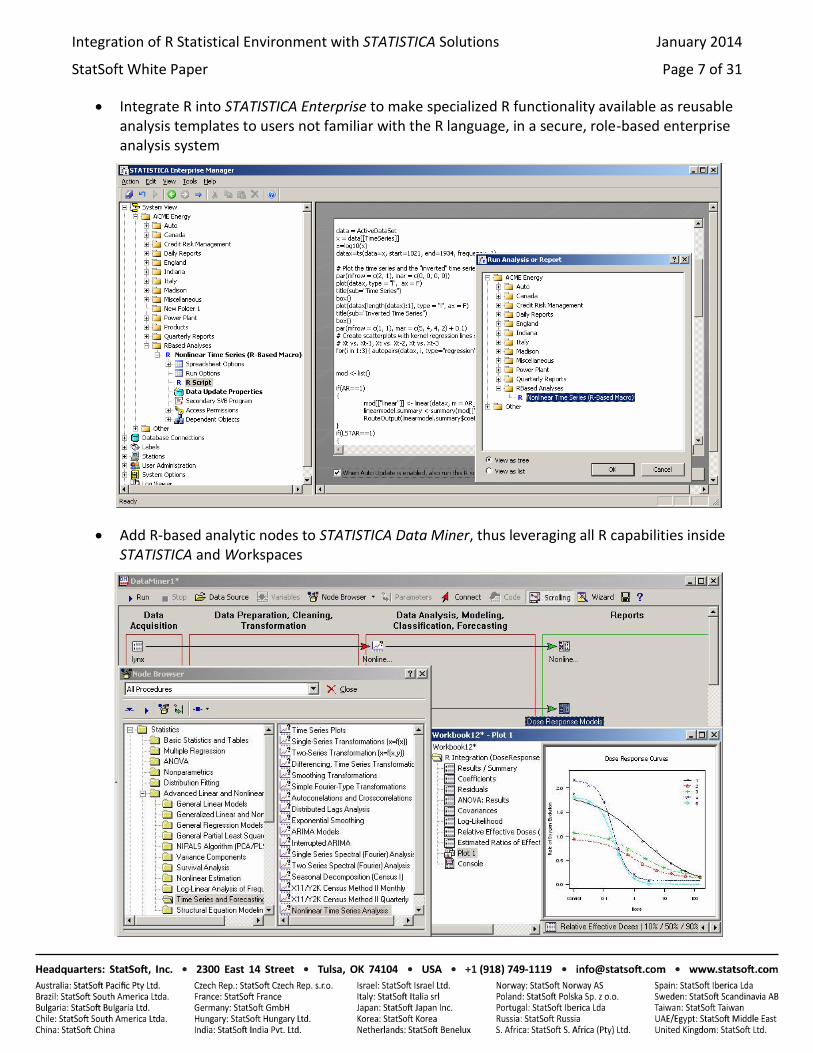
Integrate R into STATISTICA Enterprise to make specialized R functionality available as reusable analysis templates to users not familiar with the R language, in a secure, role-based enterprise analysis system
Add R-based analytic nodes to STATISTICA Data Miner, thus leveraging all R capabilities inside STATISTICA and Workspaces
• 2300 East 14 Street • Tulsa, OK 74104 • USA • +1 (918) 749-1119 • •
Integration of R Statistical Environment with STATISTICA Solutions January 2014
StatSoft White Paper Page 8 of 31
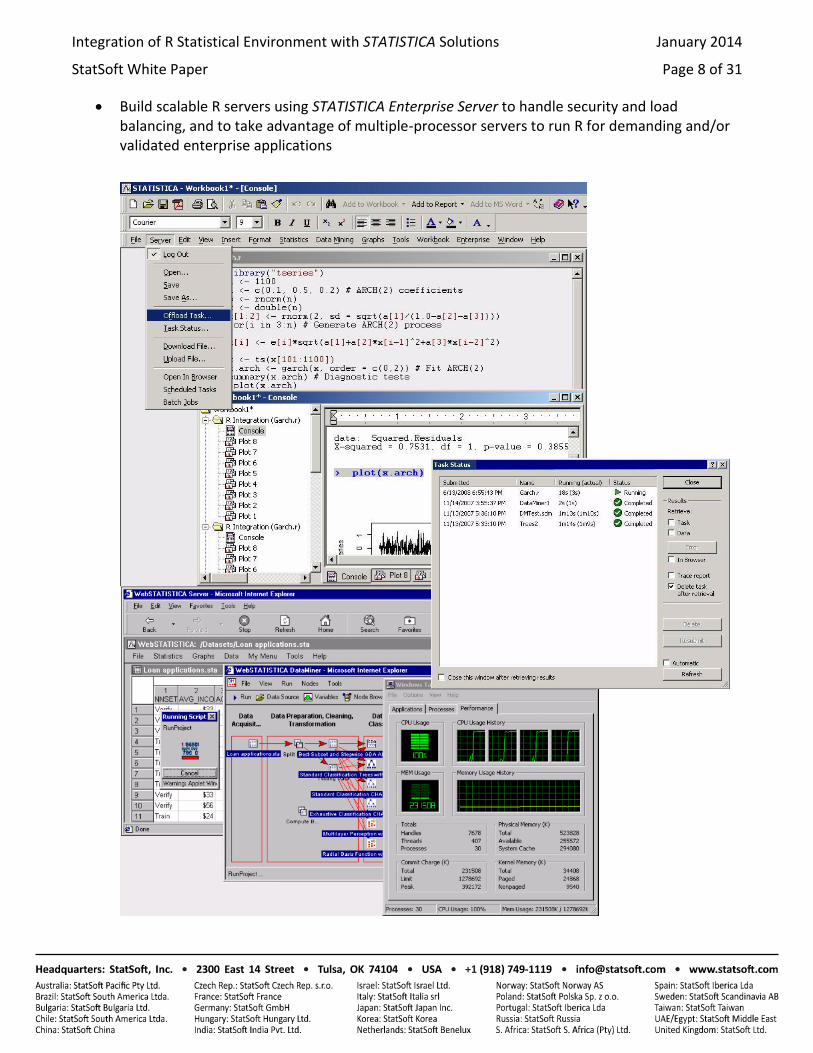
Build scalable R servers using STATISTICA Enterprise Server to handle security and load balancing, and to take advantage of multiple-processor servers to run R for demanding and/or validated enterprise applications
• 2300 East 14 Street • Tulsa, OK 74104 • USA • +1 (918) 749-1119 • •
Integration of R Statistical Environment with STATISTICA Solutions January 2014
StatSoft White Paper Page 9 of 31
Basic Architecture and Features of R Support in
STATISTICA
R support in STATISTICA was designed to create an integrated STATISTICA-R platform that enables users to run R programs (“scripts”) directly inside STATISTICA so that they can take full advantage of the specialized capabilities available in R.
The R Integration environment in STATISTICA was specifically designed to:
Enable users to run R scripts “as is,” and retrieve the results into STATISTICA reports
o all R console output is copied into the report; R commands are highlighted
o plots generated by the script are automatically embedded in the report as scalable images
o these plots are also replicated as STATISTICA Graphs (scalable “metafile” images are placed inside these graphs), thus enabling annotation using powerful graphical facilities in STATISTICA; the graphs can then be printed or exported into a variety of image formats
o the reports can be edited, printed, and saved as PDF files
Provide R language extensions functions for R scripts run from the STATISTICA environment that:
o transfer data from STATISTICA Spreadsheets into R data frames
o extract tabular data from R variables into STATISTICA Spreadsheets; these “results” spreadsheets (as well as all graphs produced by the script) are returned according to Output Manager settings (“routed”), e.g., placed into STATISTICA Workbooks
Execute R scripts as native Macros from within STATISTICA Visual Basic (SVB) programs
o scripts can be parameterized with a Collection of objects (numbers, strings, arrays, additional R code or overridden R functions, spreadsheets) that are mapped to R variables accessible to the script; this approach provides fine-grain control over scripts’ behavior in repeated runs or when used as the backend for custom STATISTICA modules
o by default, all script output is routed by STATISTICA Output Manager; scripts may also be executed using a method that instead returns its output as a Document Collection, giving developers an easy way to extract specific analysis results that could be used for further processing, e.g., as input data for further analyses in STATISTICA or in R, or for graphing.
Taken together, these enhancements not only enable users to run R scripts directly in the STATISTICA desktop environment, but also provide a way to embed specialized R functionality into their SVB programs, custom interactive analysis modules, Workspace nodes, and Enterprise analysis configurations, or to offload such scripts to STATISTICA Enterprise Server for server-side processing.
• 2300 East 14 Street • Tulsa, OK 74104 • USA • +1 (918) 749-1119 • •
Integration of R Statistical Environment with STATISTICA Solutions January 2014
StatSoft White Paper Page 10 of 31
Enterprise customers have the opportunity to integrate R into validated STATISTICA Enterprise solutions (e.g., for FDA-regulated industries) or to provide a very powerful STATISTICA Enterprise Server -based R Server environment.
Developing and debugging R scripts. One of the use cases that the R support in STATISTICA was not designed for is to supply a complete R development and debugging environment. The console application and tools supplied with standard R installation perform those functions very well, and are already familiar to R users and developers.
COM Interface to R Environment
In order for R Integration in STATISTICA to transfer data between STATISTICA and R, the R environment must be installed on the same computer (or on STATISTICA Enterprise Server or on the server for Enterprise solutions). The latest version of the R environment can be obtained from the CRAN website (http://cran.r-project.org).
To access the R environment, STATISTICA uses the COMadaptR library distributed under GNU Lesser Public License; this library has two components: one of them acts as a R COM Server; the other is used for callbacks from R to STATISTICA.
Once R is installed, STATISTICA will automatically detect it. The next time you run STATISTICA, a dialog box will be displayed where you can select to enable R Integration. Click Yes, and STATISTICA will automatically install the COMadaptR library and register one of the components with the Windows registry. Note that these steps might require administrative privileges – depending on your operating system version and settings, the system might ask you to confirm these actions, possibly requesting administrator credentials.
Complete COMadaptR library installation by accepting the installer’s default settings; you are now ready to use R within the STATISTICA environment. If you do not need R Integration enabled, you can suppress the dialog box; the Integrating R into STATISTICA dialog box will be displayed when you start STATISTICA again – select the Do not ask me again check box to prevent this dialog box from being displayed again. You can enable it again by selecting the corresponding check box in the Documents: Macros tab of the Options dialog box. Remember that the COMadaptR library is independent from STATISTICA and will remain on your computer until it is uninstalled manually.
The COMadaptR library provides a simple yet powerful COM (Component Object Model) interface to the R environment. This interface can be used directly by SVB programs in STATISTICA – an example of such a use case is included in the STATISTICA application, located in Examples\R\Dose Response folder (open Direct Interface To R via COM.stw and run the embedded SVB macro).
But usage of such an interface directly by end users is very ineffective, sometimes unproductive, and usually inflexible. It may also significantly degrade the overall performance of interactions with R if performed incorrectly.
Therefore, the following architectural extensions have been added to the STATISTICA platform to provide a seamless and effective R Integration experience for end users (the example mentioned above
• 2300 East 14 Street • Tulsa, OK 74104 • USA • +1 (918) 749-1119 • •
Integration of R Statistical Environment with STATISTICA Solutions January 2014
StatSoft White Paper Page 11 of 31
also demonstrates the significant reduction in the efforts required to implement the same analysis using the new built-in features: in STATISTICA, simply open and run DoseResponse.r).
R Integration Support Macros (R.svb / R.r)
STATISTICA installation includes a STATISTICA Visual Basic macro called R.svb and an R script called R.r. These files contain the support code required to manage interactions through COM in STATISTICA and the R side respectively. When an R script is executed in STATISTICA, it is parsed by the support macro, which then transfers data and script parameters, submits script content to the R environment, manages error conditions, and also handles script outputs, ensuring that they are properly transferred back to STATISTICA. Support script R.r implements STATISTICA-specific R language extensions functions; one of its primary responsibilities is translating STATISTICA Spreadsheets to R data frames (and back).
Although the support code is write-protected by default, it is accessible for inspection and can be modified or enhanced to support new functionality required for specific use cases, although users should do so “at their own risk.” The R.svb macro supports standalone execution to simplify debugging and testing of modifications.
R Scripts as Native STATISTICA Macros
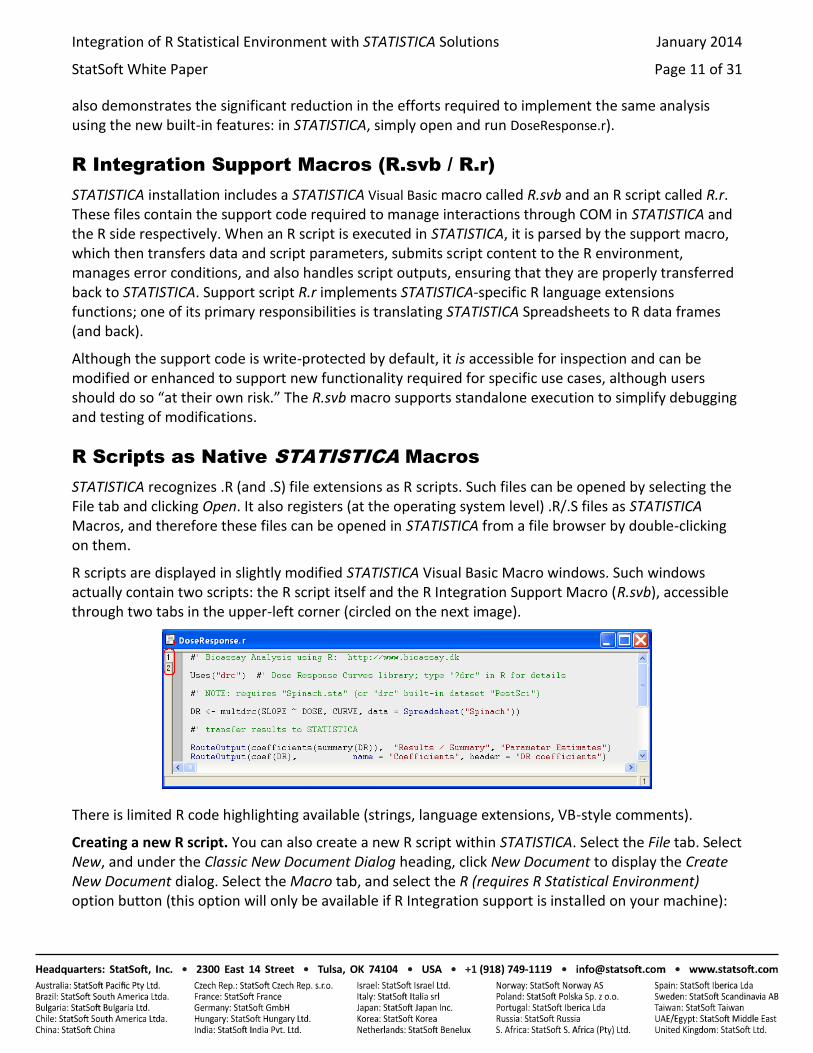
STATISTICA recognizes .R (and .S) file extensions as R scripts. Such files can be opened by selecting the File tab and clicking Open. It also registers (at the operating system level) .R/.S files as STATISTICA Macros, and therefore these files can be opened in STATISTICA from a file browser by double-clicking on them.
R scripts are displayed in slightly modified STATISTICA Visual Basic Macro windows. Such windows actually contain two scripts: the R script itself and the R Integration Support Macro (R.svb), accessible through two tabs in the upper-left corner (circled on the next image).
There is limited R code highlighting available (strings, language extensions, VB-style comments).
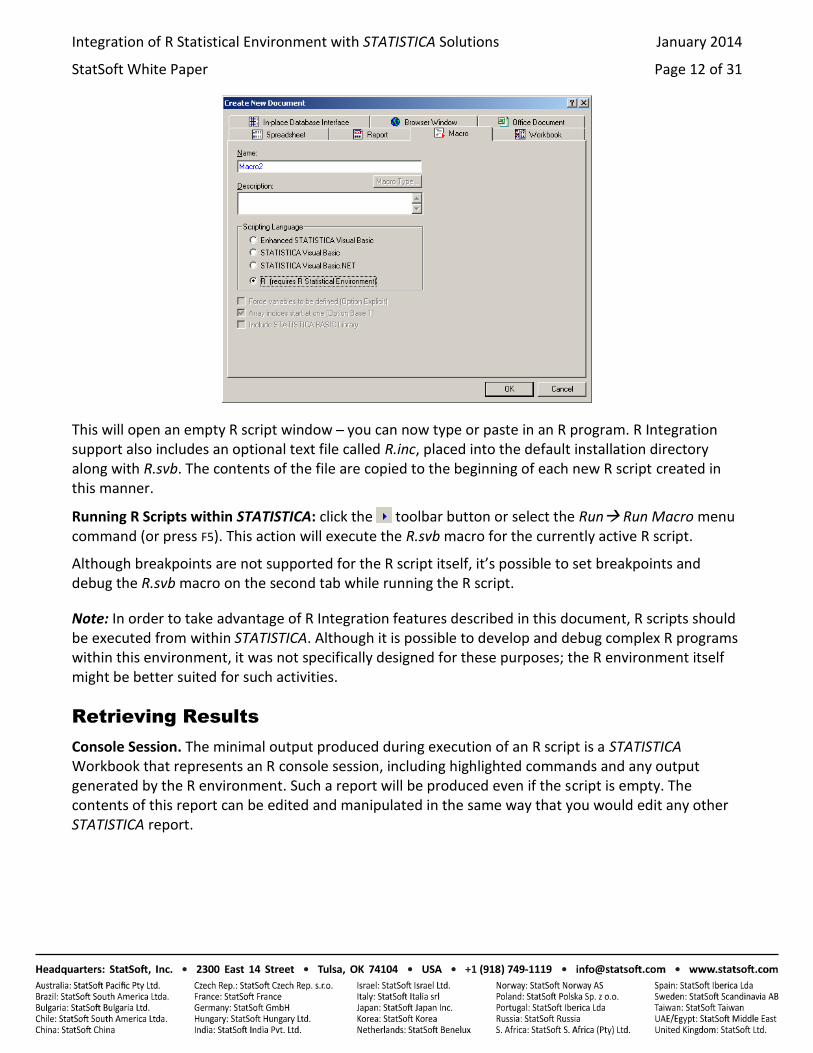
Creating a new R script. You can also create a new R script within STATISTICA. Select the File tab. Select New, and under the Classic New Document Dialog heading, click New Document to display the Create New Document dialog. Select the Macro tab, and select the R (requires R Statistical Environment) option button (this option will only be available if R Integration support is installed on your machine):
• 2300 East 14 Street • Tulsa, OK 74104 • USA • +1 (918) 749-1119 • •
Integration of R Statistical Environment with STATISTICA Solutions January 2014
StatSoft White Paper Page 12 of 31
This will open an empty R script window you can now type or paste in an R program. R Integration support also includes an optional text file called R.inc, placed into the default installation directory along with R.svb. The contents of the file are copied to the beginning of each new R script created in this manner.
Running R Scripts within STATISTICA: click the toolbar button or select the Run Run Macro menu command (or press F5). This action will execute the R.svb macro for the currently active R script.
Although breakpoints are not supported for the R script itself, it’s possible to set breakpoints and debug the R.svb macro on the second tab while running the R script.
Note: In order to take advantage of R Integration features described in this document, R scripts should be executed from within STATISTICA. Although it is possible to develop and debug complex R programs within this environment, it was not specifically designed for these purposes; the R environment itself might be better suited for such activities.
Retrieving Results
Console Session. The minimal output produced during execution of an R script is a STATISTICA Workbook that represents an R console session, including highlighted commands and any output generated by the R environment. Such a report will be produced even if the script is empty. The contents of this report can be edited and manipulated in the same way that you would edit any other STATISTICA report.
• 2300 East 14 Street • Tulsa, OK 74104 • USA • +1 (918) 749-1119 • •
Integration of R Statistical Environment with STATISTICA Solutions January 2014
StatSoft White Paper Page 13 of 31
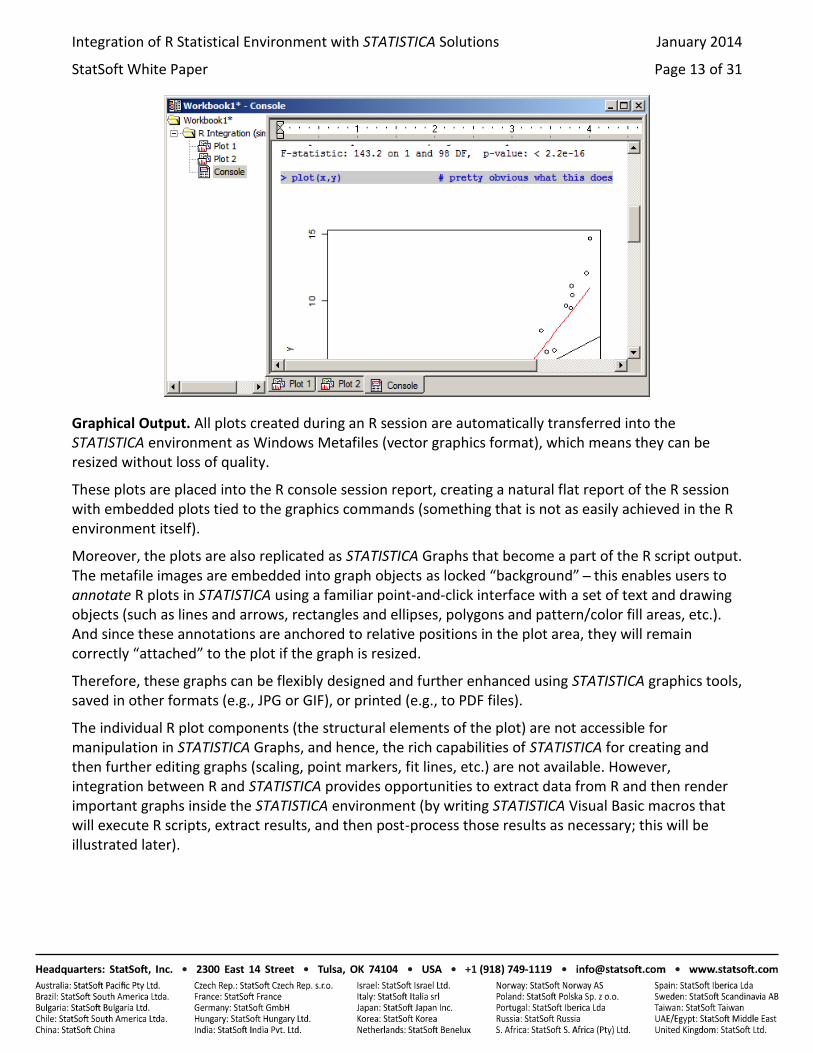
Graphical Output. All plots created during an R session are automatically transferred into the STATISTICA environment as Windows Metafiles (vector graphics format), which means they can be resized without loss of quality.
These plots are placed into the R console session report, creating a natural flat report of the R session with embedded plots tied to the graphics commands (something that is not as easily achieved in the R environment itself).
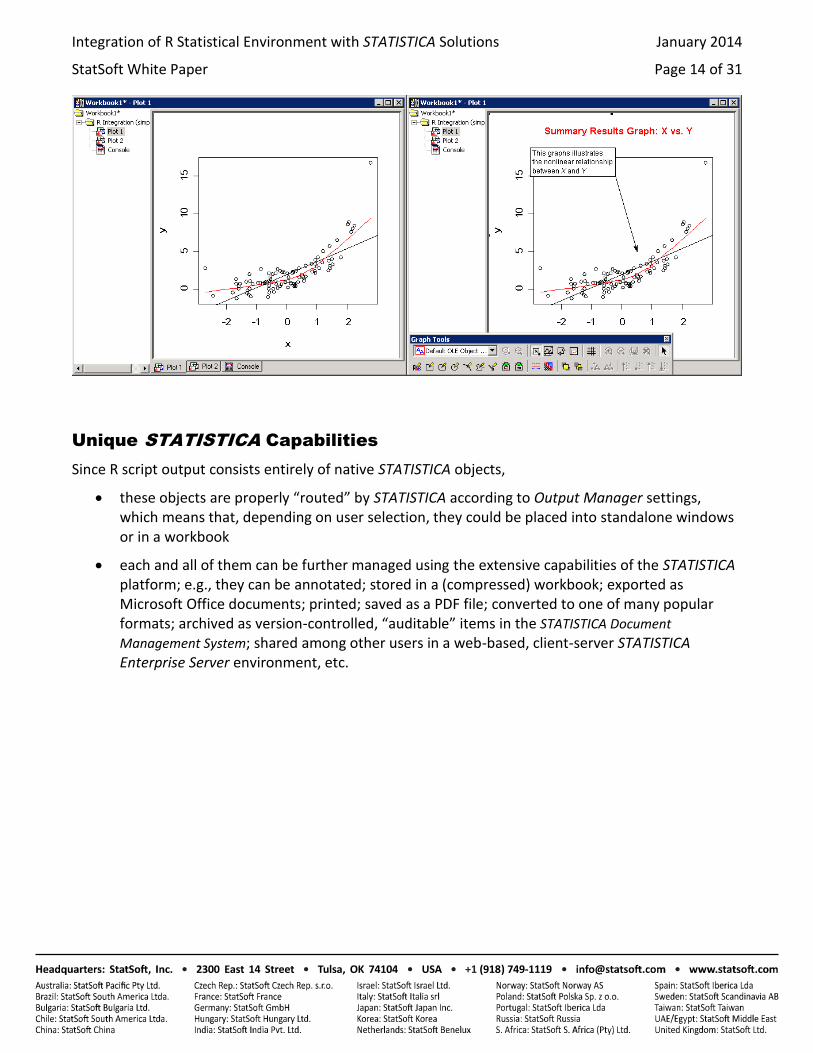
Moreover, the plots are also replicated as STATISTICA Graphs that become a part of the R script output. The metafile images are embedded into graph objects as locked “background” this enables users to annotate R plots in STATISTICA using a familiar point-and-click interface with a set of text and drawing objects (such as lines and arrows, rectangles and ellipses, polygons and pattern/color fill areas, etc.). And since these annotations are anchored to relative positions in the plot area, they will remain correctly “attached” to the plot if the graph is resized.
Therefore, these graphs can be flexibly designed and further enhanced using STATISTICA graphics tools, saved in other formats (e.g., JPG or GIF), or printed (e.g., to PDF files).
The individual R plot components (the structural elements of the plot) are not accessible for manipulation in STATISTICA Graphs, and hence, the rich capabilities of STATISTICA for creating and then further editing graphs (scaling, point markers, fit lines, etc.) are not available. However, integration between R and STATISTICA provides opportunities to extract data from R and then render important graphs inside the STATISTICA environment (by writing STATISTICA Visual Basic macros that will execute R scripts, extract results, and then post-process those results as necessary; this will be illustrated later).
• 2300 East 14 Street • Tulsa, OK 74104 • USA • +1 (918) 749-1119 • •
Integration of R Statistical Environment with STATISTICA Solutions January 2014
StatSoft White Paper Page 14 of 31
Unique STATISTICA Capabilities
Since R script output consists entirely of native STATISTICA objects,
these objects are properly “routed” by STATISTICA according to Output Manager settings, which means that, depending on user selection, they could be placed into standalone windows or in a workbook
each and all of them can be further managed using the extensive capabilities of the STATISTICA platform; e.g., they can be annotated; stored in a (compressed) workbook; exported as Microsoft Office documents; printed; saved as a PDF file; converted to one of many popular formats; archived as version-controlled, “auditable” items in the STATISTICA Document
Management System; shared among other users in a web-based, client-server STATISTICA Enterprise Server environment, etc.
• 2300 East 14 Street • Tulsa, OK 74104 • USA • +1 (918) 749-1119 • •
Integration of R Statistical Environment with STATISTICA Solutions January 2014
StatSoft White Paper Page 15 of 31
R Language Extensions: Passing Data to R and Retrieving
Results
The R Integration Support Macro (R.svb) implements several extensions to R language – keywords and functions that can be used inside R scripts executed within the STATISTICA environment. These extensions enable scripts to pass data to R and retrieve results from the R environment.
Important: The R language is case sensitive; therefore R language extensions for STATISTICA are also case sensitive - they will only be recognized by the STATISTICA environment when typed exactly as shown.
Tabular data represented in STATISTICA in the form of spreadsheets are mapped into the equivalent R structures – data frames. The mapping preserves as much information as possible for both formats: for example, text label variables in a spreadsheet become factor objects in a data frame, Missing Data values are mapped to NA indicators; data types and variable and case names are transferred both ways, etc.
ActiveDataSet
The ActiveDataSet keyword has been adopted from the STATISTICA Visual Basic language and it performs the same function in R scripts: it references the active STATISTICA data spreadsheet.
In the desktop STATISTICA environment, active data set usually means the top-most visible spreadsheet, which can act as a data source (it can also be a spreadsheet in a workbook selected as “Active Input”). This notion is redefined and extended for server-based environments (STATISTICA Enterprise Server, Enterprise), but the keyword is still valid and refers to the corresponding server-side mapping of the active data source.
If no active data set is defined/available, the R script that uses it will fail (the same is true for SVB macros).
If the R Integration Support Macro encounters the ActiveDataSet keyword in the R script, it transfers the actual STATISTICA active data set into the R environment and assigns it to a variable of the same name. Therefore, this keyword represents a data frame variable and can be handled as such in the script.
Example:
ActiveDataSet[1:5] # display a subset of active dataset (variables 1 through 5)
str(ActiveDataSet) # view the structure of the data frame
plot(ActiveDataSet$MEASURE01) # plot "MEASURE01" variable values
Spreadsheet(path.or.object,[applySelectionConditions],[recodeTe
xtLabelAsFactors],[recodeMissingDataToNA],[getCaseNames],[g
• 2300 East 14 Street • Tulsa, OK 74104 • USA • +1 (918) 749-1119 • •
Integration of R Statistical Environment with STATISTICA Solutions January 2014
StatSoft White Paper Page 16 of 31
etTextValues],[attachObject],[username],[password],[connection
string],[stationname])
path.or.object – character vector (literal or variable) or a valid COM object pointing to a STATISTICA spreadsheet, e.g. “c:/data/sample.sta”, “enterprise://SomeFolder1/SomeFile.sta” or “adstudy”
applySelectionConditions – TRUE (default) or FALSE flag indicating whether selection conditions defined on spreadsheet should be employed recodeTextLabelCodesAsFactors – TRUE (default) or FALSE flag indicating whether text labels defined for variables should be treated as factors or text
getCaseNames – TRUE (default) or FALSE flag indicating whether row names should be fetched
attachObject – TRUE or FALSE (default) flag indicating whether spreadsheet should be attached to data frame as an “Object”attribute
username, password, connectionstring, stationname – character strings (default value: “”) to be used to fetch spreadsheets from the enterprise system when user does not have an integrated login
Use the Spreadsheet() extension to load a specific STATISTICA data file into R and transfer the data in that file to an R data frame.
Similar to the ActiveDataSet keyword, the return value of the Spreadsheet() function should be treated as a data frame variable with the contents closely matching that of the corresponding STATISTICA spreadsheet.
One useful feature supported by this function is the use of default search paths for spreadsheet files that are specified only as simple file names. This means that if the function parameter consists only of a file name, e.g., Spreadsheet(“some.sta”), R Integration Support code will look for this file in several locations: first, it will check the folder where the R script itself is located (if it was saved to disk), and then it will check the Examples\Datasets folder for the current STATISTICA installation. Support code will also append the default .sta file extension if one is not present. Therefore the following options are available:
R scripts can reference the accompanying data sets (placed in the same folder) simply by name
Spreadsheets that are included in every STATISTICA installation as demonstration/example data sets can be referenced by name in much the same way as built-in R data sets
Example:
Spreadsheet("c:\myfiles\mydata.sta") # display the dataset in R console
Spreadsheet("\\server\share\data.sta") # same, but read from a network share
Spreadsheet("thisdemo.sta") # file in the same folder as this script
Spreadsheet("enterprise://folder/thisdemo.sta") # file in STATISTICA Enterprise
# plot a histogram for MEASURE05 variable from STATISTICA example dataset Adstudy:
• 2300 East 14 Street • Tulsa, OK 74104 • USA • +1 (918) 749-1119 • •
Integration of R Statistical Environment with STATISTICA Solutions January 2014
StatSoft White Paper Page 17 of 31
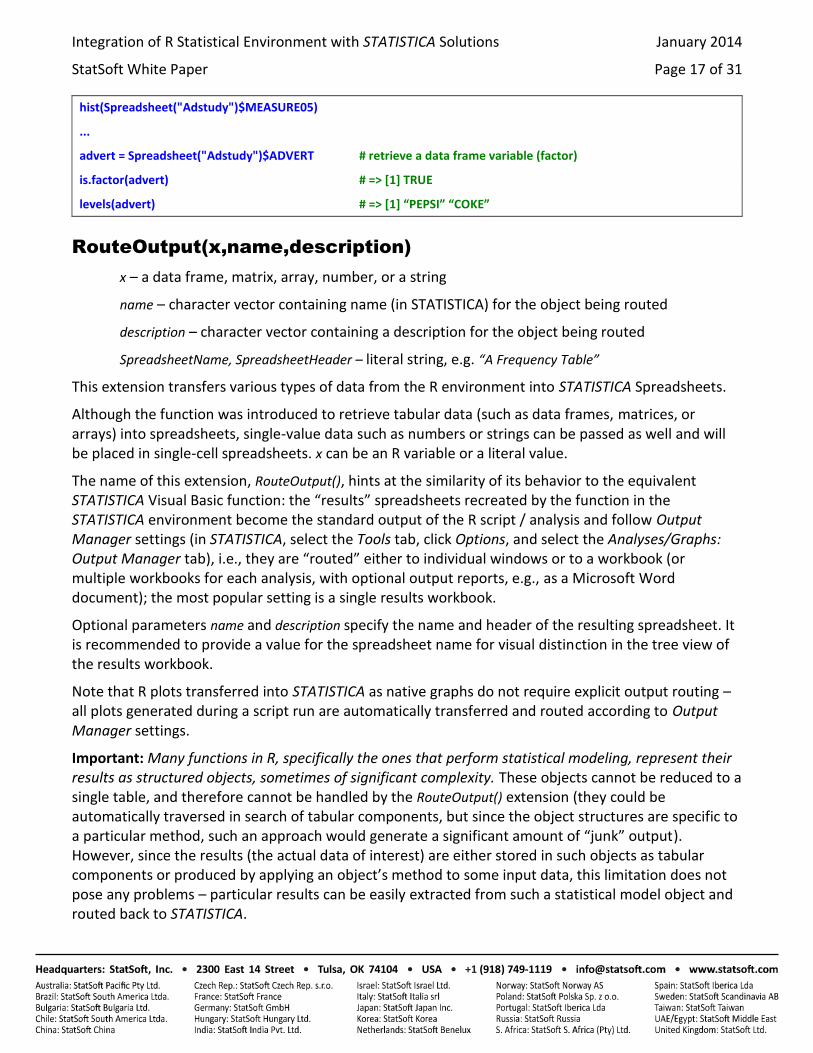
hist(Spreadsheet("Adstudy")$MEASURE05)
...
advert = Spreadsheet("Adstudy")$ADVERT # retrieve a data frame variable (factor)
is.factor(advert) # => [1] TRUE
levels(advert) # => [1] “PEPSI” “COKE”
RouteOutput(x,name,description)
x – a data frame, matrix, array, number, or a string
name – character vector containing name (in STATISTICA) for the object being routed
description – character vector containing a description for the object being routed
SpreadsheetName, SpreadsheetHeader – literal string, e.g. “A Frequency Table”
This extension transfers various types of data from the R environment into STATISTICA Spreadsheets.
Although the function was introduced to retrieve tabular data (such as data frames, matrices, or arrays) into spreadsheets, single-value data such as numbers or strings can be passed as well and will be placed in single-cell spreadsheets. x can be an R variable or a literal value.
The name of this extension, RouteOutput(), hints at the similarity of its behavior to the equivalent STATISTICA Visual Basic function: the “results” spreadsheets recreated by the function in the STATISTICA environment become the standard output of the R script / analysis and follow Output Manager settings (in STATISTICA, select the Tools tab, click Options, and select the Analyses/Graphs: Output Manager tab), i.e., they are “routed” either to individual windows or to a workbook (or multiple workbooks for each analysis, with optional output reports, e.g., as a Microsoft Word document); the most popular setting is a single results workbook.
Optional parameters name and description specify the name and header of the resulting spreadsheet. It is recommended to provide a value for the spreadsheet name for visual distinction in the tree view of the results workbook.
Note that R plots transferred into STATISTICA as native graphs do not require explicit output routing – all plots generated during a script run are automatically transferred and routed according to Output Manager settings.
Important: Many functions in R, specifically the ones that perform statistical modeling, represent their results as structured objects, sometimes of significant complexity. These objects cannot be reduced to a single table, and therefore cannot be handled by the RouteOutput() extension (they could be automatically traversed in search of tabular components, but since the object structures are specific to a particular method, such an approach would generate a significant amount of “junk” output). However, since the results (the actual data of interest) are either stored in such objects as tabular components or produced by applying an object’s method to some input data, this limitation does not pose any problems – particular results can be easily extracted from such a statistical model object and routed back to STATISTICA.
• 2300 East 14 Street • Tulsa, OK 74104 • USA • +1 (918) 749-1119 • •
Integration of R Statistical Environment with STATISTICA Solutions January 2014
StatSoft White Paper Page 18 of 31
Example:
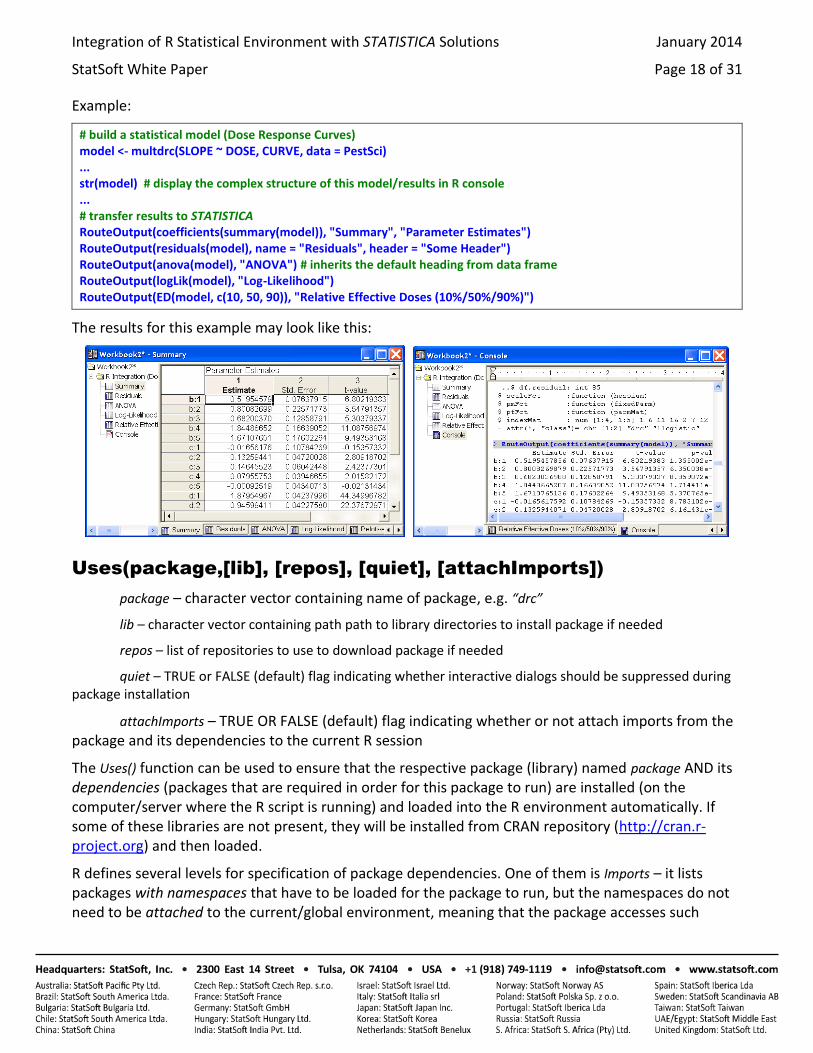
# build a statistical model (Dose Response Curves) model <- multdrc(SLOPE ~ DOSE, CURVE, data = PestSci) ... str(model) # display the complex structure of this model/results in R console ... # transfer results to STATISTICA RouteOutput(coefficients(summary(model)), "Summary", "Parameter Estimates") RouteOutput(residuals(model), name = "Residuals", header = "Some Header") RouteOutput(anova(model), "ANOVA") # inherits the default heading from data frame RouteOutput(logLik(model), "Log-Likelihood") RouteOutput(ED(model, c(10, 50, 90)), "Relative Effective Doses (10%/50%/90%)")
The results for this example may look like this:
Uses(package,[lib], [repos], [quiet], [attachImports])
package – character vector containing name of package, e.g. “drc”
lib – character vector containing path path to library directories to install package if needed
repos – list of repositories to use to download package if needed
quiet – TRUE or FALSE (default) flag indicating whether interactive dialogs should be suppressed during package installation
attachImports – TRUE OR FALSE (default) flag indicating whether or not attach imports from the package and its dependencies to the current R session
The Uses() function can be used to ensure that the respective package (library) named package AND its dependencies (packages that are required in order for this package to run) are installed (on the computer/server where the R script is running) and loaded into the R environment automatically. If some of these libraries are not present, they will be installed from CRAN repository (http://cran.r-project.org) and then loaded.
R defines several levels for specification of package dependencies. One of them is Imports – it lists packages with namespaces that have to be loaded for the package to run, but the namespaces do not need to be attached to the current/global environment, meaning that the package accesses such
• 2300 East 14 Street • Tulsa, OK 74104 • USA • +1 (918) 749-1119 • •
Integration of R Statistical Environment with STATISTICA Solutions January 2014
StatSoft White Paper Page 19 of 31
imported packages using namespace-qualified names, e.g., tseriesChaos::mutual(x) instead of mutual(x). If you need to use some of these namespace-enclosed functions in your own R code, you can either explicitly use namespace qualification [tseriesChaos::mutual(x)], attach the library to current environment [Uses(“tseriesChaos”) or library(tseriesChaos)], or set the optional Uses() parameter attachImports to TRUE (this will attach all the imports of the package).
Note that this extension is not necessary for interaction between STATISTICA and R, and it’s possible to implement it within the R language itself; rather, it simplifies the process of conditional library installation and loading by encapsulating it in a single call.
Example:
Uses("drc") # make sure that the respective package is installed and loaded ... DR <- multdrc(SLOPE ~ DOSE, CURVE, data = PestSci) # call the package methods
This program fits dose response curves to the respective variables of the built-in PestSci data set by calling multdrc function defined in “drc” package. Uses(“drc”) ensures that the function is available by installing and loading the package, if necessary.
Executing R Scripts from within STATISTICA Visual Basic
A typical use case for leveraging specialized R functionality within STATISTICA is to call R scripts from inside a STATISTICA Visual Basic (SVB) macro. This way we can build new “modules” using the SVB User Interface library and methods implemented in R scripts. Likewise, such functionality is required in order to create STATISTICA Enterprise SVB analysis configurations, or STATISTICA Workspace nodes (for STATISTICA or STATISTICA Enterprise Server) that leverage R.
But, in order to provide any non-trivial functionality within an R script in such use cases, we need to be able to “parameterize” that script with user-selected parameters, variables lists, input spreadsheets, etc. STATISTICA provides a simple and powerful way to pass such parameters to R scripts.
R Scripts are STATISTICA Macros
In (almost) all cases, STATISTICA treats R scripts in the same way as native SVB macros. This applies to the STATISTICA Object Model as well: Macro objects in SVB programs can now represent R scripts. Therefore, R scripts can be created, opened, edited, saved, and executed from within SVB scripts.
This in turn means that R functionality is available in STATISTICA Enterprise analysis configurations and STATISTICA Workspace nodes since they are SVB-based.
Existing R script files can be opened with Macros.Open(“path\to\some.r”) or created on-the-fly with Macros.New() and Macro.Code. Note that in the latter case, STATISTICA needs help in distinguishing R scripts from SVB macros – this can be achieved either by specifying the name for a new macro with the .R extension (even if you are not going to save it on disk), or by explicitly setting Macro.Scripting to 5 (R Macro Type). Run the scripts by calling Macro.Execute.
Important. The Macro.Scripting type for R scripts is 5 (later will be mapped to a symbolic constant).
• 2300 East 14 Street • Tulsa, OK 74104 • USA • +1 (918) 749-1119 • •
Integration of R Statistical Environment with STATISTICA Solutions January 2014
StatSoft White Paper Page 20 of 31
Example:
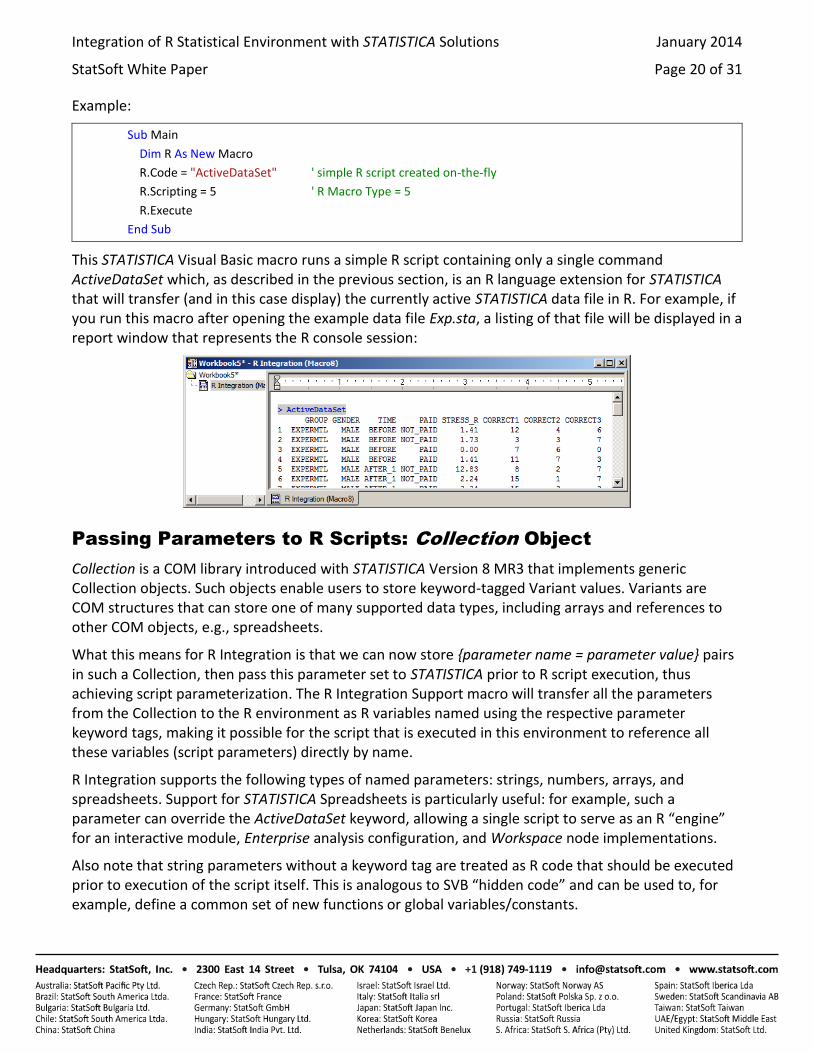
Sub Main
Dim R As New Macro
R.Code = "ActiveDataSet" ' simple R script created on-the-fly
R.Scripting = 5 ' R Macro Type = 5
R.Execute
End Sub
This STATISTICA Visual Basic macro runs a simple R script containing only a single command ActiveDataSet which, as described in the previous section, is an R language extension for STATISTICA that will transfer (and in this case display) the currently active STATISTICA data file in R. For example, if you run this macro after opening the example data file Exp.sta, a listing of that file will be displayed in a report window that represents the R console session:
Passing Parameters to R Scripts: Collection Object
Collection is a COM library introduced with STATISTICA Version 8 MR3 that implements generic Collection objects. Such objects enable users to store keyword-tagged Variant values. Variants are COM structures that can store one of many supported data types, including arrays and references to other COM objects, e.g., spreadsheets.
What this means for R Integration is that we can now store {parameter name = parameter value} pairs in such a Collection, then pass this parameter set to STATISTICA prior to R script execution, thus achieving script parameterization. The R Integration Support macro will transfer all the parameters from the Collection to the R environment as R variables named using the respective parameter keyword tags, making it possible for the script that is executed in this environment to reference all these variables (script parameters) directly by name.
R Integration supports the following types of named parameters: strings, numbers, arrays, and spreadsheets. Support for STATISTICA Spreadsheets is particularly useful: for example, such a parameter can override the ActiveDataSet keyword, allowing a single script to serve as an R “engine” for an interactive module, Enterprise analysis configuration, and Workspace node implementations.
Also note that string parameters without a keyword tag are treated as R code that should be executed prior to execution of the script itself. This is analogous to SVB “hidden code” and can be used to, for example, define a common set of new functions or global variables/constants.
• 2300 East 14 Street • Tulsa, OK 74104 • USA • +1 (918) 749-1119 • •
Integration of R Statistical Environment with STATISTICA Solutions January 2014
StatSoft White Paper Page 21 of 31
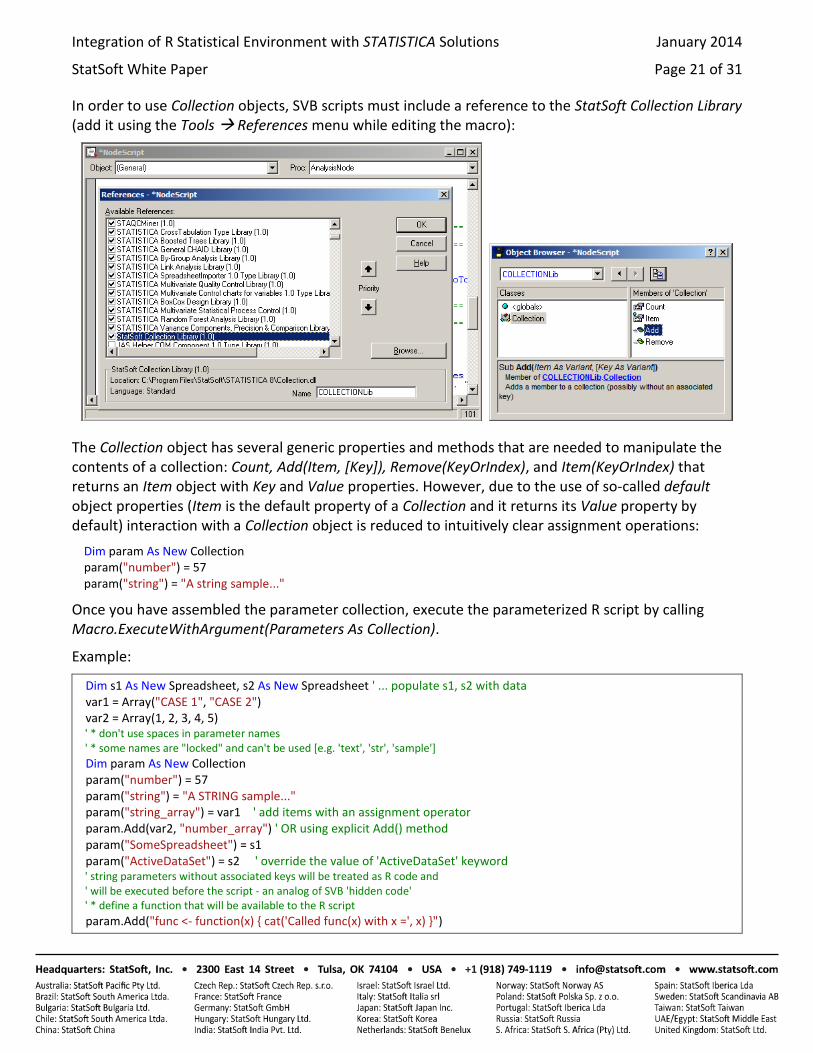
In order to use Collection objects, SVB scripts must include a reference to the StatSoft Collection Library (add it using the Tools References menu while editing the macro):
The Collection object has several generic properties and methods that are needed to manipulate the contents of a collection: Count, Add(Item, [Key]), Remove(KeyOrIndex), and Item(KeyOrIndex) that returns an Item object with Key and Value properties. However, due to the use of so-called default object properties (Item is the default property of a Collection and it returns its Value property by default) interaction with a Collection object is reduced to intuitively clear assignment operations:
Dim param As New Collection param("number") = 57 param("string") = "A string sample..."
Once you have assembled the parameter collection, execute the parameterized R script by calling Macro.ExecuteWithArgument(Parameters As Collection).
Example:
Dim s1 As New Spreadsheet, s2 As New Spreadsheet ' ... populate s1, s2 with data var1 = Array("CASE 1", "CASE 2") var2 = Array(1, 2, 3, 4, 5) ' * don't use spaces in parameter names ' * some names are "locked" and can't be used [e.g. 'text', 'str', 'sample']
Dim param As New Collection param("number") = 57 param("string") = "A STRING sample..." param("string_array") = var1 ' add items with an assignment operator param.Add(var2, "number_array") ' OR using explicit Add() method param("SomeSpreadsheet") = s1 param("ActiveDataSet") = s2 ' override the value of 'ActiveDataSet' keyword ' string parameters without associated keys will be treated as R code and ' will be executed before the script - an analog of SVB 'hidden code' ' * define a function that will be available to the R script
param.Add("func <- function(x) { cat('Called func(x) with x =', x) }")
• 2300 East 14 Street • Tulsa, OK 74104 • USA • +1 (918) 749-1119 • •
Integration of R Statistical Environment with STATISTICA Solutions January 2014
StatSoft White Paper Page 22 of 31
' * another way to define a global constant or variable
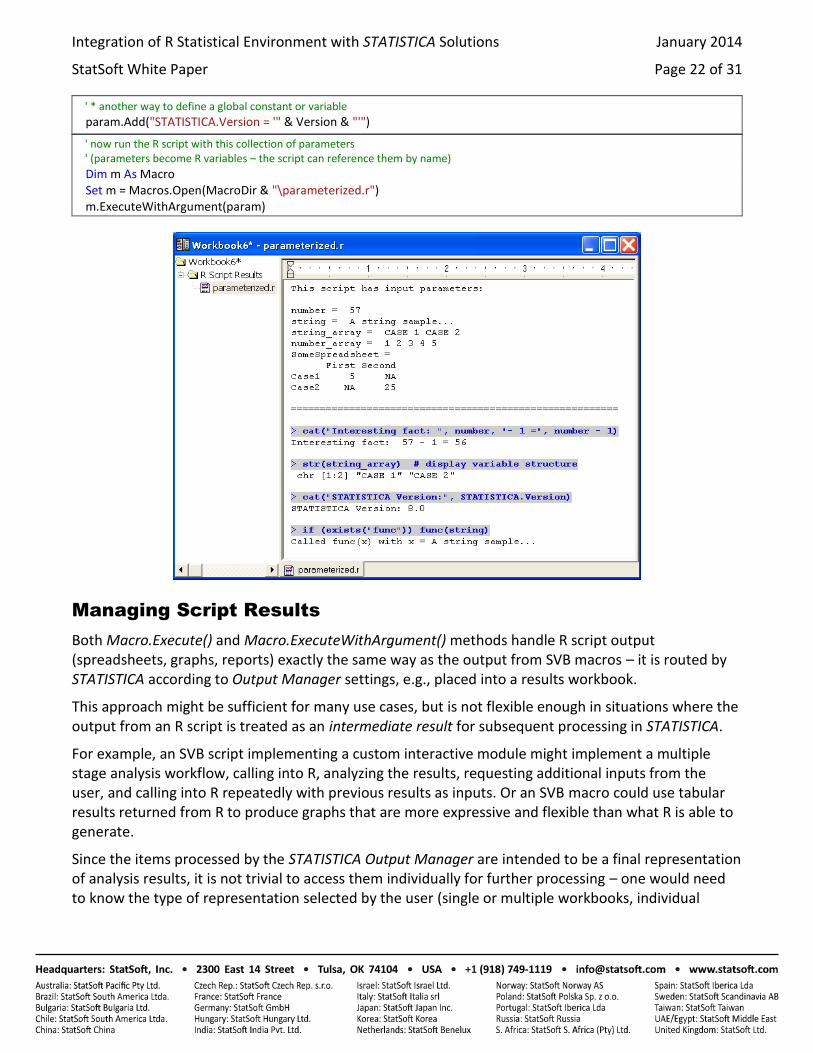
param.Add("STATISTICA.Version = '" & Version & "'")
' now run the R script with this collection of parameters ' (parameters become R variables – the script can reference them by name)
Dim m As Macro Set m = Macros.Open(MacroDir & "\parameterized.r") m.ExecuteWithArgument(param)
Managing Script Results
Both Macro.Execute() and Macro.ExecuteWithArgument() methods handle R script output (spreadsheets, graphs, reports) exactly the same way as the output from SVB macros – it is routed by STATISTICA according to Output Manager settings, e.g., placed into a results workbook.
This approach might be sufficient for many use cases, but is not flexible enough in situations where the output from an R script is treated as an intermediate result for subsequent processing in STATISTICA.
For example, an SVB script implementing a custom interactive module might implement a multiple stage analysis workflow, calling into R, analyzing the results, requesting additional inputs from the user, and calling into R repeatedly with previous results as inputs. Or an SVB macro could use tabular results returned from R to produce graphs that are more expressive and flexible than what R is able to generate.
Since the items processed by the STATISTICA Output Manager are intended to be a final representation of analysis results, it is not trivial to access them individually for further processing – one would need to know the type of representation selected by the user (single or multiple workbooks, individual
• 2300 East 14 Street • Tulsa, OK 74104 • USA • +1 (918) 749-1119 • •
Integration of R Statistical Environment with STATISTICA Solutions January 2014
StatSoft White Paper Page 23 of 31
windows) and programmatically iterate through the respective set of output items (windows, workbook contents represented as a tree), searching the item of interest by name.
Macro.ExecuteNoRouteOutput([Parameters As Collection]) As StaDocCollection
This method has been added to accommodate such special use cases: R script output is not “routed” at all, so the script runs silently; all the output from the script is collected into a StaDocCollection object (standard STATISTICA container for documents such as spreadsheets, graphs, reports, or workbooks) that is returned as the result of script execution. It also accepts an optional Collection for parameterization.
Now SVB macro developers can easily access individual components of R script output, e.g., to extract individual cell data from spreadsheets or to create a complex graph based on multiple columns from several spreadsheets.
Example:
Dim m As Macro Set m = Macros.Open(MacroDir & "\some.r") Dim Routput As StaDocCollection Set Routput = m.ExecuteNoRouteOutput() ' silent, no output displayed ' do something with "Routput": extract and operate on individual documents ' trivial case: results are routed (displayed), as if from Macro.Execute() RouteOutput(Routput, "R Script Results").Visible = True
More Examples
At this point we have demonstrated all the functional components required to build custom applications within the STATISTICA platform that can take advantage of the specialized functionality available in R.
All installations of STATISTICA now have a set of examples that provide a more detailed demonstration of the described features; you will find these examples in the [STATISTICA]\Examples\R folder. These examples may also be used as templates for your own development.
R Support in STATISTICA Enterprise Server
STATISTICA and STATISTICA Enterprise Server are based on identical STATISTICA libraries, and support identical functionality. This is true for R support in STATISTICA as well: you can execute R in STATISTICA Enterprise Server in much the same way as from desktop (thick-client) STATISTICA.
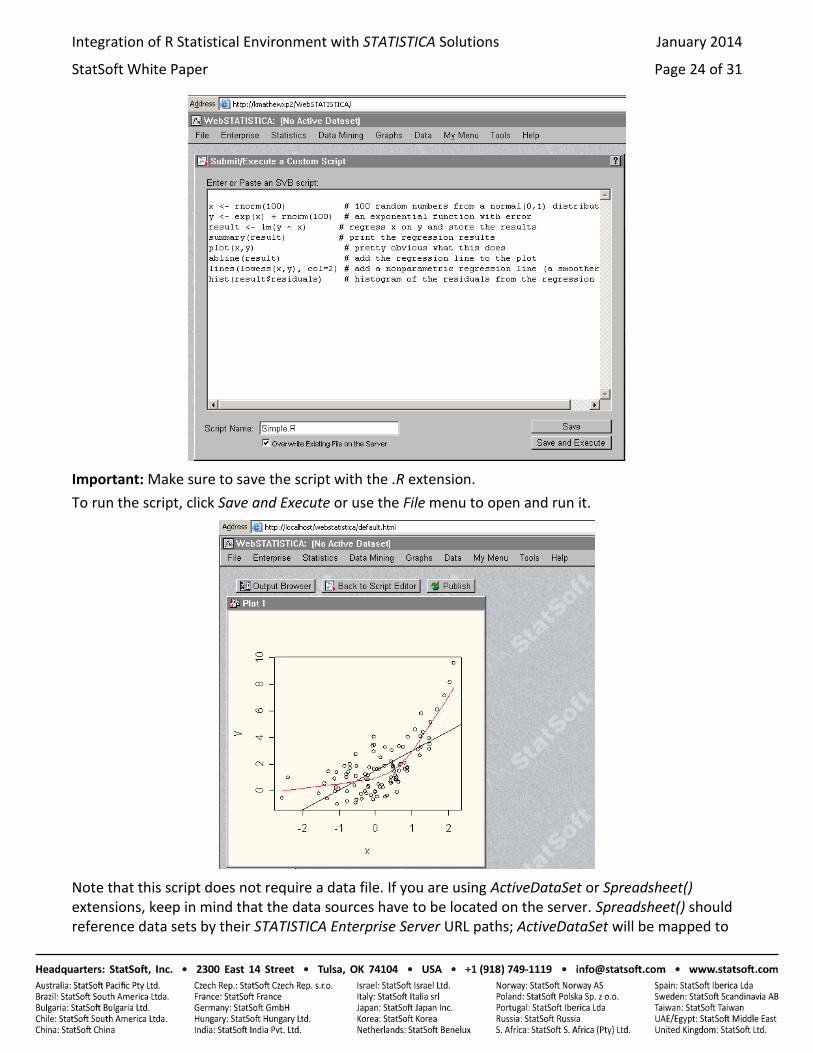
For example, sign into STATISTICA Enterprise Server, and select Tools –> Submit/Execute a Custom Script; then type in the macro shown below (available as standalone.r in the Examples\R folder).
• 2300 East 14 Street • Tulsa, OK 74104 • USA • +1 (918) 749-1119 • •
Integration of R Statistical Environment with STATISTICA Solutions January 2014
StatSoft White Paper Page 24 of 31
Important: Make sure to save the script with the .R extension.
To run the script, click Save and Execute or use the File menu to open and run it.
Note that this script does not require a data file. If you are using ActiveDataSet or Spreadsheet() extensions, keep in mind that the data sources have to be located on the server. Spreadsheet() should reference data sets by their STATISTICA Enterprise Server URL paths; ActiveDataSet will be mapped to
• 2300 East 14 Street • Tulsa, OK 74104 • USA • +1 (918) 749-1119 • •
Integration of R Statistical Environment with STATISTICA Solutions January 2014
StatSoft White Paper Page 25 of 31
the spreadsheet that you open in STATISTICA Enterprise Server, but this can be overridden by a parameter of the same name passed to the R script from SVB. Also, in order to execute any scripts in STATISTICA Enterprise Server, the user must have the proper permissions on the server.
STATISTICA Enterprise Server is a Powerful R Server
STATISTICA Enterprise Server was designed as a powerful and flexible server/web-based analytical platform, relying on the STATISTICA Visual Basic engine for diversity of its functionality, as well as extensibility.
R scripts are handled by STATISTICA Enterprise Server in much the same way as standard SVB macros. The third-party components that the STATISTICA platform relies upon to provide its R runtime environment (such as R library and R COM Server library) are also well suited for handling multiple simultaneous R sessions.
Thus, STATISTICA Enterprise Server represents an ideal platform for a powerful and flexible multi-processor R server that can handle a large number of users, providing security, scheduling, load balancing, etc.
Off-Loading R Scripts from STATISTICA to STATISTICA
Enterprise Server
Like SVB scripts or Workspaces, R scripts can be offloaded from a desktop environment for processing on STATISTICA Enterprise Server. This is particularly useful when an R script is expected to require significant computing resources users can submit such scripts to the server (e.g., overnight) and retrieve the results at a later time.
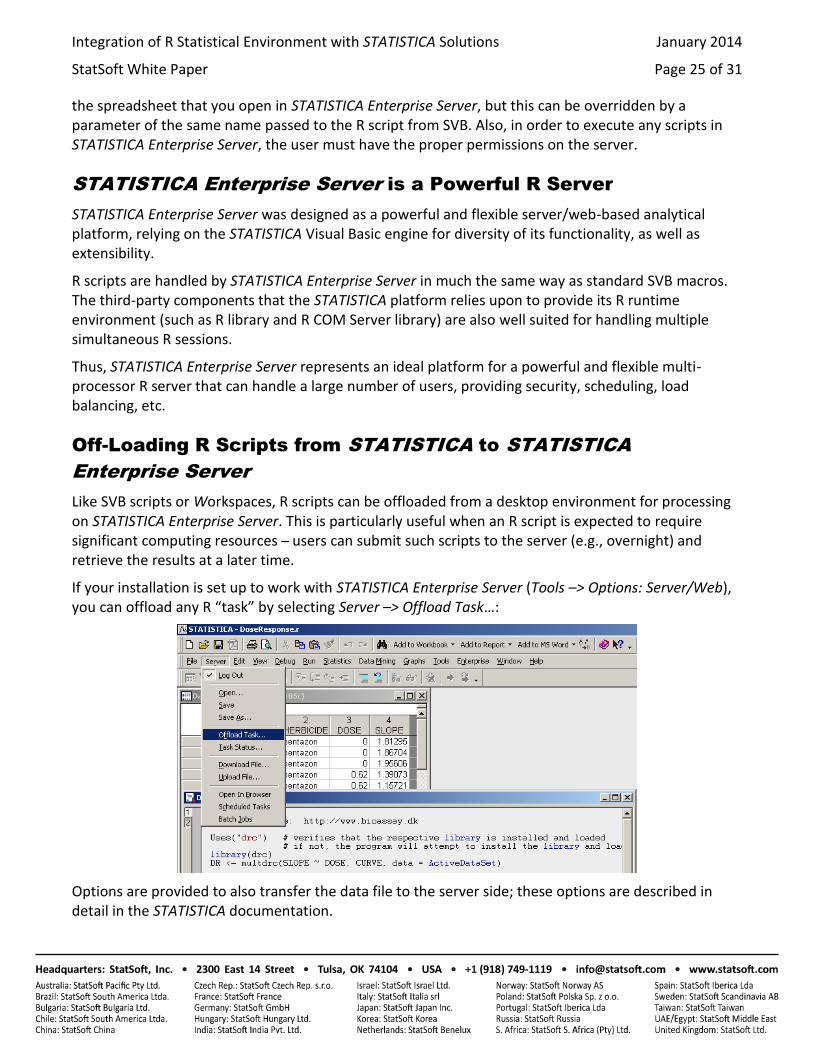
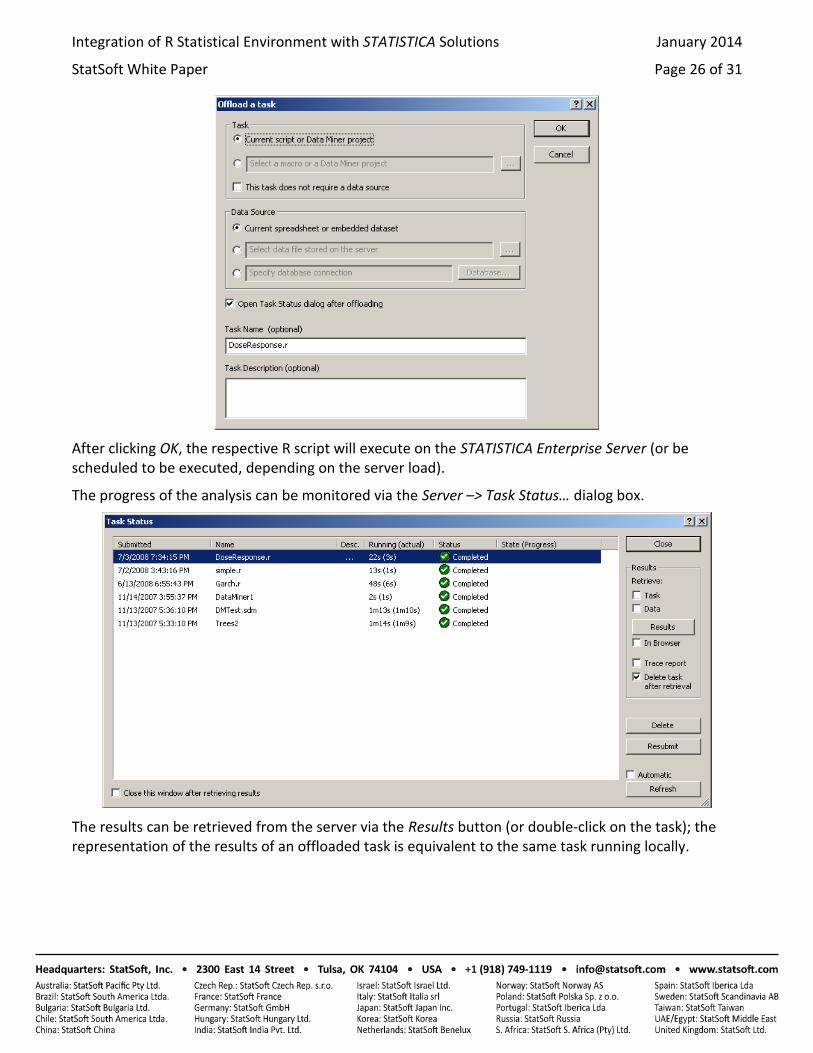
If your installation is set up to work with STATISTICA Enterprise Server (Tools –> Options: Server/Web), you can offload any R “task” by selecting Server –> Offload Task…:
Options are provided to also transfer the data file to the server side; these options are described in detail in the STATISTICA documentation.
• 2300 East 14 Street • Tulsa, OK 74104 • USA • +1 (918) 749-1119 • •
Integration of R Statistical Environment with STATISTICA Solutions January 2014
StatSoft White Paper Page 26 of 31
After clicking OK, the respective R script will execute on the STATISTICA Enterprise Server (or be scheduled to be executed, depending on the server load).
The progress of the analysis can be monitored via the Server –> Task Status… dialog box.
The results can be retrieved from the server via the Results button (or double-click on the task); the representation of the results of an offloaded task is equivalent to the same task running locally.
• 2300 East 14 Street • Tulsa, OK 74104 • USA • +1 (918) 749-1119 • •
Integration of R Statistical Environment with STATISTICA Solutions January 2014
StatSoft White Paper Page 27 of 31
Creating R-based STATISTICA Workspace Nodes
We can use the techniques described in previous sections to implement a custom R-based Workspace node: Edit the SVB node’s source to generate a Collection based on the node’s input parameters, use it to execute one or more parameterized R scripts, and retrieve the results as a StaDocCollection that becomes the output of the node.
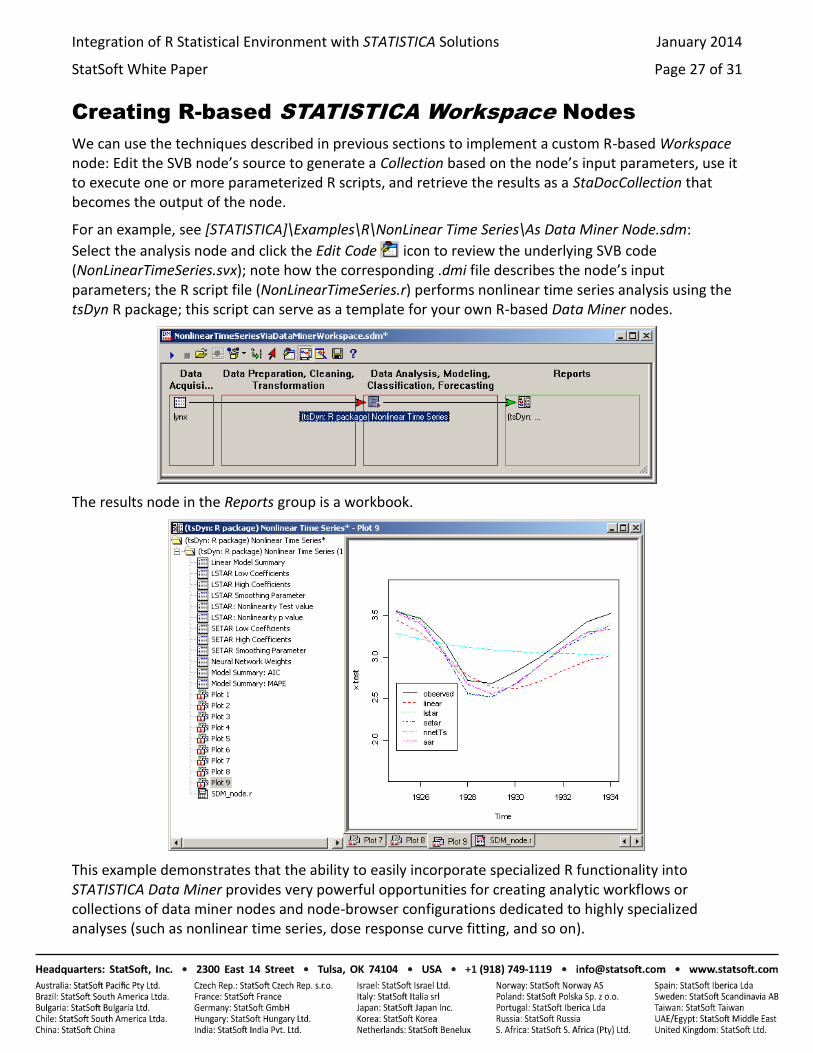
For an example, see [STATISTICA]\Examples\R\NonLinear Time Series\As Data Miner Node.sdm:
Select the analysis node and click the Edit Code icon to review the underlying SVB code (NonLinearTimeSeries.svx); note how the corresponding .dmi file describes the node’s input parameters; the R script file (NonLinearTimeSeries.r) performs nonlinear time series analysis using the tsDyn R package; this script can serve as a template for your own R-based Data Miner nodes.
The results node in the Reports group is a workbook.
This example demonstrates that the ability to easily incorporate specialized R functionality into STATISTICA Data Miner provides very powerful opportunities for creating analytic workflows or collections of data miner nodes and node-browser configurations dedicated to highly specialized analyses (such as nonlinear time series, dose response curve fitting, and so on).
• 2300 East 14 Street • Tulsa, OK 74104 • USA • +1 (918) 749-1119 • •
Integration of R Statistical Environment with STATISTICA Solutions January 2014
StatSoft White Paper Page 28 of 31
Integrating R into STATISTICA Enterprise and
STATISTICA Enterprise Server
R Integration in STATISTICA would be incomplete without support for STATISTICA Enterprise and STATISTICA Enterprise Server solutions. Now, R programs can be used in or as analysis templates. This means R analyses can be distributed to end users who are not familiar with VB or R programming. Furthermore, because the Enterprise platform provides numerous options and features to specifically enable the application of templated analyses for validated applications (e.g., for manufacturers who need to comply with the requirements of FDA 21 CFR Part 11), such as version control and audit trails, these features make R available for deployment in mission-critical manufacturing applications.
Creating R-based Analysis Configurations
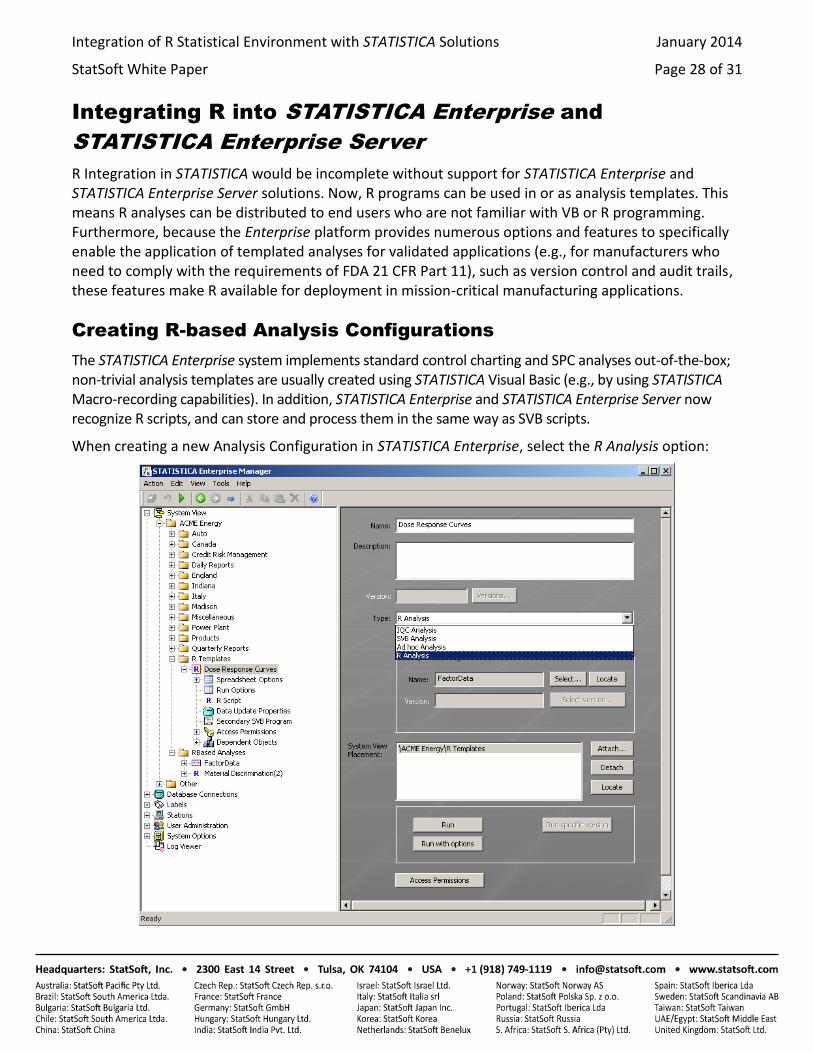
The STATISTICA Enterprise system implements standard control charting and SPC analyses out-of-the-box; non-trivial analysis templates are usually created using STATISTICA Visual Basic (e.g., by using STATISTICA Macro-recording capabilities). In addition, STATISTICA Enterprise and STATISTICA Enterprise Server now recognize R scripts, and can store and process them in the same way as SVB scripts.
When creating a new Analysis Configuration in STATISTICA Enterprise, select the R Analysis option:
• 2300 East 14 Street • Tulsa, OK 74104 • USA • +1 (918) 749-1119 • •
Integration of R Statistical Environment with STATISTICA Solutions January 2014
StatSoft White Paper Page 29 of 31
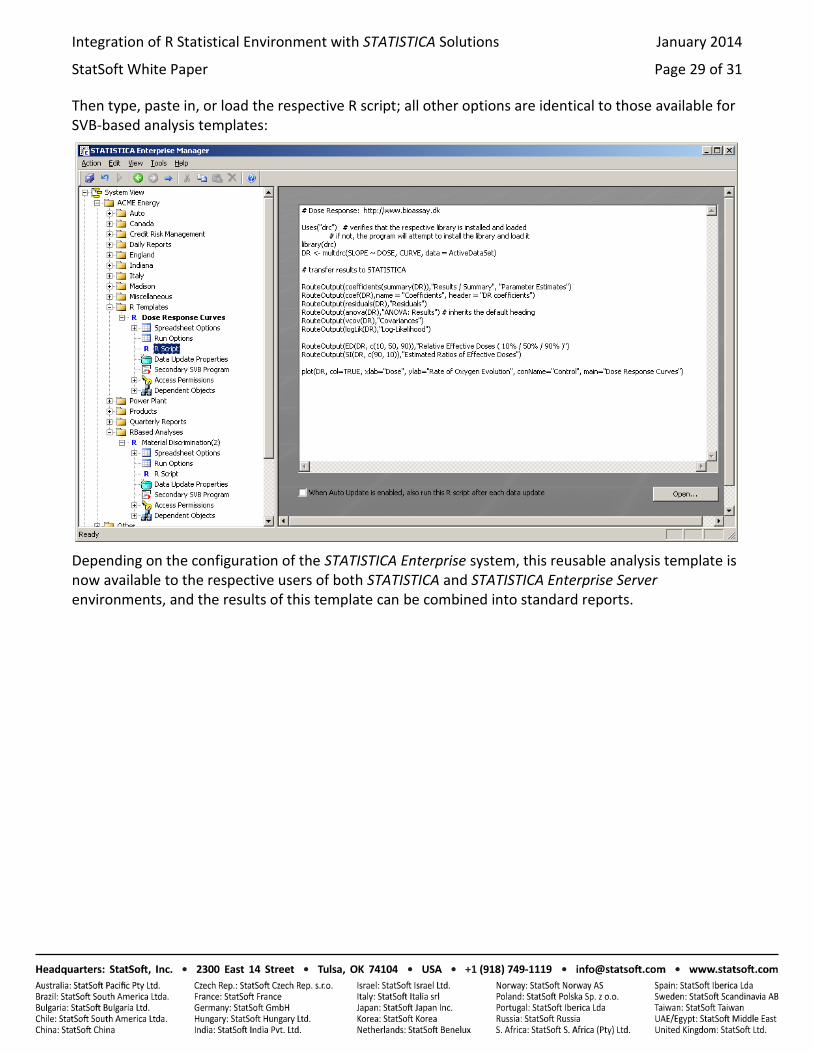
Then type, paste in, or load the respective R script; all other options are identical to those available for SVB-based analysis templates:
Depending on the configuration of the STATISTICA Enterprise system, this reusable analysis template is now available to the respective users of both STATISTICA and STATISTICA Enterprise Server environments, and the results of this template can be combined into standard reports.
• 2300 East 14 Street • Tulsa, OK 74104 • USA • +1 (918) 749-1119 • •
Integration of R Statistical Environment with STATISTICA Solutions January 2014
StatSoft White Paper Page 30 of 31
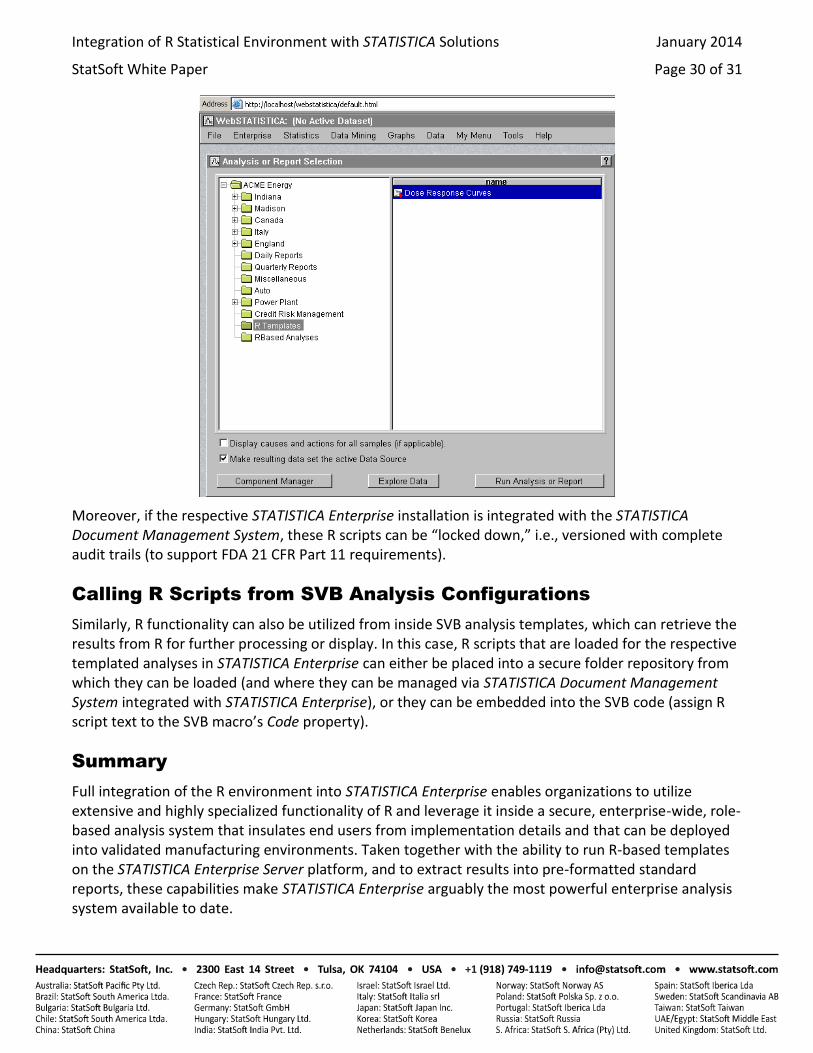
Moreover, if the respective STATISTICA Enterprise installation is integrated with the STATISTICA Document Management System, these R scripts can be “locked down,” i.e., versioned with complete audit trails (to support FDA 21 CFR Part 11 requirements).
Calling R Scripts from SVB Analysis Configurations
Similarly, R functionality can also be utilized from inside SVB analysis templates, which can retrieve the results from R for further processing or display. In this case, R scripts that are loaded for the respective templated analyses in STATISTICA Enterprise can either be placed into a secure folder repository from which they can be loaded (and where they can be managed via STATISTICA Document Management System integrated with STATISTICA Enterprise), or they can be embedded into the SVB code (assign R script text to the SVB macro’s Code property).
Summary
Full integration of the R environment into STATISTICA Enterprise enables organizations to utilize extensive and highly specialized functionality of R and leverage it inside a secure, enterprise-wide, role-based analysis system that insulates end users from implementation details and that can be deployed into validated manufacturing environments. Taken together with the ability to run R-based templates on the STATISTICA Enterprise Server platform, and to extract results into pre-formatted standard reports, these capabilities make STATISTICA Enterprise arguably the most powerful enterprise analysis system available to date.
• 2300 East 14 Street • Tulsa, OK 74104 • USA • +1 (918) 749-1119 • •
Integration of R Statistical Environment with STATISTICA Solutions January 2014
StatSoft White Paper Page 31 of 31
Final Comments, and Some Caveats
The features provided in STATISTICA for integration with R are quite flexible and make the thousands of highly specialized R functions and features available to all STATISTICA solutions. However, users who are planning to exploit these features are advised to consider the following possible issues, in particular, certain system limitations of the R platform.
Error Handling
Most of the error conditions generated within the R environment (e.g., syntax and runtime errors caused by an R script) or by the integration support libraries (e.g., broken R installation or missing components) are intercepted and handled by STATISTICA. Developers can use error handling facilities available in either environment, for example On Error handlers in SVB macros calling R scripts.
However, occasionally R programs can crash or hang (in the latter case, program control does not return to STATISTICA). Therefore, careful validation of the respective R scripts is crucial for enterprise-level deployment of R analysis templates.
Strengths and Limitations
A word of caution regarding the quality of R algorithms: R comes without warranty or guarantees. In practice, many (most) of the algorithms available in R are the result of diligent work over many years by one or a few individuals who are experts in the respective methodology or domain. However, this does not mean that the software was created following rigorous software development lifecycle methodology, or stringent standard operating procedures for software requirements gathering, design, implementation, and testing. Therefore, in order to build a mission-critical or validated application around a component that depends on R, it is absolutely critical that you carefully validate all results for the use cases to which the software is to be applied.
A word of caution regarding scalability, large data sets, etc: Another caveat regarding R that needs to be considered before building solutions around R concerns its basic architecture. Unlike STATISTICA, data in R must be (in practically all cases) resident in the computer’s memory. This restriction, in combination with hardware-level and operating system-level memory limitations, may or may not pose an obstacle for any one individual user, but will need to be considered carefully when building R-based server applications accessible to multiple users.