Embed Size (px)
Citation preview
STATISTICS IN MEDICINEStatist. Med. 2002; 21:2739–2756 (DOI: 10.1002/sim.1212)
Intensive short courses in biostatistics for fellows andphysicians
Walter T. Ambrosius1;†;∗ and Amita K. Manatunga2
1Section on Biostatistics; Department of Public Health Sciences; Wake Forest University;Medical Center Boulevard; Winston-Salem; NC 27157; U.S.A.
2Department of Biostatistics; Rollins School of Public Health; Emory University; 1518 Clifton Road NE;Atlanta; GA 30322; U.S.A.
SUMMARY
At both of our universities we teach (with colleagues) introductory courses in statistics for fellows andphysicians. We do not expect that those taking these courses will be able to do their own statisticalwork, but rather the intention is for them to ‘learn the language’ and to facilitate future collaboration.Basic principles of study design are introduced in the courses, as well as some of the most commonstatistical procedures. We will discuss the factors (what works and what does not) that may contributeto a successful course, a comparison to other courses, and our self-evaluation strategy. Finally, we willcover the �nancial arrangements that we have made when teaching these courses. Copyright ? 2002John Wiley & Sons, Ltd.
KEY WORDS: biostatistics; teaching; short courses; physicians
1. INTRODUCTION
At both Indiana and Emory Universities we teach basic biostatistics to physicians in a shortcourse format. Prior to these courses there was virtually no teaching of biostatistics to physi-cians at either institution. The major goal of these courses is to improve the overall researchatmosphere at each university. This is accomplished in two ways. First, we expect that manyof those taking the courses will be able to perform simple comparisons without the help ofa statistician. Second, we hope that participants will gain a better appreciation for what theydo not know. With this knowledge, we hope that physicians will recognize when they needto include a statistician on their research team.The statistical background of the students varies greatly. Some have had a course or two
during their undergraduate studies or in medical school and others have had no statistical
∗Correspondence to: Walter T. Ambrosius, Section on Biostatistics, Department of Public Health Sciences, WakeForest University, Medical Center Boulevard, Winston-Salem, NC 27157, U.S.A.
†E-mail: [email protected]
Contract=grant sponsor: National Institutes of Health; contract=grant numbers: PHS M01-RR00750, M01-RR00039
Received May 2000Copyright ? 2002 John Wiley & Sons, Ltd. Accepted November 2001
2740 W. T. AMBROSIUS AND A. K. MANATUNGA
training. From information provided at registration we had 65 MDs, 9 PhDs, 1 DNS (Doctorof Nursing Science), 2 PharmDs, 1 DDS, 3 MD-PhDs, 2 PhD-RNs and 5 with unknowneducation take the 2001 Indiana University (IU) course. A more thorough description of theirstatistical background is discussed in Section 6.1.The intention of these courses is to familiarize physicians with statistical methods that
often appear in the medical literature and to enable them to have a fruitful collaborativerelationship with an applied statistician. To that end, we have sacri�ced depth in any one areaof biostatistics to enable us to cover a very broad range of statistical ideas and methods.In this paper we will �rst discuss the approaches to short courses in biostatistics that others
have taken and then we will describe the courses we teach. These two courses are similar toeach other and have been successfully implemented over the last seven years. We will discussthe course objectives, the syllabus, and the necessary logistical and �nancial arrangements.Over the years, the courses have been re�ned. We will discuss the pros and cons of thesere�nements.
2. LITERATURE REVIEW
Very little on teaching short courses in biostatistics has appeared in the literature outside of afew papers in the American Statistical Association Proceedings of the Sections on StatisticalEducation and Teaching Statistics in the Health Sciences. The one exception to this is aseries of papers which appeared in The American Statistician [1–3] in 1995.Birch [1] described a course he taught for the Institute for Professional Education to en-
gineers, social scientists, managers, and medical researchers. The course is titled ‘Linear andnonlinear regression and its applications’. His course is taught by one instructor over threedays with seven hours of lecture per day. His suggestions include be prepared and �exible,use multiple media, present each topic from the ground up, plant ‘seeds’ before getting to aparticular topic and tie a new topic back to previous lectures, use real problems for motivation,emphasize application of techniques rather than theory, use repetition in lecture, encouragediscussion, and be enthusiastic. These suggestions are applicable to almost any discipline ingeneral and to applied statistics in particular. Birch does not recommend providing studentswith handouts because he believes that it discourages student participation in the learningprocess.Cornell et al. [2] have described the short courses given by the Department of Statistics at
the University of Florida. Their course is primarily directed at people in industry. The coursetopics vary with each course. Each course is 2.5 days long which allows participants to taketwo courses back-to-back in one week. Their paper details their experiences in setting upthese classes but does not discuss in much depth what is taught and how it is taught.Kleinbaum [3] has taught 71 short courses over more than 20 years. He was invited by a
sponsor to give many of these courses. The format of his courses varied; many were doneas a business venture and with and without a co-teacher. He found that most participantsand instructors prefer classes of 2–4 days during the work week. Kleinbaum states that adisadvantage of short courses is that participants usually do not have time between lecturesto do homework or think about what they have learned. He strongly recommends providingcopies of handouts to the students.Roberson et al. [4] describe a ‘Research skills’ course taught at the University of Arkansas.
The �rst edition of the course met for two one-hour sessions per week for 8 weeks. A second
Copyright ? 2002 John Wiley & Sons, Ltd. Statist. Med. 2002; 21:2739–2756
INTENSIVE SHORT COURSES IN BIOSTATISTICS 2741
version met for two one-hour sessions per week for 12 weeks. Topics included design, sam-pling, population and samples, descriptive statistics, regression, ANOVA, interrater agree-ment, and others. The instructors assigned and graded homework although no scores weregiven. Somewhat surprisingly, the students were very good about completing their home-work in time. The authors concluded by listing nine suggestions for anyone designing acourse for a similar audience. Included in this list was use a textbook, require homework,use at most two instructors, provide handouts, use software, and intersperse new and oldconcepts. To encourage high attendance, participants and their mentors or supervisors wererequired to sign a commitment that the participant would attend at least 80 per cent of thelectures.O’Brien et al. [5] have a unique approach to teaching biostatistics. Their seminar was
entitled ‘Concepts in research design and biostatistics for clinical scientists’. In their seminar,most of the participants were residents and fellows from a single department or program(‘Department X’) but others include research nurses and experienced investigators. The groupsize was limited to twelve with two biostatisticians participating. One of the biostatisticiansworks collaboratively with Department X. Their seminar met weekly at 7 a.m. for six weeks.Sessions lasted at least one hour but were often extended if the participants were engrossedin discussion. Readings were assigned prior to class from Medical Uses of Statistics [11]which served to focus the discussions. The technical level was not high and a simple rule ofthumb was used: ‘Any equation or other technical matter that all biostatisticians would notknow quickly from memory is almost certainly too complex: : :’Peterson et al. [6] describe a course in clinical research methods taught in eight one-
hour sessions. The course was designed as an introductory course and covers study design,distributions, descriptive statistics comparative statistics, and clinical signi�cance.Ahn et al. [7] describe a course entitled ‘Clinical Research Design Course’ at the University
of Texas Health Science Center at Houston. Their course met weekly for nine 1.5 hoursessions. Like O’Brien [5], they focused on general design issues and principles rather thanon the mathematical details. Topics included hypothesis tests, design, randomization, samplesize, interval estimation, equivalence and meta-analysis. No formal evaluation was made butstudent suggestions resulted in the addition of lectures on outcomes research, drug developmentand sampling strategies for studies in human populations.Finally, Deutsch and Ahn [8] describe courses taught at the University of California at
San Diego and the University of Texas Health Science Center at Houston. These coursesranged from 8 to 10 weeks in length. The goals of the course were to familiarize clinicianswith research design, allow them to read the literature e�ectively, conduct simple analyseson their own, and communicate more e�ectively with biostatisticians. The UCSD lectureswere 1.5 hours once per week for 8 weeks. Topics included design, descriptive statistics,hypothesis testing, con�dence intervals, power, linear and logistic regression, survival analysis,ANOVA and ANCOVA, non-parametric statistics, and frequency data. Overhead projectorsand handouts were used. The course did not emphasize computation but a new course oncomputation was planned that would be a prerequisite for the existing course. At UTMS-Hthe course was taught as a part of a research design course that has been described previously[7]. The purpose of this course is similar to that o�ered at UCSD except that UCSD focusedmore on teaching how to read medical journals and the UTMS-H course also focused onethics and obtaining grant funding.Some of the features of these courses will be contrasted to our courses in Section 9.
Copyright ? 2002 John Wiley & Sons, Ltd. Statist. Med. 2002; 21:2739–2756
2742 W. T. AMBROSIUS AND A. K. MANATUNGA
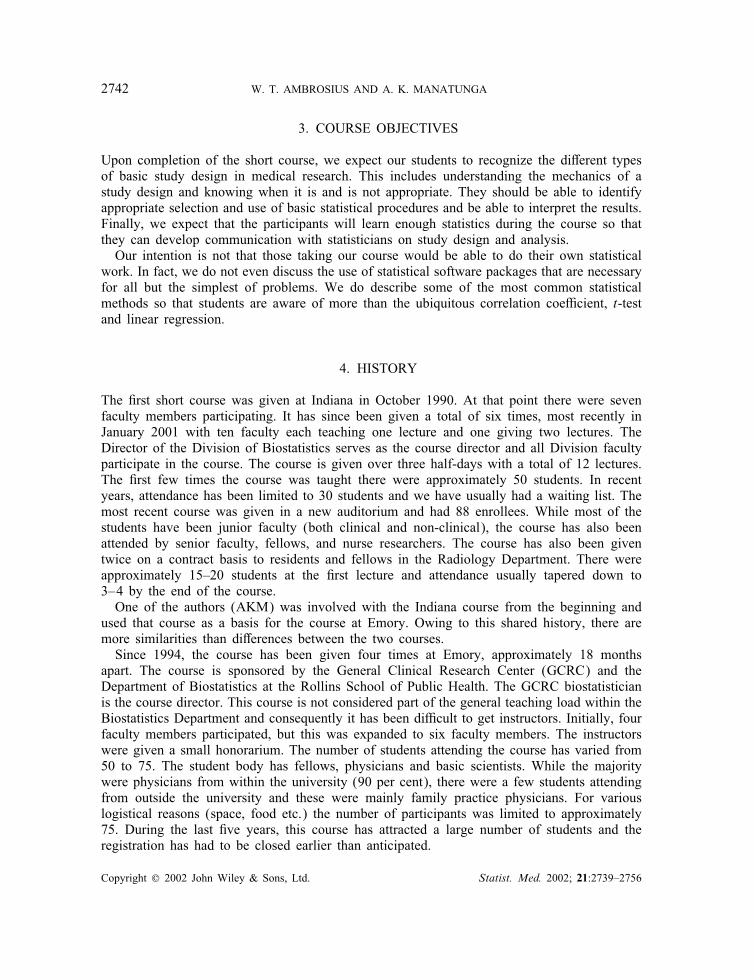
3. COURSE OBJECTIVES
Upon completion of the short course, we expect our students to recognize the di�erent typesof basic study design in medical research. This includes understanding the mechanics of astudy design and knowing when it is and is not appropriate. They should be able to identifyappropriate selection and use of basic statistical procedures and be able to interpret the results.Finally, we expect that the participants will learn enough statistics during the course so thatthey can develop communication with statisticians on study design and analysis.Our intention is not that those taking our course would be able to do their own statistical
work. In fact, we do not even discuss the use of statistical software packages that are necessaryfor all but the simplest of problems. We do describe some of the most common statisticalmethods so that students are aware of more than the ubiquitous correlation coe�cient, t-testand linear regression.
4. HISTORY
The �rst short course was given at Indiana in October 1990. At that point there were sevenfaculty members participating. It has since been given a total of six times, most recently inJanuary 2001 with ten faculty each teaching one lecture and one giving two lectures. TheDirector of the Division of Biostatistics serves as the course director and all Division facultyparticipate in the course. The course is given over three half-days with a total of 12 lectures.The �rst few times the course was taught there were approximately 50 students. In recentyears, attendance has been limited to 30 students and we have usually had a waiting list. Themost recent course was given in a new auditorium and had 88 enrollees. While most of thestudents have been junior faculty (both clinical and non-clinical), the course has also beenattended by senior faculty, fellows, and nurse researchers. The course has also been giventwice on a contract basis to residents and fellows in the Radiology Department. There wereapproximately 15–20 students at the �rst lecture and attendance usually tapered down to3–4 by the end of the course.One of the authors (AKM) was involved with the Indiana course from the beginning and
used that course as a basis for the course at Emory. Owing to this shared history, there aremore similarities than di�erences between the two courses.Since 1994, the course has been given four times at Emory, approximately 18 months
apart. The course is sponsored by the General Clinical Research Center (GCRC) and theDepartment of Biostatistics at the Rollins School of Public Health. The GCRC biostatisticianis the course director. This course is not considered part of the general teaching load within theBiostatistics Department and consequently it has been di�cult to get instructors. Initially, fourfaculty members participated, but this was expanded to six faculty members. The instructorswere given a small honorarium. The number of students attending the course has varied from50 to 75. The student body has fellows, physicians and basic scientists. While the majoritywere physicians from within the university (90 per cent), there were a few students attendingfrom outside the university and these were mainly family practice physicians. For variouslogistical reasons (space, food etc.) the number of participants was limited to approximately75. During the last �ve years, this course has attracted a large number of students and theregistration has had to be closed earlier than anticipated.
Copyright ? 2002 John Wiley & Sons, Ltd. Statist. Med. 2002; 21:2739–2756
INTENSIVE SHORT COURSES IN BIOSTATISTICS 2743
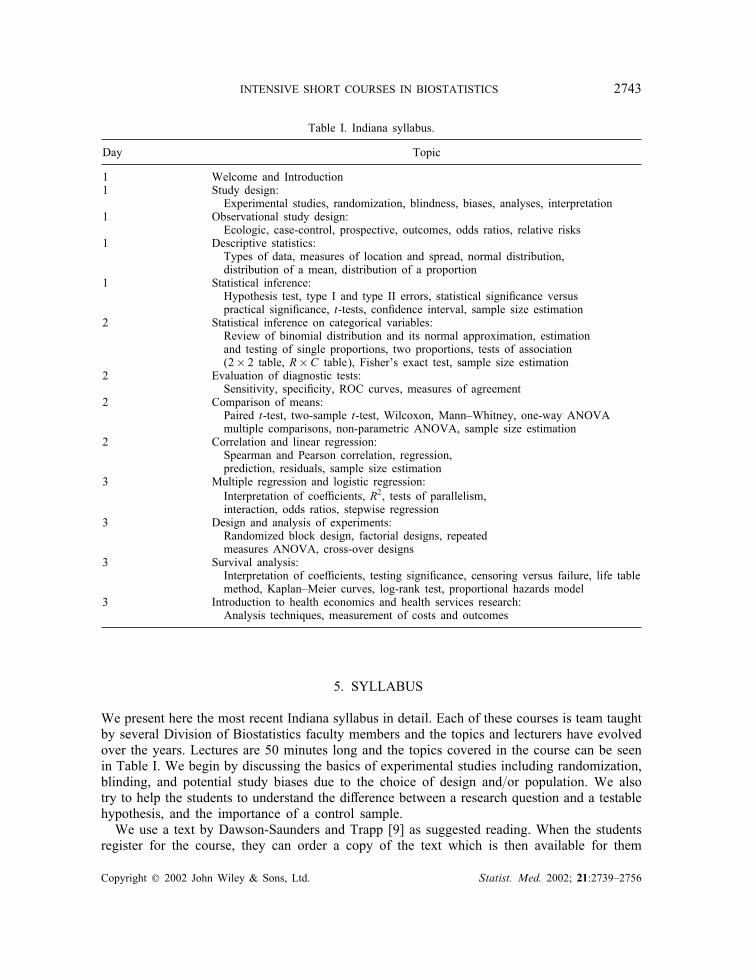
Table I. Indiana syllabus.
Day Topic
1 Welcome and Introduction1 Study design:
Experimental studies, randomization, blindness, biases, analyses, interpretation1 Observational study design:
Ecologic, case-control, prospective, outcomes, odds ratios, relative risks1 Descriptive statistics:
Types of data, measures of location and spread, normal distribution,distribution of a mean, distribution of a proportion
1 Statistical inference:Hypothesis test, type I and type II errors, statistical signi�cance versuspractical signi�cance, t-tests, con�dence interval, sample size estimation
2 Statistical inference on categorical variables:Review of binomial distribution and its normal approximation, estimationand testing of single proportions, two proportions, tests of association(2× 2 table, R×C table), Fisher’s exact test, sample size estimation
2 Evaluation of diagnostic tests:Sensitivity, speci�city, ROC curves, measures of agreement
2 Comparison of means:Paired t-test, two-sample t-test, Wilcoxon, Mann–Whitney, one-way ANOVAmultiple comparisons, non-parametric ANOVA, sample size estimation
2 Correlation and linear regression:Spearman and Pearson correlation, regression,prediction, residuals, sample size estimation
3 Multiple regression and logistic regression:Interpretation of coe�cients, R2, tests of parallelism,interaction, odds ratios, stepwise regression
3 Design and analysis of experiments:Randomized block design, factorial designs, repeatedmeasures ANOVA, cross-over designs
3 Survival analysis:Interpretation of coe�cients, testing signi�cance, censoring versus failure, life tablemethod, Kaplan–Meier curves, log-rank test, proportional hazards model
3 Introduction to health economics and health services research:Analysis techniques, measurement of costs and outcomes
5. SYLLABUS
We present here the most recent Indiana syllabus in detail. Each of these courses is team taughtby several Division of Biostatistics faculty members and the topics and lecturers have evolvedover the years. Lectures are 50 minutes long and the topics covered in the course can be seenin Table I. We begin by discussing the basics of experimental studies including randomization,blinding, and potential study biases due to the choice of design and=or population. We alsotry to help the students to understand the di�erence between a research question and a testablehypothesis, and the importance of a control sample.We use a text by Dawson-Saunders and Trapp [9] as suggested reading. When the students
register for the course, they can order a copy of the text which is then available for them
Copyright ? 2002 John Wiley & Sons, Ltd. Statist. Med. 2002; 21:2739–2756
2744 W. T. AMBROSIUS AND A. K. MANATUNGA
to pick up at the �rst class. We do not closely follow the text but we believe that studentsbene�t by having a reference that goes into more depth than we are able to in our lectures.One lecture is spent on study design for observational studies and another for experimental
studies. In the �rst of these lectures we describe observational studies including a comparisonof risk versus rate, ecological studies, case-control, and prospective studies. The second ofthese study design lectures comes on day three after the discussions of inference and hypoth-esis testing using general linear models. It discusses experimental units, randomization, andvarious experimental designs including completely randomized, randomized block, factorial,repeated measures and cross-over.In the lecture on descriptive statistics we discuss types of data (continuous, nominal, or-
dinal etc.), elementary graphics, measures of location and spread, and the di�erence betweenstandard deviation and standard error. We also introduce the normal curve and the binomialdistribution.This is followed by a lecture on inference that describes the basics of hypothesis testing
and provides several examples of distributions of test statistics. One- and two-sample t-testsare de�ned and shown via example. This is followed by a discussion of type I and II errors,sample size estimates for the one-sample problem, and con�dence intervals. Another lecturediscusses inference for categorical variables and discusses testing for a di�erence betweentwo proportions using both a �2 and Fisher’s exact tests as well as McNemar’s test formatched pairs. It ends with a discussion of estimated power for a �2 test using the normalapproximation.One lecture is spent on diagnostic tests including sensitivity, speci�city, positive predicted
value, and negative predicted value and their connection to ROC curves. This lecture alsocontains a discussion of the kappa agreement statistic. We then return to hypothesis testing ina lecture devoted to comparing means. In this discussion we discuss paired and two-samplet-tests and one-way analysis of variance and the assumptions necessary for these methods tobe valid. In addition, the Wilcoxon signed rank and rank-sum tests are introduced for non-normal data. Finally, we touch on sample size calculations for one- and two-sample t-tests aswell as on multiple comparisons for one-way ANOVA.Two lectures are spent discussing correlation, univariate and multivariate regression and
logistic regression. In these lectures, we discuss the interpretation of coe�cients (correlation,intercepts and slopes), model diagnostics, prediction and odds ratios. We also discuss modelselection methods for multiple linear regression.A lecture is devoted to survival analysis using examples which are analysed and the results
are interpreted. Finally, we have a lecture on health economics and health services research.This lecture describes the goals of health services research including the e�ects of regulatoryand policy changes, the comparison of alternative treatments in terms of resource use, issuesrelated to access of health care, and the prioritization of resource usage. Outcomes can include(but are not limited to) dollars or quality adjusted life years.The syllabus at Emory is closely related to the Indiana syllabus. One reason for the Emory
modi�cations is the limited number of available instructors. Initially, the Emory course was ahalf-day in length, given in one afternoon. Later, the course was expanded to be a one-full-daycourse. The half-day course syllabus consisted of three one-hour lectures: study design and de-scriptive statistics; statistical inference, and advanced statistical methods. The �rst and secondlectures cover the same materials as the Indiana syllabus, but the materials were modi�ed to�t them into one-hour lectures. The third lecture covers ANOVA, diagnostic tests, regression,
Copyright ? 2002 John Wiley & Sons, Ltd. Statist. Med. 2002; 21:2739–2756
INTENSIVE SHORT COURSES IN BIOSTATISTICS 2745
logistic regression and survival analysis. In this lecture the focus is mainly on examples andtheir interpretation. For the full-day course, in addition to lectures on study design, descriptivestatistics and inference, we expand the general statistical methods to three lectures: ANOVAand multiple regression; logistic regression and survival analysis, and sample size and clinicalinterpretation. The lectures on ANOVA, multiple regression, logistic regression, and survivalanalysis are similar to those at Indiana. In the lecture on sample size and clinical interpreta-tion we discuss the estimation of sample size for one sample mean, two sample mean, oneproportion, two proportions, and survival analysis. We also discuss the sample size estimationfor con�dence intervals and the concept of clinical signi�cance versus statistical signi�cance.No text is assigned but we distribute a list of 11 texts [10–20] for reference. During class weprovide a brief discussion emphasizing the mathematical and practical strengths and weak-nesses of these texts. Many are beyond the grasp of our typical students but we felt it betterto err on the side of too much information.One obvious omission from this course is computational issues. We spend very little time
discussing the use of statistical software. Instead, we provide a handout listing commonly usedsoftware and brie�y discuss the use of such packages during the rest of the lectures. It isadmittedly very di�cult to do much of interest statistically without a computer package, butthere is simply not enough time for us to teach the use of such software or for the studentsto become pro�cient.We note that the Indiana syllabus �ts into three afternoons. However, as was done at Emory,
the syllabus can be adjusted or modi�ed depending on institutional or audience needs.
6. ISSUES AND CHALLENGES IN COURSE DESIGN
6.1. Course level and student survey
The �rst decision to make in designing a course is to determine the level at which the coursewill be taught. At Emory a survey was conducted to determine the statistical experience ofcourse participants before the beginning of the course. Students’ knowledge ranged from nostatistical experience to several courses during their undergraduate and professional training.Unfortunately, this approach did not provide su�cient information to tailor the course to thelevels of the students. The questionnaire asked for student background but did not ask speci�cquestions. The responses generally were that a student had a statistics course in college ormedical school. This was not particularly useful for designing a short course because we didnot learn what they know now. A disadvantage of tailoring the course to the students eachyear is that instructors may not have the time or inclination to revise their lectures for eachshort course.In many ways the choice of topics and trade-o�s between breadth and depth are the same
as for any course. Aim too high and many of the best students will learn a lot but the weakerstudents will get very little. Aim too low and the best students will get little from the courseand the worst students may not get much more. The statistical experience of our studentsvaries widely. Approximately a month after the 2001 IU course, we sent a two-page surveyto all students asking them to rate their familiarity with twelve topics before and after takingthe short course using a �ve-point scale. One month after the surveys had been sent out,we had a response rate of 51 per cent (45=88). We received approval from the Institutional
Copyright ? 2002 John Wiley & Sons, Ltd. Statist. Med. 2002; 21:2739–2756
2746 W. T. AMBROSIUS AND A. K. MANATUNGA
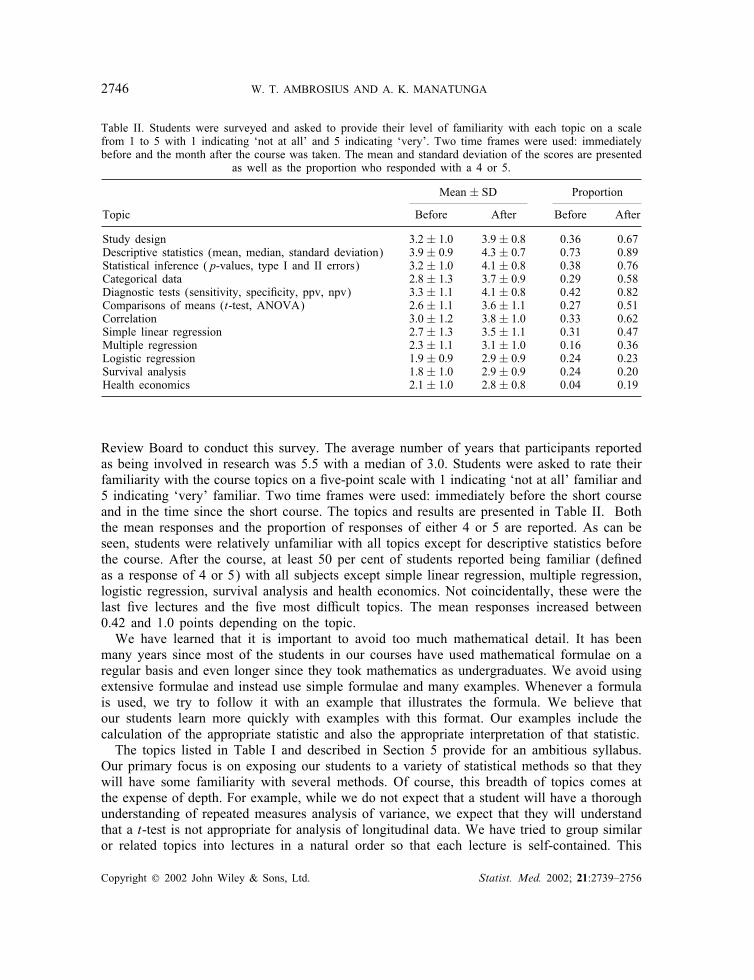
Table II. Students were surveyed and asked to provide their level of familiarity with each topic on a scalefrom 1 to 5 with 1 indicating ‘not at all’ and 5 indicating ‘very’. Two time frames were used: immediatelybefore and the month after the course was taken. The mean and standard deviation of the scores are presented
as well as the proportion who responded with a 4 or 5.
Mean ± SD Proportion
Topic Before After Before After
Study design 3:2± 1:0 3:9± 0:8 0.36 0.67Descriptive statistics (mean, median, standard deviation) 3:9± 0:9 4:3± 0:7 0.73 0.89Statistical inference (p-values, type I and II errors) 3:2± 1:0 4:1± 0:8 0.38 0.76Categorical data 2:8± 1:3 3:7± 0:9 0.29 0.58Diagnostic tests (sensitivity, speci�city, ppv, npv) 3:3± 1:1 4:1± 0:8 0.42 0.82Comparisons of means (t-test, ANOVA) 2:6± 1:1 3:6± 1:1 0.27 0.51Correlation 3:0± 1:2 3:8± 1:0 0.33 0.62Simple linear regression 2:7± 1:3 3:5± 1:1 0.31 0.47Multiple regression 2:3± 1:1 3:1± 1:0 0.16 0.36Logistic regression 1:9± 0:9 2:9± 0:9 0.24 0.23Survival analysis 1:8± 1:0 2:9± 0:9 0.24 0.20Health economics 2:1± 1:0 2:8± 0:8 0.04 0.19
Review Board to conduct this survey. The average number of years that participants reportedas being involved in research was 5.5 with a median of 3.0. Students were asked to rate theirfamiliarity with the course topics on a �ve-point scale with 1 indicating ‘not at all’ familiar and5 indicating ‘very’ familiar. Two time frames were used: immediately before the short courseand in the time since the short course. The topics and results are presented in Table II. Boththe mean responses and the proportion of responses of either 4 or 5 are reported. As can beseen, students were relatively unfamiliar with all topics except for descriptive statistics beforethe course. After the course, at least 50 per cent of students reported being familiar (de�nedas a response of 4 or 5) with all subjects except simple linear regression, multiple regression,logistic regression, survival analysis and health economics. Not coincidentally, these were thelast �ve lectures and the �ve most di�cult topics. The mean responses increased between0.42 and 1.0 points depending on the topic.We have learned that it is important to avoid too much mathematical detail. It has been
many years since most of the students in our courses have used mathematical formulae on aregular basis and even longer since they took mathematics as undergraduates. We avoid usingextensive formulae and instead use simple formulae and many examples. Whenever a formulais used, we try to follow it with an example that illustrates the formula. We believe thatour students learn more quickly with examples with this format. Our examples include thecalculation of the appropriate statistic and also the appropriate interpretation of that statistic.The topics listed in Table I and described in Section 5 provide for an ambitious syllabus.
Our primary focus is on exposing our students to a variety of statistical methods so that theywill have some familiarity with several methods. Of course, this breadth of topics comes atthe expense of depth. For example, while we do not expect that a student will have a thoroughunderstanding of repeated measures analysis of variance, we expect that they will understandthat a t-test is not appropriate for analysis of longitudinal data. We have tried to group similaror related topics into lectures in a natural order so that each lecture is self-contained. This
Copyright ? 2002 John Wiley & Sons, Ltd. Statist. Med. 2002; 21:2739–2756
INTENSIVE SHORT COURSES IN BIOSTATISTICS 2747
does result in some lectures that cover more material than others. Another option would beto make the lectures of unequal lengths.
6.2. Choice of faculty
The choice of faculty for a short course is important to its success. At Indiana, the courseis taught by all of the full-time faculty and one adjunct faculty. This is perhaps not the bestsituation because there is variability in the teaching skills of any group of twelve people.However, as this is considered part of the general teaching load of the faculty, it would bevery di�cult to assign the teaching load unevenly. Thus, the decision is made on politicalgrounds rather than on teaching skills. At Emory, the course is not considered part of theregular teaching load and consequently there is more freedom in the choice of instructors.Instructors are selected based on their teaching skills, applied collaborative research expe-rience, and availability. Of these, consulting experience is an absolute requirement becausethe course material is focused on interpretation of results rather than presentation of theory.In many Departments of Statistics and Biostatistics the faculty consists of individuals whohave experience in teaching undergraduate and=or graduate statistics courses. Instructors whoperform well in teaching theoretical courses may not necessarily do well in teaching an ap-plied short course because the nature of teaching the short course described here substantiallydi�ers from the style of teaching standard undergraduate courses. As most of the students inshort courses are professionals, they are more focused on learning how the knowledge can beapplied to their own work. Consequently, they tend to ask more questions particularly relevantto their own research. On many occasions, the questions cover a wide range of topics whichmay not even be discussed during the course. Instructors often have to face the challengeof understanding complex questions that arise from a diverse student body. The success ofthe course will depend on how these questions are handled in addition to the quality of thelectures. In our experience, instructors who have a broad consulting experience are comfort-able in these teaching environments. In summary, a successful instructor for this kind of shortcourse will have the following qualities: (i) be well organized; (ii) be able to communicateclearly; (iii) have the ability to interpret complex mathematical formulae in simple terms; (iv)be able to understand and respond to a wide range of applied questions; and (v) be able toidentify and emphasize important concepts without extensive details.At Emory, a small honorarium is o�ered for participating individuals. Since the Department
of Biostatistics at Emory has a graduate programme, each faculty member carries a consider-able teaching load. Therefore, it has been di�cult to �nd instructors who are willing to teachan additional course. In addition, there may also be little professional bene�t for a facultymember in the School of Public Health to teach a course in the School of Medicine. Anothersource of instructors may be the statisticians working in other departments of the School ofMedicine.Using multiple instructors has both advantages and disadvantages. As will be discussed
further in Section 7, there was considerable variability between faculty. Notice also that indi-vidual instructors tend to vary over time, which indicates that the di�erences between facultymight be noise as much as a systematic di�erence. (Unfortunately, we no longer have the rawdata but only have the summary statistics.) Choosing the best available faculty would likelyresult in a stronger overall course. The notation used would be more consistent. However,it is much more di�cult (both mentally and physically) to give a series of lectures in one
Copyright ? 2002 John Wiley & Sons, Ltd. Statist. Med. 2002; 21:2739–2756
2748 W. T. AMBROSIUS AND A. K. MANATUNGA
afternoon rather than to give just one. These factors should be weighed when choosing facultyfor a short course.
6.3. Students as researchers
The students who take our courses are active research scientists. This type of student presentsat least two challenges not encountered in an undergraduate or a graduate level course. The�rst of these is that the students come from many di�erent �elds of medicine which makesthe choice of examples di�cult. If all students were cancer researchers, then it would beappropriate to include only cancer examples. Of course, this is not the case and we attemptto draw examples from a variety of �elds of medicine. At Indiana, where the entire facultyis involved, each faculty member chooses examples from his or her collaborative researchareas. Therefore, the examples presented in the short course tend to mirror the research atIndiana and we hope that every participant will have an example or two from his or her �eld.At Emory, the examples are also chosen by the instructors and tend to be in the areas ofhypertension, cardiology, and cancer.The second unique challenge is directly attributable to the fact that the students are them-
selves researchers. They often have data of their own and a particular research question inmind. If they hope to learn ‘the answer’ to their problem, they are unlikely to be happy withthe course. The di�culty with this is, as any consulting biostatistician knows, that researchproblems are rarely simple enough that a satisfactory solution can be found within the veryshort time available. If we spent more time solving an individual researcher’s research prob-lem, then we would likely lose the interest of the other students. We suggest that there betime after the lecture(s) for informal one-to-one discussions.
6.4. Course format
Between our two institutions, there have been three di�erent formats used for the course. Theyare three consecutive afternoons, one full day, and one lecture in each of twelve consecutiveweeks. Indiana has used the three-afternoon and twelve-week formats. The three afternooncourse is taught from 1.00–5.00 p.m. Each lecture is 50 minutes long with 5 minutes forintroduction of speakers and questions. There is one 20 minute break per day. During thetwelve-week format, each lecture is from 7.00–8.00 a.m. Of these two the overwhelmingfavourite is the three-afternoon format. For the instructors, it is much simpler to schedule oneweek of lectures rather than three months of lectures. Much more importantly, however, isthe preferences of the students. Attendance drops o� slightly on the second and third dayof the three-day course, but attendance has been much worse in the twelve-week course. Inthe most recent edition, upwards of 75 per cent of the class were no longer coming towardsthe end of the course. It appears that students do not like 7 a.m. classes any more than thefaculty does and interest wanes as the course progresses.Emory o�ers the day-long course on Saturday. During the day-long course at Emory, lec-
tures are 40 minutes long with 20 minutes for a questions and answer period. This is a recentchange from 60 minute lectures without questions and answers. The students have respondedwell to this change in format. The class is set up so that students can freely walk to themicrophones which are located in four corners of the class. The panel of instructors seems tocreate a friendly environment for discussion. This environment also allows the instructors tospeak out about a topic at his=her own level of comfort. The intent of the environment is to
Copyright ? 2002 John Wiley & Sons, Ltd. Statist. Med. 2002; 21:2739–2756
INTENSIVE SHORT COURSES IN BIOSTATISTICS 2749
stimulate discussion but it is essential to keep a balance between teaching and discussion. Inorder to carry out a successful discussion we have used a moderator who is an experiencedresearcher. A good moderator should have the ability to (i) facilitate discussion by allowingappropriate time for both faculty and students, (ii) avoid becoming bogged down in the de-tails of individual research questions, (iii) clarify and rephrase questions and answers, and(iv) make his=her own contribution to maintain a productive discussion. The success of thismodi�ed approach is dependent on having a strong moderator and lecturers with extensiveapplied research experience.The day-long format is preferred because it minimizes scheduling con�icts for physicians.
However, the three afternoon course structure provides a better environment for covering moreadvanced material and a more detailed course. It also gives the freedom for students to attendsome or all of the lectures. An individual may decide, for example, that he or she has acquiredsu�cient knowledge of basic statistics after attending two afternoon sessions.Physical and mental endurance becomes an issue for both students and lecturers during a
day-long course. In addition, it is often di�cult for physicians to be out of their clinic foran entire day. If students were travelling to attend this course, it might be easier to have aday-long course. However, as most of our students are from our local campuses it does notimpose much of a travel burden to meet three times rather than once.All presentations are made using 35 mm slides or Microsoft PowerPoint projected directly
from a laptop. Both of these approaches allow for professional-looking presentations. A fewof the more senior faculty have some slides that have been used for several years and arenot in PowerPoint. We are slowly converting all slides to PowerPoint for two reasons: the�rst is that if all slides are in PowerPoint it is very easy for our administrative sta� to makecopies of them to give to the students; the second is that it is much easier to make changesto the electronic versions of the presentations and we can avoid having to make more slideswhenever a change is needed. The students appreciate having copies of the presentations weuse because it makes note taking much easier and gives them something to which to referafter the course is �nished.
6.5. Enrolment and classroom discussion
The enrolment in the IU course has ranged from less than 10 to nearly 90. The enrolmenthas been 5–15 when taught at IU in the twelve-week version. In recent years, the enrolmenthas been capped at 30 because of space limitations. A new auditorium was used for the 2001IU course that allowed us e�ectively to drop the enrolment limit. We had 88 students. Asidefrom the need to make more copies of the handouts, the preparation was no more di�cult.With 30 students there were a few questions, but with 88 there were many more questionswhich led to interesting discussions. This seems to contradict the usual teaching experiencesbecause often smaller groups lead to better discussions. While the reasons for this are notclear, there are two possibilities. One is that there were more outgoing students and the secondis that there were more students who knew the instructor. Both of these are related to thelarger class size. As we have only taught with a large class size once, this observation mightnot be generalizable. Based on this, we prefer to have a larger enrolment. Of course, a largerenrolment can also be more pro�table.At both institutions we encourage the students to ask questions during the lectures. With
a larger class size there are more frequent questions. We feel it is much better to help a
Copyright ? 2002 John Wiley & Sons, Ltd. Statist. Med. 2002; 21:2739–2756
2750 W. T. AMBROSIUS AND A. K. MANATUNGA
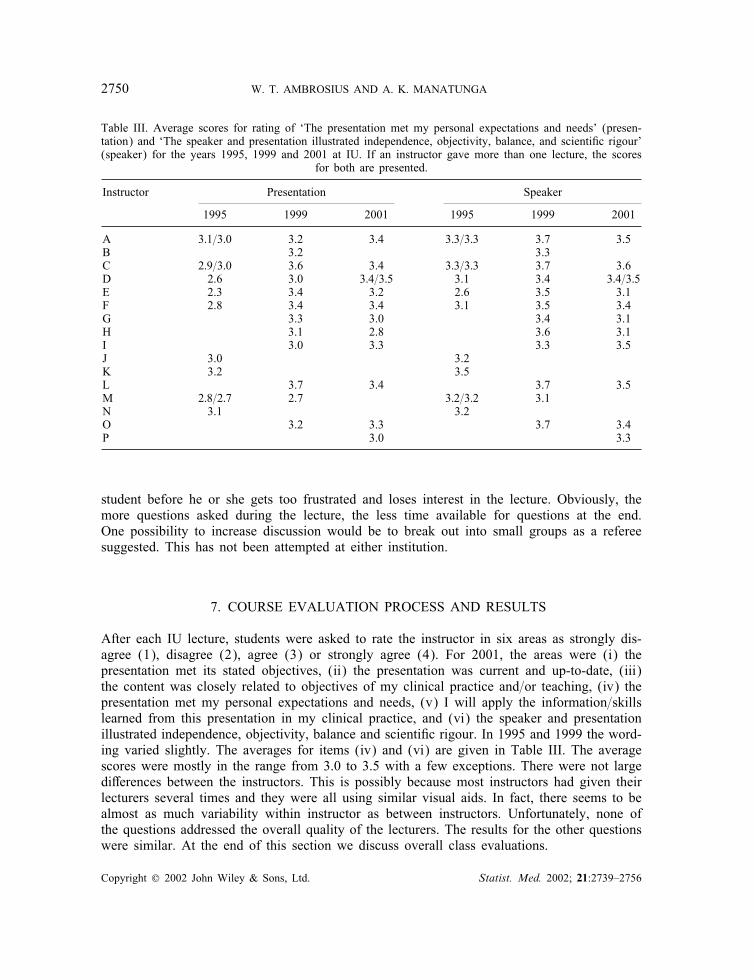
Table III. Average scores for rating of ‘The presentation met my personal expectations and needs’ (presen-tation) and ‘The speaker and presentation illustrated independence, objectivity, balance, and scienti�c rigour’(speaker) for the years 1995, 1999 and 2001 at IU. If an instructor gave more than one lecture, the scores
for both are presented.
Instructor Presentation Speaker
1995 1999 2001 1995 1999 2001
A 3:1=3:0 3.2 3.4 3:3=3:3 3.7 3.5B 3.2 3.3C 2:9=3:0 3.6 3.4 3:3=3:3 3.7 3.6D 2.6 3.0 3:4=3:5 3.1 3.4 3:4=3:5E 2.3 3.4 3.2 2.6 3.5 3.1F 2.8 3.4 3.4 3.1 3.5 3.4G 3.3 3.0 3.4 3.1H 3.1 2.8 3.6 3.1I 3.0 3.3 3.3 3.5J 3.0 3.2K 3.2 3.5L 3.7 3.4 3.7 3.5M 2:8=2:7 2.7 3:2=3:2 3.1N 3.1 3.2O 3.2 3.3 3.7 3.4P 3.0 3.3
student before he or she gets too frustrated and loses interest in the lecture. Obviously, themore questions asked during the lecture, the less time available for questions at the end.One possibility to increase discussion would be to break out into small groups as a refereesuggested. This has not been attempted at either institution.
7. COURSE EVALUATION PROCESS AND RESULTS
After each IU lecture, students were asked to rate the instructor in six areas as strongly dis-agree (1), disagree (2), agree (3) or strongly agree (4). For 2001, the areas were (i) thepresentation met its stated objectives, (ii) the presentation was current and up-to-date, (iii)the content was closely related to objectives of my clinical practice and=or teaching, (iv) thepresentation met my personal expectations and needs, (v) I will apply the information=skillslearned from this presentation in my clinical practice, and (vi) the speaker and presentationillustrated independence, objectivity, balance and scienti�c rigour. In 1995 and 1999 the word-ing varied slightly. The averages for items (iv) and (vi) are given in Table III. The averagescores were mostly in the range from 3.0 to 3.5 with a few exceptions. There were not largedi�erences between the instructors. This is possibly because most instructors had given theirlecturers several times and they were all using similar visual aids. In fact, there seems to bealmost as much variability within instructor as between instructors. Unfortunately, none ofthe questions addressed the overall quality of the lecturers. The results for the other questionswere similar. At the end of this section we discuss overall class evaluations.
Copyright ? 2002 John Wiley & Sons, Ltd. Statist. Med. 2002; 21:2739–2756
INTENSIVE SHORT COURSES IN BIOSTATISTICS 2751
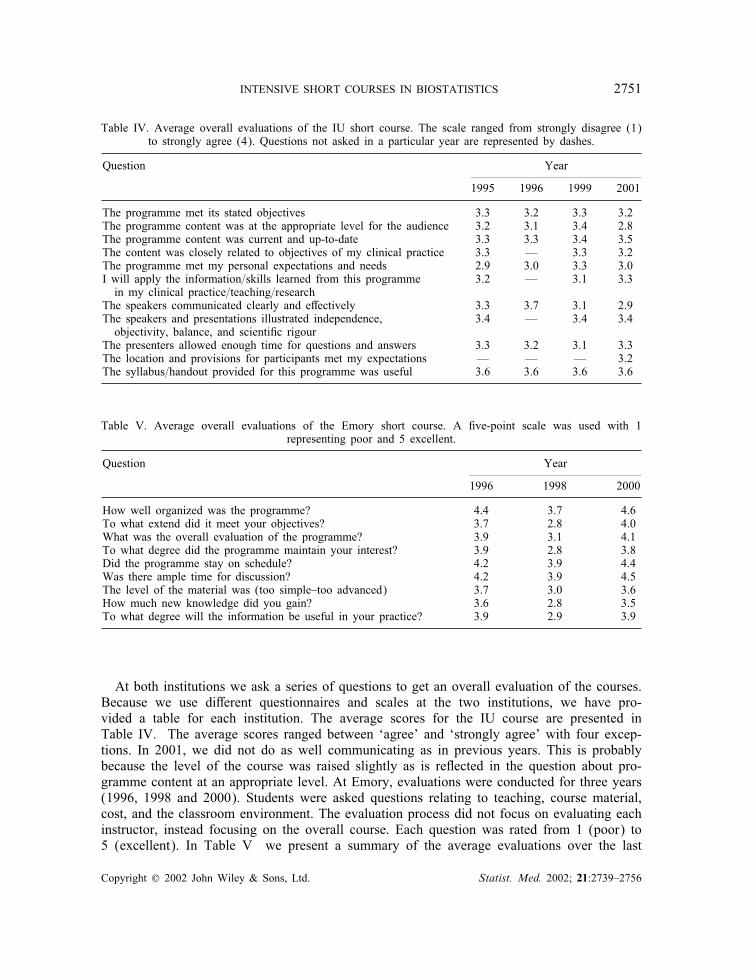
Table IV. Average overall evaluations of the IU short course. The scale ranged from strongly disagree (1)to strongly agree (4). Questions not asked in a particular year are represented by dashes.
Question Year
1995 1996 1999 2001
The programme met its stated objectives 3.3 3.2 3.3 3.2The programme content was at the appropriate level for the audience 3.2 3.1 3.4 2.8The programme content was current and up-to-date 3.3 3.3 3.4 3.5The content was closely related to objectives of my clinical practice 3.3 — 3.3 3.2The programme met my personal expectations and needs 2.9 3.0 3.3 3.0I will apply the information=skills learned from this programme 3.2 — 3.1 3.3in my clinical practice=teaching=research
The speakers communicated clearly and e�ectively 3.3 3.7 3.1 2.9The speakers and presentations illustrated independence, 3.4 — 3.4 3.4objectivity, balance, and scienti�c rigour
The presenters allowed enough time for questions and answers 3.3 3.2 3.1 3.3The location and provisions for participants met my expectations — — — 3.2The syllabus=handout provided for this programme was useful 3.6 3.6 3.6 3.6
Table V. Average overall evaluations of the Emory short course. A �ve-point scale was used with 1representing poor and 5 excellent.
Question Year
1996 1998 2000
How well organized was the programme? 4.4 3.7 4.6To what extend did it meet your objectives? 3.7 2.8 4.0What was the overall evaluation of the programme? 3.9 3.1 4.1To what degree did the programme maintain your interest? 3.9 2.8 3.8Did the programme stay on schedule? 4.2 3.9 4.4Was there ample time for discussion? 4.2 3.9 4.5The level of the material was (too simple–too advanced) 3.7 3.0 3.6How much new knowledge did you gain? 3.6 2.8 3.5To what degree will the information be useful in your practice? 3.9 2.9 3.9
At both institutions we ask a series of questions to get an overall evaluation of the courses.Because we use di�erent questionnaires and scales at the two institutions, we have pro-vided a table for each institution. The average scores for the IU course are presented inTable IV. The average scores ranged between ‘agree’ and ‘strongly agree’ with four excep-tions. In 2001, we did not do as well communicating as in previous years. This is probablybecause the level of the course was raised slightly as is re�ected in the question about pro-gramme content at an appropriate level. At Emory, evaluations were conducted for three years(1996, 1998 and 2000). Students were asked questions relating to teaching, course material,cost, and the classroom environment. The evaluation process did not focus on evaluating eachinstructor, instead focusing on the overall course. Each question was rated from 1 (poor) to5 (excellent). In Table V we present a summary of the average evaluations over the last
Copyright ? 2002 John Wiley & Sons, Ltd. Statist. Med. 2002; 21:2739–2756
2752 W. T. AMBROSIUS AND A. K. MANATUNGA
three editions of the course. The average scores tended to range from 3.0 to 4.5, indicatingmoderate enthusiasm.After the 2001 edition of the course at IU, we surveyed the students as described in
Section 6. We asked three overall evaluation questions that asked for a yes=no response; 90per cent of students would recommend that their colleague take the course in the future, 86per cent believed that the course has helped them to read the literature in their �eld, and85 per cent believed that it has helped or expect it will help with their research.
8. FINANCIAL AND LOGISTICAL ARRANGEMENTS
8.1. Indiana
When the course �rst began the administrative sta� of the Division of Biostatistics wereresponsible for most of the planning involved. In the last few years we have worked withSchool of Medicine’s Division of Continuing Medical Education (DCME). They now areresponsible for all scheduling, design of the brochure and registration form, and advertising.They also process all registrations and provide us with a list of students. Students have theability to purchase a copy of the text with registration and these are delivered by DCME tothe classroom. DCME provides an on-site person to register the students and refreshmentsat the break halfway through each afternoon’s series of lectures. DCME is responsible forgranting continuing medical education credit to the participants. This course has attractedmany interested students in recent years and we had a waiting list in recent years except forthe 2001 course where we had a larger auditorium.When we teach the twelve-week format the setting is more informal. We do not provide
continuing medical education credit or refreshments. This is usually a much smaller group ofstudents and attendance has not been as reliable.The Division of Biostatistics receives some monies from the School of Medicine for our
teaching activities which cover our e�orts for this course. The costs of the course ($125for two days or $150 for three days) are set so that we just break even after paying forphotocopying and for the services that DMCE provides. We made a tidy pro�t of $67 in1999 and $30 in 1996. In 2001 we made just over $7100 because we had more participantsand our costs for printing, mailing, and brochure design did not go up commensurately. Thesesums alone are too low to make it ‘pro�table’ to teach this course, but it is o�ered primarilyas a service to the university community as part of our teaching mission.The radiology residents and fellows have often had a di�cult time taking the regular three-
afternoon format of the short course due to scheduling problems. They requested that we o�erthe course for them in the twelve-week 7 a.m. format. We have done this three times. Whenteaching this course, we have simply charged $3000 for approximately 36 hours of facultytime, assuming two hours of preparation (we use the same slides and presentations as theother short course) and one hour of lecture for each of the twelve lectures.Almost all (10 of 11 this last time) of the faculty who teach are full-time faculty members.
The other is an Adjunct Scientist. She is not paid for her services but the University requiressome level of service from adjunct appointees in return for adjunct status. The Division haschosen to request that our adjunct faculty help to teach this course in return for our continuingto recommend that their adjunct status be renewed.
Copyright ? 2002 John Wiley & Sons, Ltd. Statist. Med. 2002; 21:2739–2756
INTENSIVE SHORT COURSES IN BIOSTATISTICS 2753
8.2. Emory
As at Indiana, the course arrangements are made with the DCME department. They areresponsible for all logistical arrangements concerning the course. At Emory, when the course�rst began, there was no charge to the students. The General Clinical Research Center paidall expenses including honoraria to instructors. When �rst given, there were 150 registrants,but only 50 students attended the course. With this experience, we later set the course fee tobe $100. This includes course material, refreshments, and a lunch.Last year, three of the six instructors who participated in teaching did so to ful�l their
responsibility to the General Clinical Research Center. The other three instructors were paidfor their service with an honorarium of $375 each. A total pro�t of approximately $1500 wasmade. These monies are set aside for travelling, buying books and future course developmentplanning. One year, $800 was donated by a pharmaceutical company to allow the course tobe videotaped. Taping the course has been useful in several ways. The tapes are availableas a training tool for educating the GCRC residents and fellows. After viewing these tapes,a resident may meet with the statistician for discussion. The intent is not to replace theclass by the tape, but to provide one-to-one individual training for those who are unable toattend the class. In addition, instructors are highly encouraged to view these tapes at thepreparation stage. This procedure has been useful in improving the quality of teaching (forexample, teaching style, handling questions, use of appropriate examples, time management,etc.) in subsequent classes. Perhaps most importantly, the tapes have been invaluable to newinstructors who do not have experience in teaching such short courses. Viewing the tapesprior to teaching provides new instructors useful insight about the background of students andthe dynamics of the class.
9. COMPARISON TO OTHER COURSES
The courses given by Birch [1], Cornell et al. [2], and Kleinbaum [3] are given primarilyfor �nancial reasons. Although our two courses do make some money, our primary goal isto ful�l part of our service mission to our institutions and, at Emory, to the GCRC. In thisregard, our course is more like those given by Roberson et al. [4], O’Brien et al. [5], Petersonet al. [6], Ahn et al. [7] and Deutsch et al. [8].Like us, Birch has students who are highly motivated. His students wish to learn the
material as quickly as possible and begin using the methods immediately. Presumably theother commercial courses [2, 3] have similarly motivated students because they must pay aconsiderable amount of money to attend. The remainder of the courses [4–8] are in academicmedical centres where the students often understand the need for biostatistics in medicalresearch and are therefore motivated.We have provided our students with copies of our presentations and they have always been
well received (in 2001 at IU, 98 per cent of students felt that the handout and syllabus wereuseful). Kleinbaum agrees that copies of transparencies are well liked by the participants.Birch prefers to write notes on �ip charts during class because he believes that the act ofcopying the information reinforces the learning.The schedule of the courses varies with institution. At Emory, our students have preferred
to have a Saturday class because of clinical responsibilities during the week. This experience
Copyright ? 2002 John Wiley & Sons, Ltd. Statist. Med. 2002; 21:2739–2756
2754 W. T. AMBROSIUS AND A. K. MANATUNGA
is thus di�erent from that of Kleinbaum [3] who has found that his students prefer coursesduring the work week. Many of the other courses [5–8] were given early in the morning orlate in the afternoon to minimize con�icts with clinical responsibilities. At IU most clinics areduring the morning hours which allows more people to take an afternoon class. In addition, atIU we have found that our students can clear their afternoon schedules with su�cient notice.As in our course, the stated goal of most other biostatistics courses is to teach many of
the basic statistical techniques [4–6, 8] and to allow for better communication with biostatis-ticians [8].
10. DISCUSSION
When planning a short course, there are many issues and challenges that need to be considered.In this paper we have presented the design of an intensive short course in biostatistics forphysicians. We have discussed the details necessary when designing a short course includingthe syllabus, selecting the instructors, scheduling, and the �nancial arrangements as well assome of the issues and challenges that must be addressed in course design. This course hasbeen successfully implemented at Indiana and then successfully modi�ed at Emory. The coursedescribed in this paper will likely not be perfect for other institutions, but we hope that itcan be modi�ed appropriately.Our goal is not to teach statistics to physicians in 8–12 hours of lecture. Rather, we hope
that participants will be able to recognize study designs and appropriate common statisticalprocedures and their interpretations in medical research. This will bene�t the students in theirreading of the medical literature and we hope that it will allow for more fruitful collaborationwith a statistician.At both institutions the course evaluations from students have been favourable and usually
the course is full. Di�erent departments request presentation of the course as new facultyarrive on campus. In order to �ll this demand, it is usually o�ered every 18 months.We strongly recommend charging a registration fee even if the course is fully supported
using other funds. Our experience has shown that without spending some of their own money,students are less likely to attend all lectures. Of course, most registration fees are paid fromdepartmental funds. We have never compared attendance proportions of those who pay them-selves to those whose fees are paid by their departments. Others who teach similar courseshave had the same experience (discussion at the annual meeting of Association of GCRCStatisticians, Dallas, 1998).While it is possible to make a small pro�t (or at the very least no loss) from such a
course, it is most certainly not worth doing solely for monetary gain; this is strictly a servicecourse. At many universities it might be possible to incorporate this course into an existingtraining programme. For example, at Emory the course is o�ered in conjunction with theGCRC training programme which allows costs to be shared.Teaching a short course such as this is very di�erent from teaching a standard biostatis-
tics course. Faculty selection (complimentary teaching styles), faculty preparation, and handoutpreparation are critical components to the success of the course. There should be a co-ordinatoror course director for the course to make sure the lectures and notation are consistent through-out all the lectures. There is also a large variability in the statistical experiences of the studentswhich can make teaching such a course di�cult. Many of the students would prefer to spend
Copyright ? 2002 John Wiley & Sons, Ltd. Statist. Med. 2002; 21:2739–2756
INTENSIVE SHORT COURSES IN BIOSTATISTICS 2755
time on advanced topics but others need to learn or relearn the basics �rst. We have tendedto aim at the middle and hope that all students will learn something.Successfully implementing a short course requires considerable faculty time but also requires
a willing and helpful sta�. Sta� will be called upon to co-ordinate the logistical details of thecourse. The co-ordinator or course director will also be managing sta� e�orts.If carefully planned, this course is likely to be popular with physicians and fellows. By
o�ering these courses, researchers at your institution will become more familiar with statisticsand therefore more comfortable consulting with statisticians. The overall goal is to improvethe research climate at your institution. We wish you luck.
ACKNOWLEDGEMENTS
This work was completed while WTA was in the Division of Biostatistics, Department of Medicine,Indiana University. This research was partially supported by grants PHS M01-RR00750 (Indiana) andM01-RR00039 (Emory) from the National Institutes of Health. Without the administrative magic ofCecilia Armour and Darlene Nickles at Indiana the IU short course would never have been o�ered.Thanks to Azhar Nizam (Emory) for his comments which resulted in a much improved paper. Wewould also like to thank our colleagues who have o�ered their historical perspectives. We appreciatethe e�orts of Robert Parker for organizing the invited session at JSM 1999 where this paper was initiallypresented. Finally, we would like to thank the anonymous reviewer and the editor whose suggestionshave resulted in a substantially improved paper.
REFERENCES
1. Birch JB. Ten suggestions for e�ectively teaching short courses to heterogeneous groups. The AmericanStatistician 1995; 49(2):190–195.
2. Cornell JA, Randles RH, Vining GG. Challenges in teaching short courses by an academic department: theUniversity of Florida experience. The American Statistician 1995; 49(2):195–200.
3. Kleinbaum DG. Teaching short courses in biostatistics and epidemiology. The American Statistician 1995;49(2):200–203.
4. Roberson PK, Tilford JM, Shema SJ. Developing instruction in research skills for pediatric fellows. Proceedingsof the American Statistical Association Sections on Statistical Education and Teaching Statistics in the HealthSciences 1995; 317–319.
5. O’Brien RG, Bowling DW, Mendencorp SV, Piedmonte MR, Kutner MH. A seminar in clinical biostatistics forestablished physicians. Proceedings of the American Statistical Association Sections on Statistical Educationand Teaching Statistics in the Health Sciences 1995; 1–4.
6. Peterson MGE, Szatrowski TP, Charlson ME, Allegrante JP, Hollenberg JP, Robbins L, Mackenzie CR,Williams-Russo P, Paget SA. An organizational model for a clinical research program which includes educationin statistics in an academic medical center. Proceedings of the American Statistical Association Sections onStatistical Education and Teaching Statistics in the Health Sciences 1996; 153–155.
7. Ahn C, Go� D, Ince A. A clinical research design course for physicians. Proceedings of the American StatisticalAssociation Sections on Statistical Education and Teaching Statistics in the Health Sciences 1997; 229–231.
8. Deutsch R, Ahn C. Lecture series in biostatistics for fellows and clinical investigators. Proceedings of theAmerican Statistical Association Sections on Statistical Education and Teaching Statistics in the HealthSciences 1999; 1–5.
9. Dawson-Saunders B, Trapp RG. Basic and Clinical Biostatistics. 2nd edn. Appleton & Lange: Norwalk, CT,1994.
10. Motulsky H. Intuitive Biostatistics. Oxford University Press: New York, 1995.11. Bailar JC, Mosteller F. Medical Uses of Statistics. 2nd edn. NEJM Books: Boston, 1992.12. Slome C, Brogan D, Eyres S, Lednar W. Basic Epidemiological Methods and Biostatistics: A Workbook.
Wadsworth: Belmont, CA, 1982.13. Meinert CL. Clinical Trials: Design, Conduct and Analysis. Oxford University Press: New York, 1986.14. Rosner B. Fundamentals of Biostatistics. 4th edn. Duxbury: Belmont, CA, 1995.15. Kuzma, JW. Basic Statistics for Health Sciences. 2nd edn. May�eld Publishing Company: Mountain View,
CA, 1992.
Copyright ? 2002 John Wiley & Sons, Ltd. Statist. Med. 2002; 21:2739–2756
2756 W. T. AMBROSIUS AND A. K. MANATUNGA
16. Kleinbaum DG. Logistic Regression—A Self Learning Text. Springer-Verlag Publishers: New York, 1994.17. Kleinbaum DG. Survival Analysis—A Self Learning Text. Springer-Verlag Publishers: New York, 1996.18. Kleinbaum DG, Kupper LL, Muller KE. Applied Regression Analysis and Other Multivariable Methods.
Duxbury Press: Belmont, CA, 1987.19. Kleinbaum DG, Kupper LL, Morgenstern H. Epidemiologic Research—Principles and Quantitative Methods.
Van Nostrand Reinhold Publishers: New York, 1982.20. Selvin, S. Practical Biostatistical Methods. Wadsworth: Belmont, CA, 1995.
Copyright ? 2002 John Wiley & Sons, Ltd. Statist. Med. 2002; 21:2739–2756