Embed Size (px)
Citation preview

I
Interaction of oxygen supply, oxidative stress, and molecular defence systems during temperature stress in fishes
Beziehungen zwischen Sauerstoffversorgung, oxidativem Stress und molekularen Schutzmechanismen bei Temperaturstress in Fischen
Dissertation
zur Erlangung des akademischen Grades
- Dr. rer. Nat. -
dem Fachbereich 2 Biologie / Chemie der Universität Bremen
vorgelegt von
Katja Heise
Diplom-Biologin
Bremen 2005

II

III
Prüfungsausschuss:
1. Gutachter: Prof. Dr. Hans-Otto Pörtner
Alfred-Wegener Institut für Polar- und Meeresforschung, Am Handelshafen 12, 27570 Bremerhaven
2. Gutachter: PD Dr. Doris Abele
Alfred-Wegener-Institut für Polar- und Meeresforschung, Am Handelshafen 12, 27570 Bremerhaven
1. Prüfer: Prof. Dr. Wilhelm Hagen
FB II Biologie/Chemie, Universität Bremen, NW II Leobener Straße, 28359 Bremen
2. Prüfer: Prof. Dr. Angela Köhler
Alfred-Wegener-Institut für Polar- und Meeresforschung Am Handelshafen 12, 27570 Bremerhaven
Tag des Promotionskolloquiums: 06.09.2005

CONTENTS
IV

CONTENTS
V
Abbreviations VIII
Summary IX
Zusammenfassung XI
1. Introduction 1
1.1. Oxygen 1
1.2. Oxygen free radicals and reactive oxygen species 1
1.3. Oxidative stress 4
1.4. Oxygen-limited thermal tolerance and oxidative stress 5
1.5. Oxidative stress in polar marine ectotherms 7
1.6. Oxygen-dependent gene expression 8
1.7. Objectives of the study 11
2. Material & Methods 13
2.1. Investigated animals 13
2.2. Experimental conditions 16
2.3. Biochemical Assays 18
2.3.1 Determination of thiobarbituric reactive substances 18
2.3.2. Tert-butyl hydroperoxide-initiated chemiluminescence 18
2.3.3. Determination of carbonyl groups 19
2.3.4. Determination of reduced (GSH) and oxidised (GSSG) glutathione 20
2.3.5. Detection of α-tocopherol (vitamin E) 21
2.3.6. EPR determination of the intracellular “free” iron content 21
2.3.7. Determination of the total iron content in tissues 22
2.3.8. Measurement of iron reduction rate 22
2.3.9. Extraction of liver microsomes 23
2.3.10. EPR spin trapping of lipid radicals 23
2.3.11. Measurement of superoxide dismutase activity 24
2.3.12. Determination of glutathione peroxidase activity 24
2.3.13. Griess colorimetric assay 25
2.3.14. Protein content 25

CONTENTS
VI
2.4. Molecular studies 25
2.4.1. Cloning and Sequencing of the transcription factor HIF-1α 25
2.4.2. Whole-cell extracts from liver tissue 27
2.4.3. Western blotting analysis of HIF-1α protein and HSP70 28
2.4.4. Electromobility shift assay (EMSA) 29
2.5. Studies on isolated hepatocytes 30
2.5.1. Preparation of hepatocytes 30
2.5.2. MitoTracker Green FM staining of hepatic mitochondria 30
2.5.3. Visualisation of ROS production by fish hepatocytes using H2DCFDA 31
2.6. Statistics 32
3. Publications 33
Publication I 35
Changes in oxidative stress parameters and activation of hypoxia inducible factor
(HIF-1) at different environmental temperatures in polar and temperate zoarcid fish
Publication II 71
The hypoxia inducible factor (HIF-1α) in cold-adapted Antarctic fishes
Publication III 85
Oxidative stress and HIF-1 DNA binding during stressful temperatures and recovery
in the North Sea eelpout (Zoarces viviparus), Part A: cold stress
Publication IV 113
Oxidative stress and HIF-1 DNA binding during stressful temperatures and recovery
in the North Sea eelpout (Zoarces viviparus), Part B: heat stress
4. Additional Results 145
4.1. Unknown thiol peak in liver samples from P. brachycephalum 145
4.2. Cloning and sequencing of the hypoxia inducible factor 148
4.2.1. HIF-1α 148
4.2.3. HIF-2α 153
4.3. Total nitrite + nitrate content in the liver of Z. viviparus 157
4.4. Studies on isolated fish hepatocytes 158
4.4.1. MitoTracker Green FM staining of Z. viviparus hepatocytes 158

CONTENTS
VII
4.4.2. ROS production in fish hepatocytes detected by H2DCFDA fluorescence 159
5. Discussion 163
5.1. Oxidative stress and ROS generation in the liver of zoarcids 163
5.2. Higher oxidative stress levels in polar fish living at permanently 164
low temperatures?
Comparison of the Antarctic (P. brachycephalum) and the temperate eelpout
(Z. viviparus)
5.3. Influence of high oxygen contents and oxidative stress levels on the 167
HIF mechanism?
Comparison of HIF sequences and DNA binding activity in polar and temperate fish
5.4. Oxidative stress and hypoxic signalling induced by short-term 171
temperature stress?
Acute cold or heat stress and subsequent recovery studied in the temperate eelpout
5.5. What is the inducing effect for the HIF response? 174
Thermal oxygen limitation or temperature itself or both
6. Conclusions & Perspectives 177
7. References 183
8. Appendix 201
Acknowledgements 207

ABBREVIATIONS
VIII
Frequently used abbreviations
aa amino acid
AOX antioxidant
bp base pairs
CBP CREB binding protein
Cm Chionodraco myersi
EMSA electromobility shift assay
EPR electron paramagnetic spin resonance spectroscopy
GPX glutathione peroxidase
GSSG oxidised glutathione
GSH reduced glutathione
H2DCFDA dichlorodihydrofluorescein diacetate
HIF hypoxia inducible factor
MDA malondialdehyde-(bis)-acetate
NO nitric oxide
ODD oxygen-dependent degradation domain
Om Oncorhynchus mykiss; rainbow trout
Pb Pachycara brachycephalum
PHD prolyl hydroxylase
POBN α-(4-pyridyl 1-oxide)-N-t-butyl nitrone
PUFA poly-unsaturated fatty acid
pVHL von Hippel Lindau Tumor suppressor protein
ROS reactive oxygen species
RT-PCR reverse transcription polymerase chain reaction
SOD superoxide dismutase
TAD transactivation domain
TBARS thiobarbituric reactive substances
tBOOH tert-butylhydroperoxide
Tc critical temperature
Th Trematomus hansoni
Tp Trematomus pennellii
Tp pejus temperature (pejus = getting worse)
XOD xanthine oxidase
Zv Zoarces viviparus

SUMMARY
IX
Summary
Oxygen is the essential substrate for oxidative energy production, but oxygen exposure has
to be limited because of the damaging effects of reactive oxygen specie (ROS). Thus, the
regulation of oxygen homeostasis within a narrow physiological range is crucial for all
aerobic life. In marine ectotherms, temperatures outside the species specific optimum
range, which is enclosed by the pejus temperatures (Tp), are supposed to cause
progressively decreasing oxygen levels in body fluids and tissues, i.e. functional hypoxia.
When critical temperatures (Tc) are reached, transition to anaerobic energy production can
be observed. In my doctoral study I tested the hypothesis that temperature induced hypoxia
entails oxidative stress, i.e. unbalanced ROS production. Moreover, temperature-induced
hypoxia was suggested to induce physiological adjustments mediated by the hypoxia
inducible transcription factor (HIF-1), i.e. the master regulator of oxygen homeostasis.
I investigated the long-term influence of environmental temperature and the short-term
effect of graded temperature stress on oxidative stress markers and the HIF-1 response in
the liver of marine fish from different latitudes under in vivo conditions.
The Antarctic zoarcid Pachycara brachycephalum, kept at control temperature (0°C) was
compared to winter acclimatised (6°C) con-familial temperate Zoarces viviparus. A highly
oxidised glutathione redox ratio and elevated microsomal lipid radical formation rates in
P. brachycephalum reflected the increased susceptibility of polar animals for oxidative
stress and lipid peroxidation. However, high glutathione levels appeared to buffer elevated
lipid radical formation in P. brachycephalum and to charge the liver tissue with a high
antioxidant capacity. Consequently, oxidative damage markers were low under control
conditions (0°C) as well as during warm acclimation to 5°C, when compared to the
temperate species. In line with cold enhanced oxidative stress, seasonal temperature
changes within the natural temperature range of the temperate Z. viviparus caused higher
levels of oxidative stress in cold acclimated specimens (6°C) collected in winter than in
animals collected in summer (12°C). Thus, in the zoarcids, both cold adaptation and cold
acclimatisation were associated with elevated oxidative stress levels.
Sequence determination of the hypoxia-inducible subunit HIF-1α from the temperate
Zoarces viviparus and four cold-adapted Antarctic fishes (Zoarcidae: Pachycara
brachycephalum, Notothenioidei: Trematomus hansoni, T. pennellii, and Chionodraco
myersi) demonstrated remarkable differences in the deduced peptide sequences compared
with mammals and non-polar fishes. In P. brachycephalum HIF-1α the N-terminal

SUMMARY
X
functional proline of the oxygen-dependent degradation domain was substituted by leucine,
which is so far the first report of this phenotype. As the HIF-1α sequences from the three
notothenioids contained both functional proline residues, Pro-Leu substitution cannot be
considered a specific polar adaptation. Lack of one functional proline may cause higher
resistance of HIF-1α to prolyl hydroxylases and proteasomal degradation. Thus, it can only
be speculated that HIF-1α is regulated mainly via transactivation and not so much via
degradation / stabilisation in the Antarctic zoarcid.
Increased HIF-1 DNA binding in 5°C acclimated P. brachycephalum versus control fish
kept at 0°C indicated that at least at the level of dimer formation HIF-1 was still functional,
despite Pro-Leu substitution and despite the highly oxidised redox environment. Whereas
in P. brachycephalum HIF-1 DNA binding was higher at the respective warmer water
temperature (5°C versus. 0°C), in the temperate Z. viviparus it was higher in cold winter
(6°C) versus summer animals (12°C). In both species, HIF-1 may play a physiological role
to adjust tissue oxygen supply to the tolerated temperature range. Moreover, HIF-1 DNA
binding occurred at a highly oxidised cellular redox environment in both,
P. brachycephalum and winter animals of Z. viviparus.
In contrast to seasonal cold acclimatisation, acute cold exposure of Z. viviparus (2 h) to 1
and 5°C led to a more reduced cellular redox environment, which was accompanied by
increased HIF-1 DNA binding. Oxidative damage was increased following 24 h recovery
at control temperature. Thus, effects of acute cold exposure and recovery, i.e. cold-induced
hypoxia and reoxygenation are reminiscent of ischemia / reperfusion events well described
in mammals. Acute heat exposure and recovery caused similar biochemical effects.
However, oxidative stress markers were elevated only during early recovery (8 - 12 h).
Thus, repair of oxidative damage may be faster following heat than following cold stress.
Moreover, acute cold and heat stress had opposing impacts on the cellular redox balance
with cold stress causing a more reduced, and critical heat stress a more oxidised cellular
redox environment. The more oxidised conditions during critical heat stress seemed to
interfere with the HIF response as reflected in weak HIF-1 signals in EMSA assays. HIF-1
may thus have different functions during long-term (seasonal) and short-term (acute stress)
changes of environmental temperatures in the temperate eelpout Z. viviparus, and the redox
potential may be the modulating factor.
ZUSAMMENFASSUNG
XI
Zusammenfassung
Sauerstoff bildet die Grundlage für den Prozess der oxidativen Phosphorylierung. Eine
übermäßige Sauerstoffzufuhr hat jedoch aufgrund der Bildung von reaktiven
Sauerstoffkomponenten eine schädigende Wirkung auf Organismen. Aerobe Lebensweise
erfordert daher die Einstellung eines empfindlichen Sauerstoffgleichgewichtes innerhalb
eines physiologisch eng umgrenzten Bereichs. Der artspezifische optimale
Temperaturbereich mariner ektothermer Tiere ist durch die pejus-Temperaturen (Tp)
markiert. Außerhalb dieses Bereichs kann es zu fortschreitendem Sauerstoffmangel in
Körperflüssigkeiten und Geweben kommen (funktionelle Hypoxie), der im kritischen
Temperaturbereich (Tc) schließlich in anaeroben Metabolismus übergeht. In meiner
Doktorarbeit habe ich die Hypothese untersucht, dass Temperatur-induzierte Hypoxie zum
einen von oxidativem Stress begleitet wird. Zum anderen könnte der Transkriptionsfaktor
HIF-1 (Hypoxie-induzierbarer Faktor) eine physiologische Anpassung der Sauerstoff-
zufuhr ermöglichen und damit dem Temperatureffekt entgegenwirken.
In dieser Arbeit wurden Langzeiteffekte der Umgebungstemperatur sowie Effekte einer
durch akuten Temperaturstress induzierten Hypoxie mit anschließender Erholungsphase
auf Sauerstoffstressparameter und Hypoxie-Signalgebung in der Leber mariner Fische aus
verschiedenen Breitengraden untersucht.
Aus der Familie der Zoarcidae wurden die Antarktische Aalmutter Pachycara
brachycephalum, bei 0°C Kontrolltemperatur, und die aus der Nordsee stammende
Zoarces viviparus, Winter-angepasst bei 6°C, verglichen. Ein stark oxidiertes Glutathion-
Redox-Verhältnis und erhöhte mikrosomale Lipidradikal-Bildungsraten in
P. brachycephalum könnten eine höhere Empfindlichkeit der polaren Art für
Sauerstoffstress und Lipidperoxidation anzeigen. Trotzdem schien der hohe Gehalt an
Glutathion die erhöhten Lipidradikal-Bildungsraten effektiv zu puffern und die Leber mit
einer so hohen antioxidativen Kapazität zu versorgen, dass sowohl unter
Kontrollbedingungen als auch nach Wärmeanpassung (5°C) die Sauerstoffschädigungs-
parameter in P. brachycephalum im Vergleich zur temperierten Art niedrig waren. In
Z. viviparus zeigte sich im Vergleich von Winter- und Sommertieren erhöhter oxidativer
Stress in Wintertieren (6°C). Demnach sind nach den Ergebnissen bei den untersuchten
zoarciden Fischen sowohl Kälteadaptation (P. brachycephalum) als auch saisonale
Kälteanpassung (Z. viviparus) mit der Erfordernis verbunden, erhöhten oxidativen Stress
auszugleichen.

ZUSAMMENFASSUNG
XII
Eine Sequenzbestimmung der O2-regulierten Untereinheit HIF-1α bei Z. viviparus aus
der Nordsee und vier kalt-angepassten Antarktischen Fischen (Zoarcidae: Pachycara
brachycephalum; Nothenioidei: Trematomus hansoni, T. pennellii, Chionodraco myersi)
zeigte beachtliche Unterschiede in der abgeleiteten Aminosäuresequenz im Vergleich zu
Säugern oder anderen nicht-polaren Fischen. Bei der Antarktischen P. brachycephalum
war der N-terminale funktionelle Prolin-Rest der HIF-1α Sauerstoffregulierungsdomäne
gegen Leucin ausgetauscht. Da in den Sequenzen der drei Notothenioiden beide
funktionellen Proline konserviert waren, kann dieser Pro-Leu Austausch aber nicht als eine
spezifische polare Anpassung betrachtet werden. Das Fehlen eines funktionellen Prolin-
Restes könnte HIF-1α resistent gegenüber Prolylhydroxylasen und dem damit verbundenen
proteasomalen Abbau machen. Weitere Untersuchungen müssen zeigen, ob die Funktion
von HIF-1α in P. brachycephalum weniger über den Abbau / Stabilisierungsmechanismus
und mehr über den Transaktivierungsmechanismus reguliert wird. Erhöhte HIF-1 DNA-
Bindung bei 5°C gehälterten P. brachycephalum im Vergleich zu Kontrollfischen bei 0°C,
zeigte, dass HIF-1 trotz Pro-Leu Austausch und stark oxidiertem Redox-Milieu zumindest
auf der Ebene der Dimerbildung und DNA-Bindung noch funktionsfähig war.
Während die HIF-1 DNA-Bindungsaktivität in P. brachycephalum bei der wärmeren
Temperatur höher war (5°C versus 0°C), wurden in Z. viviparus höhere Werte in Winter-
(6°) als in Sommertieren (12°C) gefunden. In beiden Spezies könnte HIF-1 eine Rolle bei
der Anpassung der Gewebesauerstoffversorgung an den tolerierten Temperaturbereich
spielen. Darüber hinaus wurde sowohl bei P. brachycephalum als auch bei Z. viviparus
Wintertieren HIF-1 DNA-Bindungsaktivität unter gleichzeitig stark oxidiertem Redox-
Milieu beobachtet.
Im Gegensatz zu saisonaler Kälteanpassung führte akuter Kältestress (2 h bei 1 und 5°C)
zu einem eher reduzierten Redox-Milieu, sowie zu erhöhter HIF-1 DNA-Bindung. Ein
Anstieg in Sauerstoffschädigungsparametern wurde nicht nach Kältestress, sondern nach
24 h Erholung bei Kontrolltemperatur gefunden. Das legt nahe, akuten Kältestress und
Erholung als Kälte-induzierte Hypoxie und Reoxygenierung zu beschreiben, vergleichbar
dem Stressmuster der Ischämie / Reperfusion bei Säugern. Akuter Hitzestress und
Erholung hatte prinzipiell dieselben Folgen. Jedoch konnte eine erhöhte
Sauerstoffschädigung nur bei kürzeren Erholungsphasen von 8 - 12 h festgestellt werden.
Vermutlich findet bei Erholung nach Erwärmung eine schnellere Reparatur der induzierten
Sauerstoffschäden statt als bei Erholung nach Abkühlung.

ZUSAMMENFASSUNG
XIII
Darüber hinaus hatten akuter Kälte- und Hitzestress gegensätzliche Effekte auf das
zelluläre Redox-Milieu, das nach Kältestress eher reduziert und nach Hitzestress eher
oxidiert war. Die stärker oxidierten Bedingungen bei Hitzestress scheinen die HIF Antwort
zu beeinträchtigen, erkennbar an schwächeren HIF-1 Signalen im EMSA. Es könnte
demnach sein, dass der Transkriptionsfaktor HIF-1 in Z. viviparus bei längerfristigen
(saisonalen) und kurzzeitigen (akuter Stress) Änderungen der Umgebungstemperaturen
jeweils unterschiedliche Regulationsmechanismen auslöst und dass das Redox-Milieu eine
steuernde Größe darstellt.

ZUSAMMENFASSUNG
XIV

INTRODUCTION
1
1. Introduction
1.1. Oxygen
The adjustment of oxygen delivery and demand for maintenance of oxygen homeostasis
within a narrow physiological range is crucial for all aerobic life (Haddad 2002,
Massabuau 2003). Oxygen is the essential substrate for oxidative phosphorylation, a
process generating most of the ATP required for cellular metabolism. That need for oxygen
obscures the fact that oxygen exposure has to be limited because of the hazardous effects
of oxygen free radicals (Semenza 2004).
1.2. Oxygen free radicals and reactive oxygen species
Free radicals are chemical species capable of independent existence (“free”) with an
unpaired electron in the outer valence orbital. This makes them paramagnetic and
relatively reactive due to the strong tendency to acquire a second electron in the orbital
(Boveris 1998, Halliwell & Gutteridge 1999).
The oxygen molecule contains two unpaired electrons located in different π-antibonding
orbitals and with parallel spins (↑↑), thus represents a di-radical. The spin restriction rule
makes it difficult for the O2 molecule to receive a pair of electrons with parallel spins when
oxidising another compound. Thus, oxygen must receive one electron at a time (Hermes-
Lima 2004). Four successive transfers of single electrons reduce the oxygen molecule to
water (fig. 1.1). Some of the intermediates of oxygen reduction are free radicals, such as
the superoxide anion and hydroxyl radical, whereas hydrogen peroxide is a non-radical
species. In the present work, the term reactive oxygen species (ROS) will be used for the
collective description of oxygen free radicals as well as non-radical oxygen derivatives,
such as H2O2, and also singlet oxygen.
Fig. 1.1: The univalent reduction of the oxygen molecule taken from Boveris (1998).

INTRODUCTION
2
Mitochondria consume > 90% of the overall oxygen uptake in higher animals (Boveris
1998). They are considered the main cellular site of free radical formation due to electron
leakage from the respiratory chain, primarily generating superoxide (Hermes-Lima 2004).
Several components of complex I, II and III exhibit thermodynamic properties suitable for
the reduction of oxygen to superoxide (Boveris & Cadenas 1997). Among them,
ubisemiquinone is considered the principal physiological source of mitochondrial
superoxide radicals (Hermes-Lima 2004). Calculations suggest that mitochondrial ROS
production may account for 1 - 3% of the mitochondrial oxygen consumption in
mammalian species (Boveris 1998).
In hepatocytes, the well developed endoplasmatic reticulum represents an equally
important source for superoxide as the mitochondria. Moreover, several enzymes, e.g.
NADPH-cytochrome P-450 reductase and cytochrome P-450, cytosolic xanthine oxidase
and peroxisomal flavin oxidases are further sources for cellular superoxide and hydrogen
peroxide formation (Hermes-Lima 2004).
In biological systems, the Fenton-Haber-Weiss reaction (equations 1.1 and 1.2) with
transition metals functioning as catalysts converts the primary product superoxide to the
hydroxyl radical, which is one of the most reactive chemical species:
O2-• + Fe3+ → O2 + Fe2+ (1.1)
H2O2 + Fe2+ → OH• + Fe3+ + OH- (1.2)
The hydroxyl radical in turn is able to abstract a hydrogen atom from unsaturated fatty
acids and, thus, initiate free radical chain reactions. The complex reactions undergone
during the lipid peroxidation process lead to a variety of intermediates and products, such
as lipid radicals, peroxyl radicals and alkoxyl radicals. Moreover, conjugated dienic
hydroperoxides further decompose leading finally to several aldehydes, alkanes,
isoprostanes or conjugated dienes (fig. 1.2).
Membrane phospholipids are present where radicals are formed, rendering those easily
accessible endogenous targets. Especially the poly-unsaturated fatty acids (PUFAS) are
highly susceptible to reactions with free radicals. Lipid peroxidation processes lead to
decreased membrane fluidity, disruption of membrane integrity, resulting in the break-
down of transmembrane ion gradients. Moreover, inactivation of membrane-bound
enzymes can drastically alter cell functioning (Halliwell & Gutteridge 1999). The
aldehydic products of lipid peroxidation, such as malondialdehyde (MDA), are highly
toxic, leading to cross-links between membrane-proteins and the formation of stable

INTRODUCTION
3
adducts with DNA. Consequently, lipid peroxidation is considered to be a major cause of
cell injury and death (Hermes-Lima 2004).
Fig 1.2: Lipid radical chain reaction and lipid peroxidation products modified after Dotan et al. (2004). Radical species and compounds detected in the present thesis are marked by red colour.

INTRODUCTION
4
Besides, ROS, particularly the hydroxyl radical, can attack almost any cellular structure
or molecule. They may cause DNA cross-links and DNA strand-breaks as well as specific
modifications of the nucleotides (de Zwart et al. 1999). Protein oxidation processes involve
modifications of amino acid site chains, reactive oxygen-mediated peptide cleavage and
reactions with lipid and carbohydrate oxidation products. The presence of carbonyl groups
in proteins is used as an indicator for oxidative damage (de Zwart et al. 1999). Oxidative
protein modification may lead to functional changes, chemical fragmentation, or increased
susceptibility to proteolytic attack (Dröge 2002). Altogether, cell function may be altered
by free radical generation in many different ways.
1.3. Oxidative stress
Cells have developed sophisticated antioxidant (AOX) mechanisms to prevent free radical
formation and to limit their damaging effects (de Zwart et al. 1999). These include AOX
enzymes like superoxide dismutase (SOD), catalysing the decomposition of superoxide to
hydrogen peroxide as well as catalase and glutathione peroxidase (GPX), mediating the
further conversion of H2O2 to water. Additionally, proteins exist to sequester transition
metals and an array of compounds to scavenge free radicals. The most commonly
monitored low molecular weight antioxidants are vitamin E, vitamin C, uric acid,
carotenoids, ubiquinol and glutathione (Dotan et al. 2004). Glutathione (GSH), the
tripeptide L-γ-glutamyl-L-cysteinyl-glycine, can act as an antioxidant on its own or as a
co-substrate of GPX, in both cases yielding oxidised glutathione (GSSG) (Hermes-Lima
2004). Moreover, the glutathione redox couple (GSSG / 2 GSH) due to its high
concentration (millimolar range) in the cell can be used as an indicator for changes in the
cellular redox environment (Schafer & Buettner 2001). The interaction of glutathione with
protein thiol groups (protein-S-glutathiolation) leads to protein mixed disulfide formation,
which can both, stabilise / activate or inactivate enzymes. Transcription factors can be
similarly affected by this process (Rebrin et al. 2003). Thus, maintenance of an optimal
redox status is of prime physiological importance.
Under certain conditions, ROS production is increased to a point where the AOX
response may not be sufficient to reset the system to the original level of oxygen
homeostasis (Dröge 2002). Such a disturbance in the prooxidant / antioxidant balance has
been described as oxidative stress (Sies 1985) and is reflected in changes of the cellular
redox state (Klatt & Lamas 2000, Rebrin et al. 2003).
INTRODUCTION
5
Hypoxia or ischemia, i.e. an arrest of blood flow to a tissue, and subsequent
reoxygenation on reperfusion has been extensively studied in mammalian liver, brain,
kidney and heart as a major cause for oxidative stress (Jones 1986, McCord 1988, Taniai et
al. 2004, reviewed in Halliwell & Gutteridge 1999). During ischemic events there is no
oxygen that can be converted to H2O by cytochrome c oxidase, and consequently the
mitochondrial respiratory chain becomes highly reduced. During subsequent reperfusion
the quick influx of oxygen interacts with accumulated electrons, inducing a burst of
mitochondrial ROS production (Turrens et al. 1991). Additionally, excessive ATP
consumption during ischemia leads to the accumulation of hypoxanthine, which, upon
reperfusion is rapidly metabolised by xanthine oxidase (XOD) to superoxide (Dröge 2002,
Dykens & Shick 1988 for marine ectotherms).
In contrast to the events occurring during reoxygenation, no definitive picture exists with
respect to ROS levels during hypoxia itself. Members of the family of NADPH-dependent
oxidases have been shown to generate hydrogen peroxide in an oxygen-dependent manner,
resulting in decreased cellular ROS levels during hypoxia (Fandrey et al. 1994, Zhu &
Bunn 1999, Kietzmann et al. 2000). In striking contrast to these findings, Chandel and
Schumacker (Chandel et al. 1997, 1998, 2000, reviewed in Chandel & Schumacker 2000)
reported increased ROS levels during oxygen limitation originating from the mitochondria.
Until now, there is no common consensus about whether ROS concentration decrease or
increase under low oxygen conditions (Wenger 2000, Liu et al. 2004).
1.4. Oxygen-limited thermal tolerance and oxidative stress
Marine ectotherms also undergo frequent episodes of environmental and physiological
hypoxia and, thus, are likely to experience elevated levels of ROS formation during
recovery from physiological stress (Abele & Puntarulo 2004). Particularly, functional
hypoxia accompanying temperature stress according to the concept of oxygen-limited
thermal tolerance is thought to contribute to oxidative stress in marine ectotherms (Pörtner
2002). Comparative studies on marine invertebrates and fish (Frederich & Pörtner 2000,
Lannig et al. 2004) have demonstrated maximal haemolymph or blood PO2, indicating
balanced oxygen supply and demand and full aerobic scope for activity, in an optimum
temperature range. Upon warming or cooling beyond the pejus temperatures (Tp; pejus =
getting worse), which enclose the species specific thermal optimum range, decreasing
blood PO2 and whole animal aerobic scope indicate limited oxygen supply to central
tissues even in fully oxygenated water (fig. 1.3). Below the optimum range (cold stress) the

INTRODUCTION
6
greater impact of cooling on the circulatory system than on mitochondrial oxygen demand
accounts for a developing functional hypoxia (Lannig et al. 2004). At temperatures above
the optimum range (heat stress), the temperature-induced increase in oxygen demand can
no longer be compensated for by an increase in ventilation and circulation. In fish, a
decline in cardiac performance mainly accounts for limited oxygen supply to tissues during
heat stress (Farrell 2002, Lannig et al. 2004).
Fig. 1.3: The model of oxygen-limited thermal tolerance modified after Pörtner (2002). Tc = critical temperature; Tp = pejus temperature (pejus = getting worse).
Upon further warming or cooling beyond the critical temperature limit (Tc), functional
hypoxia is enhanced and finally leads to onset of anaerobic metabolism, first affecting
tissues with high oxygen demand, such as active aerobic muscle or the liver (Sommer et al.
1997, Van Dijk et al. 1999). Under critical temperature stress, aerobic scope for activity
disappears and survival becomes a question of time. It has been suggested by Pörtner
(2002) that oxidative stress may already increase when oxygen limitation sets in at pejus,
and even more so during extreme hypoxia beyond critically low or high temperatures.
Temperature-induced hypoxia may not absolutely resemble ischemia, as blood flow is not
interrupted (Mark et al. 2002, Lannig et al. 2004). Yet oxygen limitation and its relief after
thermal stress may cause a situation similar to reperfusion after ischemia, favouring the
overproduction of ROS when temperature returns to the optimum range and the tissue is
reoxygenated.

INTRODUCTION
7
Moreover, under heat stress, the temperature-dependent rise of mitochondrial respiration
may go hand in hand with elevated mitochondria-derived ROS formation, which has been
shown for marine invertebrates by in vitro measurements (Abele et al. 2002, Heise et al.
2003, Keller et al. 2004). Consequently, passive survival under temperature stress may be
supported by maintenance of an efficient AOX system (Pörtner 2002). However, in heat
stressed marine molluscs pro- and antioxidant processes appeared balanced below Tc,
whereas above Tc SOD denatured and compensation failed (for review see Abele &
Puntarulo 2004).
Apart from the detrimental effects of oxidative injury, elevated ROS levels may cause a
general disturbance of the cellular redox balance, i.e. the ratio of reduced to oxidised
glutathione and, consequently, interfere with redox-dependent signalling cascades (Czubryt
et al. 1996, Abele 2002, Nikinmaa et al. 2004). Marine ectotherms may therefore be more
tolerant to oxidative stress in situations reminiscent to ischemia / reperfusion, and may also
have achieved adjustments of redox-dependent molecular mechanisms.
1.5. Oxidative stress in polar marine ectotherms
Several aspects of life at permanently cold water temperatures may render polar marine
ectotherms more susceptible to oxidative stress. One fact is the higher solubility of oxygen
in cold seawater and body fluids of ectothermal animals. Moreover, the solubility of
oxygen is higher in lipid droplets than in the cytosol. Thus, in oxidative muscles of polar
ectotherms high contents of neutral storage lipids provide both, a reservoir of oxygen as
well as an enhanced diffusional pathway for oxygen though the tissue (Egginton & Sidell
1989, Desaulniers et al. 1996, Sidell 1998). These findings together with low oxygen
consumption rates in those species are thought to result in high tissue oxygen
concentrations (Abele & Puntarulo 2004). Additionally, polar invertebrates and fish have
higher degrees of lipid unsaturation, in order to achieve homoeoviscous adaptation of
membrane transport and to facilitate oxygen diffusion at low temperatures (Sidell 1998).
Consequently, elevated levels of lipid unsaturation at higher cellular oxygen concentrations
may represent a pre-requisite for the initiation of lipid radical chain reactions in polar
animals. Prolonged half-life of free radicals in the cold may further facilitate the
propagation of these reactions and extend the oxidative stress to adjacent tissue areas
(Abele & Puntarulo 2004). This hypothesis is further supported by the finding of 5 to 6
times higher contents of vitamin E, the most powerful lipid soluble antioxidant, in
Antarctic versus temperate fish species (Gieseg et al. 2000). The increased susceptibility of

INTRODUCTION
8
polar ectotherms to lipid peroxidation may present no problem under unstressed
conditions, but could become a major obstacle under any form of physiological challenge,
such as temperature stress, leading to enhanced cellular ROS production (Abele &
Puntarulo 2004).
1.6. Oxygen-dependent gene expression
At high concentrations free radicals are hazardous for living organisms. However, at
moderate levels they play an important role as regulatory mediators in signalling processes,
including the hypoxia response, i.e. an important mechanism for the regulation of oxygen
homeostasis (Dröge 2002). Higher organisms maintain oxygen homeostasis by tight
regulation of red blood cell mass and respiratory ventilation. Under low oxygen conditions,
genes involved in erythropoiesis, angiogenesis, vasomotor control as well as iron and
glucose metabolism are induced by the transcription factor HIF-1 (hypoxia inducible
factor; for review see Semenza 2002, Bracken et al. 2003). HIF-1 has been identified in all
metazoan species so far investigated (Semenza 2004) and termed the master regulator of
oxygen homeostasis (Semenza 1998).
HIF-1 is a hetero-dimeric basic Helix Loop Helix (bHLH) PAS protein, composed of one
of the three α-subunits HIF-1α, HIF-2α or HIF-3α and the HIF-1β subunit. While HIF-1β is
readily found in the cell under all oxygen conditions, the α-subunits are the crucial factors
for oxygen-dependent gene expression (Jiang et al. 1996), with HIF-1α being the most
prominent member (Schmid et al. 2004). Although HIF-1α is constitutively expressed, the
protein is virtually undetectable under normoxic conditions because of its very short half-
life of less than 5 minutes (Salceda & Caro 1997, Dery et al. 2005). It has been shown that
prolyl hydroxylases (PHD), using molecular oxygen for hydroxylation of proline residues
402 and 564 in human HIF-1α target the protein for recognition by von Hippel Lindau
Tumor suppressor protein (pVHL; Ivan et al. 2001, Jaakkola et al. 2001, Masson et al.
2001). This promotes poly-ubiquitylation by the E3 ubiquitine ligase complex and
subsequent HIF-1α degradation by the 26S proteasome (fig. 1.4). Additionally, acetylation
of lysine 532 of human HIF-1α was described as a further protein degradation target for
HIF-1α that had escaped proline hydroxylation under normoxia (Jeong et al. 2002). Under
oxygen limitation proline hydroxylation is impaired and lysine acetylation down-regulated
(Dery et al. 2005). This permits stabilisation of HIF-1α protein, and translocation to the
nucleus (Kallio et al. 1998), where it dimerises with HIF-1β (ARNT) to the
transcriptionally active HIF-1 complex. The hetero-dimer then can bind to hypoxia

INTRODUCTION
9
responsive elements (HRE) in the promoter regions of its target genes and enhance their
expression (Semenza et al. 1996). Oxygen-dependent hydroxylation plays also a role in
HIF-1 transactivation. Under normoxia FIH-1 (factor inhibiting HIF) hydroxylates
asparagine 803 in the human HIF-1α sequence, preventing the interaction of HIF-1α with
general transcriptional co-activators, such as p300 / CBP (fig. 1.4) (Arany et al. 1996,
Lando et al. 2002). There is accumulating evidence suggesting that fish cells have all major
components required for the HIF response such as HIF-α and β – subunits, as well as p300
(CK421262) and that the mechanism of HIF induction is basically the same in mammals
and fish (Soitamo et al. 2001, Powell & Hahn 2002, Nikinmaa & Rees 2005). Moreover,
gene expression studies with the goby fish Gillichthys mirabilis have shown the hypoxic
induction of genes which in mammals are known as HIF target genes (Gracey et al. 2001).
Fig. 1.4: The HIF mechanism modified after Schmid et al. (2004). The upper part presents oxygen-dependent hydroxylation processes of HIF-1α under normoxic conditions, the lower part HIF-1α stabilisation, nuclear translocation and dimerisation under hypoxia. FIH-1 = factor inhibiting HIF; PHD = prolyl hydroxylase; VHL = von Hippel Lindau Tumor Suppressor protein; Ubi = ubiquitine; HRE = hypoxia responsive element
Whereas the N-terminal half of HIF-1α is characterised by the bHLH and PAS domains,
responsible for DNA binding and dimerisation with the β-subunit, the C-terminal half
consists of the oxygen-dependent degradation domain (ODD) with the two functional
proline and the lysine residues as well as two transactivation domains (fig. 1.5). The

INTRODUCTION
10
N-terminal transactivation domain (N-TAD) is located within the ODD, whereas the
C-terminal transactivation domain (C-TAD), harbouring the functional asparagine residue,
is found at the very end of the protein (Lando et al. 2002). Moreover, the HIF-1α sequence
contains two nuclear localisation signals (NLS), responsible for the transition of HIF-1α
protein from the cytosol into the nucleus (Schmid et al. 2004).
Fig. 1.5: The HIF-1α peptide structure modified after Dery et al. 2005. NLS = nuclear localisation signal; bHLH basic Helix Loop Helix domain; ODD = oxygen-dependent degradation domain; TAD = transactivation domain; the black lines indicate DNA or protein binding regions.
Although the HIF mechanism is primarily dependent on the availability of molecular
oxygen for hydroxylation, reactive oxygen species likely modulate several steps of the
hypoxic signalling pathway (for review see Fandrey 2004). On the one hand, prolyl
hydroxylases belonging to the family of iron and 2-oxoglutarate-dependent dioxygenases
need Fe2+ and ascorbate for proper functioning, and thus their enzyme activity may depend
on the cellular redox state. Also, the activity of ubiquitine-conjugating enzymes of the
proteasomal pathway has been shown to be redox-sensitive (Obin et al. 1998). There is
also considerable evidence that the glutathione equilibrium is an important regulator for the
HIF response (Haddad et al. 2000). On the other hand, it has been reported that full activity
of C-TAD depends on the reducing activity of the redox factor Ref-1 (Lando et al. 2000)
which interacts with cysteine 801 in human HIF-1α (Ema et al. 1999). Recent studies using
lung vascular cells have demonstrated oxidative modifications of a guanidine in the HRE
of the VEGF promoter, which may affect DNA integrity and thus gene expression by
influencing DNA-protein interaction (Ziel et al. 2005).
For salmonid fish, further redox-sensitive cysteine residues in bHLH and ODD have
been described, influencing the DNA binding activity as well as the protein stability of
HIF-1α (Soitamo et al. 2001, Nikinmaa et al. 2004). Consequently, any form of oxidative
stress and implicated disturbances of the cellular redox balance may interfere with oxygen-
dependent gene expression especially in fish (Nikinmaa et al. 2004, Nikinmaa & Rees

INTRODUCTION
11
2005). In contrast, one might assume that ectothermal animals frequently exposed to
oxidative stress may have developed functional adjustments of their hypoxic signalling
response to ensure oxygen-dependent gene expression even under stressful conditions.
Similarly, polar fish, living in an oxygen-rich environment, could have reduced capacities
for oxygen-dependent gene expression or could have evolved physiological adjustments of
the HIF mechanism to guarantee regulation of cellular oxygen homeostasis. Moreover, the
question arises whether the HIF-1 mediated hypoxic response could play a role under
functional hypoxia and ameliorate progressive oxygen limitation under temperature stress
in marine ectotherms.
1.7. Objectives of the study
The aim of the present work was to investigate the effect of temperature stress, anticipated
to induce functional hypoxia, on a wide array of oxidative stress parameters and on
molecular defence systems, especially the hypoxic response, in marine fish from different
latitudes. Different time scales of temperature exposure were studied, from temperature
adaptation (evolutionary effects), seasonal acclimatisation and laboratory acclimation
(long-term temperature effects of several weeks) to few hours of experimental temperature
exposure (short-term effects). Moreover, the investigated temperature range, starting from
optimal control conditions increasing to pejus, critical and finally extreme temperatures,
allowed for distinguishing various degrees of functional hypoxia.
Particularly, the following questions were addressed:
1. Does the Antarctic eelpout (Pachycara brachycephalum) display higher oxidative stress
levels than the con-familial temperate eelpout (Zoarces viviparus) under normal
physiological conditions or at elevated temperatures?
2. Do Antarctic fish, which are adapted to the oxygen-rich polar environment, display
functional adjustments of the HIF response to fine-tune oxygen-dependent gene expression
to different Co2 and oxidative stress levels in their tissues?
3. Do variable degrees of short-term temperature stress and the implied functional hypoxia
carry a risk of oxidative stress and cause adjustments by hypoxic signalling or does
oxidative stress upon temperature induced-hypoxia interfere with the hypoxic response?

INTRODUCTION
12

MATERIAL & METHODS
13
2. Material & Methods
2.1. Investigated animals
All investigated species belong to the order of perciform teleosts (fishbase,
http://filaman.uni-kiel.de/search.cfm). An overview is given in tab. 2.1. Maps
demonstrating the global distribution of all studied species are presented in the appendix
(fig. 8.2 – 8.6).
Tab. 2.1: Overview of the investigated species, their max. body size, aquatic environment, climate and their naturally experienced temperature range. Data are taken from fishbase, http://filaman.uni-kiel.de/search.cfm.
species family max size (cm)
environment climate temp. -range
Zoarces viviparus (common eelpout)
Linnaeus, 1758
Zoarcidae (eelpouts)
52.0 demersal; brackish; marine; 0 – 40 m depth
temperate; 72°N – 49°N, 11°W – 42°E
3 – 18°C
Pachycara brachycephalum
Pappenheim, 1912
Zoarcidae (eelpouts)
35.0 bathydemersal; marine; 200 – 1810 m depth
deep-water; 60°S – 78°S
0 – 2°C
Trematomus hansoni (striped rockcod)
Boulenger, 1902
Nototheniidae (cod icefishes)
41.0 demersal; marine; 6 – 549 m depth
polar; 53°S – 78°S
0°C
Trematomus pennellii (sharp-spined notothen)
Regan, 1914
Nototheniidae (cod icefishes)
24.0 demersal; marine; 0 – 732 m depth
polar; 60°S – 78°S
0°C
Chionodraco myersi
DeWit & Typer, 1960
Channichthyidae (crocodile icefishes)
38.0 bathydemersal; marine; 200 – 800 m depth
deep-water; 61°S – 78°S
0°C
The main focus of the present study was on the family of Zoarcidae (eelpout), which are
thought to be a monophyletic group comprising 220 species from Artic to Antarctic
(Eastman 1993). Generally, zoarcids are described to be sluggish, benthic fishes living at
temperatures of less than 8°C (Anderson 1984).
The common eelpout (Zoarces viviparus) from the Northern hemisphere (fig. 2.1A) is
ovoviviparous (Götting 1976) and inhabits rocky shores under stones, among algae in tide
pools and coastal areas down to 40 m depth (fishbase, http://filaman.uni-
kiel.de/search.cfm). Z. viviparus can be found from the White Sea, Barents Sea southwards
on the Norwegian coast to the English channel and the Irish Sea, as well as on the coasts of
the Baltic and the North Sea (72°N - 49°N, 11°W - 42°E; Christiansen et al. 1981;
fishbase, http://filaman.uni-kiel.de/search.cfm) with the Wadden Sea being its most
southern area of distribution (Knijn et al. 1993). Due to its benthic lifestyle, Z. viviparus
feeds on gastropods, chironomids, crustaceans, eggs and fry of fishes (fishbase,
http://filaman.uni-kiel.de/search.cfm). Since the eelpout is behaviourally a very sedentary

MATERIAL & METHODS
14
fish, it shows the tendency to form local races (Christiansen et al. 1981, Schmidt 1916-
1917). The thermal physiology of this species has been very well studied (Van Dijk et al.
1999, Zakhartsev et al. 2003, Pörtner et al. 2004). Moreover, the common eelpout is highly
tolerant to short-term hypoxia, surviving one hour of anoxia (Fischer et al. 1992), and is
even able to breathe air when out of the water (fishbase, http://filaman.uni-
kiel.de/search.cfm). Together, Z. viviparus represents a perfect model-organism for
studying temperature-induced hypoxia effects on oxidative stress and hypoxic signalling.
All Z. viviparus used for this thesis work were caught with bottom traps in shallow
waters near Helgoland, German North Sea (54°11’N, 7°52’E; fig. 2.3A). The sea surface
temperature varies between 3°C in winter and 18°C in summer (see fig. 8.1 in the
appendix), thus Z. viviparus can be called eurythermal.
Fig 2.1A: Zoarces viviparus Fig. 2.1B: Pachycara brachycephalum
For comparison of oxidative stress parameters in a latitudinal cline the con-familial,
bathydemersal, Antarctic eelpout Pachycara brachycephalum was studied (fig. 2.1B). This
species is endemic, shows a circum-Antarctic distribution (60°S - 78°S) and can be found
in 200 - 1810 m depth (fishbase, http://filaman.uni-kiel.de/search.cfm). Although
P. brachycephalum is found between 0.76 and -1.8°C, around the Antarctic peninsula a hot
spot of occurrence can be found in water layers at 350 m (0.5°C) and 860 m (0.2°C)
(Brodte et al., ms submitted). It feeds on mussels, gastropods, amphipods and polychaetes
and is oviparous. P. brachycephalum for the present work were sampled with releaser traps
near King George Island (Maxwell Bay; 62°14’S, 58°40’W; fig 2.3B) at 400 m depth upon
an Antarctic expedition of RV Polarstern (ANT XIX/5) in April 2002. Water temperatures
in this area were between 0.5 - 0.8°C (K. Mintenbeck, pers. com.).
A B

MATERIAL & METHODS
15
For HIF-1α sequencing studies presented in publication II two Antarctic members of the
family of Nototheniidae (cod icefishes) and one Antarctic member of the family of
Channichthyidae (crocodile icefishes) were studied. Both families belong to the suborder
of Notothenioidei, the nototheniids being the most diverse family. Most nototheniid
species are benthic and Antarctic, only 15 of the 49 species display non-Antarctic
distribution (Eastman 1993). The absence of a swim bladder is compensated for by lipids
and low mineral content of bones, leading to near neutral buoyancy.
Fig. 2.2: Trematomus pennellii (A), Trematomus hansoni (B), and Chionodraco myersi (C); taken from Gon & Heemstra (1990)
The demersal Trematomus pennellii (fig. 2.2A) can be found in the depth range of
0 - 732 m of Scotia Arc, the South Orkney Islands, Davis and Ross Sea in the Southern
Ocean (60°S - 78°S; fishbase, http://filaman.uni-kiel.de/search.cfm). Maintained in
aquaria, this species has been observed to be more inactive than its congener T. hansoni
(fig. 2.2B), which displayed considerable spontaneous activity (Eastman 1993). T. hansoni
is also demersal, occurring in a depth range of 6 - 549 m of South Orkneys, South Georgia
and South Shetland islands, the Ross, Davis and Weddell Seas, South Victoria, Adelie,
Queen Mary and Princess Ragnhild Coasts in the Southern Ocean (53°S - 78°S; fishbase,
http://filaman.uni-kiel.de/search.cfm). Benthic trematids are feeding generalists with
variable diets depending on availability (polychaetes, small fishes, fish eggs, amphipods,
crustaceans, zooplankton; Eastman 1993).
A
B
C

MATERIAL & METHODS
16
Channichthyids are fusiform fishes with a very weakly ossified skeleton feeding mainly
on krill. They are also known as “white-blooded fishes” due to the lack of haemoglobin,
although some non-pigmented erythrocytes are present (Eastman 1993). The complete lack
of red blood cells has been interpreted as an extreme adaptation character of Antarctic fish
that display reduced haematocrits and haemoglobin concentrations combined with low
oxygen affinity (Feller & Gerday 1997). However, in channichthyids, the lack of haem
pigments is compensated for not only by the high oxygen content of cold water, but also by
a large increase of blood volume and cardiac output (Acierno et al. 1997). Chionodraco
myersi (fig. 2.2.C) is a bathydemersal channichthyid found between 200 and 800 m and
with a circum-Antarctic distribution on the continental shelf (61°S - 78°S; fishbase,
http://filaman.uni-kiel.de/search.cfm).
Fig. 2.3: Sampling areas of fish species, indicated by red dots. A: Northern Europe; Zoarces viviparus was sampled in the German North Sea. B: Antarctic; Pachycara brachycephalum was sampled near King George Island; Trematomus pennellii, Trematomus hansoni, and Chionodraco myersi were sampled in the Weddell Sea.
All samples from notothenioids were taken onboard RV Polarstern on cruise ANT XXI/2
in December 2003 and frozen transported for later analysis at the Alfred-Wegener Institute
(Bremerhaven, Germany). The fish were caught in the Weddell Sea (70°56.57S,
10°33.02W; fig. 2.3B) at 300 m depth with a bottom trawl. Water temperatures in this area
were around -1.5°C (K. Mintenbeck, pers. com.).
2.2. Experimental conditions
A first set of studies on Zoarces viviparus focusing on long-term and short-term
temperature effects on oxidative stress and hypoxic signalling (Publication I, III, IV) was
A B

MATERIAL & METHODS
17
carried out using animals caught from May - July 2002, thus representing summer animals,
and kept at Biologische Anstalt Helgoland, Germany in aquaria with a flow-through
system of natural sea water and 12°C until the beginning of the experiment in July 2002.
For studying acute temperature stress, animals were directly transferred to a separate
thermostatted incubation basin and exposed to 1, 5, 18, 22 or 26°C, representing pejus,
critical and sub-lethal conditions for this species (Zakhartsev et al. 2003). After 2 h, half of
the animals were sacrificed immediately, whereas the other half was returned to control
temperatures (12°C) to allow for 24 h of recovery.
A second batch of Z. viviparus was caught in September 2003 and transported to the
Alfred-Wegener Institute (Bremerhaven, Germany) in November 2003, where the animals
were kept in natural sea water at 10°C until the beginning of the experiment in December
2003. To study the effect of different recovery periods after heat stress (publication IV),
fish were transferred to the same incubation basin as described above and exposed to 18°C,
followed by 0, 6, 8 or 12 h of recovery at 10°C.
For comparison of animals collected in various seasons, as well as for intra-familiar
comparison to P. brachycephalum (publication I), specimens of Z. viviparus were caught
in October 2002 and kept at temperatures similar to the outside water at the Biologische
Anstalt Helgoland until sampling in February 2003, when water temperatures in the
aquaria were 6°C. In the same month temperatures around Helgoland were occasionally
down to 4°C (fig. 8.1B in the appendix). These latter animals are called winter animals
throughout.
P. brachycephalum for the comparison to Z. viviparus were sampled in April 2002 and
transported onboard to the Alfred-Wegener Institute (Bremerhaven, Germany), where they
were kept at 0°C until start of the experiment (publication I). In December 2002 half of the
animals remained at 0°C (controls), whereas the other half was transferred to a separate
aquaria system and acclimated to 5°C over 11 weeks until sampled in March 2003.
Fish at Biologische Anstalt Helgoland were fed pieces of frozen white fish, fishes kept at
Alfred-Wegener Institute headquarters were fed live common shrimp once a week. All
experiments as well as animal maintenance were carried out at a natural salinity of
32 - 33o/oo and with well-aerated water. Oxygen contents in the water calculated according
to Boutelier et al. (1984) ranged between 357 µM (1°C), 275 µM (12°C), and 211 µM
(26°C). According to the critical PO2 values reported by Zakhartsev et al. (2003) for
different water temperatures (around 80 µM O2), all temperature experiments can be
considered as normoxia conditions. Prior to experimentation, all animals were maintained

MATERIAL & METHODS
18
for at least 10 days in the aquaria system to support full recovery from sampling or
transportation stress.
After experimental treatments, fish were narcotised with 0.5 g MS 222 * L-1 seawater,
weighted and killed by cutting the spine. Different tissues were rapidly removed, starting
with the most metabolically active, the liver. Tissue aliquots of 100 - 200 mg were frozen
in liquid nitrogen and stored at -80°C prior to analysis. Length and sex of the fishes were
recorded after tissue sampling. Information about the sampling, size and age of the fishes
used for the presented studies is summarized in tab. 8.1 in the appendix.
All biochemical and molecular analyses were carried out in liver tissue, which has been
shown to be highly sensitive to temperature-dependent oxygen limitation (Van Dijk et al.
1999). As no sex specific differences were detected for glutathione, SOD, carbonyls and
chemiluminescence in samples from both zoarcids within the studies of publication I,
samples from male and female individuals could be pooled for all analyses.
2.3. Biochemical assays
2.3.1. Determination of thiobarbituric reactive substances (TBARS) according to
Uchiyama & Mihara (1978)
The TBARS content was determined as a marker of lipid peroxidation.
A minimum of 160 mg of deep frozen tissue was ground in liquid nitrogen and
homogenised in 1.1% phosphoric acid (1:10 to 1:20; w:v). To 400 µl of homogenate the
same amount 1% thiobarbituric acid (TBA, dissolved in 50 mM NaOH, containing 10 mM
butylated hydroxytoluene) was added. For blanks TBA was replaced by 3 mM HCl. The
solutions were heated for 1 h at 100°C and subsequently extracted with 2 ml butanol by
vortexing for 40 sec and subsequent centrifugation (5 min at 1 000 g). For further
purification, the resulting supernatant was centrifuged for 5 min at 14 000 g and the
TBARS content determined spectrophotometrically as the difference of absorbance
A532nm - A600nm. After blank subtraction, the TBARS content was calculated using a 5-point
calibration curve, obtained with malondialdehyde-(bis)-acetate standard (MDA; Merck,
Darmstadt, Germany) processed in the same way as the samples.
2.3.2 Tert-butyl hydroperoxide-initiated chemiluminescence according to Gonzalez
Flecha et al. (1991)
Artificial hydroperoxides such as tert-butyl hydroperoxide (tBOOH) are known to
decompose to alkoxyl or peroxyl radicals and hence stimulate chain reactions of lipid

MATERIAL & METHODS
19
peroxidation accompanied by increased light emission (Halliwell & Gutteridge 1999). The
main sources of chemiluminescence detected by this assay are the dimol emission of
singlet oxygen and the photon emission from excited carbonyl groups formed during lipid
peroxidation (Gonzalez Flecha et al. 1991).
Approximately 50 mg of liver tissue were homogenised in the 10-fold volume of 30 mM
KPi buffer (pH 7.4) containing 120 mM KCl and centrifuged at 600 g for 10 min. The
supernatants were diluted 1:2 to 1:5 in buffer yielding a final protein concentration of
1-2 mg * ml-1. After measurement of blank chemiluminescence, tBOOH was added to a
final concentration of 3 mM. The assay was carried out in the dark at room temperature in
a liquid scintillation counter (Wallac, Ramsey, USA) in the out-of-coincidence mode,
using potassium glass vials kept in the dark for at least 48 h to avoid vial phosphorescence
activation by fluorescent light. The obtained chemiluminescence data were determined as
counts per minute (cpm). Cpm of each sample were recorded every 260 sec over an entire
time period of 70 min. Data corrected for blank chemiluminescence were plotted in a tissue
characteristic curve with y = chemiluminescence and t = time. An example is given in
fig. 8.7 in the appendix. The area under the curve could be calculated for a time period of
4 000 sec (= 66.67 min) using MatLab 7.0 program (x = min (t) : 1 max (4 000);
C = polyfit (t, y, 4); Y = polyval (C, X); area = sum (Y); plot (t, Y, ’ro’, X, Y). The
resulting arbitrary units were related to the protein content of the sample. Samples obtained
from the recovery-time series were analysed by Packard (Zavantem, Belgium) liquid
scintillation counter, where cpm recording was over an entire period of 62 min. The area
was therefore calculated for the time period of 3 600 sec.
2.3.3. Determination of carbonyl groups according to Levine et al. (1990)
Carbonyl groups in amino acid residues are a measure for oxidative modifications of
proteins. Detection of these groups was done after reaction with the carbonyl-specific
reagent 2,4-dinitrophenylhydrazine (DNTP).
Samples (100 mg) were homogenised in 10 ml of 50 mM HEPES buffer, pH 7.4,
containing 125 mM KCl, 1.1 mM EDTA, 0.6 mM MgSO4 and protease inhibitors
(0.5 mg * ml-1 leupeptine, 0.7 mg * ml-1 pepstatine, 40 mg * ml-1 phenylmethylsulfonyl
fluoride, 0.5 mg * ml-1 aprotinin,) and centrifuged at 100 000 g for 15 min. 0.4 ml of
supernatants were incubated at room temperature for 1 h with 1.4 ml 10 mM DNTP in 2 M
HCl. Blanks were run without DNTP. During incubation samples were vortexed every
15 min. After 1 h, 0.2 ml of 100% TCA were added to precipitate the protein and

MATERIAL & METHODS
20
centrifuged for 10 min at 10 000 g. The protein pellet was washed three times with 1 ml
ethanol : ethylacetate (1:1), resuspended in 0.6 ml 6 M guanidine hydrochloride in 20 mM
potassium phosphate (pH = 2.3) and incubated at 37°C until complete resuspension. The
carbonyl content could be measured spectrophotometrically at 360 nm (molar extinction
coefficient ε = 22 000 M-1 * cm-1).
2.3.4. Determination of reduced (GSH) and oxidised (GSSG) glutathione according to
Fariss & Reed (1987)
Glutathione represents a non-enzymatic low molecular weight antioxidant and is,
moreover, the most important constituent of the cellular redox milieu (Schafer & Buettner
2001).
Frozen tissue was ground in liquid nitrogen and the resulting powder homogenised in
1:10 (w:v) pre-cooled PCA (10% containing 2 mM bathophenantroline-disulphonic acid).
After centrifugation at 15 000 g for 5 min at 4°C, 500 µl of the supernatant were mixed
with 10 µl pH-indicator (1 mM m-cresol purple sodium salt containing 0.5 M iodoacetic
acid (IAA)) and 50 µl 1 mM γ-glutamyl-glutamate (in 0.3% PCA), added as internal
standard. The pH was adjusted to 8.5 with 5 M KOH (containing 0.3 M N-morpholine-
propanesulfonic acid). The mixture was incubated at room temperature for 45 min to allow
IAA to bind to GSH. Subsequently, samples were centrifuged for 5 min at 15 000 g at 4°C.
300 µl of the supernatant were added to the double amount of 1% 1-fluor-2,4-
dinitrobenzene (FDNB, diluted in 100% ethanol, HPLC grade) and derivatised in dark
vials at room temperature over 24 h. After centrifugation at 7 500 g for 1 min at 4°C and
purification through 0.2 µm nylon membrane filters, samples were stored in dark HPLC
vials at -20°C.
HPLC determination was done on a Beckmann Coulter HPLC System using a NH2-
spherisorp column, 5 µm 240 * 4 mm (Waters, Eschborn, Germany). Solvent A: 80%
methanol and solvent B: sodium acetate stock in 80% methanol (20:80). Sodium-acetate
stock was prepared by dissolving 500 g Na-acetate in 224 ml Milli-Q water and 695 ml of
concentrated HPLC-grade acetic acid. The gradient programme was as follows: 10 min
hold at 90% A followed by a 25 min linear gradient to 25% A at a flow rate of 1 ml * min-1
and a backpressure of 2.3 to 2.8 psi. Peaks were recorded with a photodiode array detector
at 365 nm. Concentrations were calculated using 5-point calibration curves for GSH and
GSSG standards processed in the same manner as described for the samples.

MATERIAL & METHODS
21
As GSSG is formed by oxidation of 2 molecules GSH, total glutathione content was
calculated as the sum (2 GSSG + GSH). Accordingly, the redox ratio of oxidised to
reduced glutathione was expressed as 2 GSSG / GSH.
The in situ redox potential was calculated by using the Nernst equation (2.1):
∆E = E°pH – (RT * 2.303 / nF) log ([GSH]² / [GSSG]) mV (2.1)
as described by Schafer & Buettner (2001) and by taking into account the different
experimental temperatures of the fishes as well as temperature-induced changes of
intracellular pH (pHi, data taken from Sartoris et al. 2003 and adopted to fish liver, Larsen
et al. 1997).
2.3.5. Detection of α-tocopherol (vitamin E) according to Desai (1984)
α-Tocopherol represents the most active compound of the lipid soluble non-enzymatic
antioxidant vitamin E (Dunlap et al. 2002).
Tissue samples were homogenised in 3- to 5-fold volume of sodium dodecyl sulfate
(SDS). To 300 µl homogenate, or 100 µl of microsomal suspension (see below), 1 ml of
ethanol was added and vortexed for 1 min. Afterwards, 4 ml of hexane were aggregated
and the mixture vortexed again for 1 min. After 10 min centrifugation at 600 g, 300 µl of
the lipid phase were dried with nitrogen gas. The remaining lipid soluble compounds were
dissolved in 150 µl of methanol : ethanol (1:1) and filtered through 0.22 µm nylon
membranes. Hereafter, samples were analysed by reverse phase high performance liquid
chromatography (HPLC) and electrochemical detection with an oxidation potential of
0.6 V and a flow rate of 1 ml * min-1. The isocratic system consisted of a column
(Supelcosil LC-8, 3 µm 15 cm * 4.6 mm; Supelco, Sigma, Seelze, Germany) and a solvent
containing 20 mM LiClO4 in 99% methanol. The α-tocopherol content of the resulting
peaks was calculated by relation to the peak area of α-tocopherol standard (67.65 µM). The
concentration of the standard was determined spectrophotometrically at 292 nm,
ε = 3.06 mM-1 * cm-1.
2.3.6. EPR determination of the intracellular “free” iron according to Woodmansee &
Imlay (2002) and Linares et al. (2003)
Iron(II) can act as catalyst for Fenton reactions, leading to enhanced formation of hydroxyl
radicals and subsequent initiation of lipid radical chain reactions (Halliwell & Gutteridge
1999). EPR detection of “free” iron by EPR includes all iron (Fe(II) and Fe(III)) that is not
firmly integrated into enzymes or iron storage proteins. All chemicals have to be prepared

MATERIAL & METHODS
22
in iron-free water obtained from Milli-Q filtered trough a sephadex column. After filtration
water pH is 9 - 10.
Liver samples pooled from 2 animals were ground in liquid nitrogen and the resulting
powder homogenised (1:2, w:v) in 10 mM Tris-HCl buffer pH 7.4 containing desfero-
xamine mesylate (final concentration 2 mM). 250 µl of each homogenate were frozen
(-20°C) for the determination of total tissue iron content as described below. The
remaining homogenate was incubated for at least 5 min, transferred to plastic tubes and
frozen in liquid nitrogen. EPR detections were carried out with a Bruker (Buenos Aires,
Argentina) spectrometer ECS 106 at 77K under permanent cooling of the sample in liquid
nitrogen. The EPR settings were centre-field, 1600 G; sweep width, 800 G; time constant
82 ms; modulation amplitude, 4.75 G; power, 10 mW. A standard curve was obtained from
Fe2(SO4)3x7H2O in 200 µM HCl quantified spectrophotometrically at 420 nm;
ε = 2.865 mM-1 * cm-1 for the Fe3+:desferal complex.
2.3.7. Determination of the total iron content in tissues according to Brumby &
Massey (1967) and Lawrie et al. (1991)
Homogenates were incubated at 50 - 60°C for at least 48 h until complete dryness.
Afterwards, dried samples were mineralised in HNO3 : HClO4 (1:1) and heated to dryness.
The remaining inorganic residues were diluted in 4 ml 5% HCl. After addition of 10%
thioglycolic acid to convert Fe(III) to Fe(II), the concentration of Fe(II) was measured
spectrophotometrically after reaction with 4 mM bathophenanthroline at 535 nm.
Quantification was done using a 5-point calibration curve obtained from iron standard
(Sigma, Seelze, Germany).
2.3.8. Measurement of iron reduction rate according to Vegh et al. (1988)
The reduction rate of Fe(III) to Fe(II) was measured as a further indicator for the presence
of Fenton-reactive Fe(II).
Samples were homogenised in 100 mM KPi buffer (pH 7.4) in 500 µl final volume. To
separate cell debris and lipids, homogenates were centrifuged for 8 min at 10 000 g. The
supernatant was mixed with 100 mM Tris-HCl buffer (pH 7.4) and the iron reduction rate
recorded spectrophotometrically at 520 nm, ε = 13.6 mM-1 * cm-1, after adding 50 µM
Fe-EDTA, 11 mM α-α’-bipyridyl and 500 µM NADPH. Assays were carried out at room
temperature.

MATERIAL & METHODS
23
2.3.9. Extraction of liver microsomes according to Klein et al. (1983)
As lipid radical EPR signals in liver homogenates were abolished by high cytosolic
antioxidant potential the microsomal fraction had to be extracted from liver tissue samples.
Microsomes represent membrane rearrangements after the homogenisation process,
originating mainly from the endoplasmic reticulum, but also the plasma membrane, and
they are known to undergo lipid peroxidation in the presence of NADPH and Fe(III) salts
(Halliwell & Gutteridge 1999).
A minimum of 0.6 g of liver tissue was needed for microsome extraction. Sample
aliquots were pooled from 1 - 3 fish and homogenised in 9 ml of 100 mM KPi buffer at pH
7.4. After centrifugation at 1 000 g for 10 min and 4°C to remove cell debris, the
supernatant was again centrifuged for 1 h at 100 000 g and 4°C. The resulting microsomal
pellet was resuspended in 1.5 ml of 125 mM KCl, frozen in liquid nitrogen and stored at
-20°C.
2.3.10. EPR spin trapping of lipid radicals in liver microsomes according to Buettner
(1987)
Lipid radicals reflect the sensitivity of lipid membranes to ROS attack. α-(4-pyridyl 1-
oxide)-N-t-butyl nitrone (POBN) adducts resulting in characteristic EPR spectra with
hyperfine coupling constants of aN = 15.8 G and aN = 2.6 G, in agreement with computer
spectral simulated signals obtained using those parameters can be assigned to lipid
radicals. However, spin trapping studies cannot readily distinguish between peroxyl
(ROO•), alkoxyl (RO•) and alkyl (R•) adducts, owing to the similarity of the corresponding
coupling constants (Buettner 1987).
To initiate the lipid radical production 5.5 mM ADP, 1 mM NADPH, 0.1 mM
Fe(NH4)(SO4)2x12H2O (in 0.1 N HCl) were added to 1 ml of microsomal suspension. For
later detection of the lipid radicals 100 mM of the spin trap POBN was aggregated and
samples were refrozen in liquid nitrogen. Immediately before detection samples were
rapidly thawed and lipid radical generation measured at room temperature using a Bruker
(Buenos Aires, Argentina) spectrometer ECS 106, operating at 9.81 GHz with 50 kHz
modulation frequency. After 30 min at room temperature lipid radical production of each
sample was detected again to see the increase over time. EPR instrument settings were
microwave power, 20 mW; modulation amplitude, 1.194 G; time constant, 81.92 ms;
receiver gain, 2 * 104. Quantification was done using 4-OH TEMPO standard.
MATERIAL & METHODS
24
2.3.11. Measurement of superoxide dismutase (SOD) activity according to Livingstone
et al. (1992)
The SOD (E.C: 1.15.1.1) activity was determined using a xanthine oxidase
(XOD) / cytochrome c assay at 20°C as well as at the respective water temperature of each
experimental group.
Frozen liver tissue was ground in liquid nitrogen and the resulting powder homogenised
in 20 mM Tris-HCl buffer (pH 7.6, containing 1 mM EDTA). After centrifugation for
3 min at 20 800 g, 4°C, the SOD activity was measured in the supernatant. The assay
mixture consisted of 43 mM KPi buffer (pH 7.8, containing 0.1 mM EDTA), 50 µM
xanthine, 100 µM cytochrome c, final concentrations. The actual volume of added
0.3 mU * µl-1 XOD was adjusted to yield an extinction increase of 0.02 E * min-1 without
sample. Likewise, the added sample volume was adjusted to an extinction increase of
0.01 E * min-1. 1 Unit SOD reduces the increase in extinction of superoxide-mediated
reduction of oxidised cytochrome c by 50% (measured at 550 nm).
2.3.12. Determination of Glutathione peroxidase activity (GPX) according to Günzler
& Flohe (1985)
GPX activity was measured by coupled optical test. Oxidised glutathione GSSG is formed
by the reaction of GPX and continuously reduced by an excess of glutathione reductase
(GR) activity, providing a constant level of GSH. The rate of NADPH oxidation by GR
can be recorded spectrophotometrically at 340 nm.
Tissues were homogenised in 20 mM Tris-HCl buffer (pH 7.6, containing 1 mM EDTA,
and 1 mM DTT) (w:v / 1:3). The assay system consisted of 100 mM KPi reaction buffer
(pH 7.0, containing 1 mM EDTA), 10 mM NaN3 for inhibition of catalase, 10 U * ml-1
glutathione reductase and 10 mM GSH. This mixture was incubated with 10 - 100 µl of
sample for 10 min at 37°C to reactivate GPX. After addition of 1.5 mM NADPH (in 0.1%
NaHCO3), hydroxide-independent NADPH consumption was determined. After 3 min
1.5 mM H2O2 was added and the reaction recorded over 5 min. Reagent blanks were run by
replacing sample with reaction buffer to control chemical oxidation.
Reactivation of GPX at 37°C led to similar activities as incubation at 20°C or on ice in
samples from the polar species, indicating that this incubation has no adverse effect on
GPX activity. Although incubation at 37°C had no stimulating effect on GPX activity in
the polar species, all samples were treated in the same way as described above in order to
achieve the same treatment for all samples.

MATERIAL & METHODS
25
2.3.13. Griess colorimetric assay according to Misko et al. (1993) and Verdon et al.
(1995)
The total content of nitrite and nitrate was measured as an indicator for NO production.
Frozen tissue was homogenised in the 10-fold volume of 30 mM KPi buffer
(pH 7.1 - 7.2). The homogenate was applied to filter tubes (30 000 MWCO) and
centrifuged for 1.5 h at 7 650 g, 4°C to remove all organic compounds. To convert all
nitrate to nitrite, the inorganic filtrate was incubated for 2 h at room temperature with 5 µM
NADPH, 6 M glucose-6-phosphate, 0.06 U * ml-1 glucose dehydrogenase, 0.3 U * ml-1
nitrate reductase. For the Griess reaction the incubated sample was mixed with 1%
sulphanilamide and 0.1% naphthalene-ethylene diamine dihydrochloride in the ratio
(1:1:1). Determination of the nitrite content was done spectrophotometrically at 540 nm
and quantified using a 3-point calibration curve obtained from KNO2- standards incubated
in the same way as described for the samples. A second standard curve was generated
using NaNO3- as control for completely conversion of nitrate to nitrite.
2.3.14. Protein content according to Bradford (1976)
The protein content of the samples was determined spectrophotometrically at 590 nm by
the Bradford method using bovine serum albumin (Sigma, Seelze, Germany) as a standard.
2.4. Molecular Studies:
2.4.1. Cloning and Sequencing of the transcription factor HIF-1α
Total RNA was extracted from frozen liver tissues using RNeasy kit (Qiagen, Hilden,
Germany) according to the manufacturer’s protocol. Protocol for P. brachycephalum as
well as notothenioids (Trematomus hansoni, Trematomus pennellii, Chionodraco myersi)
was modified by proteinase K digestion of the tissue as described by Lucassen et al.
(2003). Oligotex kit (Qiagen, Hilden, Germany) was used to isolate mRNA from total
RNA. The RNA quantification was done spectrophotometrically. A260 / A280 ratios were
> 1.8. Three different primer pairs (tab. 2.2) for hypoxia inducible factor (HIF) -1α were
constructed from conserved regions in previously published HIF-1α cDNA sequences
(rainbow trout, AF304864; zebrafish, AY326951; grass carp, AY450269, human
31077212). Thus, three overlapping fragments were obtained and identified as partial
HIF-1α sequences by BLAST search in NCBI (http://www.ncbi.nlm.nih.gov/BLAST/;
translated query vs. protein database, blastx). The obtained cDNA fragments were used to

MATERIAL & METHODS
26
construct gene specific primers (tab. 2.2) for RACE (rapid amplification of cDNA ends) by
First Choice RLM-RACE kit (Ambion, Austen, USA).
For reverse transcription 0.2 µg mRNA were incubated 65 min at 42°C and 20 min at
70°C with 1 U * µl-1 Superscript RT (Invitrogen, Karlsruhe, Germany), 6 pmol of
respective gene specific reverse primer, 0.625 mM of each dNTP, 10 mM DTT, 2.5 mM
MgCl2, 50 mM KCl, 20 mM Tris-HCl (pH 8.4).
PCR reactions to amplify RT-products was carried out in a gradient cycler (Tgradient,
Biometra) with 0.5 U * µl-1 Taq-Polymerase (Eppendorf, Hamburg, Germany) or
SuperTaq Plus polymerase (Ambion, Austen, USA) for sequences with an expected length
> 1 000 bp, 1.75 mM MgCl2, 0.2 mM of each dNTP, 1 pmol * µl-1 primer pair in 20 mM
Tris-HCl (pH 8.4), 50 mM KCl. The concentration of MgCl2 was reduced to 1.5 mM if
higher concentrations were not successful.
Tab. 2.2: List of all primers used. Zv: only used for amplification of partial HIF-1α cDNA of Z. viviparus, Pb: only used for amplification of partial HIF-1α cDNA of P. brachycephalum, N: used for amplification of partial HIF-1α cDNA of notothenioids and zoarcids, 2: only used for amplification of partial HIF-2α cDNA of T. hansoni and C. myersi, * position of partial CmHIF-2α, bp = base pairs.
Primer Sequence (5` – 3`) Position of ZvHIF-1α
Product size of ZvHIF-1α fragment (bp)
I HIF-F1 CCAAGGAACMAAACACAGAARCG 677 – 698 HIF-B5 TGAGTCTCMACCCACACAAARCC 1157 – 1135 435 II HIF-F1L TCCAACATCCCTCCAACATCG 878 – 898 HIF-B7L TTCTTCTCGTCCCCCAGCAGGAAC 1376 – 1353 453 III HIF-F13 TGTGYGTCAACTAYGTKCTCCAGTGG 1206 – 1229 N HIF-B31 TGACTTGGTCCAGRGCACKCAG 2437 – 2416 1175 N HIF-5`-B1 GATGTTGGATGGGGTCACAGAC 886 – 865 865 HIF-5`-B4Z TGTATGGCGGCTGAGAAAAGTC 939 – 918 918 Zv HIF-5`-B6 GTAGATGACAGTGGCTTGTGTTTCC 1173 – 1149 1149 HIF-3`-F6 TTGATACAGAGCCCAAAACCC 1805 – 1825 1558 Pb HIF-3`-F10 AGTCCAGTCCCTTCAGAGTTCTC 1944 – 1966 1417 IV HIF2-F1 CTCTGTTCTGCATCAGGTGAA (438 – 463)* 2 HIF2-B1 CCAGCGTCCAGGAGATTACTACAC (1075 – 1053)* (637) 2
RNA processing for 5`RACE-PCR was modified using 1 µg mRNA for 2 h incubation at
37°C with 1 U CIAP (calf intestine alkaline phosphatase; Gibco, Karlsruhe, Germany).
Termination of the CIAP reaction and precipitation with acid phenol : chloroform was
carried out according to the manufacturer’s protocol. Isopropanol precipitation was
performed at -80°C for 1 h. After precipitation with 70% ethanol, the dried pellet was
resuspended in 20 µl nuclease-free water, and the RNA concentration determined
spectrophotometrically. 250 ng mRNA were used for the following steps as described by
the manufacturer.

MATERIAL & METHODS
27
A standard PCR protocol was used with 35 cycles of 45 sec denaturation at 94°C,
annealing 80 sec with a 12°C gradient (58 ± 6°C) and 45 sec elongation at 72°C, followed
by a final elongation step of 8 min at 72°C. 3`RACE-PCR and 5`RACE-PCR reactions
with P. brachycephalum samples were carried out at higher annealing temperatures
(61 ± 6°C and 62 ± 6°C, respectively). The 1 175 bp fragments (see primer pair III) of
P. brachycephalum and notothenioid samples were amplified using a touch-down program
with 2 min annealing temperatures from 60 ± 6 to 51 ± 6°C (-1°C / cycle), followed by 25
cycles with 1 min annealing at 57 ± 6°C.
PCR-products were separated in a 1.3% agarose gel. Fragments of appropriate size were
purified by QIAquick gel extraction kit (Qiagen, Hilden, Germany) and cloned by
TOPO TA cloning kit (plasmid vector: pCR4-TOPO; chemically competent TOP10
E. coli; Invitrogen, Karlsruhe, Germany) as described in the manufacturer’s instruction. 6
to 8 clones were separated for overnight liquid culture in LB medium. Cloned plasmids
were isolated by Qiaprep Spin Miniprep kit (Qiagen, Hilden, Germany). The presence of
inserts was checked by restriction digestion with EcoRI (Invitrogen, Karlsruhe, Germany)
before sequence determination with T3 or T7 primers by MWG-Biotech (Ebersberg,
Germany).
All inserts from positive clones of one species were assembled to obtain full length
cDNA sequences of HIF-1α of both zoarcid species and partial HIF-1α sequences of
notothenioids. Using the primer pair III additional fragments comprising 1 497 nucleotides
were obtained from T. hansoni and C. myersi and identified by BLAST search as HIF-2α.
As after sequence determination with T3 and T7, the centre part of the HIF-2α fragment
was still unclear, a specific primer pair (IV) amplifying a 637 bp product at position
438 - 1075 on partial CmHIF-2α cDNA was constructed.
MacVector 7.2 was used for primer design, sequence alignments and analysis,
AssemblyLign 1.0.9c for assemblage of overlapping fragments.
2.4.2. Whole-cell extracts from liver tissue for Western blotting analysis and EMSA
Nuclear extraction protocols, developed for rainbow trout tissues (Soitamo et al. 2001)
were not readily applicable to eelpout samples: Western blotting analysis with antibodies
against HIF-1α resulted in much weaker signal intensities in nuclear extracts compared to
whole-cell extracts although the majority of the HIF-1α protein would be expected in the
nucleus (Kallio et al. 1998). It might be that the protocol developed for the freshwater fish
cannot be used for marine species, probably leading to osmolysis of the nuclei in samples

MATERIAL & METHODS
28
from marine fish. With regard to the limited amount of eelpout samples, analysis had to be
carried out with whole-cell extracts, prepared according to Vuori et al. (2004).
50 mg of liver tissue were homogenised in 200 µl buffer C (20 mM HEPES, pH 7.8,
0.42 M NaCl, 1.5 mM MgCl2, 0.2 mM EDTA, 0.5 mM PMSF, 0.5 mM DTT,
25% glycerol, 2 µg * ml-1 leupeptine, 2 µg * ml-1 antipaine, 2 µg * ml-1 pepstatine,
2 µg * ml-1 aprotinin, 1 mM Na3VO4) and centrifuged at 16 100 g, 30 min, 4°C to remove
cell debris.
2.4.3. Western blotting analysis of HIF-1α protein and HSP70
20 µg protein of whole-cell extracts per well were run on 7.5% LiDS-PAGE at 40 mA and
transferred to 3 MM nitrocellulose membrane (semi-dry blotting; 1 h; 0.4 A; 13 V).
Membranes were blocked for 1 h at room temperature with 3% non-fat dry milk in PBS
0.3% Tween20, rinsed 3 times for 10 min with PBS 0.3% Tween20 and incubated with the
primary antibody over night at 4°C followed by 1 h at room temperature. Polyclonal
antibodies directed against the N-terminus of rainbow trout HIF-1α were used as described
by Soitamo et al. (2001), dilution 1:2 000 in 1% BSA PBS + 0.02% NaN3. The antibody
recognised HIF-1α only in liver samples from Z. viviparus, but not from
P. brachycephalum.
After the incubation, the membranes were washed and incubated for 3 h at room
temperature with horseradish peroxidase conjugated anti-rabbit secondary antibody
(Amersham Biosciences, Freiburg, Germany), dilution 1:7 500 in 3% non-fat dry milk in
PBS 0.3% Tween20. After washing the membranes, the signals were detected by enhanced
chemiluminescence (ECL, Amersham Biosciences, Freiburg, Germany). Signal intensities
of HIF-1α protein bands were calculated from autoradiographed film, using Chemi-Imager
digital camera and software (Alpha Innotech Co., San Leandro, USA). Calculation of the
%-intensity was based on densitometry of gel images, with the sum of the bands from all
experimental groups taken as 100% value.
Analysed membranes were washed three times as described above, blocked again for
30 min at room temperature, washed three times and incubated for 1 h at room temperature
with HSP70 antibody (Affinity Bioreagents, Golden, USA), dilution 1:10 000 in
0.5% BSA PBS + 0.02% NaN3. The membranes were washed again, incubated with
anti-mouse secondary antibody (Amersham Biosciences, Freiburg, Germany), diluted
1:20 000 in 3% non-fat dry milk in PBS 0.3% Tween20, at room temperature. HSP70
signals were detected in the same way as described for HIF-1α.

MATERIAL & METHODS
29
2.4.4. Electromobility shift assay (EMSA) according to Kvietikova et al. (1995) and
Soitamo et al. (2001)
EMSA was carried out to study the DNA binding activity of the transcription factor HIF-1
which is supposed to indicate the initiation of hypoxic signalling. The protocol which was
used for sample analysis is given in publication III. Subsequently the protocol was slightly
modified to obtain stronger EMSA signals:
According to Soitamo et al. (2001), the promoter region of the human erythropoietin
(EPO) gene was used as a HIF-sensitive DNA probe (5`-GCCCTACGTGCTGTCTCA-3`)
in fish samples. 18 pmol of sense strand and antisense strand were incubated separately
with 5 mM MgCl2 for 3 min at 95°C in a total volume of 10 µl. For annealing the heated
strands were mixed and incubated for another 3 min at 95°C. The annealed strands were
cooled down to room temperature within 3 hours. 5`-endlabeling of the annealed strands
(1 pmol * µl-1 DNA) was done with 10 U * µl-1 T4 polynucleotide kinase and 32P-γ-dATP
(10%; v:v) over 30 min at 37°C. After removing unincorporated nucleotides by
gelfiltration (sephadex G-25), probes were diluted in TE buffer (10 mM Tris-HCl, pH 8.0,
1 mM EDTA) to a final concentration of 5 fmol * µl-1.
EMSA DNA-protein binding reactions were carried out for 30 min on ice in a total
volume of 20 µl, containing 30 µg cell extract, 0.1 µg * µl-1 carrier DNA (poly dI-dC),
DNA binding buffer (10 mM Tris-HCl, pH 7.5, 50 mM KCl, 50 mM NaCl, 1 mM MgCl2,
1 mM EDTA, 5 mM DTT), 1 µl 32P-endlabeled DNA probe, 1 µl bromphenol blue (1.5%).
Samples were run on 4% non-denaturating glycerolpolyacrylamide-gel (4% acrylamide,
1% glycerol, 0.33x TBE buffer (89 mM Tris, 89 mM boric acid, 5 mM EDTA)).
Electrophoresis was performed at 150 V, room temperature, 2 h in 0.33x TBE buffer.
Radioactivity was detected and quantified in dried gels with a phosphor storage image
system (FLA-5000; Fuji, Tokyo, Japan) and the AIDA software package (raytest,
Straubenhardt, Germany).
For testing the specificity of the human EPO, the signal was erased by previous 15 min
incubation of the reaction mixture with a 2 500-fold excess of unlabeled probe prior to
addition of the labelled EPO probe (fig. 3.C in publ. III). Moreover, specificity was tested
by super-shift experiments: 1 µl of undiluted polyclonal antibody against HIF-1α (see
above) was added to the EMSA reaction mixture with liver extracts from Z. viviparus. In
the presence of the antibody, the EMSA signal was markedly reduced, indicating that
antibody interaction with the HIF-1α subunit minimised binding of the HIF-1 dimer to the
EPO probe (Fig. 3.B in publ. III). This can be explained by the DNA binding function also

MATERIAL & METHODS
30
being located in the N-terminus of the HIF-1α protein (e.g. Chi & Karliner 2004). To date,
there is no antibody available which recognises the HIF-1α protein in liver samples from
P. brachycephalum, therefore the super-shift assay could not be carried out for the
Antarctic eelpout. However, the specificity of the observed band has been determined in
three fish species in the laboratory of M. Nikinmaa (pers. com.; see also Soitamo et al
2001). Moreover, the migrating distance was the same in P. brachycephalum as in
Z. viviparus, indicating the same molecular size of the HIF-1-EPO enhancer complex in
both zoarcids.
2.5. Studies on isolated hepatocytes
2.5.1. Preparation of hepatocytes according to Mommsen et al. (1994)
Hepatocyte preparation was modified after Mommsen et al. (1994). The liver was rapidly
removed from narcotised (0.5 g MS 222 * L-1 seawater) Z. viviparus, rinsed and perfused
in solution I (5.6 mM glucose, 5 mM KCl, 4 mM NaHCO3, 0.3 mM Na2PO4, 240 mM
NaCl, 0.4 mM KH2PO4, 10 mM HEPES, pH 7.4 = Mg2+-free Hanks medium) to remove
blood. Subsequently, liver perfusion was carried out using 750 U * ml-1 collagenase type
IV (Sigma, Seelze, Germany) in solution II (= solution I + 1% BSA) until complete tissue
digestion. Separated hepatocytes were filtered through 250 µm gauze and centrifuged for
4 min at 60 g, 0°C. The fatty top layer as well as the remaining supernatant were carefully
removed and discarded. The cellular pellet was resuspended in solution II and again
centrifuged for 2 min at 60 g and 0°C. Resuspension and centrifugation was repeated until
a clear, colourless supernatant was observed. The purified cell pellet was resuspended in a
final volume of 2 – 3 ml solution II supplemented with 5 mM glucose, 2 mM MgSO4
(=solution III). After 1 h, cell vitality was controlled by Trypan-blue staining (> 95%)
using a Fuchs-Rosenthal-haemocytometer (0.2 mm). A density of 3 - million cells was
adjusted.
2.5.2. MitoTracker Green FM staining of hepatic mitochondria
MitoTracker Green FM (Molecular Probes, Eugene, USA), passing trough membranes and
accumulating in active mitochondria (Molecular probes; product information) was added to
the hepatocyte suspension (4 - 10 µM final concentration) and incubated for 25 min in the
darkness at room temperature. Afterwards, stained hepatocytes were washed twice by
centrifugation for 2 min at 60 g and 0°C and subsequent resuspension in solution III.
Finally, a density of 6 - million cells per ml was adjusted. 40 µl of this suspension was

MATERIAL & METHODS
31
transferred into a thermostatted microscopy chamber (10°C). A TCS-NT confocal system
with an inverted DM IRBE microscope (Leica, Solms, Germany) equipped with an argon-
krypton laser was used for confocal imaging of mitochondrial density in Z. viviparus
hepatocytes. Cell imaging was carried out with 100x / 1.40 - 0.70 oil immersion lens with
the following properties: excitation wavelength 488 nm, laser power 40 - 60, confocal
pinhole 0.7, emission filter 580 nm, photomultiplier voltage 600 - 800, offset -3. Cells
were scanned in glow mode with slow scan speed and an accumulation of 8 scans per
picture. A slice of 18 - 30 µm, depending on cell size was scanned in 2 µm sections in z-
direction to image mitochondria density throughout the cells. A total of 227 hepatocytes
obtained from 6 liver preparations were recorded.
2.5.3. Visualisation of ROS production by fish hepatocytes using the fluorescent dye
H2DCFDA
The fluorescent dye H2DCFDA (dichlorodihydrofluorescein diacetate) was used to detect
cellular ROS production.
40 µl hepatocytes were placed in the thermostatted (10°C) chamber. Pre-incubation of
cells with H2DCFDA (D-399; Molecular probes, Eugene, USA), as proposed by the
manufacturer proved inconvenient, because fluorescence of hepatocytes had already passed
its maximum after a few minutes. Thus, no further increase in fluorescence intensity could
be observed upon confocal microscopy. In some samples actually a decrease of
fluorescence intensity occurred, probably due to resuspension of the fluorescent dye in the
medium (data not shown). Consequently, imaging of fluorescence by confocal microscopy
was carried out immediately after adding 50 µM H2DCFDA to the cells and followed over
an entire period of 40 min by using the same Leica TCS-NT confocal system as described
above. Images with the size 100 µm² were recorded every 2 min. Properties were
100x / 1.40 - 0.70 oil immersion lens, excitation wavelength 488 nm, laser power 29
(without POBN) or 39 (with POBN), confocal pinhole 0.7, emission filter 505 nm,
photomultiplier voltage 721, offset -8, glow-over mode, slow scan speed, accumulation of
4 scans per picture.
To test the ROS-specificity of fluorescent signals, the radical quencher POBN (Janzen
1971) was added together with H2DCFDA to the hepatocyte suspension.

MATERIAL & METHODS
32
2.6. Statistics
All values are given as means ± standard deviation. Differences between experimental
groups were analysed by student’s t-test using Statview 5.0. Significances were evaluated
based on the p-level < 0.05.

PUBLICATIONS
33
3. Publications
List of publications and declaration of my contribution towards them.
Publication I
Katja Heise, Maria Susana Estevez, Susana Puntarulo, Monica Galleano, Mikko Nikinmaa,
Hans O. Pörtner, Doris Abele
Changes in oxidative stress parameters and activation of hypoxia inducible factor
(HIF-1) at different environmental temperatures in polar and temperate zoarcid fish
Physiological and Biochemical Zoology, submitted
I developed the concept together with the six and seventh author. I carried out the practical
work at the Alfred-Wegener Institute in Bremerhaven, Germany, at the University of
Buenos Aires in Argentina and at the University of Turku in Finland. The practical work in
Buenos Aires was supported by the second and the fourth author. Data were analysed by
myself and discussed with the third, the fifth, the six and the seventh author. I wrote the
first draft of the manuscript, which was revised together with all co-authors.
Publication II
Katja Heise, Magnus Lucassen, Doris Abele
The hypoxia inducible factor (HIF-1α) in cold-adapted Antarctic fishes
Biochimica et Biophysica Acta – Gene structure and expression, submitted
The scientific idea of this study was developed by the second and the third author and
myself. The laboratory work was carried out by myself. I analysed and discussed the data
together with the second author and wrote the first manuscript, which was improved in
cooperation with both co-authors.
PUBLICATIONS
34
Publication III
Katja Heise, Susana Puntarulo, Mikko Nikinmaa, Magnus Lucassen, Hans O. Pörtner,
Doris Abele
Oxidative stress and HIF-1 DNA binding during stressful temperatures and recovery
in the North Sea eelpout (Zoarces viviparus)
Part A: cold stress
Journal of Experimental Biology, submitted
I planned the concept of this study together with the fifth and the sixth author. I carried out
the experimental work at the Biologische Anstalt Helgoland and the laboratory and data
analysis at the Alfred-Wegener Institute in Bremerhaven, Germany, at the University of
Buenos Aires in Argentina and at the University of Turku in Finland. The practical work at
the Alfred-Wegener Institute was supported by the second author. The first manuscript was
written by myself and revised together with all co-authors.
Publication IV
Katja Heise, Susana Puntarulo, Mikko Nikinmaa, Doris Abele, Hans O. Pörtner
Oxidative stress and HIF-1 DNA binding during stressful temperatures and recovery
in the North Sea eelpout (Zoarces viviparus)
Part B: heat stress
Journal of Experimental Biology, submitted
The ideas for the experiments were elaborated by the fourth and the fifth author and
myself. The practical work and data analysis were conducted by myself at Biologische
Anstalt Helgoland, at the Alfred-Wegener Institute in Bremerhaven, Germany, at the
University of Buenos Aires in Argentina and at the University of Turku in Finland. The
data and my first manuscript draft were discussed together with all co-authors.
PUBLICATION I
35
Publication I:
PHYSIOLOGICAL AND BIOCHEMICAL ZOOLOGY
Changes in oxidative stress parameters and activation of hypoxia inducible
factor (HIF-1) at different environmental temperatures
in polar and temperate zoarcid fish
K. Heise1, M. S. Estevez2, S. Puntarulo2, M. Galleano2, M. Nikinmaa3, H.O. Pörtner1, and
D. Abele1
Author affiliations: 1 Alfred-Wegener Institute for Polar and Marine Research, Marine Animal Physiology, Am
Handelshafen 12, 27570 Bremerhaven, Germany, 2 Physical Chemistry-PRALIB, School of Pharmacy and Biochemistry University of
Buenos Aires, Junin 956, C 1113 AAD Buenos Aires, Argentina 3 Animal Physiology, Department of Biology, University of Turku, 20014 Turku, Finland.
Corresponding author:
Doris Abele
Alfred-Wegener Institute for Polar and Marine Research
Marine Animal Physiology
Am Handelshafen 12
27570 Bremerhaven
Germany
Ph: ++49 471 4831 1567, Fax: ++49 471 4831 1149
Email: [email protected]

PUBLICATION I
36
Abstract
The rate of reactive oxygen species (ROS) formation in marine ectotherms is modified by
changing environmental temperatures. We investigated oxidative stress parameters in polar
and temperate zoarcid fish at the border of their thermal optimum range, in order to study a
possible interference of elevated ROS production with metabolic reorganisation. As
exposure to high and low temperature extremes has been shown to cause a state of
metabolic hypoxia in marine ectotherms, onset of hypoxic signalling was studied as DNA
binding activity of the hypoxia inducible factor (HIF-1) in the liver. The Antarctic eelpout
Pachycara brachycephalum was maintained at 0 (controls) and acclimated to 5°C. North
Sea eelpouts, Zoarces viviparus, were maintained at 12°C in summer and at 6°C in winter.
Compared at the lower water temperatures (0°C for the polar and 6°C for the temperate
eelpout) the polar fish showed lower levels of oxidative stress parameters, but higher
susceptibility to liver microsomal lipid radical formation. Moreover, glutathione content
was significantly higher in the polar eelpout and oxidised (GSSG) to over 50%. Oxidative
damage parameters indicating elevated ROS production were higher in the warm in polar
(TBARS) and in the cold in temperate fish (protein carbonyls and TBARS). This higher
ROS levels went along with higher DNA binding activity of HIF-1. The hypothetical role
of this response in the optimisation of tissue oxygenation at the borders of the thermal
optimum range is discussed.
Keywords:
Oxidative stress, lipid peroxidation, hypoxia inducible factor, glutathione, polar fish

PUBLICATION I
37
Introduction
Eurythermal marine fish can adjust their metabolic performance to seasonal fluctuations of
the environmental temperature and are, moreover, tolerant of periodic and non-periodic
short term temperature fluctuations. The physiological mechanisms that allow for seasonal
adaptation include functional adjustments of the number of mitochondria, enzyme
activities and membrane composition to improve resistance to short term fluctuations of
summer and winter temperature extremes (Guderley & St-Pierre 2002). Seasonal cold
acclimatisation was also found to cause a cold-induced increase in muscle capillary density
(Johnston 1982; Egginton & Sidell 1989). According to a recent concept of thermal
adaptation, a mismatch between oxygen demand and the capacity of oxygen uptake and
distribution by ventilation and circulation sets the limits of thermal tolerance in aquatic
ectotherms when exposed to warm and cold temperature extremes (Pörtner 2002). This
means that onset of thermal stress initially leads to loss of aerobic scope and a state of
metabolic hypoxia in central organs. At more extreme temperatures accumulation of
anaerobic metabolites marks the critical temperature limit as seen in several invertebrates
and marine fish (Pörtner 2001; 2002). Our hypothesis is, therefore, that the capacity of a
metabolic reorganisation during hypoxic events may signify tolerance also of (subcritical)
temperature fluctuations in marine ectotherms.
Oxidative stress parameters are frequently measured as stress indicators, because various
forms of physiological stress propagate reactive oxygen species (ROS) formation from
mitochondria and cytosolic ROS generating oxido-reductase enzymes. Alternatively,
insufficient enzymatic antioxidant protection can be the reason for radical mediated
damage. In many eurythermal ectotherms, low winter temperatures cause metabolic slow
down, and low antioxidant enzyme activities speak for an increased susceptibility of winter
animals to oxidative stress (Abele et al. 1998; Buchner et al. 2001; Keller et al. 2004). In
general, elevated antioxidant functions are thought to confer higher stress resistance in an
organism.
The hypoxia inducible factor (HIF-1) is known to enable hypoxic survival in mammalian
tissues and to be functionally controlled by po2 sensitive prolyl hydroxylases (Ivan et al.
2001). Stabilisation of the HIF-1α subunit enables nuclear translocation and formation of
the HIF-1 heterodimer, necessary for the expression of target genes, involved in the tissue
specific and the organismal hypoxia response. This implies improved oxygen binding and
blood supply to the tissues and enhanced anaerobic capacity (Pugh 2003). All in all, this

PUBLICATION I
38
system coordinates survival during transient episodes of hypoxia, also characteristic of
different environmental stress situations experienced by marine animals (temperature and
po2 fluctuations, H2S exposure, oxygen shortage during fight and flight response). Among
mammalian target genes activated by HIF-1 are the genes for erythropoietin (EPO), the
vascular endothelial growth factor (VEGF), nitric oxide synthase and around 11 glycolytic
enzymes (Semenza 2002). Transient hypoxia may occur rapidly in ectotherms, because
these animals adjust arterial po2 to a minimum required level in accordance with lifestyle
requirements (Massabuau 2003). Exhaustive exercise, sudden temperature or salinity stress
that require regulatory efforts or exposure to hydrogen sulphide or xenobiotics may then
lead to fluctuations of steady state po2, causing transient tissue hypoxia. Moreover, the
other extreme: hyperoxia can occur in intertidal pools (Abele-Oeschger et al. 1998).
Fluctuations between oxygen deficiency and reoxygenation or oxygen overload of a tissue
are thought to be accompanied by elevated ROS production causing oxidative stress when
unbalanced by antioxidants. As several steps of the oxygen sensitive signalling cascade
(stabilisation of HIF-1α, DNA binding activity of HIF-1) are also redox controlled
(Haddad et al. 2000; Nikinmaa et al. 2004) and, thus, functionally modulated by ROS,
elevated production of ROS may interfere with hypoxic signalling and in so doing may
prevent a tissue specific regulatory response (Czubryt et al. 1996; Nikinmaa 2002). This is
one reason, why cellular ROS levels are buffered by ROS quenching antioxidants like
vitamins E and C, and by the cellular glutathione (GSH) system. Metal exposure and
several xenobiotics have been shown to alter the GSH status in fish (Maracine & Segner
1998; Pena et al. 2000; Sayeed et al. 2003), but data on seasonal and regional differences
of the glutathione status in marine fish are missing. However, it is known that polar fish
carry high levels of the lipid-soluble radical scavenging α-tocopherol (Gieseg et al. 2000),
which is thought to be the most active compound of vitamin E (Dunlap et al. 2002).
In the present study we compare two eelpout species from Antarctic (Pachycara
brachycephalum) and temperate North Sea (Zoarces viviparus) environments with respect
to cellular oxidative stress parameters including α-tocopherol levels and glutathione redox
rate, antioxidant enzyme activities and ROS damage parameters, as well as induction of
metabolic reorganisation in response to the onset of functional hypoxia at the borders of
their thermal envelope. Both fishes belong to the family of zoarcids, have a similar
behaviour (mainly inactive, carnivorous sit-and-wait predators, Van Dijk et al. 1999).
Temperature exposure was kept subcritical because the objective was to study the potential
for metabolic regulation to compensate for changing environmental temperatures when

PUBLICATION I
39
approaching the critical limit. In the North Sea species acclimatisation to natural seasonal
temperatures was studied at 12°C in summer and 6°C in winter. By contrast, a warming
experiment was carried out with the polar species (preference temperature of 1-2°C,
E. Brodte, pers. com.), to investigate its regulatory flexibility although it does not
experience seasonal temperature fluctuations in nature. Therefore, P. brachycephalum
were acclimated to their upper tolerance temperature (5°C) close to the border to thermal
stress (7°C; Mark et al. 2002).
Interspecies comparison was done at both respective low water temperatures, which are
natural for both animals: the polar fish at 0°C and winter acclimatised North Sea eelpout at
6°C, thus, presenting the comparison of cold adaptation vs. cold acclimatisation.
Material & Methods
Animal collection and experimental conditions
Antarctic eelpout (Pachycara brachycephalum) were caught with bottom traps near King
George Island (Maxwell Bay) at 400 m depth during Antarctic expedition with RV
Polarstern (ANT XIX/5) in April 2002. At the Alfred-Wegener Institute, a total of 30
animals were kept at 0°C in natural sea water from the North Sea with constant aeration
and a day-night cycle of 12 h until the beginning of the acclimation experiment in
December 2002. A batch of 15 polar eelpout was acclimated at 5°C over an entire period
of 11 weeks. Fish were fed live mud shrimp once a week.
After 11 weeks fish were narcotised with 0.5 g MS222 l-1 seawater, weighed and killed
by a cut through the spine. Tissue samples of the liver were quickly taken and aliquots of
100 mg frozen in liquid nitrogen. Samples were stored at –80°C. After sampling, sex and
length of the eelpout were determined. Length varied between 18 and 34 cm.
14 temperate eelpout, Zoarces viviparus, were caught near the island of Helgoland in the
German North Sea in December 2002 and were thus treated as winter animals. Lowest
habitat water temperatures in winter 2002/03 were about 3°C (sea surface temperature
taken from MURSYS, Bundesamt für Seeschiffahrt und Hydrografie). Fish were fed
pellets of white fish (Merlangius merlangus) once a week and kept in an aquarium with a
flow through system of natural filtered sea water, which had the same temperature as the
outside water in the natural habitat. In February, tissue samples of the fish were taken as
described above, when water temperature was 6°C. For comparison to summer

PUBLICATION I
40
acclimatisation, samples were taken from another batch of 16 eelpout caught in May and
June 2002 and maintained at constant 12°C for one month.
All parameters were determined in liver tissue, as the liver is very sensitive to
temperature stress (Van Dijk et al. 1999). The determination of the carbonyl-content,
chemiluminescence, α-tocopherol, iron content as well as the EPR measurements, were
carried out in the department of Physical Chemistry at the School of Pharmacy and
Biochemistry of the University of Buenos Aires, Argentina. Samples were maintained
frozen on dry ice during transport.
TBARS (thiobarbituric reactive substances)
were determined as a marker of lipid peroxidation, indicating oxidative damage in the lipid
fraction according to Uchiyama & Mihara (1978).
Tert-butyl hydroperoxide-initiated chemiluminescence according to Gonzalez Flecha et al.
(1991)
Chemiluminescence indicates an imbalance between pro- and antioxidant processes
resulting from depletion of antioxidant compounds like glutathione, vitamin E and vitamin
C. Tissue samples were homogenised in 30 mM KPi buffer (pH 7.4) containing 120 mM
KCl and centrifuged at 600 g for 10 min. The supernatants were diluted in buffer,
containing a final concentration of 3 mM tert-butyl hydroperoxide and assayed in the dark
at room temperature for chemiluminescence (counts per minute) in a liquid scintillation
counter in the out-of-coincidence mode, using potassium glass vials kept in the dark for at
least 48 h to avoid vial phosphorescence activation by fluorescent light. Data were
expressed in a tissue characteristic curve with y = chemiluminescence and x = time and the
area under this curve integrated for a time period of 4000 sec (= 66.67 min) using MatLab
program and related to the protein content of the sample.
Determination of carbonyl groups according to Levine et al. (1990)
Carbonyl groups were measured as indication for oxidative damage to proteins. Samples
were homogenised in 50 mM HEPES buffer containing 125 mM KCl and protease
inhibitors (0.5 mg * ml-1 leupeptine, 0.7 µg * ml-1 pepstatine, 40 µg * ml-1
phenylmethylsulfonyl fluoride, 0.5 µg * ml-1 aprotinin, 1.1 mM EDTA, 0.6 mM MgSO4)
and centrifuged at 100 000 g for 15 min. Supernatants were incubated at room temperature
for 1 h with 10 mM 2,4-dinitrophenylhydrazine (DNTP) in 2 M HCl. Blanks were run

PUBLICATION I
41
without DNTP. Afterwards, proteins were precipitated with TCA and centrifuged for
10 min at 10000 g. The protein pellet was washed 3 times with ethanol : ethylacetate (1:1),
resuspended in 6 M guanidine hydrochloride in 20 mM potassium phosphate (pH = 2.3)
and incubated at 37°C until complete resuspension. The carbonyl content could be
measured spectrophotometrically at 360 nm (molar extinction coefficient ε =
22 000 M-1 cm-1). The protein content of the samples was determined by the Bradford
(1976) method using bovine serum albumin as standard.
Determination of (nitrite and nitrate)
The total content of nitrite and nitrate (Σ NO2+ NO3) was measured as indicator for NO
production by the Griess colorimetric assay as described in Misko et al. (1993) and Verdon
et al. (1995).
Determination of reduced (GSH) and oxidised (GSSG) glutathione according to Fariss &
Reed (1987).
The glutathione status represents the most important determinant for the cellular redox
environment (Schafer & Buettner 2001). Frozen tissue was ground in liquid nitrogen and
the resulting powder homogenised in 1/10 (w/v) pre-cooled PCA (10% containing 2 mM
bathophenantroline-disulphonic acid). After centrifugation at 15 000 g for 5 min at 4°C,
500 µl of the supernatant were mixed with 10 µl pH-indicator (1 mM m-cresol purple
sodium salt containing 0.5 M iodoacetic acid (IAA)) and 50 µl 1 mM γ-glutamyl-glutamate
(in 0.3% PCA) was added as internal standard. The pH was adjusted to 8.5 with 5 M KOH
(containing 0.3 M N-morpholine-propanesulfonic acid). The mixture was incubated at
room temperature for 45 min, to allow IAA to bind to GSH. Subsequently samples were
centrifuged for 5 min at 15 000 g at 4°C. 300 µl of the supernatant were added to the
double amount of 1% 1-fluor-2,4-dinitrobenzene (diluted in 100% ethanol, HPLC grade)
and derivatised in dark vials at room temperature over 24 h. After centrifugation at 7 500 g
for 1 min at 4°C and filtration through 0.2 µm nylon membrane filters, samples were stored
in dark HPLC vials at –20°C.
HPLC determination was carried out on a Beckmann Coulter HPLC System using a
NH2-spherisorp column, 5 µm 240 x 4 mm (Waters, Germany). Solvent A: 80% methanol
and solvent B: sodium acetate stock in 80% methanol (20:80). Sodium acetate stock was
prepared by dissolving 500 g Na-acetate in 224 ml Milli-Q water and 695 ml of
concentrated HPLC-grade acetic acid. The gradient programme was as follows: 10 min

PUBLICATION I
42
hold at 90% A followed by a 25 min linear gradient to 25% A at a flow rate of
1 ml * min-1, and 2.3 to 2.8 psi backpressure. Peaks were recorded with a photodiode array
detector at 365 nm. Concentrations were calculated using 5-point calibration curves for
GSH and GSSG standards processed in the same manner as described for the samples.
As GSSG is formed by oxidation of 2 molecules GSH, total glutathione content was
calculated as the sum (2 GSSG + GSH). Accordingly, the redox ratio of oxidised to
reduced glutathione was expressed as 2 GSSG / GSH.
The redox potential was calculated with the Nernst equation, as given by Schafer &
Buettner (2001), for the different temperatures of maintenance, also considering the
temperature induced changes of intracellular pH (pHi) in fish liver (data taken from Larsen
et al. 1997 and Sartoris et al. 2003).
Detection of α-tocopherol according to Desai (1984)
α-tocopherol represents the most active compound of the lipid-soluble non-enzymatic
antioxidant vitamin E (Dunlap et al. 2002). Tissue samples were homogenised with sodium
dodecylsulfate (SDS). To 300 µl homogenate, or 100 µl of microsome suspension, 1 ml of
ethanol was added and vortexed for 1 min. Then, 4 ml of hexane were added and the
mixture vortexed again for 1 min. After 10 min centrifugation at 600 g, the lipid phase was
dried with nitrogen, resuspended in methanol:ethanol (1:1) and filtered through nylon
membranes, 0.22 µm. Hereafter, samples were analysed by reverse phase high
performance liquid chromatography (HPLC) and electrochemical detection with an
oxidation potential of 0.6 V and a flow rate of 1 ml * min-1. The isocratic system consisted
of a column (Supelcosil LC-8, 3 µm 15 cm x 4.6 mm, Supelco 58983) and a solvent
containing 20 mM LiClO4 in 99% methanol.
Determination of the intracellular “free” iron by EPR
Iron contents were measured as possible catalysts for Fenton reactions leading to enhanced
formation of OH. and subsequent lipid radical formation (Halliwell & Gutteridge 1985).
Tissue samples frozen in liquid nitrogen and pooled from two animals were weighed
without thawing and ground to powder in a porcelain mortar. The powder obtained was
mixed at ratio 1:2 (w:v) with 10 mM Tris/HCl buffer, pH 7.4, containing deferoxamine
mesylate (final concentration 2 mM). After 5 minutes incubation, samples were transferred
to cylindrical plastic tubes and frozen in liquid nitrogen (Yegorov et al. 1993;
Woodmansee & Imlay 2002). EPR measurements were carried out at 77K; microwave

PUBLICATION I
43
power, 10 mW; time constant, 82 ms; modulation amplitude, 5 G; centerfield 1600 G;
sweep width, 800 G (Linares et al. 2003). A standard curve was generated using solutions
of Fe2(SO4)3x7H2O in 200 µM HCl quantified spectrophotometrically (ε420 =
2.865 mM-1 * cm-1 for the Fe3+:desferal complex). All chemicals were prepared in iron free
water, obtained from Milli-Q treated with chelex 100.
Determination of the total iron content in tissues after Brumby & Massey (1967) and
Lawrie et al. (1991)
Homogenates were heated at 50 - 60°C for at least 48 h until complete dryness. Afterwards
samples were mineralised in HNO3:HClO4 (1:1) and heated to dryness. The remaining
inorganic residues were diluted in 4 ml 5% HCl. After addition of 10% thioglycolic acid to
convert Fe(III) to Fe(II), the concentration of Fe(II) was measured spectrophotometrically
after reaction with 4 mM bathophenanthroline at 535 nm.
Measurement of iron reduction according Vegh et al. (1988)
Samples were homogenised in 100 mM KPi buffer pH 7.4 in 500 µl final volume. To
separate cell debris and lipids, homogenates were centrifuged for 8 min at 10000g. The
supernatant was mixed with 100 mM Tris/HCl buffer pH 7.4 and the iron reduction rate
recorded spectrophotometrically at 520 nm, ε = 13.6 mM-1 * cm-1, after adding 50 µM
Fe-EDTA, 11 mM α-α’-bipyridyl and 500 µM NADPH. Assays were carried out at room
temperature.
Extraction of liver microsomes according to Klein et al. (1983)
A minimum of 0.6 g of liver tissue was needed for microsome extraction. Sample aliquots
were pooled from 2 - 3 fish and homogenised in 9 ml of 100 mM KPi buffer at pH 7.4.
After centrifugation at 1 000 g for 10 min and 4°C to remove cell debris, the supernatant
was again centrifuged for 1 h at 10 0000 g and 4°C to precipitate the microsomal fraction.
The resulting microsomal pellet was resuspended in 1.5 ml of 125 mM KCl, frozen in
liquid nitrogen and stored at –20°C.
EPR- spin trapping of lipid radicals after Buettner (1987) in liver microsomes
Lipid radicals reflect the sensitivity of lipid membranes to ROS attack. Of each microsome
solution 1 ml was used. To initiate the lipid radical production the following reactants were
added: 5.5 mM ADP, 1 mM NADPH, 0.1 mM Fe(NH4)(SO4)2x12H2O (in 0.1 N HCl). For

PUBLICATION I
44
later detection of the lipid radicals 100 mM of the spin trap α-(4-pyridyl 1-oxide)-N-t-butyl
nitrone (POBN) was added. After aggregation samples were frozen again in liquid
nitrogen. Immediately before detection samples were thawed and lipid radical generation
measured at room temperature using a Bruker spectrometer ECS 106, operating at 9.81
GHz with 50 kHz modulation frequency. After 30 min at room temperature lipid radical
production of each sample was detected again to see the increase over time. EPR
instrument settings were microwave power, 20 mW; modulation amplitude, 1.194 G; time
constant, 81.92 ms; receiver gain, 2x10⁴. Quantification was done using 4-OH TEMPO
standard.
Superoxide dismutase activity (SOD E.C: 1.15.1.1), being the prime antioxidant enzyme,
was determined according to Livingstone et al. (1992) using a xanthine
oxidase/cytochrome c assay at 20°C as well as at the respective water temperature of each
experimental group. 1 Unit SOD reduces the increase in extinction of superoxide-mediated
reduction of oxidised cytochrome c by 50% (measured at 550 nm).
Glutathione peroxidase activity (GPX) was determined as further antioxidant enzyme by a
coupled optical test after Günzler & Flohe (1985). Tissues were homogenised in 20 mM
Tris/HCl buffer, pH 7.6, containing 1 mM EDTA and 1 mM DTT (1,4-dithiothreitol,
w:v/1:3). The assay system consisted of 100 mM KPi, 1 mM EDTA reaction buffer at
pH 7.0, 10 mM sodium azide for inhibition of catalase, 10 U * ml-1 glutathione-reductase
and 10 mM GSH. This mixture was incubated with 10 - 100 µl of sample for 10 min at
37°C to reactivate GPX. After addition of 1.5 mM NADPH (in 0.1% NaHCO3), hydroxide-
independent NADPH consumption was determined at 340 nm. After 3 min, 1.5 mM H2O2
was added and the reaction recorded over 5 min. Reagent blanks were run by replacing
sample with reaction buffer to control chemical oxidation.
Protein content after Bradford (1976)
The protein content of the samples was determined by the Bradford method using bovine
serum albumin as standard.
Determination of the DNA-binding activity of the hypoxia inducible factor (HIF-1)
The DNA binding activity of HIF-1 was determined as indicator for hypoxic signalling.
Measurements were carried out at the Department of Biology, University of Turku,

PUBLICATION I
45
Finland. Samples were transported frozen in liquid nitrogen. Nuclear extraction protocols
developed for rainbow trout (Soitamo et al. 2001), were not applicable to small tissue
samples. Thus, EMSA and Western blotting were carried out with whole cell extracts,
prepared as described in Vuori et al. (2004).
50 mg of liver tissues were homogenised in 200 µl buffer C (25% glycerol, 0.42 M NaCl,
1.5 mM MgCl2, 0.2 mM EDTA, 20 mM Hepes, 0.5 mM PMSF, 0.5 mM DTT, 2 µg * ml-1
leupeptine, 2 µg * ml-1 antipaine, 2 µg * ml-1 pepstatine, 2 µg * ml-1 aprotinin, 1 mM
Na3VO4) and centrifuged at 16 100 g, 30 min, 4°C. The supernatant was transferred to a
new tube and the protein content determined by the Bio-Rad assay in a microplate reader.
For Western blotting (20 µg protein of whole cell extracts per well) polyclonal antibodies
directed against the N-terminus of rainbow trout HIF-1α were used (Soitamo et al. 2001).
The antibody recognised HIF-1α in Z. viviparus, but not in P. brachycephalum.
Following the fish protocol of Soitamo et al. (2001), we used the promoter region of the
human erythropoietin (EPO) gene as HIF-sensitive DNA probe
(5`-GCCCTACGTGCTGTCTCA-3`). 5´ - endlabeling of the sense strand
(2 pmol * µl-1 DNA) was done with 10 U * µl-1 T4 polynucleotide kinase and 32P-γ-dATP
(10 % v/v) over 15 min at 37°C. After removing unincorporated nucleotides by purifying
through a sephadex G-25 column, probes were annealed with 2 pmol * µl-1 antisense
strand, 5 mM MgCl2 and TE buffer (10 mM Tris/HCl, 1 mM EDTA, pH 8.0).
EMSA DNA-protein binding reactions were carried out for 30 min on ice in a total
volume of 20 µl, containing 10 µg cell extract, 0.1 µg * µl-1 carrier DNA (poly dI-dC),
DNA binding buffer (10 mM Tris/HCl, pH 7.5), 50 mM KCl, 50 mM NaCl, 1 mM MgCl2,
1 mM EDTA, 5 mM DTT, 5% glycerol), 1 µl 32P-endlabeled DNA probe, 1 µl bromphenol
blue (1.5%). Samples were run on 4% non-denaturating glycerolpolyacrylamide-gel (4%
acrylamide, 1% glycerol, TBE buffer). Electrophoresis was performed at 150 V, room
temperature, 2 h in TBE buffer (89 mM Tris, 89 mM boric acid, 5 mM EDTA). Dried gels
were autoradiographed (Kvietikova et al. 1995). Calculation of the % intensity was based
on densitometry of gel images, with the sum of all 4 bands taken as 100% value.
For testing the specificity of the human EPO enhancer by supershift experiments, 1 µl of
polyclonal antibody (against the N-terminus of rainbow trout HIF-1α, see above) was
added to the EMSA reaction mixture with liver extracts from Z. viviparus. In the presence
of the antibody, the EMSA signal was markedly reduced, indicating that antibody
interaction with the HIF-1α subunit minimised binding of the HIF-1 dimer to the EPO
probe (Fig. 2.D). This is explained by the DNA binding function also being located in the

PUBLICATION I
46
N-terminus of the HIF-1α protein (e.g. Chi & Karliner 2004). To date, there is no antibody
available which recognises the HIF-1α protein in liver samples from P. brachycephalum,
therefore the supershift assay could not be carried out for the Antarctic eelpout. The
specificity of the observed band has been determined in three fish species in the laboratory
of M. Nikinmaa (see also Soitamo et al 2001). Further, the signal of the complex band
appeared at the same location as found in North Sea eelpout, indicating the band to have
the molecular size of the HIF-1-EPO enhancer complex.
Statistics
All values are given as means ± standard deviation. Differences between experimental
groups were analysed by student’s t-test using Statview 5.0. Significances were evaluated
based on the p-level < 0.05.
Results & Discussion
We investigated the response of oxidative stress parameters in the two zoarcid fish species
to the warm and cold exposure at the borders of their optimum temperature range.
Although water temperatures in Antarctica never reach 5°C, even a ten months acclimation
at this temperature did not lead to reduced growth, nor any differences in physiological
condition factors in 5°C acclimated Pachycara brachycephalum as reported by Lannig et
al. (MS submitted). Consequently, we anticipated metabolic regulation to compensate the
temperature change.
Interspecies comparison at low temperature of maintenance
Table 1 depicts measurements of the content of total and of “free” iron in whole tissue
homogenates as well as α-tocopherol content and lipid radical generation in liver
microsomal isolates. Iron was measured as a transition metal catalyst of free radical
formation in liver tissues. The amount of “free” iron, including all iron (Fe(II) and Fe(III)),
not bound to enzymes or iron storage proteins, represents catalytically available iron.
Binding of iron to ferritin and transferrin is one of the most powerful antioxidant
mechanisms in living tissues, as it prevents the iron from acting as Fenton catalyst by
generating highly toxic hydroxyl radicals (·OH) (Halliwell & Gutteridge 1985). The
concentrations of total and of “free” iron were lower in the polar, compared to the

PUBLICATION I
47
temperate fish. However, a greater proportion of iron in polar eelpout liver was “free”
(ratio “free”/total iron 0.59 in P. brachycephalum and 0.22 in Z. viviparus, tab. 1) and thus
available for Fenton kinetics and contributing to lipid radical formation in polar eelpout
microsomes (fig. 1B, C). Like other Antarctic fish, P. brachycephalum is characterised by
low amounts of red blood cells (Mark et al. 2002) and, therefore, may have only a reduced
capacity to control “free” iron via ferritin and transferrin binding.
Iron reduction rate, enzymatic and non-enzymatic conversion of Fe(III) to the more
powerful oxidising agent Fe(II), was similar in liver homogenates from both fishes. A
doubling of iron reduction rate (measured at 20°C) occurred in summer eelpout from the
North Sea, as compared to winter activities (24 ± 6 in summer and 11 ± 5 µmol * g fresh
weight-1 * min-1 in winter; p = 0.04). This difference suggests a more intense and
presumably enzymatic (and therefore thermally increased) iron metabolism in Z. viviparus,
to maintain higher turnover of heme proteins in more active summer animals. Contrary to
Z. viviparus, acclimation of polar eelpout to higher temperatures had no inducing effect on
iron reductase activity (10 ± 4 at 0°C and 12 ± 1 µmol * g fresh weight-1 * min-1 for
P. brachycephalum at 5°C, p = 0.46), speaking for primarily non-enzymatic catalysis.
As lipid radical EPR signals in liver homogenates were abolished by high cytosolic
antioxidant potential, only the microsomal fraction was used in the assay. As individual
liver samples did not yield sufficient sample volume, material had to be pooled from 2 or 3
liver samples. Lipid radicals combined with the spin trap POBN resulted in adducts that
gave a characteristic EPR spectrum with hyperfine coupling constants of aN = 15.8 G and
aN = 2.6 G, in agreement with computer spectral simulated signals obtained using the same
parameters (fig. 1D). Even though these constants could be assigned to lipid radicals, spin
trapping studies cannot readily distinguish between peroxyl (ROO·), alkoxyl (RO·) and
alkyl (R·) adducts, owing to the similarity of the corresponding coupling constants
(Buettner 1987). EPR signals of lipid radical formation were 4-fold higher in the polar
eelpout (fig. 1B, C and tab. 2), indicating elevated susceptibility of polar membrane lipids
to ROS attack, although the content of the lipid soluble antioxidant α-tocopherol was also
2-fold higher in the polar eelpout microsomal fraction compared to the temperate species.
Elevated sensitivity of polar fish membranes to ROS attack has already been documented
by Giardina et al. (1997), Gieseg et al. (2000), Dunlap et al. (2002). This is in agreement
with a higher content of unsaturated fatty acids in polar eelpout (E. Brodte, pers. com),
which are the main targets of oxidative damage in membranes (Slater 1984), but necessary
for homoeoviscous adaptation at low temperatures (Sidell 1998).
PUBLICATION I
48
Table 2 summarizes the rate of chemiluminescence which results from the imbalance
between pro- and antioxidant processes, and the oxidative damage markers TBARS and
protein carbonyls, reflecting the level of ROS production in the liver. Moreover, the total
content of nitrite and nitrate (Σ NO2+ NO3) is given as a measure for NO production. SOD
activities in liver tissues, presented in tab. 2, were measured at 20°C and also at the
respective water temperature for each group. The table also gives the glutathione
peroxidase activity, measured at 20°C, and the α-tocopherol content in liver homogenates.
Comparing both animals at low habitat temperature, the polar P. brachycephalum at 0°C
and winter acclimatised Z. viviparus (6°C), we found less indication for lipid peroxidation
(TBARS, p < 0.01) and chemiluminescence (p = 0.04) in the polar eelpout. SOD activities
per g fresh weight were also lower in P. brachycephalum at standard assay temperature
(20°C, p = 0.02), but similar (p = 0.59) when assayed at the respective water temperature
(6°C for Z. viviparus and 0°C for P. brachycephalum), indicating the same superoxide
scavenging capacity prevailed in both fishes under in situ conditions. In line with this,
Natoli et al. (1990) found that Cu,ZnSOD enzyme properties in Antarctic icefish
(Chaenocephalus aceratus) allow for efficient superoxide scavenging at low water
temperature.
As already shown for isolated microsomes, liver homogenates of the Antarctic eelpout
contained higher α-tocopherol levels compared to the North Sea species (n = 2; no
statistical evaluation). α-tocopherol concentrations were in the same range as reported from
several notothenioid species (30 – 1000 nmol * mg protein-1, Ansaldo et al. 2000).
Interestingly, the polar fish maintained 3-fold higher tissue concentrations of the redox
buffer glutathione (p < 0.01), which was to over 50 % oxidised to GSSG (tab. 3). Although
again, the difference in glutathione redox ratio is not significant between the two species
(p = 0.13), it seems important in the context that liver tissue of the polar eelpout appeared
generally more oxidised. To our knowledge GSSG is usually lower than GSH content (e.g.
Ritola et al. 1999; Pena et al. 2000 for other fish species). Moreover, under oxidative stress
causing GSH oxidation, GSSG is exported to maintain a constant cellular redox
environment (Schafer & Buettner 2001) and avoid adverse side effects of GSSG
accumulation (Klatt & Lamas 2000). The intracellular glutathione concentration is much
higher than the concentration of other thiols, which makes it the most important
determinant of the cellular redox environment (Schafer & Buettner 2001). According to
these authors, not only the glutathione redox ratio, but also the quantity of reduced GSH,
PUBLICATION I
49
which represents the cellular reducing capacity, impacts cellular redox potential because of
the square term in the Nernst equation:
∆E = E°pH – (RT*2.303/nF) log ([GSH]²/[GSSG]) mV (I)
We calculated the redox potential (∆E) for both eelpout species (tab. 3) according to
equation I at in situ temperature of each group taking into account the temperature
dependent changes of intracellular pH (pHi). These have been determined for North Sea
and Antarctic eelpout white muscle by Sartoris et al. (2003). Liver pHi was approximated,
assuming it to range about 0.28 pH units lower than in the white muscle (Larsen et al.
1997). Calculated redox potentials in tab. 3 are in line with the glutathione redox ratio,
indicating a similar redox milieu in both species at low water temperature.
Taken together, our data speak for the need of high antioxidant potential and redox
buffering in polar eelpout and are in line with results from Giardina et al. (1997), who
demonstrated Antarctic fishes to maintain higher levels of antioxidant defences than
Mediterranean species. Similar enzyme activities (SOD and GPX), but higher levels of
glutathione and α-tocopherol (n.s.) in Antarctic vs. North Sea eelpout, illustrate the
importance, especially of the non-enzymatic antioxidant defence for this polar fish. In
agreement with this, Dunlap et al. (2002) detected a marine-derived tocopherol (MDT)
constituent in Antarctic notothenioids and krill, which confer special antioxidant protection
of cellular lipids at low temperatures.
Σ NO2+ NO3 (tab. 1) was about 5-times higher (p < 0.01) in North Sea than in polar
eelpout. This finding provides a first hint that higher NO production rates may occur in
temperate than polar fish, whereas the physiological consequences this may have on
metabolic regulation in fish cells still wait to be investigated.
Response to warmer water temperatures
Acclimation of P. brachycephalum to 5°C and acclimatisation of Z. viviparus to summer
temperatures (12°C) had distinct effects in both fishes. North Sea eelpout caught during
summer had lower SOD (measured at 12 and 20°C), but higher glutathione peroxidase
(GPX) activities (measured at 20°C), than winter animals. Earlier work by Ronisz et al.
(1999) also reported slightly elevated GPX activities in Z. viviparus caught in June or
August vs. February. α-tocopherol levels in summer animals (n = 4) were more than two
times higher as levels in only two winter Z. viviparus individuals (no statistical evaluation),
and chemiluminescence rates (p = 0.42, n = 5), as well as lipid (p = 0.03, n = 4) and protein
(p = 0.04, n = 4) oxidation markers were correspondingly decreased. Moreover, due to

PUBLICATION I
50
significantly lower GSSG concentrations (p < 0.01) at unchanged GSH levels (p = 0.69),
the glutathione redox ratio was lower (p < 0.01) and the Nernst potential (∆E) more
negative (p = 0.02) in summer fish. This indicates more reduced redox milieu at warmer
water temperature in North Sea eelpout liver.
A different picture was found in polar eelpout, acclimated to 5°C. Oxidative damage
parameters increased on warming however, significantly only for TBARS (TBARS
p = 0.03, n = 5; chemiluminescence p = 0.34, n = 5-7, protein carbonyls p = 0.11, n = 4-5).
This again underlines the high ROS damage sensitivity of polar fish fatty acids. Low
molecular antioxidants (α-tocopherol and glutathione-related parameters, tab. 2, 3) were
not significantly different in warm acclimated fish, compared to animals maintained at
0°C. Together with constant SOD and elevated GPX activity (p = 0.03) at 5°C, this
supports the view that 5°C is still not critical for the animals, because they maintain or
even induce antioxidant functions. In contrast, exposure of stenothermal Antarctic
invertebrates to critically high temperatures caused impairment of SOD activity and onset
of oxidative stress (Abele et al. 1998: Nacella concinna; Abele et al. 2001: Yoldia eightsii).
Taken together, higher levels of oxidative damage (tab. 2) and a more oxidised
glutathione redox ratio (tab. 3) are indicative of elevated levels of ROS production in
winter acclimatised North Sea eelpout compared to summer animals. In contrast, warm
acclimation of the polar eelpout had less clear effects on oxidative stress parameters, with
the exception of significantly increased TBARS concentrations again demonstrating
elevated susceptibility of polar fish for lipid peroxidation.
Western blotting with an antibody against the N-terminus of rainbow trout HIF-1α
confirmed the presence of this protein in North Sea eelpout, but did not reveal seasonal
changes in protein amount (fig. 2.A). Therefore, our prime finding is that the HIF-1α
protein is permanently present in unstressed North Sea eelpout. As the antibody did not
recognise P. brachycephalum HIF-1α, protein quantification could not be performed for
the polar eelpout. Although preliminary results of the HIF-1α sequence indicate high
conservation (~98% on the protein level) between the two eelpout species (Heise,
Lucassen, Abele, in prep.), low environmental temperatures may cause different HIF-1α
protein folding (see Fields & Somero 1998) in the Antarctic eelpout, preventing antibody-
HIF-1α interaction in P. brachycephalum. Results from the electromobility shift assay
(EMSA) for DNA binding activity of hypoxia inducible transcription factor (HIF-1) with

PUBLICATION I
51
the human EPO (erythropoietin) enhancer are presented in fig. 2 (fig. 2B: mean values ±
standard deviation, n = 5; fig. 2C: EMSA example).
Higher HIF-1 DNA binding activity was found at the higher temperature in the polar and
at the lower temperature in the North Sea eelpout (fig. 2.B and 2.C) and is interpreted as a
tissue entering a state of beginning oxygen deficiency. Obviously, in eelpout, HIF-1
function is not regulated on the level of protein expression and stabilisation of the α-
subunit, but during later steps of the signalling pathway. Besides the cellular oxygenation
status, cellular redox state can also affect both, the stability and the DNA binding of HIF-1
(Ema et al. 1999, Haddad et al. 2000, Lando et al. 2000 for mammals, Nikinmaa et al. 2004
for rainbow trout). Thus, also ROS formation is likely to be an important HIF-1α
modulating signal (Fandrey 2004).
HIF–1 DNA binding correlates with increased oxidative damage, especially in
Z. viviparus.
Our data set represents a first approach to study HIF-1 DNA-binding in the liver of whole
animal ectotherms, exposed to temperatures at the border of their thermal optimum range,
and directly relate this to tissue oxidation and redox potential in the liver of the living fish.
Thus, our approach reflects a co-ordinated physiological response at the whole animal
level and, importantly, allows tissue oxygenation to change on a natural time scale. This
provides new insight into HIF-1 regulation at above cellular level. Elevated mitochondrial
ROS production, elicited by subcritical warming to temperatures above natural, is
presumably responsible for the accumulation of TBARS in polar eelpout at 5°C (tab. 2).
Likewise, accumulation of oxidative damage markers and enhanced glutathione oxidation
in North Sea eelpout at 6°C (tab. 2, 3) indicate higher ROS levels at decreased cellular
antioxidant capacity (GPX and α-tocopherol).
Induction of HIF-1, going together with an increase of cellular ROS producing activity,
appears like an absolute paradox. Previous models described HIF-1α as controlled by ROS
produced by membrane bound NADPH oxido-reductases (Fandrey et al. 1994). Rapid
progress in the field of cellular oxygen sensing demonstrated that HIF-1α destabilization
involves prolyl hydroxylases controlled by po2 and not by ROS (Jaakkola et al. 2001).
However, until to date, reactive oxygen species involvement in HIF-1 redox regulation is
subject to controversial discussions (Fandrey 2004). A second model sees cellular ROS
production promoted under hypoxic conditions (Chandel & Schumacker 1999; Chandel et
al. 2000; reviewed in Chandel & Schumacker 2000). According to this view, mitochondria
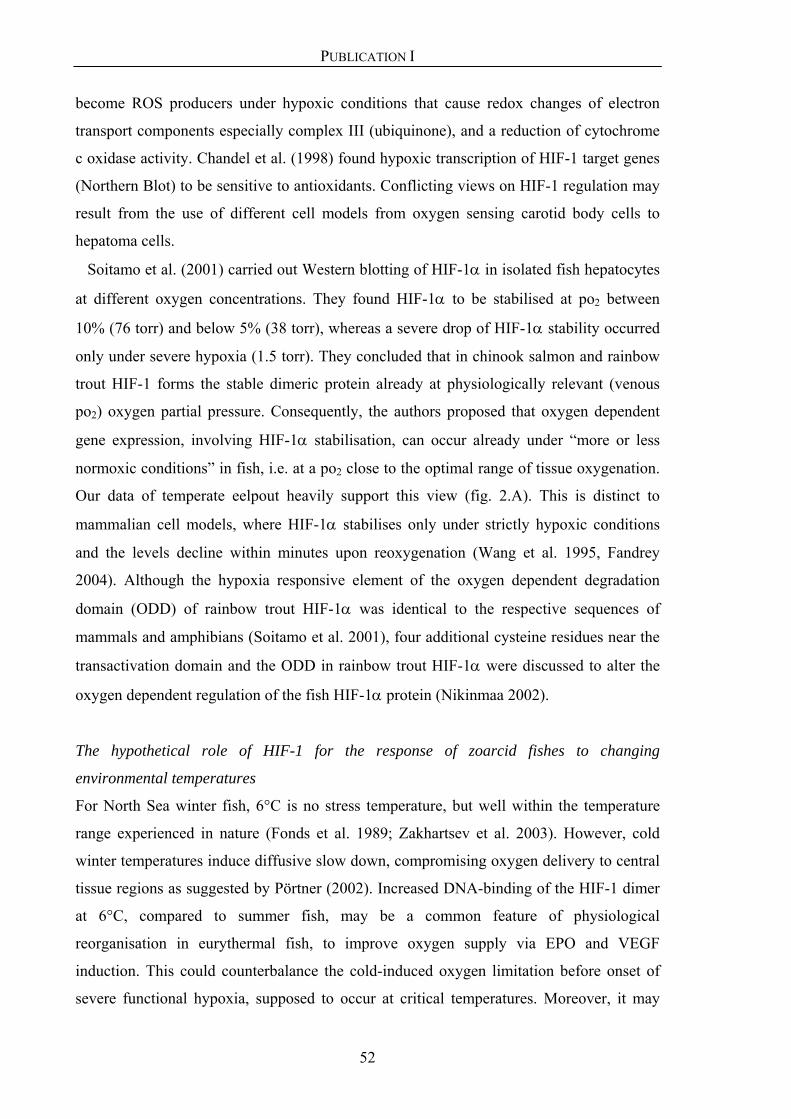
PUBLICATION I
52
become ROS producers under hypoxic conditions that cause redox changes of electron
transport components especially complex III (ubiquinone), and a reduction of cytochrome
c oxidase activity. Chandel et al. (1998) found hypoxic transcription of HIF-1 target genes
(Northern Blot) to be sensitive to antioxidants. Conflicting views on HIF-1 regulation may
result from the use of different cell models from oxygen sensing carotid body cells to
hepatoma cells.
Soitamo et al. (2001) carried out Western blotting of HIF-1α in isolated fish hepatocytes
at different oxygen concentrations. They found HIF-1α to be stabilised at po2 between
10% (76 torr) and below 5% (38 torr), whereas a severe drop of HIF-1α stability occurred
only under severe hypoxia (1.5 torr). They concluded that in chinook salmon and rainbow
trout HIF-1 forms the stable dimeric protein already at physiologically relevant (venous
po2) oxygen partial pressure. Consequently, the authors proposed that oxygen dependent
gene expression, involving HIF-1α stabilisation, can occur already under “more or less
normoxic conditions” in fish, i.e. at a po2 close to the optimal range of tissue oxygenation.
Our data of temperate eelpout heavily support this view (fig. 2.A). This is distinct to
mammalian cell models, where HIF-1α stabilises only under strictly hypoxic conditions
and the levels decline within minutes upon reoxygenation (Wang et al. 1995, Fandrey
2004). Although the hypoxia responsive element of the oxygen dependent degradation
domain (ODD) of rainbow trout HIF-1α was identical to the respective sequences of
mammals and amphibians (Soitamo et al. 2001), four additional cysteine residues near the
transactivation domain and the ODD in rainbow trout HIF-1α were discussed to alter the
oxygen dependent regulation of the fish HIF-1α protein (Nikinmaa 2002).
The hypothetical role of HIF-1 for the response of zoarcid fishes to changing
environmental temperatures
For North Sea winter fish, 6°C is no stress temperature, but well within the temperature
range experienced in nature (Fonds et al. 1989; Zakhartsev et al. 2003). However, cold
winter temperatures induce diffusive slow down, compromising oxygen delivery to central
tissue regions as suggested by Pörtner (2002). Increased DNA-binding of the HIF-1 dimer
at 6°C, compared to summer fish, may be a common feature of physiological
reorganisation in eurythermal fish, to improve oxygen supply via EPO and VEGF
induction. This could counterbalance the cold-induced oxygen limitation before onset of
severe functional hypoxia, supposed to occur at critical temperatures. Moreover, it may

PUBLICATION I
53
prepare the animals to meet metabolic requirements during winter. Seasonal cold
acclimatisation was, in fact, found to cause cold-induced increase in capillary density of
carp muscle (Johnston 1982, Egginton & Sidell 1989), associated with a rise in aerobic
capacity via mitochondrial proliferation in several fish species (Johnston 1982; Egginton &
Sidell 1989; Guderley & St-Pierre 2002 for review). HIF-1 DNA-binding in winter
eelpout, therefore, seems perfectly in line with the observed trends in other fish species, to
improve tissue oxygen delivery in the cold, provided it acts on the same array of target
genes as in mammalian tissues.
Quite another question is what happens on warming of fish as performed here with the
polar P. brachycephalum that also caused HIF-1 to bind to the EPO-enhancer fragment?
Cellular oxygen consumption in ectotherms increases with temperature. In other fish this
causes a decrease in venous oxygen partial pressure, as shown for cod (Lannig et al. 2004).
In the polar eelpout HIF-1 DNA-binding occurred at 5°C, close to the temperature where
blood flow levels off (7°C, Mark et al. 2002), indicating that the high border (pejus levels)
of the optimal temperature range was almost reached. Further increase of oxygen
consumption rates at even higher temperatures will then, especially in the liver, cause an
imbalance between oxygen supply and demand as modelled by Pörtner (2002), i.e.
functional hypoxia. Again HIF-1 likely supports oxygen homeostasis as the fishes
approach critical conditions. In so doing it might represent the first step to initiate
physiological adjustments in the polar species during acclimation at above habitat
temperature. Prolonged acclimation of P. brachycephalum over 10 months at 5°C under
laboratory conditions by Lannig et al. (MS submitted), caused a reduction of mitochondrial
aerobic capacity in the liver thereby economizing mitochondrial respiratory efficiency. As
thermal adjustability is typical for eurythermal ectotherms (Pörtner 2001), Lannig et al.
(MS submitted) concluded, that the Antarctic eelpout is not as typically cold stenothermal
as supposed of a polar animal.
In summary, we assume that changing environmental temperatures cause higher levels of
ROS stress, which may go along with functional hypoxia in both eelpout species, indicated
by onset of hypoxic signalling. This can be observed under natural winter conditions in
North Sea eelpout, while in a related polar eelpout species, a similar response can be
detected under experimental warm acclimation.
Further, Treinin et al. (2003) found increased HIF-1α levels on acclimation of C. elegans
to higher temperatures, which, obviously, conferred resistance to subsequent exposure to
heat stress. These authors developed a concept of “cross-tolerance” in which acclimation to

PUBLICATION I
54
one stress factor (mild warming) confers protection against also other types of stress. Thus
heat exposure may render animals (including mammals) less susceptible to cadmium
exposure (Treinin et al. 2003 for C. elegans) or to ischemia / reperfusion injury (Horowitz
et al. 2004), and HIF-1 seems to be an essential modulator in cross-tolerance requirement.
In the light of these findings, one would hypothesise that functional hypoxia could be a
more common phenomenon, accompanying many more forms of environmental stress,
than we may currently assume. Thus, HIF-1α certainly has a major function in governing
re-regulation under severe hypoxia, but may also be a cross-tolerance factor, induced under
many forms of stress that may lead to a functional hypoxia.
Acknowledgements
The authors would like to thank Maike Schmidt for her assistance in preparing the fish
samples, as well as Tamara Zaobornyj and Laura Valdez for their help adapting the
chemiluminescence assay protocol to fish liver tissue. We further thank Hanna Numminen,
Eeva Rissanen and Kristiina Vuori for their contribution to adjust EMSA and Western blot
methodology to eelpout samples. This study was supported by grants from Deutscher
Akademischer Austauschdienst (DAAD) to KH.
Literature Cited
Abele D., B. Burlando, A. Viarengo and H.-O. Pörtner. 1998. Exposure of elevated
temperatures and hydrogen peroxide elicits oxidative stress and antioxidant response in the
Antarctic intertidal limpet Nacella concinna. Comparative Biochemistry and Physiology
120B:425-435.
Abele D., C. Tesch, P. Wencke and H.O. Pörtner. 2001. How does oxidative stress relate to
thermal tolerance in the Antarctic bivalve Yoldia eightsii. Antarctic Science 13 (2):111-
118.
Abele-Oeschger D., H. Großpietsch and H.O. Pörtner. 1998. Temporal fluctuations and
spatial gradients of environmental PO2, H2O2 and temperature in its intertidal habitat

PUBLICATION I
55
trigger antioxidant protection in the capitellide worm Heteromastus filiformis. Marine
Ecology Progress Series 173:179-191.
Acker H. 1994. Mechanisms and meaning of cellular oxygen sensing in the organism.
Respiration Physiology 95:1-10.
Ansaldo M., C.M. Luquet, P.A. Evelson, J.M. Polo and S. Llesuy. 2000. Antioxidant levels
from different Antarctic fish caught around South Georgia Island and Shag Rocks. Polar
Biology 23:160-165.
Buettner G.R. 1987. Spin trapping: ESP parameters of spin adducts. Free Radical Biology
and Medicine 3:259-303.
Bradford M.M. 1976. A rapid and sensitive method for the quantification of microgram
quantities of protein utilizing the principle of protein-dye binding. Analytical Biochemistry
71:248-254.
Brumby P.E. and V. Massey. 1967. Determination of nonhuman iron, total iron and
copper. Methods in Enzymology 10:464-472.
Buchner T., D. Abele and H.O. Pörtner. 2001. Oxyconformity in the intertidal worm
Sipunculus nudus: The mitochondrial background and energetic consequences.
Comparative Biochemistry and Physiology 129B:109-120.
Chandel N.S., E. Maltepe, E. Goldwasser, C.E. Mathieu, M.C. Somin, M.C. and
Schumacker, P.T. 1998. Mitochondrial reactive oxygen species trigger hypoxia-induced
transcription. Proceedings of the National Academy of Sciences of the United States of
America 95:11715-11720.
Chandel N.S., D.S. McClintock, C.E. Feliciano, T.M. Wood, J.A. Melendez, A.M.
Rodriguez and P.T. Schumacker. 2000. Reactive oxygen species generated at
mitochondrial complex III stabilize hypoxia-inducible factor-α during hypoxia. Journal of
Biological Chemistry 275 (33):25130-25138.

PUBLICATION I
56
Chandel N.S. and P.T. Schumacker. 1999. Cells depleted of mitochondrial DNA (rho0)
yield insight into physiological mechanisms. FEBS Letters 454 (3):173-176.
Chandel N.S. and P.T. Schumacker. 2000. Cellular oxygen sensing by mitochondria: old
questions, new insight. Journal of Applied Physiology 88:1880-1889.
Chi N.C. and J.S. Karliner. 2004. Molecular determinants of responses to myocardial
ischemia / reperfusion injury: focus on hypoxia-inducible and heat shock factors.
Cardiovascular Research 61:437-447.
Czubryt M.P., V. Panagia and G.N. Pierce. 1996. The roles of free radicals, peroxides and
oxidized lipoproteins in second messenger system dysfunction. EXS 76:57-69.
Desai I. 1984. Vitamin E analysis methods for animal tissues. Methods in Enzymology
105:138-146.
Dunlap W.C., A. Fujisawa, Y. Yamamoto, T.J. Moylan and B.D. Sidell. 2002.
Notothenioid fish, krill and phytoplankton from Antarctica contain a vitamin E constituent
(α-tocopherol) functionally associated with cold-water adaptation. Comparative
Biochemistry Physiology 133B: 299-305.
Egginton S. and B.D. Sidell. 1989. Thermal acclimation induces adaptive changes in
subcellular structure of fish skeletal muscle. American Journal of Physiology 256:R1-R9.
Ema M., K. Hirota, J. Mimura, H. Abe, J. Yodoi, K. Sogawa, L. Poellinger and Y. Fujii-
Kuriyama. 1999. Molecular mechanisms of transcription activation by HLF and HIF-1α in
response to hypoxia: their stabilization and redox signal-induced interaction with
CBP/p300. The EMBO Journal 18:1905-1914.
Fandrey J., S. Frede and W. Jelkmann. 1994. Role of hydrogen peroxide in hypoxia-
induced erythropoietin production. Biochemical Journal 303:507-510.

PUBLICATION I
57
Fandrey J. 2004. Oxygen-dependent and tissue-specific regulation of erythropoietin gene
expression. American Journal Physiology, Regulatory, Integrative and Comparative
Physiology 286:R977-R988.
Fariss M.W. and D.J. Reed. 1987. High-performance liquid chromatography of thiols and
disufides: diphenol derivatives. Methods in Enzymology 143:101-109.
Fields P.A. and G. N. Somero. 1998. Hot spots in cold adaptation: Localized increases in
conformational flexibility in lactate dehydrogenase A4 orthologs of Antarctic notothenioid
fishes. Proceedings of the National Academy of Sciences of the United States of America
95:11476-11481.
Fonds M., A. Jaworski, A. Idema and P.V.D. Puyl. 1989. Metabolism, food consumption,
growth and food conversion of shorthorn sculpin (Myxocephalus scorpius) and eelpout
(Zoarces viviparus). I. C. E. S., Demersal Fish Commitee 31G:1-10.
Giardina B., M.L. Gozzo, B. Zappacosta, L. Colacicco, C. Calla, A. Mordente and S.
Lippa. 1997. Coenzyme Q homologs and trace elements content of Antarctic fishes
Chionodraco hamatus and Pagothenia bernacchii compared with the Mediterranean fish
Mugil cephalus. Comparative Biochemistry Physiology 118A:977-980.
Gieseg S.P., S. Cuddihy, J.V. Hill and W. Davison. 2000. A Comparison of plasma vitamin
C and E levels in two Antarctic and two temperate water fish species. Comparative
Biochemistry and Physiology 125B:371-378.
Gonzalez Flecha B., S. Llesuy and A. Boveris. 1991. Hydroperoxide-initiated
chemiluminescence: An assay for oxidative stress in biopsies of heart, liver, and muscle.
Free Radical Biology and Medicine 10:93-100.
Guderley H. and J. St-Pierre. 2002. Going with the flow or life in the fast lane: contrasting
mitochondrial responses to thermal change. Journal of Experimental Biology 205:2237-
2249.

PUBLICATION I
58
Günzler W.A. and L. Flohe. 1985. Glutathione peroxidase. In: Greenwald, R. A. (ed), CRC
handbooks of methods for oxygen radical research. Boca Raton, CRC Press Inc, 285-289.
Haddad J.J.E., R.E. Olvers and S.C. Land. 2000. Antioxidant/pro-oxidant equilibrium
regulates HIF-1α and NF-κB redox sensitivity. Journal of Biological Chemistry
275:21130-21139.
Halliwell B. and J.M.C. Gutteridge. 1985. Free radicals in Biology and Medicine. 2.
edition. Clarendon Press, Oxford, 1-543.
Horowitz M., L. Eli-Berchoer, I. Wapinski, N. Friedman and E. Kodesch. 2004. Stress
related genomic responses during the course of heat acclimation and its association with
ischemia / reperfusion cross-tolerance. Journal of Applied Physiology 97:1496-1507.
Ivan M., K. Kondo, H. Yang, W. Kim, J. Valiando, M. Ohh, A. Salic, J.M. Asara, W.S.
Lane and W.G. Kaelin Jr. 2001. HIFα targeted for VHL-mediated destruction by praline
hydroxylation: implications for O2 sensing. Science 292:464-468.
Jaakkola P., D.R. Mole, Y.-M. Tian, M.J. Wilson, J. Gielbert, S.J. Gaskell, A. von
Kriegsheim, H.F. Hebestreit, M. Mukherij, C.J. Schofield, P.H. Maxwell, C.W. Pugh and
P.J. Ratcliffe. 2001. Targeting of HIF-1α to the von Hippel-Lindau ubiquitylation complex
by O2-regulated prolyl hydroxylation. Science 292:468-472.
Johnston I.A. 1982. Capillarisation, oxygen diffusion distances and mitochondrial content
of carp muscles following acclimation to summer and winter temperatures. Cell Tissue
Research 222:325-337.
Keller M., A.M. Sommer, H.-O. Pörtner and D. Abele. 2004. Seasonality of energetic
functioning and reactive oxygen species production by mitochondria of the lugworm
Arenicola marina, exposed to acute temperature changes. Journal of Experimental Biology
207: 2529-2538.

PUBLICATION I
59
Klatt P. and S. Lamas. 2000. Regulation of protein function by S-glutathiolation in
response to oxidative and nitrosative stress. European Journal of Biochemistry 267:4928-
4944.
Klein S.M., G. Cohen, C.S. Lieber and A.I. Cederbaum. 1983. Increased microsomal
oxidation of hydroxyl radical scavengers and ethanol after chronic consumption of ethanol.
Archives of Biochemistry and Biophysics 223:425-433.
Kvietikova I., R.H. Wenger, H.H. Marti and M. Gassmann. 1995. The transcription factors
ATF-1 and CREB-1 bind constitutively to the hypoxia-inducible factor-1 (HIF-1) DNA
recognition site. Nuclear Acids Research 23 (22):4542-4550.
Lando D., I. Pongratz, L. Poellinger and M.L. Whitelaw. 2000. A redox mechanism
controls differential DNA binding activities of hypoxia-inducible factor (HIF) 1α and the
HIF-like factor. Journal of Biological Chemistry 275:4618-4627.
Lannig G., C. Bock, F.-J. Sartoris and H.O. Pörtner. 2004. Oxygen limitation of thermal
tolerance in cod, Gadus morhua L., studied by magnetic resonance imaging and on-line
venous oxygen monitoring. American Journal of Physiology, Regulatory, Integrative and
Comparative Physiology. 287:R902-R910.
Lannig G., D. Storch and H.-O. Pörtner. Aerobic mitochondrial capacities in Antarctic and
temperate eelpout (Zoarcidae) subjected to warm versus cold acclimation. MS submitted.
Larsen B.K., H.O. Pörtner and F.B. Jensen. 1997. Extra- and intracellular acid-base
balance and ionic regulation in cod (Gadus morhua) during combined and isolated
exposures to hypercapnia and copper. Marine Biology 128:337-346.
Lawrie S., N. Tancock, S. McGrowth and J. Roger. 1991. Influence of complexation of the
uptake by plants of iron, manganese, copper and zinc. I Effect of EDTA in a multimetal
and computer simulation study. Journal of Experimental Biology 42, 509-515.

PUBLICATION I
60
Levine R.L., D. Garland, C.N. Oliver, A. Amici, I. Climent, A.-G. Lenz, B.-W. Ahn, S.
Shaltiel and E.R. Stadtman. 1990. Determination of carbonate content in oxidatively
modified proteins. Methods in Enzymology 186:464-485.
Linares E., L.S. Nakao, O. Augusto and M.B. Kadiiska. 2003. EPR studies of in vivo
radical production by lipopolysaccharide: potential role of iron mobilized from iron-
nitrosyl complexes. Free Radical Biology and Medicine 34:766-773.
Livingstone D.R., F. Lips, P.G. Martinez and R.K. Pipe. 1992. Antioxidant enzymes in the
digestive gland of the common mussel Mytilus edulis. Marine Biology 112:265-276.
Maracine M. and H. Segner. 1998. Cytotoxicity of metals in isolated fish cells: Importance
of the cellular glutathione status. Comparative Biochemistry and Physiology 120A:83-88.
Mark F.C., C. Bock and H.O. Pörtner. 2002. Oxygen-limited thermal tolerance in Antarctic
fish investigated by MRI and 31P-MRS. American Journal of Physiology, Regulatory,
Integrative and Comparative Physiology 283:R1254-R1262.
Massabuau J.-C. 2003. Primitive, and protective, our cellular oxygenation status?
Mechanisms of Ageing and Development 124:857-863.
Misko T.P., R.J. Schilling, D. Salvemini, W.M. Moore and M.G. Currie. 1993. A
fluorometric assay for the measurement of nitrite in biological samples. Analytical
Biochemistry 214:11-16.
Natoli G., L. Calabrese, C. Capo, P. O’Neill and G. di Prisco. 1990. Icefish
(Chaenocephalus aceratus) Cu,Zn superoxide dismutase. Conservation of the enzyme
properties in extreme adaptation. Comparative Biochemistry Physiology 95B:29-33.
Nikinmaa M. 2002. Oxygen-dependent cellular functions – why fishes and their aquatic
environment are a prime choice of study. Comparative Biochemistry and Physiology
133A:1-16.

PUBLICATION I
61
Nikinmaa M., S. Pursiheimo and A.J. Soitamo. 2004. Redox state regulates HIF-1α and its
DNA binding and phosphorylation in salmonid cells. Journal of Cell Science 117:3201-
3206.
Pena S., J.B. Pena, C. Rios, E. Sacho, C. Fernandez and M.D. Ferrando. 2000. Role of
glutathione in thiobencarb resistance in the european eel Anguilla anguilla. Ecotoxicology
and Environmental Safety 46:51-56.
Pörtner H.O. 2001. Climate change and temperature-dependent biogeography: Oxygen
limitation of thermal tolerance in animals. Naturwissenschaften 88:137-146.
Pörtner H.O. 2002. Climate variations and the physiological basis of temperature
dependent biogeography: systemic to molecular hierarchy of thermal tolerance in animals.
Comparative Biochemistry and Physiology 132A:739-761.
Pugh C.W. 2003. Oxygen sensing in cancer. Annals of Medicine 35:380-390.
Ritola O., T. Kuiru, K. Koponen, H. Mölsä, O. Hänninen and P. Lindström-Seppä. 1999.
Rainbow trout (Oncorhynchus mykiss) exposed to oxygen supersaturation and handling
stress: plasma cortisol and hepatic glutathione status. Acta Biologica Hungarica 50:215-
227.
Ronisz D., D.G.J. Larsson and L. Förlin. 1999. Seasonal variation in the activities of
selected hepatic biotransformation and antioxidant enzymes in eelpout (Zoarces viviparus).
Comparative Biochemistry and Physiology 124C:271-279.
Sartoris F.J., C. Bock and H.O. Pörtner. 2003. Temperature-dependent pH regulation in
eurythermal and stenothermal marine fish: an interspecies comparison using 31P-NMR.
Journal of Thermal Biology 28:363-371.
Sayeed I., S. Parvez, S. Pandey, B. Bin-Hafeez, R. Haque and S. Raisuddin. 2003.
Oxidative stress biomarkers of exposure to deltamethrin in freshwater fish, Channa
punctatus Bloch. Ecotoxicology and Environmental Safety 56:295-301.

PUBLICATION I
62
Schafer F.Q. and G.R. Buettner. 2001. Redox environment of the cell as viewed through
the redox state of the glutathione disulfide/glutathione couple. Free Radical Biology and
Medicine 30 (11):1191-1212.
Semenza G. 2002. Signal transduction to hypoxia-inducible factor 1. Biochemical
Pharmacology 64:993-998.
Sidell B.D. 1998. Intracellular oxygen diffusion: the roles of myoglobin and lipid at cold
body temperature. Journal of Experimental Biology 201:1118-1127.
Slater T.F. 1984. Free radical mechanisms in tissue injury. Biochemical Journal 222:1-15.
Soitamo A.J., C.M.I. Rabergh, M. Gassmann, L. Sistonen and M. Nikinmaa. 2001.
Characterization of a hypoxia-inducible factor (HIF-1α) from rainbow trout. Journal of
Biological Chemistry 276 (23):19677-19705.
Treinin M., J. Shilar, H. Jiang, J.A. Powell-Coffman, Z. Bromberg and M. Horowitz. 2003.
HIF-1 is required for heat acclimation in the nematode Caenorabditis elegans.
Physiological Genomics 14:17-24.
Uchiyama M. and M. Mihara. 1978. Determination of malonaldehyde precursor in tissues
by thiobarbituric acid test. Analytical Biochemistry 86:271-278.
Van Dijk P.L.M., C. Tesch, I. Hardewig and H.-O. Pörtner. 1999. Physiological
disturbances at critically high temperatures: a comparison between stenothermal Antarctic
and eurythermal temperate eelpouts (Zoarcidae). Journal of Experimental Biology
202:3611-3621.
Vegh M., A. Marton and I. Horvath. 1988. Reduction of Fe(III) ADP complex by liver
microsomes. Biochimica Biophysica Acta 964:146-150.
Verdon C.P., B.A. Burton and R.L. Prior. 1995. Sample pretreatment with nitrate reductase
and glucose-6-phosphate dehydrogenase quantitatively reduces nitrate while avoiding

PUBLICATION I
63
interference by NADP+ when the Griess reaction is used to assay for nitrite. Analytical
Biochemistry 224:502-508.
Vuori K.A.M., A. Soitamo, P.J. Vuorinen and M. Nikinmaa. 2004. Baltic salmon (Salmo
salar) yolk-sac fry mortality is associated with disturbances in the function of hypoxia-
inducible transcription factor (HIF-1α) and consecutive gene expression. Aquatic
Toxicology 68:301-313.
Wang G.L., B.H. Jiang, E.A. Rue and G.L. Semenza. 1995. Hypoxia inducible factor 1 is a
basic-helix-loop-helix-PAS heterodimer regulated by cellular O2 tension. Proceedings of
the National Academy of Sciences of the United States of America 92:5510-5514.
Woodmansee A.N. and J.A. Imlay. 2002. Methods in Enzymology 349:3-9.
Yegorov D.Y., A.V. Kozlov, O.A. Azizova and Y.A. Vladimorov. 1993. Simultaneous
determination of Fe(III) and Fe(II) in water solutions and tissue homogenates using
deferral and 1,10-phenanthroline. Free Radical Biology and Medicine 15:565-574.
Zakhartsev M.V., B. De Wachter, F.J. Sartoris, H.O. Pörtner and R. Blust. 2003. Thermal
physiology of the common eelpout (Zoarces viviparus). Journal of Comparative
Physiology 173B:365-378.

PUBLICATION I
64

PUBLICATION I
65
Tables
Table 1
compares α-tocopherol content and lipid radical formation in liver microsomes as well as availability of iron (total iron,
total “free” iron detected by EPR, ratio “free” iron/ total iron and iron reduction rate Fe(III) to Fe(II)) in liver
homogenates of the polar eelpout Pachycara brachycephalum (Pb) and the temperate eelpout Zoarces viviparus (Zv). #
significant difference of the two species compared at the low water temperature, n.s. = not significant, - no statistical
evaluation, as values were obtained from pooled samples in microsomal isolates or calculated from mean values (ratio
“free” / total iron), p < 0.05, n = 3-5, n = 2 for “free” iron of Zv 6°C. FW = fresh weight.
P. brachycephalum
(0°C)
Z. viviparus
(6°C)
Significance
p < 0.05
α-tocopherol in microsomes
(µmol * mg protein-1)
0.76 0.27 -
lipid radicals in microsomes
(pmol *mg protein-1 * min-1)
0.54 0.11 -
total iron content
(nmol * g FW-1)
37 ± 10 150 ± 20 #
total intracellular “free“ iron
(nmol * g FW-1)
22 ± 4 34 ± 7 n.s.
ratio of “free“ iron / total iron 0.59 0.22 -
iron reduction rate
(µmol * g FW-1 * min-1)
10 ± 4 11 ± 5 n.s.

PUBLICATION I
66
Table 2
summarizes oxidative damage marker (thiobarbituric reactive substances (TBARS), chemiluminescence, carbonyl content), total nitrite + nitrate content and antioxidant defence (superoxide
dismutase (SOD), glutathione peroxidase, α-tocopherol) in liver samples from the polar eelpout Pachycara brachycephalum (Pb) acclimated to 0 and 5°C as well as the temperate eelpout
Zoarces viviparus (Zv) acclimatised to 6 and 12°C. Means ± standard deviation, n = 4 - 7, n = 2 for α-tocopherol of Zv 6°C. Interspecies comparison: # significant difference between the two
species at the respective lower water temperature, intraspecies comparison: * significantly different to the values at the higher water temperature, n.s. = not significant, - no statistical evaluation
because n = 2, p < 0.05. FW = fresh weight.
P. brachycephalum
(0°C)
P. brachycephalum
(5°C)
Z. viviparus
(6°C)
Z. viviparus
(12°C)
Sign. difference
Pb 0°C vs. Zv 6°C
TBARS (µmol * g FW-1) 0.17 ± 0.05 (*) 0.26 ± 0.05 0.6 ± 0.1 (*) 0.4 ± 0.1 #
chemiluminescence rate (cpm2 * mg protein-1) 0.3 ± 0.1 (n.s.) 0.4 ± 0.3 1.1 ± 0.8 (*) 0.6 ± 0.3 #
carbonyl content (nmol * mg protein-1) 4 ± 2 (n.s.) 6 ± 2 3.2 ± 0.4 (n.s.) 2.2 ± 0.7 n.s.
total (nitrite+nitrate) content (µmol * mg protein-1) 0.03 ± 0.01 (n.s.) 0.047 ± 0.007 0.17 ± 0.06 (n.s.) 0.2 ± 0.1 #
SOD activity (20°C) (U * g FW-1) 2200 ± 800 (n.s.) 2400 ± 200 3400 ± 500 (*) 2000 ± 700 #
SOD activity (water temperature) (U * g FW-1) 2000 ± 400 (n.s.) 2100 ± 400 2000 ± 1000 (n.s.) 1800 ± 500 n.s.
glutathione peroxidase (20°C) (U * g FW-1) 1.6 ± 0.5 (*) 2.6 ± 0.7 1.6 ± 0.6 (*) 4 ± 2 n.s.
α-tocopherol (µmol * g FW-1) 300 ± 200 (n.s.) 500 ± 100 93 (-) 240 ± 80 -
PUBLICATION I
67
Table 3
depicts glutathione redox parameters: the contents of reduced (GSH) and oxidised glutathione (GSSG), total glutathione content and the ratio of oxidised to reduced glutathione. The redox
potential (∆E) was calculated at respective water temperature and in situ intracellular pH (pHi) calculated by the Nernst equation as described in Schafer & Buettner (2001). Changes of pHi with
temperature were elaborated for muscle tissue by Sartoris et al. (2003) and corrected for lower liver pHi values by 0.28 pH units (Larsen et al. 1997). Values are given for liver tissue of the polar
eelpout Pachycara brachycephalum (Pb) acclimated to 0 and 5°C as well as the temperate eelpout Zoarces viviparus (Zv) acclimatised to 6 and 12°C. Means ± standard deviation, n = 4 - 7.
Interspecies comparison: # significant difference between the two species at the respective lower water temperature, intraspecies comparison: * significantly different to the values at the higher
water temperature, n.s. = not significant, - no statistical evaluation, p < 0.05. FW = fresh weight.
P. brachycephalum
(0°C)
P. brachycephalum
(5°C)
Z. viviparus
(6°C)
Z. viviparus
(12°C)
Sign. difference
Pb 0°C vs. Zv 6°C
GSH (µmol * g FW-1) 2.1 ± 0.5 (n.s.) 2.4 ± 0.3 1.0 ± 0.4 (n.s.) 0.9 ± 0.3 #
GSSG (µmol * g FW-1) 3.1 ± 1.5 (n.s.) 2.9 ± 0.8 0.8 ± 0.2 (*) 0.16 ± 0.05 #
total glutathione
(GSH + 2GSSG) (µmol * g FW-1)
8 ± 2 (n.s.) 9 ± 3 2.5 ± 0.5 (*) 1.2 ± 0.3 #
(2GSSG)/GSH 2.7 ± 0.9 (n.s.) 3 ± 1 1.8 ± 0.9 (*) 0.36 ± 0.041 n.s.
Redox potential ∆E (mV) -253 ± 5 (n.s.) -252 ± 8 -246 ± 11 (*) -258 ± 4 n.s.
pHi 7.140 7.065 7.072 6.970 -

PUBLICATION I
68
Figures Figure 1
EPR detection of lipid radical formation by liver microsomal extracts. 3.A shows POBN spectra. 3.B Overlay of lipid
radical generation at t = 0 min and t = 30 min in the polar eelpout Pachycara brachycephalum. 3.C Overlay of lipid
radical generation at t = 0 min and t = 30 min in the temperate eelpout Zoarces viviparus. 3.D Depicts computer
simulated spectra of lipid radicals. Arrows indicate the higher lipid radical generation in the polar eelpout upon 30 min
incubation compared to the temperate eelpout.
D
C
B
A

PUBLICATION I
69
Figure 2
HIF-1: 2.A Western blotting analysis of HIF-1α in liver whole cell extracts from the temperate eelpout Zoarces viviparus
(Zv) acclimatised to 6 and 12°C. 2.B: HIF-1 DNA binding activity to the human EPO enhancer in electromobility shift
assays with liver whole cell extracts from the polar eelpout Pachycara brachycephalum (Pb) acclimated to 0 and 5°C as
well as the temperate eelpout Zoarces viviparus (Zv) acclimatised to 6 and 12°C. Means ± standard deviation, n = 5. %
intensity was based on densitometry of gel images, with the sum of all 4 bands taken as 100 % value. Interspecies
comparison: # significant difference between the two species at respective lower water temperature, intraspecies
comparison: * significantly different from the values at the higher water temperature, p < 0.05. 2.C: Example of EMSA.
2.D: Addition of polyclonal antibody directed against the N-terminus of rainbow trout HIF-1α to the reaction mixture in
lane 2 and 4 diminished the EMSA signal in liver whole cell extracts from Z. viviparus compared to reaction mixtures
without antibody (lane 1 and 3) indicating that the fish HIF-1 bound to the human EPO enhancer.
2.B
Pb 0°C Pb 5°C Zv 6°C Zv 12°C
rela
tive
amou
nt o
f act
ivat
ed H
IF-1
(% in
tens
ity)
0
10
20
30
40
50
*
*
#

PUBLICATION I
70
PUBLICATION II
71
Publication II:
BIOCHIMICA ET BIOPHYSICA ACTA –
GENE STRUCTURE AND EXPRESSION
The hypoxia inducible factor (HIF-1α) in cold-adapted Antarctic fishes
Rapid report
Katja Heise, Magnus Lucassen, and Doris Abele
Author affiliation:
Alfred-Wegener Institute for Polar and Marine Research, Marine Animal Physiology, Am
Handelshafen 12, 27570 Bremerhaven, Germany,
Corresponding author:
Katja Heise
Alfred-Wegener Institute for Polar and Marine Research
Marine Animal Physiology
Am Handelshafen 12
27570 Bremerhaven
Germany
Ph: ++49 471 4831 1311, Fax: ++49 471 4831 1149
Email: [email protected]
PUBLICATION II
72
Summary
Hypoxia inducible factor 1α sequences from one temperate and four cold-adapted
Antarctic fishes were determined with remarkable differences in the deduced peptide
sequences compared with mammals or other fishes. One functional proline in the oxygen
dependent degradation domain of the Antarctic zoarcid was substituted by leucine.
Sequences are compared and their implication for cold-adaptation discussed.
Key words:
Hypoxia inducible factor, cold-adaptation, Antarctic fish, prolyl hydroxylation

PUBLICATION II
73
Antarctic fish have evolved into a highly cold-adapted phenotype (1), including a variety
of adaptations of the O2-transport system (2, 3, 4). High O2 solubility in aqueous media at
low temperatures presumably supports the low hematocrits found in Antarctic
notothenioids and zoarcids and the complete absence of red blood cells in icefish (5, 6).
We hypothesize that cold adaptation moreover implicates modifications of O2-dependent
gene expression. In mammals the transcription factor HIF-1 (hypoxia inducible factor)
activates target genes involved in erythropoiesis, angiogenesis, and glucose metabolism
(reviewed in 7, 8) and is seen as the key regulator of O2 homeostasis (9). The O2 regulated
subunit HIF-1α is constitutively expressed, but rapidly degraded under normoxic
conditions (10). Prolyl hydroxylases (PHD) use molecular O2 for hydroxylation of Pro402
and Pro564 in human HIF-1α, which are subsequently recognized by pVHL (von Hippel
Lindau Tumor suppressor protein) enabling HIF-1α proteasomal degradation (11, 12, 13).
Under O2 deprivation, proline hydroxylation is prevented, HIF-1α protein escapes
proteolytic degradation, and translocates to the nucleus (10). Following dimerization with
HIF-β, the HIF-1 dimer activates target genes containing the hypoxia responsive element
(HRE; 14, 15). Both HIF-1 subunits belong to the basic-helix-loop-helix-PAS family of
proteins (16). The C-terminal half of HIF-1α contains the oxygen dependent degradation
domain (ODD) including the two proline residues and the N-terminal transactivation
domain (N-TAD). The C-terminal TAD is regulated mainly by normoxic hydroxylation of
Asn803 in human HIF-1α, preventing its interaction with transcriptional co-activators (17).
This study compares the HIF-1α sequences of the common eelpout Zoarces viviparus
(Zv; Zoarcidae), caught in the German North Sea, to the con-familial Antarctic eelpout
Pachycara brachycephalum (Pb), caught during an RV Polarstern cruise near King George
Island (Antarctic peninsula). Moreover, zoarcid HIF-1α was compared to three
notothenioid species (Trematomus hansoni, Th; T. pennellii, Tp; and the icefish species
Chionodraco myersi, Cm), which were caught in the Antarctic Weddell Sea. Fish
sampling, mRNA isolation from liver, RT-PCR, cloning and sequencing of partial HIF-1α
cDNA sequences were carried out as described by Lucassen et al. (18). Full-length cDNA
sequences for both eelpout were obtained by amplification of overlapping fragments and
rapid amplification of cDNA ends (RACE; 19), using the primers listed in table 1. Taq-
Polymerase (Eppendorf, Hamburg, Germany) was used for amplification of fragments
<1000 bp and SuperTaqPlus-Polymerase (Ambion, Austin, USA) for fragments >1000 bp.
A standard PCR protocol was used with 35 cycles of 45 s denaturation at 94°C, annealing
80 s with a 12°C gradient (58±6°C), and 80 s elongation at 72°C, followed by a final

PUBLICATION II
74
elongation step of 8 min at 72°C. 3`RACE-PCR and 5`RACE-PCR reactions with
P. brachycephalum samples were carried out with annealing at 61±6°C and 62±6°C,
respectively. The 1175 bp fragments (see tab.1) of P. brachycephalum and notothenioid
samples were amplified using a touch-down program with 2 min annealing at temperatures
from 60±6 to 51±6°C (-1°C/cycle), followed by 25 cycles with 1 min annealing at 57±6°C.
MacVector 7.2 was used for primer design, assemblage and sequence analysis.
We identified full length HIF-1α nucleotide sequences of the zoarcids with sizes of 3383
(Z. viviparus, fig.1) and 3283 (P. brachycephalum) base pairs and an open reading frame
encoding 747 amino acids for both fishes (Genbank submission in progress). The
nucleotide sequences showed 96% identity between the two eelpout species, 41% to
human (Hs) and 63% identity to rainbow trout (Om) HIF-1α. The deduced amino acid
sequences had 96% identity between the eelpout species, 50% identity to human, 71% to
rainbow trout sequences. Overall, the N-terminal half of the protein containing the bHLH-
PAS domains involved in dimerization and DNA binding proved highly conserved
between eelpout species (99% identity; not shown), whereas the C-terminal half containing
ODD and C-TAD was less conserved (94% identity, fig.2).
For comparison of different cold-adapted species we characterized partial cDNA
sequences covering the C-terminal half of HIF-1α from Antarctic notothenioids (Genbank
submission in progress). High conservation of the deduced amino acid sequences (amino
acids 343-737 of ZvHIF-1α) could be found between zoarcids and notothenioids with
identities of 75-77% and 82-84% similarities (fig.2). The derived partial amino acid
sequences of the marine fishes clustered together with the partial rainbow trout sequence
(58-60% identity, 76% similarity), with all six species belonging to the order of
perciformes (fig.3). Lower conservation was found when comparing to the cyprinids, order
cypriniformes (44-45% identity, 58-60% similarity).
Characterization of rainbow trout HIF-1α demonstrated that the degradation/stabilization
mechanism is essentially the same in fish and mammals, but stabilization occurred at much
higher O2 levels in fish (20). This was ascribed to four redox-sensitive cysteine residues in
the ODD of rainbow trout HIF-1α in contrast to only one cysteine in the human sequence
(21). Four cysteine residues were also identified in the ODD of both zoarcid sequences
(position of ZvHIF-1α: 442, 496, 512, 578; fig.2). Similarly, the Trematomus species (Tp,
Th) exhibited two and the icefish (Cm) three cysteine residues in the ODD (fig.2).
Moreover, the notothenioids displayed two additional cysteines in or next to the C-TAD,
possibly leading to changes in the redox-sensitivity of the transactivation mechanism (22).

PUBLICATION II
75
In conjunction with the detection of normoxic HIF-1α protein levels in the liver of Zoarces
viviparus (23), this supports the idea that O2-regulated gene expression might play a role in
the normal fish physiology accomplished by different redox characteristics of HIF-1α (21,
24, 20). Further, for rainbow trout HIF-1 redox sensitivity of DNA binding conferred by
Cys25 (Ser28 in human HIF-1α) has been reported (21). Although we found increased
HIF-1 DNA binding in the liver of temperature-stressed Z. viviparus occurring at more
reduced cellular redox environment (25), both zoarcid sequences have serine at the
respective position (not shown).
Surprisingly, the N-terminal (Pro402 in HsHIF-1α) of the two functional proline residues
(7) was substituted by leucine in the Antarctic eelpout (Pb, fig.2), which is to our
knowledge, the first report of this phenotype. Both prolines can be independently
recognized by the PHDs (13, 26). Moreover, mutation of both proline residues and the
asparagine residue was required to render HIF-1α fully active at normoxia (17). It is
conceivable that substitution of one functional proline in PbHIF-1α still allows for
hydroxylation of the other conserved residue, and subsequent pVHL mediated proteasomal
degradation. On the other hand, mutation of Pro564Ala abrogated pVHL binding activity,
and full length HsHIF-1α Pro564Ala proved more stable than wildtype HIF-1α in
degradation assays (11). Hence, PbHIF-1α can be expected to be even more inert to PHD
action than ZvHIF-1α, which conserved both functional prolines. Multiplicity of the
hydroxylation sites of HIF-1α is supposed to allow a more complex response to oxygen
availability (13). Taken together, these considerations suggest a reduced flexibility of the
hypoxic response via the degradation/ stabilization mechanism of HIF-1α in the Antarctic
zoarcid. However, we found increased HIF-1 DNA binding in P. brachycephalum
acclimated to 5°C, supposed to induce temperature dependent O2 limitation in this species
(6, 27), compared to control fish kept at 0°C (23). Thus, despite the proline substitution,
HIF-1 might still be functional, at least on the level of dimerization and DNA binding. It
has been suggested that the regulation of transcriptional activity is likely the crucial step
under most physiological conditions (7) and Asn803 hydroxylation should abolish
transactivation of HIF-1 in normoxia, if HIF-1α escapes the degradation process (26).
Thus, PbHIF-1 function may be regulated mainly via transactivation. In this context, the
Pro-Leu conversion within that anyway leucine-rich site LXLLXL (fig.2) could improve
the interaction of HIF-1α with transcriptional co-activators, as leucine-rich regions are
important for the interactions of p300 with several transcription factors including HIF-2α
(28).

PUBLICATION II
76
Reduced numbers of proline residues represent one possibility of protein adaptation to
cold temperatures in that they increase the structural flexibility of the molecule at low
temperature (29). However, amino acid substitutions for cold adaptation of a protein are
not expected in functional domains but in between those protein regions (30, 31). To
clarify this point, we sequenced the C-terminal part of the HIF-1α gene from two red-
blooded notothenioids, T. hansoni, T. pennellii and also from the hemoglobinless icefish,
C. myersi, and detected both functional prolines in all three notothenioid HIF-1α fragments
(fig.2). Hence, the substitution found in P. brachycephalum is not primarily related to cold
adaptation of O2-dependent gene expression in polar fish. In addition to higher structural
flexibility by a reduced number of proline residues, amino acid substitutions favouring
solvent interactions with a hydrophilic surface were observed in cold adapted proteins (32,
29, 33). Of course, the location of the substituted residue in the folded protein is highly
important for its influence on protein structural properties. As no data for the HIF-1α
tertiary structure are available, only preliminary assumptions on the impact of amino acid
substitutions on HIF-1α cold adaptation are possible. When comparing the deduced amino
acid sequences only of the two zoarcids, differences supporting the general trend for cold
adaptation of PbHIF-1α can be found as well as others opposed to this trend. However,
outlining all differences between Zv and PbHIF-1α which are conserved in all cold-adapted
proteins, revealed that all substitutions found in the ODD and C-TAD (Ala445Ser,
Trp495Arg/Thr, Ile543Thr, Gly702Ser/Asn; positions on ZvHIF-1α; indicated by green
stars in fig.2) may support higher hydrophilicity and, therewith, cold adaptation. Few
substitutions supposed to reduce protein flexibility (Ser606Pro, His609Arg; indicated by
orange stars in fig.2), were not located within the functional sites.
Moreover, the alignment (fig.2) revealed another interesting feature. Whereas human
HIF-1α protein showed a single glutamine residue at position 365, the respective region of
the rainbow trout sequence contained 3 glutamines. Both zoarcids show an accumulation
of overall 8 glutamine and glutamate residues. An even larger extension of this Gln-Glu
cluster was detected in the notothenioid HIF-1αs with >10 in the Trematomus species and a
total of 21 residues in the icefish. Especially the glutamate residues of this cluster will
render this protein region highly acidic.
We have reported HIF-1α sequences from several cold adapted Antarctic fish species
deviating from the known mammal and fish sequences within regulatory ODD. The
functional consequences of additional cysteines, Gln-Glu cluster and Pro-Leu substitution
in the ODD of PbHIF-1α have to be established in future studies. Moreover, the question

PUBLICATION II
77
arises what might be the primary function of a HIF protein in icefishes, without red blood
cells but endowed with outstanding cardio-vascular adaptations to accommodate this lack
(34). Nevertheless, detection of HIF-1α by RT-PCR from normoxic fish samples confirms
constitutive expression of this gene in the liver of all four Antarctic species. This might
support the suggestion of Semenza (8) that HIF-1 was an essential factor in metazoan
evolution.
Acknowledgements
We thank Felix C. Mark for providing notothenioid liver samples.
References
[1] D.E. Wohlschlag, Respiratory metabolism and ecological characteristics of some fishes
in McMurdo Sound, Antarctica, in: M.O. Lee (ed.), Antarctic research series, vol. 1,
American geophys. Union, Washington D.C., 1964, pp. 36-62.
[2] R. Acierno, M. Maffia, M. Rollo, C. Storelli, Buffer capacity in the blood of the
hemoglobinless Antarctic fish Chionodraco hamatus, Comp. Biochem. Physiol. 118A
(1997) 989-992.
[3] E. Cocca, M. Ratnayake-Lecamwasam, S.K. Parker, L. Camadella, M. Ciaramella, G.
di Prisco, H.W. Detrich, Do the hemoglobinless icefishes have globin genes? Comp.
Biochem. Physiol. 188A (1997) 1027-1030.
[4] R.M.G. Wells, M.D. Ashby, S.J. Duncan, J.A: Macdonald, Comparative study of the
erythrocytes and haemoglobins in notothenioid fishes from Antarctica, J. Fish Biol. 17
(1980) 517-527.
[5] W. Davison, M. Axelsson, S. Nilsson, M.E. Forster, Cardiovascular control in
Antarctic notothenioid fishes, Comp. Biochem. Physiol. 118A (1997) 1001-1008.
[6] F.C. Mark, C. Bock, H.O. Pörtner, Oxygen-limited thermal tolerance in Antarctic fish
investigated by MRI and 31P-MRS. Am. J. Physiol. Regul. Integr. Comp. Physiol. 283
(2002) R1254-R1262.
[7] C.P. Bracken, M.L. Whitelaw, D.J. Peet, The hypoxia-inducible factor: key
transcriptional regulators of hypoxic responses, Cell. Mol. Life Sci. 60 (2003) 1376-1393.

PUBLICATION II
78
[8] G.L. Semenza, Hydroxylation of HIF-1: Oxygen sensing at the molecular level,
physiology 19 (2004) 176-182.
[9] G.L. Semenza, Hypoxia-inducible factor 1: master regulator of O2 homeostasis, Curr.
Op. Genet. Develop. 8 (1998) 588-594.
[10] P.J. Kallio, W.J. Wilson, S. O’Brian, Y. Makino, L. Poellinger, Regulation of the
hypoxia-inducible transcription factor 1 α by the ubiquitine proteasome pathway, J. Biol.
Chem. 274 (1999) 6519-6525.
[11] M. Ivan, K. Kondo, H. Yang, W. Kim, J. Valiando, M. Ohh, A. Salic, J.M. Asara,
W.S. Lane, W.G. Kaelin Jr, HIFα targeted for VHL-mediated destruction by proline
hydroxylation: implications for O2 sensing, Science 292 (2001) 464-468.
[12] P. Jaakkola, D.R. Mole, Y.M. Tian, M.J. Wilson, J. Gielbert, S.J. Gaskell, A. von
Kriegsheim, H.F. Hebestreit, M. Mukherij, C.J. Schofield, P.H. Maxwell, C.W. Pugh, P.J.
Ratcliffe, Targeting of HIF-1α to the von Hippel-Lindau ubiquitylation complex by O2-
regulated prolyl hydroxylation, Science 292 (2001) 468-472.
[13] N. Masson, C. William, P.H. Maxwell, C.W. Pugh, P.J. Ratcliffe, Independent
function of two destruction domains in hypoxia-inducible factor-α chains activated by
prolyl hydroxylation, The EMBO J. 20 (2001) 5197-5206.
[14] K.L. Blanchard, A.M. Acquaviva, D.L. Galson, H.F. Bunn, Hypoxic induction of the
human erythropoietin gene: cooperation between the promoter and enhancer, each of
which contains steroid receptor response elements. Mol. Cell. Biol. 12 (1992) 5373-5385.
[15] G.L. Wang, G.L. Semenza, Characterization of hypoxia inducible factor 1 and
regulation of DNA binding activity by hypoxia. J. Biol. Chem. 268 (1993) 21513-21518.
[16] G.L. Wang, B.-H. Jiang, E. A. Rue, G.L. Semenza, Hypoxia-inducible factor 1 is a
basic-helix-loop-helix-PAS heterodimer regulated by O2 tension, Proc. Natl. Acad. Sci.
USA 92 (1995) 5510-5514.
[17] D. Lando, D.J. Peet, D.A. Whelan, J.J. Gorman, M.L. Whitelaw, Asparagine
hydroxylation of the HIF transactivation domain a hypoxic switch, Science 295 (2002)
858-861.
[18] M. Lucassen, A. Schmidt, L.G. Eckerle, H.-O. Pörtner, Mitochondrial proliferation
versus temporary cold: enzyme activities and mRNA levels Antarctic and temperate
zoarcid fish, Am. J. Physiol. Regul. Integr. Comp. Physiol. 285 (2003) R1410-1420.
[19] F.C. Mark, M. Lucassen, H.O. Pörtner, Are mitochondrial uncoupling proteins
involved in thermal acclimation of polar and temperate fish? Physiol. Genom. in revision.

PUBLICATION II
79
[20] A.J. Soitamo, CM.I. Rabergh, M. Gassmann, L. Sistonen, M. Nikinmaa,
Characterization of a hypoxia-inducible factor (HIF-1α) from rainbow trout, J. Biol. Chem.
276 (2001) 19677-19705.
[21] M. Nikinmaa, S. Pursiheimo, A.J. Soitamo, Redox state regulates HIF-1α and its
DNA binding and phosphorylation in salmonid cells, J. Cell. Sci. 117 (2004) 3201-3206.
[22] M. Ema, K. Hirota, J. Mimura, H. Abe, J. Yodoi, K. Sogawa, L. Poellinger, Y. Fujii-
Kuriyama Y, Molecular mechanisms of transcription activation by HLF and HIF-1α in
response to hypoxia: their stabilization and redox signal-induced interaction with
CBP/p300. EMBO J. 18 (1999) 1905-1914.
[23] K. Heise, M.S. Estevez, S. Puntarulo, M. Galleano, M. Nikinmaa, H.O. Pörtner, D.
Abele, Changes in oxidative stress parameters and activation of hypoxia inducible factor
(HIF-1) at different environmental temperatures in polar and temperate zoarcid fish, MS
submitted.
[24] M. Nikinmaa, B.B. Rees, Oxygen-dependent gene expression in fishes, Am. J.
Physiol. Regul. Integr. Comp. Physiol., 288 (2005) R1079-1090.
[25] K. Heise, S. Puntarulo, M. Nikinmaa, H.-O. Pörtner, D. Abele, Oxidative stress and
HIF-1 DNA binding during stressful warming (hyperthermia) and recovery in the North
Sea eelpout (Zoarces viviparus), MS submitted.
[26] N.M. Mazure, M.C. Brahimi-Horn, M.A. Berta, E.Benizri, R.L. Bilton, F. Dayan, A.
Ginouves, E. Berra, J. Pouyssegur, HIF-1: master and commander of the hypoxic world A
pharmacological approach to its regulation by siRNAs, Biochem. Pharmacol. 68 (2004)
971-980.
[27] H.O. Pörtner, Climate variations and the physiological basis of temperature dependent
biogeography: systemic to molecular hierarchy of thermal tolerance in animals, Comp.
Biochem. Physiol. 132A (2002) 739-761.
[28] J.F. O’Rourke, Y.-M. Tian, P.J. Ratcliffe, C.W. Pugh, Oxygen-regulated and
transactivating domains in endothelial PAS protein 1: comparison with hypoxia-inducible
factor-1α, J. Biol. Chem. 274 (1999) 2060-2071.
[29] G. Feller, J.L. Arpigny, E. Narinx, C. Gerday, Molecular adaptation of enzymes from
psychrophilic organisms. Comp. Biochem. Physiol. 118A (1997) 495-499.
[30] G.N. Somero, Protein adaptations to temperature and pressure: complementary roles
of adaptive changes in amino acid sequence and internal milieu, Comp. Biochem. Physiol.
136B (2003) 577-591.

PUBLICATION II
80
[31] G.N. Somero, Adaptation of enzymes to temperature: searching for basic “strategies”,
Comp. Biochem. Physiol 139B (2004) 321-333.
[32] S. D’Amico, P. Claverie, T. Collins, D. Georlette, E. Gratia, A. Hoyoux, M.-A.
Meuwis, G. Feller, C. Gerday, Molecular basis of cold adaptation, Phil. Trans. R. Soc.
Lond 357B (2002) 917-925.
[33] H.-O. Pörtner, M. Lucassen, D. Storch, Metabolic biochemistry: its role in thermal
tolerance and in the capacities of physiological and ecological function, in: J.F. Steffensen,
A.P. Farrell (Guest Eds.), The Physiology of Polar Fishes. To appear in 2005 as vol. 21 in
the series Fish Physiology – Series, editors W.S. Hoar, D.R. Randall and A.P. Farrell.
[34] G. Feller, C. Gerday, Adaptations of the hemoglobinless Antarctic icefish
(Channichthyidae) to hypoxia tolerance, Comp. Biochem. Physiol. 118A (1997) 981-987.

PUBLICATION II
81
Tables
Table 1
List of all primers used in this study.
Zv: only used for amplification of partial HIF-1α cDNA of Z. viviparus, Pb: only used for amplification of partial HIF-1α
cDNA of P. brachycephalum, N: used for amplification of partial HIF-1α cDNA of notothenioids and zoarcids.
Primer Sequence (5` – 3`) Position of
Z. viviparus HIF-1α
Product size of Z. viviparus
HIF-1α fragment (bp)
HIF-F1 CCAAGGAACMAAACACAGAARCG 677 – 698
HIF-B5 TGAGTCTCMACCCACACAAARCC 1157 – 1135 435
HIF-F1L TCCAACATCCCTCCAACATCG 878 – 898
HIF-B7L TTCTTCTCGTCCCCCAGCAGGAAC 1376 – 1353 453
HIF-F13 TGTGYGTCAACTAYGTKCTCCAGTGG 1206 – 1229 N
HIF-B31 TGACTTGGTCCAGRGCACKCAG 2437 – 2416 1175 N
HIF-5`-B1 GATGTTGGATGGGGTCACAGAC 886 – 8656 865
HIF-5`-B4Z TGTATGGCGGCTGAGAAAAGTC 939 – 918 918 Zv
HIF-5`-B6 GTAGATGACAGTGGCTTGTGTTTCC 1173 – 1149 1149
HIF-3`-F6 TTGATACAGAGCCCAAAACCC 1805 – 1825 1558 Pb
HIF-3`-F10 AGTCCAGTCCCTTCAGAGTTCTC 1944 – 1966 1417
Figures
Figure 1
Schematic overview of Z. viviparus HIF-1α cDNA: The 5` and 3` untranslated regions (UTR) are indicated by blue bars,
the open reading frame by the green bar, the striped part indicating partial HIF-1α used for the alignment in fig.2 and the
phylogenetic analysis in fig.3. The locations of RT-PCR primers are indicated by blue, locations of RACE primers by red
arrows.

PUBLICATION II
82
Figure 2
Alignment of partial HIF-1α amino acid sequences (according to fig.1, representing amino acids 343-737 of ZvHIF-1α) of
the common eelpout Zoarces viviparus (Zv), the Antarctic eelpout Pachycara brachycephalum (Pb), the icefish
Chionodraco myersi (Cm) and the red-blooded Antarctic notothenioids Trematomus hansoni (Th) and T. pennellii (Tp) as

PUBLICATION II
83
well as of the rainbow trout Oncorhynchus mykiss (Om; AF304864) and human (Hs; 31077212). The oxygen-dependent
degradation domain (ODD) is indicated by the red line below the sequence. The N-terminal (N-TAD) and the C-terminal
(C-TAD) transactivation domains are framed by black boxes. LXXLXP represents the binding motif for PHDs (12).
Regulatory proline, lysine and asparagine residues are highlighted red, cysteine residues blue. The functional Pro402 of
HsHIF-1α appeared substituted to leucine in PbHIF-1α. The green line indicates a Gln-Glu cluster in the fish sequences,
prevailing especially in the Antarctic species. Stars mark differences between Zv and Pb, which in Pb are identical or
similar in notothenioids; green stars representing differences in line with general trends observed upon protein cold
adaptation, orange stars representing differences opposing those trends, black stars representing conserved substitutions.
Substitutions supposed to support cold adaptation of HIF-1α are observed mainly in the ODD and the C-TAD.
Figure 3
Phylogenetic analysis of the C-terminal half of fish HIF-1α amino acid sequences (according to fig.2) of the zoarcids
Zoarces viviparus (Zv) and Pachycara brachycephalum (Pb), the notothenioids Chionodraco myersi (Cm), Trematomus
hansoni (Th) and T. pennellii (Tp), the cyprinids Danio rerio (Dr; zebrafish; AY326951)) and Ctenopharyngodon idella
(Ci; grass carp; AY450269) as well as of the salmonid Oncorhynchus mykiss (Om; rainbow trout; AF304864). The tree
was calculated by the Neighbour Joining method (best tree; tie breaking = Systematic; Distance: Uncorrected “p”; Gaps
distributed proportionally) with the human sequence (Hs; 31077212) as outgroup. Tree calculation by bootstrap (1000
repeats) resulted in the same cluster with all bootstrap values being 100% (not shown).

PUBLICATION II
84

PUBLICATION III
85
Publication III:
JOURNAL OF EXPERIMENTAL BIOLOGY
Oxidative stress and HIF-1 DNA binding during stressful temperatures and recovery in the North Sea eelpout (Zoarces viviparus)
Part A: cold stress
Katja Heise1, Susana Puntarulo2, Mikko Nikinmaa3, Magnus Lucassen1, Hans-O. Pörtner1
and Doris Abele1
Author affiliations: 1 Alfred-Wegener Institute for Polar and Marine Research, Physiology of Marine Animals,
Am Handelshafen 12, 27570 Bremerhaven, Germany 2 Physical Chemistry-PRALIB, School of Pharmacy and Biochemistry, University of
Buenos Aires, Junin 956, C 1113 AAD Buenos Aires, Argentina 3 Laboratory of Animal Physiology, Department of Biology, University of Turku,
FIN20014 Turku, Finland
Corresponding author:
Doris Abele
Alfred-Wegener Institute for Polar and Marine Research
Physiology of Marine Animals
Am Handelshafen 12
27570 Bremerhaven
Germany
Ph: ++49 471 4831 1567, Fax: ++49 471 4831 1149
E-Mail: [email protected]

PUBLICATION III
86
Abstract
Effects of acute cold exposure (at 1°C and 5°C) on tissue redox state and oxidative stress
parameters, as well as the onset of hypoxic signaling were investigated in the North Sea
eelpout, Zoarces viviparus. Activation of the transcription factor HIF-1 (hypoxia inducible
factor) was detected in liver samples after acute cold exposure. HIF-1 activation occurred
at more reduced cellular redox milieu. Mildly increased levels of oxidative stress
parameters were observed mainly during recovery at control temperature (12°C). This
increase in oxidative stress parameters, in spite of maintained antioxidant capacity,
indicates that acute cold stress and recovery mimic ischemia / reperfusion events as found
in mammals. Notably the non-enzymatic antioxidant defense (e.g. glutathione) may play an
important role for eelpout ROS scavenging capacity under cold stress.
Key words:
Cold stress, hypoxia inducible factor, redox state, antioxidants, temperate fish

PUBLICATION III
87
Introduction
Tissue PO2 in higher organisms and fish is usually regulated in a very narrow range
(Massabuau 2003). Critically low (hypoxic) or high (hyperoxic) PO2 values are associated
with many forms of physiological stress. Generally, these situations are accompanied by
oxidative stress, i.e. the unbalanced production of reactive oxygen species (ROS) like O2-.
H2O2, OH., ROO. (Sies 1985). Decreasing ROS levels under hypoxia and excess ROS
formation when the tissue is flooded with oxygen (reoxygenation) have frequently been
described and termed ischemia / reperfusion injury (Chi & Karliner 2004, Erecińska &
Silver 2001, Hermes-Lima & Zenteno-Savin 2002).
In addition to their detrimental effects on cellular integrity and function, ROS are
involved in cellular signaling (Czubryt et al. 1996, Ehleben et al. 1998, Genius & Fandrey
2000), e.g. in the redox regulation of the hypoxia inducible transcription factor (HIF-1)
(Huang et al. 1996, Ema et al. 1999, Lando et al. 2000, Liu et al. 2004, Acker & Acker
2004). The target genes of HIF-1 support cellular and systemic survival during oxygen
shortage (for review see Semenza 2002). HIF-1 is a heterodimer with the β-subunit
(ARNT) being constitutively present, whereas the α-subunit is regulated in an oxygen-
sensitive manner (Jiang et al. 1996). In mammalian cells HIF-1α is permanently expressed
and rapidly degraded under normoxia by the ubiquitine-proteasome system resulting in low
steady state protein levels (Kallio et al. 1999, Cockman et al. 2000). Under hypoxia the
HIF-1α protein stabilizes and accumulates, translocates into the nucleus and dimerizes with
the β-subunit to the transcriptionally active HIF-1 dimer.
Oxygen dependent prolyl hydroxylases (PHDs) control normoxic HIF-1α destabilization,
which depends on PO2 (Ivan et al. 2001, Jaakkola et al. 2001, and Masson et al. 2001).
However, the cellular redox state is the quintessential regulator of the PHD/HIF interaction,
indicated by the fact that the central iron atom of PHDs undergoes redox cycling. Many
different redox effectors (ascorbate, ferrous iron, thioredoxin etc.) can influence PHD
activity (Acker & Acker 2004, Fandrey 2004). Further, ROS may affect redox chemistry of
thiol groups in regulatory proteins, e.g. the transcriptional co-activators CBP/p300, Ref-1,
and in HIF-subunits themselves (Ema et al. 1999, Haddad et al. 2000, Lando et al. 2000,
Liu et al. 2004), and may therefore be involved in intracellular redox sensitive signaling
pathways. In addition, ROS, produced by NADP(H) oxidase in response to extracellular
signals (Görlach et al. 2000) can induce HIF-1α stabilization under normoxic conditions
(reviewed by Acker & Acker 2004, see papers cited like Haddad & Land 2001).

PUBLICATION III
88
In marine ectotherms, changing environmental temperatures outside the optimal
temperature range cause a decrease of whole animal aerobic scope upon both warming and
cooling and can induce a state of functional hypoxia in fully oxygenated water (Pörtner
2002). In line with findings in several marine invertebrates, Lannig et al. (2004) suggested
for Atlantic cod that below the optimum temperature range a larger reduction of blood
circulation and oxygen transport than of tissue oxygen demand might be responsible for the
significant lowering of venous PO2. In fish, cardiovascular performance likely sets the
temperature range for optimal aerobic scope (Mark et al. 2002, Lannig et al. 2004, and
Pörtner et al. 2004). The progressive mismatch between oxygen supply and demand in the
cold thus causes cold-induced hypoxia in fish tissues. Hypoxia and subsequent reperfusion
in central tissues might then form a basis for cold-induced oxidative stress. Survival in
habitats where temperatures may transiently fluctuate beyond the thermal optimum range
will then require protection of molecular functions by heat shock proteins and increased
antioxidant defenses. Thus, our approach was to investigate the consequences of cold stress
in fish and to analyze whether hypoxia inducible transcription factor HIF-1 in combination
with a signal for cellular redox state respond to and thus indicate hypoxia induced by cold
temperatures in fish. Furthermore, we used oxidative stress parameters in vivo as another
signal for a more oxidized cellular redox environment, hypothesized to be involved in the
induction of HIF-1 signaling during acute cold stress and recovery.
The investigation was carried out with a North Sea population of the eurythermal eelpout,
Zoarces viviparus from Helgoland Island, which experiences temperatures as low as 3-4°C
in winter. Also the fishes were shown to be of considerable tolerance to short-term hypoxia
(Fischer et al. 1992) and therefore likely endowed with a well functioning hypoxic
signaling system, possibly involved in cellular signaling not only during hypoxia per se but
also during acute cold stress.
Material & Methods
Experimental design
Summer acclimatized eelpout (Zoarces viviparus) were caught with bottom traps in
shallow waters near the island Helgoland in the German North Sea in June and July 2002.
Animals were kept in flow-through aquaria with filtered North Sea water, under constant
aeration and a natural day-night cycle at 12°C. Prior to experimental treatment the fish

PUBLICATION III
89
were kept for at least 10 days in the aquaria to allow full recovery from handling stress.
Eelpouts were fed pieces of fresh white fish once a week.
To mimic acute cold stress, the animals were transferred to 5°C (at the low limit of
habitat temperatures) and to 1°C (extremely cold) over 2 h. Whereas 50% of the exposed
animals were sacrificed directly following cold exposure, the other 50% were returned to
12°C and allowed to recover for 24 h.
For sampling, fish were narcotized with 0.5 g MS222/L seawater, weighed and killed by
cutting through the spine. Tissue samples were rapidly removed with sterilized scissors,
knifes and forceps, starting with the most metabolically active (liver). Tissue aliquots of
about 100 mg were immediately frozen in liquid nitrogen. Samples were stored at -80°C
prior to analysis. After sampling sex and length of each fish were determined.
Each experimental group comprised 9 - 16 fish. Fish length varied between 18 and 32
cm. Average fish mass was 47.3 ± 28.3 g (max 159.8 g; min 16.1 g).
Determination of thiobarbituric reactive substances (TBARS)
TBARS were determined as a marker of lipid peroxidation by the TBA (thiobarbituric
acid) assay using malondialdehyde-(bis)-acetate (MDA, Merck) as standard (Uchiyama &
Mihara 1978).
Tert-butyl hydroperoxide-initiated chemiluminescence
was measured according to Gonzalez Flecha et al. (1991) as indicator for an imbalance
between pro- and antioxidant processes resulting from depletion of antioxidant compounds
like glutathione, vitamin E and vitamin C. Tissue samples were homogenised in 30 mM
KPi buffer (pH 7.4) containing 120 mM KCl and centrifuged at 600 g for 10 min. The
supernatants were diluted in buffer, containing a final concentration of 3 mM tert-butyl
hydroperoxide and assayed in the dark at room temperature for chemiluminescence in a
liquid scintillation counter (Wallac) in the out-of-coincidence mode, using potassium glass
vials kept in the dark for at least 48 h to avoid vial phosphorescence activation by
fluorescent light. The chemiluminescence data were determined as counts per minute and
were expressed in a tissue specific curve with y = chemiluminescence and x = time. The
area under this curve could be calculated for a time period of 3600 sec using the Mat Lab
program. The results are expressed as arbitrary area units per mg protein over the studied
period.

PUBLICATION III
90
Determination of protein carbonyl content
Carbonyl groups were measured as indication for oxidative damage to proteins according
to Levine et al. (1990). Samples were homogenised in 50 mM HEPES buffer, pH 7.4,
containing 125 mM KCl, 0.6 mM MgSO4, 1.1 mM EDTA, and protease inhibitors (0.5 mg
* ml-1 leupeptine, 0.7 µg * ml-1 pepstatine, 40 µg * ml-1 phenylmethylsulfonyl fluoride, 0.5
µg * ml-1 aprotinin) and centrifuged at 100,000 g for 15 min. Supernatants were incubated
at room temperature for 1 h with 10 mM 2,4-dinitrophenylhydrazine (DNTP) in 2 M HCl.
Blanks were run without DNTP. Afterwards, proteins were precipitated with TCA and
centrifuged for 10 min at 10,000 g. The protein pellet was washed 3 times with
ethanol:ethylacetate (1:1), resuspended in 6 M guanidine hydrochloride, 20 mM potassium
phosphate (pH = 2.3) and incubated at 37°C until complete resuspension. The carbonyl
content could be measured spectrophotometrically at 360 nm (molar extinction coefficient
ε = 22,000 M-1 cm-1).
Determination of reduced (GSH) and oxidized (GSSG) glutathione
The glutathione status represents the most important determinant for the cellular redox
environment (Schafer & Buettner 2001). The content of GSH and GSSG was determined
according to Fariss & Reed (1987). Frozen tissue was ground in liquid nitrogen, and the
resulting powder was homogenised in 1:10 (w:v) pre-cooled PCA (10% containing 2 mM
bathophenantroline-disulphonic acid). After centrifugation at 15,000 g for 5 min at 4°C,
500 µl of the supernatant were mixed with 10 µl pH-indicator (1 mM m-cresol purple
sodium salt containing 0.5 M iodoacetic acid (IAA)) and 50 µl 1 mM γ-glutamyl-glutamate
(in 0.3% PCA) was added as internal standard. The pH was adjusted to 8.5 with 5 M KOH
(containing 0.3 M N-morpholine-propanesulfonic acid). The mixture was incubated at
room temperature for 45 min, to allow binding of IAA to GSH. Subsequently samples were
centrifuged for 5 min at 15,000 g and 4°C. 300 µl of the supernatant were added to the
double amount of 1% 1-fluor-2,4-dinitrobenzene (diluted in 100% ethanol, HPLC grade)
and derivatised in dark vials at room temperature over 24 h. After centrifugation at 7,500 g
for 1 min at 4°C and filtration through 0.2 µm nylon membrane filters, samples were stored
in dark HPLC vials at -20°C.
HPLC determination was carried out on a Beckmann Coulter HPLC System using an
NH2-spherisorp column, 5 µm 240 x 4 mm (Waters, Germany). Solvent A: 80% methanol
and solvent B: sodium acetate stock in 80% methanol (20:80). Sodium acetate stock was
prepared by dissolving 500 g Na-acetate in 224 ml H2O and 695 ml of concentrated HPLC-

PUBLICATION III
91
grade acetic acid. The gradient programme was as follows: 10 min hold at 90% A followed
by a 25 min linear gradient to 25% A at a flow rate of 1 ml * min-1, and 2.3 to 2.8 psi
backpressure. Peaks were recorded with a photodiode array detector at 365 nm.
Concentrations were calculated using 5-point calibration curves for GSH and GSSG
standards processed in the same manner as described for the samples.
As GSSG is formed by oxidation of 2 molecules GSH, total glutathione content was
calculated as the sum (2 GSSG + GSH). Accordingly, the redox ratio of oxidised to
reduced glutathione was expressed as 2 GSSG / GSH.
The redox potential was calculated with the Nernst equation, as given by Schafer &
Buettner (2001), for the different temperatures of maintenance, also considering the
temperature induced changes of intracellular pH (pHi) in fish liver (data taken from Larsen
et al. 1997 and Sartoris et al. 2003).
Determination of enzymatic antioxidants
Superoxide dismutase activity (SOD E.C: 1.15.1.1) was determined according to
Livingstone et al. (1992), using a xanthine oxidase/cytochrome c assay at 20°C and at the
respective stress temperature of each experimental group. 1 Unit SOD reduces the increase
in extinction of superoxide-mediated reduction of oxidized cytochrome c by 50%
(measured at 550 nm).
Glutathione peroxidase activity (GPX) was determined at 20°C in a coupled optical test
according to Günzler & Flohe (1985).
Protein content
The protein content of the samples was determined according to Bradford (1976) using
bovine serum albumin as a standard.
Western blot analysis
Nuclear extraction protocols, developed for rainbow trout cells (Soitamo et al. 2001), are
not applicable to small tissue samples. Thus, EMSA and Western blotting were carried out
with whole cell extracts, prepared as described by Vuori et al. (2004).
50 mg of liver tissues were homogenized in 200 µl buffer C (20 mM HEPES, pH 7.8,
0.42 M NaCl, 1.5 mM MgCl2, 0.2 mM EDTA, 0.5 mM PMSF, 0.5 mM DTT, 25%
glycerol, 2 µg * ml-1 leupeptine, 2 µg * ml-1 antipaine, 2 µg * ml-1 pepstatine, 2 µg * ml-1
aprotinin, 1 mM Na3VO4) and centrifuged at 16,100 g, 30 min, 4°C to remove cell debris.

PUBLICATION III
92
20 µg protein of whole cell extracts per well were run on 7.5% LiDS-PAGE at 40 mA
and transferred to 3 MM nitrocellulose membrane (semi-dry blotting; 1 h; 0.4 A; 13 V).
Membranes were blocked for 1 h at room temperature with 3% non-fat dry milk in PBS
0.3% Tween20, rinsed 3 times for 10 min with PBS 0.3% Tween20 and incubated with the
primary antibody over night at 4°C followed by 1 h at room temperature. Polyclonal
antibodies directed against the N-terminus of rainbow trout HIF-1α as described in
Soitamo et al. (2001) were used in a dilution of 1:2000 in 1% BSA PBS + 0.02% NaN3.
Afterwards, the membranes were washed and incubated for 3 h at room temperature with
horseradish peroxidase conjugated anti-rabbit secondary antibody (Amersham Pharmacia
Biotech), dilution 1:7500 in 3% non-fat dry milk in PBS 0.3% Tween20. After washing the
membranes, the signals were detected by enhanced chemiluminescence (ECL, Amersham
Pharmacia Biotech). Signal intensities of HIF-1α protein bands were calculated from
autoradiographed film, using Chemi-Imager digital camera and software (Alpha Innotech
Co.). Calculation of the % intensity was based on densitometry of gel images, with the sum
of the bands from all experimental groups taken as 100% value.
Electromobility shift assay (EMSA)
Following the fish protocol of Soitamo et al. (2001), the promoter region of the human
erythropoietin (EPO) gene as HIF-sensitive DNA probe (5`-GCCCTACGTGCTGTCTCA-
3`) was used. 5`-endlabeling of the sense strand (2 pmol * µl-1 DNA) was done with 10 U *
µl-1 T4 polynucleotide kinase and 32P-γ-dATP (10% v:v) over 15 min at 37°C. After
removing unincorporated nucleotides by gelfiltration (sephadex G-25), probes were
annealed with 2 pmol * µl-1 antisense strand in 10 mM Tris-HCl, pH 8.0, 1 mM EDTA, 5
mM MgCl2.
EMSA DNA-protein binding reactions were carried out for 30 min on ice in a total
volume of 20 µl, containing 10 µg cell extract, 0.1 µg * µl-1 carrier DNA (poly dI-dC),
DNA binding buffer (10 mM Tris-HCl, pH 7.5, 50 mM KCl, 50 mM NaCl, 1 mM MgCl2, 1
mM EDTA, 5 mM DTT, 5% glycerol), 1 µl 32P-endlabeled DNA probe, 1 µl bromphenol
blue (1.5%). Samples were run on 4% non-denaturating glycerolpolyacrylamide-gel (4%
acrylamide, 1% glycerol, 0.33x TBE buffer (89 mM Tris, 89 mM boric acid, 5 mM
EDTA)). Electrophoresis was performed at 150 V and room temperature, for 2 h in 0.33x
TBE buffer. Dried gels were autoradiographed (Kvietikova et al. 1995). Calculation of the
% intensity was based on densitometry of gel images, with the sum of all bands taken as
100% value.

PUBLICATION III
93
For testing the specificity of the human EPO enhancer by supershift experiments, 1 µl of
polyclonal antibody (against the N-terminus of rainbow trout HIF-1α, see above) was
added to the EMSA reaction mixture with liver extracts from Z. viviparus. In the presence
of the antibody, the EMSA signal was markedly reduced, indicating that antibody
interaction with the HIF-1α subunit minimized specific binding of the HIF-1 dimer to the
EPO probe (Fig. 3.B). Moreover, the signal was erased by previous 15 min incubation of
the reaction mixture with a 2500-fold excess of unlabeled probe prior to addition of the
labeled EPO probe. An excess of mutated EPO probe M18 (5`-
TTGCCCTAAAAGCTGTCTCAG-3`; Gorr et al. 2004) was added to minimize non-
specific (but not HIF) binding (fig. 2.C). In the latter experiment radioactivity was detected
quantified in dried gels with a phosphor storage image system (FLA-5000; Fuji, Tokyo,
Japan) and the AIDA software package (raytest, Straubenhardt, Germany).
Statistics
All values are given as means ± standard deviation. Differences between experimental
groups were analyzed by student’s t-test using Statview 5.0. Significances were evaluated
based on the p-level < 0.05.
Results
Visual behavior recordings during cold stress and recovery
Visual records of swimming behavior included mobility level (active swimming per time
interval) and swim speed when exposed to acute temperature changes. At control
temperature 12°C the animals were continuously active. At 5°C swimming speed was
maintained at the same level, but spontaneous mobility was observed less often. By
contrast, at 1°C, spontaneous mobility was completely abolished and much slower induced
swimming speed was observed than at warmer temperatures. However, directly after
returning cold stressed fishes to 12°C for recovery, swimming performance was not any
different from unstressed control fishes. No fish died during cold exposure or during
recovery from cold exposure.
Antioxidant capacity

PUBLICATION III
94
The entire set of oxidative stress parameters and cellular HIF-1 signaling was determined
in the liver tissue.
Antioxidant enzyme activities (SOD, GPX) in the liver during cold exposure and
recovery are given in tab. 1. Superoxide dismutase (SOD) activity was measured at a
standard temperature of 20°C, and at the respective exposure temperature, to determine the
in vivo superoxide scavenging capacity. Although acute cold exposure to 1°C led to a slight
increase in SOD activity (p = 0.13; measured at 20°C), no significant change in SOD
activity occurred in any group compared to controls. In vivo SOD activity was the same
under all experimental conditions. Due to the limited amount of sample material,
glutathione peroxidase (GPX) activity could only be measured at 20°C. Slightly lower
GPX activities after cold exposure and recovery were not significantly different from
unstressed controls (p > 0.25).
The ratio of oxidized (GSSG) to reduced (GSH) glutathione (fig. 1.A) is an indicator of a
tissue redox environment (Schafer & Buettner 2001). This ratio was significantly decreased
after cold stress at 1°C compared to unstressed controls (p < 0.01). Accordingly, the redox
potential ∆E (fig. 1.B) was more negative (p < 0.01), indicating the tissue to be more
reduced at the low water temperature. Following recovery from 1°C, both, the glutathione
redox ratio and the redox potential returned to control levels. Exposure to 5°C did not
provoke changes of the glutathione redox ratio (p = 0.66), but ∆E still indicates a more
reduced redox environment (p = 0.03) compared to controls, although less negative than
under more severe cold stress (1°C). The total glutathione content was significantly higher
after exposure to 1°C, when compared to 5°C (p = 0.03) and decreased during recovery
from cold stress at 1°C to below control levels (fig. 1.C). These changes in the total
glutathione content and glutathione redox ratio after exposure to 1°C can be explained by
concomitant changes of GSH (fig. 1.D), because the amount of oxidized GSSG (fig. 1.E)
remained unchanged.
Oxidative stress parameters
Fig. 2 presents the changes of oxidative stress parameters in the liver. The tert-butyl
hydroperoxide initiated chemiluminescence rate (fig. 2.A) is an indicator for the imbalance
between pro- and antioxidant processes in a tissue (Gonzalez Flecha et al. 1991) and allows
for the evaluation of the ex vivo susceptibility of lipids to oxidation (Dotan et al. 2004).
TBARS (thiobarbituric reactive substances; fig. 2.B) accumulate during enhanced lipid
peroxidation processes, whereas carbonyls (fig. 2.C) indicate oxidative modifications of

PUBLICATION III
95
proteins. All these parameters indicate unbalanced oxidative stress and are indirect
measures of increased ROS action in a tissue.
Cold stress led to only slightly higher chemiluminescence rates after exposure to 1°C (p =
0.06), mildly elevated TBARS levels after exposure to 1°C (p = 0.08) and 5°C (p = 0.02),
and unchanged carbonyl contents. By contrast, recovery from both cold stress treatments
caused a pronounced increase in TBARS content (p = 0.05 for recovery from 1°C; p < 0.01
for recovery from 5°C). Oxidative protein damage after recovery from both cold stress
situations (p = 0.24 for 1°C, p = 0.19; fig. 2.C) as well as chemiluminescence rates after
recovery following 5°C cold stress (p = 0.09; fig. 2.A) showed the same trend, but were not
significant due to high inter-individual variability.
Taken together the oxidative stress parameters indicate elevated oxidative stress to occur
after recovery from severe (1°C), as well as mild cold stress (5°C).
Hypoxic signaling
Western blot analysis with antibodies raised against rainbow trout HIF-1α confirmed the
expression of the protein in all experimental groups, including unstressed control eelpout
(fig. 3. A). Further, the level of HIF-1α protein did not show any clear temperature
dependence.
The electromobility shift assay (EMSA) detects the DNA binding activity of the HIF-1
dimer to the (human) erythropoietin enhancer. The specificity of the human EPO enhancer
was tested by supershift experiments (Fig. 3.B) and by adding an excess unlabeled probe
(fig. 3.C).
HIF-1 DNA binding was significantly higher after 1°C cold stress (p < 0.01) and returned
to control levels during recovery (p = 0.64). By contrast, 5°C cold stress caused only a
minor increase of HIF-1 DNA binding activity (p = 0.08) compared to control fish, but the
EMSA signal was significantly higher after 24 h recovery from 5°C cold stress (p < 0.01).
Further, HIF-1 DNA binding was generally higher at more reduced glutathione redox ratios
(fig. 4, linear regression, p = 0.03).
PUBLICATION III
96
Discussion
According to the model of oxygen limited thermal tolerance, temperatures outside the
thermal optimum range cause functional hypoxia in ectothermal animals including fish
(Pörtner 2002). In the present study of hypoxia tolerant eelpout, the hypothesis was tested
that short-term cold stress induces hypoxic signaling and that oxidative stress during
recovery indicates tissue reoxygenation after the hypoxic period, mimicking ischemia /
reperfusion events in mammals. We chose a short period (2 h) of acute cold exposure, to
avoid any adaptive shifts in thermal tolerance thresholds. Some adaptive responses to cold
can occur very fast, like changes in the fluidity of the plasma membrane, observed within
6 h in trout hepatocytes after cooling from 20 to 5°C (Williams & Hazel 1994).
Oxidative stress during cold stress and recovery
Similar SOD activities measured at 20°C confirm the absence of any acclimatory processes
within 2 hours of temperature exposure (tab. 1). Unchanged SOD activities measured in
cold exposed fishes at the respective temperature indicate maintenance of in vivo
superoxide scavenging capacities during experimental cold exposure and during recovery.
The compensated in vivo SOD activities underline the general importance of SOD as a
primary enzymatic ROS quencher during stressful cold exposure. Moreover, GPX activity
also remained unchanged in our experiment (tab. 1) and, taken that also winter
acclimatization of Z. viviparus resulted in only minor changes of AOX enzyme activities
(Heise et al., in prep), it seems that the enzymatic antioxidant defense is not be mobilized
to any further extent at low temperatures. ROS scavenging potential is further sustained by
an increase in reduced glutathione levels resulting in a more reduced redox potential under
severe cold stress (1°C; fig. 1.D and B). It may be quicker and less costly for the fish to
increase the production of the low molecular weight antioxidant glutathione during cold
exposure, when energy generating processes are slowed-down, than to newly synthesize
enzymes. Elevated glutathione levels (or increased activities of key antioxidant enzymes)
have been observed in many anoxia/hypoxia tolerant animals in natural situations
reminiscent to ischemia / reperfusion such as anoxia, desiccation or freezing. These
patterns were interpreted as an “anticipatory response” during periods of decreased tissue
PO2, to meet oxidative stress arising during the subsequent tissue reoxygenation (Hermes-
Lima & Zenteno-Savin 2002).

PUBLICATION III
97
In Z. viviparus the more reduced redox state and the increased HIF-1 DNA binding upon
exposure to 1° and 5°C (here HIF-1 enhancer binding increased only insignificantly)
speaks for the onset of temperature induced hypoxia during cold stress (fig. 1. B, 3.D).
During such hypoxic or ischemic events, the mitochondrial respiratory chain, notably
complex III, becomes highly reduced (for review see Acker & Acker 2004, Hermes-Lima
2004). The accumulated electrons than evoke increased ROS formation as the tissue is
reoxygenated (McCord 1988, Turrens et al. 1991, Chi & Karliner 2004). The higher
oxidative stress levels (TBARS, carbonyls) seen in the eelpout during recovery and the
return of the redox potential to more oxidized control values may reflect this
“reoxygenation stress” in Z. viviparus (fig. 2.B, C,1.B). Whereas ischemia / reperfusion is
highly damaging for most mammals, it is not for many anoxia tolerant animals, which
display the “anticipatory AOX response” (Abele 2002, Hermes-Lima & Zenteno-Savin
2002, and Storey & Storey 2004). In these animals induction of antioxidants occurs during
the metabolically depressed and in some cases “torpid” (low body temperature) state.
Maintenance but not anticipatory increase of antioxidant enzyme activities in cold exposed
Z. viviparus, and only mildly elevated oxidative stress parameters during recovery show
that hypoxic stress was not severe in the fishes, consistent with undiminished swimming
performance directly after return to control temperature (12°C). This may be due to the fact
that in this bottom dwelling fish, respiratory slow down at low temperature may minimize
oxygen supply to demand gradients during short-term cold exposure. In this case, HIF-1
DNA binding in an EMSA assay and tissue redox state qualify as very sensitive indicators
for the onset of tissue hypoxia in fish.
HIF-1 during cold stress in fish
The mechanism of degradation and stabilization of HIF-1α seems basically to be the same
in fish and mammals. However, stabilization occurred at much higher oxygen levels in
rainbow trout, i.e. at normoxic venous PO2 (Soitamo et al. 2001). Several redox-sensitive
cysteine residues in the oxygen dependent degradation domain of trout HIF-1α protein may
be involved in this stabilization (Nikinmaa et al. 2004), which are also present in the
Z. viviparus HIF-1α protein (Heise et al., ms submitted). This may also explain our
findings of constitutive HIF-1α protein levels in unstressed, i.e. normoxic Z. viviparus.
Coming to the low temperature response, significant increase of HIF-1 DNA binding was
found upon severe short-term cold exposure to 1°C (this study) as well as upon winter
acclimatization of Z. viviparus (Heise et al., in prep.). Apparently, this represents a

PUBLICATION III
98
common physiological response in this species when exposed to low water temperatures.
This might improve blood flow and oxygen supply to the liver and therewith
counterbalance acute and seasonal temperature effects.
Interestingly, 2 h exposure to mild (5°C) and to severe cold stress (1°C) with or without
24 h recovery at the control temperature 12°C led to different response patterns: HIF-1
DNA binding activity was significantly higher at 1°C and only insignificantly enhanced at
5°C (fig. 3.D). Instead, HIF-1 DNA binding was strongly enhanced after recovery from
5°C. Seemingly, during severe cold stress of 1°C internal oxygen stores will be more
rapidly depleted than at 5°C and, therewith, directly cause a HIF response. By contrast,
upon mild cold stress the HIF response was found delayed to the recovery phase. Clearly, a
mechanistic explanation has to be established.
The cellular oxygen concentration may not be the only factor shaping the HIF response.
Several studies have documented the importance of redox regulation for HIF-1α
stabilization and HIF-1 DNA binding (Huang et al. 1996, Lando et al. 2000, Acker &
Acker 2004 for review). Also for fish (rainbow trout), in vitro studies have demonstrated
increased HIF-1 DNA binding activity as redox conditions become more reduced
(Nikinmaa et al. 2004). Similarly, our data indicate higher HIF-1 DNA binding during cold
exposure, with a more negative cellular redox value (fig. 2.B, 4). This clearly underlines
the suggestion of Nikinmaa & Rees (2005) that any form of oxidative stress may affect the
function of HIF-1.
Temperature itself may also or alternatively act as a HIF regulating factor. Mammalian
studies suggest that upon interaction with HSP90 HIF-1α might be stabilized under
normoxic conditions (Minet et al. 1999, Katschinski et al. 2002). In Crucian carp an
increase of HIF-1 DNA binding on acclimation to reduced temperature was observed, and
was associated with increased levels of HSP70 and 90 (E. Rissanen, H. Numminen,
J. Sollid, G. Nilsson and M. Nikinmaa, unpublished results). Thus, in fish normoxic HIF-1
functions, mediated by interaction with heat shock proteins might be favoured in the cold.
Heat shock proteins, however, are also induced by hypoxia (review by Feder & Hofmann
1999) such that hypoxia and temperature effects may be intertwined. Similar to the results
obtained with eelpout under control conditions, considerable HIF-1α protein levels were
observed in Crucian carp under unstressed, and therefore presumably normoxic conditions.
Nikinmaa & Rees (2005) suggest that HIF-1 may play oxygen-independent roles in fish
physiology. The cross-tolerance concept by Horowitz et al. (2004) also implies that

PUBLICATION III
99
temperature stress and perturbation of oxygen supply and demand, and probably other
environmental stressors may share similar protective pathways.
Conclusions
This study shows the in vivo activation of the transcription factor HIF-1 upon acute cold
exposure as well as during subsequent recovery. It demonstrates the induction of hypoxic
signaling, possibly involved in metabolic reorganization at extremely cold temperatures for
this fish. We further report a more reduced redox environment after cold exposure and an
increase of oxidative stress parameters during recovery from acute cold stress. Thus, this
situation may resemble ischemia / reperfusion events. Moreover, HIF-1 DNA binding in
combination with changes in the cellular redox state may be sensitive markers for
cold-induced hypoxia in tissues.
Acknowledgements
The authors thank Andreas Wagner for technical support on Helgoland and Birgit
Obermüller for her help with sampling of fish. We further thank Hanna Numminen, Eeva
Rissanen, Kristiina Vuori and Saijaliisa Pursiheimo for their laboratory support. This study
was supported by grants from Deutscher Akademischer Austauschdienst (DAAD) to KH.
References
Abele, D. (2002). The radical life-giver. Nature 420, 27.
Acker, T. and Acker, H. (2004). Cellular oxygen sensing need in CNS function:
physiological and pathological implications. J. Exp. Biol. 207, 3171-3188.
Bradford, M.M. (1976). A rapid and sensitive method for the quantification of microgram
quantities of protein utilizing the principle of protein-dye binding. Analyt. Biochem. 71,
248-254, 1976.

PUBLICATION III
100
Chi, N.C. and Karliner, J.S. (2004). Molecular determinants of responses to myocardial
ischemia / reperfusion injury: focus on hypoxia-inducible and heat shock factors.
Cardiovasc. Res. 61, 437-447.
Cockman, M.E., Masson, N., Mole, D.R., Jaakkola, P., Chan, G.W., Clifford, S.C.,
Maher, E.R., Pugh, C.W., Ratcliffe, P.J. and Maxwell, P.H. (2000). Hypoxia inducible
factor-alpha binding and ubiquitylation by the von Hippel-Lindau (VHL) tumor suppressor
protein. J. Biol. Chem. 275, 25733-25741.
Czubryt, M.P., Panagia, V. and Pierce, G.N. (1996). The roles of free radicals, peroxides
and oxidized lipoproteins in second messenger system dysfunction. EXS 76, 57-69.
Dotan, Y., Lichtenberg, D. and Pinchuk, I. (2004). Lipid peroxidation cannot be used as
a universal criterion of oxidative stress. Prog. Lipid Res. 43, 200-227.
Ehleben, W., Bölling, B., Merten, E., Porwol, T., Strohmaier, A.R. and Acker, H.
(1998). Cytochromes and oxygen radicals as putative members of the oxygen sensing
pathway. Respir. Physiol. 114, 25-36.
Ema, M., Hirota, K., Mimura, J., Abe, H., Yodoi, J., Sogawa, K., Poellinger, L. and
Fujii-Kuriyama, Y. (1999). Molecular mechanisms of transcription activation by HLF and
HIF-1α in response to hypoxia: their stabilization and redox signal-induced interaction with
CBP/p300. EMBO J. 18, 1905-1914.
Erecińska, M. and Silver, I.A. (2001). Tissue oxygen tension and brain sensitivity to
hypoxia. Respir. Physiol. 128, 263-276.
Fandrey, J. (2004). Oxygen-dependent and tissue-specific regulation of erythropoietin
gene expression. Am. J. Physiol. Regul. Integr. Comp. Physiol. 286, R977-R988.
Fariss, M.W. and Reed, D.J. (1987). High-performance liquid chromatography of thiols
and disulfides: diphenol derivatives. Meth. Enzymol. 143, 101-109.

PUBLICATION III
101
Feder, M.E. and Hofmann, G.E. (1999). Heat-shock proteins, molecular chaperones, and
the stress response: evolutionary and ecological physiology. Annu. Rev. Physiol. 61, 243-
282.
Fischer, P., Rademacher, K. and Kils, U. (1992). In situ investigations on the respiration
and behaviour of the eelpout Zoarces viviparus under short-term hypoxia. Mar. Ecol. Prog.
Ser. 88, 181-184.
Genius, J. and Fandrey, J. (2000). Nitric oxide affects the production of reactive oxygen
species in hepatoma cells: implications for the process of oxygen sensing. Free Rad. Biol.
Med. 29, 515-521.
Gonzalez Flecha, B., Llesuy, S and Boveris, A. (1991). Hydroperoxide-initiated
chemiluminescence: An assay for oxidative stress in biopsies of heart, liver, and muscle.
Free Rad. Biol. Med. 10, 93-100.
Gorr, T.A., Tomita, T., Wappner, P. and Bunn, F. H. (2004). Regulation of Drosophila
Hypoxia-inducible factor (HIF) activity in SL2 cells. J. Biol. Chem. 279, 36048-36058.
Görlach, A., Brandes, R.P., Bassus, S., Kronemann, N., Kirchmaier, C.M., Busse, R.
and Schini-Kerth, V.B. (2000). Oxidative stress and expression of p22phox are involved
in the up-regulation of tissue factor in vascular smooth cells in response to activated
platelets. FASEB J. 14, 1518-1528.
Günzler, W.A. and Flohe, L. (1985). Glutathione peroxidase. In: CRC handbooks of
methods for oxygen radical research, edited by Greenwald RA. Boca Raton: CRC Press
Inc., p. 285-289.
Haddad, J.J.E., Olvers, R.E. and Land, S.C. (2000). Antioxidant/pro-oxidant
equilibrium regulates HIF-1α and NF-κB redox sensitivity. J. Biol. Chem. 275, 21130-
21139.
Haddad, J.J. and Land, S.C. (2001). A non-hypoxic, ROS-sensitive pathway mediates
TNF-alpha-dependent regulation of HIF-1 alpha. FEBS Lett. 505, 269-274.

PUBLICATION III
102
Heise, K., Lucassen, M. and Abele D. The hypoxia inducible factor (HIF-1α) in cold-
adapted Antarctic fishes. Biochim. Biophys. Acta – Gene Struct. Expr., MS submitted.
Heise, K., Estevez, M.S., Puntarulo, S., Galleano, M., Nikinmaa, M., Pörtner, H.O.
and Abele, D. Changes in oxidative stress parameters and activation of hypoxia inducible
factor (HIF-1) at different environmental temperatures in polar and temperate zoarcid fish.
Ms in prep.
Hermes-Lima, M. and Zenteno-Savin, T. (2002). Animal response to drastic changes in
oxygen availability and physiological oxidative stress. Comp. Biochem. Physiol. 133C,
537-556.
Hermes-Lima, M. (2004.) Oxygen in biology and biochemistry: Role of free radicals. In:
K.B. Storey (ed.), Functional metabolism: Regulation and adaptation (pp. 319-368).
Hooken: Wiley-Liss.
Horowitz M., L. Eli-Berchoer, I. Wapinski, N. Friedman and E. Kodesch. (2004.)
Stress related genomic responses during the course of heat acclimation and its association
with ischemia / reperfusion cross-tolerance. J. Appl. Physiol. 97, 1496-1507.
Huang, L.E., Arany, Z., Livingston, D.M. and Bunn, H.F. (1996). Activation of
hypoxia-inducible transcription factor depends primarily upon redox-sensitive stabilization
of its α subunit. J. Biol. Chem. 50, 32253-32259.
Ivan, M., Kondo, K., Yang, H., Kim, W., Valiando, J., Ohh, M., Salic, A., Asara, J.M.,
Lane, W.S. and Kaelin, W.G. Jr. (2001). HIFα targeted for VHL-mediated destruction by
proline hydroxylation: implications for O2 sensing. Science 292, 464-468.
Jaakkola, P., Mole, D.R., Tian, Y.M., Wilson, M.J., Gielbert, J., Gaskell, S.J., von
Kriegsheim, A., Hebestreit, H.F., Mukherij, M., Schofield, C.J., Maxwell, P.H., Pugh,
C.W. and Ratcliffe, P.J. (2001). Targeting of HIF-1α to the von Hippel-Lindau
ubiquitylation complex by O2-regulated prolyl hydroxylation. Science 292, 468-472.

PUBLICATION III
103
Jiang, B.-H., Semenza, G.L., Bauer, C. and Marti, H.H. (1996). Hypoxia-inducible
factor 1 levels vary exponentially over a physiologically relevant range of O2 tension. Am.
J. Physiol. 271, C1172-C1180.
Kallio, P.J., Wilson, W.J., O’Brian, S., Makino, Y. and Poellinger, L. (1999).
Regulation of the hypoxia-inducible transcription factor 1 α by the ubiquitine proteasome
pathway. J. Biol. Chem. 274, 6519-6525.
Katschinski, D.M., Le, L., Heinrich, D., Wagner, K.F., Hofer, T. Schindler, S.G., and
Wenger, R.H. (2002). Heat induction of the unphosphorylated form of hypoxia-inducible
factor-1α is dependent on heat shock protein-90 activity. J. Biol. Chem. 277, 9262-9267.
Kvietikova, I., Wenger, R.H., Marti, H.H. and Gassmann, M. (1995). The transcription
factors ATF-1 and CREB-1 bind constitutively to the hypoxia-inducible factor-1 (HIF-1)
DNA recognition site. Nuclear Acids Res. 23, 4542-4550.
Lando, D., Pongratz, I., Poellinger, L. and Whitelaw, M.L. (2000). A redox mechanism
controls differential DNA binding activities of hypoxia-inducible factor (HIF) 1α and the
HIF-like factor. J. Biol. Chem. 275, 4618-4627.
Lannig, G., Bock, C., Sartoris, F.J. and Pörtner, H.O. (2004). Oxygen limitation of
thermal tolerance in cod, Gadus morhua L., studied by magnetic resonance imaging and
on-line venous oxygen monitoring. Am. J. Physiol. Regul. Intergr. Comp. Physiol. 287,
R902-R910.
Larsen, B.K., Pörtner, H.O. and Jensen F.B. (1997). Extra- and intracellular acid-base
balance and ionic regulation in cod (Gadus morhua) during combined and isolated
exposures to hypercapnia and copper. Mar. Biol. 128, 337-346.
Levine, R.L., Garland, D., Oliver, C.N., Amici, A., Climent, I., Lenz, A.G., Ahn, B.W.,
Shaltiel, S. and Stadtman, E.R. (1990). Determination of carbonyl content in oxidatively
modified proteins. Meth. Enzymol. 186, 464-485.

PUBLICATION III
104
Liu, Q., Bechner-Pfannschmidt, U., Möller, U., Brecht, M., Wotzlaw, C., Acker, H.,
Jungermann, K. and Kietzmann, T. (2004). A Fenton reaction at the endoplasmic
reticulum is involved in the redox control of hypoxia-inducible gene expression. Proc. Nat.
Acad. Sci. 101, 4302-4307.
Livingstone, D.R., Lips, F., Garcia Martinez, P. and Pipe, R.K.. (1992). Antioxidant
enzymes in the digestive gland of the common mussel Mytilus edulis. Mar. Biol. 112, 265-
276.
Mark, F.C., Bock, C. and Pörtner, H.O. (2002). Oxygen-limited thermal tolerance in
Antarctic fish investigated by MRI and 31P-MRS. Am. J. Physiol. Regul. Integr. Comp.
Physiol. 283, R1254-R1262.
Massabuau, J.C. (2003). Primitive, and protective, our cellular oxygenation status? Mech.
Ageing Develop. 124, 857-863.
Masson, N., William, C., Maxwell, P.H., Pugh, C.W. and Ratcliffe, P.J. (2001).
Independent function of two destruction domains in hypoxia-inducible factor-α chains
activated by prolyl hydroxylation. EMBO J. 20, 5197-5206.
McCord, J.M. (1988). Free radicals and myocardial ischemia: overview and outlook. Free
Rad. Biol. Med. 4, 9-14.
Minet, E., Motter, D., Michel, G., Roland, I., Raes, M., Remacle, J., and Michiels, C.
(1999). Hypoxia-induced activation of HIF-1: role of HIF-1α-Hsp90 interaction. FEBS
Lett. 460, 251-256.
Nikinmaa, M., Pursiheimo, S. and Soitamo, A.J. (2004). Redox state regulates HIF-1α
and its DNA binding and phosphorylation in salmonid cells. J. Cell Sci. 117, 3201-3206.
Nikinmaa, M. and Rees, B.B. (2005). Oxygen-dependent gene expression in fishes. Am. J.
Physiol. Regul. Integr. Comp. Physiol. 288, R1079-R1090. .

PUBLICATION III
105
Pörtner, H.O. (2002). Climate variations and the physiological basis of temperature
dependent biogeography: systemic to molecular hierarchy of thermal tolerance in animals.
Comp. Biochem. Physiol. 132A, 739-761.
Pörtner, H.O., Mark, F.C. and Bock, C. (2004). Oxygen limited thermal tolerance in
fish? Answers obtained by nuclear magnetic resonance techniques. Respir. Physiol.
Neurobiol. 141, 243-260.
Sartoris, F.J., Bock, C. and Pörtner, H.O. (2003). Temperature-dependent pH regulation
in eurythermal and stenothermal marine fish: an interspecies comparison using 31P-NMR.
J. Thermal Biol. 28, 363-371.
Schafer, F.Q. and Buettner, G.R. (2001). Redox environment of the cell as viewed
through the redox state of the glutathione disulfide/glutathione couple. Free Rad. Biol.
Med. 30, 1191-1212.
Semenza, G.L. (2002). Signal transduction to hypoxia-inducible factor 1. Biochem.
Pharmacol. 64, 993-998. 2002.
Sies, H. (1985). Oxidative Stress: Introductory remarks. In: Oxidative Stress, edited by Sies
H. London, New York: Academic Press, Harcourt Brace Jovanovich Publishers, p. 1-8.
Soitamo, A.J., Rabergh, C.M.I., Gassmann, M., Sistonen, L. and Nikinmaa, M. (2001).
Characterization of a hypoxia-inducible factor (HIF-1α) from rainbow trout. J. Biol. Chem.
276, 19677-19705.
Storey, K.B. and Storey, L.M. (2004). Biochemical adaptation to extreme environments.
In: Integrative Physiology: In the Proteomics and Post-Genomics Age, edited by Walz, W.
Totowa: Humana Press Inc, p. 169-200.
Turrens, J.F., Beconi, M., Barilla, J., Chavez, U.B. and McCord, J.M. (1991).
Mitochondrial generation of oxygen radicals during reoxygenation of ischemic tissues.
Free Rad. Res. Commun. 12-13, 681-689.

PUBLICATION III
106
Uchiyama, M and Mihara, M. (1978). Determination of malonaldehyde precursor in
tissues by thiobarbituric acid test. Analyt. Biochem. 86, 271-278.
Vuori, K.A.M., Soitamo. A., Vuorinen, P.J. and Nikinmaa, M. (2004). Baltic salmon
(Salmo salar) yolk-sac fry mortality is associated with disturbances in the function of
hypoxia-inducible transcription factor (HIF-1α) and consecutive gene expression. Aquat.
Toxicol. 68, 301-313.
Williams, E.E. and Hazel, J.R. (1994). Membrane fluidity and hemilayer temperature
sensitivity in trout hepatocytes during brief in vitro cold exposure. Am. J. Physiol. 266,
R773-R780.

PUBLICATION III
107
Tables
Table 1
Antioxidant enzyme activities in Z. viviparus liver after 2 h cold exposure to 1 and 5°C as well as after 24 h recovery
from cold exposure.
Superoxide dismutase (SOD) activities were measured at 20°C and at respective stress temperature; glutathione
peroxidase (GPX) activities were measured at 20°C. Means ± standard deviation, n = 3-5, p < 0.05. ww = wet weight.
unstressed 1°C 1°C recovery. 5°C 5°C recovery SOD activity at 20°C (U * g ww-1)
2000 ± 700 3100 ± 1200
2200 ± 1000 1700 ± 500 1700 ± 500
SOD activity at stress temperature (U * g ww-1)
1800 ± 500 1500 ± 200 1500 ± 500 2000 ± 800 1500 ± 300
GPX activity at 20°C (U * g ww-1)
4.3 ± 2.2 2.4 ± 2.4 2.5 ± 1.9 3.2 ± 1.1 3.1 ± 1.4

PUBLICATION III
108
Figures Figure 1
Glutathione redox chemistry in Z. viviparus liver samples after 2 h cold exposure to 1 and 5°C as well as after 24 h
recovery (recov.) from cold exposure.
A: Glutathione redox ratio (2GSSG/GSH), B: redox potential ∆E at in situ temperature and in situ intracellular pH
(adopted from Sartoris et al. (2003), Larsen et al. (1997)) calculated after Schaffer & Buettner (2001), C: total glutathione
content (2GSSG+GSH), D: content of reduced glutathione (GSH), E: content of oxidized glutathione (GSSG), Means ±
standard deviation, n = 4-7, * = significantly different from the unstressed group, # = significant difference to the
respective recovery group, p < 0.05. ww = wet weight.
unstressed 1°C 1°C recov. 5°C 5°C recov.
glut
athi
one
redo
x ra
tio (2
GSS
G/G
SH)
0.0
0.1
0.2
0.3
0.4
0.5
0.6
* #
A
unstressed 1°C 1°C recov. 5°C 5°C recov.
redo
x po
tent
ial ∆
E (m
V)
-300
-275
-250
-225
-2000
**
B
unstressed 1°C 1°C recov. 5°C 5°C recov.
tota
l glu
tath
ione
con
tent
(2G
SSG
+GSH
; µm
ol *
g w
w-1
)
0.0
0.2
0.4
0.6
0.8
1.0
1.2
1.4
1.6
1.8
#C
unstressed 1°C 1°C recov. 5°C 5°C recov.
GSH
con
tent
(µm
ol *
g w
w-1
)
0.0
0.2
0.4
0.6
0.8
1.0
1.2
1.4 #D
unstressed 1°C 1°C recov. 5°C 5°C recov.
GSS
G c
onte
nt (µ
mol
* g
ww
-1)
0.00
0.05
0.10
0.15
0.20
0.25E

PUBLICATION III
109
Figure 2
Oxidative stress markers in Z. viviparus liver samples after 2 h cold exposure to 1 and 5°C as well as after 24 h recovery
(recov.) from cold exposure.
A: tert-butyl hydroperoxide initiated chemiluminescence indicating imbalance between pro- and antioxidant processes, B:
content of thiobarbituric reactive substances (TBARS) indicating lipid peroxidation, C: carbonyl content indicating
protein oxidation. Means ± standard deviation, n = 3-6, * = significantly different from the unstressed group, # =
significant difference to the respective recovery group, p < 0.05. ww = wet weight.
unstressed 1°C 1°C recov. 5°C 5°C recov.
TBA
RS
cont
ent (
µmol
* g
ww
-1)
0.0
0.5
1.0
1.5
2.0
2.5
*
*
#
B
unstressed 1°C 1°C recov. 5°C 5°C recov.
chem
ilum
ines
cenc
e (a
rea
* 108 *
mg
prot
ein-1
)
0.0
0.2
0.4
0.6
0.8
1.0
1.2
1.4
A
unstressed 1°C 1°C recov. 5°C 5°C recov.
carb
onyl
con
tent
(nm
ol C
O *
mg
prot
ein-1
)
0
1
2
3
4
5
#
C

PUBLICATION III
110
Figure 3
HIF-1 in Z. viviparus whole cell extracts from the liver after 2 h cold exposure to 1 and 5°C as well as after 24 h recovery
(recov.) from cold exposure.
A: Representative Western blot with antibodies against HIF-1α protein, B: electromobility shift assay (EMSA)
demonstrating HIF-1 DNA binding to the human erythropoietin enhancer: Addition of polyclonal antibody directed
against the N-terminus of rainbow trout HIF-1α to the reaction mixture in lane 2 and 4 diminished the EMSA signal in
liver whole cell extracts from Z. viviparus compared to reaction mixtures without antibody (lane 1 and 3) indicating that
the fish HIF-1 bound to the human EPO enhancer, C: addition of an excess of unlabeled EPO probe completely erased the
signal, addition of a mutated EPO probe M18 reduced the unspecific signal. Lane 1: control signal with labeled EPO
probe, lane 2: labeled EPO probe + 2500-fold excess of unlabeled EPO probe, lane 3 labeled EPO probe + mutated EPO
probe M18, lane 4: labeled EPO probe + 2500-fold excess of unlabeled EPO probe + mutated EPO probe M18, D: signal
intensity of HIF-1 DNA binding in electromobility shift assays in unstressed, 1°C, 1°C recovery, 5°C and 5°C recovery
exposed Z. viviparus. Means ± standard deviation, n = 4-5, * = significantly different from the unstressed group, # =
significant difference to the respective recovery group, p < 0.05.
unstressed 1°C 1°C recov. 5°C 5°C recov.HIF
-1 D
NA
bin
ding
act
ivity
(EM
SA s
igna
l int
ensi
ty; %
)
0
2
4
6
8
10
12
14
16
*
*
#
D

PUBLICATION III
111
Figure 4
Higher HIF-1 DNA binding activity occurred at a more reduced glutathione redox ratio in liver samples from Z. viviparus
(linear regression, y = -9.9 x + 12.8, R² = 0.2, n = 22, p < 0.05, Statview 5.0).
glutathione redox ratio (2GSSG/GSH)
0.0 0.1 0.2 0.3 0.4 0.5 0.6 0.7HIF
-1 D
NA
bin
ding
act
ivity
(EM
SA s
igna
l int
ensi
ty; %
)
0
2
4
6
8
10
12
14
16
18

PUBLICATION III
112

PUBLICATION IV
113
Publication IV:
JOURNAL OF EXPERIMENTAL BIOLOGY
Oxidative stress and HIF-1 DNA binding during stressful temperatures and
recovery in the North Sea eelpout (Zoarces viviparus)
Part B: heat stress
Katja Heise1, Susana Puntarulo2, Mikko Nikinmaa3, Doris Abele1, and Hans-O. Pörtner1
Author affiliations: 1 Alfred-Wegener Institute for Polar and Marine Research, Physiology of Marine Animals,
Am Handelshafen 12, 27570 Bremerhaven, Germany 2 Physical Chemistry-PRALIB, School of Pharmacy and Biochemistry, University of
Buenos Aires, Junin 956, C 1113 AAD Buenos Aires, Argentina 3 Laboratory of Animal Physiology, Department of Biology, University of Turku,
FIN20014 Turku, Finland
Corresponding author:
Doris Abele
Alfred-Wegener Institute for Polar and Marine Research
Physiology of Marine Animals
Am Handelshafen 12
27570 Bremerhaven
Germany
Ph: ++49 471 4831 1567, Fax: ++49 471 4831 1311
E-mail: [email protected]

PUBLICATION IV
114
Abstract
The interplay between antioxidants, heat shock proteins and hypoxic signaling is supposed
to be important for passive survival of critical temperature stress, e.g. during unfavorable
conditions in hot summers. We investigated the effect of mild (18°C), critical (22°C) and
severe (26°C) experimental heat stress, assumed to induce different degrees of functional
hypoxia, as well as the effect of recovery following heat stress on these parameters in liver
samples of the common eelpout Zoarces viviparus.
Upon heat exposure to critical and higher temperatures we found an increase in oxidative
damage markers such as TBARS (thiobarbituric reactive substances) and a more oxidized
glutathione redox milieu, combined with reduced activities of the antioxidant enzyme SOD
at 26°C. Together, this points to higher oxidative stress levels during hyperthermia.
Moreover, heat-induced hypoxia and subsequent reoxygenation upon recovery had
comparable effects as ischemia / reperfusion events in mammals, as indicated by increased
protein oxidation and chemiluminescence rates within the first 12 hours upon recovery. A
recovery-time series experiment revealed that the onset of oxidative damage repair
occurred faster during recovery from heat than recently reported for recovery from cold
stress.
HSP70 levels were found only slightly elevated after recovery from sub-lethal heat
stress, indicating minor importance of the heat shock response in this species. The DNA
binding activity of the hypoxia inducible transcription factor (HIF-1) was elevated only
during mild heat exposure (18°C), but appeared impaired at more severe heat stress. We
suppose that the more oxidized redox state during extreme heat may interfere with the
hypoxic signaling response.
Key words:
Hyperthermia, heat shock proteins, oxidative stress, redox state, hypoxia inducible factor,
temperate fish

PUBLICATION IV
115
Introduction
Exposure of cold blooded marine animals to elevated temperatures accelerates
mitochondrial respiration and has been shown to increase mitochondrial reactive oxygen
species (ROS) formation (Heise et al. 2003, Keller et al. 2004). Excess ROS production by
intensively respiring mitochondria is held responsible for cellular damage expected upon
exposure of an ectotherm to warming (hyperthermia) and heat stress (Abele et al. 1998,
2002).
On the other hand, as more oxygen is consumed in peripheral tissues under severe
thermal stress, limitation of oxygen supply to central tissues can occur, and provoke a state
of thermally induced transient hypoxia. Onset of heat-induced hypoxia in body fluids and
tissues has been found as animals were warmed beyond their pejus temperatures (Tp),
indicating the limits of the species specific thermal optimum range. These findings have
led to the concept of oxygen and capacity limited thermal tolerance (for review see Pörtner
2002). In fish, capacity limits of cardiac performance account for progressive mismatch
between oxygen supply and demand in the whole animal during warming (Mark et al.
2002, Farrell 2002, Lannig et al. 2004). The decline in cardiac performance could reflect
problems with the hearts own oxygen supply (Farrell 2002). Oxygen extraction by working
skeletal muscle during exercise would further increase oxygen demand at high
temperatures. When a critical temperature (Tc) is reached, aerobic scope for activity
disappears and mitochondria progressively switch to anaerobic energy production, which
allows only time limited survival (Zielinski & Pörtner 1996, Sommer et al. 1997, reviewed
in Pörtner 2002).
Complications can result, when oxygen deprived tissues are re-oxygenated, a situation
which resembles ischemia / reperfusion in mammalian tissues (Jones 1986, McCord 1988,
Erecinska & Silver 2001, Chi & Karliner 2004). Elevated ROS formation may thus not
only result as a consequence of stressful hyperthermia, but also as a consequence of
reoxygenation during recovery (Halliwell & Gutteridge 1999).
There is likely considerable overlap between hypoxic signaling, the heat shock response,
and oxidative stress during stressful warming (cf. Pörtner 2002). Ischemia / reperfusion
and ROS production are known to induce heat shock protein (HSP) transcription and
synthesis in mammalian cells and to play a common denominator role for both pro- and
anti-apoptotic processes under hyperthermia (Flanagan et al. 1998, Katschinski et al. 2000,
Skulachev 2001, King et al. 2002, Kregel 2002). Therefore, short-term tolerance to

PUBLICATION IV
116
oxidative stress provided by an effective antioxidant system (Abele & Puntarulo 2004), as
well as up-regulation of HSPs, mediating the refolding of heat-damaged proteins, may
support survival under heating (Moseley 1997, Pörtner 2002).
Moreover, the transcription factor HIF-1 (hypoxia inducible factor), which activates
genes involved in angiogenesis, erythropoiesis and glucose metabolism (for review see
Wenger 2000, Semenza 2004) has been shown to be functional for heat acclimation of
C. elegans (Treinin et al. 2003). Loss of the HIF-1 gene abolished heat resistance despite
of an up-regulation of HSP72 in the nematode model and metabolic reorganization
mediated by HIF-1 could thus contribute to ameliorate the temperature induced oxygen
limitation upon (sub)-critical warming. Although the causal link between heat and hypoxia
resistance may relate to the onset of functional hypoxia during stressful heating as
demonstrated for marine fishes, clear evidence supporting this mechanistic link has still to
be elaborated.
The common eelpout is a eurythermal marine fish which offers an appropriate model-
system to study the interdependence of oxidative stress, hypoxic signaling and HSP
expression under high temperature stress. Acclimation to and stress response at high
temperatures and heat-induced hypoxia is well studied in this animal (Zakhartsev et al.
2003, Pörtner et al. 2004). The critical temperature, where anaerobic energy production
sets in was found to range between 22 and 24°C (Van Dijk et al. 1999). Graded short-term
exposure to temperatures, mildly and severely elevated over the control temperature
should, therefore, allow to distinguish between the effect of hyperthermia and the
combination of heat and functional hypoxia beyond the critical temperature limit. All
parameters were determined in the liver tissue, which has been reported to be the most
sensitive organ to synthesize HSP70 in response to hyperthermia (King et al. 2002) and
also to suffer from temperature induced oxygen limitation (Van Dijk et al. 1999).
Material & Methods
Experimental design:
A) Graded heat stress and 24 h recovery
Summer acclimatized eelpout (Zoarces viviparus) were caught with bottom traps in
shallow waters near the island Helgoland in the German North Sea in June and July 2002.
Animals were kept in flow-through aquaria with filtered North Sea water under constant

PUBLICATION IV
117
aeration and a natural day-night cycle at 12°C. Before the experimental phase, the fishes
were kept at least for 10 days in the aquaria to recover from handling stress. Eelpouts were
fed pieces of fresh white fish once a week.
To mimic acute heat stress, the animals were transferred to 18°C, the high temperature
limit in the habitat, which is above Tp (Zakhartsev et al. 2003), as well as to 22°C, which
according to Van Dijk et al. (1999) is the critical temperature (Tc) and eventually to 26°C
which represents extreme heat stress, where the animals are close to the onset of loss of
equilibrium at 27-28°C (Zakhartsev et al. 2003). Exposure time was limited to 2 h.
Following heat exposure, 50% of the animals were directly sacrificed, whereas the other
half was returned to 12°C and allowed to recover for 24 h.
For tissue sampling, fishes were narcotized with 0.5 g MS222/L seawater, weighed and
killed by cutting through the spine. Tissues were rapidly removed, starting with the most
metabolically active (liver) and aliquots of 100 mg immediately frozen in liquid nitrogen.
Samples were stored at -80°C prior to analysis. After sampling sex and length of each fish
were determined.
Each experimental group comprised 12 - 16 fish. Fish length varied between 18 and
26 cm (21.5 ± 2.6). Average fish mass was 40.2 ± 20.8 g (max 132 g; min 16 g).
B) Recovery time series
For a second experimental series we tested the effects of different recovery times in order
to assess a potentially time dependent maximum of reoxygenation stress. Zoarces viviparus
were caught near the island Helgoland in September 2003 and transported to the Alfred-
Wegener Institute two weeks prior to experimentation, where the fish were kept at 10°C in
natural sea water with constant aeration and a day-night cycle of 12 h. Fish were fed live
shrimp once a week. Animals were exposed only to 18°C over 2 h to induce thermal stress
followed by 0 h, 2 h, 8 h or 12 h recovery at control temperature (10°C). Samples were
taken as described above. Each experimental group comprised 6 - 8 fish. Fish length varied
between 20 and 27 cm (23.6 ± 2.7). Average fish mass was 50.4 ± 22.2 g (113 g max; 17 g
min.).
Determination of thiobarbituric reactive substances (TBARS)
TBARS were determined as a marker of lipid peroxidation by the TBA (thiobarbituric
acid) assay using malondialdehyde-(bis)-acetate (MDA, Merck) as standard (Uchiyama &
Mihara 1978).

PUBLICATION IV
118
Tert-butyl hydroperoxide (tBOOH)-initiated chemiluminescence
was measured according to Gonzalez Flecha et al. (1991) as indicator for an imbalance
between pro- and antioxidant processes resulting from depletion of antioxidant compounds
like glutathione, vitamin E and vitamin C. Tissue samples were homogenised in 30 mM
KPi buffer (pH 7.4) containing 120 mM KCl and centrifuged at 600 g for 10 min. The
supernatants were diluted in buffer, containing a final concentration of 3 mM tert-butyl
hydroperoxide and assayed in the dark at room temperature for chemiluminescence (counts
per minute) in a liquid scintillation counter (Wallac) in the out-of-coincidence mode, using
potassium glass vials kept in the dark for at least 48 h to avoid vial phosphorescence
activation by fluorescent light. The chemiluminescence data were determined as counts per
minute and were expressed in a tissue specific curve with y = chemiluminescence and x =
time. The area under this curve could be calculated for a time period of 3600 sec using the
Mat Lab program. The results are expressed as arbitrary area units per mg protein over the
studied period.
Determination of protein carbonyl content
Carbonyl groups were measured as indication for oxidative damage to proteins according
to Levine et al. (1990). Samples were homogenised in 50 mM HEPES buffer, pH 7.4,
containing 125 mM KCl, 1.1 mM EDTA, 0.6 mM MgSO4 and protease inhibitors
(0.5 mg * ml-1 leupeptine, 0.7 µg * ml-1 pepstatine, 40 µg * ml-1 phenylmethylsulfonyl
fluoride, 0.5 µg * ml-1 aprotinin) and centrifuged at 100,000 g for 15 min. Supernatants
were incubated at room temperature for 1 h with 10 mM 2,4-dinitrophenylhydrazine
(DNTP) in 2 M HCl. Blanks were run without DNTP. Afterwards, proteins were
precipitated with TCA and centrifuged for 10 min at 10,000 g. The protein pellet was
washed 3 times with ethanol:ethylacetate (1:1), resuspended in 6 M guanidine
hydrochloride in 20 mM potassium phosphate (pH = 2.3) and incubated at 37°C until
complete resuspension. The carbonyl content could be measured spectrophotometrically at
360 nm (molar extinction coefficient ε = 22,000 M-1 cm-1).
Determination of reduced (GSH) and oxidized (GSSG) glutathione
The glutathione status represents the most important determinant for the cellular redox
environment (Schafer & Buettner 2001). The content of GSH and GSSG was determined
according to Fariss & Reed (1987). Frozen tissue was ground in liquid nitrogen and the
resulting powder homogenised in 1:10 (w:v) pre-cooled PCA (10% containing 2 mM

PUBLICATION IV
119
bathophenantroline-disulphonic acid). After centrifugation at 15,000 g for 5 min at 4°C,
500 µl of the supernatant were mixed with 10 µl pH-indicator (1 mM m-cresol purple
sodium salt containing 0.5 M iodoacetic acid (IAA)). 50 µl 1 mM γ-glutamyl-glutamate (in
0.3% PCA) was added as internal standard. The pH was adjusted to 8.5 with 5 M KOH
(containing 0.3 M N-morpholine-propanesulfonic acid). The mixture was incubated at
room temperature for 45 min, to allow IAA to bind to GSH. Subsequently samples were
centrifuged for 5 min at 15,000 g at 4°C. 300 µl of the supernatant were added to the
double amount of 1% 1-fluor-2,4-dinitrobenzene (diluted in 100% ethanol, HPLC grade)
and derivatised in dark vials at room temperature over 24 h. After centrifugation at 7,500 g
for 1 min at 4°C and filtration through 0.2 µm nylon membrane filters, samples were stored
in dark HPLC vials at -20°C.
HPLC determination was carried out on a Beckmann Coulter HPLC System using a
NH2-spherisorp column, 5 µm 240 x 4 mm (Waters, Germany). Solvent A: 80% methanol
and solvent B: sodium acetate stock in 80% methanol (20:80). Sodium acetate stock was
prepared by dissolving 500 g Na-acetate in 224 ml Milli-Q water and 695 ml of
concentrated HPLC-grade acetic acid. The gradient programme was as follows: 10 min
hold at 90% A followed by a 25 min linear gradient to 25% A at a flow rate of
1 ml * min-1, and 2.3 to 2.8 psi backpressure. Peaks were recorded with a photodiode array
detector at 365 nm. Concentrations were calculated using 5-point calibration curves for
GSH and GSSG standards processed in the same manner as described for the samples.
As GSSG is formed by oxidation of 2 molecules GSH, total glutathione content was
calculated as the sum (2 GSSG + GSH). Accordingly, the redox ratio of oxidised to
reduced glutathione was expressed as 2 GSSG / GSH.
The redox potential was calculated with the Nernst equation, as given by Schafer &
Buettner (2001), for the different temperatures of maintenance, also considering the
temperature induced changes of intracellular pH (pHi) in fish liver (data taken from Larsen
et al. 1997 and Sartoris et al. 2003).
Determination of enzymatic antioxidants
Superoxide dismutase activity (SOD E.C: 1.15.1.1) was determined according to
Livingstone et al. (1992), using a xanthine oxidase/cytochrome c assay at 20°C as well as
at the respective stress temperature of each experimental group. 1 Unit SOD reduces the
increase in extinction of superoxide-mediated reduction of oxidized cytochrome c by 50%
(measured at 550 nm).

PUBLICATION IV
120
Glutathione peroxidase activity (GPX) was determined at 20°C in a coupled optical test
according to Günzler & Flohe (1985).
Protein content
The protein content of the samples was determined according to Bradford (1976) using
bovine serum albumin as a standard.
Western blot analysis
Nuclear extraction protocols, developed for rainbow trout cells (Soitamo et al. 2001), are
not applicable to small tissue samples. Thus, EMSA and Western blotting were carried out
with whole cell extracts, prepared as described by Vuori et al. (2004).
50 mg of liver tissues were homogenized in 200 µl buffer C (20 mM HEPES, pH 7.8,
0.42 M NaCl, 1.5 mM MgCl2, 0.2 mM EDTA, 0.5 mM PMSF, 0.5 mM DTT, 25%
glycerol, 2 µg * ml-1 leupeptine, 2 µg * ml-1 antipaine, 2 µg * ml-1 pepstatine, 2 µg * ml-1
aprotinin, 1 mM Na3VO4) and centrifuged at 16,100 g, 30 min, 4°C.
20 µg protein of whole cell extracts per well were run on 7.5% LiDS-PAGE at 40 mA
and transferred to 3 MM nitrocellulose membrane (semi-dry blotting; 1 h; 0. 4A; 13 V).
Membranes were blocked for 1 h at room temperature with 3% non-fat dry milk in PBS
0.3% Tween20, rinsed 3 times for 10 min with PBS 0.3% Tween20 and incubated with the
primary antibody over night at 4°C followed by 1 h at room temperature. Polyclonal
antibodies directed against the N-terminus of rainbow trout HIF-1α as described in
Soitamo et al. (2001) were used in a dilution of 1:2000 in 1% BSA PBS + 0.02% NaN3.
Afterwards, the membranes were washed and incubated for 3 h at room temperature with
horseradish peroxidase conjugated anti-rabbit secondary antibody (Amersham Pharmacia
Biotech), dilution 1:7500 in 3 % non-fat dry milk in PBS 0.3% Tween20. After washing
the membranes, the signals were detected by enhanced chemiluminescence (ECL,
Amersham Pharmacia Biotech). Signal intensities of HIF-1α protein bands were calculated
from autoradiographed film, using Chemi-Imager digital camera and software (Alpha
Innotech Co.). Calculation of the % intensity was based on densitometry of gel images,
with the sum of the bands from all experimental groups taken as 100% value.
Electromobility shift assay (EMSA)
Following the fish protocol of Soitamo et al. (2001), the promoter region of the human
erythropoietin (EPO) gene as HIF-sensitive DNA probe (5`-GCCCTACGTGCTGTCTCA-

PUBLICATION IV
121
3`) was used. 5`-endlabeling of the sense strand (2 pmol * µl-1 DNA) was done with
10 U * µl-1 T4 polynucleotide kinase and 32P-γ-dATP (10% v:v) over 15 min at 37°C.
After removing unincorporated nucleotides by gelfiltration (sephadex G-25), probes were
annealed with 2 pmol * µl-1 antisense strand in 10 mM Tris/HCl, pH 8.0, 1 mM EDTA,
5 mM MgCl2)
EMSA DNA-protein binding reactions were carried out for 30 min on ice in a total
volume of 20 µl, containing 10 µg cell extract, 0.1 µg * µl-1 carrier DNA (poly dI-dC),
DNA binding buffer (10 mM Tris-HCl, pH 7.5, 50 mM KCl, 50 mM NaCl, 1 mM MgCl2,
1 mM EDTA, 5 mM DTT, 5% glycerol), 1 µl 32P-endlabeled DNA probe, 1 µl bromphenol
blue (1.5%). Samples were run on 4% non-denaturating glycerolpolyacrylamide-gel (4%
acrylamide, 1% glycerol, 0.33x TBE buffer (89 mM Tris, 89 mM boric acid, 5 mM
EDTA). Electrophoresis was performed at 150 V and room temperature, for 2 h in 0.33x
TBE buffer. Dried gels were autoradiographed (Kvietikova et al. 1995). Calculation of the
% intensity was based on densitometry of gel images, with the sum of all bands taken as
100% value.
Testing the specificity of the human EPO enhancer by supershift experiments and by
addition of an excess of unlabeled probe are depicted in Heise et al. (part A).
Statistics
All values are given as means ± standard deviation. Differences between experimental
groups were analyzed by student’s t-test using Statview 5.0. Significances were evaluated
based on the p-level < 0.05.
Results
A) Graded heat stress and 24 h recovery
Behavior during heat stress and recovery
Observations of behavior included mobility level (frequency of spontaneous swimming)
and swimming speed observed during 2 h exposure to heat stress. Eelpouts at 18°C
maintained mobility and swimming speed at control level or even higher. At 22°C fishes
showed spontaneous mobility but at a reduced speed compared to 12°C. Exposure to 26°C
led to an even more obvious slow-down of swimming and to severely reduced spontaneous
mobility. However, directly after returning the fish to 12°C for recovery, there was no

PUBLICATION IV
122
difference in swimming speed and mobility between unstressed controls and all heat
exposed groups. No fish died during heat exposure or recovery.
Antioxidant capacity in the liver
Fig. 1 shows antioxidant enzyme activities in the liver in unstressed, heat stressed and
recovery groups. Superoxide dismutase (SOD) activity, measured at standardized
temperature of 20°C (fig. 1.A), was unchanged from control levels after heat exposure to
18 and 22°C, but significantly reduced after 2 h at 26°C (p = 0.04). Partial recovery of the
reduced SOD activity was achieved by 24 h maintenance at 12°C (p = 0.3 compared to
control, p = 0.06 compared to 26°C). When SOD was assayed at stress temperature
(fig. 1.B) there was no significant difference in SOD activities between any of the heat
stressed and the control groups (p > 0.05). However, a mild activity increase at 22°C and a
decrease at 26°C were mirrored in a significantly lower in situ SOD activity at 26°C
compared to 18 or 22°C (p ≤ 0.03).
Glutathione peroxidase (GPX) activities assayed at 20°C (fig. 1.C) did not show
significant changes (p > 0.16) compared to control levels. A minor increase at 22°C and a
slight decrease at 26°C were in line with the trend already observed for SOD activities.
Fig. 2 gives a differentiated overview of glutathione-related parameters in all
experimental groups. The total glutathione content (controls: 1.2 ± 0.3 µmol * g ww-1) as
well as the contents of reduced (GSH, control: 0.9 ± 0.6 µmol * g ww-1) and oxidized
(GSSG, fig. 2.A) glutathione did not show significant changes following heat exposure or
recovery from heat stress (total glutathione: p > 0.35, GSH: p > 0.18, data for these
parameters are not included in Fig. 2). However, a trend for GSSG to rise upon recovery
from 26°C was close to being significant (p = 0.05, fig. 2.A). Glutathione redox ratio
(2GSSG/GSH) was significantly reduced (p < 0.01, fig. 2.B) in fishes exposed to 18°C
compared to controls (12°C). Calculation of the redox environment ∆E according to
Schafer & Buettner (2001) are based on GSH and GSSG concentrations, the water
temperature, and the temperature-dependent change of intracellular pH (adopted from
Sartoris et al. 2003, Larsen et al. 19997). The resulting ∆E values (fig. 2.C) remained close
to control levels at 18°C (p = 0.28) and during recovery from 18°C (p = 0.77). By contrast,
warming to 22°C (p < 0.01) as well as 26°C (p = 0.03) led to a significantly more oxidized
cellular redox environment. Following recovery from each high temperature exposure ∆E
values returned to control level within 24 h of recovery (p > 0.33).

PUBLICATION IV
123
Oxidative damage parameters in the liver
The exposure to a source of free radicals such as tBOOH allows for the evaluation of the
ex vivo susceptibility of lipids to oxidation (Dotan et al. 2004). The main reactive species
detected by the assay of tBOOH- initiated chemiluminescence according to Gonzalez
Flecha et al. (1991) are the dimol emission of singlet oxygen and the photon emission from
excited carbonyl groups formed during lipid peroxidation. It has been shown that this assay
evaluates the imbalance between pro- and antioxidant processes resulting from depletion of
low-molecular weight antioxidant compounds like glutathione, ascorbate and α-tocopherol.
Accordingly, unaltered tBOOH initiated chemiluminescence rates in all experimental
groups (fig. 3.A), indicate that prooxidant processes were well balanced by antioxidant
compounds (Gonzalez Flecha et al. 1991). However, thiobarbituric reactive substances
(TBARS) as markers of lipid peroxidation were elevated over control levels after all heat
treatments and remained elevated throughout recovery (p-values: 0.06 / 18°C, 0.04 / 22°C,
< 0.01 / 26°C, 0.02 / 18°C recovery, 0.03 / 22°C recovery, 0.04 / 26°C recovery, fig. 3.B).
Differences between stressed groups were insignificant, with TBARS content at 18°C
being higher than at 22 or 26°C. After recovery from 18 and 22°C, TBARS content was
reduced in comparison to the respective heat stress group, but after 24 h levels were still
somewhat higher than in controls.
The carbonyl content of the liver reflects oxidative modifications of proteins (fig. 3.C)
and was similar in all groups with the exception of higher carbonyl levels after recovery
from 18°C (p = 0.03 compared to controls).
Hypoxic signaling and molecular defense in the liver
Higher levels of heat shock protein (HSP70) were detected only after recovery from 26°C
(1.5 ± 0.2 % signal intensity) compared to control levels (1.0 ± 0.3 %, p = 0.05) and to the
26°C heat stress group (1.0 ± 0.3 %, p = 0.02).
The HIF-1α protein could be detected in all experimental groups including unstressed
controls and recovering specimens (data not shown) and did not show temperature
dependent concentration changes. Electromobility shift assays (EMSA), demonstrating
DNA binding of HIF-1 to the human erythropoietin enhancer, reached only weak signal
intensities following heat stress (fig. 4.A). DNA binding of HIF-1 significantly above
control levels was found only after recovery from exposure to 18°C (p = 0.04; fig. 4.B).
Taking the data from this and from our parallel study on cold stress together (Heise et al.
part A), HIF-1 DNA binding in Z. viviparus was generally enhanced at more reduced

PUBLICATION IV
124
cellular redox environment ∆E (fig. 4.C, linear regression, Statview 5.0, p = 0.03;
R² = 0.3).
B) Recovery from exposure to 18°C
Recovery over time was analyzed in a different batch of animals collected in September
2003. Liver SOD activities of unstressed controls were measured at 20°C (3470 ± 750
U * g ww-1) and at 10°C (2600 ± 480 U * g ww-1) and remained unchanged after exposure
to 18°C and subsequent recovery (p > 0.08; data not shown).
Glutathione parameters of the recovery time series are presented in fig 5. The content of
GSH was significantly increased following exposure to 18°C (p < 0.01, fig. 5.A).
Throughout recovery we also found GSH significantly elevated over controls (p = 0.04 /
2 h rec., p = 0.01 / 8 h rec., p = 0.01 / 12 h rec.) but lower than in the heat stressed group.
Due to high variability in the control group, GSSG content was only insignificantly
increased above 10°C controls upon warming and in the recovery groups (fig. 5.B).
However, due to an increase of both GSH and GSSG, the total glutathione content was
significantly higher in the 18°C group and also in all recovery groups (p-levels: < 0.01 /
18°C, 0.04 / 2 h rec., 0.01 / 8 h rec., 0.01 / 12 h rec., fig. 5.C). Moreover, constant
glutathione redox ratio and redox potential ∆E indicates an unchanged liver redox
environment under all exposure conditions (fig. 5.D, E). Liver oxidative stress parameters
of the recovery time series are given in fig. 6. A significant increase in tBOOH initiated
chemiluminescence rates was found after 12 h recovery from 18°C (p < 0.01; fig 6.A). The
content of protein carbonyls was significantly increased during the initial phase (2 and 8 h)
of recovery at control temperature (p = 0.08 / 2 h rec., p = 0.04 / 8 h rec.) and returned to
control levels within 12 h of recovery from warming (p = 0.41; fig. 6.B). TBARS were not
measured in this experiment.
Interestingly, some parameters showed significant differences between both experimental
series with respect to controls and also with respect to fish exposed to 18°C (tab. 1). The
carbonyl content was significantly higher in control and 18°C fish of experiment A (graded
heat stress) compared to B (recovery time series). This went along with significantly lower
SOD activities in experiment A. Further, the increase in GSH and total glutathione content
upon exposure to 18°C (fig. 5.A, C) in experiment B, not observed in experiment A (see
above), caused a significant difference of the glutathione tissue concentration between both
experiments (tab. 1). However, the redox potential was similar and only insignificantly
lower in experiment B in both, controls and fish at 18°C.

PUBLICATION IV
125
Discussion
The present study investigates the physiological response of the common eelpout Zoarces
viviparus to short-term experimental hyperthermia and heat stress, suggested to cause
functional hypoxia in central tissues (Pörtner 2002). Specifically we addressed the
question, whether oxidative stress occurred during hyperthermia and / or during recovery
at control temperature and whether antioxidants (AOX), heat shock proteins (HSP) and
hypoxic signaling were induced. The interplay between these defense systems is supposed
to be important for passive survival of critical temperature stress, e.g. during unfavorable
conditions in hot summers.
Based on the previous evaluation of the thermal biology of Z. viviparus, as summarized
in Zakhartsev et al. (2003), we chose 18, 22 and 26°C as stress temperatures, covering the
range from sub-critical values (18°C) beyond pejus temperatures, where the animals started
to lose their aerobic scope, to the critical heat stress limit, where heat-induced hypoxia
becomes more severe and anaerobic metabolism sets in (22°C). Finally, animals were
exposed to 26°C slightly below the temperature where Zakhartsev and co-workers found
an onset of muscular spasms and loss of equilibrium.
Response to graded heat stress and recovery
Induction of antioxidant enzymes is an important line of defense against oxidative stress
in biological systems (Storey 1996, Parihar et al. 1997) but can be compromised under
temperature stress due to thermal impairment of protein function (reviewed by Abele &
Puntarulo 2004). In the present study, only slightly higher SOD and GPX activities after
exposure to 22°C were recorded, whereas particularly SOD was reduced under extreme
hyperthermia (26°C, fig. 1). Similarly, impairment especially of SOD above Tc has been
reported for different marine invertebrates (Abele et al. 1998, 2001, 2002). This loss of
enzymatic antioxidant activity beyond critical temperatures might relate to heat-induced
protein denaturation or disturbances of protein synthesis (Pörtner 2002, Kregel 2002).
Interestingly, although GPX activity was not significantly elevated, the cellular redox
environment, which is mainly determined by the ratio of oxidized to reduced glutathione
(Schafer & Buettner 2001), was more oxidized under critical hyperthermia at 22°C and
26°C (fig. 2.C). Presumably this relates to spontaneous, non-enzymatic GSH oxidation by
emerging ROS under hyperthermia. It may also be due to loss of function of the enzyme
glutathione reductase, which re-converts oxidized to reduced glutathione. At all events, a

PUBLICATION IV
126
more oxidized glutathione redox ratio under heat stress stands against our findings of a
more reduced redox environment under severe cold stress in eelpout (Heise et al., part A).
Thus, heat and cold stress outside the thermal tolerance range had opposite effects on the
cellular redox milieu, which indicates that oxidative stress presented a greater problem
during acute warming than during cooling of this temperate fish species. However, the
glutathione antioxidant capacity seemed sufficient to counterbalance an assumed
temperature induced acceleration of ROS formation rates also upon severe heat stress, as
indicated by constant chemiluminescence levels on tBOOH-induction (Gonzalez Flecha et
al. 1991). By contrast, either ROS production itself, or the oxidizing reaction with GSH
appeared slower in the cold.
The glutathione based antioxidant effect is thought to be protective in the hydrophilic
protein fraction and, indeed, protein oxidation was not elevated at critically high
temperatures (≤ 22°C). In the hydrophobic lipid fraction the antioxidant glutathione is
much less soluble and therefore less effective, and TBARS levels rose significantly over
controls at 22°C and higher. In agreement with these findings, glutathione depletion in heat
stressed marine sponges resulted in a loss of antioxidant protection (Bachinski et al. 1997)
and the same effect has been observed in mammalian systems (Freeman et al. 1990). It has
to be considered that higher TBARS levels in heat stressed eelpout could also be due to
temperature induced changes in the rates of their degradation with the rates of ROS
formation being unaffected upon heating. However, recent in vitro studies on isolated
mitochondria obtained from marine invertebrates have clearly shown increasing ROS rates
with rising temperature (Abele et al. 2002, Heise et al. 2003, Keller et al. 2004) and similar
effects can be expected in marine fish.
A heat shock response has been demonstrated in a number of studies using fish cells
(Arai et al. 1994, Airaksinen et al. 1998, 2003) and also in whole animal experiments with
marine (Dietz & Somero 1992) and freshwater fish (Molina et al. 2000) exposed to a
variety of stressors including heat (for review see Iwama et al. 1998). We studied HSP70
as it represents the most temperature sensitive HSP family (Krebs & Bettencourt 1999,
Kregel 2002) also in fish (Iwama et al. 1998). Insignificantly higher HSP70 levels were
found only after recovery from 26°C, which supports the view that major inactivation of
native proteins has not yet occurred at this temperature. This conclusion is in line with the
finding that protein oxidation remained close to control levels. It is commonly observed,
that the synthesis of HSPs is activated near the upper temperatures that ectothermal species
encounter in their habitat (Tomanek & Somero 2000). After a relatively short heat stress

PUBLICATION IV
127
period of 2 h, HSP are supposed to start increasing directly after returning the fishes to
control temperatures. It seems possible, that HSP levels were higher earlier during the
recovery phase. A shorter recovery phase may therefore have detected HSP levels also
following milder heat stress of 18 or 22°C. Thus, in the present eelpout case HSPs were
either not induced although Tc was reached or measurements after 24 h were too late to
detect the heat shock response. In addition, it is conceivable that a preconditioning
exposure to sub-critical heating may be required to confer enhanced heat shock protein
expression, leading to transiently improved tolerance of severe heat stress (Moseley 1997,
King et al. 2002, reviewed in Kregel 2002).
Recent results by Treinin et al. (2003) demonstrated that the transcription factor HIF-1 is
essential for heat acclimation in C. elegans and probably also in rat and mouse.
Stabilization or activation of HIF-1 occurring within 1 h of heat exposure in liver and
kidney from mice appeared to be mediated by increased HSP90 levels (Katschinski et al.
2002). Furthermore, increased HIF-1 DNA binding was observed after long-term warm
acclimation (to 5°C) of the Antarctic eelpout Pachycara brachycephalum (Heise et al. ms
in prep.). Therefore, we hypothesized that heat stress could activate hypoxic signaling also
in the North Sea eelpout Z. viviparus. However, only sub-critical warming in the pejus
temperature range (18°C) caused a significant induction of HIF-1 activity (fig. 4.A, B),
whereas higher temperatures produced only weak EMSA signals. We therefore conclude
that metabolic reorganization to improve oxygen supply can only be functional in the pejus
range of this fish species (15-22°C, Zakhartsev et al. 2003) as aerobic scope diminishes.
This interpretation would also apply to the findings obtained in the Antarctic eelpout
acclimated to 5°C, which is close to pejus conditions (6-7°C, Mark et al. 2002). The
observed transition of Z. viviparus liver tissue to anaerobic metabolism observed on longer
warming beyond the Tc by Van Dijk et al. (1999) is a consequence of extreme hypoxia and
probably regulated via reversible enzyme phosphorylation and leading to accumulation of
glycolytic substrates, while not controlled by HIF-1 induced up-regulation of glycolytic
enzymes (Semenza et al. 1994). Also, other transcription factors such as Sp1 and Sp3
could be responsible for the temperature mediated induction of glycolytic enzymes as
shown for β-enolase and pyruvate kinase M in mammalian muscle cells subjected to
hypoxia (Discher et al. 1998).
Moreover, HIF-1 DNA binding was generally higher at a more reduced redox
environment. Thus the more oxidized conditions at 22 and 26°C (fig. 2.C) might “switch-
off” the hypoxic signal (Abele 2002) and therewith prevent the more complex HIF-1

PUBLICATION IV
128
induced physiological response. By contrast, cold stress led to a more reduced cellular
redox milieu and increased HIF-1 DNA binding (Heise et al., part A). All in all, the
response to cold stress might much more allow for a HIF regulated hypoxia response than
the response to heat stress in fish.
In any event, redox sensitivity and the presence of the protein in normoxic samples
suggest that HIF-1 could have significant normoxic functions, which we presently know
nothing about (Nikinmaa & Rees 2005).
Recovery time series
In contrast to cold stress (Heise et al. part A), we did not find increased oxidative stress
markers (chemiluminescence and TBARS, fig 3. A. B.) upon 24 h recovery compared to
the respective heat stress group, except for the higher carbonyl content after recovery from
18°C (fig. 3.C). Thus, on first sight, heat-induced hypoxia did not so clearly follow the
ischemia / reperfusion pattern of oxidative stress in mammals (e.g. Halliwell & Gutteridge
1999). To see whether oxidative damage repair might have been faster and already finished
within 24 h of recovery from high temperature stress, we performed a recovery-time series
with another batch of eelpout caught in autumn.
An unaltered redox potential (∆E) in all groups (fig. 5.E) confirmed our first
experimental finding that neither sub-critical temperature stress (18°C) itself, nor the
subsequent recovery phase disturbed the cellular redox milieu. Increased
chemiluminescence rates and carbonyl contents during recovery intervals of up to 12 hrs
(fig. 6.A, B) confirm our prediction that repair of oxidative damage could be faster
following heat than following cold stress. The distinct time patterns of both parameters can
be explained by the different underlying processes. Chemiluminescence depends on the
progressive exploitation of small molecule antioxidants under ongoing oxidative stress,
obviously still active after 12 h. Protein oxidation depends on oxidative stress and
induction of repair mechanisms, i.e. proteasomal degradation and new synthesis (Dröge
2002), which set in after about 10 h of recovery, so that the 12 h values were already back
to control levels in the recovery time series with autumn animals. Taking into account that
exactly the same protein carbonyl parameters were still elevated after 24 hrs in summer
animals illustrates the complex interaction of various repair systems and the unknown
importance of seasonal preconditioning. Thus, it is possible that seasonal changes in the
protein turnover between the experimental fishes, the first batch (A) caught in summer

PUBLICATION IV
129
2002 (kept at 12°C), and the second one caught in autumn 2003 (kept at 10°C), account for
the detected variations.
Conclusions
The data we presented here support the hypothesis that heat-induced hypoxia and
reoxygenation upon recovery in the North Sea eelpout have effects comparable to
ischemia / reperfusion events in mammals. However, onset of oxidative damage repair
occurred faster during recovery from heat than from cold stress (Heise et al., part A).
Hypoxic signaling and subsequent metabolic reorganization to counterbalance thermal
oxygen limitation could play a role only in the pejus temperature range, but appears
impaired at critical and higher temperatures (22 and 26°C), presumably because of the
more oxidized cellular redox state.
The fishes, most probably, do not die from oxidative damage, although SOD was
impaired and lipid peroxidation was significantly increased upon critical heating. However,
oxidative stress effects leading to a more oxidized cellular redox state under critical heat
exposure (-245 mV vs. -260 mV in controls) can exacerbate the hypoxic deficit, by
impairment of a more active HIF-1 signal. In contrast, we found a more reduced tissue
redox state under stressful cooling (-275 mV vs. -260 in controls) and more significant
HIF-1 DNA binding, which likely enabled a regulatory response and, thereby, stabilization
of physiological functions in the cold.
Acknowledgements
The authors thank Andreas Wagner for technical support on Helgoland and Birgit
Obermüller for her help with sampling of fish. This study was supported by grants from
Deutscher Akademischer Austauschdienst (DAAD) to KH.
PUBLICATION IV
130
Literature cited
Abele, D., Burlango, B., Viarengo, A. and Pörtner, H.-O. (1998). Exposure to elevated
temperatures and hydrogen peroxide elicits oxidative stress and antioxidant response in the
Antarctic intertidal limpet Nacella concinna. Comp. Biochem. Physiol. 120B, 425-435.
Abele, D., Tesch, C. Wencke, P. and Pörtner, H.O. (2001). How does oxidative stress
relate to thermal tolerance in the Antarctic bivalve Yoldia eightsi? Ant. Sci. 13, 111-118.
Abele, D. (2002). The radical life-giver. Nature 420, 27.
Abele, D., Heise, K., Pörtner, H.O. and Puntarulo, S. (2002). Temperature-dependence
of mitochondrial function and production of reactive oxygen species in the intertidal mud
clam Mya arenaria. J. Exp. Biol. 205, 1831-1841.
Abele, D. and Puntarulo, S. (2004). Formation of reactive species and induction of
antioxidant defence systems in polar and temperate marine invertebrates and fish. Comp.
Biochem. Physiol. 138A, 405-15.
Airaksinen, S., Rabergh, C.M., Sistonen, L., and Nikinmaa, M. (1998). Effects of heat
shock and hypoxia on protein synthesis in rainbow trout (Oncorhynchus mykiss) cells. J.
Exp. Biol. 201, 2543-2551.
Airaksinen, S., Rabergh, C.M., Lahti, A., Kaatrasalo, A., Sistonen, L. and Nikinmaa,
M. (2003). Stressor-dependent regulation of the heat shock response in zebrafish, Danio
rerio. Comp. Biochem. Physiol. 134A, 839-46.
Arai, A., Mitani, H., Naruse, K. and Shima, A. (1994). Relationship between the
induction of proteins in the HSP70 family and thermosensitivity in two species of Oryzias
(Pisces). Comp. Biochem. Physiol. 109B, 647-654.
Bachinski, N., Koziol, C., Batel, R., Labura, Z., Schröder, H.C. and Müller, W.E.G.
(1997). Immediate early response of the marine sponge Suberites domuncula to heat stress:

PUBLICATION IV
131
reduction of trehalose and glutathione S-transferase activity. J. Exp. Mar. Biol. E. 210,
129-141.
Bradford, M.M. (1976). A rapid and sensitive method for the quantification of microgram
quantities of protein utilizing the principle of protein-dye binding. Analyt. Biochem. 71,
248-254.
Chi, N.C. and Karliner, J.S. (2004). Molecular determinants of responses to myocardial
ischemia / reperfusion injury: focus on hypoxia-inducible and heat shock factors.
Cardiovasc. Res. 61, 437-447.
Dietz, T.J. and Somero, G.N. (1992). The threshold induction temperature of the 90-kDa
heat shock protein is subject to acclimatization in eurythermal goby fishes (genus
Gillichthys). Proc. Nat. Acad. Sci. USA 89, 3389-3393.
Discher, D.J., Bishopric, N.H., Wu, X., Peterson, C.A. and Webster, K.A. (1998).
Hypoxia regulates β-enolase and pyruvate kinase-M promoters by modulating Sp1/Sp3
binding to a conserved GC element. J. Biol. Chem. 273, 26087-26093.
Dotan, Y., Lichtenberg, D. and Pinchuk, I. (2004). Lipid peroxidation cannot be used as
a universal criterion of oxidative stress. Prog. Lipid Res. 43, 200-227.
Dröge, W. (2002). Free radicals in the physiological control of cell function. Physiol. Rev.
82, 47-95.
Erecińska, M. and Silver, I.A. (2001). Tissue oxygen tension and brain sensitivity to
hypoxia. Respir. Physiol. 128, 263-276.
Fariss, M.W. and Reed. D.J. (1987). High-performance liquid chromatography of thiols
and disulfides: diphenol derivatives. Meth. Enzymol. 143, 101-109.
Farrell, A.P. (2002). Cardiorespiratory performance in salmonids during exercise at high
temperature: insights into cardiovascular design limitations in fishes. Comp. Biochem.
Physiol. 132A, 797-810.

PUBLICATION IV
132
Flanagan, S.W., Moseley, P.L. and Buettner, G.R. (1998). Increased flux of free radicals
in cells subjected to hyperthermia: detection by electron paramagnetic resonance spin
trapping. FEBS Lett. 431, 285-286.
Freeman, M.L., Spitz, D.R. and Meredith, M.J. (1990). Does heat shock enhance
oxidative stress? Studies with ferrous and ferric iron. Radiation Res. 124, 288-293.
Gonzalez Flecha, B., Llesuy, S. and Boveris, A. (1991). Hydroperoxide-initiated
chemiluminescence: An assay for oxidative stress in biopsies of heart, liver, and muscle.
Free Rad. Biol. Med. 10, 93-100.
Günzler, W.A. and Flohe, L. (1985). Glutathione peroxidase. In: Greenwald, R. A. (ed),
CRC handbooks of methods for oxygen radical research. Boca Raton, CRC Press Inc, 285-
289.
Halliwell, B. and Gutteridge, J.M.C. (1999). Free radicals in Biology and Medicine. 3.
edition. Clarendon Press, Oxford.
Heise, K., Puntarulo, S., Pörtner, H.O. and Abele, D. (2003). Production of reactive
oxygen species by isolated mitochondria of the Antarctic bivalve Laternula elliptica (King
and Broderip) under heat stress. Comp. Biochem. Physiol. 134C, 79-90.
Heise, K., Estevez, M.S., Puntarulo, S., Galleano, M., Nikinmaa, M., Pörtner, H.O.
and Abele D. Changes in oxidative stress parameters and activation of hypoxia inducible
factor (HIF-1) at different environmental temperatures in polar and temperate zoarcid fish,
ms in prep.
Heise, K, Puntarulo, S., Nikinmaa, M., Pörtner, H.-O. and Abele, D. Oxidative stress
and HIF-1 DNA binding during stressful temperatures and recovery in the North Sea
eelpout (Zoarces viviparus), part A: cold stress. J. Exp. Biol. submitted..
Iwama, G.K., Thomas, P.T., Forsyth, R.B. and Vijayan, M.M. (1998). Heat shock
protein expression in fish. Rev. Fish Biol. & Fisheries 8, 35-56.

PUBLICATION IV
133
Jones, D.P. (1986). Renal metabolism during normoxia, hypoxia and ischemic injury. An.
Rev. Physiol. 48, 33-50.
Katschinski, D.M., Boos, K., Schindler, S.G., and Fandrey, J. (2000). Pivotal role of
reactive oxygen species as intracellular mediators of hyperthermia-induced apoptosis. J.
Biol. Chem. 275, 21094-21098.
Katschinski, D.M., Le, L., Heinrich, D., Wagner, K.F., Hofer, T. Schindler, S.G. and
Wenger, R.H. (2002). Heat induction of the unphosphorylated form of hypoxia-inducible
factor-1α is dependent on heat shock protein-90 activity. J. Biol. Chem. 277, 9262-9267.
Keller, M., Sommer, A.M., Pörtner, H.O. and Abele, D. (2004). Seasonality of energetic
functioning and production of reactive oxygen species by lugworm (Arenicola marina)
mitochondria exposed to acute temperature changes. J. Exp. Biol. 207, 2529-2538.
King, Y.-T., Lin, C.-S., Lin, J.-H. and Lee, W.-C. (2002). Whole-body-hyperthermia-
induced thermotolerance is associated with the induction of heat shock protein 70 in mice.
J. Exp. Biol. 205, 273-278.
Krebs, R.A. and Bettencourt, B.R. (1999). Evolution of thermotolerance and variation in
the heat shock protein, Hsp70. Amer. Zool. 39, 910-919.
Kregel, K.C. (2002). Heat shock proteins: modifying factors in physiological stress
response and acquired thermotolerance. J. Appl. Physiol. 92, 2177-2186.
Kvietikova, I., Wenger, R.H., Marti, H.H. and Gassmann, M. (1995). The transcription
factors ATF-1 and CREB-1 bind constitutively to the hypoxia-inducible factor-1 (HIF-1)
DNA recognition site. Nucl. Ac. Res. 23, 4542-4550.
Lannig, G., Bock, C., Sartoris, F.J. and Pörtner, H.O. (2004). Oxygen limitation of
thermal tolerance in cod, Gadus morhua L., studied by magnetic resonance imaging and
on-line venous oxygen monitoring. Am. J. Physiol. Regul. Intergr. Comp. Physiol. 287,
R902-R910.
PUBLICATION IV
134
Larsen, B.K.,. Pörtner, H.O and Jensen, F.B. (1997). Extra- and intracellular acid-base
balance and ionic regulation in cod (Gadus morhua) during combined and isolated
exposures to hypercapnia and copper. Mar. Biol. 128, 337-346.
Levine, R. L., Garland, D., Oliver, C. N., Amici, A., Climent, I., Lenz, A.-G., Ahn, B.-
W., Shaltiel, S. and Stadtman, E. R. (1990). Determination of Carbonyl Content in
Oxidatively Modified Proteins. Meth. Enzymol. 186, 464-485.
Livingstone, D. R., Lips, F., Garcia Martinez, P. and Pipe, R.K. (1992). Antioxidant
enzymes in the digestive gland of the common mussel Mytilus edulis. Mar. Biol. 112, 265-
276.
Mark, F.C., Bock, C. and Pörtner, H.O. (2002). Oxygen-limited thermal tolerance in
Antarctic fish investigated by MRI and 31P-MRS. Am. J. Physiol. Regul. Integr. Comp.
Physiol. 283, R1254-R1262.
McCord, J.M. (1988). Free radicals and myocardial ischemia: overview and outlook. Free
Rad. Biol. Med. 4, 9-14.
Molina, A., Biemar, F., Müller, F., Iyengar, A., Prunet, P., Maclean, N., Martial, J.A.,
Muller, M. (2000). Cloning and expression analysis of an inducible HSP70 gene from
tilapia fish. FEBS Lett. 474, 5-10.
Mosely, P.L. (1997). Heat shock proteins and heat adaptation of the whole organism. J.
Appl. Physiol. 83, 1413-1417.
Nikinmaa, M. and Rees, B.B. (2005). Oxygen-dependent gene expression in fishes. Am.
J. Physiol. Regul. Integr. Comp. Physiol. 288, R1079-R1090. .
Parihar, M.S., Javeri, T., Hemnani, T., Dubey, A.K. and Prakash, P. (1997).
Responses of superoxide dismutase, glutathione peroxidase and reduced glutathione
antioxidant defenses in gills of the freshwater catfish (Heteropneustes fossilis) to short-
term elevated temperature. J. Therm. Biol. 22, 151-156.

PUBLICATION IV
135
Pörtner, H.O. (2002). Climate variations and the physiological basis of temperature
dependent biogeography: systemic to molecular hierarchy of thermal tolerance in animals.
Comp. Biochem. Physiol. 132A, 739-761.
Pörtner, H.O., Mark, F.C. and Bock, C. (2004). Oxygen limited thermal tolerance in
fish? Answers obtained by nuclear magnetic resonance techniques. Respir. Physiol.
Neurobiol. 141, 243-260.
Sartoris, F.J., Bock, C. and Pörtner, H.O. (2003). Temperature-dependent pH regulation
in eurythermal and stenothermal marine fish: an interspecies comparison using 31P-NMR.
J. Therm. Biol. 28, 363-371.
Schafer, F.Q. and Buettner, G.R. (2001). Redox environment of the cell as viewed
through the redox state of the glutathione disulfide/glutathione couple. Free Rad. Biol.
Med. 30, 1191-1212.
Semenza, G.L., Roth, P.H., Fang, H.M. and Wang, G.L. (1994). Transcriptional
regulation of genes encoding glycolytic enzymes by hypoxia-inducible factor 1. J. Biol.
Chem. 269, 23757-23763.
Semenza, L. (2004). Hydroxylation of HIF-1: Oxygen sensing at the molecular level.
Physiol. 19, 176-182.
Skulachev, V. P. (2001). The programmed death phenomena, aging. And the Samurai law
of biology. Exp. Geront. 36, 995-1024.
Soitamo, A.J., Rabergh, C.M.I., Gassmann, M., Sistonen, L. and Nikinmaa, M.
(2001). Characterization of a hypoxia-inducible factor (HIF-1α) from rainbow trout. J.
Biol. Chem. 276, 19677-19705.
Sommer, A., Klein, B. and Pörtner, H.O. (1997). Temperature induced anaerobiosis in
two populations of the polychaete worm Arenicola marina (L.). J. Comp. Physiol. 167B,
25-35.

PUBLICATION IV
136
Storey, K.B. (1996). Oxidative stress: animal adaptations in nature. Braz. J. Med. Biol.
Res. 29, 1715-1733.
Tomanek, L. and Somero, G.N. (2000). Time course and magnitude of synthesis of heat-
shock proteins in congeneric marine snails (Genus Tegula) from different tidal heights.
Physiol. Biochem. Zool. 73, 249-256.
Treinin, M., Shilar, J., Jiang, H., Powell-Coffman, J.A., Bromberg, Z. and Horowitz,
M. (2003). HIF-1 is required for heat acclimation in the nematode Caenorabditis elegans.
Physiol. Genom. 14, 17-24.
Uchiyama, M. and Mihara, M. (1978). Determination of malonaldehyde precursor in
tissues by thiobarbituric acid test. Analyt. Biochem. 86, 271-278.
Van Dijk, P.L.M., Tesch, C., Hardewig, I. and Pörtner, H.-O. (1999). Physiological
disturbances at critically high temperatures: a comparison between stenothermal Antarctic
and eurythermal temperate eelpouts (Zoarcidae). J. Exp. Biol. 202, 3611-3621.
Vuori, K.A.M., Soitamo. A., Vuorinen, P.J. and Nikinmaa, M. (2004). Baltic salmon
(Salmo salar) yolk-sac fry mortality is associated with disturbances in the function of
hypoxia-inducible transcription factor (HIF-1α) and consecutive gene expression. Aquat.
Toxicol. 68, 301-313.
Wenger, R.H. (2000). Mammalian oxygen sensing, signalling and gene regulation. J. Exp.
Biol. 203, 1253-1263.
Zakhartsev, M.V., De Wachter, B., Sartoris, F.J., Pörtner, H.O. and Blust, R. (2003).
Thermal physiology of the common eelpout (Zoarces viviparus). J. Comp. Physiol. 173B,
365-378.
Zielinski, S. and Pörtner, H.O. (1996). Energy metabolism and ATP free energy change
of the intertidal worm Sipunculus nudus below a critical temperature. J. Comp. Physiol.
166B, 492-500.

PUBLICATION IV
137
Tables Table 1
Statistical comparison of oxidative stress markers in liver samples from unstressed controls and 18°C exposed Z.
viviparus obtained during the graded heat stress experiment (A) and during the recovery time series (B). * significant
difference between both experiments.
Parameter in
summer (A) vs. fall (B)
unstressed controls
18°C exposed fish
SOD activity at 20°C (A) < (B) p = 0.01 (*) (A) < (B) p < 0.01 (*)
GSH content (A) > (B) p = 0.72 (A) < (B) p < 0.03 (*)
GSSG content (A) < (B) p = 0.14 (A) < (B) p < 0.01 (*)
total glutathione (A) < (B) p = 0.49 (A) < (B) p < 0.01 (*)
2GSSG/GSH (A) < (B) p = 0.06 (A) < (B) p = 0.03 (*)
redox potential ∆E (A) < (B) p = 0.40 (A) < (B) p = 0.34
carbonyl content (A) > (B) p < 0.01 (*) (A) > (B) p < 0.01

PUBLICATION IV
138
Figures Figure 1
Antioxidant enzyme activity in Z. viviparus liver samples after 2 h of heat exposure to 18, 22 and 26°C as well as after 24
h recovery (recov.) from the respective temperature. A: superoxide dismutase (SOD) activity measured at 20°C. B: SOD
activity measured at the respective stress temperature. C: glutathione peroxidase (GPX) activity measured at 20°C. Means
± standard deviation, n = 3-5, * = significantly different from the unstressed group, p < 0.05, ww = wet weight.
unstressed 18°C 18°C recov. 22°C 22°C recov. 26°C 26°C recov.
GPX
act
ivity
at 2
0°C
(U *
g w
w-1
)
0
2
4
6
8
10
12
14
16
C
unstressed 18°C 18°C recov. 22°C 22°C recov. 26°C 26°C recov.
SOD
act
ivity
at 2
0°C
(U *
g w
w-1
)
0
500
1000
1500
2000
2500
3000
*
A
unstressed 18°C 18°C recov. 22°C 22°C recov. 26°C 26°C recov.
SOD
act
ivity
at s
tres
s te
mpe
ratu
re (U
* g
ww
-1)
0
500
1000
1500
2000
2500
3000
3500
B

PUBLICATION IV
139
Figure 2
Glutathione redox chemistry in Z. viviparus liver samples after 2 h of heat exposure to 18, 22 and 26°C as well as after 24
h recovery (recov.) from these temperatures. A: content of oxidized glutathione (GSSG), B: Glutathione redox ratio
(2GSSG/GSH), C: redox potential ∆E at in situ temperature and in situ intracellular pH (adopted from Sartoris et al.
2003, Larsen et al. 1997) calculated after Schaffer & Buettner (2001). Means ± standard deviation, n = 4-7, * =
significantly different from the unstressed group, # = significant difference to the respective recovery group, p < 0.05,
ww = wet weight.
unstressed 18°C 18°C recov. 22°C 22°C recov. 26°C 26°C recov.
GSS
G c
onte
nt (µ
mol
* g
ww
-1)
0.0
0.1
0.2
0.3
0.4
A
unstressed 18°C 18°C recov. 22°C 22°C recov. 26°C 26°C recov.
redo
x po
tent
ial ∆
E (m
V)
-280
-270
-260
-250
-240
0
C
* #
*
unstressed 18°C 18°C recov. 22°C 22°C recov. 26°C 26°C recov.
glut
athi
one
redo
x ra
tio (2
GSS
G/G
SH)
0.0
0.2
0.4
0.6
0.8
1.0
1.2
* #
B
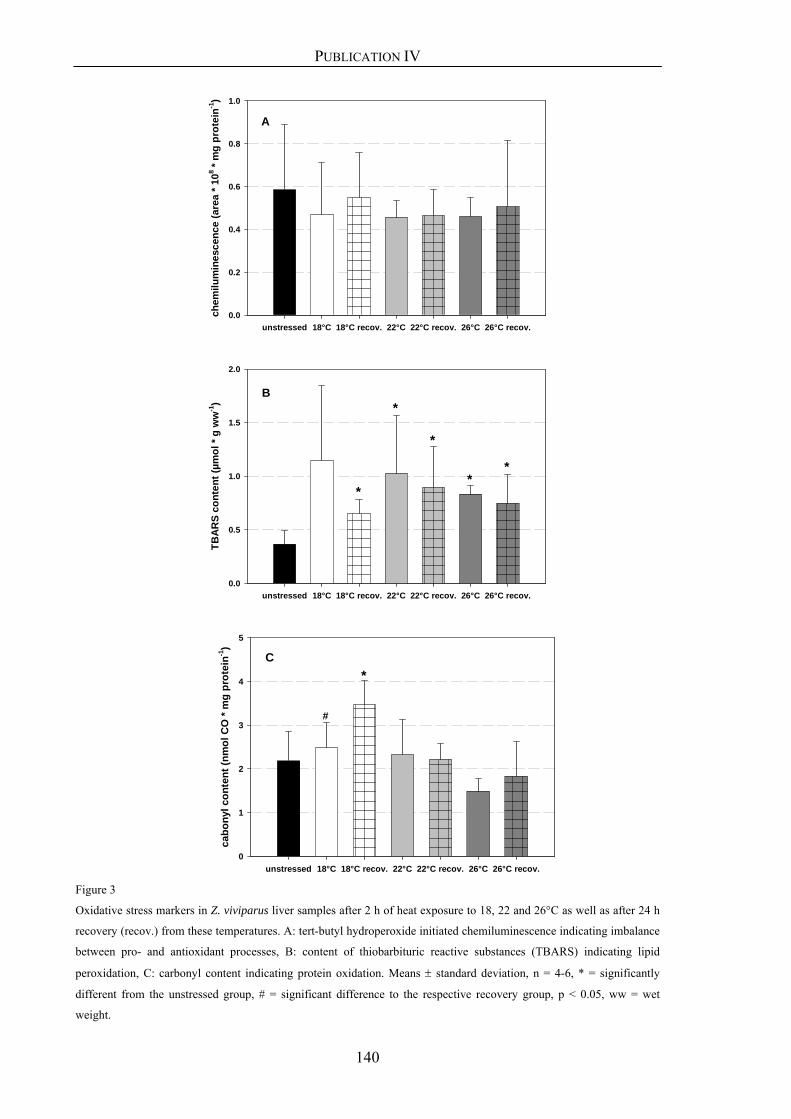
PUBLICATION IV
140
Figure 3
Oxidative stress markers in Z. viviparus liver samples after 2 h of heat exposure to 18, 22 and 26°C as well as after 24 h
recovery (recov.) from these temperatures. A: tert-butyl hydroperoxide initiated chemiluminescence indicating imbalance
between pro- and antioxidant processes, B: content of thiobarbituric reactive substances (TBARS) indicating lipid
peroxidation, C: carbonyl content indicating protein oxidation. Means ± standard deviation, n = 4-6, * = significantly
different from the unstressed group, # = significant difference to the respective recovery group, p < 0.05, ww = wet
weight.
unstressed 18°C 18°C recov. 22°C 22°C recov. 26°C 26°C recov.
chem
ilum
ines
cenc
e (a
rea
* 108 *
mg
prot
ein-1
)
0.0
0.2
0.4
0.6
0.8
1.0
A
unstressed 18°C 18°C recov. 22°C 22°C recov. 26°C 26°C recov.
TBA
RS
cont
ent (
µmol
* g
ww
-1)
0.0
0.5
1.0
1.5
2.0
*
*
*
**
B
unstressed 18°C 18°C recov. 22°C 22°C recov. 26°C 26°C recov.
cabo
nyl c
onte
nt (n
mol
CO
* m
g pr
otei
n-1)
0
1
2
3
4
5
*
#
C

PUBLICATION IV
141
Figure 4
DNA binding activity of HIF-1 in Z. viviparus whole cell extracts from the liver after 2 h of heat exposure to 18, 22 and
26°C as well as after 24 h recovery (recov.) from these temperatures.
A: signal intensity of HIF-1 DNA binding to the human erythropoietin enhancer. Lanes 1: unstressed, 2: 1°C, 3: 1°C
recovery, 4: 5°C, 5: 5°C recovery, 6: 18°C, 7: 18°C recovery, 8: 22°C, 9: 22°C recovery, 10: 26°C, 11: 26°C recovery;
data taken from the heat stress experiment (this study) and from cold stress (Heise et al. part A). B: HIF-1 DNA binding.
Means ± standard deviation, n = 4-5, * = significantly different from the unstressed group, p < 0.05. C: Linear regression
demonstrating increased HIF-1 DNA binding at a more reduced redox environment (R² = 0.3, n = 50, p < 0.05, Statview
5.0). Data taken from the heat stress experiment (this study) and from cold stress (Heise et al. part A).
redox potential ∆E (mV)
-290-280-270-260-250-240-2300HIF
-1 D
NA
bin
ding
act
ivity
(EM
SA s
igna
l int
ensi
ty; %
)
0
2
4
6
8
10
12
14
16
18
C
unstressed 18°C 18°C recov. 22°C 22°C recov. 26°C 26°C recov.HIF
-1 D
NA
bin
ding
act
ivity
(EM
SA s
igna
l int
ensi
ty, %
)
0
2
4
6
8
10
12
14
*
B

PUBLICATION IV
142
Figure 5
Glutathione redox chemistry in Z. viviparus liver samples after 2 h of exposure to 18°C as well as after 2, 8 or 12 h of
recovery (recov.). A: content of reduced glutathione (GSH), B: content of oxidized glutathione (GSSG), C: total
glutathione content (2GSSG+GSH), D: glutathione redox ratio (2GSSG/GSH), E: redox potential ∆E at in situ
temperature and in situ intracellular pH (adopted from Sartoris et al. 2003, Larsen et al. 1997) calculated after Schaffer &
Buettner (2001). Means ± standard deviation, n = 4-5, * = significantly different from the unstressed group, p < 0.05, ww
= wet weight.
unstressed 18°C 2h recov. 8h recov. 12h recov.
redo
x po
tent
ial ∆
E (m
V)
-280
-270
-260
-250
-240
0
E
unstressed 18°C 2h recov. 8h recov. 12h recov.
GSH
con
tent
(µm
ol *
g w
w-1
)
0.0
0.5
1.0
1.5
2.0
2.5
*
*
* *
A
unstressed 18°C 2h recov. 8h recov. 12h recov.
GSS
G c
onte
nt (µ
mol
* g
ww
-1)
0.0
0.1
0.2
0.3
0.4
0.5
0.6
B
unstressed 18°C 2h recov. 8h recov. 12h recov.
tota
l glu
tath
ione
con
tent
(2G
SSG
+GSH
; µm
ol *
g w
w-1
)
0.0
0.5
1.0
1.5
2.0
2.5
3.0
3.5
*
*
* *C
unstressed 18°C 2h recov. 8h recov. 12h recov.
glut
athi
one
redo
x ra
tio (2
GSS
G/G
SH)
0.0
0.2
0.4
0.6
0.8
1.0
1.2
1.4
D

PUBLICATION IV
143
Figure 6 Oxidative stress markers in Z. viviparus liver samples after 2 h of heat exposure to 18°C as well as after 2, 8 or 12 h of
recovery (recov.). A: tert-butyl hydroperoxide initiated chemiluminescence indicating imbalance between pro- and
antioxidant processes, B: carbonyl content indicating protein oxidation. Means ± standard deviation, n = 3-5, * =
significantly different from the unstressed group, p < 0.05.
unstressed 18°C 2h recov. 8h recov. 12h recov.
carb
onyl
con
tent
(nm
ol C
O *
mg
prot
ein-1
)
0.0
0.2
0.4
0.6
0.8
1.0
1.2
1.4
1.6* B
*
unstressed 18°C 2h recov. 8h recov. 12h recov.
chem
ilum
ines
cenc
e (a
rea
* 108 *
mg
prot
ein-1
)
0.0
0.2
0.4
0.6
0.8
1.0
1.2
1.4
A*

PUBLICATION IV
144

ADDITIONAL RESULTS
145
4. Additional results
In the following section I will present additional results which are not included in any of
the publications I - IV.
4.1. Unknown thiol peak in liver samples from P. brachycephalum
In publication I data of glutathione-related parameters (GSH, GSSG, total glutathione,
glutathione redox ratio) determined in the liver tissue of P. brachycephalum, acclimated to
0 and 5°C are presented. The HPLC spectrum of FDNB-derivatised liver samples from
P. brachycephalum revealed the presence of an additional thiol peak (termed: “unknown
peak”) eluting before the peak of the internal standard γ-glutamyl-glutamate. The unknown
compound displayed an extremely large peak area; hence the compound may be present in
very high concentrations. (For comparison: peak area of the unknown compound was
about 42 000 000 arbitrary units vs. about 700 000 units for GSH obtained from liver
samples of both eelpout species.) However, it has to be admitted that a large peak area may
not always be linked to a high concentration of a compound, because different substances
may display different reactivities towards FDNB (M. Köck, pers. com.).
Pb 0°C Pb 5°C Zv 6°C Zv 12°C
peak
are
a
0
1e+7
2e+7
3e+7
4e+7
5e+7* #
Fig. 4.1: Peak area of unknown thiol peak detected in FDNB-derivatised liver samples of P. brachycephalum (Pb) and Z. viviparus (Zv), maintained at different environmental temperatures. * intra-species comparison, significantly different to the respective warmer water temperature. n.d = not determined, # inter-species comparison, significant difference between Pb 0°C and Zv 6°C, n = 4-7, p < 0.05.
The peak area, thus the concentration of the thiol compound was dependent on
acclimation temperature (fig. 4.1). A similar peak could be detected in liver samples from
Z. viviparus, however, at much lower concentrations, with peak area also depending on
environmental temperature. In 12°C Z. viviparus the peak area of the unknown compound
n.d.
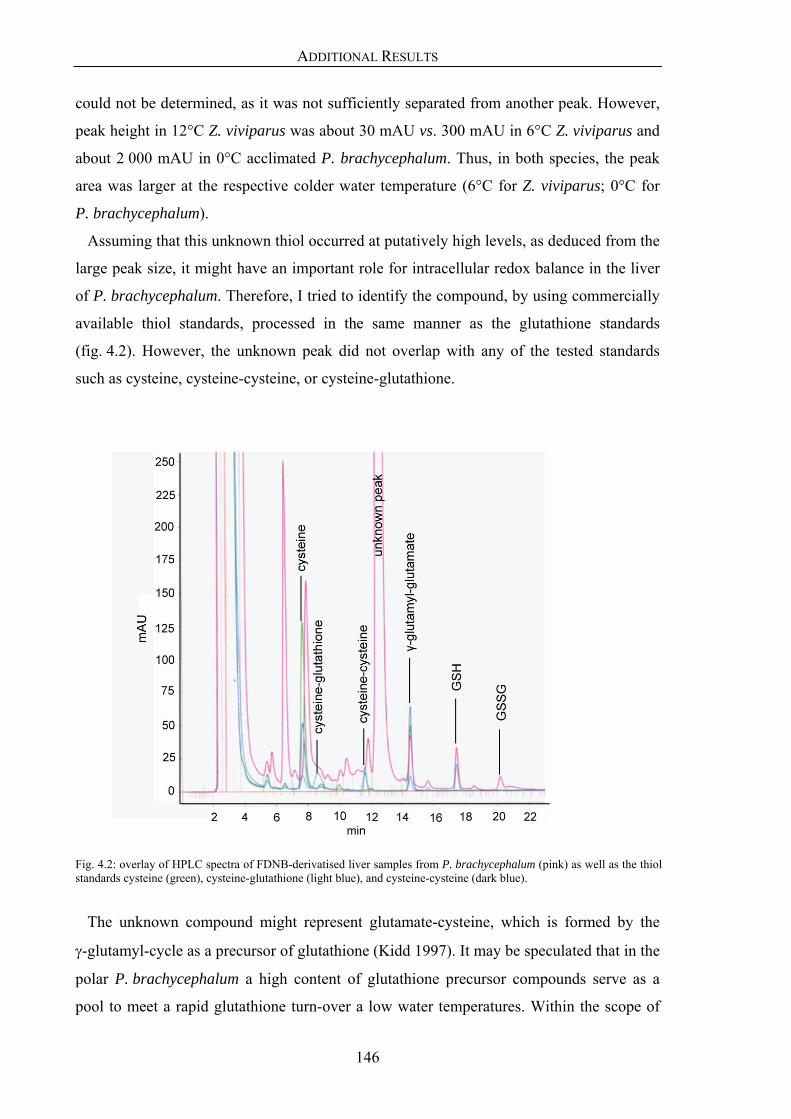
ADDITIONAL RESULTS
146
could not be determined, as it was not sufficiently separated from another peak. However,
peak height in 12°C Z. viviparus was about 30 mAU vs. 300 mAU in 6°C Z. viviparus and
about 2 000 mAU in 0°C acclimated P. brachycephalum. Thus, in both species, the peak
area was larger at the respective colder water temperature (6°C for Z. viviparus; 0°C for
P. brachycephalum).
Assuming that this unknown thiol occurred at putatively high levels, as deduced from the
large peak size, it might have an important role for intracellular redox balance in the liver
of P. brachycephalum. Therefore, I tried to identify the compound, by using commercially
available thiol standards, processed in the same manner as the glutathione standards
(fig. 4.2). However, the unknown peak did not overlap with any of the tested standards
such as cysteine, cysteine-cysteine, or cysteine-glutathione.
Fig. 4.2: overlay of HPLC spectra of FDNB-derivatised liver samples from P. brachycephalum (pink) as well as the thiol standards cysteine (green), cysteine-glutathione (light blue), and cysteine-cysteine (dark blue).
The unknown compound might represent glutamate-cysteine, which is formed by the
γ-glutamyl-cycle as a precursor of glutathione (Kidd 1997). It may be speculated that in the
polar P. brachycephalum a high content of glutathione precursor compounds serve as a
pool to meet a rapid glutathione turn-over a low water temperatures. Within the scope of

ADDITIONAL RESULTS
147
this thesis it was not possible to further clarify the identity and function of the unknown
thiol compound.
Additional standards could be tested in future studies. Also, methods such as HPLC mass
spectroscopy could be applied for chemical characterisation of the compound.

ADDITIONAL RESULTS
148
4.2. Cloning and sequencing of the Hypoxia-inducible factor
4.2.1 HIF-1α
Zoarcid full length HIF-1α cDNA sequences were identified with sizes of 3 383
(Z. viviparus) and 3 283 (P. brachycephalum) base pairs (fig. 4.3) with an open reading
frame of 2 244 base pairs, coding for 747 amino acids (fig. 4.4). The zoarcid nucleotide
sequences displayed 96% identity. The identity level was 40 - 41% to the human (Hs)
sequence and 47 - 63% to different fish sequences (tab. 4.1).
Tab. 4.1: Identities within full length HIF-1α cDNA sequences of Zoarces viviparus (Zv; DQ089695) and Pachycara brachycephalum (Pb; DQ089691) to the sequences of rainbow trout Oncorhynchus mykiss (Om; AF304864), grass carp Ctenopharyngodon idella (Ci; AY326951) and zebrafish Danio rerio (Dr; AY450269) as well as human Homo sapiens (Hs; 31077212). bp = base pairs.
Identity to Zv Identity to Pb Om 2299 bp = 63% 2293 bp = 63% Ci 1936 bp = 50% 1925 bp = 50% Dr 1924 bp = 47% 1917 bp = 47% Hs 1628 bp = 41% 1622 bp = 40%
The deduced amino acid sequences of HIF-1α showed 96% identity (97% similarity)
between both zoarcids, 61 - 71% identity (72 - 83% similarity) to other fishes and 50%
identity (64% similarity) to the human sequence (tab. 4.2).
Tab. 4.2: Identities within deduced full length HIF-1α amino acid sequences of Zoarces viviparus (Zv; DQ089695) and Pachycara brachycephalum (Pb; DQ089691) to the sequences of rainbow trout Oncorhynchus mykiss (Om; AF304864), grass carp Ctenopharyngodon idella (Ci; AY326951) and zebrafish Danio rerio (Dr; AY450269) as well as human Homo sapiens (Hs; 31077212). aa = amino acid.
identity similarity Zv Pb Zv Pb Om 548 aa = 71% 548 aa = 71% 93 aa = 12% 96 aa = 12% Ci 481 aa = 62% 479 aa = 61% 96 aa = 12% 100 aa = 12% Dr 485 aa = 62% 481 aa = 61% 88 aa = 11% 92 aa = 11% Hs 421 aa = 50% 421 aa = 50% 117 aa = 14% 123 aa = 14%
Functional sites of HIF-1α such as the basic Helix-Loop-Helix (bHLH) domain, PAS A
and PAS B domains, the oxygen-dependent degradation domain (ODD), as well as the two
transactivation domains N-TAD and C-TAD were identified in the deduced amino acid
sequences of zoarcid HIF-1α (fig. 4.4). Moreover, the hydroxyl-accepting asparagine
residue of the C-TAD (Asn803 in HsHIF-1α) as well as the functional lysine residue of the
ODD (Lys532 in HsHIF-1α) were conserved in both zoarcid sequences. By contrast, only
ZvHIF-1α displayed both hydroxyl-accepting proline residues within the ODD, whereas in

ADDITIONAL RESULTS
149
PbHIF-1α the N-terminal proline (Pro402 in HsHIF-1α) was substituted by leucine
(fig. 4.4).

ADDITIONAL RESULTS
150

ADDITIONAL RESULTS
151
Fig. 4.3: Full length HIF-1α cDNA sequences of P. brachycephalum (Pb; DQ089690) and Z. viviparus (Zv; DQ089695) in 5`-3` direction. The black line below the sequences indicates the open reading frames. The C-T nucleotide conversion leading to Pro-Leu substitution in the deduced amino acid sequence of PbHIF-1α is highlighted in red.

ADDITIONAL RESULTS
152
Fig. 4.4: Deduced full length amino acid sequences of HIF-1α of P. brachycephalum (Pb; DQ089691) and Z. viviparus (Zv; DQ089695) in C-N direction. Black boxes indicate functional domains, the red line below the sequence mark the oxygen-dependent degradation domain (ODD) adopted from Soitamo et al. (2001). N-TAD = N-terminal transactivation domain, C-TAD = C-terminal transactivation domain. LXXLXP represents the binding motif for prolyl hydroxylases (Huang et al. 2002). Functional amino acids are highlighted in red, cysteines in ODD and C-TAD blue. The Pro-Leu substitution of the N-terminal proline residue (Pro402 in human HIF-1α) in P. brachycephalum is marked red.

ADDITIONAL RESULTS
153
4.2.2 HIF-2α
Upon amplification of a HIF-1α fragment using primer pair III (see “Material & Methods”)
an additional fragment of 1 497 nucleotides was detected in PCR samples of the
notothenioids T. hansoni and C. myersi and identified as HIF-2α. Fig. 4.5 depicts the
determined cDNA sequences, aligned with HIF-2α of the killifish Fundulus heteroclitus
(Fh) and fig. 4.7 shows the deduced amino acid sequences, aligned with the sequences of
F. heteroclitus (Fh) and the grass carp Ctenopharyngodon idella (Ci). The partial HIF-2α
nucleotide sequences displayed 91% identity between the notothenioids, and 65 - 66% to
the killifish. The deduced amino acid sequences had 80% identity (82% similarity)
between notothenioids and had 50 - 57% identity (61 - 67%% similarity) to the partial
killifish sequence (Fh). Less conservation was found compared to the partial grass carp
sequence (Ci) with 42 - 48% identity (55 - 62% similarity) (tab. 4.3 and phylogenetic tree
in fig. 4.6).
Tab. 4.3: Identities and similarities within deduced amino acid of partial HIF-2α sequences (C-terminal half) of Chionodraco myersi (Cm; DQ089690), Trematomus hansoni (Th; DQ089693), Ctenopharyngodon idella (Ci, AY577524), Fundulus heteroclitus (Fh, AF402782) and Homo sapiens (Hs, BC051338).
Identity / similarity Cm Th Ci Fh Hs Cm - 80% / 82% 42% / 55% 50% / 61% 34% / 44% Th 80% / 82% - 48% / 62% 57% / 67% 36% / 47% Ci 42% / 55% 48% / 62% - 38% / 51% 38% / 51% Fh 50% / 61% 57% / 67% 43% / 59% - 34% / 51% Hs 34% / 44% 36% / 47% 38% / 51% 34% / 49% -
Despite low identities (similarities) of 42 - 80% (55 - 82%) of the C-terminal half of
HIF-2α sequences between fishes, as well as between fishes and human with 34 - 38%
identity (44 - 51% similarity), functional proline residues and the LXXLXP motif for PHD
binding in the ODD as well as the functional asparagine residue and di-leucine repeats in
the C-TAD were conserved in all sequences (fig. 4.7). Additionally, a Glu cluster,
comprising 6 residues in ThHIF-2α and 15 residues in CmHIF-2α, located C-terminal of
the functional proline residues, was identified.
To clarify the centre part of the 1 497 bp fragments of notothenioid HIF-2α, an additional
primer pair (IV; see Material & Methods) was constructed yielding a 637 bp product at
position 438-1075 on partial CmHIF-2α cDNA. Sequencing of plasmids obtained from
different clones revealed an alternative HIF-2α variant in C. myersi (fig. 4.5). The deduced
amino acid sequence missed the proline and arginine residue at position 191 - 192 of the
earlier sequence, but displayed two additional glutamate residues in the Glu cluster.

ADDITIONAL RESULTS
154

ADDITIONAL RESULTS
155
Fig. 4.5: Partial HIF-2α cDNA sequences (C-terminal half) of Chionodraco myersi (Cm; DQ089690), Trematomus hansoni (Th; DQ089693) and Fundulus heteroclitus (Fh, AF402782) in 5`-3` direction. Moreover, a different variant of partial CmHIF-2α cDNA obtained with primer pair IV (HIF2-F1, HIF2-B1; see tab. 2.2 in Material & Methods; unpublished).
Fig. 4.6: Phylogenetic analysis of the C-terminal half of fish HIF-2α amino acid sequences of the notothenioids Chionodraco myersi (Cm; DQ0896690) and Trematomus hansoni (Th; DQ0896693), the cyprinid Ctenopharyngodon idella (Ci, AY577524) and the cyprinidontid Fundulus heteroclitus (Fh, AF402782). The tree was calculated by the Neighbour Joining method (best tree; tie breaking = Systematic; Distance: Uncorrected “p”; Gaps distributed proportionally with the human sequence (Hs; BC051338) as out-group. Tree calculation by bootstrap (1000 repeats) resulted in the same cluster with all bootstrap values being 100% (not shown).
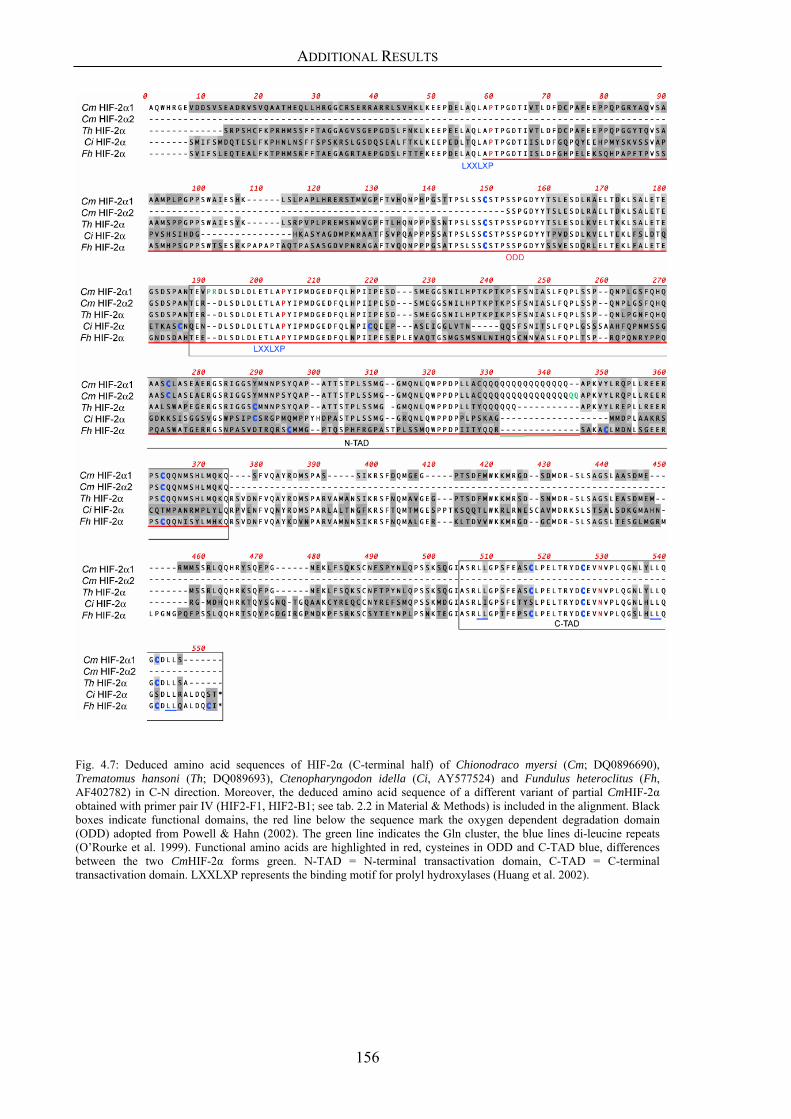
ADDITIONAL RESULTS
156
Fig. 4.7: Deduced amino acid sequences of HIF-2α (C-terminal half) of Chionodraco myersi (Cm; DQ0896690), Trematomus hansoni (Th; DQ089693), Ctenopharyngodon idella (Ci, AY577524) and Fundulus heteroclitus (Fh, AF402782) in C-N direction. Moreover, the deduced amino acid sequence of a different variant of partial CmHIF-2α obtained with primer pair IV (HIF2-F1, HIF2-B1; see tab. 2.2 in Material & Methods) is included in the alignment. Black boxes indicate functional domains, the red line below the sequence mark the oxygen dependent degradation domain (ODD) adopted from Powell & Hahn (2002). The green line indicates the Gln cluster, the blue lines di-leucine repeats (O’Rourke et al. 1999). Functional amino acids are highlighted in red, cysteines in ODD and C-TAD blue, differences between the two CmHIF-2α forms green. N-TAD = N-terminal transactivation domain, C-TAD = C-terminal transactivation domain. LXXLXP represents the binding motif for prolyl hydroxylases (Huang et al. 2002).
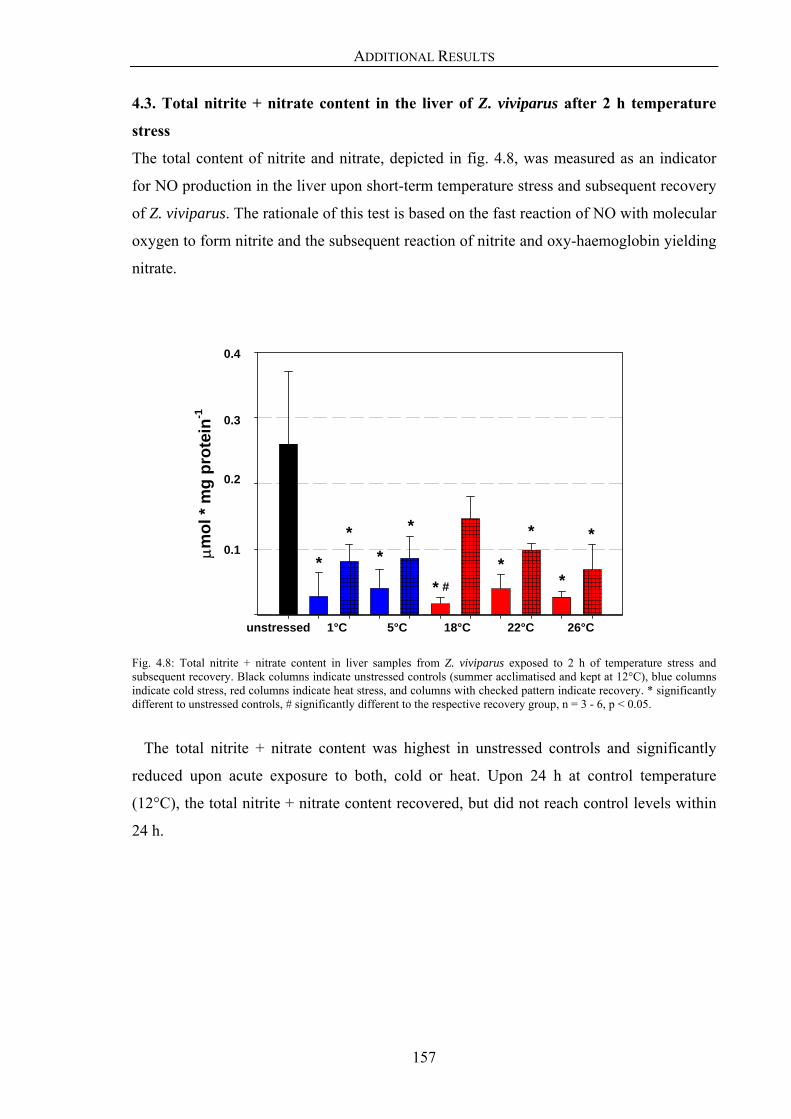
ADDITIONAL RESULTS
157
4.3. Total nitrite + nitrate content in the liver of Z. viviparus after 2 h temperature
stress
The total content of nitrite and nitrate, depicted in fig. 4.8, was measured as an indicator
for NO production in the liver upon short-term temperature stress and subsequent recovery
of Z. viviparus. The rationale of this test is based on the fast reaction of NO with molecular
oxygen to form nitrite and the subsequent reaction of nitrite and oxy-haemoglobin yielding
nitrate.
Fig. 4.8: Total nitrite + nitrate content in liver samples from Z. viviparus exposed to 2 h of temperature stress and subsequent recovery. Black columns indicate unstressed controls (summer acclimatised and kept at 12°C), blue columns indicate cold stress, red columns indicate heat stress, and columns with checked pattern indicate recovery. * significantly different to unstressed controls, # significantly different to the respective recovery group, n = 3 - 6, p < 0.05.
The total nitrite + nitrate content was highest in unstressed controls and significantly
reduced upon acute exposure to both, cold or heat. Upon 24 h at control temperature
(12°C), the total nitrite + nitrate content recovered, but did not reach control levels within
24 h.
control 1°C rec. 5°C rec. 18°C rec. 22°C 2 rec. 26°C 26 rec.
µmol
* m
g pr
otei
n-1
0,0
0,1
0,2
0,3
0,4
**
*
*
*
**
**
#
unstressed 1°C 5°C 18°C 22°C 26°C
0.4
0.3
0.2
0.1

ADDITIONAL RESULTS
158
4.4. Studies on isolated fish hepatocytes
4.4.1. MitoTracker Green FM staining of Z. viviparus hepatocytes
Mitochondrial density in Z. viviparus hepatocytes was visualised by staining the cells with
the fluorophor MitoTracker Green FM and subsequent confocal imaging. Fig. 4.9 depicts a
typical set of scans throughout hepatocytes with 2 µm sections.
Fig. 4.9: Typical example of confocal imaging of mitochondrial density in Z. viviparus hepatocytes. Image size (xy-z): 50 µm² * 18 µm; 2 µm sections; zoom 2.0. Properties: 100x / 1.40 - 0.70 oil immersion lens, excitation wavelength 488nm, laser power 46, confocal pinhole 0.7, emission filter 580 nm, photomultiplier voltage 732, offset -3, glow mode, slow scan speed, accumulation of 8 scans / picture.
Mean hepatocyte volume was 2 100 ± 800 µm³, although the complete range comprised
sizes from 100 to 6 000 µm³. In contrast to invertebrate cells containing only 30 - 40

ADDITIONAL RESULTS
159
mitochondria per cell (Abele et al. 2002), which can easily be counted, quantification of
mitochondrial numbers cannot be assessed in Z. viviparus hepatocytes with this technique,
due to the far higher mitochondrial densities.
4.4.2. Measurement of ROS production in fish hepatocytes using H2DCFDA
fluorescence
According to the product information of Molecular Probes (Eugene, USA) H2DCFDA
(dichlorodihydrofluorescein diacetate) is oxidised by ROS such as H2O2, peroxyl radicals
and peroxinitrite anion to the fluorescent DCF (fluorescin) and thus, can be used for
intracellular reactive oxygen species detection. However, control assays using radical
scavengers have to be carried out to prove ROS-specificity of the fluorescent oxidation.
Horse-radish peroxidase (HRP), increasing H2O2 formation as well as catalase, decreasing
H2O2 formation cannot be used to prove for H2DCFDA fluorescence specific for
intracellular ROS formation, as both substances react with this dye leading to an increase
of ROS-unspecific fluorescence (E. Philipp, unpubl. observ., Hempel et al. 1999).
Therefore, the spin trap POBN to quench any radical species (Janzen 1971) was used to
test the ROS-specificity of fluorescent signals.
Comparison of confocal images with transmission images, depicted in fig. 4.10, reveals
two types of cells, circular cells being hepatocytes, as well as cylindrical cells being
erythrocytes, which were not completely removed during the isolation process. Following
aggregation of H2DCFDA fluorescence developed only in the hepatocytes (fig. 4.10).
Fig: 4.10: Confocal scans of fluorescence of Z. viviparus hepatocytes 22 min after aggregation of 50 µM H2DCFDA. Image on the left side: confocal scan; image on the right side: associated transmission image. Fluorescence can be observed only in circular cells being hepatocytes, but not in cylindrical cells being erythrocytes.
Fluorescence of hepatocyte solutions of Z. viviparus was imaged once every 2 min over a
40 min time interval by confocal microscopy. The image series in the upper part of fig.

ADDITIONAL RESULTS
160
4.11 shows progressively increasing fluorescence over a 40 min time interval following
addition of 50 µM H2DCFDA. By contrast, upon concomitant aggregation of 50 µM
H2DCFDA and 5 mM POBN, fluorescence appeared depressed within the same time
period (image series in the lower part of fig. 4.11). Thus, increasing fluorescence,
indicating accumulation of the fluorescent dye DCF may be attributed to oxidation by ROS
generated from Z. viviparus hepatocytes.

ADDITIONAL RESULTS
161
Fig. 4.11: Confocal scans of fluorescence of Z. viviparus hepatocytes, recorded every 2 min over a 40 min time period. The image series in the upper part shows progressively increasing fluorescence of hepatocytes after addition of 50 µM H2DCFDA. By contrast, the image series in the lower part shows depression of fluorescence in hepatocytes after concomitant aggregation of 50 µM H2DCFDA and 5 mM of the spin trap POBN. Image size (xy): 100 µm²; Properties: 100x / 1.40 - 0.70 oil immersion lens, excitation wavelength 488 nm, laser power 29 (without POBN) or 39 (with POBN), confocal pinhole 0.7, emission filter 505 nm, photomultiplier voltage 721, offset -8, glowover mode, slow scan speed, accumulation of 4 scans / picture.

ADDITIONAL RESULTS
162

DISCUSSION
163
5. Discussion
The presented thesis investigated long-term and short-term in vivo impacts of
environmental temperature and graded temperature stress, supposed to induce various
degrees of functional hypoxia, on oxidative stress and hypoxic signalling in marine fish
from different latitudes. In the following section, I will discuss the data presented in
publications I - IV and in the section “additional results”.
5.1. Oxidative stress and ROS generation in the liver of zoarcids
To answer the questions addressed in this work, whole animal experiments were carried
out, where fishes were maintained at different temperatures, with subsequent freezing of
sampled tissues. This set-up does, however, not allow for direct measurements of ROS
generation in the living fish. Thus, oxidative stress levels were determined in frozen
samples of experimental animals by analysing oxidative damage markers. It has to be
considered that altered concentrations of, e.g. TBARS or protein carbonyls might not
always be indicative of unbalanced pro- and antioxidant processes. Although this is
hypothetical, they may also result from different velocities of repair at varying
experimental temperatures, while the net ROS generation rates may be unchanged due to
parallel changes of ROS producing and scavenging processes (M. Nikinmaa, pers. com.).
Therefore, I used a combination of several oxidative damage and AOX markers to assess
oxidative stress levels. Moreover, exposure to a source of free radicals allows for the
evaluation of the ex vivo susceptibility of lipids to oxidation e.g. by tBOOH-induced
chemiluminescence (Dotan et al. 2004). By this assay, occurrence of oxidative stress under
experimental conditions in the fish can be delineated from the ex vivo ROS generation
(mainly singlet oxygen and excited carbonyl groups), which is higher in a tissue where
antioxidants have been depleted during experimental exposure. Chemiluminescence rates
in this assay detect oxidative stress resulting from an imbalance of pro-oxidant processes
and low molecular weight antioxidants, but are not affected by enzymatic AOX defence
(Gonzalez Flecha et al. 1991).
In vitro studies with isolated liver mitochondria of Zoarces viviparus were unable to
detect any H2O2 release to the medium when using the fluorescent dye homovanillic acid
(Abele et al. 2004). Therefore, confocal microscopy and the fluorescent dye H2DCFDA
were used in an initial approach to visualise the ROS generation of isolated Z. viviparus
hepatocytes. The obtained results must be considered preliminary. However, the increasing

DISCUSSION
164
fluorescence over time can be interpreted as continuous basal generation of reactive
oxygen species in Z. viviparus hepatocytes, as addition of the spin trap POBN depressed
fluorescence within the experimental time span (fig. 4.11 in “additional results). Future
studies have to evaluate the type and also the main cellular sources of ROS generated in
Z. viviparus hepatocytes.
5.2. Higher oxidative stress levels in polar fish living at permanently low
temperatures?
- comparison of the Antarctic (P. brachycephalum) and the temperate eelpout (Z. viviparus) -
Polar marine ectotherms are characterised by a higher content of unsaturated fatty acids in
order to maintain membrane fluidity at low water temperature (Sidell 1998). In line with
this common observation, higher concentration of unsaturated fatty acids were found in
Antarctic eelpout, Pachycara brachycephalum, compared to the con-familial common
eelpout Zoarces viviparus from the German North Sea (E. Brodte, pers. com). It has been
suggested that higher levels of lipid unsaturation in combination with the enhanced
aqueous oxygen solubility at cold temperatures render polar ectotherms vastly more
sensitive to oxidative damage from lipid peroxidation processes (for review Abele &
Puntarulo 2004). To test this hypothesis, I studied a wide array of oxidative stress
parameters in liver samples of the zoarcids, P. brachycephalum kept at its habitat
temperature of 0°C, and Z. viviparus winter acclimatised to 6°C. Lipid radical generation
rates measured by EPR spin trapping (fig. 1 and tab. 1 in publ. I) were indeed higher in
liver microsomes of P. brachycephalum. However, TBARS content, which is an indicator
for lipid peroxidation products, was only one half of that found in Z. viviparus (tab. 2 in
publ. I). It might be that other lipid peroxidation products prevail in the polar zoarcid,
which are not detected by the TBARS assay. In mammalian tissues, TBARS such as MDA,
which are highly toxic, causing protein cross-links and interacting with DNA bases, are
rapidly metabolised (Halliwell & Gutteridge 1999). Therefore, a lower TBARS content
despite higher lipid radical formation rates may reflect successful cleavage of such
products in P. brachycephalum. This suggestion is supported by the finding that lipid
radicals were only detectable in liver microsomes void of antioxidants, but not in liver
homogenates, which contain all cellular antioxidants. Lower tBOOH-induced
chemiluminescence rates (tab. 2 in publ. I) in P. brachycephalum than in Z. viviparus,
reflect high AOX capacity due to elevated levels of low molecular weight antioxidants

DISCUSSION
165
(Gonzalez Flecha et al. 1991). Indeed, both α-tocopherol and total glutathione were two to
three times higher in the polar compared to the temperate eelpout (tab. 3 in publ. I).
Interestingly, glutathione was oxidised to 50%, or even higher in some specimens of
P. brachycephalum, resulting in a significantly more oxidised redox potential (∆E). As far
as I know, this is the highest GSSG / GSH ratio reported for fish (tab. 5.1).
Tab. 5.1: Glutathione-related parameters in the liver tissue of several fish species. Contents are given in µmol * g wet weight-1. n.d. = not determined.
fish species origin climate / water temperature
GSH GSSG total glutathione
2GSSG/GSH
reference
Pachycara brachycephalum
Antarctic, marine
polar 0°C
2.1 3.1 8 2.7 this study
Zoarces viviparus Germany, marine
temperate, 6°C (winter)
1.0 0.8 2.5 1.8 this study
Zoarces viviparus Germany, marine
temperate, 10°C (autumn)
0.8 0.3 1.4 0.7 this study
Zoarces viviparus Germany, marine
temperate, 12°C (summer)
0.9 0.16 1.2 0.36 this study
Sparus aurata (gilthead seabreams)
Spain, marine
subtropical 20°C
4.4 0.04 4.48 0.02 Pascual et al. 2003
Salvelinus alpinus (Arctic charr)
Finland, freshwater
temperate, 10°C 14°C
1.44 1.08
0.05 0.05
1.55 1.19
0.07 0.09
Ritola et al. 2000
Oncorhynchus mykiss (rainbow trout)
Finland, freshwater
temperate, autumn
1.3 0.12 1.54 0.19 Ritola et al. 1999
Oncorhynchus mykiss (rainbow trout)
Sweden, freshwater
temperate, 10°C 1.36 1.17 1.45 1.14
0.09 0.04 0.10 0.03
1.54 1.25 1.65 1.20
0.13 0.07 0.14 0.05
Stephensen et al. 2002
Ameriurus nebulosus (brown bullhead)
Ictalurus punctatus (channel catfish)
USA, freshwater
temperate, 20°C
n.d. n.d. 1.3
1.4
n.d Ploch et al. 1999
Anguilla anguilla (european eel)
Spain, freshwater
20°C 0.21 0.03 0.27 0.29 Pena et al. 2000
Such extremely high GSSG concentrations might indicate excessive oxidative stress in
the liver of this species. They also underline the importance of glutathione as an
antioxidant effectively protecting cellular constituents from oxidative damage by forming
lipid radicals, as reflected in low TBARS contents as well as low protein oxidation and
chemiluminescence rates compared to the temperate eelpout. Moreover, the high degree of
glutathione oxidation is quite surprising, as GSSG rarely exceeds 10% of total glutathione
in healthy cells (Kidd 1997). Generally, over-produced GSSG molecules are rapidly
exported from hepatocytes because they can have deleterious effects on cell integrity and
physiological processes (Reed 1990). Through protein-S-thiolation, GSSG can modify the
activity of important metabolic enzymes (Klatt & Lamas 2000). However, the fact that
such high degrees of glutathione oxidation were found in unstressed animals illustrates that
they are not harmful for P. brachycephalum. It might be that in this polar fish, metabolic

DISCUSSION
166
processes adapted to function at low temperatures are also adapted to operate in a different,
more oxidised redox environment. As glutathione concentrations are not available for other
Antarctic fish is not clear, if a highly oxidised glutathione redox ratio represents a specific
polar characteristic. It may also be a consequence of 2 to 6 times higher total glutathione
levels in P. brachycephalum compared to other fishes (tab. 5.1).
It has been suggested that the high susceptibility of polar ectotherms to oxidative damage
may become deleterious under any form of physiological stress (Abele & Puntarulo 2004).
To test this hypothesis, I investigated the response of oxidative stress parameters in the
liver of P. brachycephalum acclimated to 5°C. This temperature, although being outside
the habitat temperature range of this species (0.5 - 0.8°C, K. Mintenbeck, pers. com.), is
not supposed to be critical, as a ten months acclimation of P. brachycephalum to 5°C did
not cause reduced physiological condition factors compared to animals kept at 0°C (Lannig
et al. 2005). However, 5°C is close to the upper pejus temperature of this species (6 - 7°C;
Mark et al. 2002) when pre-acclimated to 0°C. Thus, beginning oxygen limitation together
with elevated mitochondrial respiration at 5 versus 0°C (Lannig et al. 2005) was originally
expected to induce higher oxidative stress levels. However, oxidative damage parameters
were only slightly elevated in warm acclimated versus control P. brachycephalum. Only
TBARS content was significantly higher compared to control fish kept at 0°C, but
temperature induced changes in TBARS levels were much lower than changes observed in
Z. viviparus upon seasonal acclimatisation (tab. 2 in publ. I). Also, the redox environment
remained constant during warm acclimation of P. brachycephalum. It appears that
particularly the redox couple glutathione charges the liver tissue of this polar fish with such
a high AOX capacity that oxidative damage is not augmented upon warm acclimation.
Recently, Mark et al. (in revision) reported higher UCP2 expression in 5°C versus 0°C
acclimated P. brachycephalum. UCP2 might increase mitochondrial proton leak and thus,
reduce the mitochondrial membrane potential and superoxide generation (Skulachev 1996).
Thus, increased UCP2 levels might represent a means for P. brachycephalum to control
mitochondrial ROS production upon warming. Moreover, Lannig et al. (2005) have shown
reduced liver aerobic capacities in P. brachycephalum upon 5°C acclimation, which is seen
as a physiological response typical for cold-eurythermal animals (Pörtner 2002). Probably,
P. brachycephalum has to be considered more eurythermal than other Antarctic animals.
Thus, the presented findings support previous conclusions that P. brachycephalum is able
to warm acclimate and adjust life functions including positive growth to higher
temperatures (Storch et al. 2005, Lannig et al. 2005, Brodte et al. ms submitted). This

DISCUSSION
167
assumption is further supported by the observation that in contrast to the Antarctic zoarcid,
several benthic Antarctic notothenioids survived warm acclimation to 4°C only for a few
weeks (Weinstein & Somero 1998). However, recent findings in the more active pelagic
Pagothenia borchgrevinki have shown an unexpected capacity to warm acclimate (Lowe et
al. 2005).
Altogether the presented data demonstrate only a minor impact of sub-critical alterations
of ambient water temperature on oxidative stress levels in the liver of the Antarctic eelpout
P. brachycephalum, probably because the species is able to warm acclimate and because
the AOX capacity provided by the glutathione redox couple is highly efficient, to
counteract the high risk for oxidative damage resulting from lipid peroxidation processes.
By contrast, different oxidative stress levels were observed in the temperate eelpout
Z. viviparus upon seasonal temperature changes within the natural temperature range (for
ambient water temperatures at Helgoland see fig. 8.1 in the appendix). Comparison of
summer acclimatised Z. viviparus kept at 12°C with winter animals kept at 6°C revealed
lower overall AOX capacities (lower α-tocopherol contents and lower GPX activities at
similar SOD activities) and higher levels of oxidative damage markers (TBARS, protein
carbonyl and chemiluminescence rates) in 6°C acclimated winter fish (tab. 2 in publ. I).
The apparent increase in oxidative stress was also reflected in a more oxidised glutathione
redox ratio (tab. 3 in publ. I).
It can be concluded that both, the development of cold adaptation features of the polar
eelpout P. brachycephalum, as well as the expression of seasonal cold acclimatisation
characteristics of the temperate eelpout Z. viviparus were associated with higher levels of
oxidative stress, mainly visible in a highly oxidised cellular redox environment.
5.3. Influence of high oxygen contents and oxidative stress levels on the HIF
mechanism?
- comparison of HIF sequences and DNA binding activity in polar and temperate fish -
Low environmental temperatures in combination with high oxygen solubility may be the
cause for a variety of adaptations in the oxygen-transport systems of Antarctic fish (Wells
et al. 1980, Acierno et al. 1997). Very low haematocrit values are characteristic for
Antarctic notothenioids and zoarcids, with an extreme effectuation of this adaptation in
icefishes completely void of red blood cells (Davison et al. 1997, Mark et al. 2002). Such
modifications together with an extremely oxidised cellular redox environment could cause

DISCUSSION
168
disturbances of the HIF signalling mechanism or might produce a need for functional
adjustments of this system to ensure oxygen-dependent gene expression in polar fishes.
In an initial step to test this hypothesis, I characterised full length HIF-1α cDNA
sequences of the zoarcids P. brachycephalum and Z. viviparus as well as partial cDNA
sequences comprising the C-terminal half of HIF-1α of two red-blooded notothenioids
(Trematomus hansoni and T. pennellii) and an icefish Chionodraco myersi (publ. II).
Moreover, I identified a partial cDNA sequence of HIF-2α in T. hansoni and C. myersi
(fig. 4.5 in “additional results”). The detection of HIF-α sequences by RT-PCR in all four
polar species, confirms constitutive expression of these genes. This emphasises a
ubiquitous physiological importance of the transcription factor HIF in fish, as suggested by
Nikinmaa & Rees (2005). It may also underlie the suggestion of Semenza (2004) that the
HIF-1 signalling mechanism was essential to metazoan evolution.
Within the full length cDNA sequences of zoarcid HIF-1α an open reading frame
encoding for 747 amino acids was identified (fig. 4.3 and 4.4 in “additional results”).
Several substitutions located in the ODD and the C-TAD were identified as conserved in
all Antarctic species and different from the Z. viviparus sequence (indicated by green stars
in fig. 2, publ. II), which might support a more hydrophilic character and, thus, favour
protein cold adaptation (Feller et al. 1997, D’Amico et al. 2002, Pörtner et al. in press).
Moreover, additional cysteines were noticed in the ODD of zoarcid and notothenioid
HIF-1α. This could have similar implications for the function of HIF as reported in
rainbow trout, where four cysteines in the ODD confer elevated redox-sensitivity to
HIF-1α stabilisation (Nikinmaa et al. 2004). Future studies should address the question
whether increased redox-sensitivity mediated by these cysteine residues is a special feature
for oxygen-dependent gene expression in fish. A further interesting finding was the
substitution of the single Glu365 in human HIF-1α by a Gln-Glu cluster in marine fish
HIF-1α, comprising 8 residues in the zoarcids, over 10 in Trematomus and 21 residues in
the icefish. Although the function of this cluster remains obscure, especially the glutamate
residue of the cluster will cause a highly acidic site in the respective protein region.
Most astonishing was the substitution of the N-terminal functional proline residue
(Pro402 in human HIF-1α) in P. brachycephalum by leucine (fig. 2 in publ. II, fig. 4.4 in
“additional results”). This is, so far, the only wild-type animal of this phenotype. It can be
suggested that HIF-1α might still be functional as pVHL mediated proteasomal
degradation may occur via hydroxylation of the other conserved proline residue (Masson et
al. 2001, Mazure et al. 2004).

DISCUSSION
169
However, it has been shown that mutation in any amino acid of the LXXLXP sequence,
which is the recognition motif for PHDs, can be tolerated, except in the hydroxyl-accepting
proline residues (Huang et al. 2002, Min et al. 2002). Thus, the Pro-Leu substitution in
PbHIF-1α protein could render it more stable than in other species (Ivan et al. 2001).
Consequently, the flexibility of the HIF response via the degradation / stabilisation
mechanism might be reduced in P. brachycephalum (Masson et al. 2001). By contrast,
Pro-Leu conversion within that anyway leucine-rich region may facilitate the interaction of
HIF-1 with the transcriptional co-activator p300, as leucine-rich regions have been
demonstrated to be crucial for p300 interaction with transcription factors (O’Rourke et al.
1999). It is intriguing to speculate from these structural differences that PbHIF-1
regulation may function mainly via transactivation and not so much via the degradation /
stabilisation mechanism. In the three notothenioid HIF-1α sequences both functional
prolines appeared conserved (fig. 2 in publ. II), thus the Pro-Leu substitution in PbHIF-1α
cannot be considered an essential polar adaptation.
Yet it is conceivable that different polar fishes have evolved various modifications of
their HIF mechanism. Thus, the findings of additional cysteines in functional domains,
inserts of Gln-Glu cluster and Pro-Leu substitution in HIF-1α sequences, might represent
diverse adjustments to ensure HIF mediated oxygen-dependent gene expression in cold
adapted fish, despite high oxygen solubility in the water and potentially more oxidised
cellular redox environment.
Phylogenetic comparisons suggest that several rounds of gene duplication of an ancestral
HIF-α gene led to the α-forms (Powell & Hahn 2002). HIF-1α and HIF-2α both seem to
regulate oxygen-dependent gene regulation via the same HRE element (Rose et al. 2002).
Whereas HIF-1α is ubiquitously expressed, HIF-2α is restricted to endothelial cells in
mammals (Powell & Hahn 2002). Despite apparently diverse effects of both α-subunits
during embryogenesis it is unknown, whether they play different roles during hypoxia (Gu
et al. 2000). Analysis of the C-terminal half of HIF-2α in liver samples of the notothenioids
T. hansoni and C. myersi revealed lower conservation of the deduced amino acid
sequences between both species compared to the partial HIF-1α peptides of the
notothenioids (80 versus 92% identity). However, functional proline and asparagine
residues as well as di-leucine repeats proved conserved in notothenioid HIF-2α. Similarly
to the Gln-Glu cluster in HIF-1α, both notothenioid HIF-2α sequences contained a
Glu cluster. Future studies will clarify whether the regulation of oxygen homeostasis by the
HIF response could be supported by the action of HIF-2α in Antarctic notothenioids.

DISCUSSION
170
In a second step, the HIF function was analysed at the protein level in warm acclimated
(5°C) versus control (0°C) P. brachycephalum, as well as in winter (6°C) and summer
(12°C) Z. viviparus (fig. 2.B, C in publ. I). Western blotting measuring the abundance of
HIF-1α protein could be carried out only for Z. viviparus. The available antibody,
originally produced against rainbow trout HIF-1α, did not recognise the protein in
P. brachycephalum although both eelpout HIF-1α sequences displayed high identity,
whereas the identity of Zv was considerably lower to OmHIF-1α (see above). However,
already minor differences in primary structures are sufficient for changing protein
conformation in cold adapted animals (Fields & Somero 1997, for review see Somero
2004), which might explain the failure of the rainbow trout antibody. Significant HIF-1α
protein levels could be detected with similar quantities in liver samples of both winter and
summer Z. viviparus. This result was quite surprising, as both batches of Z. viviparus,
acclimatised to temperatures well within their naturally experienced temperature regime,
have to be considered as unstressed, normoxic animals. In contrast, the HIF-1α protein
cannot be detected in the liver of normoxic mammals (Stroka et al. 2001). It is reasonable
to assume that, like in rainbow trout, HIF-1α stabilisation in unstressed eelpout may be
linked to the abundance of surplus cysteine residues in the ODD (Soitamo et al. 2001,
Nikinmaa et al. 2004). Even though HIF-1α protein levels were unchanged in both groups
of Z. viviparus, electromobility shift assays (EMSA) demonstrated higher DNA binding
activity in winter (6°C) compared to summer (12°C) animals. Moreover, water temperature
had opposite effects on HIF-1 DNA binding activity in both species, being enhanced in
cold winter Z. viviparus, and in warm acclimated P. brachycephalum as compared to
summer Z. viviparus and 0°C acclimated P. brachycephalum. Higher HIF-1 DNA binding
activity can be interpreted as induction of hypoxic signalling. Thus, in 6°C winter
Z. viviparus, the onset of hypoxic signalling could indicate physiological reorganisation to
improve oxygen supply at low temperatures. This might counterbalance the cold-induced
slow-down of oxygen delivery to central tissue regions (Pörtner 2002), and thus, prevent
severe functional hypoxia. Likewise, in warm acclimated P. brachycephalum, close to
upper pejus temperature (6 - 7°C, Mark et al. 2002), the HIF response might support
oxygen homeostasis before onset of heat-induced functional hypoxia. Thus, it appears that
HIF-1 could be a common regulatory tool to adjust tissue oxygenation upon seasonal
acclimatisation within the benevolent temperature regime (Z. viviparus) and at the border
of the thermal optimum range (P. brachycephalum).

DISCUSSION
171
Additionally, higher DNA binding activity upon warm acclimation demonstrates that
HIF-1 is still functional in P. brachycephalum, despite the Pro-Leu substitution (see above)
and despite the highly oxidised cellular redox environment.
Elevated HIF-1 DNA binding in winter versus summer Z. viviparus and constitutive,
unchanged levels of HIF-1α protein in both acclimatisation groups suggests that as
proposed for P. brachycephalum, the HIF-1 response could be regulated mainly during
later steps of the signalling cascade also in the common eelpout: Translocation, dimer
formation or transactivation could be more important than degradation / stabilisation.
Future studies at the cellular level are needed to clarify this issue.
It has to be mentioned that increased HIF-1 DNA binding occurred together with higher
TBARS levels (but unchanged redox environment) in warm acclimated P. brachycephalum
and with increased levels of oxidative damage markers together with a more oxidised
redox environment in cold winter Z. viviparus. Thus, despite the general observation that
HIF signalling is favoured at a more reduced redox environment in fish (Nikinmaa et al.
2004), higher oxidative stress levels does not seem to impair HIF induced regulation of
oxygen homeostasis in the zoarcids, upon long-term temperature changes within the
thermal optimum range. Future studies have to determine the target genes of HIF-1 in
zoarcids and notothenioids and have to show whether HIF is actually able to enhance their
expression, particularly in Antarctic species, including icefish.
5.4. Oxidative stress and hypoxic signalling induced by short-term temperature
stress?
- acute cold or heat stress and subsequent recovery studied in the temperate eelpout -
In marine ectotherms, temperatures outside the optimum range, above or below the pejus
threshold (Tp) are supposed to cause progressively decreasing oxygen levels in body fluids
and tissues, i.e. functional hypoxia (Pörtner 2002). When critical temperatures (Tc) are
reached, transition to anaerobic metabolism can be observed (Sommer et al. 1997, Van
Dijk et al. 1999). It has been suggested that onset of functional hypoxia in the pejus range
may be linked to increasing oxidative stress, becoming worse during critical temperature
stress (Pörtner 2002, Abele 2002). The following text will discuss the short-term in vivo
exposure to graded cold and heat stress ranging from pejus to critical and sub-lethal
temperatures.
Interestingly, effects of short-term (2 h) cold exposure to 1 or 5°C on liver oxidative
stress parameters were different from those of winter acclimatisation. When compared to

DISCUSSION
172
unstressed controls, protein carbonyl contents were unchanged following acute cold stress,
chemiluminescence rates in 1°C exposed Z. viviparus were only slightly higher and
TBARS in 1 and 5°C exposed fish only mildly elevated (fig. 2 in publ. III). Calculation of
the cellular redox potential at in situ pHi and in situ temperature with the Nernst equation,
using the concentrations of the glutathione redox couple, even revealed more reduced
redox conditions in both cold exposed groups compared to unstressed control fish (fig. 1.B
in publ. III). However, TBARS and carbonyl contents were higher after 24 h recovery
following cold stress, with the redox potential having returned to control levels. When
taking the increased HIF-1 DNA binding activity into account, especially after exposure to
1°C (fig. 3.D in publ. III), the sum of these results indicates temperature-induced hypoxia
during acute cold stress and reoxygenation accompanied by unbalanced oxidative stress
upon recovery. Thus, cold stress and subsequent recovery can have similar biochemical
effects in these ectotherms as the ischemia / reperfusion event described in mammals
(Jones 1986, McCord 1988, Chi & Karliner 2004). Whereas this situation is highly
pathological in mammalian tissues, the observed elevations in oxidative stress parameters
do not seem dramatic in Z. viviparus. Actually, many anoxia tolerant animals such as
goldfish, garter snakes and wood frogs have been found to deal well with oxidative stress
arising from natural situations reminiscent to ischemia / reperfusion, such as anoxia,
desiccation or freezing (Hermes-Lima & Zenteno-Savin 2002).
At first sight, short-term (2 h) heat stress and subsequent 24 h recovery did not show a
comparable ischemia / reperfusion effect on oxidative stress parameters, as
chemiluminescence rates were similar in unstressed, heat stressed, and heat recovered
Z. viviparus (fig. 3 in publ. IV). Protein carbonyls were elevated only after recovery
following 18°C, but not after recovery following more severe heat stress (22 or 26°C).
However, it seemed possible that repair of oxidative damage was simply faster following
heat than following cold stress, such that after 24 h all parameters had already returned to
control levels. Therefore, a second heat stress experiment was carried out, where
Z. viviparus were exposed to 18°C heat stress followed by shorter recovery periods of 0, 2,
8, or 12 h at acclimation temperature. In fact, chemiluminescence rates and protein
carbonyls indicated increased oxidative stress within the first 12 h of recovery, supporting
the idea of faster repair of oxidative damage during recovery from heat than from cold
stress (fig. 6 in publ. IV). Furthermore, these results confirmed that the biochemical effects
of heat stress and recovery resemble ischemia / reperfusion. Again, Z. viviparus appeared
tolerant to oxidative stress arising from short-term acute warming and recovery, as no

DISCUSSION
173
animal died during experimentation. Moreover, swimming performance of all recovery
groups was observed to be similar to unstressed fishes immediately after they were
returned to control temperature. It is, however, conceivable that frequent warming /
recooling events would exacerbate the situation for the animals.
Nitric oxide (NO) is another radical species, which has been ascribed regulatory function
during low tissue PO2 due to its vasodilatory effect (Palmer et al. 1987). Moreover,
nanomolar concentrations of NO inhibit cytochrome c oxidase activity and thus
mitochondrial O2 consumption in peripheral cells, which may add to improve oxygen
availability to central organs (Monacada & Erusalimsky 2002, Hagen et al. 2003). Further,
NO treatment of isolated mitochondria has been shown to increase superoxide production,
leading to enhanced formation of highly toxic peroxinitrite (Poderoso et al. 1996, Abe et
al. 1999). Upon hypoxia, NO levels may either increase or decrease, depending on
exposure time and tissue studied (Malyshev et al. 1999, Sandau et al. 2001). It is difficult
to plausibly predict the role and effect of NO in temperature-induced hypoxia in eelpout, as
the Griess assay, detecting the oxidation products of NO (total nitrite + nitrate), does not
measure the actual in situ NO concentrations (fig. 4.8 in “additional results”). However,
reduced levels of total nitrite + nitrate might reflect temperature-induced disturbances of
the NO producing enzyme NO-synthase. Similarly, slightly higher total nitrite + nitrate
levels after recovery could indicate partial recovery of the enzyme. If this were the case,
NO would not be expected to improve oxygen availability in the central liver of
Z. viviparus during stressful cold or heat exposure.
An important difference between cold and heat stress was discovered through
calculations of the glutathione based redox potential (∆E). Whereas ∆E was generally more
reduced upon cold exposure, it was more oxidised after critical (22°C) or extreme (26°C)
heat stress and unchanged after exposure to 18°C, i.e. within the pejus range. This was
consistent with significantly increased HIF-1 DNA binding upon cold and 18°C exposure,
but only weak EMSA HIF-1 signals upon higher heat stress of 22 or 26°C (fig. 4.A, B in
publ. IV). It has been shown, that although the HIF response is mainly controlled by
oxygen-dependent hydroxylation of prolines and asparagine, some steps of the HIF
response can be modulated by ROS and are thus sensitive to redox changes (Ema et al.
1999, Haddad et al. 2000, Lando et al. 2000, Liu et al. 2004). Statistical analysis indeed
confirmed the general trend for higher HIF-1 DNA binding activity in Z. viviparus liver
tissue at a more reduced cellular redox potential leading to the conjecture that ROS may
interfere with HIF-1 signalling during stressful warming. Nikinmaa et al. (2004) have also

DISCUSSION
174
shown enhanced DNA binding activity of rainbow trout HIF-1 under reduced redox
conditions, which they attributed to a cysteine residue at position 25 in rainbow trout HIF-
1α, which is Ser28 in the human sequence conferring redox-independence to DNA binding
of human HIF-1 (Lando et al. 2000). Similar to the human sequence, serine was identified
at the respective position in ZvHIF-1α (fig. 4.4 in “additional results”). It might be that
increased HIF-1 DNA binding together with more reduced conditions represents a
secondary event and that the primary redox regulated step of the HIF response is brought
forth during transactivation (Lando et al. 2000, Evans et al. 2000).
Taken together, short-term cold and heat stress had opposing impact on the cellular redox
balance, with cold stress causing a more reduced, and heat stress a more oxidised cellular
redox environment. The more oxidised conditions seemed to interfere with the HIF
response and might thus prevent the expression of hypoxia inducible genes under heat
stress. In other words, functional hypoxia under critical heat stress will not be
counterbalanced by adjustments of the oxygen delivery system. The observed
accumulation of anaerobic metabolites in Z. viviparus liver and muscle tissue beyond the
Tc (Van Dijk et al. 1999) may not require HIF-1 induced up-regulation of glycolytic
enzymes (Semenza et al. 1994, 1996). Also, other transcription factors such as Sp1 and
Sp3 could be responsible for the temperature mediated expression of glycolytic enzymes as
shown for β-enolase and pyruvate kinase M in mammalian muscle cells subjected to
hypoxia (Discher et al. 1998).
By contrast, cold stress as well as sub-critical heat exposure (18°C) in the pejus range
probably allow for hypoxic signalling. Thus, HIF-1 might be a physiological regulator
counterbalancing early onset of functional hypoxia at the border of the optimum
temperature range and in the warm pejus range, but appears impaired at critically high
temperatures presumably because the redox sensitive signalling pathway is compromised
by enhanced oxidative stress.
5.5. What is the inducing effect for the HIF response?
-thermal oxygen limitation or temperature itself or both-
In the previous section, temperature stress / recovery was interpreted to be reminiscent of
temperature-induced hypoxia / reoxygenation. HIF-1 was seen as a physiological regulator
during functional hypoxia in the cold and in the warm pejus temperature range. Along that
line of argumentation cold stress may resemble much more the “normal” hypoxia response
than the response to heat stress in fish. However, it has to be taken in mind that Atlantic

DISCUSSION
175
cod so far is the only fish species where a cold-induced decrease in blood PO2 indicating
functional hypoxia has directly been demonstrated (Lannig et al. 2004). Although similar
effects are likely for Z. viviparus, so far only heat-induced functional hypoxia has been
confirmed (Zakhartsev et al. 2003, Pörtner et al. 2004). Therefore, I will investigate a
different explanation which may act independently or in addition to temperature-induced
hypoxia, and considers temperature itself as factor influencing HIF regulation. Few authors
have investigated the possible relationship of HIF and changing temperatures. HIF-1
proved necessary for heat acclimation of the nematode C. elegans (Treinin et al. 2003).
Moreover, in vivo experiments with mice demonstrated that an increase in HSP90 protein
upon heating might stabilise HIF-1α even under normoxic conditions (Minet et al. 1999,
Katschinski et al. 2002). Likewise, increased HIF-1 DNA binding was observed with a
decrease in acclimation temperature from 26 to 18 and 8°C in crucian carp, which was
associated with increased levels of HSP70 and 90 (E. Rissanen, H. Numminen,
M. Nikinmaa; unpublished results). It seems that normoxic HIF-1 functions might be
mediated by its interactions with heat shock proteins. In fish, this might be favoured in the
cold. Whether this applies to Z. viviparus remains unclear, as HSP90 protein levels were
not determined and HSP70 protein levels did not show any temperature-dependent changes
(own unpublished data). Similarly to Z. viviparus, considerable normoxic HIF-1α protein
levels were observed in crucian carp with high inter-individual differences (E. Rissanen,
H. Numminen, M. Nikinmaa; unpublished results). It has been argued by Nikinmaa &
Rees (2005) that those findings together with the apparent high importance of the cellular
redox state suggest that HIF-1α may have oxygen-independent roles in the physiology of
fishes, with the temperature effect being one of those normoxic roles. Thus, the
investigation of HSP-HIF interaction in normoxic fish warrants further efforts.
A recent hypothesis proposed a cross-tolerance effect of heat acclimation and
perturbation of oxygen supply and demand, and probably other environmental stressors by
shared similar protective pathways where HIF-1 seemed to be an essential modulator
(Horowitz 2001, Horowitz et al. 2004). Thus, at least in the cold, onset of thermal oxygen
limitation and the temperature itself may go hand in hand to induce the HIF response in
liver of temperature stressed Z. viviparus.

DISCUSSION
176

CONCLUSIONS & PERSPECTIVES
177
6. Conclusions & Perspectives
The aim of my thesis was to evaluate the in vivo importance of oxidative stress and the
hypoxic response induced by the transcription factor HIF-1 in liver of polar and temperate
marine fish. In a second approach oxidative stress and HIF-1 were investigated in liver of
the temperate species (Zoarces viviparus) exposed to acute heat and cold stress ranging
from pejus to critical and above critical conditions, suspected to induce various degrees of
functional hypoxia. I will now answer the questions addressed in the introduction based on
the findings from my doctoral studies.
1. The Antarctic eelpout (Pachycara brachycephalum) appeared more prone to oxidative
stress under regular unstressed field conditions compared to the temperate con-familial
Zoarces viviparus. This may be the reason why this polar fish has such a high glutathione
redox buffering capacity.
Higher lipid radical formation in liver microsomes from the Antarctic eelpout Pachycara
brachycephalum compared to the temperate eelpout Zoarces viviparus (German North
Sea), speak for a higher susceptibility of polar ectotherms to lipid peroxidation and may
relate to the higher content of unsaturated fatty acids in their cellular lipid fraction.
However, in P. brachycephalum, this high risk for oxidative damage seems effectively
counterbalanced, as deduced from oxidative stress parameters. Particularly, the redox
buffer glutathione appeared to charge the liver tissue of the polar P. brachycephalum with
a very high antioxidant capacity. Interestingly, glutathione was found oxidised to over 50%
in both, control (0°C) and warm acclimated (5°C) P. brachycephalum. On the one hand,
such a high degree of glutathione oxidation underlines the elevated risk for oxidative stress
and the importance of glutathione as antioxidant. On the other hand, this observation may
also suggest that physiological processes adapted to function at low temperatures operate
in a more oxidised cellular redox environment in this polar fish. Comparative studies will
demonstrate whether a redox shift applies also for other cold-adapted species.
Whereas warm acclimation to 5°C led to only slight changes of oxidative damage
markers indicating a minor impact of varying water temperatures on oxidative stress levels
in the polar P. brachycephalum, seasonal temperature changes within the natural
temperature range caused different oxidative stress levels in the temperate species:
Oxidative damage marker were increased in cold winter Z. viviparus (6°C) compared to

CONCLUSIONS & PERSPECTIVES
178
summer animals (12°C). Thus, both, cold adaptation of the polar eelpout
P. brachycephalum, as well as seasonal cold acclimatisation of the temperate eelpout
Z. viviparus, was associated with enhanced potential for elevated tissue oxidation, i.e.
higher oxidative stress levels.
2. The higher levels of tissue oxidation together with the high oxygen solubility at low
environmental temperatures may be the reason for differences in HIF-α sequences and HIF
responses compared with mammals, to ensure oxygen-dependent gene expression in polar
fishes.
The constitutive expression of HIF-α sequences coding for the hypoxia-inducible subunit
of HIF, in all four investigated polar species (P. brachycephalum, T. hansoni, T. pennellii,
C. myersi) illustrates that the transcription factor HIF may have a basic physiological
function in fish. Whether the physiological function is the same as in mammals remains to
be shown. Future studies will show whether notothenioids exhibit a hypoxic HIF response
and what target genes will be induced in polar fishes, which commonly do not encounter
oxygen limitation or heat stress within their natural environment. However, constitutive
HIF-1α protein levels in Z. viviparus support the idea that the function of the protein or the
regulatory mechanism has undergone an evolutionary change from fish to mammals.
Generally, protein cold adaptation may be supported by several amino acid substitutions
located in the ODD and C-TAD of the deduced HIF-1α peptide sequences which might
confer higher hydrophilicity. Moreover, several features in the deduced amino acid
sequence, such as a Glu-Gln cluster in HIF-1α (in all five studied species) and a Glu cluster
in HIF-2α (in T. hansoni, C. myersi) may be indicative of special adaptations of the HIF
response in the investigated fishes. Additional cysteine residues may enhance redox-
sensitivity to HIF-1α stabilisation or transactivation, similar the rainbow trout HIF-1α
protein (Soitamo et al. 2001, Nikinmaa et al. 2004). Future studies should scrutinise the
possible modifications of redox-sensitivity and also investigate whether this is a special
feature of oxygen-dependent gene expression in fish and especially in polar species. The
highly surprising finding of the substitution of the N-terminal functional proline by leucine
in P. brachycephalum HIF-1α is so far the only wild-type sequence, where this phenotype
has been described. The three notothenioid HIF-1α sequences demonstrated both proline
residues, so that this Pro-Leu substitution cannot plausibly be considered a specific polar
adaptation. It is intriguing to think that PbHIF-1 function may be regulated mainly via
CONCLUSIONS & PERSPECTIVES
179
transactivation and not so much via degradation / stabilisation. Comparative studies of Zv
and PbHIF-1α functionality could reveal the effect of this substitution on HIF-1α protein
stability and address the question what might be the important regulatory step of the HIF
response in polar eelpout.
Higher HIF-1 DNA binding activity in P. brachycephalum was observed in warm
acclimated to 5°C compared to control fish kept at 0°C, and also in winter acclimatised
(6°C) Z. viviparus versus summer animals (12°C). In both species HIF-mediated metabolic
reorganisation may counterbalance the temperature-induced onset of tissue hypoxia. Thus,
it may be speculated that HIF-1 plays a common regulatory role to adjust tissue
oxygenation upon seasonal acclimatisation within the natural temperature range
(Z. viviparus), and at the warm border of the thermal optimum range (P. brachycephalum),
respectively. Again, it remains to be shown, whether commonly known target genes such
as VEGF or EPO are induced as part of the response to long-term (seasonal and
acclimatory) changes of ambient water temperatures or whether HIF may have a different
function in this context. Moreover, increased HIF-1 binding occurred at a more oxidised
redox environment in winter Z. viviparus and an unchanged, but basically highly oxidised
redox environment in warm acclimated P. brachycephalum. Thus, higher basal oxidative
stress levels during the colder winter season did apparently not interfere with hypoxic
signalling in Z. viviparus. Respectively, in P. brachycephalum, HIF-1 signalling may
indeed be adapted to function in a more oxidised redox environment.
3. Short-term temperature stress / recovery resembled ischemia / reperfusion in mammals.
Cold and heat stress had opposing effects on oxidative stress levels, the cellular redox
potential and the HIF response in the temperate eelpout Zoarces viviparus.
In contrast to seasonal acclimatisation to tolerated winter cold (6°C), short-term (2 h) cold
stress of 1 or 5°C had different effects on oxidative stress parameters in Z. viviparus.
Oxidative damage markers were increased following 24 h recovery from cold stress, but
not directly after cold stress itself which, moreover, was characterised by a more reduced
cellular redox environment. Higher HIF-1 DNA binding activity indicated onset of hypoxic
signalling following exposure to 1°C. Together, cold stress and subsequent recovery at
control temperature represent a similar biochemical situation as ischemia / reperfusion in
mammals.

CONCLUSIONS & PERSPECTIVES
180
Elevated levels of oxidative damage markers following recovery from heat stress were
observed only when exposing the heat stressed Z. viviparus to shorter recovery periods of
8 - 12 h, indicating more rapid repair of oxidative damage following heat than following
cold stress. Whereas acute cold exposure led to a more reduced cellular redox environment
and higher HIF-1 DNA binding, heat stress of 22 or 26°C caused more oxidised redox
conditions and only weak HIF-1 signals in EMSA assays (fig. 6.1). After less stressful
warming to 18°C stronger HIF-1 signals were observed with the redox environment
unchanged.
Fig. 6.1: Response of Zoarces viviparus to acute temperature stress (2 h). HIF-1 might have a modulating function in the liver during acute cold exposure and during warming within the pejus temperature range, but appeared impaired at critically high temperatures. The cellular redox potential in the liver was more reduced during cold stress and more oxidised above critical temperatures. Moreover, heat stress was accompanied by increasing oxidative stress. The lower part of the graphic shows increasing oxidative stress in the liver during recovery following cold or following heat stress. Together, these results support the hypothesis of temperature induced hypoxia and recovery in the eelpout Z. viviparus being reminiscent to ischemia / reperfusion events in endothermal mammals.
Likewise, a general trend for higher HIF-1 DNA binding at more reduced cellular redox
environment was observed in Z. viviparus. Together, HIF may be a physiological regulator
in fish counterbalancing early functional hypoxia during acute cooling and in the warm

CONCLUSIONS & PERSPECTIVES
181
pejus range, but appears impaired at critically high temperatures due to the adverse effects
of increasing oxidative stress (fig. 6.1). Furthermore, HIF-1 in combination with the
cellular redox environment appeared to be sensitive markers for temperature-induced
hypoxia upon acute stress in tissues.
The discrepancy between the cellular redox potentials during long-term (seasonal) and
short-term (acute stress) cold exposure of Z. viviparus, in both cases associated with higher
HIF-1 DNA binding stays open to speculation. It may indicate a different physiological
function for HIF-1 during seasonal acclimatisation within the benevolent temperature
range and during acute temperature stress. Thus, different target genes may be induced
during long- and short-term changes of environmental temperatures, and the redox
potential could be the regulating factor for that.
Continuous ROS formation by isolated Zoarces viviparus hepatocytes could be
visualised by confocal microscopy using the fluorescent dye H2DCFDA. However, the
type of the generated reactive oxygen species and also the cellular source remain obscure.
Therefore, detailed studies have to be carried out using different radical quencher and
inhibitors of various ROS sources to determine the origin of ROS, e.g. mitochondria or
cytosolic enzymes, under temperature-induced hypoxia. Moreover, those studies require
further evaluation of the method for quantitative measurements of cellular ROS
production, e.g. under different experimental temperatures and oxygen partial pressures.
Using inhibitors of the NO synthase and artificial NO donors, the role of NO could be
investigated in fish hepatocytes. Together, cellular studies should analyse the clear
interdependence of HIF-1 and ROS (redox potential) as well as NO during temperature-
induced versus environmental hypoxia.
Collectively, the proposed future studies could extend the presented in vivo findings and
scrutinise the molecular mechanisms controlling the counterbalancing response during
temperature-induced hypoxia.

CONCLUSIONS & PERSPECTIVES
182

REFERENCES
183
7. References
Abe K., Hayashi N., and Terada H. 1999. Effect of endogenous nitric oxide on energy
metabolism of rat heart mitochondria during ischemia and reperfusion. Free Rad. Biol.
Med. 26, 379-387.
Abele D. 2002. The radical life-giver. Nature 420, 27.
Abele D., Heise K., Pörtner H.O., and Puntarulo S. 2002. Temperature-dependence of
mitochondrial function and production of reactive oxygen species in the intertidal mud
clam Mya arenaria. J. Exp. Biol. 205, 1831-1841.
Abele D. and Puntarulo S. 2004. Formation of reactive species and induction of
antioxidant defence systems in polar and temperate marine invertebrates and fish. Comp.
Biochem. Physio.l 138A, 405-415.
Abele D., Philipp E., Heise K., and Keller M. 2004. Mitochondria of Antarctic and North
Sea Marine Invertebrates – Ecological functions of Mild Uncoupling in Water breathers.
Proceedings of the XII Biennial Meeting of the Society for Free Radical Research SFRR,
Buenos Aires, Argentina 2004. Invited paper.
Acierno R., Maffia M., Rollo M., and Storelli C. 1997. Buffer capacity in the blood of
the hemoglobinless Antarctic fish Chionodraco hamatus. Comp. Biochem. Physiol. 118A,
989-992.
Anderson M.E. 1984. Zoarcidae: Development and relationships. In: Ontogeny and
systematics of fishes; Moser, H.G. ed., Am. Soc. Ichthyol. Herpetol., Spec. Publ. No. 1, pp.
578-582. Allen Press, Lawrence, Kansas.
Arany Z., Huang L.E., Eckner R., Bhattacharya S., Jiang C., Goldberg M.A., Bunn
H.F, and Livingston D.M. 1996. An essential role for p300/CBP in the cellular response
to hypoxia. Proc. Natl. Acad. Sci. USA 93, 12969-12973.

REFERENCES
184
Boutelier R.G., Heming T.A., and Iwama, G.K. 1984. Appendix: Physicochemical
parameters for use in fish respiratory physiology. Fish Physiol., XA, 403-430.
Boveris A. and Cadenas E. 1997. Cellular sources and steady-state levels of reactive
oxygen species. In: Clerch L.B., Massaro D.J. (eds.). Oxygen, gene expression, and
cellular function, vol. 105, 1-25.
Boveris A. 1998. Biochemistry of free radicals: from electrons to tissues. Medicina 58,
350-356.
Bracken C.P., Whitelaw M.L., and Peet D.J. 2003. The hypoxia-inducible factor: key
transcriptional regulators of hypoxic responses. Cell. Mol. Life Sci. 60, 1376-1393.
Bradford M.M. 1976. A rapid and sensitive method for the quantification of microgram
quantities of protein utilizing the principle of protein-dye binding. Analyt. Biochem. 71,
248-254.
Brodte E., Knust R., Pörtner H.O., and Arntz W.E. Pachycara brachycephalum –
tracing the life history of an Antarctic eelpout. MS submitted.
Brumby P.E. and Massey V. 1967. Determination of nonheme iron, total iron and copper.
Meth. Enzymol. 10, 464-472.
Buettner G.R. 1987. Spin trapping: ESP parameters of spin adducts. Free Rad. Biol. Med.
3, 259-303.
Chandel N.S., Budinger G.R., Choe S.H., and Schumacker P.T. 1997. Cellular
respiration during hypoxia. Role of cytochrome oxidase as the oxygen sensor in
hepatocytes. J. Biol. Chem. 20, 402-415.
Chandel N.S., Maltepe E., Goldwasser E., Mathieu C.E., Somin M.C., and
Schumacker P.T. 1998. Mitochondrial reactive oxygen species trigger hypoxia-induced
transcription. Proc. Nat. Acad. Sci. USA 95, 11715-11720.

REFERENCES
185
Chandel N.S., McClintock D.S., Feliciano C.E., Wood T.M., Melendez J.A.,
Rodriguez A.M., and Schumacker P.T. 2000. Reactive oxygen species generated at
mitochondrial complex III stabilize hypoxia-inducible factor-α during hypoxia. J. Biol.
Chem. 275, 25130-25138.
Chandel N.S. and Schumacker P.T. 2000. Cellular oxygen sensing by mitochondria: old
questions, new insight. J. Appl. Physiol. 88, 1880-1889.
Chi N.C. and Karliner J.S. 2004. Molecular determinants of responses to myocardial
ischemia / reperfusion injury: focus on hypoxia-inducible and heat shock factors.
Cardiovasc. Res. 61, 437-447.
Christiansen F.B., Nielsen B.V., and Simonsen V. 1981. Genetical and morphological
variation in the eelpout Zoarces viviparus. Can. J. Genet. Cytol. 23, 163-172.
Czubryt M.P., Panagia V., and Pierce G.N. 1996. The roles of free radicals, peroxides
and oxidized lipoproteins in second messenger system dysfunction. EXS 76, 57-69.
D’Amico S., Claverie P., Collins T., Georlette D., Gratia E., Hoyoux A., Meuwis M.-
A., Feller G., and Gerday C. 2002. Molecular basis of cold adaptation. Phil. Trans. R.
Soc. Lond. 357B, 917-925.
Davison W., Axelsson M., Nilsson S., and Forster M.E. 1997. Cardiovascular control in
Antarctic notothenioid fishes. Comp. Biochem. Physiol. 118A, 1001-1008.
Dery M.-A.C., Michaud M.D., and Richard D.E. 2005. Hypoxia-inducible factor 1:
regulation by hypoxic and non-hypoxic activators. Int. J. Biochem. Cell Biol. 37, 535-540.
Desai I. 1984. Vitamin E analysis methods for animal tissues. Meth. Enzymol. 105, 138-
146.
Desaulniers N., Moerland T.S., and Sidell B.D. 1996. High lipid content enhances the
rate of oxygen diffusion through fish skeletal muscle. Am. J. Physiol. Regul. Integr. Comp.
Physiol. 271, R42-R47.

REFERENCES
186
De Zwart L., Meerman J.H.N., Commandeur J., and Vermeulen N.P.E. 1999.
Biomarkers of free radical damage applications in experimental animals and humans. Free
Rad. Biol. Med. 26, 202-226.
Discher D.J., Bishopric N.H., Wu X., Peterson C.A., and Webster K.A. 1998. Hypoxia
regulates β-enolase and pyruvate kinase-M promotors by modulating Sp1/Sp3 binding to a
conserved GC element. J. Biol. Chem. 273, 26087-26093.
Dotan Y., Lichtenberg D., and Pinchuk I. 2004. Lipid peroxidation cannot be used as a
universal criterion of oxidative stress. Prog. Lipid Res., 43, 200-227.
Dunlap W.C., Fujisawa A., Yamamoto Y., Moylan T.J., and Sidell B.D. 2002.
Notothenioid fish, krill and phytoplankton from Antarctica contain a vitamin E constituent
(α-tocopherol) functionally associated with cold-water adaptation. Comp. Biochem.
Physiol. 133B, 299-305.
Dröge W. 2002. Free radicals in the physiological control of cell function. Physiol. Rev.
82, 47-95.
Dykens J.A. and Shick J.M. 1988. Relevance of purine catabolism to hypoxia and
recovery in euryoxic and stenoxic marine invertebrates, particularly bivalve molluscs.
Comp. Biochem. Physiol. 91C, 35-41.
Eastman J.T. 1993. Antarctic fish biology. Evolution in a unique environment. Academic
Press Inc. San Diego, USA.
Egginton S. and Sidell B.D. 1989. Thermal acclimation induces adaptive changes in
subcellular structure of fish skeletal muscle. Am. J. Physiol. Regul. Integr. Comp. Physiol.
256, R1-R9.
Ema M., Hirota K., Mimura J., Abe H., Yodoi J., Sogawa K., Poellinger L., and Fujii-
Kuriyama Y. 1999. Molecular mechanisms of transcription activation by HLF and HIF-1α
REFERENCES
187
in response to hypoxia: their stabilization and redox signal-induced interaction with
CBP/p300. EMBO J. 18, 1905-1914.
Evans A.R., Limp-Foster M., and Kelley M.R. 2000. Going APE over ref-1. Mut. Res.
461, 83-108.
Fandrey J., Frede S., and Jelkmann W. 1994. Role of hydrogen peroxide in hypoxia-
induced erythropoietin production. Biochem. J. 303, 507-510.
Fandrey J. 2004. Oxygen-dependent and tissue-specific regulation of erythropoietin gene
expression. Am. J. Physiol. Reg. Integr. Comp. Physiol. 286, R977-R988.
Fariss M.W. and Reed D.J. 1987. High-performance liquid chromatography of thiols and
disufides: diphenol derivatives. Meth. Enzymol. 143, 101-109.
Farrell A.P. 2002. Cardiorespiratory performance in salmonids during exercise at high
temperature: insights into cardiovascular design limitations in fishes. Comp. Biochem.
Physiol. 132A, 797-810.
Feller G. and Gerday C. 1997. Adaptations of the hemoglobinless Antarctic icefish
(Channichthyidae) to hypoxia tolerance. Comp. Biochem. Physiol. 118A, 981-987.
Feller G., Arpigny J.L., Narinx E., and Gerday C. 1997. Molecular adaptation of
enzymes from psychrophilic organisms. Comp. Biochem. Physiol. 118A, 495-499.
Fields P.A. and Somero G.N. 1997. Amino acid sequence differences cannot fully explain
interspecific variation in thermal sensitivities of gobiid fish A4-lactate dehydrogenases (A4-
LDHs). J. Exp. Biol. 200, 1839-1850.
Fischer P., Rademacher K., and Kils U. 1992. In situ investigations on the respiration
and behaviour of the eelpout Zoarces viviparus under short-term hypoxia. Mar. Ecol. Prog.
Ser. 88, 181-184.

REFERENCES
188
Frederich M. and Pörtner H.O. 2000. Oxygen limitation of thermal tolerance defined by
cardiac and ventilatory performance in spider crab, Maja squinado. Am. J. Regul. Integr.
Comp. Physiol. 279, R1531-R1538.
Gieseg S.P., Cuddihy S., Hill J.V., and Davison W. 2000. A comparison of plasma
vitamin C and E levels in two Antarctic and two temperate water fish species. Comp.
Biochem. Physiol. 125B, 371-378.
Gon O. and Heemstra P. 1990. Fishes of the Southern Ocean. Grahamstown, South
Africa: J.L.B. Smith Institute for Ichthyology.
Gonzalez Flecha B., Llesuy S., and Boveris A. 1991. Hydroperoxide-initiated
chemiluminescence: An assay for oxidative stress in biopsies of heart, liver, and muscle.
Free Rad. Biol. Med. 10, 93-100.
Götting K.J. 1976. Fortpflanzung und Oocyten – Entwicklung bei der Aalmutter (Zoarces
viviparus /Pisces, Osteichthyes). Helgol. Wissenschaftl. Meeresunters. 28, 71-89.
Gracey A.Y., Troll J.V., and Somero G.N. 2001. Hypoxia-induced gene expression
profiling in the euryoxic fish Gillichthys mirabilis. Proc. Natl. Acad. Sci. USA 98, 1993-
1998.
Gu Y.-Z., Hogenesch J.B., and Bradfield C.A. 2000. The PAS superfamily: sensors of
environmental and developmental signals. Annu. Rev. Pharmacol. Toxicol. 40, 519-561.
Günzler W.A. and Flohe L. 1985. Glutathione peroxidase. In: Greenwald, R. A. (ed),
CRC handbooks of methods for oxygen radical research. Boca Raton, CRC Press Inc, 285-
289.
Haddad J.J.E., Olvers R.E., and Land S.C. 2000. Antioxidant/pro-oxidant equilibrium
regulates HIF-1α and NF-κB redox sensitivity. J. Biol. Chem. 275, 21130-21139.
Haddad, J.J. 2002. Oxygen-sensing mechanisms and the regulation of redox-responsive
transcription factors in development and pathophysiology. Respir. Res. 3, 1-27.
REFERENCES
189
Hagen T., Taylor C.T., Lam F., and Moncada S. 2003. Redistribution of intracellular
oxygen in hypoxia by nitric oxide: Effect on HIF1α. Science 302:1975-1978.
Halliwell B. and Gutteridge J.M.C. 1999. Free radicals in biology and medicine. 3.
edition. Clarendon Press, Oxford.
Heise K., Puntarulo S., Pörtner H.O., and Abele D. 2003. Production of reactive oxygen
species by isolated mitochondria of the Antarctic bivalve Laternula elliptica (King and
Broderip) under heat stress. Comp. Biochem. Physiol. 134C, 79-90.
Hempel S.L., Buettner G.R., O’Malley Y.Q., Wessels D.A., and Flaherty D.M. 1999.
Dihydrofluorescein diacetate is superior for detecting intracellular oxidants: comparison
with 2’7’-dichlordihydrofluorescein diacetate, 5 (and 6)-carboxy-2’7’dichlordihydro-
fluorescein diacetate, and dihydrorhodamine 123. Free Rad. Biol. Med. 27, 146-159.
Hermes-Lima M. and Zenteno-Savin T. 2002. Animal response to drastic changes in
oxygen availability and physiological oxidative stress. Comp. Biochem. Physiol. 133C,
537-556, 2002.
Hermes-Lima M. 2004. Oxygen in biology and biochemistry: Role of free radicals. In:
K.B. Storey (ed.), Functional metabolism: Regulation and adaptation (pp. 319-368).
Hooken: Wiley-Liss.
Horowitz M. 2001. Heat acclimation: phenotypic plasticity and cues to the underlying
molecular mechanisms. J. Therm. Biol. 26, 357-363.
Horowitz M., Eli-Berchoer L., Wapinski I., Friedman N., and Kodesch E. 2004. Stress
related genomic responses during the course of heat acclimation and its association with
ischemia / reperfusion cross-tolerance. J. Appl. Physiol. 97, 1496-1507.
Huang J., Zhao Q., Mooney S.M., and Lee F.S. 2002. Sequence determinants in hypoxia
inducible factor-1α for hydroxylation by the prolyl hydroxylases PHD1, PHD2, and PHD3.
J. Biol. Chem. 277, 39792-39800.

REFERENCES
190
Ivan M., Kondo K., Yang H., Kim W., Valiando J., Ohh M., Salic A., Asara J.M.,
Lane W.S., and Kaelin Jr. W.G. 2001. HIFα targeted for VHL-mediated destruction by
proline hydroxylation: implications for O2 sensing. Science 292, 464-468.
Jaakkola P., Mole D.R., Tian Y.M., Wilson M.J., Gielbert J., Gaskell S.J., von
Kriegsheim A., Hebestreit H.F., Mukherij M., Schofield C.J., Maxwell P.H., Pugh
C.W., and Ratcliffe P.J. 2001. Targeting of HIF-1α to the von Hippel-Lindau
ubiquitylation complex by O2-regulated prolyl hydroxylation. Science 292, 468-472.
Janzen E.G. 1971. Spin trapping. Account. Chem. Res. 4, 31-40.
Jeong J.W., Bae M.K., Ahn M-Y., Kim S.H., Sohn T.K., Bae M.H., Yoo M.A., Song
E.J., Lee K.J., and Kim K.W. 2002. Regulation and destabilization of HIF-1α by ARD1-
mediated acetylation. Cell 111, 709-720.
Jiang B.-H., Semenza G.L., Bauer C., and Marti H.H. 1996. Hypoxia-inducible factor 1
levels vary exponentially over a physiologically relevant range of O2 tension. Am. J.
Physiol. 271, C1172-C1180.
Jones D.P. 1986. Renal metabolism during normoxia, hypoxia, and ischemic injury. Ann.
Rev. Physiol. 48, 33-50.
Kallio P.J., Okamoto K., O’Brian S., Carrero P., Makino Y., Tanaka H., and
Poellinger L. 1998. Signal transduction in hypoxic cells: inducible nuclear translocation
and recruitment of the CBP/p300 coactivator by the hypoxia-inducible factor-1α. EMBO J.
17, 6573-6586.
Katschinski D.M., Le L., Heinrich D., Wagner K.F., Hofer T., Schindler S.G., and
Wenger R.H. 2002. Heat induction of the unphosphorylated form of hypoxia-inducible
factor-1α is dependent on heat shock protein-90 activity. J. Biol. Chem. 277, 9262-9267.

REFERENCES
191
Keller M., Sommer A.M., Pörtner H.O., and Abele D. 2004. Seasonality of energetic
functioning and production of reactive oxygen species by lugworm (Arenicola marina)
mitochondria exposed to acute temperature changes. J. Exp. Biol. 207, 2529-2538.
Kidd P.M. 1997. Glutathione: systemic protectant against oxidative and free radical
damage. Alt. Med. Rev. 1, 155-176.
Kietzmann T., Fandrey J., and Acker H. 2000. Oxygenradicals as messengers in
oxygen-dependnet gene expression. News Physiol Sci. 15, 202-208.
Klatt P. and Lamas S. 2000. Regulation of protein function by S-glutathiolation in
response to oxidative and nitrosative stress. Europ. J. Biochem. 267, 4928-4944.
Klein S.M., Cohen G., Lieber C.S., and Cederbaum A.I. 1983. Increased microsomal
oxidation of hydroxy radical scavengers and ethanol after chronic consumption of ethanol.
Arch. Biochem. Biophys. 223, 425-433.
Knijn R.J., Boon T.W., Heessen J.L., and Hislop J.R.G. 1993. Atlas of the North Sea
fishes, I.C.E.S. Cooper. Res. Rep. vol. 194.
Kolayli S. and Keha E. 1999. A comperative study of antioxidant enzyme activities in
freshwater and seawater-adapted rainbow trout. J. Biochem. Mol. Toxicol. 13, 334-337.
Kvietikova I., Wenger R.H., Marti H.H., and Gassmann M. 1995. The transcription
factors ATF-1 and CREB-1 bind constitutively to the hypoxia-inducible factor-1 (HIF-1)
DNA recognition site. Nucl. Acids Res. 23, 4542-4550.
Lando D., Pongratz I., Poellinger L., and Whitelaw M.L. 2000. A redox mechanism
controls differential DNA binding activities of hypoxia-inducible factor (HIF) 1α and the
HIF-like factor. J. Biol. Chem. 275, 4618-4627.
Lando D., Peet D.J., Whelan D.A., Gorman J.J., and Whitelaw M.L. 2002. Asparagine
hydroxylation of the HIF transactivation domain a hypoxic switch. Science 295, 858-861.

REFERENCES
192
Lannig G., Bock C., Sartoris F.J., and Pörtner H.O. 2004. Oxygen limitation of thermal
tolerance in cod, Gadus morhua L., studied by magnetic resonance imaging and on-line
venous oxygen monitoring. Am. J. Physiol. Regul. Intergr. Comp. Physiol. 287, R902-
R910.
Lannig G., Storch D., and Pörtner H.-O. 2005. Aerobic mitochondrial capacities in
Antarctic and temperate eelpout (Zoarcidae) subjected to warm versus cold acclimation.
Polar Biol., in press.
Larsen B.K., Pörtner H.O., and Jensen F.B. 1997. Extra- and intracellular acid-base
balance and ionic regulation in cod (Gadus morhua) during combined and isolated
exposures to hypercapnia and copper. Mar. Biol. 128, 337-346.
Lawrie S., Tancock N., McGrowth S., and Roger J. 1991. Influence of complexation of
the uptake by plants of iron, manganese, copper and zinc. I Effect of EDTA in a multimetal
and computer simulation study. J. Exp. Biol. 42, 509-515.
Levine R.L., Garland D., Oliver C.N., Amici A., Climent I., Lenz A.-G., Ahn B.-W.,
Shaltiel S., and Stadtman E.R. 1990. Determination of carbonyl content in oxidatively
modified proteins. Meth. Enzymol. 186, 464-485.
Linares E., Nakao L.S., Augusto O., and Kadiiska M.B. 2003. EPR studies of in vivo
radical production by lipopolysaccharide: potential role of iron mobilized from iron-
nitrosyl complexes. Free Rad. Biol. Med. 34, 766-773.
Liu Q., Bechner-Pfannschmidt U., Möller U., Brecht M., Wotzlaw C., Acker H.,
Jungermann K., and Kietzmann T. 2004. A Fenton reaction at the endoplasmic
reticulum is involved in the redox control of hypoxia-inducible gene expression. Proc. Nat.
Acad. Sci. USA 101, 4302-4307.
Livingstone D.R., Lips F., Garcia Martinez P., and Pipe R.K. 1992. Antioxidant
enzymes in the digestive gland of the common mussel Mytilus edulis. Mar. Biol. 112, 265-
276.

REFERENCES
193
Lowe C.J., Seebacher, F., and Davison W. 2005. Thermal sensitivity of heart rate and
insensitivity of blood pressure in the Antarctic nototheniid fish Pagothenia borchgrevinki.
J. Comp. Physiol. 175B, 97-105.
Lucassen M., Schmidt A., Eckerle L.G., and Pörtner H.-O. 2003. Mitochondrial
proliferation versus temporary cold: enzyme activities and mRNA levels Antarctic and
temperate zoarcid fish. Am. J. Physiol. Regul. Integr. Comp. Physiol. 285, R1410-1420.
Malyshev I.Y., Zenina T.A., Golubeva L.Y., Saltykova V.A., Manukhina E.B.,
Mikoyan V.D., Kubrina L.N., and Vanin A.F. 1999. NO-dependent mechanisms of
adaptation to hypoxia. Nitric Oxide: Biol. and Chem. 3, 105-113.
Mark F.C., Bock C., and Pörtner, H.O. 2002. Oxygen-limited thermal tolerance in
Antarctic fish investigated by MRI and 31P-MRS. Am. J. Physiol. Regul. Integr. Comp.
Physiol. 283, R1254-R1262.
Mark F.C., Lucassen M., and Pörtner H.O. Are mitochondrial uncoupling proteins
involved in thermal acclimation of polar and temperate fish? Physiol. Genom. in revision.
Massabuau J.C. 2003. Primitive, and protective, our cellular oxygenation status? Mech.
Ageing Develop. 124, 857-863.
Masson N., William C., Maxwell P.H., Pugh C.W., and Ratcliffe P.J. 2001.
Independent function of two destruction domains in hypoxia-inducible factor-α chains
activated by prolyl hydroxylation. EMBO J. 20, 5197-5206.
Mazure N.M., Brahimi-Horn M.C., Berta M.A., Benizri E., Bilton R.L., Dayan F.,
Ginouves A., Berra E., and Pouyssegur J. 2004. HIF-1: master and commander of the
hypoxic world A pharmacological approach to its regulation by siRNAs. Biochem.
Pharmacol. 68, 971-980.
McCord J.M. 1988. Free radicals and myocardial ischemia: overview and outlook. Free
Rad. Biol. Med. 4, 9-14.

REFERENCES
194
Min J.-H., Yang H., Ivan M., Gertler F., Kaelin Jr. W.G., and Pavletich N.P. 2002.
Structure of an HIF-1α-pVHL complex: Hydroxyproline recognition in signalling. Science
296, 1886-1889.
Minet E., Motter D., Michel G., Roland I., Raes M., Remacle J., and Michiels C. 1999.
Hypoxia-induced activation of HIF-1: role of HIF-1α-Hsp90 interaction. FEBS Lett. 460,
251-256.
Misko T.P., Schilling R.J., Salvemini D., Moore W.M., and Currie M.G. 1993. A
fluorometric assay for the measurement of nitrite in biological samples. Anal. Biochem.
214, 11-16.
Mommsen T.O., Moon T.W., and Walsh P.J. 1994. Hepatocytes: isolation, maintenance
and utilization. In: Biochemistry and molecular biology of fishes, analytical techniques,
vol. 3 eds: Hochachka, P.W., Mommsen, T.P. Elsevier Science, Amsterdam, chapter 30,
355-372.
Monada S. and Erusalimsky J.D. 2002. Does nitric oxide modulate mitochondrial energy
generation and apoptosis? Nature Reviews 3, 214-220
Nikinmaa M., Pursiheimo S., and Soitamo A.J. 2004. Redox state regulates HIF-1α and
its DNA binding and phosphorylation in salmonid cells. J. Cell. Sci. 117, 3201-3206.
Nikinmaa M. and Rees B.B. 2005. Oxygen-dependent gene expression in fishes. Am. J.
Physiol. Regul. Integr. Comp. Physiol. 288R, 1079-1090.
Obin M., Shang F.S., Gong X., Handelman G., Blumberg J., and Taylor A. 1998.
Redox regulation of ubiquitine-conjugating enzymes: mechanistic insights using the thiol-
specific oxidant diamide. FASEB J. 12, 561-569.
O’Rourke J.F., Tian Y.-M., Ratcliffe P.J., and Pugh C.W. 1999. Oxygen-regulated and
transactivating domains in endothelial PAS protein 1: comparison with hypoxia-inducible
factor-1α. J. Biol. Chem. 274, 2060-2071.

REFERENCES
195
Palmer R.M.J., Ferrige A.G., and Moncada S. 1987. Nitric oxide release accounts for
the biological activity of endothelium-derived relaxating factor. Nature 327, 524-526.
Pascual P., Pedrajas J.R., Toribio F., Lopez-Barea J., and Peinado, J. 2003. Effect of
food deprivation on oxidative stress biomarkers in fish (Sparus aurata). Chem.-Biol.
Interact. 145, 191-199.
Pena S., Pena J.B., Rios C., Rancho E., Fernandez C., and Ferrando M.D. 2000. Role
of glutathione in thiobencarb resistance in the european eel Anguilla anguilla. Ecotox.
Environm. Saf. 46, 51-56.
Ploch A.A., Lee Y.-P., MacLean E., and Di Giulio R.T. 1999. Oxidative stress in liver of
brown bullhead and channel catfish following exposure to tert-butyl hydroperoxide. Aquat.
Toxicol. 46, 231-240.
Poderoso J.J., Carreras M.C., Lisdero C., Riobo N., Schöpfer F., and Boveris A. 1996.
Nitric oxide inhibits electron transfer and increases superoxide radical production in rat
heart mitochondria and submitochondrial particles. Arch. Biochem. Biophys. 328, 85-92.
Pörtner H.O. 2002. Climate variations and the physiological basis of temperature
dependent biogeography: systemic to molecular hierarchy of thermal tolerance in animals.
Comp. Biochem. Physiol. 132A, 739-761.
Pörtner H.O., Mark F.C., and Bock C. 2004. Oxygen limited thermal tolerance in fish?
Answers obtained by nuclear magnetic resonance techniques. Respir. Physiol. Neurobiol.
141, 243-260.
Pörtner H.-O., Lucassen M., and Storch D. Metabolic biochemistry: its role in thermal
tolerance and in the capacities of physiological and ecological function, in: J.F. Steffensen,
A.P. Farrell (Guest Eds.), The Physiology of Polar Fishes. To appear in 2005 as vol. 21 in
the series Fish Physiology – Series, editors W.S. Hoar, D.R. Randall and A.P. Farrell.

REFERENCES
196
Powell W.H. and Hahn M.E. 2002. Identification and functional characterization of
hypoxia-inducible factor 2α from estuarine teleost, Fundulus heteroclitus: Interaction of
HIF-2α with two ARNT2 splice variants. J. Exp. Zool. Mol. Dev. Evol. 294, 17-29.
Rebrin I., Kamzalov S., and Sohal R.S. 2003. Effects of age and caloric restriction on
glutathione redox state in mice. Free Rad. Biol. Med. 35, 626-635.
Reed D.J. 1990. Glutathione: toxicological implications. Annu. Rev. Pharmacol. Toxicol.
30, 603-631.
Ritola O., Kuiru T., Mölsa H., Hänninen O., and Lindström-Seppä P. 1999. Rainbow
trout (Oncorhynchus mykiss) exposed to oxygen supersaturation and handling stress:
plasma cortisol and hepatic glutathione status. Acta Biol. Hungar. 50, 215-227.
Ritola O., Lyytikäinen T., Pylkkö P., Mölsä H., and Lindtröm-Seppä P. 2000.
Glutathione-dependent defence system and monooxygenase enzyme activities in Antarctic
charr Salvelinus alipinus (L.) exposed to ozone. Aquacul. 185, 219-233.
Rose F., Grimminger F., Appel J., Heller M., Pies V., Weissmann N., Fink L.,
Schmidt S., Camenisch G., Gassmann M., Seeger W., and Hänze J. 2002. Hypoxic
pulmonary artery fibroblasts trigger proliferation of vascular smooth muscle cells – role of
hypoxia-inducible transcription factors. FASEB J. 16, 1657-1659.
Salceda S. and Caro J. 1997. Hypoxia-inducible factor 1a (HIF-1α) protein is rapidly
degraded by the ubiquitine proteasome system under normoxic conditions. J. Biol. Chem.
272, 22642-22647.
Sandau K., Fandrey J., and Brüne B. 2001. Accumulation of HIF-1α under the influence
of nitric oxide. Blood 97, 1009-1015.
Sartoris F.J., Bock C., and Pörtner H.O. 2003. Temperature-dependent pH regulation in
eurythermal and stenothermal marine fish: an interspecies comparison using 31P-NMR. J.
Therm. Biol. 28, 363-371.

REFERENCES
197
Schafer F.Q. and Buettner G.R. 2001. Redox environment of the cell as viewed through
the redox state of the glutathione disulfide/glutathione couple. Free Rad. Biol. Med. 30,
1191-1212.
Schmid T., Zhou J., and Brüne B. 2004. HIF-1 and p53: communication of transcription
factors under hypoxia. J. Cell. Mol. Med. 8, 423-431.
Schmidt J. 1916-1917. Zoarces viviparus L. and local races of the same. Comptes –
rendues des traveaux du laboratoire de Carlsberg, vol. 13, p. 279-398.
Semenza G.L., Roth P.H., Fang H.M., and Wang G.L. 1994. Transcriptional regulation
of genes encoding glycolytic enzymes by hypoxia-inducible factor 1. J. Biol. Chem. 269,
23757-23763.
Semenza G.L., Jiang B.-H., Leung S.W., Passantino R., Concordet J.-P-, Maire P.,
and Giallongo A. 1996. Hypoxia response elements in the aldolase A, enolase 1, and
lactate dehydrogenase A gene promotors contain essential binding sites for hypoxia-
inducible factor 1. J. Biol. Chem. 271, 32529-32537.
Semenza G.L. 1998. Hypoxia-inducible factor 1: master regulator of O2 homeostasis.
Curr. Op. Gen. Develop. 8, 588-594.
Semenza G.L. 2002. Signal transduction to hypoxia-inducible factor 1. Biochem.
Pharmacol. 64, 993-998.
Semenza G.L. 2004. Hydroxylation of HIF-1: oxygen sensing at the molecular level.
Physiol. 19, 176-182.
Sidell B.D. 1998. Intracellular oxygen diffusion: the roles of myoglobin and lipid at cold
body temperature. J. Exp. Biol. 201, 1118-1127.
Sies H. 1985. Oxidative Stress: Introductory remarks. In: Oxidative Stress, edited by Sies
H. London, New York: Academic Press, Harcourt Brace Jovanovich Publishers, p. 1-8.

REFERENCES
198
Skulachev V. 1996. Role of uncoupled and non-coupled oxidations in maintenance of
safely low levels of oxygen and its one-electron reductants. Quaterly Rev. Biophys. 29,
169-202.
Soitamo A.J., Rabergh C.M.I., Gassmann M., Sistonen L., Nikinmaa M. 2001.
Characterization of a hypoxia-inducible factor (HIF-1α) from rainbow trout. J. Biol. Chem.
276, 19677-19705.
Somero G.N. 2004. Adaptation of enzymes to temperature: searching for basic
“strategies”. Comp. Biochem. Physiol. 139B, 321-333.
Sommer A., Klein B., and Pörtner H.O. 1997. Temperature induced anaerobiosis in two
populations of the polychaete worm Arenicola marina (L.). J. Comp. Physiol. 167B, 25-35.
Stephensen E., Sturve J., and Förlin L. 2002. Effects of redox cycling compounds on
glutathione content and activity of glutathione-relate enzymes in rainbow trout liver.
Comp. Biochem. Physiol. 133C, 435-442.
Storch D., Lannig G., and Pörtner H.O. 2005. Temperature-dependent protein synthesis
capacities in Antarctic and temperate (North Sea) fish (Zoarcidae). J. Exp. Biol. 208, 2409-
2420.
Stroka D.M., Burkhardt T., Desbaillets I., Wenger R.H., Neil D.A.H., Gassmann M.,
and Candinas D. 2001. HIF-1 is expressed in normoxic tissue and displays an organ-
specific regulation under systemic hypoxia. FASEB J. 15, 2445-2453.
Taniai H., Hines I.N., Bharwani S., Maloney R.E., Nimura Y., Gao B., Flores S.C.,
McCord J.M., Grisham M.B., and Aw T.Y. 2004. Susceptibility of murine periportal
hepatocytes to hypoxia-reoxygenation: role for NO and Kupffer cell-derived oxidants.
Hepatol. 39, 1544-1552.
Treinin M., Shilar J., Jiang H., Powell-Coffman J.A., Bromberg Z., and Horowitz M.
2003. HIF-1 is required for heat acclimation in the nematode Caenorabditis elegans.
Physiol. Genom. 14, 17-24.

REFERENCES
199
Turrens J.F., Beconi M., Barilla J., Chavez U.B., and McCord J.M. 1991.
Mitochondrial generation of oxygen radicals during reoxygenation of ischemic tissues.
Free Rad. Res. Commun. 12-13, 681-689.
Uchiyama M. and Mihara M. 1978. Determination of malonaldehyde precursor in tissues
by thiobarbituric acid test. Analyt. Biochem. 86, 271-278.
Van Dijk P.L.M., Tesch C., Hardewig I., and Pörtner H.-O. 1999. Physiological
disturbances at critically high temperatures: a comparison between stenothermal Antarctic
and eurythermal temperate eelpouts (Zoarcidae). J. Exp. Biol. 202, 3611-3621.
Vegh M., Marton A., and Horvath I. 1988. Reduction of Fe(III) ADP complex by liver
microsomes. Biochim. Biophys. Acta 964, 146-150.
Verdon C.P., Burton B.A., and Prior R.L. 1995. Sample pretreatment with nitrate
reductase and glucose-6-phosphate dehydrogenase quantitatively reduces nitrate while
avoiding interference by NADP+ when the Griess reaction is used to assay for nitrite.
Analyt. Biochem. 224, 502-508.
Vuori K.A.M., Soitamo A., Vuorinen P.J., and Nikinmaa M. 2004. Baltic salmon
(Salmo salar) yolk-sac fry mortality is associated with disturbances in the function of
hypoxia-inducible transcription factor (HIF-1α) and consecutive gene expression. Aquat.
Toxicol. 68, 301-313.
Weinstein R.B. and Somero G.N. 1998. Effects of temperature on mitochondrial function
in the Antarctic fish Trematomus bernacchii. J. Comp. Physiol. 168B, 190-196.
Wells R.M.G., Ashby M.D., Duncan S.J., and Macdonald J.A. 1980. Comparative
study of the erythrocytes and haemoglobins in notothenioid fishes from Antarctica. J. Fish
Biol. 17, 517-527.
Wenger R.H. 2000. Mammalian oxygen sensing, signalling and gene regulation. J. Exp.
Biol. 203, 1253-1263.

REFERENCES
200
Woodmansee A.N. and Imlay J.A. 2002. Meth. Enzymol. 349, 3-9.
Zakhartsev M.V., De Wachter B., Sartoris F.J., Pörtner H.O., and Blust R. 2003.
Thermal physiology of the common eelpout (Zoarces viviparus). J. Comp. Physiol. 173B,
365-378.
Zhu H. and Bunn F. 1999. Oxygen sensing and signalling: impact on the regulation of
physiologically important genes. Respir. Physiol. 115, 239-247.
Ziel K.A., Grishko V., Campbell C.C., Breit J.F., Wilson G.L., and Gillespie, M.N.
2005. Oxidants in signal transduction: impact on DNA integrity and gene expression.
FASEB J. 19, 387-394.

APPENDIX
201
8. Appendix
Temperature regime Helgoland
Fig 8.1: Median monthly sea surface temperatures next to Helgoland, sampling area “Helgoland-Reede Kabeltonne” of the years 2002 (A) and 2003 (B). Red dots indicate sampling of Z. viviparus used for the present work. Figures are taken from MURSYS environmental reports of the BSH (Bundesamt für Seeschiffahrt und Hydrographie; http://www.bsh.de/de/Meeresdaten/Beobachtungen/MURSYS-Umweltreportsystem/).
A
B

APPENDIX
202
Global distribution of investigated fish species
Distribution of the respective species is indicated by red dots. All maps are taken from
OBIS, http://www.iobis.org/Welcome.htm.
Zoarcids
Fig. 8.2: Global distribution of Zoarces viviparus
Fig 8.3: Global distribution of Pachycara brachycephalum

APPENDIX
203
Notothenioids
Fig. 8.4: Global distribution of Trematomus hansoni
Fig. 8.5: Global distribution of Trematomus pennellii
Fig. 8.6: Global distribution of Chionodraco myersi

APPENDIX
204
tBOOH-initiated chemiluminescence
Fig. 8.7: Characteristic curve obtained from tBOOH-initiated chemiluminescence. The area under the curve could be calculated for a time period of 4 000 sec (= 66.67 min) using MatLab 7.0 program (x = min (t) : 1 max (4 000); C = polyfit (t, y, 4); Y = polyval (C, X); area = sum (Y); plot (t, Y, ’ro’, X, Y).

APPENDIX
205
Tab. 8.1: Information on the fishes used in this thesis work. * Age determination of P. brachycephalum (Pb) was done according to Brodte et al. (ms submitted); age determination of Z. viviparus (Zv) according to E. Brodte (unpublished results).
species location coordinates depth (m)
sampling date
trap start of acclimation
experimentation / tissue sampling
date
body length (cm)
body weight (g)
age* (years)
experiment publi-cation
Zoarces viviparus
Helgoland; North Sea
54°11’N 7°52’ E
~ 10 Mar. / April 2002
bottom trap
02.05.2002 (10°C)
14.05-15.06.2002 15.09.-14.10.2002
25.4 ± 1.8 52.7 ± 12.6 means: >4.5 min: 3 max: > 4.5
hepatocyte studies
-
May / June 2002
03.06.02 (12°C)
04.07.- 05.07.2002
22.8 ± 3.5 54.4 ± 31.1 means: 3-4 min: 1 max: > 4.5
seasonal comp; comparison to Pb
I
04.07.- -26.07.2002
23.3±3.6
60.5±34.7
means: 3-4 min: 1 max: > 4.5
acute cold stress, acute heat stress
III IV
09.-17.07.02
July 2002 (12°C)
29.07 – 09-08.2002
21.5±2.6
40.2±20.8
means: 2-3 min: 1 max: > 4.5
acute heat stress
IV
Oct. 2002
Oct. 2002 (6°C)
11.02. – 12.02.2002
23.7±1.6 49.9±15.4 means: 4-5 min: 2 max: > 4.5
seasonal comp; comparison to Pb
I
Sep. 2003 21.11.03 (10°C)
03.12.-07.12.2003
23.6 ± 2.7 504. ± 22.2 means: 4 min: 1.5 max: > 4.5
recovery time series III
Pachycara brachycephalum
King George Island (Maxwell Bay)
62°14’ S 58° 40’ W
400 ANT XIX/5; April 2002
releaser trap
June 2002 (0°C)
03.03.-04.03.2003 23.4±3.7 43.4±12.4 means: 7 min: 4 max: 11
control acclimation; comparison to Zv
I
18.12.02 (5°C)
24.5±2.2
48.4±10.6
means: 8-9 min: 6-7 max: 11
warm acclimation to 5°C; comparison to Zv
I
ANT XVII/3 May 2000
- 19.09./16.10.01 - - - HIF-1α sequencing II
Trematomus hansoni
Weddell Sea 70°56.57 S 10°33.02 W
300 – 333
ANT XXI/2; Dec. 2003
bottom trawl
- 25.12.03 - - - HIF-1α sequencing II
Trematomus pennellii
Weddell Sea 70°56.57 S 10°33.02 W
300 – 333
ANT XXI/2; Dec. 2003
bottom trawl-
- 25.12.03 - - - HIF-1α sequencing II
Chionodraco myersi
Weddell Sea 70°56.57 S 10°33.02 W
300 – 333
ANT XXI/2; Dec. 2003
bottom trawl
- 25.12.03 HIF-1α sequencing II

APPENDIX
206

ACKNOWLEDGEMENTS
207
Ein besonderes Dankeschön an…
…Prof. Dr. Hans-Otto Pörtner für die gute Betreuung und die Begutachtung meiner
Doktorarbeit.
…Privatdozentin Dr. Doris Abele für die Betreuung und Unterstützung in sämtlichen
Phasen meiner Doktorarbeit, die Begutachtung der Arbeit und ein immer offenes Ohr.
…Prof. Dr. Wilhelm Hagen und Prof. Dr. Angela Köhler für die Zusage als Prüfer
während meiner Verteidigung.
…Dr. Susana Puntarulo für die Betreuung und die stete Diskussionsbereitschaft
während meiner Zeit in ihrem Labor in Buenos Aires.
…Prof. Dr. Mikko Nikinmaa für die Betreuung in Finnland und viele interessante
Diskussionen.
…Dr. Magnus Lucassen für die Unterstützung, den Satz „das klappt schon“ und v.a.
dafür, dass ich feststellen konnte, dass Molekularbiologie Spaß machen kann.
…Timo Hirse und Stefanie Meyer für die stete Hilfe im Labor und bei vielen kleinen
und größeren Katastrophen. .
…Andreas Wagner und Ulrich Knoll für ihre technische Unterstützung auf Helgoland.
…der gesamten Arbeitsgruppe „Ökophysiologie“ für die freundschaftliche Atmosphäre
und die ständige gegenseitige Unterstützung.
…den Mitgliedern der Arbeitsgruppen „Fisicoquimica“ und „Animal Physiologie“ für
unvergessliche Zeiten in Argentinien und Finnland.
…den Bewohnern der „Residencia“, die mir mit ihrer Hilfsbereitschaft und Freundschaft
das Überleben im Dschungel von Buenos Aires ermöglicht haben, sowie für Spanisch-
Nachhilfe, Empanadas und RESISTIRE.
…Birgit Obermüller für vier gemeinsame Jahre im Container.
…meine Eltern und meine kleine Schwester dafür, dass sie immer für mich da sind.

ACKNOWLEDGEMENTS
208

ERKLÄRUNG
209
Bremerhaven, den 14. September 2005
Katja Heise
Wittekindstr. 21
27570 Bremerhaven
Erklärung gemäß § 5 (1) Nr. 3 PromO
Ich erkläre hiermit,
1. dass ich mich vor dem jetzigen Promotionsverfahren keinem anderen Promotions-
verfahren unterzogen habe
und
2. dass ich außer dem jetzt laufenden Promotionsverfahren auch kein anderes beantragt
habe.
__________________
Katja Heise


![Optimierung von Oligonukleotid-Bibliotheken für DNA ...elib.suub.uni-bremen.de/diss/docs/E-Diss779_Dissertation_Manfred_Noelte.pdf · nennt [103] „A classification of tasks in](https://img.pdfslide.net/doc/110x75/5dd0e2c8d6be591ccb632cb5/optimierung-von-oligonukleotid-bibliotheken-fr-dna-elibsuubuni-nennt-103.jpg)