Embed Size (px)
Citation preview
INTE
RACTIVE
VISUALIZ
ATIO
NS TOOLK
IT
FOR R
IP
BY :
TI M
DE
BO
ER
AN
D K
I M V
ER
K OO
I J
DEFINITION: INTERACTIVE VISUALIZATION TOOLKIT Toolkit:
a set of tools designed to be used together or for a particular purpose
For a visualization to be considered interactive it must satisfy two criteria:
Human input: control of some aspect of the visual representation of information, or of the information being represented, must be available to a human, and
Response time: changes made by the human must be incorporated into the visualization in a timely manner. In general, interactive visualization is considered a soft real-time task.
INTRODUCTION
• Problem statement
• Research questionWhat makes a Interactive Visualization Toolkit applicable for the development of visualizations for Rich Internet Publications?
• Scientific contribitionIdentification of features for IVT
• Practical contribution • Help scolars choose a toolkit• Hand IVT developers a roadmap to get optimized for RIP
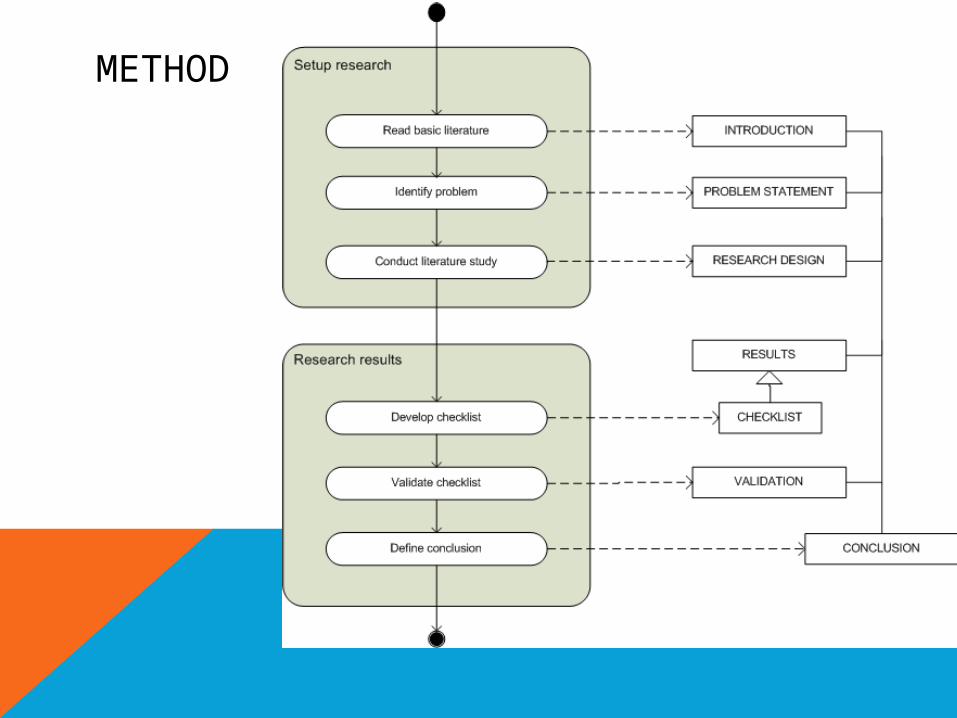
METHOD
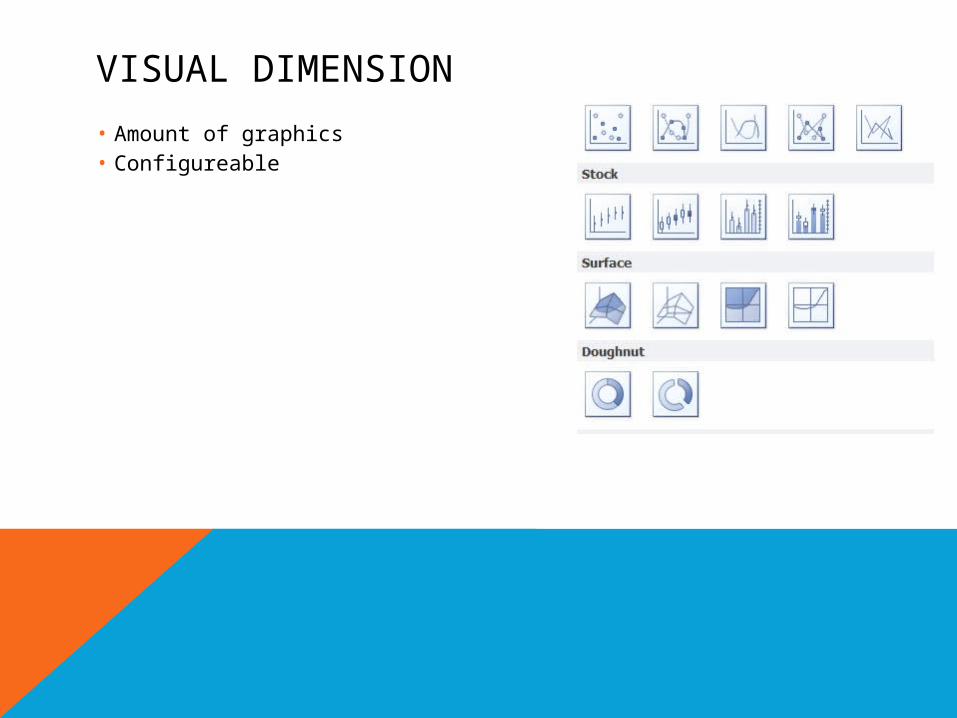
VISUAL DIMENSION
• Amount of graphics• Configureable
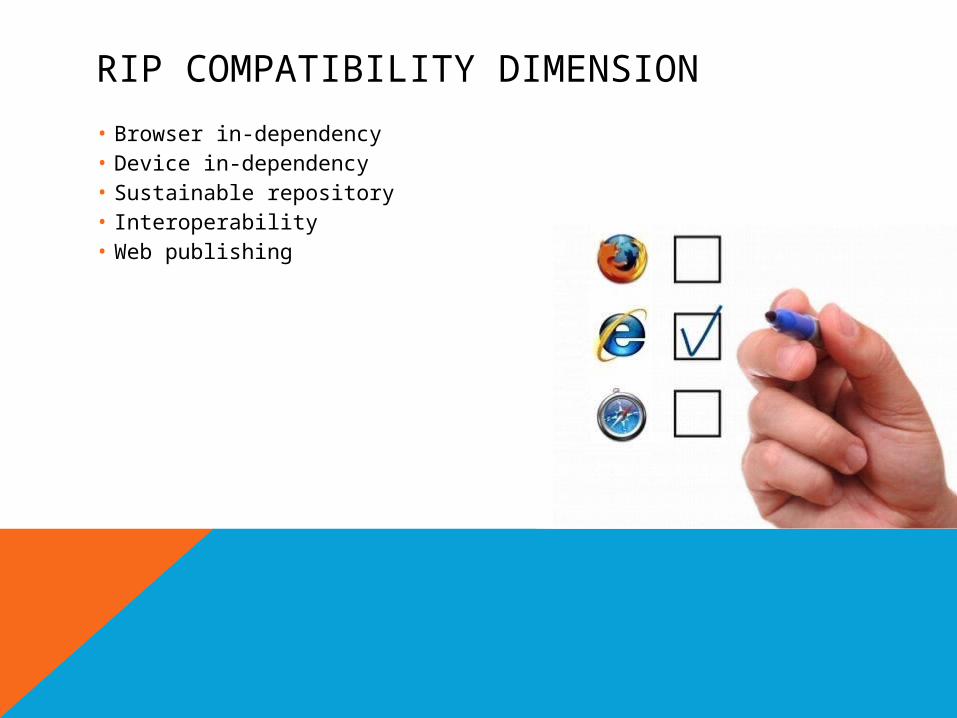
RIP COMPATIBILITY DIMENSION
• Browser in-dependency• Device in-dependency• Sustainable repository• Interoperability• Web publishing
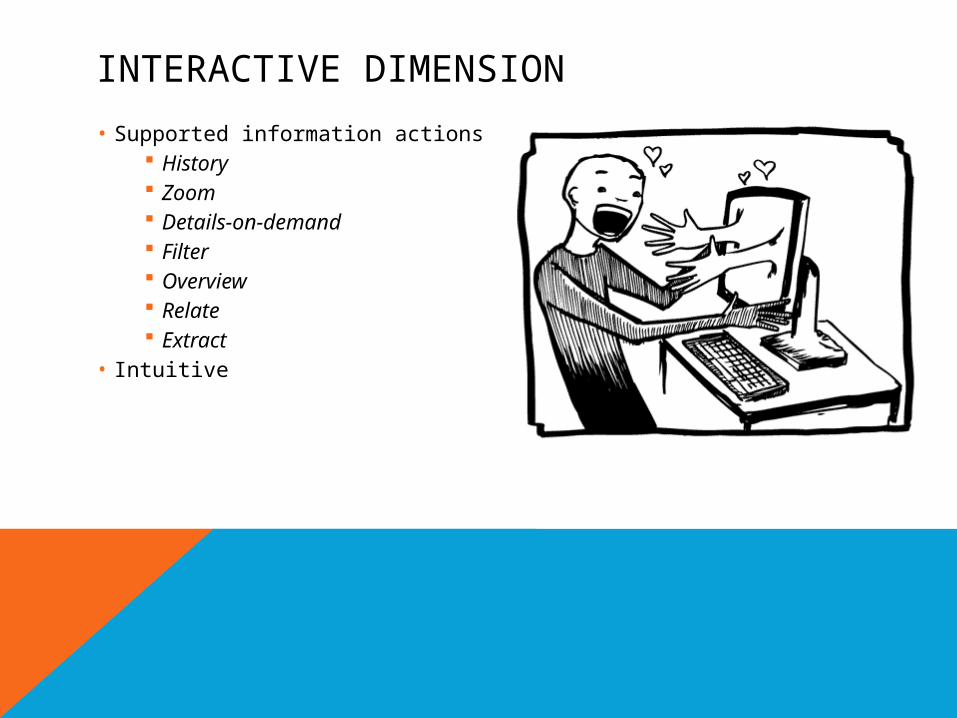
INTERACTIVE DIMENSION
• Supported information actions History Zoom Details-on-demand Filter Overview Relate Extract
• Intuitive
SCIENTIFIC DIMENSION
• Reproduce and reuse of data• Annotation data points• Discussion• Statistical calculations• Static export options
DIMENSION: EASE OF DEVELOPMENT
Skills needed Time needed Cost of toolkit
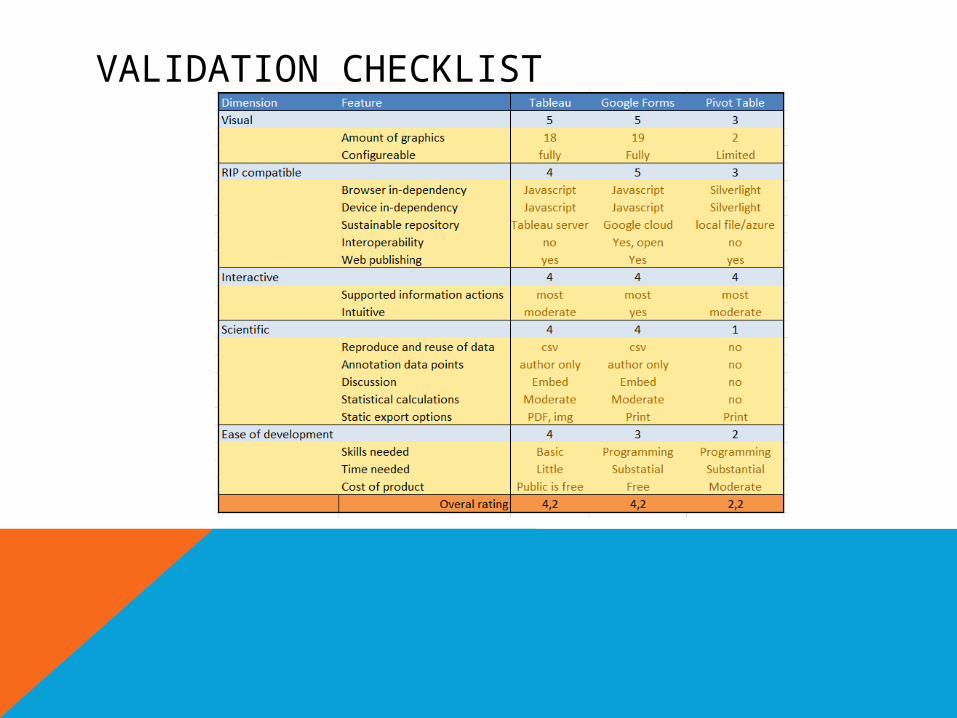
VALIDATION CHECKLIST
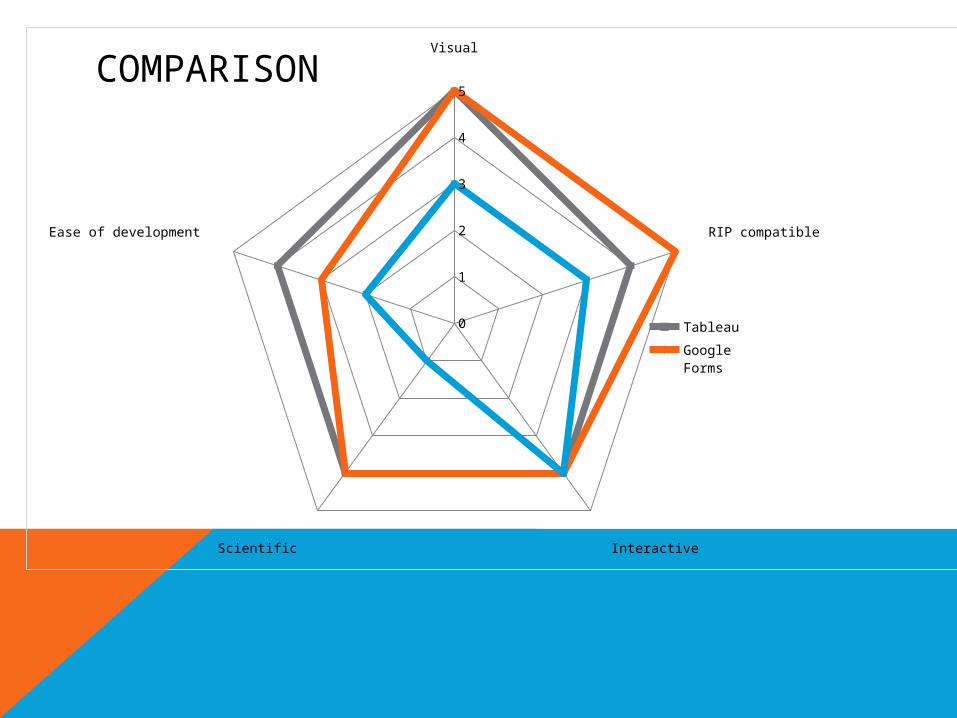
Visual
RIP compatible
InteractiveScientific
Ease of development
0
1
2
3
4
5
TableauGoogle FormsPivotviewer
COMPARISON
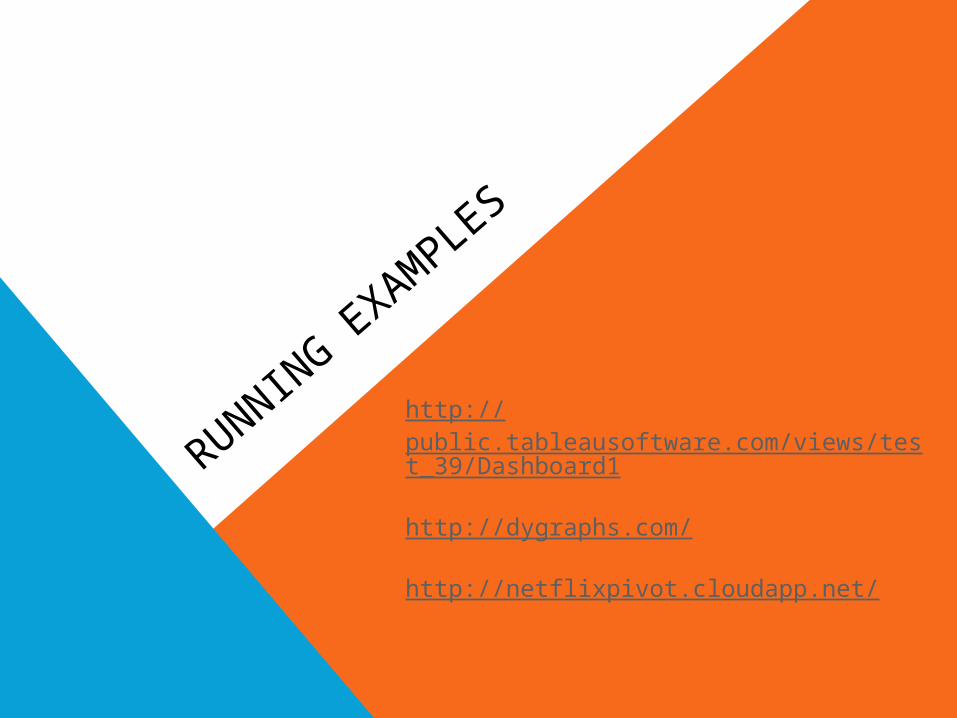
RUNNING E
XAMPLES
http://public.tableausoftware.com/views/test_39/Dashboard1
http://dygraphs.com/
http://netflixpivot.cloudapp.net/

DISCUSSIO
N