Embed Size (px)
Citation preview
International Journal of Development and Economic Sustainability
Vol.5, No.3, pp.32-47, June 2017
__Published by European Centre for Research Training and Development UK (www.eajournals.org)
32
2053-2199 (Print), 2053-2202(Online)
INTERFACES BETWEEN ROAD INFRASTRUCTURE AND POVERTY IN
AFRICA: THE CASE OF MALAWI, 1994-2013
Abdi-Khalil Edriss
Professor of Applied Economics and Statistics, Lilongwe University of Agriculture and
Natural Resources (LUANAR), Bunda Campus, Box 219, Lilongwe, Malawi
ABSTRACT: Critical assessment on the correlation between public investment on road
infrastructure and poverty was carried out, and therefore this research paper provides an in
depth analyses of the linkage between road infrastructure and poverty, as well as, other
relevant macro economic variables used in the Malawi Growth and Development Strategy
(MGDS) as target indicators. Using primary and secondary data from 1994-2013, dynamic
time series models were applied in elaborating the various factors with thrust on road
infrastructure that may influence poverty in Malawi. Noting poverty reduction as priority of
Malawi Government’s development agenda since the early 1990s, MGDS provides the
country’s socioeconomic growth and development platforms. According to the latest 2010
Integrated Household Survey (IHS3), the majority of Malawians (50.7 percent) are
languishing in abysmal poverty; this level is remotely far from the MDGS target of 27
percent by end 2015. The country has a high inequality index (Gini 0.38) reflecting profound
inequalities in access to assets, services and opportunities across the population. The
distribution of the benefits of economic growth is also important for the alleviation of
poverty. However, the distribution of income and wealth are highly skewed, with a majority
of the population living in a state of absolute poverty. Based on NSO surveys (1998-2010),
the poorest 20 percent of the population control only around 10 percent of national
consumption implying inequality is not decreasing at all for long time. Hosts of factors
explaining why poverty level continues to be rampant are: share of agricultural as a percent
of GDP (proxy to agricultural production) and export as percent of GDP (proxy to exports).
However, this paper findings show that there is significant (p=0.000<0.05) relationship
between road network and poverty levels. Estimates from Granger Causality analysis
indicate that for one percent increase in road network, a reduction of 7.2 percent in poverty
level is perhaps achievable. Average inflation rate over the last 20 years stands at 22.41
percent, and this has an immense impact on poverty level since it dramatically reduces the
purchasing power of the majority of the population. For a one percent increase in the
inflation rate, there is a consequence of about 3.7 percent increase in the average poverty
level. Average Gross Domestic Product (GDP) growth rate is 4.7 percent annually with a
minimum of -4.9 percent and a maximum of 10.2 percent in the last 20 years. Poverty level
appears to significantly respond to (GDP). There is a 4.27 percent reduction in poverty level
if a one percent GDP increment takes place as shown in the dynamic time series analysis. In
fact, the declining of agricultural production for export and the growing gap in balance of
payment (average Malawi Kwacha -498.92 billions or approximately US$1.1 billion) would
immensely influence GDP negatively and therefore poverty becomes abysmal as GDP growth
plummets. In a nutshell, the findings confirm that in the long run economic growth is the key
to alleviation of extreme poverty since it creates the resources to raise incomes. Given the
importance of agriculture in contributing towards GDP in Malawi, the positive impact that
this sector has on poverty is evident. For agriculture to meaningfully impact economic
growth, road infrastructure plays a great role. Other pro-poor variables such as development
International Journal of Development and Economic Sustainability
Vol.5, No.3, pp.32-47, June 2017
__Published by European Centre for Research Training and Development UK (www.eajournals.org)
33
2053-2199 (Print), 2053-2202(Online)
roads and other investment on infrastructure are vital for economic growth and hence
poverty alleviation.
KEYWORDS: Infrastructure, Vector Autoregression, Granger Causality, Public Investment,
Poverty, Malawi
INTRODUCTION
Recently the issue of poverty reduction has been at the centre of global policymaking.
Although the link between public investment in rural roads and poverty reduction has been at
the centre of development discourse for some time, not much has been investigated on the
impact of public investment in rural development in Africa and particularly in Malawi. In
fact, the majority of poor people in the world including Malawi live in rural areas, where the
level of public infrastructure especially roads is low. The inadequate roads and poor access
escalates the high cost of transportation, and limits the use of local markets for sales of their
products, the purchase of consumer goods and opportunities for off-farm employment, as
well as reducing access to high quality inputs. In addition, poor road access has immense
constraint for rural poor in terms of access to other social infrastructures such as education
and health facilities.
Most developing countries in the world have depended on agriculture as the main source of
income and poverty reduction. In this context, Malawi being a rural country, infrastructure
development in the rural areas is important. In this regard, the correlation between public
investment and rural infrastructure in Malawi is relevant. For instance, farmers need good
rural roads to access farm inputs and commodity markets, electricity, schools, health and
telecommunication facilities. Investing in rural infrastructure can enhance rural employment
and income and thereby reducing poverty. Accordingly, critical assessment on the correlation
between public investment and what type of rural infrastructure must be prioritized for
inducing rural productivity and poverty reduction is essential. In depth analyses have to be
carried out with the aim of developing the linkage between rural infrastructure and poverty.
A good understanding and analysis on public investment and rural infrastructure in Malawi is
crucial in reducing poverty. This information is vital in providing policy direction on
government expenditure and resource allocation and value for money.
Background and Reviews
Of late, there is a very strong impetus given to infrastructure investments in Sub-Saharan
Africa.
For the period 2008-2010, the Chinese EXIM bank committed around $20billion in
infrastructure for financing railway rehabilitation in Nigeria, Angola, building dams in
Ethiopia and other places. The African Development Bank will spend over $5billion in the
next three years, of which over 60 percent in infrastructure (mainly roads, energy and water).
The World Bank spends more than $5 billion a year in Sub-Saharan Africa (with more than
$1.5billion in roads), and as of 2006 it has spent US$16.5 million on road infrastructure
development in Malawi. Moreover, aid to Africa is planned to double in the near future (G8
commitment in 2008); infrastructure investments will be of crucial importance (World Bank,
2006; 2013).
International Journal of Development and Economic Sustainability
Vol.5, No.3, pp.32-47, June 2017
__Published by European Centre for Research Training and Development UK (www.eajournals.org)
34
2053-2199 (Print), 2053-2202(Online)
Characteristics of Road in Malawi
According to National Roads Authority (2011) report, roads continue to be the country’s
most dominant mode of transport and handles over 99 percent of domestic passenger traffic,
more than 70% of internal freight traffic and 90 percent of international freight and passenger
traffic. National Roads Authority (NRA, 2011) reported that the road network is composed of
15,451 km of which about 26 percent are paved. The rest of the road network (74 percent) is
of earth/gravel surface. Studies carried out in 2005 have identified about 10,000 km of
undesignated road network serving rural communities. The road transport is also important
for international trade as it handles more than 90% of freight and passenger traffic.
Based on NRA data, the paved road density is about 268 meters per 1000 population in
Malawi compared to 318 meters per 1000 population for Sub-Saharan African countries. This
implies the dysfunctional state of roads all over Africa, and it is even worst and a huge
challenge for Malawi as a land-locked country. It is a complete deficiency in coverage.
According to UN-Habitat (2011) study, Africa’s 15 land-locked countries, which accounts for
40 percent of the region’s overall population, face special challenges. Countries that are land-
locked are at the disadvantage because, on average, they take four more days to land
distribution of exports and nine days to imports compared with seaport countries with
equivalent distances. The geographical results in higher transport costs which hamper intra
and inter-regional trade, as well as reduces openness to trade emerges as the main factor,
other things being equal, that contribute to slow growth than the rest of the countries.
According to data obtained from Malawi Roads Authority, the condition of the road network
is such that 60 percent (2426 km), 33 percent (1361 km), and 7 percent (286 km) are in good,
fair and poor conditions, respectively. On the other hand, 44% (5000 km), 23 percent (2654
km) and 33 percent (3724 km) of the unpaved roads are in good, fair and poor condition,
respectively. Thus, the total road network condition is 48 percent good, 26 percent fair and 26
percent poor. With no statistically difference between good and a combination of fair and
poor roads, Malawi still does not have good road conditions; where by over 60 percent of the
roads are in unacceptable conditions. These conditions of the road also likely contribute to
declining of economic growth and elevating poverty, as a whole.
Extent of Poverty
According to the latest 2010 Integrated Household Survey (IHS3), the majority of Malawians
are poor (50.7 percent). The rural areas have proportionately more people living in abysmal
poverty (55.9 percent) than urban areas (25.4 percent) (National Statistical Office, 2005-
2010). The poverty is manifested in low incomes, high illiteracy rates, high infant (under-5)
and maternal mortality rates, high levels of child malnutrition, low life expectancy and a high
HIV and AIDS prevalence rate. The country has a high inequality index (Gini 0.38) reflecting
profound inequalities in access to assets, services and opportunities across the population
(World Bank, 2006). In fact, according to the 1998, 2005 and 2010 Integrated Household
Surveys, the poorest 20 percent of the population control only around 10 percent of national
consumption implying inequality is not decreasing at all.

International Journal of Development and Economic Sustainability
Vol.5, No.3, pp.32-47, June 2017
__Published by European Centre for Research Training and Development UK (www.eajournals.org)
35
2053-2199 (Print), 2053-2202(Online)
Figure 3.4: Actual and Projected Poverty Head Count Malawi
49.850.7545253.954.3 50.7
0
10
20
30
40
50
60
1990/92 1998-2000 2004/05 2012/13 2013 2014/15 2015
Pe
rce
nt
Actual Poverty MDG target 2 per. Mov. Avg. (MDG target)
Source: NSO, 1991, 2000, 2005 and 2012
Ostensibly, poverty has continued to manifest itself in different ways and more pronounced in
the rural areas of Malawi where 85 percent of the population reside. As shown in Figure 3.4,
poverty in Malawi has become almost endemic and has been about 52 percent in the last
fifteen years. Over half of the entire population is in abysmal poverty. Eradicating extreme
poverty is the first of the eight MDGs goals, which targets to halve1 the level of poverty to 27
percent by 2015. This is remotely impossible to achieve as poverty stands at about 52 percent
at the moment; implying that Malawians have continued to remain in poverty and prone to
vulnerability due to exogenous shocks including natural disasters, external economic forces,
internal policy failures, mismanagement of government funds and virtually with no
meaningful development.
METHODOLOGY
According to the World Bank (2006), insufficient and inadequate economic infrastructure is
among the most pressing obstacles to achieving pro-poor growth. Among infrastructure,
roads are considered of first interest to reduce poverty due to the widely accepted
consensus that transport infrastructure has a significant, positive and substantial impact
on economic growth and poverty. Within this context, the rural access index (RAI)
(proportion of rural people who live within two kilometers (typically equivalent to a 20-
minute walk) of an all-season road has been set as the most important indicator for the World
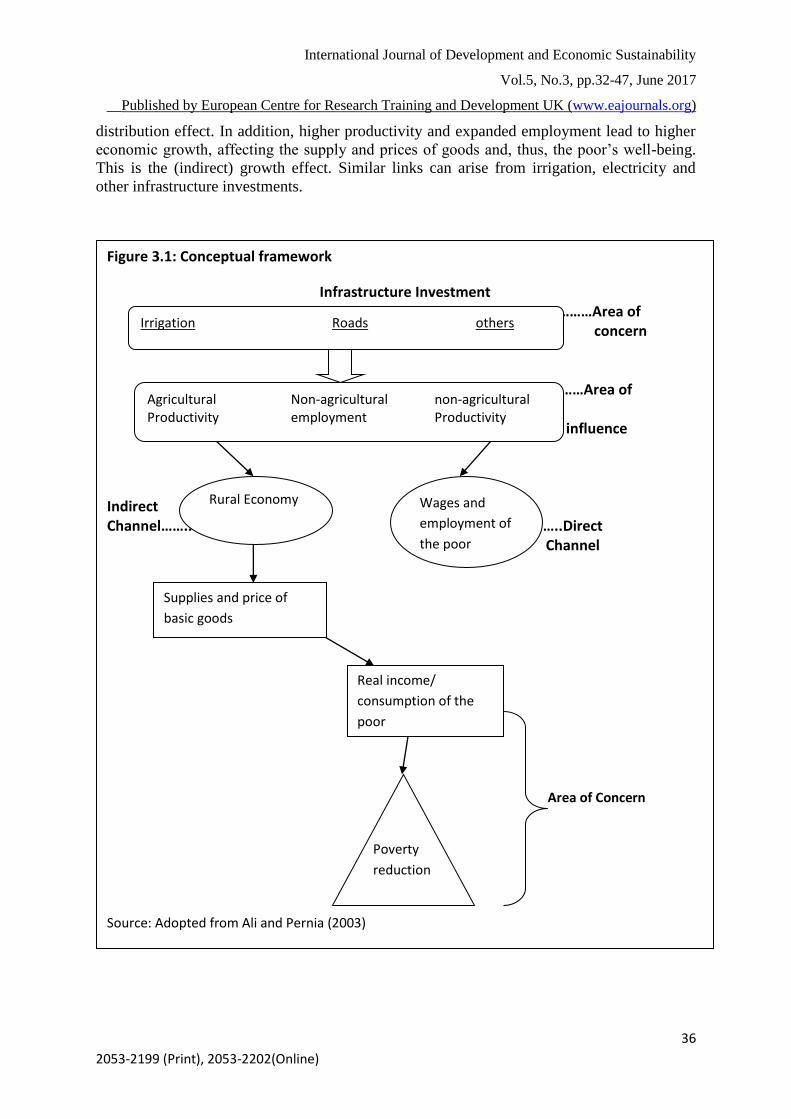
Bank in its current and future investments in road transport. Based on ADB (2013) and
macroeconomic conceptual framework, Figure 3.1 illustrates the links from infrastructure
investments (areas of intervention) through these determinants (areas of influence) to the
poor’s wages and employment (direct channel), on the other hand, rural economic growth
(indirect channel) that influences the supply and prices of basic goods. The final links are to
real income/consumption of the poor and consequently, poverty reduction (area of concern).
The various links can be illustrated with an example from the tentative conceptual
framework. For example, a road investment could result in an increase in agricultural
productivity, nonfarm employment and productivity, directly raising the wages and
employment of the poor and, hence, their economic welfare. This is the (direct) income
1 MDG’s first target is to halve, between 1990 and 2015 the proportion of people whose income is less than one dollar per day
MDG target
International Journal of Development and Economic Sustainability
Vol.5, No.3, pp.32-47, June 2017
__Published by European Centre for Research Training and Development UK (www.eajournals.org)
36
2053-2199 (Print), 2053-2202(Online)
distribution effect. In addition, higher productivity and expanded employment lead to higher
economic growth, affecting the supply and prices of goods and, thus, the poor’s well-being.
This is the (indirect) growth effect. Similar links can arise from irrigation, electricity and
other infrastructure investments.
Figure 3.1: Conceptual framework
Infrastructure Investment ………………… …………Area of
…………………………… c concern
……Area of
influence
Indirect Channel…….. ……. ……..Direct
Channel
Area of Concern Source: Adopted from Ali and Pernia (2003)
Irrigation Roads others
Agricultural Non-agricultural non-agricultural Productivity employment Productivity
Rural Economy Wages and
employment of
the poor
Supplies and price of
basic goods
Real income/
consumption of the
poor
Poverty
reduction
International Journal of Development and Economic Sustainability
Vol.5, No.3, pp.32-47, June 2017
__Published by European Centre for Research Training and Development UK (www.eajournals.org)
37
2053-2199 (Print), 2053-2202(Online)
The framework herein was used in designing the empirical work that aimed to trace more
carefully and systematically the links of interest. Various econometric studies available
generally do trace some links described above. They provide useful assessments of the more
important links, indicating their quantitative and statistical significance. These measures are
typically represented as elasticities denoting the responsiveness of a variable to a
determinant. The few available studies covered in the review offer examples from Asian and
few African countries. While differences in econometric model specifications, data, and
definitions call for caution in the interpretation of results across countries, they do lend
helpful insights into the connection between physical infrastructure and poverty reduction.
This road map will be utilized to formulate relevant econometric models to understand the
influences of various variables in reducing poverty.
Data requirements and Sources
Both primary and secondary sources of data were explored. Primary data were gathered
through formal interviews with different stakeholders including officials from government
and World Bank representative/s working on the ISP, community leaders and ordinary
members of communities in rural areas. Structured questionnaires and checklists were be
used for the data collection. Different Focus Group Discussion (FGDs), government
ministries, universities, research centers, UN organizations and NGOs, were consulted and
information were used where deemed necessary.
Secondary sources of information involved a review of literature relevant to the subject
matter including project documents, public expenditure statements and government annual
report. Sources of secondary data included the following; Ministry of Transport and Public
Works, Ministry of Agriculture, Ministry of Planning and Economic Development, Ministry
of Finance, Reserve Bank of Malawi, National Roads Authority (NRA), National Statistical
Office (NSO), Malawi Social Action Fund (MASAF) and the World Bank.
Analytical Techniques
In order to link the roadmap or conceptual framework illustrated previously, various
analytical techniques were reviewed from studies in developing countries, and in which the
best analytical technique or a combination of methods was adopted for Malawi’s scenarios
(based on available data). Some of the methods used to analyze impact of rural road
infrastructure on poverty are summarized in Table 3.1.
Table 3.1: Analytical techniques and References
Analytical methods References
Generalized Method of Moments as employed
Seetanah, 2012; Oraboune, 2008
Three log forms model with Fixed/random
effects techniques
Datt and Ravaillon, 2002;
Ravallion and Datt, 1996 and
Ghura, Leite, and Tsangarides, 2002
Simultaneous equations Fan, Hazell and Thorat (1999)
Neo-classical production functions such as
Cobb-Douglas or log linear production function
Fan, Rao and Zhang (2004);
Munnel, 1992; Gramlich, 1994;
Sturm, Kuper & De Haan, 1998;
Romp & DeHaan, 2005
International Journal of Development and Economic Sustainability
Vol.5, No.3, pp.32-47, June 2017
__Published by European Centre for Research Training and Development UK (www.eajournals.org)
38
2053-2199 (Print), 2053-2202(Online)
Simultaneous Equations
(A) The Human Capital Channel, (B) The
Market Access Channel, and (C) The Labor
Activities Channel
Gachassin, Najman and Raballand,
2010; Mustajab, 2009
Panel data and Dynamic Panel Analysis Seeanah, Ramessur and Rojid
(2009); Woodridge, 2002
Vector Autoregression (VAR) and Vector Error
Correction Models (VECM)
Perron (1990); Toda & Phillips
(1993; 1994), Dufour & Renault,
1998; Ramirez, 2004; Lütkepohl,
2005
Structural Vector Autoregressive (SVAR) Sims (1980a, 1980b); Amisano &
Giannini, 1997; Arellano and Bover,
1995; Saikkonen & Lutkephol,
2002; Sarte, 1997; Ogun’s (2010)
In this study the impact of road infrastructure on Malawi’s poverty is assessed from
a macroeconomic perspective. The lack of clear theoretical guidance on the choice of
regressors, for the poverty equation, leads to a wide set of possible specifications and
model uncertainty which in turn often results in contradictory conclusions. A challenge
therefore is to motivate which macroeconomic variables to include in the poverty equation.
The fact that a certain variable is available in the data set seldom provides sufficient
justification for including it in the model. Thus, after reviewing various studies done in
developing countries (Table 3.1), a comprehensive list of variables were put together in
conjunction to MDGs target variables and indicators. The variables that are used in the
multivariate time series models are:
povertyrate=the headcount poverty index
gdprate = gross domestic product (%)
inflationrate=inflation rate or cpi
xportpergdp = exports as a % of GDP
foreigninflow = foreign fund in flow Malawi Kwacha (MK’00 billions)
totalgvtexpendi = government capital expenditure
totalgovrev = government revenue in MK(billions)
shareagrgdp = share of agriculture in GDP
lifeexpectancy= life expectancy rate at birth or health(years)
literacrate = literacy rate(%)
unemloyrate =unemployment rate(%)
roadlength = length of road paved/tarred(km)
fmd2gdp = financial development (Money supply or M2 as a % of GDP)
International Journal of Development and Economic Sustainability
Vol.5, No.3, pp.32-47, June 2017
__Published by European Centre for Research Training and Development UK (www.eajournals.org)
39
2053-2199 (Print), 2053-2202(Online)
With the availability of Malawi data from 1994 to 2013 on these selected variables, Vector
Autoregression (VAR) and Vector Error Correction (VEC) time series models were used as
econometric specifications to link poverty with different variables identified and listed
previously.
VAR and VEC Models
The vector autoregressive (VAR) model is a general framework used to describe the dynamic
interrelationship among stationary variables. So, the first step in multivariate time-series
analysis should be to determine whether the levels of the data are stationary. If not, take the
first difference of the series and try again. Usually, if the levels (or log levels) of the time
series are not stationary, the first difference will be (Adikins and Hill, 2011).
If the time series are not stationary then the VAR framework needs to be modified to allow
consistent estimation of the relationships among the series. The vector error correction (VEC
or VECM) model is just a special case of the VAR for variables that are stationary in their
differences. The VEC can also take into account any cointegrating relationships among the
variables. Generalizing the discussion about dynamic relationships between two interrelated
variables, say yt and xt, the following systems of equations are used.
yt=β20 + β11yt-1 + β12xt-1 + υyt
xt=β30 + β21yt-1 + β22xt-1 + υxt
These equations describe a system in which each variable is a function of its own lag, and the
lag of the other variable in the system. In this case the system contains two variables y and x.
Together the equations constitute a system known as a vector autoregression (VAR).
However, if y and x are stationary, the system can be estimated using least squares applied to
each equation. If y and x are not stationary in their levels, but stationary in their differences
(i.e., I(1)), the differences estimate:
Δyt=β20 + β11Δyt-1 + β12Δxt-1 + υΔyt
Δxt=β30 + β21Δyt-1 + β22Δxt-1 + υΔxt
Using least squares, if y and x are I(1) and cointegrated, then the system of equations can be
modified to allow for the cointegrated relationship between I(1) variables. Introducing the
cointegrating relationship leads to a model known as the vector error correction (VEC or
VECM) model (Adikins and Hill, 2011). These are the dynamic multivariate models applied
in this analysis with all assorted and necessary unit root tests including Dickey-Fuller tests
and remedial measures are taken to make sure the estimates are consistent as expected and
required.
RESULTS AND DISCUSSIONS
The level of poverty index shows that the percentage of the population with consumption of
food and non-food essentials lowers than the poverty line of US$1/day (currently
MK420/day). As shown in Table 4.1, the average for the last two decades stands at 52.8
percent with no significant reduction at all comparing to current level of 51 percent. With the
International Journal of Development and Economic Sustainability
Vol.5, No.3, pp.32-47, June 2017
__Published by European Centre for Research Training and Development UK (www.eajournals.org)
40
2053-2199 (Print), 2053-2202(Online)
current population growth rate of 2.8 percent, Malawi would need GDP growth of 8.4 percent
to have meaningful economic development and prevent an increase in poverty level.
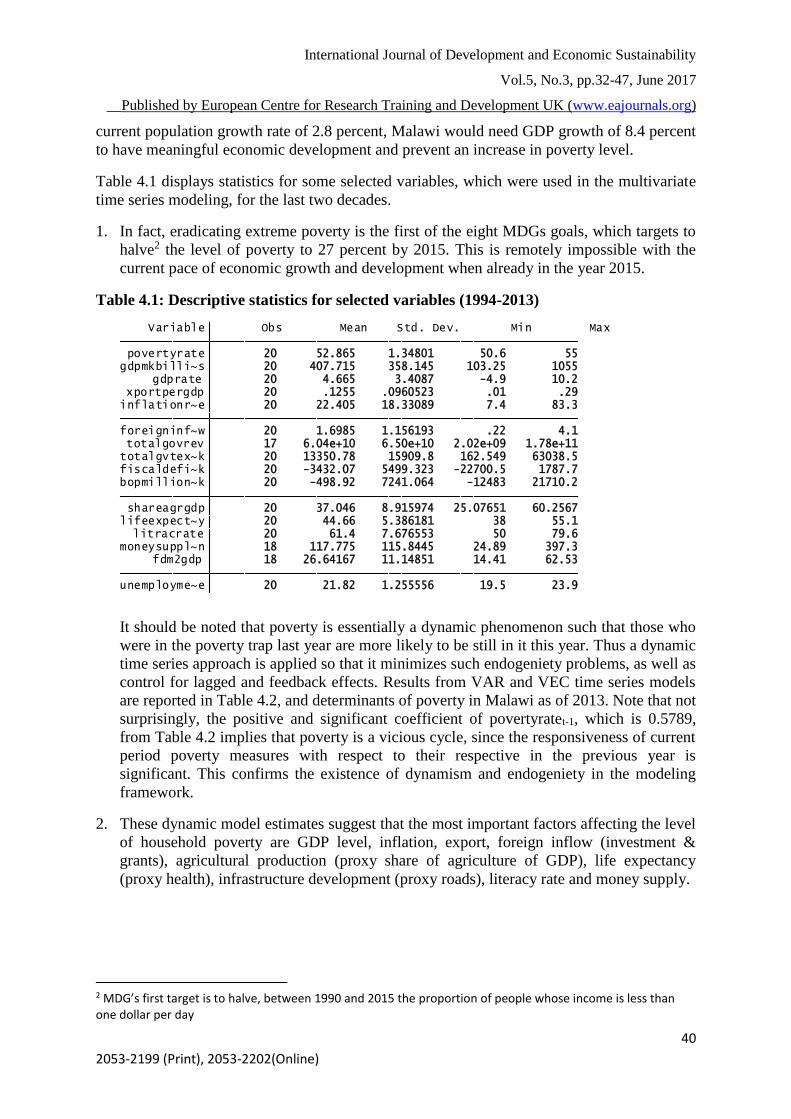
Table 4.1 displays statistics for some selected variables, which were used in the multivariate
time series modeling, for the last two decades.
1. In fact, eradicating extreme poverty is the first of the eight MDGs goals, which targets to
halve2 the level of poverty to 27 percent by 2015. This is remotely impossible with the
current pace of economic growth and development when already in the year 2015.
Table 4.1: Descriptive statistics for selected variables (1994-2013)
unemployme~e 20 21.82 1.255556 19.5 23.9 fdm2gdp 18 26.64167 11.14851 14.41 62.53moneysuppl~n 18 117.775 115.8445 24.89 397.3 litracrate 20 61.4 7.676553 50 79.6lifeexpect~y 20 44.66 5.386181 38 55.1 shareagrgdp 20 37.046 8.915974 25.07651 60.2567 bopmillion~k 20 -498.92 7241.064 -12483 21710.2fiscaldefi~k 20 -3432.07 5499.323 -22700.5 1787.7totalgvtex~k 20 13350.78 15909.8 162.549 63038.5 totalgovrev 17 6.04e+10 6.50e+10 2.02e+09 1.78e+11foreigninf~w 20 1.6985 1.156193 .22 4.1 inflationr~e 20 22.405 18.33089 7.4 83.3 xportpergdp 20 .1255 .0960523 .01 .29 gdprate 20 4.665 3.4087 -4.9 10.2gdpmkbilli~s 20 407.715 358.145 103.25 1055 povertyrate 20 52.865 1.34801 50.6 55 Variable Obs Mean Std. Dev. Min Max
It should be noted that poverty is essentially a dynamic phenomenon such that those who
were in the poverty trap last year are more likely to be still in it this year. Thus a dynamic
time series approach is applied so that it minimizes such endogeniety problems, as well as
control for lagged and feedback effects. Results from VAR and VEC time series models
are reported in Table 4.2, and determinants of poverty in Malawi as of 2013. Note that not
surprisingly, the positive and significant coefficient of povertyratet-1, which is 0.5789,
from Table 4.2 implies that poverty is a vicious cycle, since the responsiveness of current
period poverty measures with respect to their respective in the previous year is
significant. This confirms the existence of dynamism and endogeniety in the modeling
framework.
2. These dynamic model estimates suggest that the most important factors affecting the level
of household poverty are GDP level, inflation, export, foreign inflow (investment &
grants), agricultural production (proxy share of agriculture of GDP), life expectancy
(proxy health), infrastructure development (proxy roads), literacy rate and money supply.
2 MDG’s first target is to halve, between 1990 and 2015 the proportion of people whose income is less than one dollar per day
International Journal of Development and Economic Sustainability
Vol.5, No.3, pp.32-47, June 2017
__Published by European Centre for Research Training and Development UK (www.eajournals.org)
41
2053-2199 (Print), 2053-2202(Online)
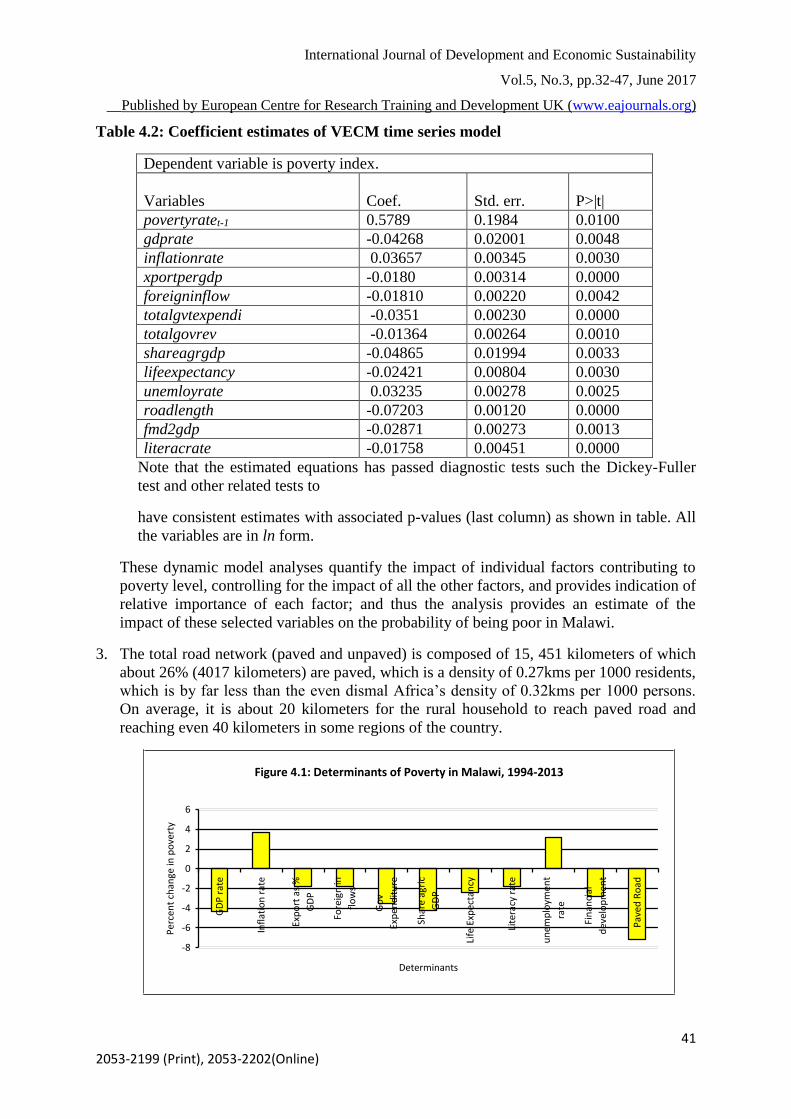
Table 4.2: Coefficient estimates of VECM time series model
Dependent variable is poverty index.
Variables
Coef.
Std. err.
P>|t|
povertyratet-1 0.5789 0.1984 0.0100
gdprate -0.04268 0.02001 0.0048
inflationrate 0.03657 0.00345 0.0030
xportpergdp -0.0180 0.00314 0.0000
foreigninflow -0.01810 0.00220 0.0042
totalgvtexpendi -0.0351 0.00230 0.0000
totalgovrev -0.01364 0.00264 0.0010
shareagrgdp -0.04865 0.01994 0.0033
lifeexpectancy -0.02421 0.00804 0.0030
unemloyrate 0.03235 0.00278 0.0025
roadlength -0.07203 0.00120 0.0000
fmd2gdp -0.02871 0.00273 0.0013
literacrate -0.01758 0.00451 0.0000
Note that the estimated equations has passed diagnostic tests such the Dickey-Fuller
test and other related tests to
have consistent estimates with associated p-values (last column) as shown in table. All
the variables are in ln form.
These dynamic model analyses quantify the impact of individual factors contributing to
poverty level, controlling for the impact of all the other factors, and provides indication of
relative importance of each factor; and thus the analysis provides an estimate of the
impact of these selected variables on the probability of being poor in Malawi.
3. The total road network (paved and unpaved) is composed of 15, 451 kilometers of which
about 26% (4017 kilometers) are paved, which is a density of 0.27kms per 1000 residents,
which is by far less than the even dismal Africa’s density of 0.32kms per 1000 persons.
On average, it is about 20 kilometers for the rural household to reach paved road and
reaching even 40 kilometers in some regions of the country.
Figure 4.1: Determinants of Poverty in Malawi, 1994-2013
-8
-6
-4
-2
0
2
4
6
GD
P r
ate
Infl
atio
n r
ate
Exp
ort
as
%
GD
P
Fore
ign
in
flo
ws
Go
v
Exp
end
itu
re
Shar
e ag
ric
GD
P
Life
Exp
ecta
ncy
Lite
racy
rat
e
un
emp
loym
ent
rate
Fin
anci
al
dev
elo
pm
ent
Pav
ed R
oad
Determinants
Per
cen
t ch
ange
in p
ove
rty
International Journal of Development and Economic Sustainability
Vol.5, No.3, pp.32-47, June 2017
__Published by European Centre for Research Training and Development UK (www.eajournals.org)
42
2053-2199 (Print), 2053-2202(Online)
As shown in Table 4.2 and Figure 4.1, results from VECM model show that there is
significant (p=0.000<0.05) relationship between road network and poverty levels.
Estimates indicate that for a one percent increase in road network, this leads to a
reduction of 7.2 percent in poverty level.
Furthermore, access to roads and markets is a critical determinant of poverty. Poverty
increases with distance from paved roads as it hinders accessibility to market centers and
therefore difficult to sale their agricultural products and lowers their income. Also
economic opportunities outside agriculture are limited since accessibility to trading or
marketing center or district administrative center is inaccessible. In support of this
conclusion, World Bank and NSO (2005) reported that limited access to financial services
and transport infrastructure reveals a dearth of opportunities for the poor; substantial
portions of the population remain isolated from the rest of the country both physically and
in terms of economic activity.
3. Hosts of factors explaining why poverty level continues to be rampant are: share of
agricultural as a percent of GDP (proxy to agricultural production) and export as percent
of GDP (proxy to exports). Analysis of the interface between poverty and export as a
percent of GDP indicate that a one percent increment in export reduces poverty level by
1.8 percent; in fact, the gap between import and export is exponential growing for the last
20 years. Malawi has become a consuming country rather than producing country. With
balance of payment gaps (MK498.92 billions) on average, the current export level, which
is only 12.5% percent of GDP, offsets the imports very minimally and has also minimal
(1.8%) impact on the poverty level over the years.
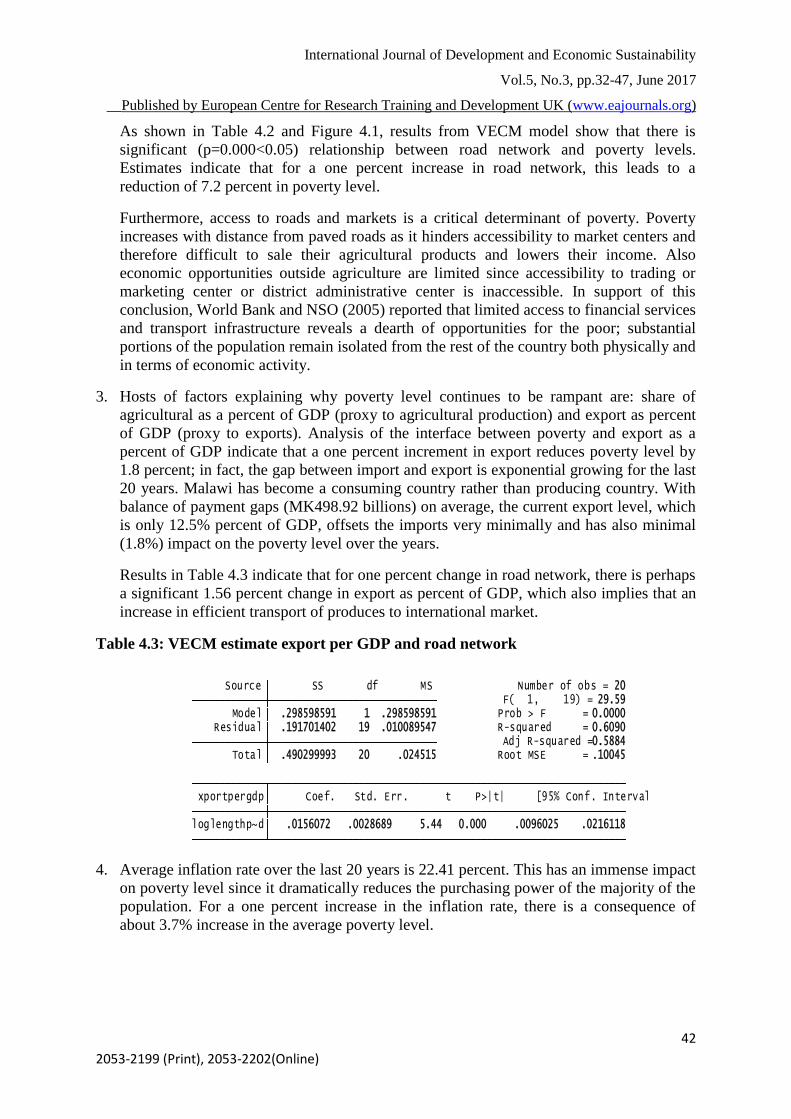
Results in Table 4.3 indicate that for one percent change in road network, there is perhaps
a significant 1.56 percent change in export as percent of GDP, which also implies that an
increase in efficient transport of produces to international market.
Table 4.3: VECM estimate export per GDP and road network
loglengthp~d .0156072 .0028689 5.44 0.000 .0096025 .0216118 xportpergdp Coef. Std. Err. t P>|t| [95% Conf. Interval]
Total .490299993 20 .024515 Root MSE = .10045 Adj R-squared = 0.5884 Residual .191701402 19 .010089547 R-squared = 0.6090 Model .298598591 1 .298598591 Prob > F = 0.0000 F( 1, 19) = 29.59 Source SS df MS Number of obs = 20
4. Average inflation rate over the last 20 years is 22.41 percent. This has an immense impact
on poverty level since it dramatically reduces the purchasing power of the majority of the
population. For a one percent increase in the inflation rate, there is a consequence of
about 3.7% increase in the average poverty level.

International Journal of Development and Economic Sustainability
Vol.5, No.3, pp.32-47, June 2017
__Published by European Centre for Research Training and Development UK (www.eajournals.org)
43
2053-2199 (Print), 2053-2202(Online)
Table 4.4: Estimates for road network and inflation rate
_cons -.1287842 3.967054 -0.03 0.974 -8.498536 8.240968 L1. -.5217325 .2109174 -2.47 0.024 -.9667292 -.0767358ehatinflroad inflationr~e Coef. Std. Err. t P>|t| [95% Conf. Interval]D.
Table 4.4 also displays that there is significant negative relationship between road
network and inflation rate. For one percent change in road network, there is a possibility
of reducing inflation by 52.1 percent; this is possible that if there are good road network,
the transport cost could be significantly reduced from the 45 percent transport costs of
commodities currently charged in Malawi; thus good road conditions and effectiveness of
road would have significantly impact on inflation, in general.
5. Over the last 20 years, on average the share of agricultural to GDP is 37 percent with a
minimum of 25 percent and a maximum of 60.1 percent. The annual agriculture growth
has fallen to 6.7 percent in 2011 from 12.3percent in 2007 (MEPD, 2013). These results
suggest a high fluctuation of agricultural production, especially tobacco, maize, rice, tea
and sugarcane. As seen previously, the declining of agricultural production would have
immediate and higher negative impact on export, and consequently the share of
agriculture to GDP dropped from 60.2 percent to an average of 37 percent in recent years.
This domino effect has dire consequences on government revenue and hence on
expenditures for development including road infrastructure.
Using Granger causality analysis (Granger 1969), Table 4.5 provides results for some
selected variables associated with road network.
Table 4.5: Granger Causality analysis of some selected variables
Hypothesis (H0)
Coefficient
Estimates
ρ-value < 0.10
Road network Poverty -0.07203 0.0013
Road network Export as percent GDP 0.0156 0.0000
Road network unemployment rate -0.3292 0.0054
Road network Inflation rate -0.5217 0.024
Road network Agri-Share as percent GDP 0.04865 0.033
Road network Gross Domestic Product 0.1900 0.0000
Gross Domestic Product Road network 0.0519 0.0000
6. Again there is significant and positive relationship between road infrastructure and
agricultural GDP (proxy to agricultural production); implying that for a unit change in
road infrastructure, agricultural production responds by 4.87 percent, on average (Tables
4.2 & 4.5). This high response corresponds to various activities surrounding agriculture
production such as employment, input and output marketing, demand and supply and so
forth.
International Journal of Development and Economic Sustainability
Vol.5, No.3, pp.32-47, June 2017
__Published by European Centre for Research Training and Development UK (www.eajournals.org)
44
2053-2199 (Print), 2053-2202(Online)
7. Average Gross Domestic Product growth rate is 4.7 percent annually with a minimum of -
4.9 percent and a maximum of 10.2 percent in the last 20 years. Poverty level appears to
significantly respond to GDP. This average level of GDP rate itself shows lack of
economic growth and development as it is far below the threshold of GDP level (8.4
percent) required to have meaningful investment in various sectors in Malawi.
8. Analysis of dynamic models shows that there is a possibility of 4.27 percent poverty
reduction if a one percent GDP increment takes place. In fact, the declining of agricultural
production for export and the growing gap in balance of payment (average –MK498.92
billions) would immensely influence GDP negatively and therefore poverty becomes
abysmal as GDP growth plummets. As reported in Table 4.5, road network has also
significant impact on GDP, for one percent change in the road network; there is a
possibility of changing GDP by 19% from its average level. Thus investing in road
infrastructure enhances GDP through various channels, transport cost, agricultural
production, export, etc.
9. From both dynamic modeling and descriptive statistics, it is obvious that there is
correlation between poverty and unemployment rate. Being aware of seasonality of
employment rate and the majority living in rural areas, unemployment is still high using
proxy variables of labor participation rate in farming and manufacturing industries. It is
estimated that on average the unemployment rate is about 22 percent in the last two
decades, and this has tremendous incremental impact on poverty. This high rate of
unemployment is not surprising when the share of women in wage employment in non-
agricultural sector was less than 30 percent by 2011 (NSO, 2012).
10. The dynamic analysis shows that for a one percent increase in unemployment rate there
leads to an increase of 3.25 percent on the average poverty level (Table 4.3). According to
World Bank (2010), those most vulnerable to poverty usually have no investment income
and receive little or no income in the form of interpersonal transfers from family to
friends. Thus, unemployment fuels poverty.
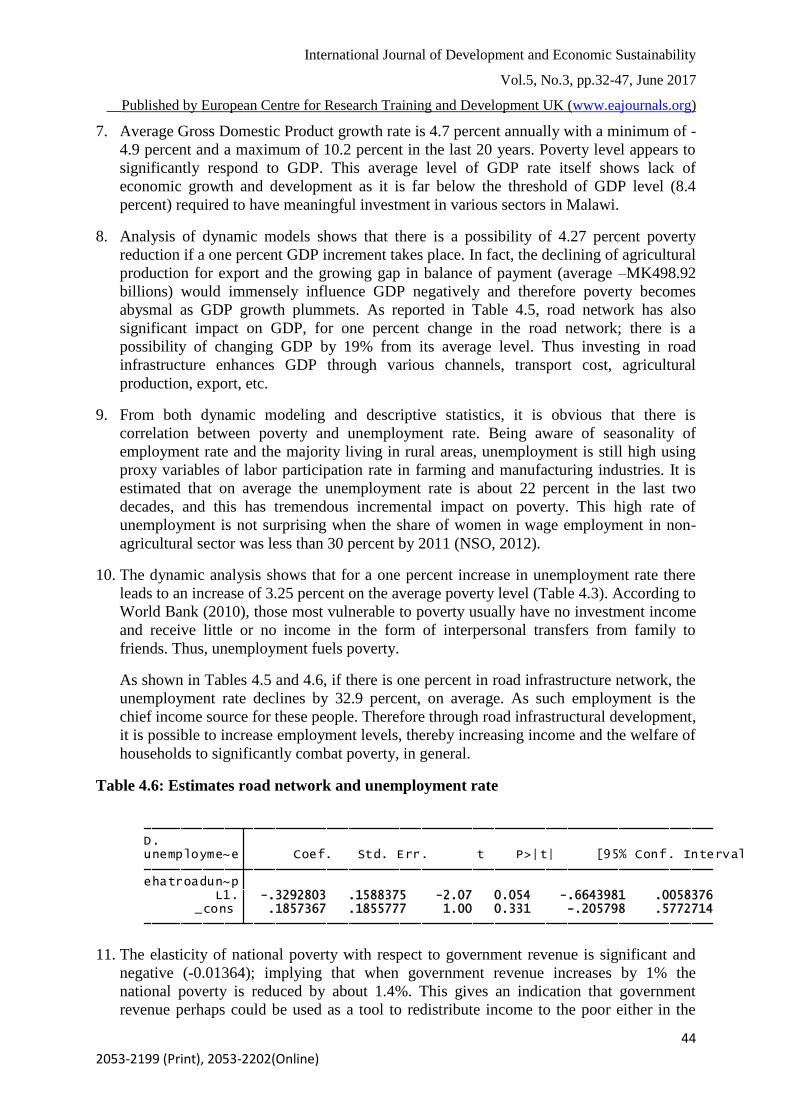
As shown in Tables 4.5 and 4.6, if there is one percent in road infrastructure network, the
unemployment rate declines by 32.9 percent, on average. As such employment is the
chief income source for these people. Therefore through road infrastructural development,
it is possible to increase employment levels, thereby increasing income and the welfare of
households to significantly combat poverty, in general.
Table 4.6: Estimates road network and unemployment rate
_cons .1857367 .1855777 1.00 0.331 -.205798 .5772714 L1. -.3292803 .1588375 -2.07 0.054 -.6643981 .0058376ehatroadun~p unemployme~e Coef. Std. Err. t P>|t| [95% Conf. Interval]D.
11. The elasticity of national poverty with respect to government revenue is significant and
negative (-0.01364); implying that when government revenue increases by 1% the
national poverty is reduced by about 1.4%. This gives an indication that government
revenue perhaps could be used as a tool to redistribute income to the poor either in the
International Journal of Development and Economic Sustainability
Vol.5, No.3, pp.32-47, June 2017
__Published by European Centre for Research Training and Development UK (www.eajournals.org)
45
2053-2199 (Print), 2053-2202(Online)
form of direct or indirect targeting such as infrastructure development, agricultural
programs and so forth.
In a nutshell, the findings confirm that in the long run economic growth is the key to
alleviation of extreme poverty since it creates the resources to raise incomes. Given the
importance of agriculture in contributing towards GDP in Malawi, the impact that this
sector has on poverty is evident. Other pro-poor variables such as development roads and
other investment on infrastructure are vital for economic growth and hence poverty
alleviation.
CONCLUSIONS
The identification and analysis of infrastructure investment and its effect on economic
growth, development and poverty reduction is of considerable interest from a policy
perspective. To address this issue, this research focused on Malawi as a developing country,
and assessed the impact of road infrastructure on poverty level, investigated the link between
poverty and road infrastructure, as well as other variables related to MGDs in Malawi.
Rigorous time series data analysis was done using dynamic models, VAR and VECM, on
several selected variables on data from 1994 to 2013. The findings from both descriptive and
model analyses have confirmed the theoretical link between road infrastructure and poverty
reduction in Malawi. As expected, the dynamic analysis has also validated that other
variables such as literacy rate, export, government expenditure, government revenue,
unemployment rate, inflation and gross domestic product do have immense impact on
poverty.
These research findings provide important insights into the determinants and positive effect
of public infrastructure policies such that they can help to allocate scarce resources in the
fight against abysmal poverty. These macro analyses provide insights in creation of better
infrastructure development in rural areas as equivalent to the whole country. Noting that road
sector is very important for the land-locked Malawi, not only creates access to economic
activities to the majority of the population, but also cuts the high cost of transport in reducing
inflation and increase of purchasing power the entire population.
Acknowledgments
The study was funded by German Development Cooperation (GIZ) on behalf of Malawi
Government under PFEM project. The preparations of the final report and finally this
extraction of this article would not have been possible without the support and valuable
contributions of several individuals, panel of experts and organizations.
The author would like to thank significantly the nucleus team from GIZ, Mrs Sook-Jung
Dofel (PFEM Team Leader), Dr. Alfred Nyasulu (Deputy Advisor) and Mr. Daniel Schmidt
(Junior Advisor) for their significant role, relentless support and advices in the course of
proposal development, analysis as well as, various administrative supports at all stages of the
exercise. In the Ministry of Economic Planning and Development (MEPD), I am also are
thankful to Dr. Rodwell Mzonde (Deputy Director), Mr. Hamilton Kamwana, Mr Cliff
Chiunda and Mr. Dalitso Kalimba. This work could not have been possible without data from
Ministry of Economic Planning and Development (MEPD) and National Road Authority. I
International Journal of Development and Economic Sustainability
Vol.5, No.3, pp.32-47, June 2017
__Published by European Centre for Research Training and Development UK (www.eajournals.org)
46
2053-2199 (Print), 2053-2202(Online)
feel highly indebted to MEPD for their utmost support in acquiring data and relevant critical
documents on roads, economics and infrastructure development in Malawi. If any error,
whatsoever, pops it should be directed to me, and the usual disclaims apply.
REFERENCES
Adikins, L., and Cater Hill, R. (2011). Principles of Econometrics. John Wiley & Sons, Inc.
New York.
African Development Bank. (2013). ‘Group Malawi Country Strategy Paper 2013-2017’.
Amisano, G., and C. Giannini (1997). Topics in Structural VAR Econometrics, 2nd edition.
Berlin: Springer.
Ali, I., and Pernia, E.M. (2003). Infrastructure and Poverty Reduction. What is the
Connection?, ERD Policy Brief, Asian Development Bank.
Arellano, M. and Bover, O. (1995). Another Look at the Instrumental Variable
Estimation of. Error-Components Models, Journal of Econometrics, 68, 29-51.
Datt, G., and Ravallion, M. (2002). Has India’s Post-Reform Economic Growth Left the
Poor Behind. Journal of Economic Perspectives, 16(3): 89-108, 2002.
Dufour, J. M. & Renault, E. (1998). Short run and long run causality in time series: Theory.
Econometrica, 66(5), 1099–1125.
Fan, S., N. Rao, and X. Zhang (2004), “Public Expenditure, Growth, and Poverty Reduction
in Rural Uganda”, International Food Policy Research Institute, DSGD Discussion
Paper No. 4.
Gachassin, M., Najman, B., and Raballand, G. (2010). Roads Impact on Poverty Reduction:
A Cameroon Case Study, World Bank Poicy Working Paper Series, No. 5209.
Ghura, D., Leite, C., and Tsangarides, C, G., 2002. Is Growth Enough?
Macroeconomic Policy and Poverty Reduction IMF Working Paper No. 02/118.
Gramlich, E. M. (1994). Infrastructure investment: A review essay. Journal of Economic
Literature, 32(3), 1176–1196.
Granger, C. W. J. (1969). Investigating causal relations by econometric models and cross-
spectral methods. Econometrica, 37(3), 424–438.
Lütkepohl, H. (2005). New Introduction to Multiple Time Series Analysis Berlin: Springer.
Ministry of Economic Planning and Development. Annual Economic Reports (Various 2007-
2013). Government of Malawi, Lilongwe.
Munnell, A. H. (1992). Policy Watch: Infrastructure Investment and Economic Growth.The
Journal of Economic Perspectives, 6(4), 189-198
Mustajab, M. (2009). Infrastructure Investment in Indonesia: Process and Impact.
Unpublished PhD thesis. Groningen, Netherlands.
National Roads Authority. (2011). Roads Authority Annual Report. Lilongwe, Malawi.
National Statistical Office (2005). Malawi Demographic and Health Survey 2004. Zomba,
Malawi
National Statistical Office (2011). Malawi Demographic and Health Survey 2010. Zomba,
Malawi.
National Statistical Office (2012). Welfare Monitoring Survey 2011. Zomba, Malawi.
Ogun, T.P. (2010). Infrastructure and Poverty Reduction Implications for Urban
Development in Nigeria. Working Paper No. 2010/43.
Oraboune, S. (2008). Infrastructure (Rural Road) Development and Poverty Alleviation I Lao
PDR. National Economic Research Institute, Lao.
International Journal of Development and Economic Sustainability
Vol.5, No.3, pp.32-47, June 2017
__Published by European Centre for Research Training and Development UK (www.eajournals.org)
47
2053-2199 (Print), 2053-2202(Online)
Perron, P. (1990). Testing for a unit root in a time series with a changing mean. Journal of
Business & Economic Statistics, 8(2), 153–162.
Ramirez, M. D. (2004). Is public infrastructure spending productive in the Mexican case? A
vector error correction analysis. Journal of International Trade and Economic
Development, 13(2), 159–178.
Ravallion, M., and Datt, G., 1996. How Important to India’s Poor Is the sectoral
Composition of Economic Growth?, World Bank Economic Review, 10 (1): 1-25.
Romp, W. & De-Haan, J. (2005). Public capital and economic growth: A critical
survey. EIB Papers, 10(1), 40–93.
Saikkonen, P. & Lütkepohl, H. (2002). Testing for a unit root in a time series with a level
shift at unknown time. Econometric Theory, 18, 313–348.
Sarte, P. G. (1997). ‘On the Identification of Structural Vector Autoregressions’. Federal
Reserve Bank of Richmond Economic Quarterly, 83/3. Available at:
www.richmondfed.org/publications/research/economic_quarterly/1997/summer/pdf/sart
e.pdf
Seetanah, B. (2012). ‘Transport Investment and poverty reduction: the African experience
using dynamic panel data estimates’. International Journal of Innovations in Business
;IJIB Vol. 1. No 1. July 2012.
Seeanah, Ramessur and Rojid. (2009). Does infrastructure alleviate poverty in developing
countries? International Journal of Applied Econometrics and Quantitative Studies, V6-
2(2009).
Sims, C. A. (1980a). ‘Macroeconomics and Reality’. Econometrica, 48: 1-48.
Sims, C. A. (1980b). ‘Comparison of Interwar and Postwar Business Cycles: Monetarism
Reconsidered’. American Economic Review, 70 (2): 250-7.
Sturm, J. E., Kuper, G. H. & De-Haan, J. (1998). Modelling government investment and
economic growth on a macro level: a review. In S. Brakman, H. van Ees & S. K.
Kuipers (Eds.), Market Behaviour and Macroeconomic Modelling. London: Macmillan
Press Ltd.
Toda, H. Y. & Phillips, P. C. B. (1993). Vector autoregression and causality. Econometrica,
61, 1367–1393.
________(1994). Vector autoregression and causality: A theoretical overview and simulation
study. Econometric Review, 13, 259–285.
UN Habitat. (2011). ‘Infrastructure for Economic Development and Poverty Reduction in
Africa’. United Nations Human Settlements Programme, Nairobi.
Wooldridge, J. M. (2002), “Econometric Analysis of Cross Section and Panel Data”, The
MIT Press, Cambridge.
World Bank. (2006). Malawi Country Assistance Evaluation. Report No. 36862. Washington,
D. C.
World Bank. (2006). Malawi Country Assistance Evaluation. Report No. 36862. Independent
Evaluation Group. Washington, D. C.
World Bank. (2010) .‘Africa Infrastructure Country Diagnostic (AICD); Malawi’s
Infrastructure: A Continental Perspective’. Washington, D.C.
World Bank. (2013). Implementation completion and Result Report. Report No. ICR2467,
Infrastructure Services Project, Urban Development and Services Practice, Country
Department, Africa Region.