Embed Size (px)
Citation preview
www.afm-journal.de
FULL
PAPER
© 2013 WILEY-VCH Verlag GmbH & Co. KGaA, Weinheim396
www.MaterialsViews.com
wileyonlinelibrary.com
1 . Introduction
Graphene, the two-dimensional carbon material, has unique electronic, thermal and mechanical properties and holds great promise for a wide range of applications such as nano-electro-mechanical systems, [ 1–3 ] fl exible/stretchable electronics [ 4,5 ] and nanocomposites. [ 6–8 ] In particular, with its superior electronic transport properties and high fl exibility, graphene is considered one of the emerging materials for next-generation fl exible elec-tronics; a variety of graphene-based fl exible devices have been demonstrated recently. [ 9–11 ] The performance and reliability of these devices are often limited by the interfacial properties between graphene and substrate materials. In this study, we have measured the nonlinear mechanical response of mono-layer graphene on top of a commonly used plastic substrate,
polyethylene terephthalate (PET), using in-situ Raman spectroscopy and atomic force microscopy (AFM). Interfacial sliding under tension and buckling under compression are identifi ed as two lim-iting mechanisms for stress transfer and coherent integration across the interface. Based on a nonlinear shear-lag model, the interfacial shear strength, the critical strain for onset of interfacial sliding, and stress transfer effi ciency are deduced from the measurements.
Raman spectroscopy was used in this study to measure the strain in mono-layer graphene on a PET substrate. It has been well established that Raman spectroscopy can be used to measure stress transfer in a variety of composites reinforced with carbon fi bers and carbon nanotubes. [ 12,13 ] Recent studies have shown that Raman peaks of monolayer graphene shift with deformation, ena-
bling quantitative measurement of strain in graphene. [ 14,15 ] Several studies have used graphene on fl exible or stretchable substrates, which typically assumed perfect bonding and no sliding at the interface. [ 16,17 ] Observation of interfacial sliding was reported for a graphene monolayer sandwiched between PMMA and SU-8 epoxy resin under tension, [ 18 ] while indi-cation of graphene buckling on PMMA was reported under compression. [ 19 ] In the present work, both interfacial sliding and buckling were observed for the same monolayer gra-phene on a PET substrate subjected to a uniaxial tensile loading and unloading cycle.
2 . Results and Discussion
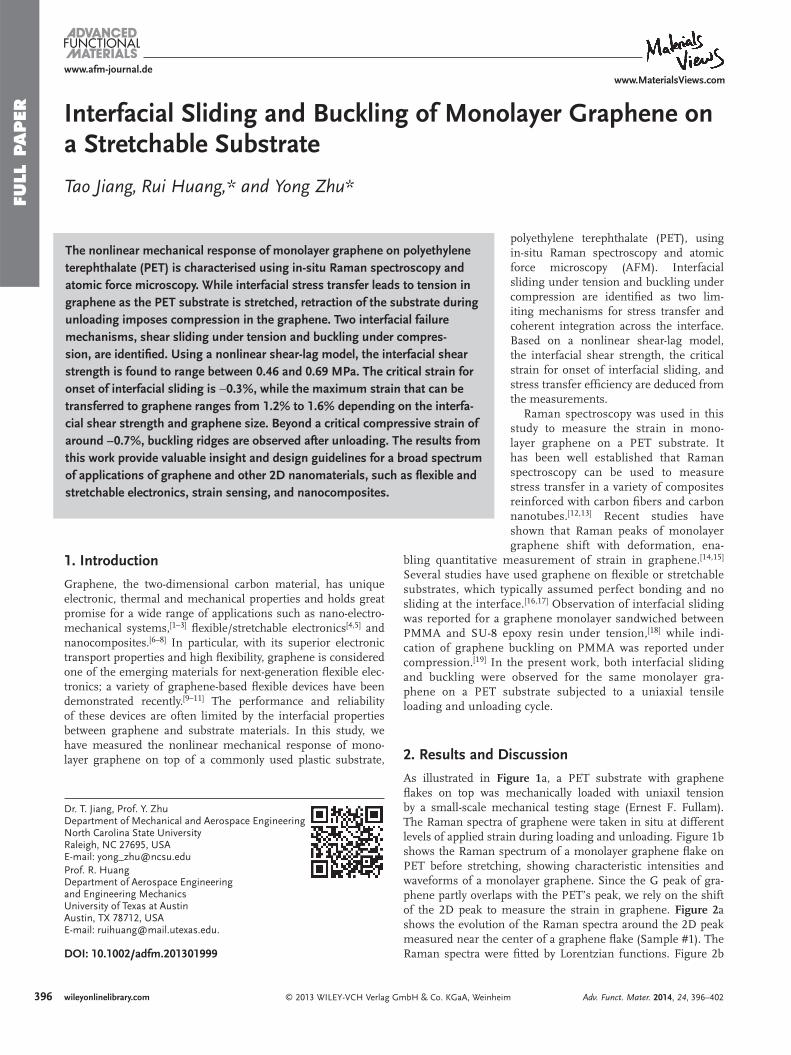
As illustrated in Figure 1 a, a PET substrate with graphene fl akes on top was mechanically loaded with uniaxil tension by a small-scale mechanical testing stage (Ernest F. Fullam). The Raman spectra of graphene were taken in situ at different levels of applied strain during loading and unloading. Figure 1 b shows the Raman spectrum of a monolayer graphene fl ake on PET before stretching, showing characteristic intensities and waveforms of a monolayer graphene. Since the G peak of gra-phene partly overlaps with the PET’s peak, we rely on the shift of the 2D peak to measure the strain in graphene. Figure 2 a shows the evolution of the Raman spectra around the 2D peak measured near the center of a graphene fl ake (Sample #1). The Raman spectra were fi tted by Lorentzian functions. Figure 2 b
Interfacial Sliding and Buckling of Monolayer Graphene on a Stretchable Substrate
Tao Jiang , Rui Huang ,* and Yong Zhu *
The nonlinear mechanical response of monolayer graphene on polyethylene terephthalate (PET) is characterised using in-situ Raman spectroscopy and atomic force microscopy. While interfacial stress transfer leads to tension in graphene as the PET substrate is stretched, retraction of the substrate during unloading imposes compression in the graphene. Two interfacial failure mechanisms, shear sliding under tension and buckling under compres-sion, are identifi ed. Using a nonlinear shear-lag model, the interfacial shear strength is found to range between 0.46 and 0.69 MPa. The critical strain for onset of interfacial sliding is ∼ 0.3%, while the maximum strain that can be transferred to graphene ranges from 1.2% to 1.6% depending on the interfa-cial shear strength and graphene size. Beyond a critical compressive strain of around −0.7%, buckling ridges are observed after unloading. The results from this work provide valuable insight and design guidelines for a broad spectrum of applications of graphene and other 2D nanomaterials, such as fl exible and stretchable electronics, strain sensing, and nanocomposites.
Dr. T. Jiang, Prof. Y. Zhu Department of Mechanical and Aerospace Engineering North Carolina State University Raleigh , NC 27695 , USA E-mail: [email protected] Prof. R. Huang Department of Aerospace Engineering and Engineering Mechanics University of Texas at Austin Austin , TX 78712 , USA E-mail: [email protected] .
DOI: 10.1002/adfm.201301999
Adv. Funct. Mater. 2014, 24, 396–402
FULL P
APER
397
www.afm-journal.dewww.MaterialsViews.com
wileyonlinelibrary.com© 2013 WILEY-VCH Verlag GmbH & Co. KGaA, Weinheim
where gm is the applied strain to the PET substrate, L is the length of graphene in the x direction with x = 0 at the center, and $ =
√km
E2D is the shear-lag parameter depending on the eff-
fective stiffness of the substrate ( k m ) and the in-plane stiffness (or 2D Young’s modulus) of monolayer graphene (E2D ). The corresponding shear stress, J , at the graphene-substrate inter-face is given by
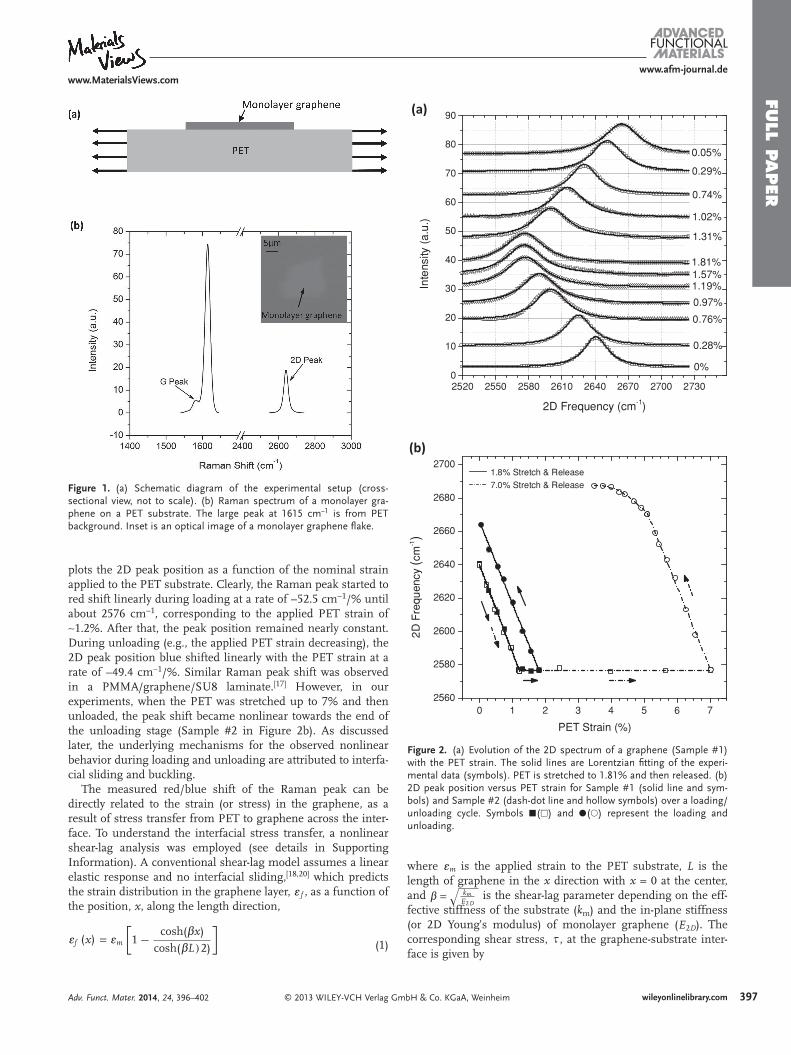
plots the 2D peak position as a function of the nominal strain applied to the PET substrate. Clearly, the Raman peak started to red shift linearly during loading at a rate of −52.5 cm −1 /% until about 2576 cm −1 , corresponding to the applied PET strain of ∼ 1.2%. After that, the peak position remained nearly constant. During unloading (e.g., the applied PET strain decreasing), the 2D peak position blue shifted linearly with the PET strain at a rate of −49.4 cm −1 /%. Similar Raman peak shift was observed in a PMMA/graphene/SU8 laminate. [ 17 ] However, in our experiments, when the PET was stretched up to 7% and then unloaded, the peak shift became nonlinear towards the end of the unloading stage (Sample #2 in Figure 2 b). As discussed later, the underlying mechanisms for the observed nonlinear behavior during loading and unloading are attributed to interfa-cial sliding and buckling.
The measured red/blue shift of the Raman peak can be directly related to the strain (or stress) in the graphene, as a result of stress transfer from PET to graphene across the inter-face. To understand the interfacial stress transfer, a nonlinear shear-lag analysis was employed (see details in Supporting Information). A conventional shear-lag model assumes a linear elastic response and no interfacial sliding, [ 18,20 ] which predicts the strain distribution in the graphene layer, g f , as a function of the position, x , along the length direction,
gf (x) = gm
[1 − cosh($x)
cosh($L)2)
]
(1)
Figure 1. (a) Schematic diagram of the experimental setup (cross-sectional view, not to scale). (b) Raman spectrum of a monolayer gra-phene on a PET substrate. The large peak at 1615 cm −1 is from PET background. Inset is an optical image of a monolayer graphene fl ake.
Figure 2. (a) Evolution of the 2D spectrum of a graphene (Sample #1) with the PET strain. The solid lines are Lorentzian fi tting of the experi-mental data (symbols). PET is stretched to 1.81% and then released. (b) 2D peak position versus PET strain for Sample #1 (solid line and sym-bols) and Sample #2 (dash-dot line and hollow symbols) over a loading/unloading cycle. Symbols �(�) and �(�) represent the loading and unloading.
2520 2550 2580 2610 2640 2670 2700 27300
10
20
30
40
50
60
70
80
90
Inte
nsity
(a.
u.)
2D Frequency (cm-1)
0.05%
0.29%
0.74%
1.02%
1.31%
1.81%1.57%1.19%
0.97%
0.76%
0.28%
0%
(a)
0 1 2 3 4 5 6 72560
2580
2600
2620
2640
2660
2680
2700
2D F
requ
ency
(cm
-1)
PET Strain (%)
1.8% Stretch & Release7.0% Stretch & Release
(b)
Adv. Funct. Mater. 2014, 24, 396–402
FULL
PAPER
398
www.afm-journal.dewww.MaterialsViews.com
wileyonlinelibrary.com © 2013 WILEY-VCH Verlag GmbH & Co. KGaA, Weinheim
the strain distribution in graphene becomes almost linear near the edges, an evidence of interfacial sliding with a constant shear stress at the interface. By Equation (S1) (i.e., dF
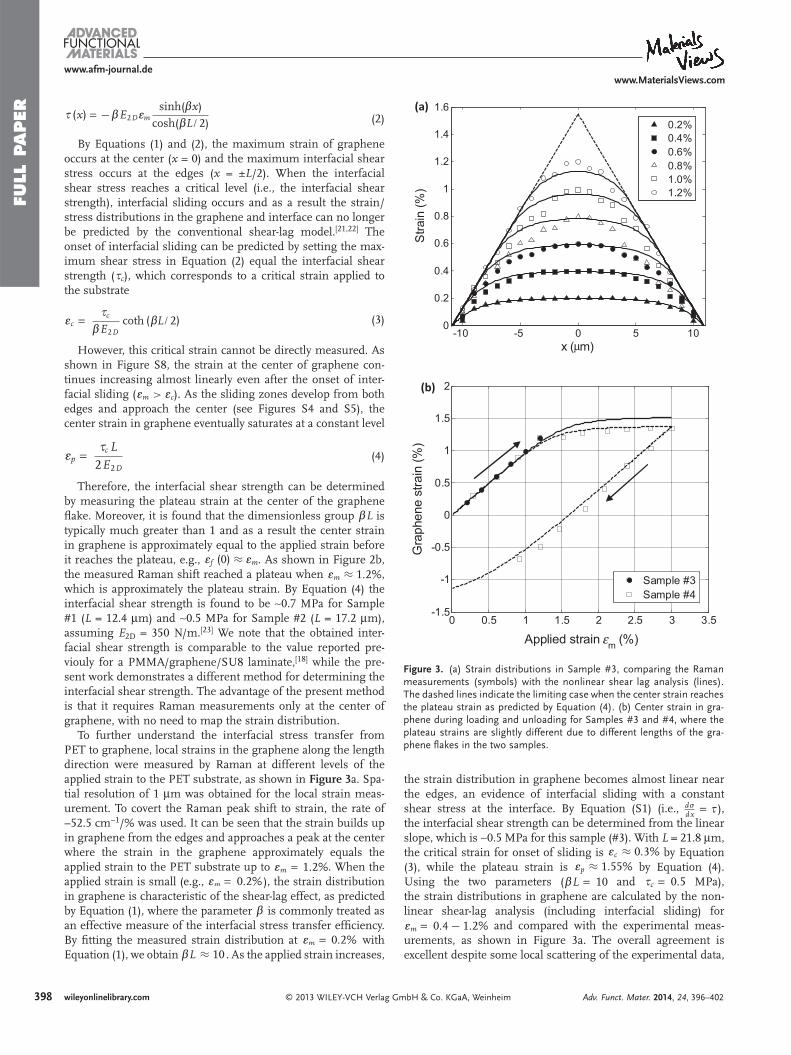
dx = J ), the interfacial shear strength can be determined from the linear slope, which is ∼ 0.5 MPa for this sample (#3). With L = 21.8 μ m, the critical strain for onset of sliding is gc ≈ 0.3% by Equation ( 3 ), while the plateau strain is gp ≈ 1.55% by Equation ( 4 ). Using the two parameters ($L = 10 and Jc = 0.5 MPa), the strain distributions in graphene are calculated by the non-linear shear-lag analysis (including interfacial sliding) for gm = 0.4 − 1.2% and compared with the experimental meas-urements, as shown in Figure 3 a. The overall agreement is excellent despite some local scattering of the experimental data,
J (x) = −$E2Dgmsinh($x)
cosh($L / 2) (2)
By Equations ( 1 ) and ( 2 ), the maximum strain of graphene occurs at the center ( x = 0) and the maximum interfacial shear stress occurs at the edges ( x = ± L /2). When the interfacial shear stress reaches a critical level (i.e., the interfacial shear strength), interfacial sliding occurs and as a result the strain/stress distributions in the graphene and interface can no longer be predicted by the conventional shear-lag model. [ 21,22 ] The onset of interfacial sliding can be predicted by setting the max-imum shear stress in Equation ( 2 ) equal the interfacial shear strength (Jc ), which corresponds to a critical strain applied to the substrate
gc =Jc
$E2Dcoth ($L / 2)
(3)
However, this critical strain cannot be directly measured. As shown in Figure S8, the strain at the center of graphene con-tinues increasing almost linearly even after the onset of inter-facial sliding (gm > gc ). As the sliding zones develop from both edges and approach the center (see Figures S4 and S5), the center strain in graphene eventually saturates at a constant level
gp =Jc L
2E2D (4)
Therefore, the interfacial shear strength can be determined by measuring the plateau strain at the center of the graphene fl ake. Moreover, it is found that the dimensionless group $L is typically much greater than 1 and as a result the center strain in graphene is approximately equal to the applied strain before it reaches the plateau, e.g., gf (0) ≈ gm . As shown in Figure 2 b, the measured Raman shift reached a plateau when gm ≈ 1.2% , which is approximately the plateau strain. By Equation ( 4 ) the interfacial shear strength is found to be ∼ 0.7 MPa for Sample #1 ( L = 12.4 μ m) and ∼ 0.5 MPa for Sample #2 ( L = 17.2 μ m), assuming E 2D = 350 N/m. [ 23 ] We note that the obtained inter-facial shear strength is comparable to the value reported pre-viouly for a PMMA/graphene/SU8 laminate, [ 18 ] while the pre-sent work demonstrates a different method for determining the interfacial shear strength. The advantage of the present method is that it requires Raman measurements only at the center of graphene, with no need to map the strain distribution.
To further understand the interfacial stress transfer from PET to graphene, local strains in the graphene along the length direction were measured by Raman at different levels of the applied strain to the PET substrate, as shown in Figure 3 a. Spa-tial resolution of 1 μ m was obtained for the local strain meas-urement. To covert the Raman peak shift to strain, the rate of −52.5 cm −1 /% was used. It can be seen that the strain builds up in graphene from the edges and approaches a peak at the center where the strain in the graphene approximately equals the applied strain to the PET substrate up to gm = 1.2% . When the applied strain is small (e.g., gm = 0.2% ), the strain distribution in graphene is characteristic of the shear-lag effect, as predicted by Equation ( 1 ), where the parameter $ is commonly treated as an effective measure of the interfacial stress transfer effi ciency. By fi tting the measured strain distribution at gm = 0.2% with Equation ( 1 ), we obtain $L ≈ 10 . As the applied strain increases,
Figure 3. (a) Strain distributions in Sample #3, comparing the Raman measurements (symbols) with the nonlinear shear lag analysis (lines). The dashed lines indicate the limiting case when the center strain reaches the plateau strain as predicted by Equation ( 4 ). (b) Center strain in gra-phene during loading and unloading for Samples #3 and #4, where the plateau strains are slightly different due to different lengths of the gra-phene fl akes in the two samples.
(a)
-10 -5 0 5 100
0.2
0.4
0.6
0.8
1
1.2
1.4
1.6
x (µm)
Stra
in (%
)
0.2%0.4%0.6%0.8%1.0%1.2%
(b)
0 0.5 1 1.5 2 2.5 3 3.5-1.5
-1
-0.5
0
0.5
1
1.5
2
Applied strain ε m (%)
Gra
phen
e st
rain
(%)
Sample #3Sample #4
Adv. Funct. Mater. 2014, 24, 396–402
FULL P
APER
399
www.afm-journal.dewww.MaterialsViews.com
wileyonlinelibrary.com© 2013 WILEY-VCH Verlag GmbH & Co. KGaA, Weinheim
to a large strain (e.g., gm up to 7%), the Raman shift during unloading became nonlinear beyond a critical point, which cor-responds to ∼ 0.7% compressive strain in the graphene. Sim-ilar Raman shift was observed in graphene under bending, [ 19 ] which was considered as an indication of graphene fl ake buck-ling. By the nonlinear shear-lag model, reverse sliding during unloading is predicted, which leads to a nonlinear behavior as shown in Figure 3 b. However, other mechanisms may also contribute to the nonlinear behavior observed in experiments. In particular, the compressive strain in the graphene may lead to wrinkling or buckle delamination, which would further relax the compressive strain in the nonlinear regime.
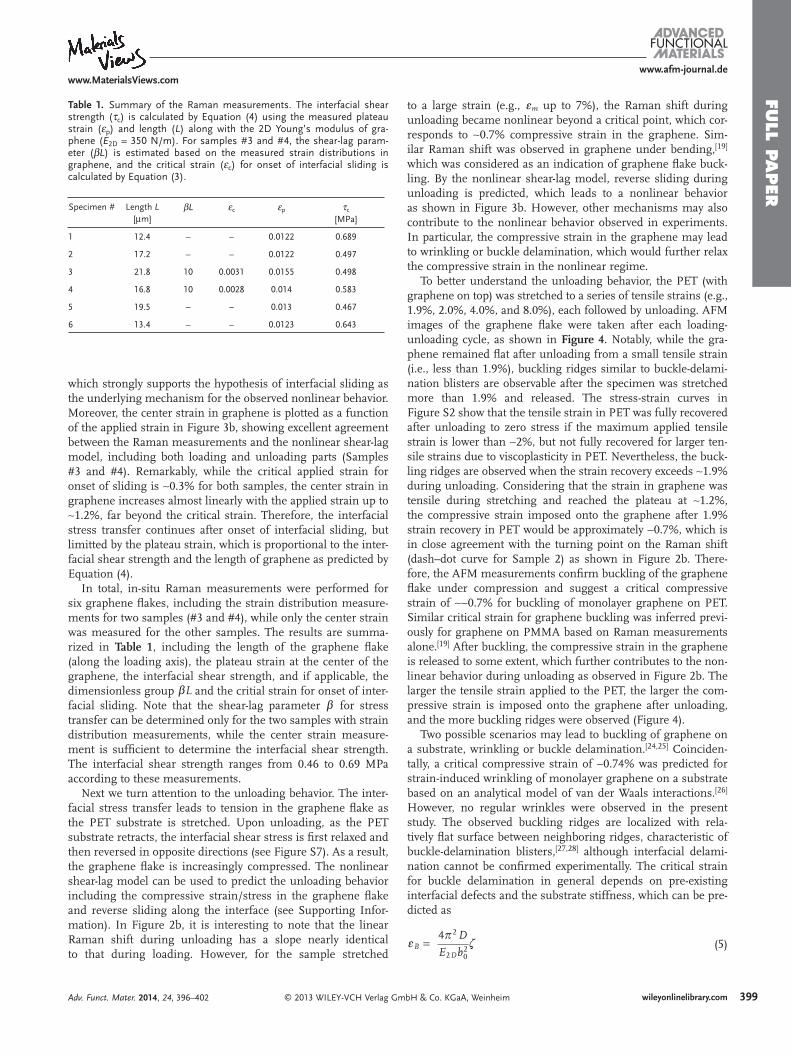
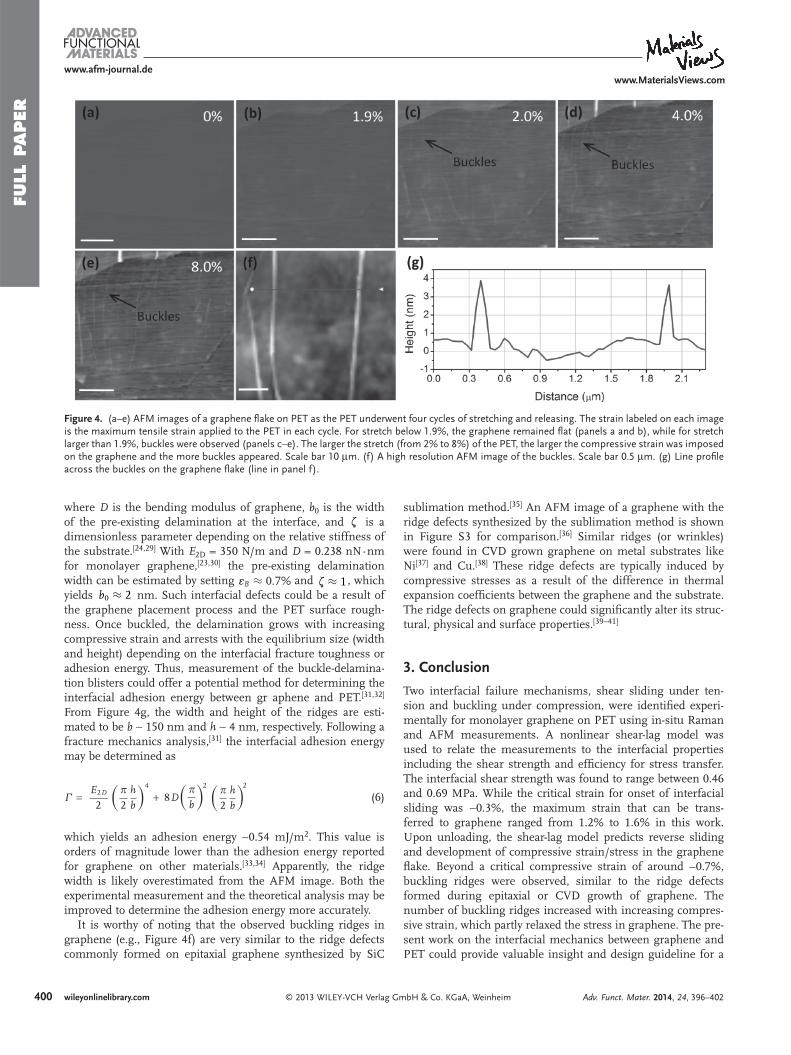
To better understand the unloading behavior, the PET (with graphene on top) was stretched to a series of tensile strains (e.g., 1.9%, 2.0%, 4.0%, and 8.0%), each followed by unloading. AFM images of the graphene fl ake were taken after each loading-unloading cycle, as shown in Figure 4 . Notably, while the gra-phene remained fl at after unloading from a small tensile strain (i.e., less than 1.9%), buckling ridges similar to buckle-delami-nation blisters are observable after the specimen was stretched more than 1.9% and released. The stress-strain curves in Figure S2 show that the tensile strain in PET was fully recovered after unloading to zero stress if the maximum applied tensile strain is lower than ∼ 2%, but not fully recovered for larger ten-sile strains due to viscoplasticity in PET. Nevertheless, the buck-ling ridges are observed when the strain recovery exceeds ∼ 1.9% during unloading. Considering that the strain in graphene was tensile during stretching and reached the plateau at ∼ 1.2%, the compressive strain imposed onto the graphene after 1.9% strain recovery in PET would be approximately −0.7%, which is in close agreement with the turning point on the Raman shift (dash–dot curve for Sample 2) as shown in Figure 2 b. There-fore, the AFM measurements confi rm buckling of the graphene fl ake under compression and suggest a critical compressive strain of ∼ −0.7% for buckling of monolayer graphene on PET. Similar critical strain for graphene buckling was inferred previ-ously for graphene on PMMA based on Raman measurements alone. [ 19 ] After buckling, the compressive strain in the graphene is released to some extent, which further contributes to the non-linear behavior during unloading as observed in Figure 2 b. The larger the tensile strain applied to the PET, the larger the com-pressive strain is imposed onto the graphene after unloading, and the more buckling ridges were observed (Figure 4 ).
Two possible scenarios may lead to buckling of graphene on a substrate, wrinkling or buckle delamination. [ 24,25 ] Coinciden-tally, a critical compressive strain of −0.74% was predicted for strain-induced wrinkling of monolayer graphene on a substrate based on an analytical model of van der Waals interactions. [ 26 ] However, no regular wrinkles were observed in the present study. The observed buckling ridges are localized with rela-tively fl at surface between neighboring ridges, characteristic of buckle-delamination blisters, [ 27,28 ] although interfacial delami-nation cannot be confi rmed experimentally. The critical strain for buckle delamination in general depends on pre-existing interfacial defects and the substrate stiffness, which can be pre-dicted as
gB =4B 2 D
E2Db20
.
(5)
which strongly supports the hypothesis of interfacial sliding as the underlying mechanism for the observed nonlinear behavior. Moreover, the center strain in graphene is plotted as a function of the applied strain in Figure 3 b, showing excellent agreement between the Raman measurements and the nonlinear shear-lag model, including both loading and unloading parts (Samples #3 and #4). Remarkably, while the critical applied strain for onset of sliding is ∼ 0.3% for both samples, the center strain in graphene increases almost linearly with the applied strain up to ∼ 1.2%, far beyond the critical strain. Therefore, the interfacial stress transfer continues after onset of interfacial sliding, but limitted by the plateau strain, which is proportional to the inter-facial shear strength and the length of graphene as predicted by Equation ( 4 ).
In total, in-situ Raman measurements were performed for six graphene fl akes, including the strain distribution measure-ments for two samples (#3 and #4), while only the center strain was measured for the other samples. The results are summa-rized in Table 1 , including the length of the graphene fl ake (along the loading axis), the plateau strain at the center of the graphene, the interfacial shear strength, and if applicable, the dimensionless group $L and the critial strain for onset of inter-facial sliding. Note that the shear-lag parameter $ for stress transfer can be determined only for the two samples with strain distribution measurements, while the center strain measure-ment is suffi cient to determine the interfacial shear strength. The interfacial shear strength ranges from 0.46 to 0.69 MPa according to these measurements.
Next we turn attention to the unloading behavior. The inter-facial stress transfer leads to tension in the graphene fl ake as the PET substrate is stretched. Upon unloading, as the PET substrate retracts, the interfacial shear stress is fi rst relaxed and then reversed in opposite directions (see Figure S7). As a result, the graphene fl ake is increasingly compressed. The nonlinear shear-lag model can be used to predict the unloading behavior including the compressive strain/stress in the graphene fl ake and reverse sliding along the interface (see Supporting Infor-mation). In Figure 2 b, it is interesting to note that the linear Raman shift during unloading has a slope nearly identical to that during loading. However, for the sample stretched
Table 1. Summary of the Raman measurements. The interfacial shear strength ( τ c ) is calculated by Equation ( 4 ) using the measured plateau strain ( ε p ) and length ( L ) along with the 2D Young’s modulus of gra-phene ( E 2D = 350 N/m). For samples #3 and #4, the shear-lag param-eter ( β L ) is estimated based on the measured strain distributions in graphene, and the critical strain ( ε c ) for onset of interfacial sliding is calculated by Equation ( 3 ).
Specimen # Length L [ μ m]
β L ε c ε p τ c [MPa]
1 12.4 – – 0.0122 0.689
2 17.2 – – 0.0122 0.497
3 21.8 10 0.0031 0.0155 0.498
4 16.8 10 0.0028 0.014 0.583
5 19.5 – – 0.013 0.467
6 13.4 – – 0.0123 0.643
Adv. Funct. Mater. 2014, 24, 396–402
FULL
PAPER
400
www.afm-journal.dewww.MaterialsViews.com
wileyonlinelibrary.com © 2013 WILEY-VCH Verlag GmbH & Co. KGaA, Weinheim
where D is the bending modulus of graphene, b 0 is the width of the pre-existing delamination at the interface, and . is a dimensionless parameter depending on the relative stiffness of the substrate. [ 24,29 ] With E 2D = 350 N/m and D = 0.238 nN·nm for monolayer graphene, [ 23,30 ] the pre-existing delamination width can be estimated by setting gB ≈ 0.7% and . ≈ 1 , which yields b0 ≈ 2 nm. Such interfacial defects could be a result of the graphene placement process and the PET surface rough-ness. Once buckled, the delamination grows with increasing compressive strain and arrests with the equilibrium size (width and height) depending on the interfacial fracture toughness or adhesion energy. Thus, measurement of the buckle-delamina-tion blisters could offer a potential method for determining the interfacial adhesion energy between gr aphene and PET. [ 31,32 ] From Figure 4 g, the width and height of the ridges are esti-mated to be b ∼ 150 nm and h ∼ 4 nm, respectively. Following a fracture mechanics analysis, [ 31 ] the interfacial adhesion energy may be determined as
� =E2D
2
(B2
h
b
)4
+ 8D2 2(
B2
h
b
)(Bb
)
(6)
which yields an adhesion energy ∼ 0.54 mJ/m 2 . This value is orders of magnitude lower than the adhesion energy reported for graphene on other materials. [ 33,34 ] Apparently, the ridge width is likely overestimated from the AFM image. Both the experimental measurement and the theoretical analysis may be improved to determine the adhesion energy more accurately.
It is worthy of noting that the observed buckling ridges in graphene (e.g., Figure 4 f) are very similar to the ridge defects commonly formed on epitaxial graphene synthesized by SiC
sublimation method. [ 35 ] An AFM image of a graphene with the ridge defects synthesized by the sublimation method is shown in Figure S3 for comparison. [ 36 ] Similar ridges (or wrinkles) were found in CVD grown graphene on metal substrates like Ni [ 37 ] and Cu. [ 38 ] These ridge defects are typically induced by compressive stresses as a result of the difference in thermal expansion coeffi cients between the graphene and the substrate. The ridge defects on graphene could signifi cantly alter its struc-tural, physical and surface properties. [ 39–41 ]
3 . Conclusion
Two interfacial failure mechanisms, shear sliding under ten-sion and buckling under compression, were identifi ed experi-mentally for monolayer graphene on PET using in-situ Raman and AFM measurements. A nonlinear shear-lag model was used to relate the measurements to the interfacial properties including the shear strength and effi ciency for stress transfer. The interfacial shear strength was found to range between 0.46 and 0.69 MPa. While the critical strain for onset of interfacial sliding was ∼ 0.3%, the maximum strain that can be trans-ferred to graphene ranged from 1.2% to 1.6% in this work. Upon unloading, the shear-lag model predicts reverse sliding and development of compressive strain/stress in the graphene fl ake. Beyond a critical compressive strain of around −0.7%, buckling ridges were observed, similar to the ridge defects formed during epitaxial or CVD growth of graphene. The number of buckling ridges increased with increasing compres-sive strain, which partly relaxed the stress in graphene. The pre-sent work on the interfacial mechanics between graphene and PET could provide valuable insight and design guideline for a
Figure 4. (a–e) AFM images of a graphene fl ake on PET as the PET underwent four cycles of stretching and releasing. The strain labeled on each image is the maximum tensile strain applied to the PET in each cycle. For stretch below 1.9%, the graphene remained fl at (panels a and b), while for stretch larger than 1.9%, buckles were observed (panels c–e). The larger the stretch (from 2% to 8%) of the PET, the larger the compressive strain was imposed on the graphene and the more buckles appeared. Scale bar 10 μ m. (f) A high resolution AFM image of the buckles. Scale bar 0.5 μ m. (g) Line profi le across the buckles on the graphene fl ake (line in panel f).
Adv. Funct. Mater. 2014, 24, 396–402
FULL P
APER
401
www.afm-journal.dewww.MaterialsViews.com
wileyonlinelibrary.com© 2013 WILEY-VCH Verlag GmbH & Co. KGaA, Weinheim
Acknowledgements This work was supported by the National Science Foundation (CMMI-1129817) and the NSF ASSIST ERC (EEC-1160483). RH gratefully acknowledges fi nancial support by the National Science Foundation through Grant No. CMMI-1130261.
Received: June 11, 2013 Published online: August 1, 2013
[1] J. S. Bunch , A. M. van der Zande , S. S. Verbridge , I. W. Frank , D. M. Tanenbaum , J. M. Parpia , H. G. Craighead , P. L. McEuen , Science 2007 , 315 , 490 .
[2] K. Eom , H. S. Park , D. S. Yoon , T. Kwon , Phys. Rep. 2011 , 503 , 115 . [3] C. Chen , S. Rosenblatt , K. I. Bolotin , W. Kalb , P. Kim , I. Kymissis ,
H. L. Stormer , T. F. Heinz , J. Hone , Nat. Nanotechnol. 2009 , 4 , 861 . [4] G. Eda , G. Fanchini , M. Chhowalla , Nat. Nanotechnol. 2008 , 3 , 270 . [5] K. S. Kim , Y. Zhao , H. Jang , S. Y. Lee , J. M. Kim , K. S. Kim , J.-H. Ahn ,
P. Kim , J.-Y. Choi , B. H. Hong , Nature 2009 , 457 , 706 . [6] T. Ramanathan , A. A. Abdala , S. Stankovich , D. A. Dikin ,
M. Herrera-Alonso , R. D. Piner , D. H. Adamson , H. C. Schniepp , X. Chen , R. S. Ruoff , S. T. Nguyen , I. A. Aksay , R. K. Prud’Homme , L. C. Brinson , Nat. Nanotechnol. 2008 , 3 , 327 .
[7] M. A. Rafi ee , J. Rafi ee , Z. Wang , H. Song , Z.-Z. Yu , N. Koratkar , ACS Nano 2009 , 3 , 3884 .
[8] S. Stankovich , D. A. Dikin , G. H. B. Dommett , K. M. Kohlhaas , E. J. Zimney , E. A. Stach , R. D. Piner , S. T. Nguyen , R. S. Ruoff , Nature 2006 , 442 , 282 .
[9] R.-H. Kim , M.-H. Bae , D. G. Kim , H. Cheng , B. H. Kim , D.-H. Kim , M. Li , J. Wu , F. Du , H.-S. Kim , S. Kim , D. Estrada , S. W. Hong , Y. Huang , E. Pop , J. A. Rogers , Nano Lett. 2011 , 11 , 3881 .
[10] Y. Wang , R. Yang , Z. Shi , L. Zhang , D. Shi , E. Wang , G. Zhang , ACS Nano 2011 , 5 , 3645 .
[11] X. Huang , Z. Zeng , Z. Fan , J. Liu , H. Zhang , Adv. Mater. 2012 , 24 , 5979 .
[12] Y. Huang , R. J. Young , Compos. Sci. Technol. 1994 , 52 , 505 . [13] S. Cui , I. A. Kinloch , R. J. Young , L. Noé , M. Monthioux , Adv. Mater.
2009 , 21 , 3591 . [14] J. Zabel , R. R. Nair , A. Ott , T. Georgiou , A. K. Geim , K. S. Novoselov ,
C. Casiraghi , Nano Lett. 2012 , 12 , 617 . [15] F. Ding , H. Ji , Y. Chen , A. Herklotz , K. Dörr , Y. Mei , A. Rastelli ,
O. G. Schmidt , Nano Lett. 2010 , 10 , 3453 . [16] M. Huang , H. Yan , C. Chen , D. Song , T. F. Heinz , J. Hone , Proc.
Natl. Acad. Sci. USA 2009 , 106 , 7304 . [17] Z. H. Ni , T. Yu , Y. H. Lu , Y. Y. Wang , Y. P. Feng , Z. X. Shen , ACS
Nano 2008 , 2 , 2301 . [18] L. Gong , I. A. Kinloch , R. J. Young , I. Riaz , R. Jalil , K. S. Novoselov ,
Adv. Mater. 2010 , 22 , 2694 . [19] G. Tsoukleri , J. Parthenios , K. Papagelis , R. Jalil , A. C. Ferrari ,
A. K. Geim , K. S. Novoselov , C. Galiotis , Small 2009 , 5 , 2397 . [20] Y. Zhu , F. Xu , Adv. Mater. 2012 , 24 , 1073 . [21] M. A. Montes-Morán , R. J. Young , Carbon 2002 , 40 , 857 . [22] M. Piggott , Compos. Sci. Technol. 1991 , 42 , 57 . [23] C. Lee , X. Wei , J. W. Kysar , J. Hone , Science 2008 , 321 , 385 . [24] H. Mei , C. M. Landis , R. Huang , Mech. Mater. 2011 , 43 , 627 . [25] H. Mei , R. Huang , J. Y. Chung , C. M. Stafford , H.-H. Yu , Appl. Phys.
Lett. 2007 , 90 , 151902 . [26] Z. H. Aitken , R. Huang , J. Appl. Phys. 2010 , 107 , 123531 . [27] D. Vella , J. Bico , A. Boudaoud , B. Roman , P. M. Reis , Proc. Natl.
Acad. Sci. USA 2009 , 106 , 10901 . [28] G. Parry , J. Colin , C. Coupeau , F. Foucher , A. Cimetière , J. Grilhé ,
Acta Mater. 2005 , 53 , 441 . [29] H.-H. Yu , J. W. Hutchinson , Int. J. Fract. 2002 , 113 , 39 .
broad spectrum of applications of graphene such as fl exible and stretchable electronics, strain sensing, and nanocomposites. In addition, for the fi rst time this paper demonstrates a simple experimental method to investigate the graphene/substrate interface under both tension and compression, combining in-situ Raman and AFM measurements. The experimental method can be readily extended to study other two-dimensional nanomaterials (e.g., hexagonal boron nitride, molybdenum disulfi de, and silicene) on stretchable substrates.
4 . Experimental Section Sample Preparation : Monolayer graphene fl akes were prepared using
the mechanical exfoliation method and deposited directly on PET substrates. Prior to depositing graphene fl akes, the PET substrates were cleaned with acetone in a supersonic bath, rinsed with isopropanol and deionized water, followed by blown drying with nitrogen gas. Monolayer graphene was determined by its characteristic Raman spectrum and verifi ed by the thickness measurement using an AFM (XE-70, Park Systems).
Raman Characterization : The Raman spectra were measured using a Horiba LabRAM HR system (with a 633 nm laser as the excitation source). The laser power was kept below 0.2 mW to avoid laser-induced local heating of the sample. The incident light was polarized along the strain direction. The objective lens was 100× with a numerical aperture (NA) of 0.9. The focused laser spot was approximately 1 μ m in diameter. Figure 1 b shows the Raman spectrum and an optical image (inset) of a monolayer graphene fl ake on PET. For the purpose of comparison, Raman spectrum of a bilayer graphene is shown in Figure S1 (in Supporting Information). In these two fi gures, the 2D peaks of the Raman spectra exhibit the characteristic intensities and waveforms of a monolayer and bilayer graphene, respectively.
Nonlinear Shear-Lag Analysis with Interfacial Sliding : The critical strain for onset of interfacial sliding is predicted by Equation ( 3 ). When εm>εc , the interface consists of two sliding zones emerging from the edges and a no-sliding zone in between. Noting the symmetry of the problem, let the sliding zone size to be s at each end. In the sliding zones (L / 2 > |x | > L / 2 − s ), the interfacial shear stress and the strain in graphene are
τ = ± τcττ
(7)
ε fε =±τcττE 2D
(x(( ± L / 2)
(8)
In the no-sliding zone (|x | < L /2 − s ), we have
τ = −τcττ
sinh [β (L / 2 − s )]sinh(β(( x)x
(9)
ε fε = εmεε − τcττβE 2D
cosh (β(( xββ )
sinh β(L / 2 − s ) (10)
where the sliding zone size s can be obtained by solving the equation
coth β(L / 2 − s ) + βsββ = βE2D εmεετcττ
(11)
Details of this analysis are presented in Supporting Information.
Supporting Information Supporting Information is available from the Wiley Online Library or from the author.
Adv. Funct. Mater. 2014, 24, 396–402
FULL
PAPER
402
www.afm-journal.dewww.MaterialsViews.com
wileyonlinelibrary.com © 2013 WILEY-VCH Verlag GmbH & Co. KGaA, Weinheim
[36] G. Prakash , M. Capano , M. Bolen , D. Zemlyanou , R. Reifenberger , Carbon 2010 , 48 , 2383 .
[37] A. N. Obraztsov , E. A. Obraztsova , A. V. Tyurnina , A. A. Zolotukhin , Carbon 2007 , 45 , 2017 .
[38] X. Li , W. Cai , J. An , S. Kim , J. Nah , D. Yang , R. Piner , A. Velamakanni , I. Jung , E. Tutuc , S. K. Banerjee , L. Colombo , R. S. Ruoff , Science 2009 , 324 , 1312 .
[39] K. Xu , P. Cao , J. R. Heath , Nano Lett. 2009 , 9 , 4446 . [40] W. Zhu , T. Low , V. Perebeinos , A. A. Bol , Y. Zhu , H. Yan , J. Tersoff ,
P. Avouris , Nano Lett. 2012 , 12 , 3431 . [41] J. Zang , S. Ryu , N. Pugno , Q. Wang , Q. Tu , M. J. Buehler , X. Zhao ,
Nat. Mater. 2013 , 12 , 321 .
[30] K. Kudin , G. Scuseria , B. Yakobson , Phys. Rev. B 2001 , 64 , 235406 .
[31] S. Faulhaber , C. Mercer , M. Moon , J. W. Hutchinson , A. G. Evans , J. Mech. Phys. Solids 2006 , 54 , 1004 .
[32] Y. Aoyanagi , J. Hure , J. Bico , B. Roman , Soft Matter 2010 , 6 , 5720 .
[33] S. P. Koenig , N. G. Boddeti , M. L. Dunn , J. S. Bunch , Nat. Nano-technol. 2011 , 6 , 543 .
[34] T. Yoon , W. C. Shin , T. Y. Kim , J. H. Mun , T.-S. Kim , B. J. Cho , Nano Lett. 2012 , 12 , 1448 .
[35] N. Srivastava , G. He , R. M. Feenstra , P. J. Fisher , Phys. Rev. B 2010 , 82 , 235406 .
Adv. Funct. Mater. 2014, 24, 396–402


![Interfacial Sliding and Buckling of Monolayer Graphene on ...ruihuang/papers/adfm1.pdfbling quantitative measurement of strain in graphene. [14,15 ] Several studies have used graphene](https://img.pdfslide.net/doc/110x75/6002fcf66585cc23012e6fb2/interfacial-sliding-and-buckling-of-monolayer-graphene-on-ruihuangpapersadfm1pdf.jpg)