Embed Size (px)
Citation preview

interimAir New Zealand
Shareholder Review 2012
timesA period of tough
Air New Zealand Interim Shareholder Review | 2012
AIR NEW ZEALAND GROUP
1 Refer to the Financial Commentary on page 7 for details of Normalised Earnings.
TOURISM NEW ZEALAND COVER PHOTOGRAPHY:
Ferns – Brian High Swimming between the flags – Legend Photography
Auckland by night – Julian Apse
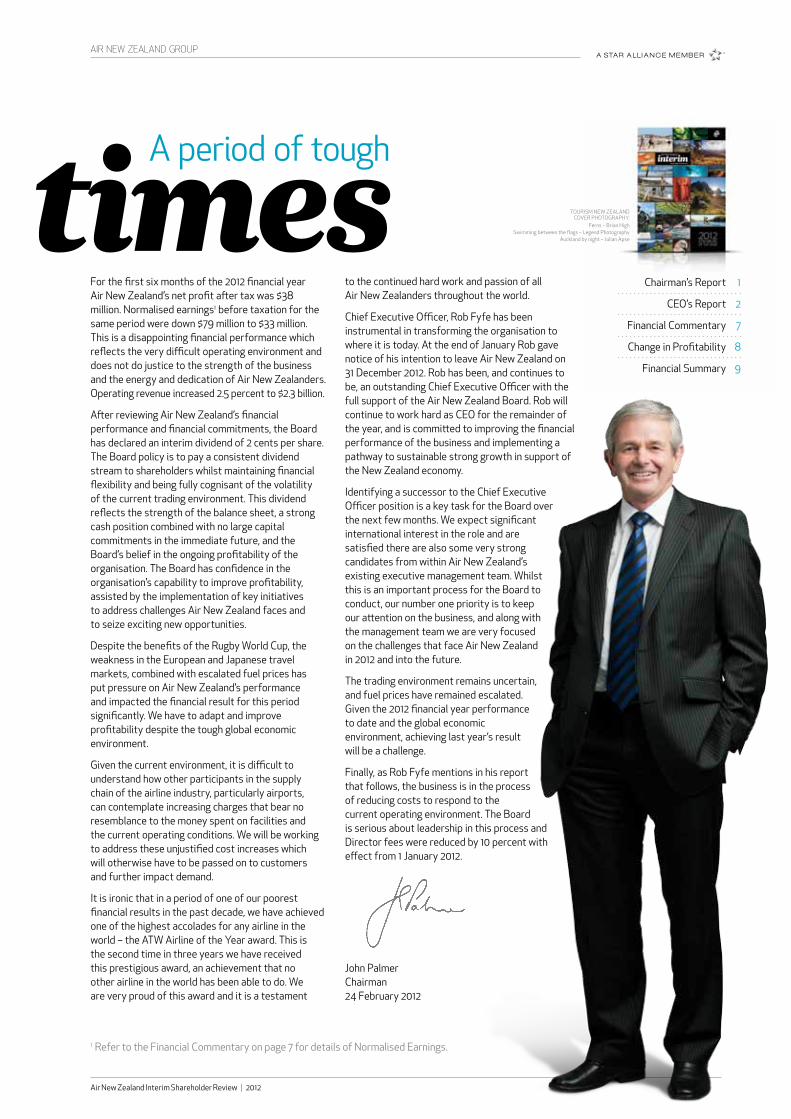
For the first six months of the 2012 financial year Air New Zealand’s net profit after tax was $38 million. Normalised earnings1 before taxation for the same period were down $79 million to $33 million. This is a disappointing financial performance which reflects the very difficult operating environment and does not do justice to the strength of the business and the energy and dedication of Air New Zealanders. Operating revenue increased 2.5 percent to $2.3 billion.
After reviewing Air New Zealand’s financial performance and financial commitments, the Board has declared an interim dividend of 2 cents per share. The Board policy is to pay a consistent dividend stream to shareholders whilst maintaining financial flexibility and being fully cognisant of the volatility of the current trading environment. This dividend reflects the strength of the balance sheet, a strong cash position combined with no large capital commitments in the immediate future, and the Board’s belief in the ongoing profitability of the organisation. The Board has confidence in the organisation’s capability to improve profitability, assisted by the implementation of key initiatives to address challenges Air New Zealand faces and to seize exciting new opportunities.
Despite the benefits of the Rugby World Cup, the weakness in the European and Japanese travel markets, combined with escalated fuel prices has put pressure on Air New Zealand’s performance and impacted the financial result for this period significantly. We have to adapt and improve profitability despite the tough global economic environment.
Given the current environment, it is difficult to understand how other participants in the supply chain of the airline industry, particularly airports, can contemplate increasing charges that bear no resemblance to the money spent on facilities and the current operating conditions. We will be working to address these unjustified cost increases which will otherwise have to be passed on to customers and further impact demand.
It is ironic that in a period of one of our poorest financial results in the past decade, we have achieved one of the highest accolades for any airline in the world – the ATW Airline of the Year award. This is the second time in three years we have received this prestigious award, an achievement that no other airline in the world has been able to do. We are very proud of this award and it is a testament
to the continued hard work and passion of all Air New Zealanders throughout the world.
Chief Executive Officer, Rob Fyfe has been instrumental in transforming the organisation to where it is today. At the end of January Rob gave notice of his intention to leave Air New Zealand on 31 December 2012. Rob has been, and continues to be, an outstanding Chief Executive Officer with the full support of the Air New Zealand Board. Rob will continue to work hard as CEO for the remainder of the year, and is committed to improving the financial performance of the business and implementing a pathway to sustainable strong growth in support of the New Zealand economy.
Identifying a successor to the Chief Executive Officer position is a key task for the Board over the next few months. We expect significant international interest in the role and are satisfied there are also some very strong candidates from within Air New Zealand’s existing executive management team. Whilst this is an important process for the Board to conduct, our number one priority is to keep our attention on the business, and along with the management team we are very focused on the challenges that face Air New Zealand in 2012 and into the future.
The trading environment remains uncertain, and fuel prices have remained escalated. Given the 2012 financial year performance to date and the global economic environment, achieving last year’s result will be a challenge.
Finally, as Rob Fyfe mentions in his report that follows, the business is in the process of reducing costs to respond to the current operating environment. The Board is serious about leadership in this process and Director fees were reduced by 10 percent with effect from 1 January 2012.
John PalmerChairman24 February 2012
Chairman’s Report 1
CEO’s Report 2
Financial Commentary 7
Change in Profitability 8
Financial Summary 9

This time last year the global airline industry was showing signs of recovery and Air New Zealand was well positioned to take advantage of the improving landscape. However since that time uncertainty has intensified in the global economy, fuel prices have continued to escalate and we have felt the significant effects of natural disasters.
In the six month period to 31 December 2011, the number of passengers carried across the network declined 0.6 percent to 6.75 million. Group capacity (ASKs) decreased 1 percent along with demand (RPKs) decreasing 2.6 percent. Load factor declined 1.4 percentage points to 82.8 percent. Yield increased by 4.4 percent to 13.5 cents per revenue passenger kilometre, partially recovering increased fuel costs through fare increases.
Although we achieved a solid performance on the Domestic Network and sustained profitability on the Tasman and Pacific Islands Network, the International Long Haul Network has been challenging.
We have worked hard to continue to improve our competitive positioning despite challenging times for the industry. In recent weeks we have seen the bankruptcy of established airlines in Europe, and airlines in the Asia Pacific region contracting their networks. Given the challenges facing the industry we expect more failures will follow as the year progresses. In response we must continue to adapt Air New Zealand to be a stronger, more efficient and more profitable business.
PeopleAir New Zealand has made a deliberate investment in its people. The result has been Air New Zealanders who have the capability and passion to make a real difference; who are constantly generating new innovations, and delivering award winning customer service with a ‘can do’ attitude. This ‘can do’ attitude is seen in all facets of our business. Like the crew member who goes the extra mile for someone on board, the engineer who comes up with a better process to improve efficiency at our maintenance facilities and the Airline Operations team dedicating themselves to find a way to safely fly around ash clouds. Most importantly, this attitude gives us the ability to adapt at speed, which is fundamental in an industry that is constantly changing.
Air New Zealand Interim Shareholder Review | 2012
2
AIR NEW ZEALAND GROUP
Building on asolid base
What’s working well...
Air New Zealand Interim Shareholder Review | 2012
AIR NEW ZEALAND GROUP
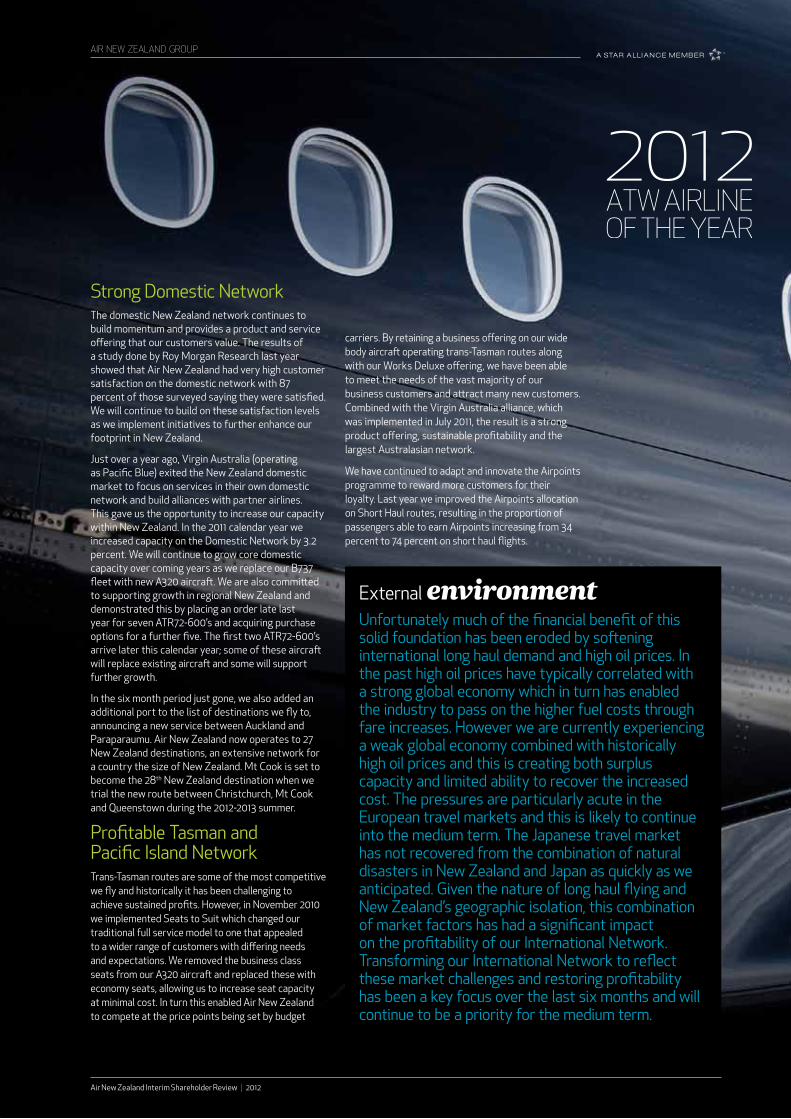
Strong Domestic NetworkThe domestic New Zealand network continues to build momentum and provides a product and service offering that our customers value. The results of a study done by Roy Morgan Research last year showed that Air New Zealand had very high customer satisfaction on the domestic network with 87 percent of those surveyed saying they were satisfied. We will continue to build on these satisfaction levels as we implement initiatives to further enhance our footprint in New Zealand.
Just over a year ago, Virgin Australia (operating as Pacific Blue) exited the New Zealand domestic market to focus on services in their own domestic network and build alliances with partner airlines. This gave us the opportunity to increase our capacity within New Zealand. In the 2011 calendar year we increased capacity on the Domestic Network by 3.2 percent. We will continue to grow core domestic capacity over coming years as we replace our B737 fleet with new A320 aircraft. We are also committed to supporting growth in regional New Zealand and demonstrated this by placing an order late last year for seven ATR72-600’s and acquiring purchase options for a further five. The first two ATR72-600’s arrive later this calendar year; some of these aircraft will replace existing aircraft and some will support further growth.
In the six month period just gone, we also added an additional port to the list of destinations we fly to, announcing a new service between Auckland and Paraparaumu. Air New Zealand now operates to 27 New Zealand destinations, an extensive network for a country the size of New Zealand. Mt Cook is set to become the 28th New Zealand destination when we trial the new route between Christchurch, Mt Cook and Queenstown during the 2012-2013 summer.
Profitable Tasman and Pacific Island NetworkTrans-Tasman routes are some of the most competitive we fly and historically it has been challenging to achieve sustained profits. However, in November 2010 we implemented Seats to Suit which changed our traditional full service model to one that appealed to a wider range of customers with differing needs and expectations. We removed the business class seats from our A320 aircraft and replaced these with economy seats, allowing us to increase seat capacity at minimal cost. In turn this enabled Air New Zealand to compete at the price points being set by budget
carriers. By retaining a business offering on our wide body aircraft operating trans-Tasman routes along with our Works Deluxe offering, we have been able to meet the needs of the vast majority of our business customers and attract many new customers. Combined with the Virgin Australia alliance, which was implemented in July 2011, the result is a strong product offering, sustainable profitability and the largest Australasian network.
We have continued to adapt and innovate the Airpoints programme to reward more customers for their loyalty. Last year we improved the Airpoints allocation on Short Haul routes, resulting in the proportion of passengers able to earn Airpoints increasing from 34 percent to 74 percent on short haul flights.
External environmentUnfortunately much of the financial benefit of this solid foundation has been eroded by softening international long haul demand and high oil prices. In the past high oil prices have typically correlated with a strong global economy which in turn has enabled the industry to pass on the higher fuel costs through fare increases. However we are currently experiencing a weak global economy combined with historically high oil prices and this is creating both surplus capacity and limited ability to recover the increased cost. The pressures are particularly acute in the European travel markets and this is likely to continue into the medium term. The Japanese travel market has not recovered from the combination of natural disasters in New Zealand and Japan as quickly as we anticipated. Given the nature of long haul flying and New Zealand’s geographic isolation, this combination of market factors has had a significant impact on the profitability of our International Network. Transforming our International Network to reflect these market challenges and restoring profitability has been a key focus over the last six months and will continue to be a priority for the medium term.
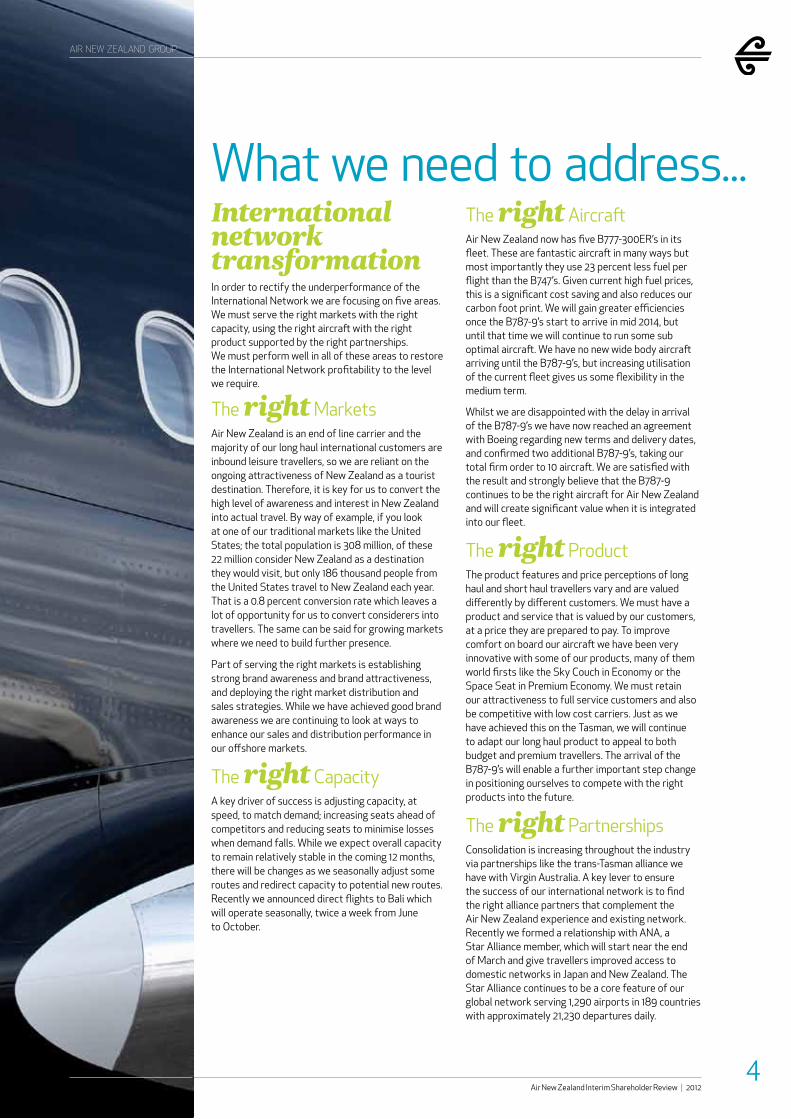
International network transformationIn order to rectify the underperformance of the International Network we are focusing on five areas. We must serve the right markets with the right capacity, using the right aircraft with the right product supported by the right partnerships. We must perform well in all of these areas to restore the International Network profitability to the level we require.
The right MarketsAir New Zealand is an end of line carrier and the majority of our long haul international customers are inbound leisure travellers, so we are reliant on the ongoing attractiveness of New Zealand as a tourist destination. Therefore, it is key for us to convert the high level of awareness and interest in New Zealand into actual travel. By way of example, if you look at one of our traditional markets like the United States; the total population is 308 million, of these 22 million consider New Zealand as a destination they would visit, but only 186 thousand people from the United States travel to New Zealand each year. That is a 0.8 percent conversion rate which leaves a lot of opportunity for us to convert considerers into travellers. The same can be said for growing markets where we need to build further presence.
Part of serving the right markets is establishing strong brand awareness and brand attractiveness, and deploying the right market distribution and sales strategies. While we have achieved good brand awareness we are continuing to look at ways to enhance our sales and distribution performance in our offshore markets.
The right CapacityA key driver of success is adjusting capacity, at speed, to match demand; increasing seats ahead of competitors and reducing seats to minimise losses when demand falls. While we expect overall capacity to remain relatively stable in the coming 12 months, there will be changes as we seasonally adjust some routes and redirect capacity to potential new routes. Recently we announced direct flights to Bali which will operate seasonally, twice a week from June to October.
The right AircraftAir New Zealand now has five B777-300ER’s in its fleet. These are fantastic aircraft in many ways but most importantly they use 23 percent less fuel per flight than the B747’s. Given current high fuel prices, this is a significant cost saving and also reduces our carbon foot print. We will gain greater efficiencies once the B787-9’s start to arrive in mid 2014, but until that time we will continue to run some sub optimal aircraft. We have no new wide body aircraft arriving until the B787-9’s, but increasing utilisation of the current fleet gives us some flexibility in the medium term.
Whilst we are disappointed with the delay in arrival of the B787-9’s we have now reached an agreement with Boeing regarding new terms and delivery dates, and confirmed two additional B787-9’s, taking our total firm order to 10 aircraft. We are satisfied with the result and strongly believe that the B787-9 continues to be the right aircraft for Air New Zealand and will create significant value when it is integrated into our fleet.
The right ProductThe product features and price perceptions of long haul and short haul travellers vary and are valued differently by different customers. We must have a product and service that is valued by our customers, at a price they are prepared to pay. To improve comfort on board our aircraft we have been very innovative with some of our products, many of them world firsts like the Sky Couch in Economy or the Space Seat in Premium Economy. We must retain our attractiveness to full service customers and also be competitive with low cost carriers. Just as we have achieved this on the Tasman, we will continue to adapt our long haul product to appeal to both budget and premium travellers. The arrival of the B787-9’s will enable a further important step change in positioning ourselves to compete with the right products into the future.
The right PartnershipsConsolidation is increasing throughout the industry via partnerships like the trans-Tasman alliance we have with Virgin Australia. A key lever to ensure the success of our international network is to find the right alliance partners that complement the Air New Zealand experience and existing network. Recently we formed a relationship with ANA, a Star Alliance member, which will start near the end of March and give travellers improved access to domestic networks in Japan and New Zealand. The Star Alliance continues to be a core feature of our global network serving 1,290 airports in 189 countries with approximately 21,230 departures daily.
Air New Zealand Interim Shareholder Review | 2012
What we need to address...
4
AIR NEW ZEALAND GROUP
Escalatingfuel costsThe price of jet fuel has doubled over the last three years. This is compounded by the fuel intensive nature of long haul flying and the inability to fully recover increased costs through fares in the current economic environment. Therefore, it is necessary to adapt the business to perform in a high fuel price environment. This means we must change the way we do some things to improve efficiency and productivity, and a review of all costs is well advanced. Through this process we have looked at every part of the business to see where we can eliminate unnecessary expenditure. Over the coming months we will be implementing outcomes from this review, starting with overhead costs. This is a necessary step as we refocus and intensify our commitment to continually transform the way we do business across all areas.
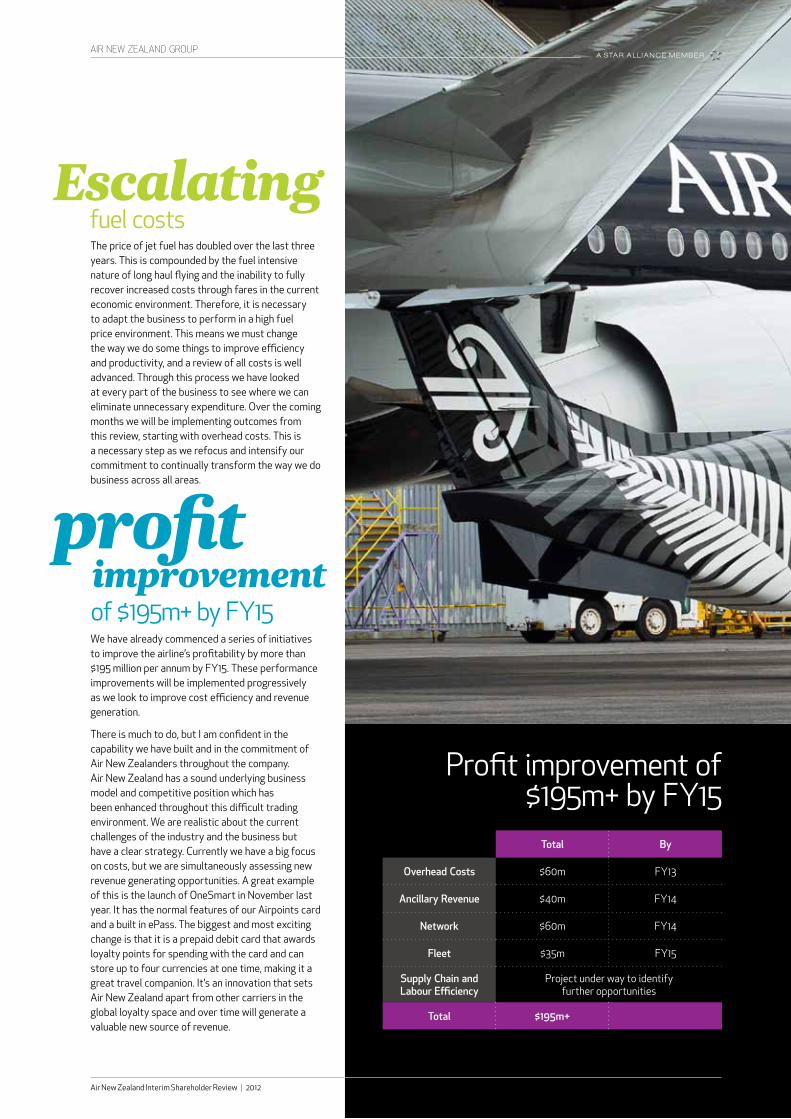
profitimprovementof $195m+ by FY15We have already commenced a series of initiatives to improve the airline’s profitability by more than $195 million per annum by FY15. These performance improvements will be implemented progressively as we look to improve cost efficiency and revenue generation.
There is much to do, but I am confident in the capability we have built and in the commitment of Air New Zealanders throughout the company. Air New Zealand has a sound underlying business model and competitive position which has been enhanced throughout this difficult trading environment. We are realistic about the current challenges of the industry and the business but have a clear strategy. Currently we have a big focus on costs, but we are simultaneously assessing new revenue generating opportunities. A great example of this is the launch of OneSmart in November last year. It has the normal features of our Airpoints card and a built in ePass. The biggest and most exciting change is that it is a prepaid debit card that awards loyalty points for spending with the card and can store up to four currencies at one time, making it a great travel companion. It’s an innovation that sets Air New Zealand apart from other carriers in the global loyalty space and over time will generate a valuable new source of revenue.
Air New Zealand Interim Shareholder Review | 2012
AIR NEW ZEALAND GROUP
Profit improvement of $195m+ by FY15
Total By
Overhead Costs $60m FY13
Ancillary Revenue $40m FY14
Network $60m FY14
Fleet $35m FY15
Supply Chain and Labour Efficiency
Project under way to identify further opportunities
Total $195m+
Air New Zealand Interim Shareholder Review | 2012
6
AIR NEW ZEALAND GROUP
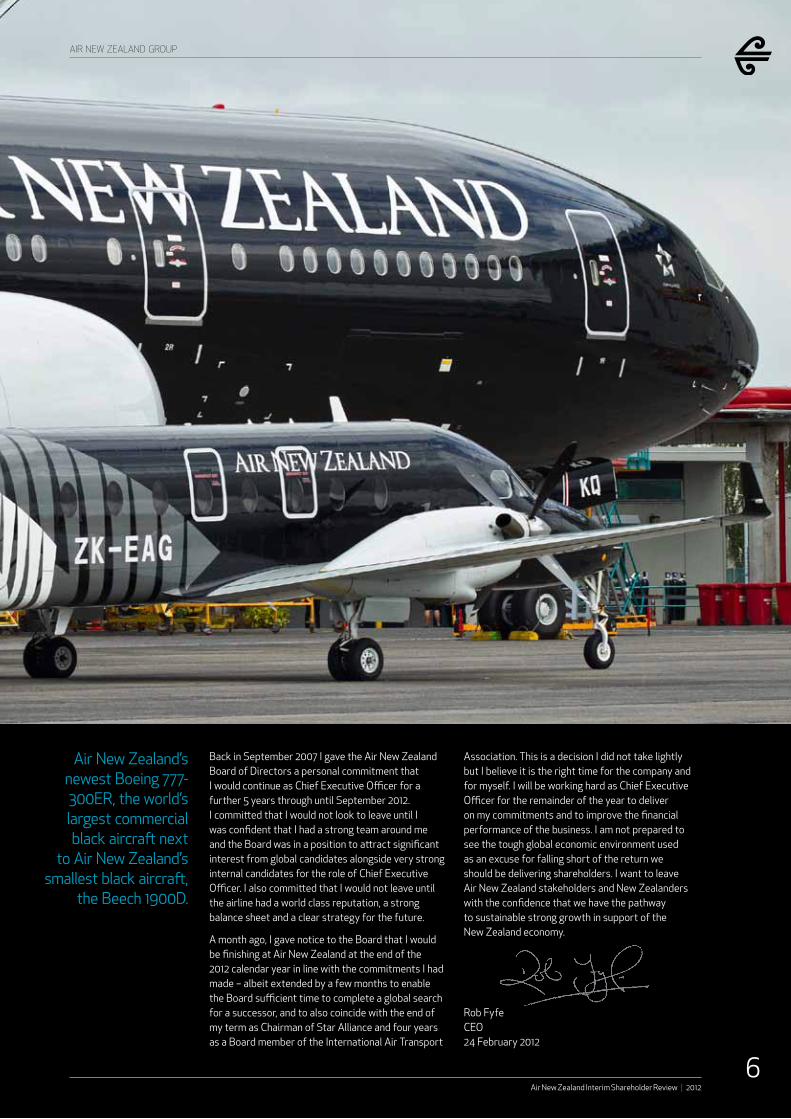
Air New Zealand’s newest Boeing 777-300ER, the world’s largest commercial black aircraft next
to Air New Zealand’s smallest black aircraft,
the Beech 1900D.
Back in September 2007 I gave the Air New Zealand Board of Directors a personal commitment that I would continue as Chief Executive Officer for a further 5 years through until September 2012. I committed that I would not look to leave until I was confident that I had a strong team around me and the Board was in a position to attract significant interest from global candidates alongside very strong internal candidates for the role of Chief Executive Officer. I also committed that I would not leave until the airline had a world class reputation, a strong balance sheet and a clear strategy for the future.
A month ago, I gave notice to the Board that I would be finishing at Air New Zealand at the end of the 2012 calendar year in line with the commitments I had made – albeit extended by a few months to enable the Board sufficient time to complete a global search for a successor, and to also coincide with the end of my term as Chairman of Star Alliance and four years as a Board member of the International Air Transport
Association. This is a decision I did not take lightly but I believe it is the right time for the company and for myself. I will be working hard as Chief Executive Officer for the remainder of the year to deliver on my commitments and to improve the financial performance of the business. I am not prepared to see the tough global economic environment used as an excuse for falling short of the return we should be delivering shareholders. I want to leave Air New Zealand stakeholders and New Zealanders with the confidence that we have the pathway to sustainable strong growth in support of the New Zealand economy.
Rob FyfeCEO24 February 2012
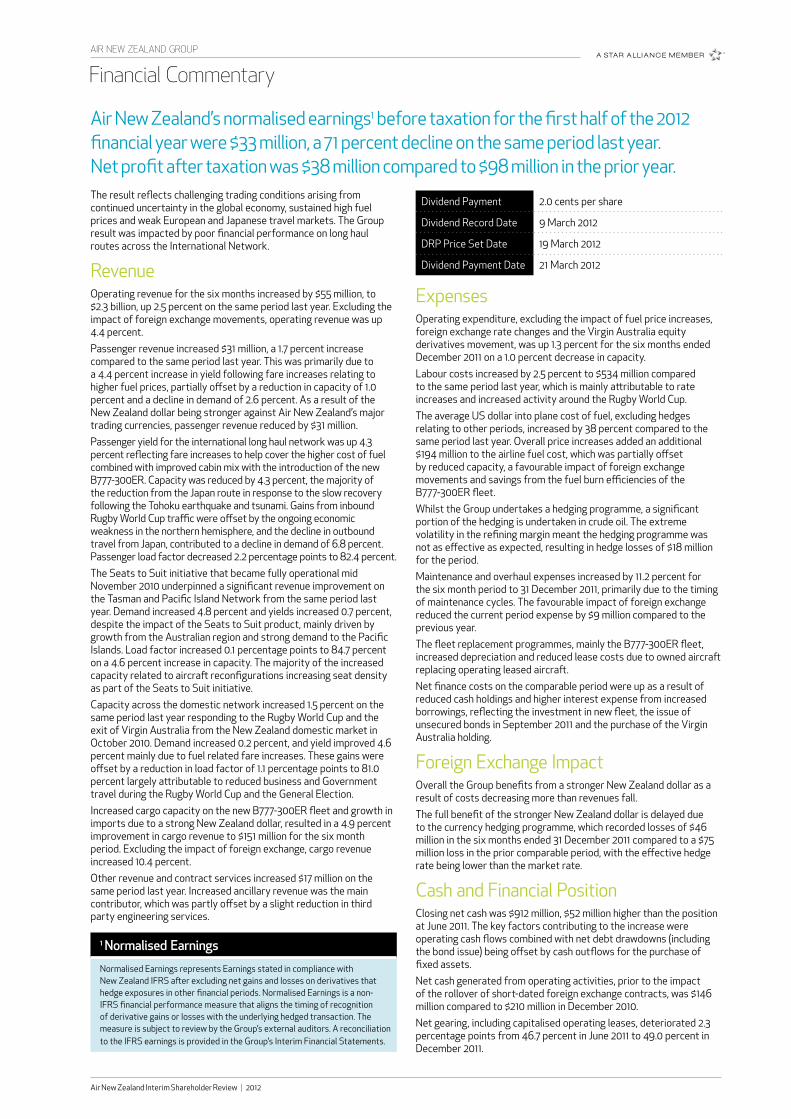
Air New Zealand’s normalised earnings1 before taxation for the first half of the 2012 financial year were $33 million, a 71 percent decline on the same period last year. Net profit after taxation was $38 million compared to $98 million in the prior year.
Air New Zealand Interim Shareholder Review | 2012
Financial CommentaryAIR NEW ZEALAND GROUP
The result reflects challenging trading conditions arising from continued uncertainty in the global economy, sustained high fuel prices and weak European and Japanese travel markets. The Group result was impacted by poor financial performance on long haul routes across the International Network.
Revenue Operating revenue for the six months increased by $55 million, to $2.3 billion, up 2.5 percent on the same period last year. Excluding the impact of foreign exchange movements, operating revenue was up 4.4 percent.Passenger revenue increased $31 million, a 1.7 percent increase compared to the same period last year. This was primarily due to a 4.4 percent increase in yield following fare increases relating to higher fuel prices, partially offset by a reduction in capacity of 1.0 percent and a decline in demand of 2.6 percent. As a result of the New Zealand dollar being stronger against Air New Zealand’s major trading currencies, passenger revenue reduced by $31 million. Passenger yield for the international long haul network was up 4.3 percent reflecting fare increases to help cover the higher cost of fuel combined with improved cabin mix with the introduction of the new B777-300ER. Capacity was reduced by 4.3 percent, the majority of the reduction from the Japan route in response to the slow recovery following the Tohoku earthquake and tsunami. Gains from inbound Rugby World Cup traffic were offset by the ongoing economic weakness in the northern hemisphere, and the decline in outbound travel from Japan, contributed to a decline in demand of 6.8 percent. Passenger load factor decreased 2.2 percentage points to 82.4 percent. The Seats to Suit initiative that became fully operational mid November 2010 underpinned a significant revenue improvement on the Tasman and Pacific Island Network from the same period last year. Demand increased 4.8 percent and yields increased 0.7 percent, despite the impact of the Seats to Suit product, mainly driven by growth from the Australian region and strong demand to the Pacific Islands. Load factor increased 0.1 percentage points to 84.7 percent on a 4.6 percent increase in capacity. The majority of the increased capacity related to aircraft reconfigurations increasing seat density as part of the Seats to Suit initiative.Capacity across the domestic network increased 1.5 percent on the same period last year responding to the Rugby World Cup and the exit of Virgin Australia from the New Zealand domestic market in October 2010. Demand increased 0.2 percent, and yield improved 4.6 percent mainly due to fuel related fare increases. These gains were offset by a reduction in load factor of 1.1 percentage points to 81.0 percent largely attributable to reduced business and Government travel during the Rugby World Cup and the General Election. Increased cargo capacity on the new B777-300ER fleet and growth in imports due to a strong New Zealand dollar, resulted in a 4.9 percent improvement in cargo revenue to $151 million for the six month period. Excluding the impact of foreign exchange, cargo revenue increased 10.4 percent. Other revenue and contract services increased $17 million on the same period last year. Increased ancillary revenue was the main contributor, which was partly offset by a slight reduction in third party engineering services.
Expenses Operating expenditure, excluding the impact of fuel price increases, foreign exchange rate changes and the Virgin Australia equity derivatives movement, was up 1.3 percent for the six months ended December 2011 on a 1.0 percent decrease in capacity. Labour costs increased by 2.5 percent to $534 million compared to the same period last year, which is mainly attributable to rate increases and increased activity around the Rugby World Cup.The average US dollar into plane cost of fuel, excluding hedges relating to other periods, increased by 38 percent compared to the same period last year. Overall price increases added an additional $194 million to the airline fuel cost, which was partially offset by reduced capacity, a favourable impact of foreign exchange movements and savings from the fuel burn efficiencies of the B777-300ER fleet. Whilst the Group undertakes a hedging programme, a significant portion of the hedging is undertaken in crude oil. The extreme volatility in the refining margin meant the hedging programme was not as effective as expected, resulting in hedge losses of $18 million for the period. Maintenance and overhaul expenses increased by 11.2 percent for the six month period to 31 December 2011, primarily due to the timing of maintenance cycles. The favourable impact of foreign exchange reduced the current period expense by $9 million compared to the previous year. The fleet replacement programmes, mainly the B777-300ER fleet, increased depreciation and reduced lease costs due to owned aircraft replacing operating leased aircraft. Net finance costs on the comparable period were up as a result of reduced cash holdings and higher interest expense from increased borrowings, reflecting the investment in new fleet, the issue of unsecured bonds in September 2011 and the purchase of the Virgin Australia holding.
Foreign Exchange ImpactOverall the Group benefits from a stronger New Zealand dollar as a result of costs decreasing more than revenues fall. The full benefit of the stronger New Zealand dollar is delayed due to the currency hedging programme, which recorded losses of $46 million in the six months ended 31 December 2011 compared to a $75 million loss in the prior comparable period, with the effective hedge rate being lower than the market rate.
Cash and Financial Position Closing net cash was $912 million, $52 million higher than the position at June 2011. The key factors contributing to the increase were operating cash flows combined with net debt drawdowns (including the bond issue) being offset by cash outflows for the purchase of fixed assets.Net cash generated from operating activities, prior to the impact of the rollover of short-dated foreign exchange contracts, was $146 million compared to $210 million in December 2010. Net gearing, including capitalised operating leases, deteriorated 2.3 percentage points from 46.7 percent in June 2011 to 49.0 percent in December 2011.
1 Normalised Earnings
Normalised Earnings represents Earnings stated in compliance with New Zealand IFRS after excluding net gains and losses on derivatives that hedge exposures in other financial periods. Normalised Earnings is a non-IFRS financial performance measure that aligns the timing of recognition of derivative gains or losses with the underlying hedged transaction. The measure is subject to review by the Group’s external auditors. A reconciliation to the IFRS earnings is provided in the Group’s Interim Financial Statements.
Dividend Payment 2.0 cents per share
Dividend Record Date 9 March 2012
DRP Price Set Date 19 March 2012
Dividend Payment Date 21 March 2012
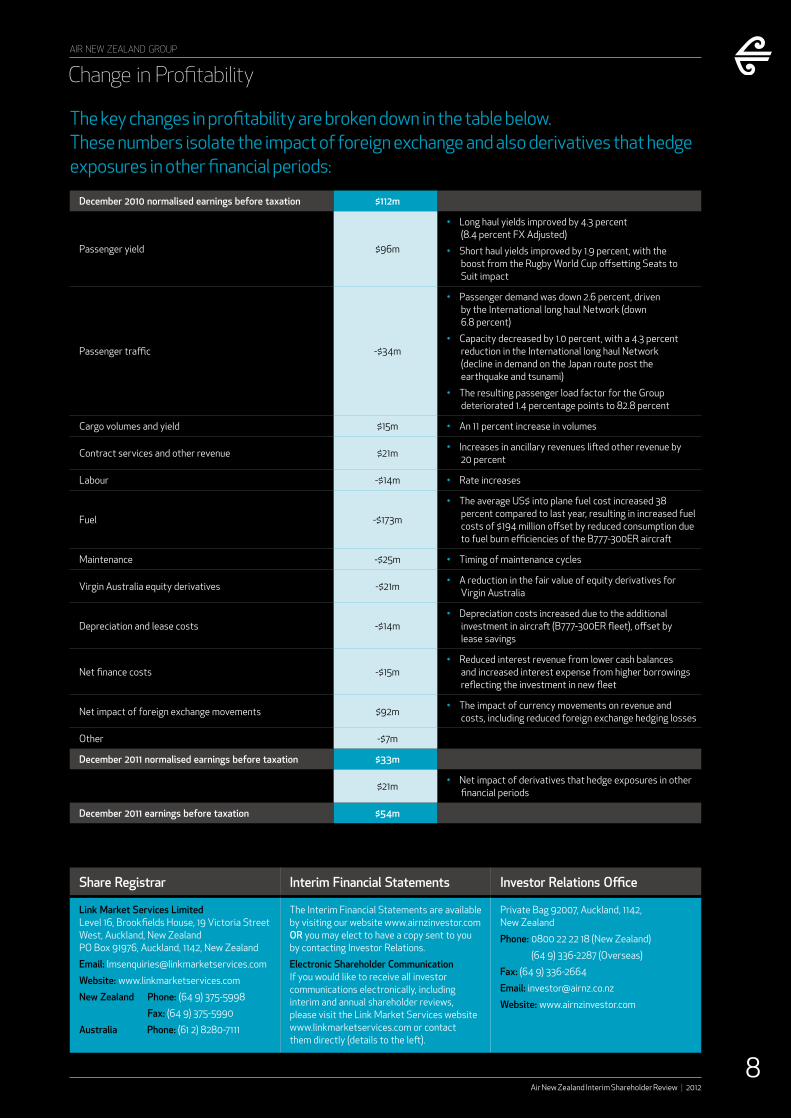
December 2010 normalised earnings before taxation $112m
Passenger yield $96m
• Long haul yields improved by 4.3 percent (8.4 percent FX Adjusted)
• Short haul yields improved by 1.9 percent, with the boost from the Rugby World Cup offsetting Seats to Suit impact
Passenger traffic -$34m
• Passenger demand was down 2.6 percent, driven by the International long haul Network (down 6.8 percent)
• Capacity decreased by 1.0 percent, with a 4.3 percent reduction in the International long haul Network (decline in demand on the Japan route post the earthquake and tsunami)
• The resulting passenger load factor for the Group deteriorated 1.4 percentage points to 82.8 percent
Cargo volumes and yield $15m • An 11 percent increase in volumes
Contract services and other revenue $21m• Increases in ancillary revenues lifted other revenue by
20 percent
Labour -$14m • Rate increases
Fuel -$173m
• The average US$ into plane fuel cost increased 38 percent compared to last year, resulting in increased fuel costs of $194 million offset by reduced consumption due to fuel burn efficiencies of the B777-300ER aircraft
Maintenance -$25m • Timing of maintenance cycles
Virgin Australia equity derivatives -$21m• A reduction in the fair value of equity derivatives for
Virgin Australia
Depreciation and lease costs -$14m• Depreciation costs increased due to the additional
investment in aircraft (B777-300ER fleet), offset by lease savings
Net finance costs -$15m• Reduced interest revenue from lower cash balances
and increased interest expense from higher borrowings reflecting the investment in new fleet
Net impact of foreign exchange movements $92m• The impact of currency movements on revenue and
costs, including reduced foreign exchange hedging losses
Other -$7m
December 2011 normalised earnings before taxation $33m
$21m• Net impact of derivatives that hedge exposures in other
financial periods
December 2011 earnings before taxation $54m
The key changes in profitability are broken down in the table below.These numbers isolate the impact of foreign exchange and also derivatives that hedge exposures in other financial periods:
Air New Zealand Interim Shareholder Review | 2012
8
Change in ProfitabilityAIR NEW ZEALAND GROUP
Share Registrar Interim Financial Statements Investor Relations Office
Link Market Services LimitedLevel 16, Brookfields House, 19 Victoria Street West, Auckland, New ZealandPO Box 91976, Auckland, 1142, New Zealand
Email: [email protected]
Website: www.linkmarketservices.com
New Zealand Phone: (64 9) 375-5998
Fax: (64 9) 375-5990
Australia Phone: (61 2) 8280-7111
The Interim Financial Statements are available by visiting our website www.airnzinvestor.com OR you may elect to have a copy sent to you by contacting Investor Relations.
Electronic Shareholder CommunicationIf you would like to receive all investor communications electronically, including interim and annual shareholder reviews, please visit the Link Market Services website www.linkmarketservices.com or contact them directly (details to the left).
Private Bag 92007, Auckland, 1142, New Zealand
Phone: 0800 22 22 18 (New Zealand)
(64 9) 336-2287 (Overseas)
Fax: (64 9) 336-2664
Email: [email protected]
Website: www.airnzinvestor.com
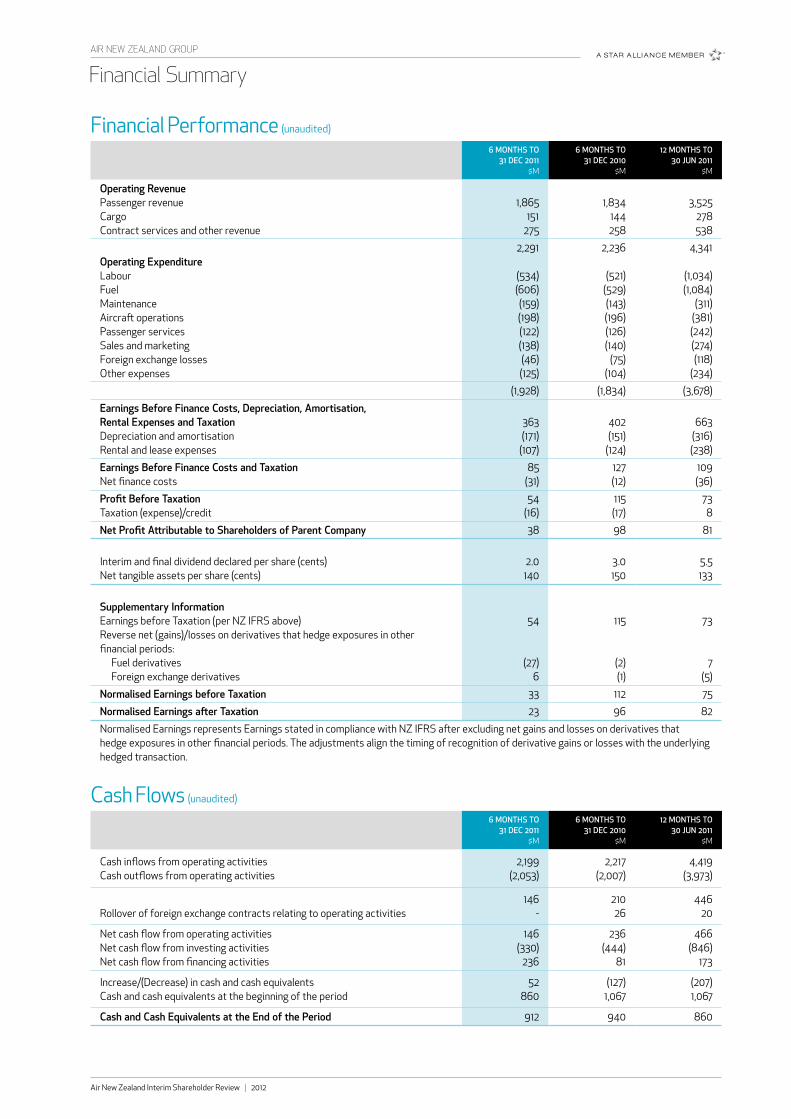
Financial Performance (unaudited)
6 MONTHS TO 31 DEC 2011
$M
6 MONTHS TO 31 DEC 2010
$M
12 MONTHS TO 30 JUN 2011
$M
Operating RevenuePassenger revenueCargoContract services and other revenue
1,865151
275
1,834144258
3,525278538
Operating ExpenditureLabourFuelMaintenanceAircraft operationsPassenger servicesSales and marketingForeign exchange lossesOther expenses
2,291
(534)(606)
(159)(198)(122)(138)(46)(125)
2,236
(521)(529)(143)(196)(126)(140)
(75)(104)
4,341
(1,034)(1,084)
(311)(381)(242)(274)(118)
(234)
(1,928) (1,834) (3,678)
Earnings Before Finance Costs, Depreciation, Amortisation, Rental Expenses and TaxationDepreciation and amortisationRental and lease expenses
363(171)
(107)
402(151)
(124)
663(316)(238)
Earnings Before Finance Costs and TaxationNet finance costs
85(31)
127(12)
109(36)
Profit Before TaxationTaxation (expense)/credit
54(16)
115(17)
738
Net Profit Attributable to Shareholders of Parent Company 38 98 81
Interim and final dividend declared per share (cents)Net tangible assets per share (cents)
2.0140
3.0150
5.5133
Supplementary InformationEarnings before Taxation (per NZ IFRS above)Reverse net (gains)/losses on derivatives that hedge exposures in other financial periods:
Fuel derivativesForeign exchange derivatives
54
(27)6
115
(2)(1)
73
7(5)
Normalised Earnings before Taxation 33 112 75
Normalised Earnings after Taxation 23 96 82
Normalised Earnings represents Earnings stated in compliance with NZ IFRS after excluding net gains and losses on derivatives that hedge exposures in other financial periods. The adjustments align the timing of recognition of derivative gains or losses with the underlying hedged transaction.
Cash Flows (unaudited)
6 MONTHS TO 31 DEC 2011
$M
6 MONTHS TO 31 DEC 2010
$M
12 MONTHS TO 30 JUN 2011
$M
Cash inflows from operating activitiesCash outflows from operating activities
2,199(2,053)
2,217(2,007)
4,419(3,973)
Rollover of foreign exchange contracts relating to operating activities146
-21026
44620
Net cash flow from operating activitiesNet cash flow from investing activitiesNet cash flow from financing activities
146(330)
236
236(444)
81
466(846)
173
Increase/(Decrease) in cash and cash equivalentsCash and cash equivalents at the beginning of the period
52860
(127)1,067
(207)1,067
Cash and Cash Equivalents at the End of the Period 912 940 860
Financial Summary
Air New Zealand Interim Shareholder Review | 2012
AIR NEW ZEALAND GROUP
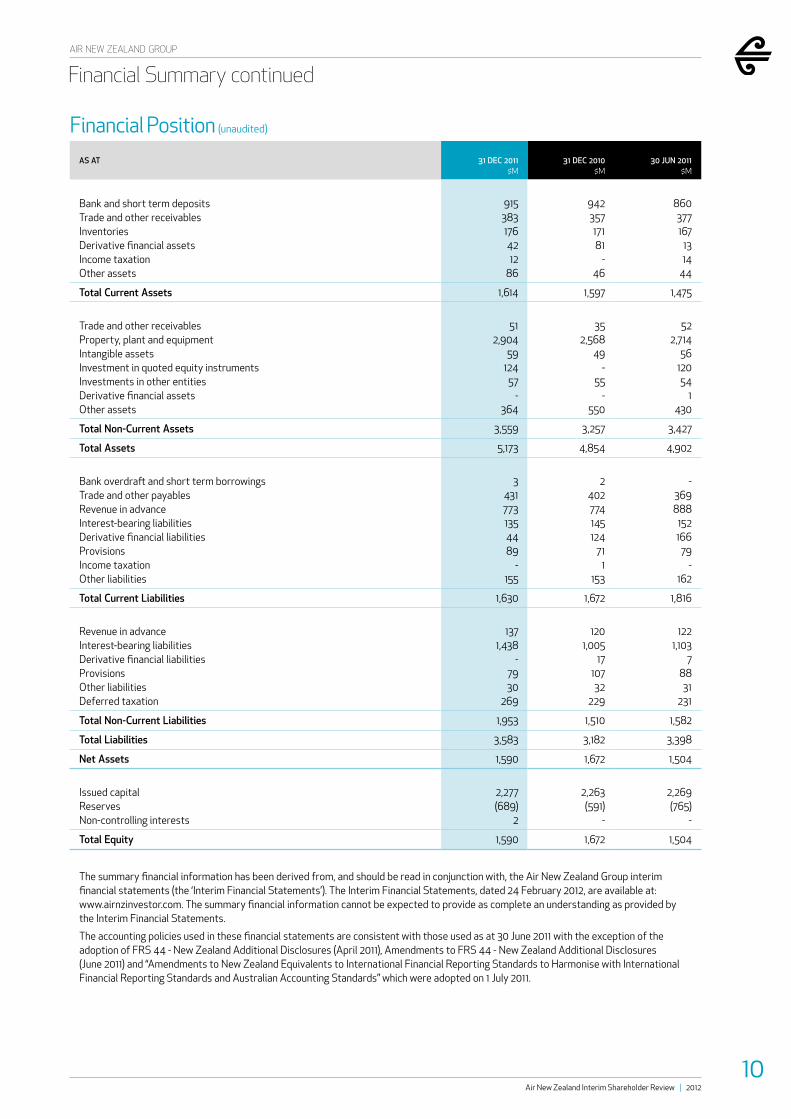
Financial Position (unaudited)
AS AT 31 DEC 2011$M
31 DEC 2010$M
30 JUN 2011$M
Bank and short term depositsTrade and other receivablesInventoriesDerivative financial assetsIncome taxationOther assets
9153831764212
86
942357
17181
-46
860377167
1314
44
Total Current Assets 1,614 1,597 1,475
Trade and other receivablesProperty, plant and equipmentIntangible assetsInvestment in quoted equity instrumentsInvestments in other entitiesDerivative financial assetsOther assets
512,904
59124
57-
364
352,568
49-
55-
550
522,714
5612054
1430
Total Non-Current Assets 3,559 3,257 3,427
Total Assets 5,173 4,854 4,902
Bank overdraft and short term borrowingsTrade and other payablesRevenue in advanceInterest-bearing liabilitiesDerivative financial liabilitiesProvisionsIncome taxationOther liabilities
34317731354489
-155
2402774145124
711
153
-369888
152166
79-
162
Total Current Liabilities 1,630 1,672 1,816
Revenue in advanceInterest-bearing liabilitiesDerivative financial liabilitiesProvisionsOther liabilitiesDeferred taxation
1371,438
-7930
269
1201,005
1710732
229
1221,103
78831
231
Total Non-Current Liabilities 1,953 1,510 1,582
Total Liabilities 3,583 3,182 3,398
Net Assets 1,590 1,672 1,504
Issued capitalReservesNon-controlling interests
2,277(689)
2
2,263(591)
-
2,269(765)
-
Total Equity 1,590 1,672 1,504
The summary financial information has been derived from, and should be read in conjunction with, the Air New Zealand Group interim financial statements (the ‘Interim Financial Statements’). The Interim Financial Statements, dated 24 February 2012, are available at: www.airnzinvestor.com. The summary financial information cannot be expected to provide as complete an understanding as provided by the Interim Financial Statements.
The accounting policies used in these financial statements are consistent with those used as at 30 June 2011 with the exception of the adoption of FRS 44 - New Zealand Additional Disclosures (April 2011), Amendments to FRS 44 - New Zealand Additional Disclosures (June 2011) and “Amendments to New Zealand Equivalents to International Financial Reporting Standards to Harmonise with International Financial Reporting Standards and Australian Accounting Standards” which were adopted on 1 July 2011.
10
Financial Summary continued
Air New Zealand Interim Shareholder Review | 2012
AIR NEW ZEALAND GROUP

The Air New Zealand Airpoints card just got smarter as it now comes with OneSmart Account features for NZ based Airpoints members aged 16 and over. It’s a reloadable payment card and Airpoints card in one, and packed full of benefits that make travelling easier. It will transform the way you earn and use Airpoints Dollars.
Heading overseas?Your OneSmart Account is an easy way to take money when you travel. You can buy up to four foreign currencies (choose from eight) online at great rates before you takeoff and pay us no commission1. When you’re using overseas ATMs you won’t pay us any fees to withdraw funds2, not forgetting you’ll also earn Airpoints Dollars on eligible purchases3 when using your Reloadable Prepaid Debit MasterCard.
Key features and benefits of the new Airpoints Card and OneSmart Account
• Top up your Airpoints Dollars • Earn Airpoints Dollars • No commission charged when buying foreign currency1 • Pay us no international ATM withdrawal fees2 • OneSmart Account balance updates direct to your mobile • Airpoints card comes ePass ready
For more information see airnz.co.nz/onesmart
1. OneSmart Conversion Rates apply. 2. Some ATM operators may charge a fee to withdraw cash from their ATMs which you may not be advised of at the point of withdrawing cash. Currency conversion fees may apply. 3. Eligible purchases exclude: a) purchases of Airpoints Dollars, gambling chips, cash withdrawals from ATMs, Money Orders, travellers cheques and foreign currencies in cash, b) any fees, adjustments and transfers between OneSmart Accounts or c) any transaction that is reversed/refunded or charged-back.
MasterCard and the MasterCard brand mark are registered trademarks of MasterCard International Incorporated. Tap & Go and PayPass are registered trademarks of MasterCard International Incorporated. Air New Zealand Airpoints Programme Terms and Conditions apply. Eligibility criteria apply. Bank of New Zealand (BNZ) is the issuer of the OneSmart Account. BNZ’s account opening criteria and account fees apply. OneSmart Account Terms and Conditions apply see airnz.co.nz/onesmart BNZ’s current Disclosure Statement and Qualifying Financial Entity Disclosure Statement may be obtained from any BNZ store or viewed at bnz.co.nz. This information is provided for New Zealand residents only. This offer of securities is only an offer to persons resident in New Zealand and is not available for subscription by any person outside New Zealand.