Embed Size (px)
Citation preview
2018
INTERIM FINANCIAL
REPORT
2 3
A high quality result
Contents:
Letter from the Chairman 2
Financial Commentary 4
Change in Profitability 6
Condensed Interim Financial Statements 7
Independent Review Report 15
Earnings before taxation:
$323 million
Net profit after taxation:
$232 million
Operating cash flow:
$479 million
Tony Carter Chairman
Air New Zealand Group
2018 Interim Financial Report
Strong financial performance
Air New Zealand reported earnings before taxation for the first six months of the 2018 financial year of $323 million. The prior period result of $349 million included a $22 million gain related to the divestment of Virgin Australia. Adjusting for this one-off gain and a $72 million impact of increased fuel prices, the Company delivered a very strong result. Robust operating revenue growth of 5.6 percent was driven by positive pricing dynamics across much of the airline’s network and capacity growth of 3.4 percent. Also demonstrating considerable strength was our cargo business, which grew revenues 11 percent by achieving strong improvement in pricing and volumes. The airline’s focus on sustainable cost improvement contributed to the result, as efficiencies from cost saving initiatives and economies of scale offset price inflation and kept non-fuel unit costs stable.
Delivering superior returns
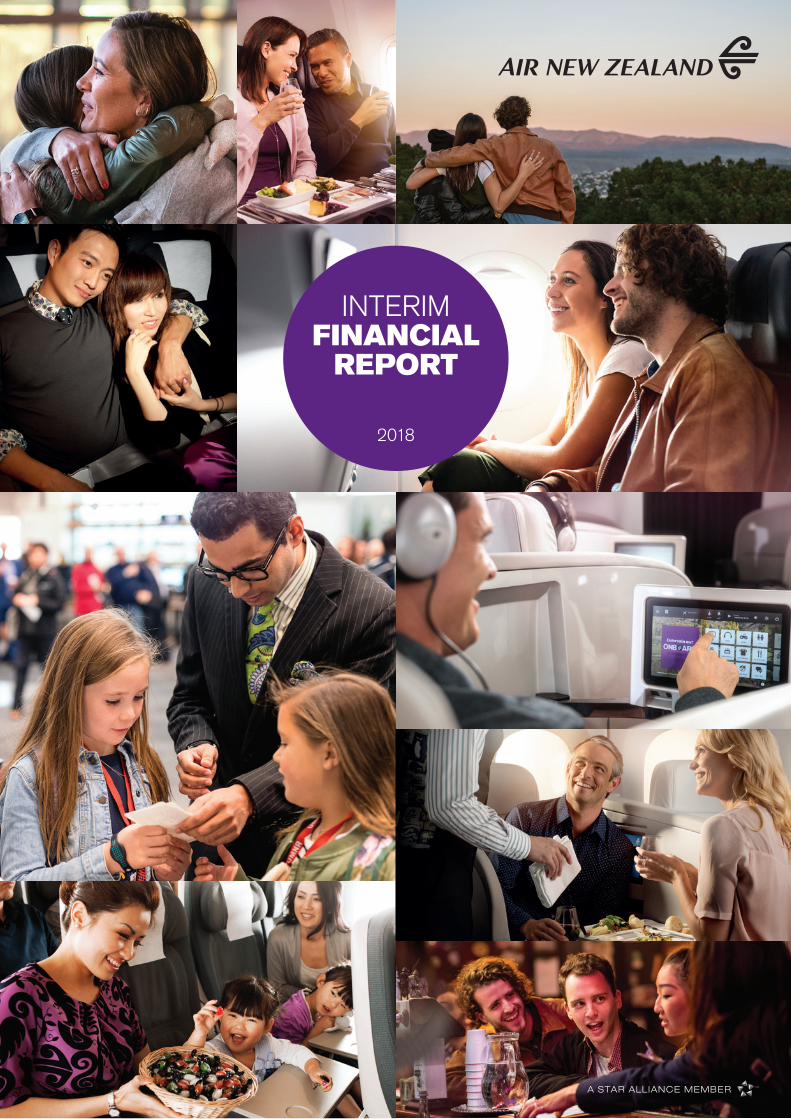
We are extremely proud of the strength of this financial result, which demonstrates our continued commitment to deliver superior returns for our shareholders over the long term. The Company’s strategy to expand the network profitably has driven sustainable value over the years. In fact, Air New Zealand’s total shareholder return was 300 percent over the past five years, outperforming the Bloomberg World Airline Index, consisting of global airline peers, by two and a half times.
Maintaining a strong financial position
Our financial position remains strong and the airline maintains a stable investment grade credit rating from Moody’s of Baa2, among the top-ranked airlines globally. Gearing was 52.4 percent, a minor increase from 51.8 percent at the end of the 2017 financial year, reflecting the investment in new aircraft. Cash flow from operations grew $103 million or 27 percent to $479 million, driven by growth in cash operating earnings and strong working capital cash flows. Cash on hand was $1.3 billion.
Increasing the interim dividend
The Board is pleased to declare a fully imputed interim dividend of 11.0 cents per share, a 10 percent increase from the prior period. This dividend reflects the Board’s confidence in the medium-term outlook for the airline and considers the strength of the company’s balance sheet, the positive trading environment and future capital requirements.
Strategically expanding our Pacific Rim network
We continue to see opportunities to expand across our network, and to do so profitably. The domestic network was our strongest performer in the first half of this year, as a buoyant New Zealand economy and continued strong inbound tourism resulted in positive growth in unit revenues on a capacity increase of 5.2 percent. This year we have also targeted some strong growth in parts of our Tasman and Pacific Island network, and have been pleased with the customer response. A large portion of our international long-haul growth will come
from growing Tokyo, with the addition of a new service to Haneda Airport, which complements our existing Auckland to Narita route. Overall, we are planning to grow our network approximately five percent for the year.
Looking beyond the 2018 financial year, we have announced plans for a new direct service to Taipei, beginning in November 2018. This destination, with strong tourism as well as connections to New Zealand, is an exciting addition that aligns with our Pacific Rim growth strategy. Our revenue share alliances continue to strengthen our international proposition for customers, as we will begin offering a third daily service to Singapore, with our partner Singapore Airlines in October 2018.
Fleet investment continues to drive long-term value
A key enabler to achieving profitable growth across our network is our modern and simplified fleet. In the period, we welcomed two of our newly configured Boeing 787-9 Dreamliners into service, bringing the total number of Dreamliners to 11. We are in the final stages of confirming a new lease agreement for an additional Boeing 787-9 aircraft, which will join the fleet in the 2020 financial year.
Our forecasted aircraft capital expenditures through to 2021 will be approximately $1.1 billion. A key component of that investment will be the Airbus A320/321 NEO aircraft, which we will start receiving in the 2019 financial year.
Changes to our Executive team
During the period we saw the departure of two longstanding members of our Executive team. Rob McDonald, our Chief Financial Officer for the past 13 years, retired from his position at the end of December and is succeeded by Jeff McDowall, a 17-year veteran of Air New Zealand. Stephen Jones, our Chief Strategy, Networks & Alliances Officer, left to take up an exciting external opportunity in Europe after 16 years with the airline. Succeeding him in the role is Nick Judd, another high calibre internal candidate with 14 years tenure at Air New Zealand. Talent development and
succession planning are key focus areas for the Board of Directors, and to be able to promote two world-class internal candidates into the Executive says a lot about the calibre of talent at Air New Zealand.
Reaffirming our 2018 outlook
Looking to the remainder of the year, we are optimistic about the overall market dynamics. Based upon the current market conditions and despite the increased price of jet fuel, the Company is still expecting 2018 earnings before taxation to exceed the prior year.
Tony CarterChairman
22 February 2018
“ The 2018 interim result sets Air New Zealand on a path to achieve the second highest profit in history, despite rising fuel prices.”
Letter from the Chairman
Gearing:
52.4%Operating revenue growth of:
5.6%Cash on hand of:
$1.3bInterim dividend declared of:
11.0 cps
5 year total shareholder return (as at 31 December 2017)
400
350
300
250
200
150
100
50
0
(50)
PE
RC
EN
TAG
E
AIR NEW ZEALAND
BLOOMBERG WORLD AIRLINE INDEX
DEC 2012
DEC 2013
DEC 2014
DEC 2015
DEC 2016
DEC 2017
Exceeding global airline peers 2.5x
Air New Zealand’s earnings before taxation for the first six months of the 2018 financial year were $323 million.
Net profit after taxation was $232 million.This interim result saw strong revenue growth driven by increased capacity and positive pricing dynamics, as well as improvements in the competitive environment. Revenue growth was offset by increased fuel cost in the period and unfavourable foreign exchange, as well as a prior period gain of $22 million related to the divestment of Virgin Australia.
Operating Revenue
Operating revenue grew by $145 million to $2.7 billion, an increase of 5.6 percent on the prior period. Excluding the impact of foreign exchange, operating revenue increased 6.1 percent.
Passenger revenue grew by $122 million to $2.3 billion, a 5.5 percent increase. Excluding the impact of foreign exchange, passenger revenue increased by 6.0 percent. Capacity (Available Seat Kilometres, ASK) growth of 3.4 percent reflected growth in the domestic network, increased wide-body flying across the Tasman and Pacific Island routes and the commencement of a new service to Tokyo’s Haneda Airport. Demand (Revenue Passenger Kilometres, RPK) lagged slightly behind capacity growth at 2.7 percent, resulting in a decreased load factor of 82.5 percent. Passenger Revenue per Available Seat Kilometre (RASK) for the Group increased 2.0 percent, driven by positive pricing dynamics on the Domestic and Tasman and Pacific Island routes. Excluding the adverse impact of foreign exchange, RASK increased 2.5 percent.
International long-haul capacity increased 2.3 percent due to the new service into Tokyo’s Haneda Airport. Demand on international long-haul routes remained stable, with load factor declining 1.9 percentage points to 83.0 percent.
International long-haul RASK decreased by 3.3 percent reflecting the capacity growth into Japan as well as the annualisation of competitive entrants in the Asian and European markets. This decline was partially offset by RASK improvements on the North and South American routes, driven by stronger pricing dynamics and the stabilisation of U.S. competitor capacity in the period. Excluding the adverse impact of foreign exchange, RASK declined by 2.0 percent.
Short-haul capacity grew 4.8 percent, driven by increased frequency on New Zealand domestic main trunk routes including Auckland to Queenstown and larger aircraft and increased frequency on a number of Tasman and Pacific Island routes. Demand grew by 6.2 percent, with load factor increasing 1.1 percentage points to 82.0 percent. Short-haul RASK increased 5.3 percent, and excluding the benefit of foreign exchange, improved 5.2 percent, driven by positive pricing dynamics.
Cargo revenue was $189 million, an increase of $18 million or 10.5 percent. Excluding the adverse impact of foreign exchange, cargo revenue increased 10.7 percent. The increase was driven by a 9.0 percent increase in volume and 1.7 percent increase in yield.
Contract services and other revenue was $203 million, an increase of $5 million or 2.5 percent on the prior period. The increase reflected higher third-party maintenance and ancillary revenue. There was no impact from foreign exchange.
Operating Expenses
Operating expenditure increased by $142 million on the prior period, an increase of 7.5 percent. Excluding the additional $72 million related to increased fuel prices in the period, operating expenditures increased 3.7 percent on a 3.4 percent increase in ASKs and a 5.5 percent increase in passengers. Net foreign exchange did not have an impact on total operating expenses.
Costs per ASK increased 4.0 percent on the prior period to 9.16 cents per ASK, driven by fuel price increases of 18 percent. Excluding the impact of fuel price, Costs per ASK were flat, as efficiencies achieved throughout the cost
base offset inflation. Economies of scale and efficiencies contributed $33 million in savings.
Labour costs were $635 million for the period, an increase of $12 million or 1.9 percent on a 3.4 percent increase in capacity. Activity and rate increases were offset by productivity improvements. Headcount increased by 34 full time equivalent (FTE) between December 2016 and December 2017 to 10,896 FTE employees, a 0.3 percent increase.
Fuel costs were $470 million, increasing by $80 million. The largest driver of the increase was the average price of fuel, which was 18 percent higher than the prior period, resulting in a $72 million adverse impact. Also contributing to the increase was 1.8 percent growth in volume, net of fleet efficiencies.
Aircraft operations, passenger services and maintenance costs were $605 million, an increase of $47 million or 8.4 percent on the prior period. Increased capacity, passenger numbers and price increases drove increased aircraft operations and passenger services expenses. Maintenance expenditure increases were driven by higher jet fleet engine costs and fleet growth.
Sales and marketing and other expenses increased by $8 million or 2.7 percent,
due to increased loyalty programme activity, commission volumes and property costs, partially offset by lower advertising costs.
Depreciation, rental and lease expense and funding costs increased by $12 million or 3.1 percent. Excluding the impact of foreign exchange, the increase was 2.9 percent, and was driven by depreciation of new aircraft, higher digital investment and lounge refurbishments.
The impact of foreign exchange rate changes on the revenue and cost base in the current financial period resulted in an unfavourable foreign exchange movement of $18 million. After taking into account the $5 million improvement in hedging, overall foreign exchange had a net $13 million negative impact on the Group result compared to the prior period.
Share of Earnings of Associates
The share of equity earnings of associates reflected $15 million of earnings from the Christchurch Engine Centre, an increase of $5 million from the prior period, driven by continued growth in engine volumes.
Other Significant Items
In the prior period, there were other significant items of $22 million, reflecting a gain on the divestment of Virgin Australia.
Cash and Financial Position
Cash on hand at 31 December 2017 was $1.3 billion, a decrease of $29 million from 30 June 2017.
Operating cash flows increased $103 million or 27 percent, to $479 million, reflecting an increase in cash operating earnings and a strong working capital cash flow as the business grows.
Net gearing, including capitalised aircraft operating leases, increased 0.6 percentage points to 52.4 percent. The increase reflected the purchase of new aircraft during the period.
A 2018 fully imputed interim ordinary dividend has been declared of 11.0 cents per share, an increase of 10 percent from the prior period.
5
Financial Commentary
4
Air New Zealand Group
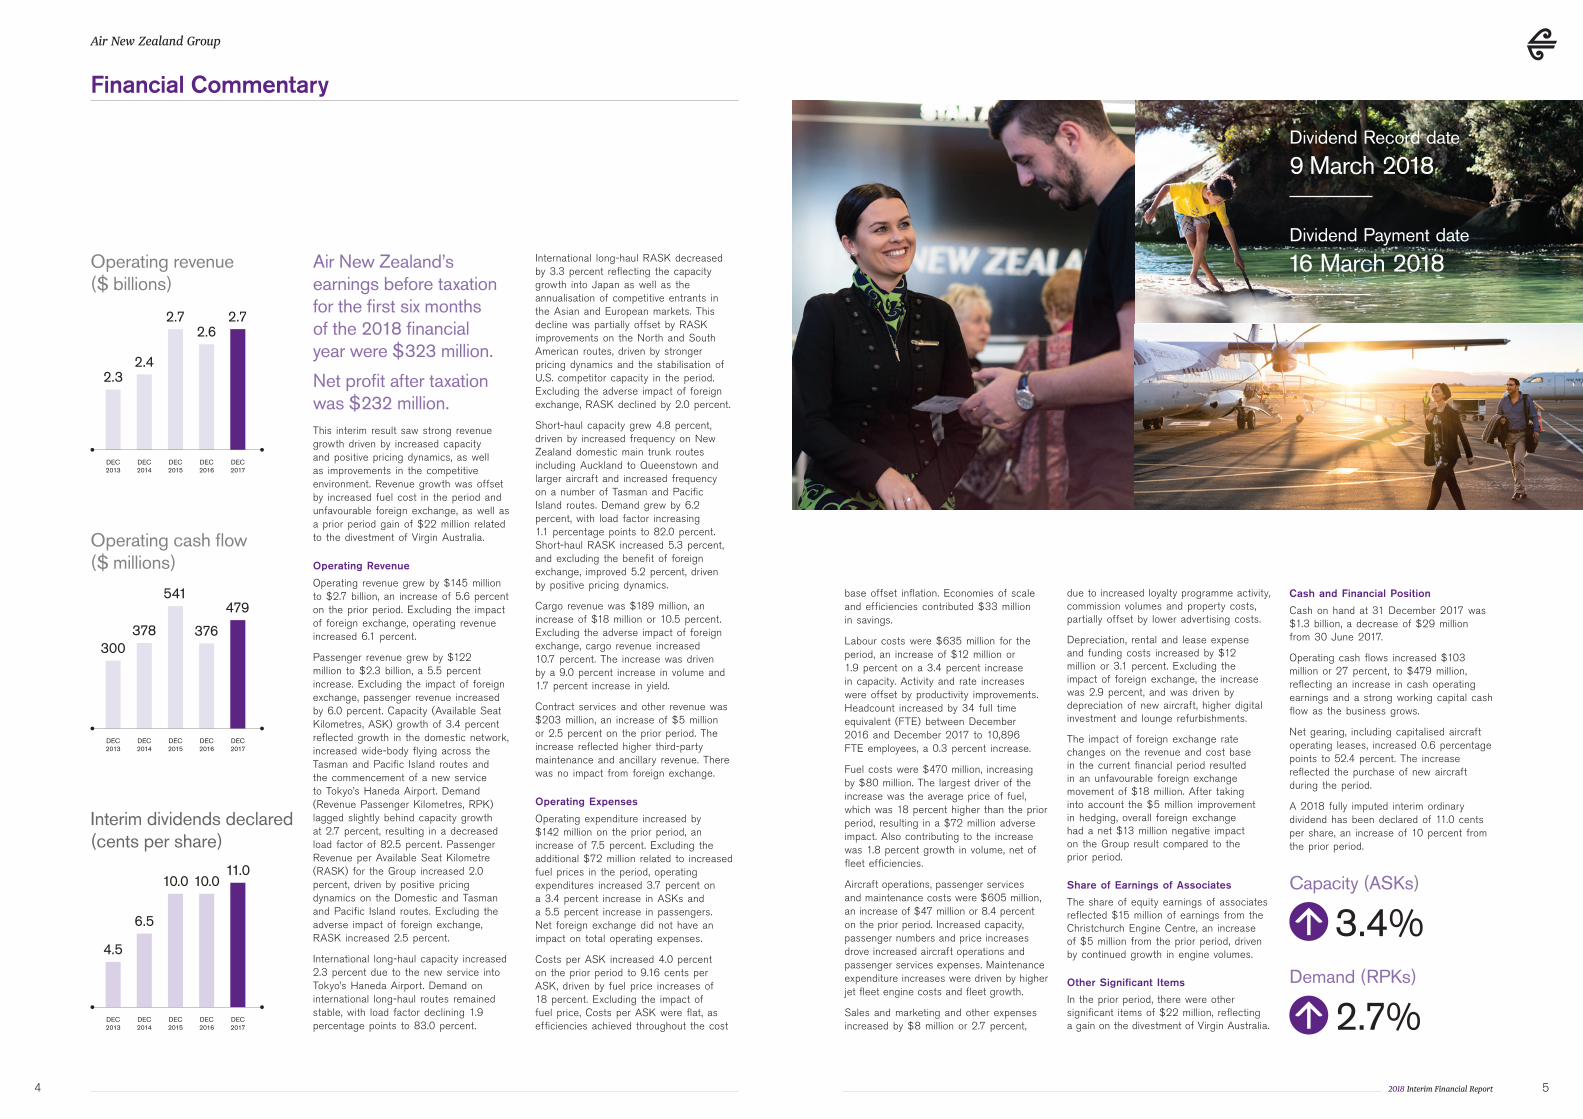
Interim dividends declared (cents per share)
10.0
4.5
6.5
10.011.0
DEC 2017
DEC 2013
DEC 2014
DEC 2015
DEC 2016
Capacity (ASKs)
3.4%Demand (RPKs)
2.7%
Dividend Record date
9 March 2018
Dividend Payment date
16 March 2018
2.6
2.42.3
2.7 2.7
DEC 2017
DEC 2015
DEC 2014
DEC 2013
DEC 2016
Operating revenue ($ billions)
376378300
541479
DEC 2017
DEC 2015
DEC 2014
DEC 2013
DEC 2016
Operating cash flow ($ millions)
2018 Interim Financial Report
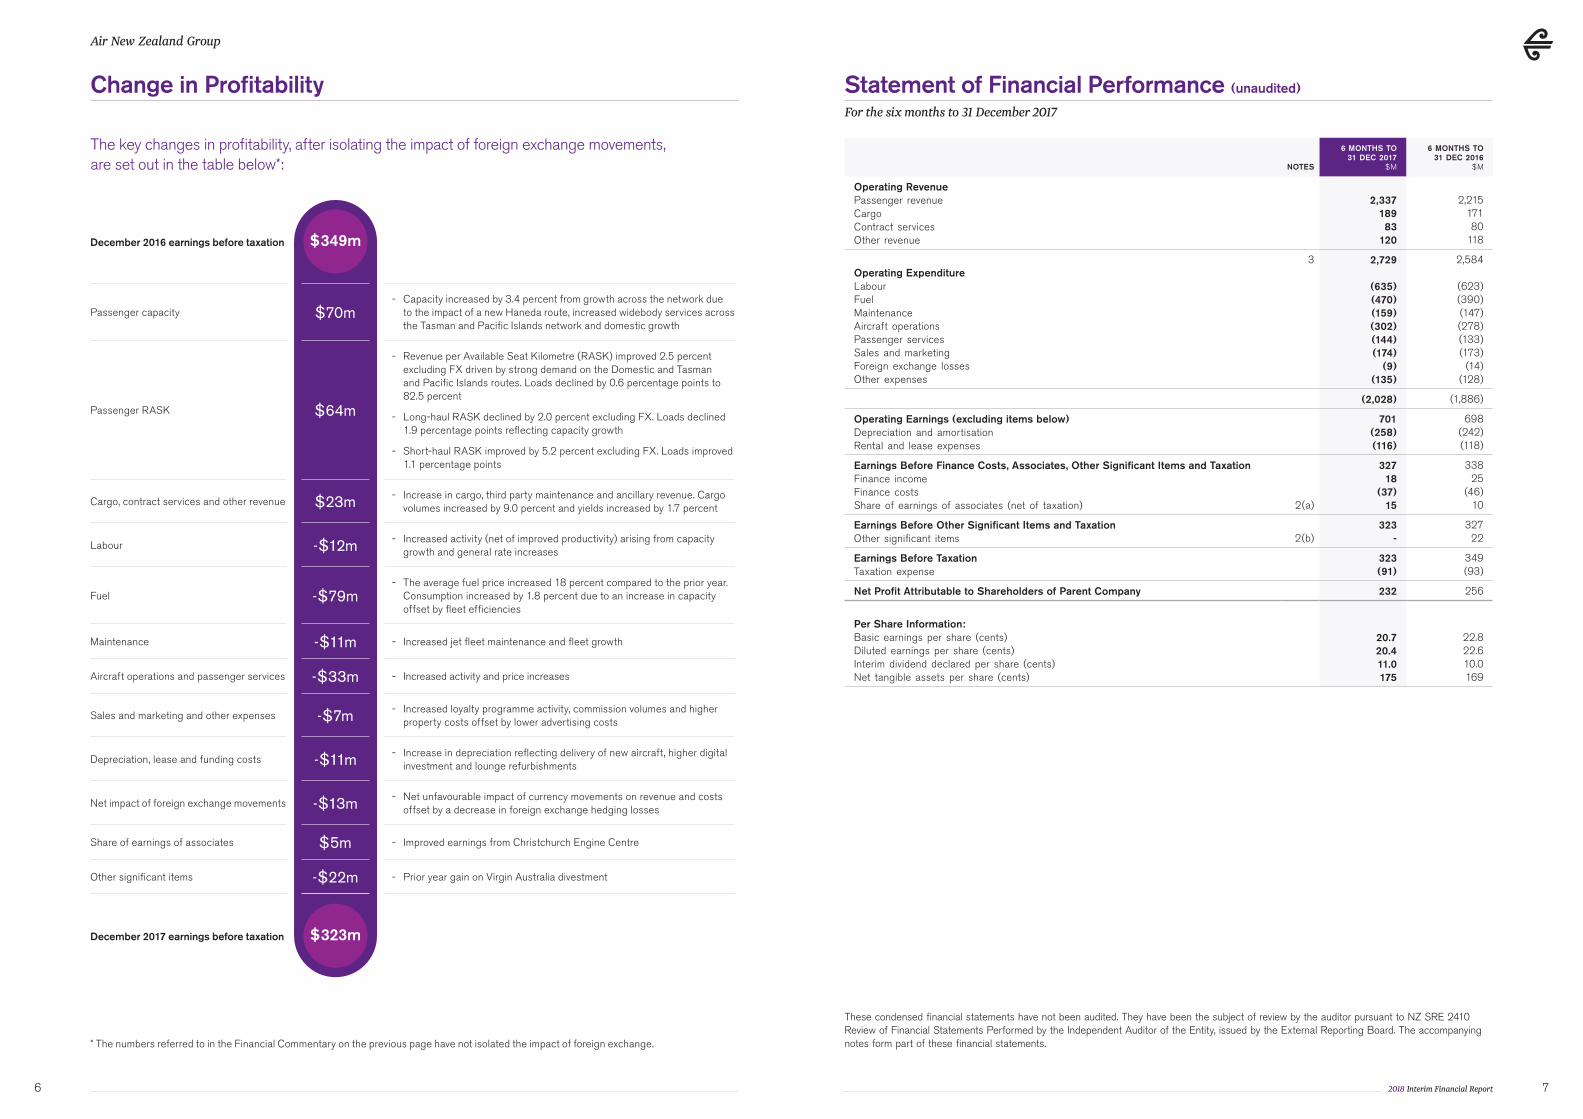
December 2016 earnings before taxation
Passenger capacity $70m- Capacity increased by 3.4 percent from growth across the network due
to the impact of a new Haneda route, increased widebody services across the Tasman and Pacific Islands network and domestic growth
Passenger RASK $64m
- Revenue per Available Seat Kilometre (RASK) improved 2.5 percent excluding FX driven by strong demand on the Domestic and Tasman and Pacific Islands routes. Loads declined by 0.6 percentage points to 82.5 percent
- Long-haul RASK declined by 2.0 percent excluding FX. Loads declined 1.9 percentage points reflecting capacity growth
- Short-haul RASK improved by 5.2 percent excluding FX. Loads improved 1.1 percentage points
Cargo, contract services and other revenue $23m - Increase in cargo, third party maintenance and ancillary revenue. Cargo volumes increased by 9.0 percent and yields increased by 1.7 percent
Labour -$12m - Increased activity (net of improved productivity) arising from capacity growth and general rate increases
Fuel -$79m- The average fuel price increased 18 percent compared to the prior year.
Consumption increased by 1.8 percent due to an increase in capacity offset by fleet efficiencies
Maintenance -$11m - Increased jet fleet maintenance and fleet growth
Aircraft operations and passenger services -$33m - Increased activity and price increases
Sales and marketing and other expenses -$7m - Increased loyalty programme activity, commission volumes and higher property costs offset by lower advertising costs
Depreciation, lease and funding costs -$11m - Increase in depreciation reflecting delivery of new aircraft, higher digital investment and lounge refurbishments
Net impact of foreign exchange movements -$13m - Net unfavourable impact of currency movements on revenue and costs offset by a decrease in foreign exchange hedging losses
Share of earnings of associates $5m - Improved earnings from Christchurch Engine Centre
Other significant items -$22m - Prior year gain on Virgin Australia divestment
December 2017 earnings before taxation
* The numbers referred to in the Financial Commentary on the previous page have not isolated the impact of foreign exchange.
NOTES
6 MONTHS TO 31 DEC 2017
$M
6 MONTHS TO 31 DEC 2016
$M
Operating RevenuePassenger revenueCargoContract servicesOther revenue
2,337 189 83
120
2,215 171 80
118
Operating ExpenditureLabourFuelMaintenanceAircraft operationsPassenger servicesSales and marketingForeign exchange lossesOther expenses
3 2,729
(635) (470) (159) (302) (144) (174)
(9) (135)
2,584
(623) (390) (147) (278)(133)(173)
(14)(128)
(2,028) (1,886)
Operating Earnings (excluding items below)Depreciation and amortisationRental and lease expenses
701(258)(116)
698(242)(118)
Earnings Before Finance Costs, Associates, Other Significant Items and TaxationFinance incomeFinance costs Share of earnings of associates (net of taxation) 2(a)
32718
(37)15
33825
(46)10
Earnings Before Other Significant Items and TaxationOther significant items 2(b)
323-
32722
Earnings Before TaxationTaxation expense
323(91)
349(93)
Net Profit Attributable to Shareholders of Parent Company 232 256
Per Share Information:Basic earnings per share (cents)Diluted earnings per share (cents)Interim dividend declared per share (cents)Net tangible assets per share (cents)
20.720.411.0175
22.822.610.0169
Statement of Financial Performance (unaudited)
For the six months to 31 December 2017
These condensed financial statements have not been audited. They have been the subject of review by the auditor pursuant to NZ SRE 2410 Review of Financial Statements Performed by the Independent Auditor of the Entity, issued by the External Reporting Board. The accompanying notes form part of these financial statements.
Change in Profitability
6 7
Air New Zealand Group
$349m
The key changes in profitability, after isolating the impact of foreign exchange movements, are set out in the table below*:
$323m
2018 Interim Financial Report
These condensed financial statements have not been audited. They have been the subject of review by the auditor pursuant to NZ SRE 2410, issued by the External Reporting Board. The accompanying notes form part of these financial statements.
6 MONTHS TO 31 DEC 2017
$M
6 MONTHS TO 31 DEC 2016
$M
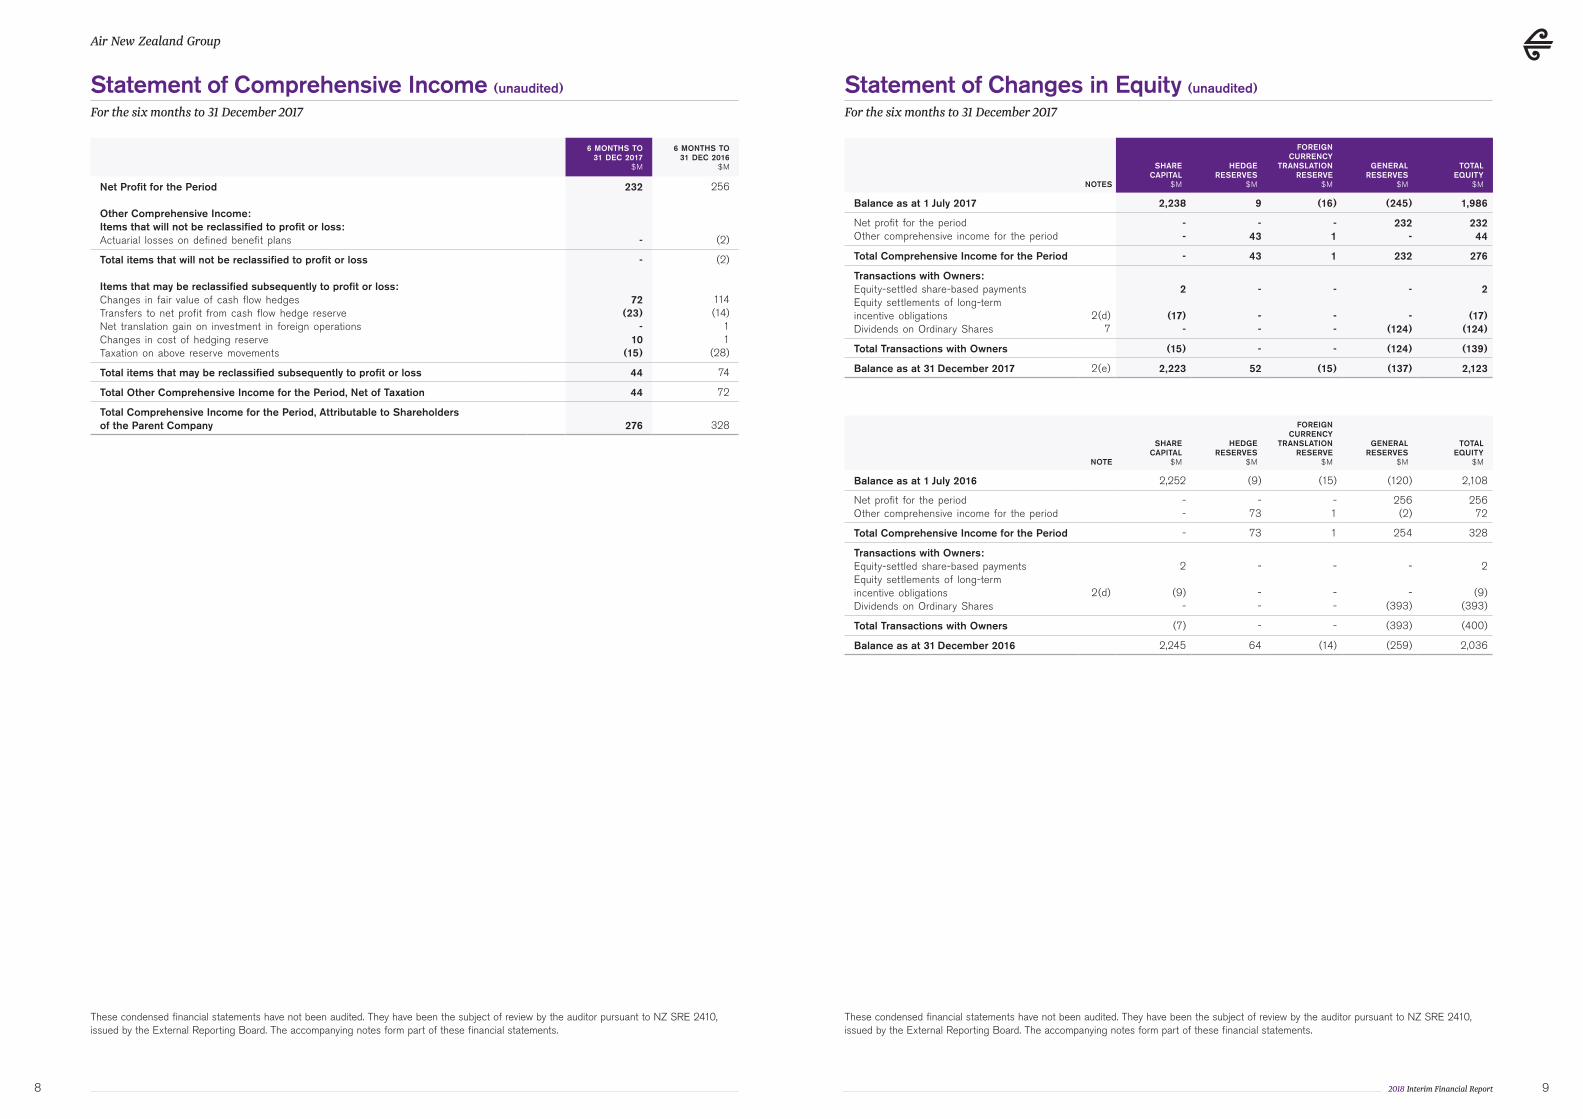
Net Profit for the Period
Other Comprehensive Income:Items that will not be reclassified to profit or loss:Actuarial losses on defined benefit plans
232
-
256
(2)
Total items that will not be reclassified to profit or loss
Items that may be reclassified subsequently to profit or loss: Changes in fair value of cash flow hedgesTransfers to net profit from cash flow hedge reserveNet translation gain on investment in foreign operationsChanges in cost of hedging reserveTaxation on above reserve movements
-
72(23)
-10
(15)
(2)
114(14)
11
(28)
Total items that may be reclassified subsequently to profit or loss 44 74
Total Other Comprehensive Income for the Period, Net of Taxation 44 72
Total Comprehensive Income for the Period, Attributable to Shareholders of the Parent Company 276 328
NOTES
SHARE CAPITAL
$M
HEDGE RESERVES
$M
FOREIGN CURRENCY
TRANSLATION RESERVE
$M
GENERAL RESERVES
$M
TOTAL EQUITY
$M
Balance as at 1 July 2017 2,238 9 (16) (245) 1,986
Net profit for the periodOther comprehensive income for the period
- -
- 43
- 1
232 -
232 44
Total Comprehensive Income for the Period - 43 1 232 276
Transactions with Owners:Equity-settled share-based paymentsEquity settlements of long-term incentive obligationsDividends on Ordinary Shares
2(d)7
2
(17)-
-
--
-
--
-
-(124)
2
(17)(124)
Total Transactions with Owners (15) - - (124) (139)
Balance as at 31 December 2017 2(e) 2,223 52 (15) (137) 2,123
NOTE
SHARE CAPITAL
$M
HEDGE RESERVES
$M
FOREIGN CURRENCY
TRANSLATION RESERVE
$M
GENERAL RESERVES
$M
TOTAL EQUITY
$M
Balance as at 1 July 2016 2,252 (9) (15) (120) 2,108
Net profit for the periodOther comprehensive income for the period
- -
- 73
- 1
256 (2)
256 72
Total Comprehensive Income for the Period - 73 1 254 328
Transactions with Owners:Equity-settled share-based paymentsEquity settlements of long-term incentive obligationsDividends on Ordinary Shares
2(d)
2
(9)-
- --
-
- -
-
-(393)
2
(9) (393)
Total Transactions with Owners (7) - - (393) (400)
Balance as at 31 December 2016 2,245 64 (14) (259) 2,036
These condensed financial statements have not been audited. They have been the subject of review by the auditor pursuant to NZ SRE 2410, issued by the External Reporting Board. The accompanying notes form part of these financial statements.
8 9
Statement of Comprehensive Income (unaudited)
For the six months to 31 December 2017
Statement of Changes in Equity (unaudited)
For the six months to 31 December 2017
Air New Zealand Group
2018 Interim Financial Report
These condensed financial statements have not been audited. They have been the subject of review by the auditor pursuant to NZ SRE 2410, issued by the External Reporting Board. The accompanying notes form part of these financial statements.
NOTES
31 DEC 2017$M
30 JUN 2017$M
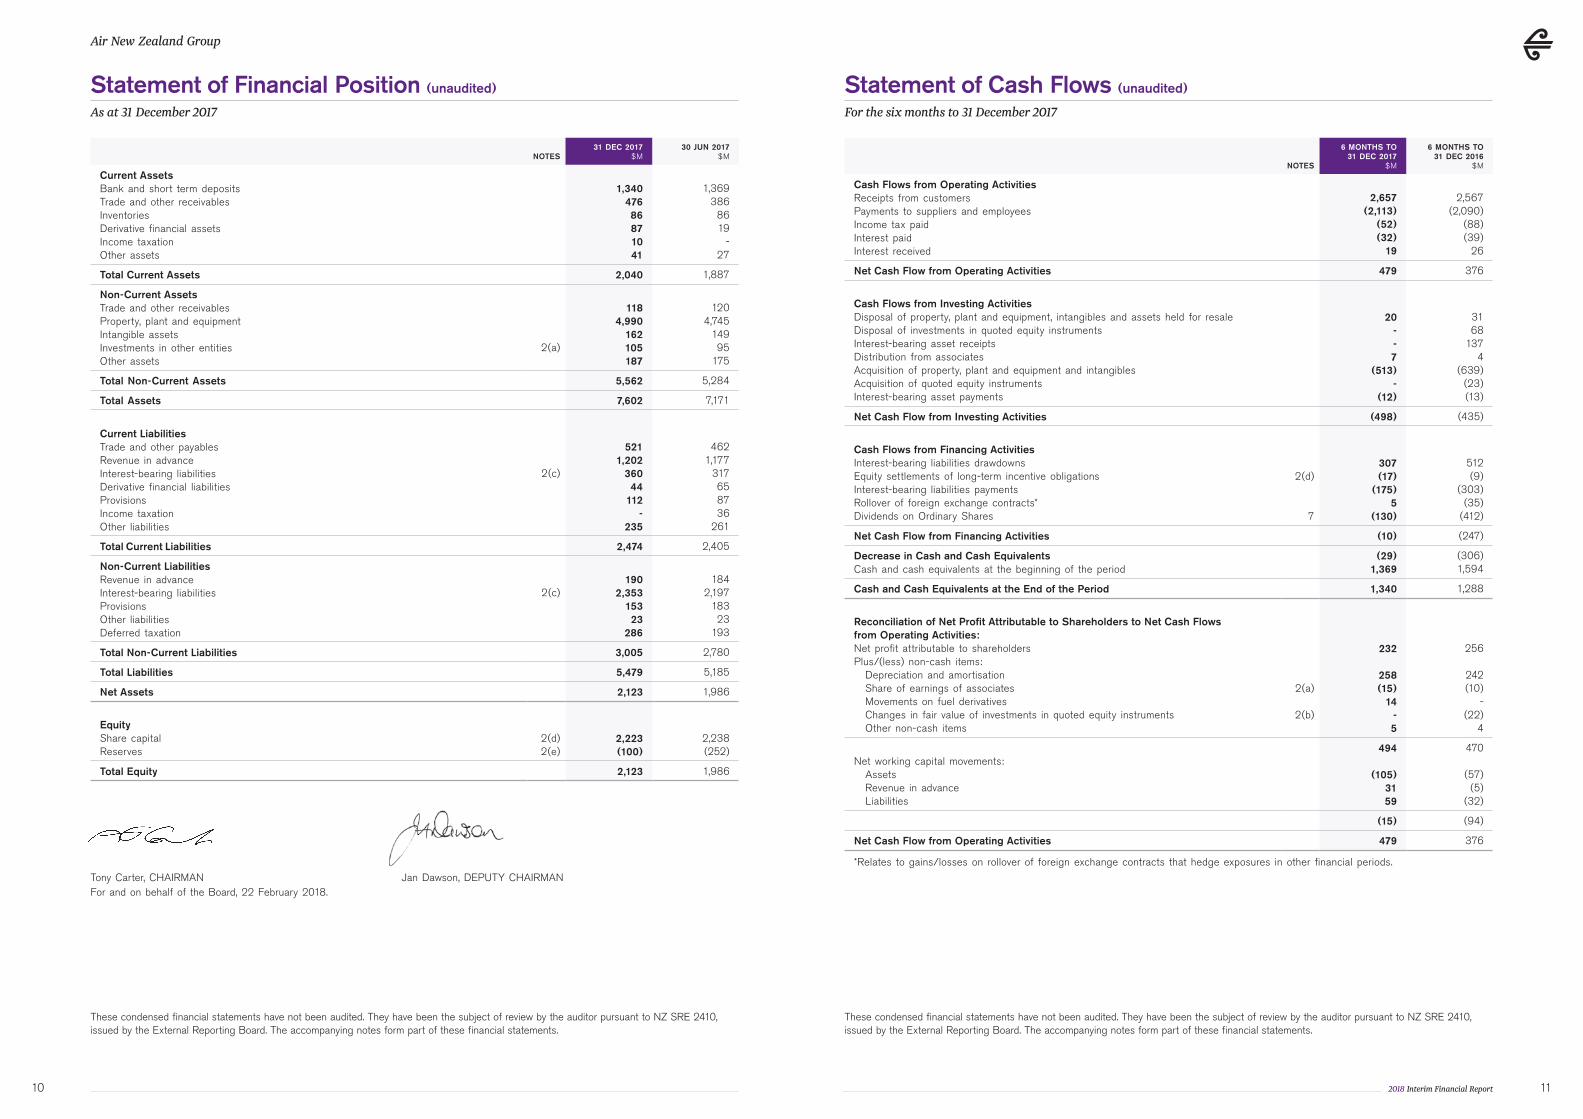
Current Assets Bank and short term depositsTrade and other receivablesInventoriesDerivative financial assetsIncome taxationOther assets
1,340 476 86 87 10 41
1,369 386
86 19
- 27
Total Current Assets 2,040 1,887
Non-Current Assets Trade and other receivablesProperty, plant and equipmentIntangible assetsInvestments in other entitiesOther assets
2(a)
1184,990
162105187
1204,745
14995
175
Total Non-Current Assets 5,562 5,284
Total Assets 7,602 7,171
Current LiabilitiesTrade and other payablesRevenue in advanceInterest-bearing liabilitiesDerivative financial liabilitiesProvisions Income taxationOther liabilities
2(c)
521
1,202360
44112
-235
4621,177
317658736
261
Total Current Liabilities 2,474 2,405
Non-Current Liabilities Revenue in advanceInterest-bearing liabilitiesProvisionsOther liabilitiesDeferred taxation
2(c)190
2,35315323
286
184
2,19718323
193
Total Non-Current Liabilities 3,005 2,780
Total Liabilities 5,479 5,185
Net Assets 2,123 1,986
Equity Share capitalReserves
2(d)2(e)
2,223(100)
2,238(252)
Total Equity 2,123 1,986
Tony Carter, CHAIRMAN Jan Dawson, DEPUTY CHAIRMAN For and on behalf of the Board, 22 February 2018.
These condensed financial statements have not been audited. They have been the subject of review by the auditor pursuant to NZ SRE 2410, issued by the External Reporting Board. The accompanying notes form part of these financial statements.
NOTES
6 MONTHS TO 31 DEC 2017
$M
6 MONTHS TO 31 DEC 2016
$M
Cash Flows from Operating ActivitiesReceipts from customersPayments to suppliers and employeesIncome tax paidInterest paidInterest received
2,657 (2,113)
(52) (32)
19
2,567 (2,090)
(88) (39)
26
Net Cash Flow from Operating Activities 479 376
Cash Flows from Investing ActivitiesDisposal of property, plant and equipment, intangibles and assets held for resaleDisposal of investments in quoted equity instrumentsInterest-bearing asset receiptsDistribution from associatesAcquisition of property, plant and equipment and intangiblesAcquisition of quoted equity instrumentsInterest-bearing asset payments
20--7
(513)-
(12)
3168
1374
(639)(23)(13)
Net Cash Flow from Investing Activities (498) (435)
Cash Flows from Financing Activities Interest-bearing liabilities drawdownsEquity settlements of long-term incentive obligationsInterest-bearing liabilities paymentsRollover of foreign exchange contracts*Dividends on Ordinary Shares
2(d)
7
307(17)
(175)5
(130)
512(9)
(303)(35)
(412)
Net Cash Flow from Financing Activities (10) (247)
Decrease in Cash and Cash EquivalentsCash and cash equivalents at the beginning of the period
(29)1,369
(306)1,594
Cash and Cash Equivalents at the End of the Period 1,340 1,288
Reconciliation of Net Profit Attributable to Shareholders to Net Cash Flows from Operating Activities:Net profit attributable to shareholdersPlus/(less) non-cash items:
Depreciation and amortisationShare of earnings of associates Movements on fuel derivativesChanges in fair value of investments in quoted equity instrumentsOther non-cash items
2(a)
2(b)
232
258(15)
14-5
256
242(10)
-(22)
4
Net working capital movements:AssetsRevenue in advanceLiabilities
494
(105)3159
470
(57)(5)
(32)
(15) (94)
Net Cash Flow from Operating Activities 479 376
*Relates to gains/losses on rollover of foreign exchange contracts that hedge exposures in other financial periods.
10 11
Statement of Financial Position (unaudited)
As at 31 December 2017
Statement of Cash Flows (unaudited)
For the six months to 31 December 2017
Air New Zealand Group
2018 Interim Financial Report
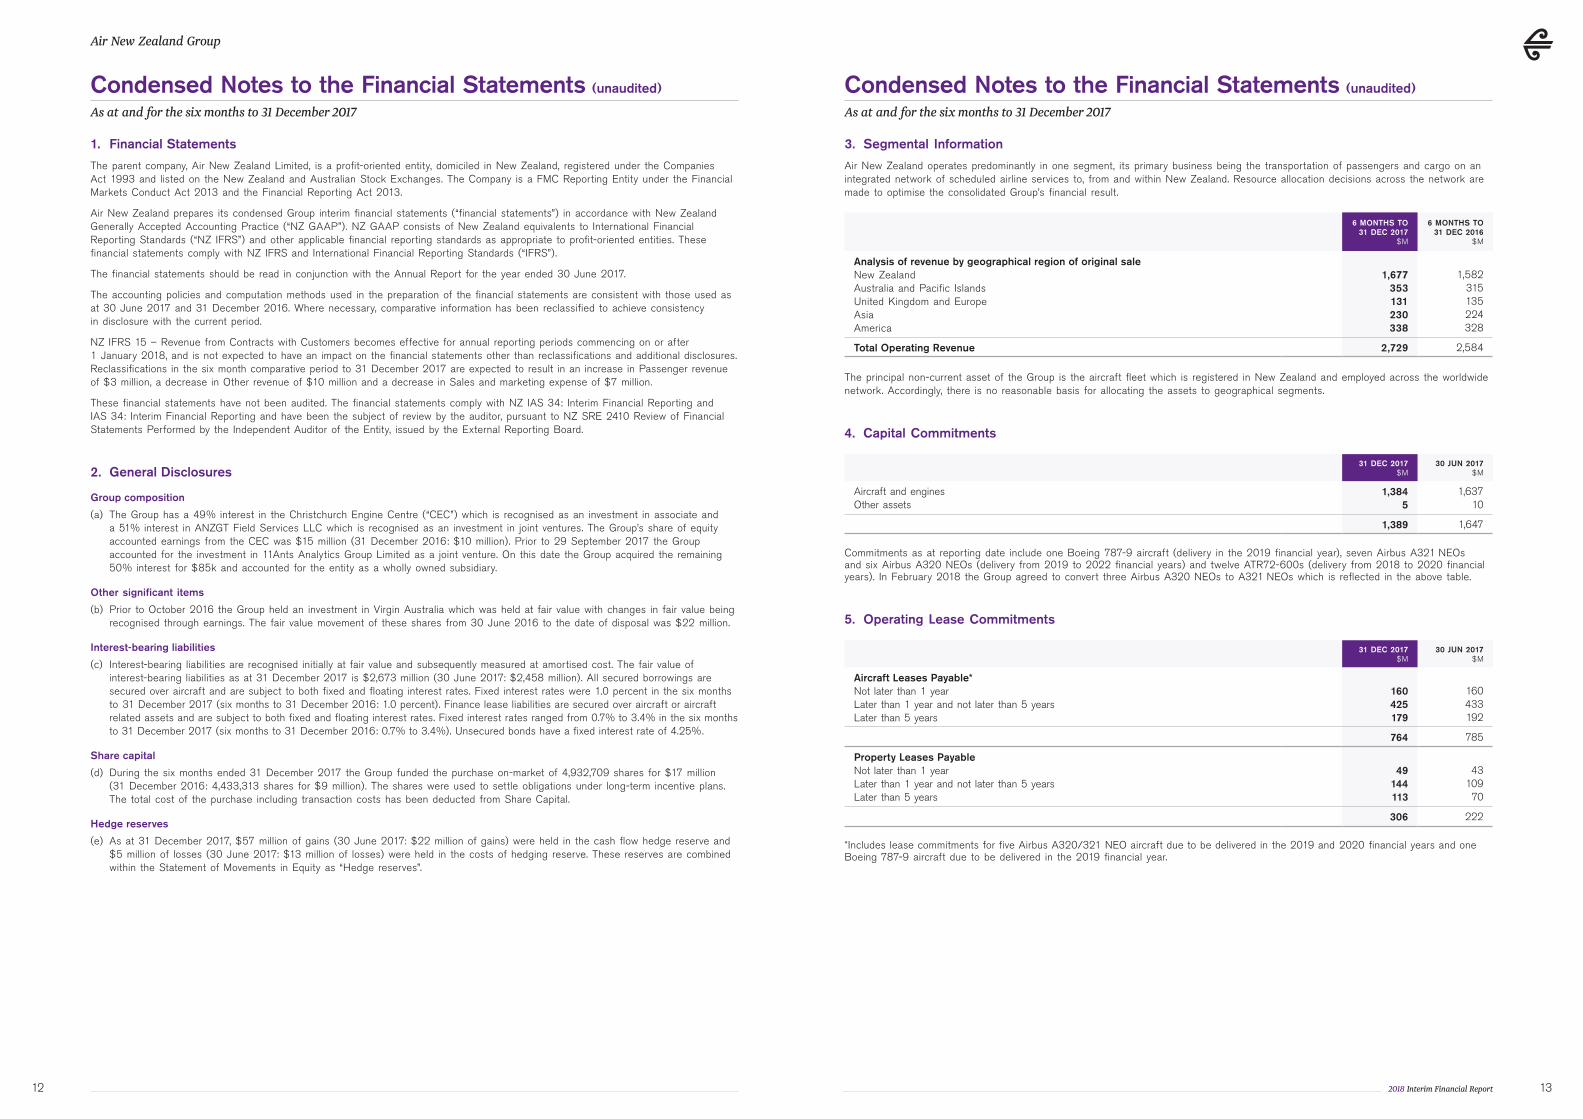
1. Financial Statements
The parent company, Air New Zealand Limited, is a profit-oriented entity, domiciled in New Zealand, registered under the Companies Act 1993 and listed on the New Zealand and Australian Stock Exchanges. The Company is a FMC Reporting Entity under the Financial Markets Conduct Act 2013 and the Financial Reporting Act 2013.
Air New Zealand prepares its condensed Group interim financial statements (“financial statements”) in accordance with New Zealand Generally Accepted Accounting Practice (“NZ GAAP”). NZ GAAP consists of New Zealand equivalents to International Financial Reporting Standards (“NZ IFRS”) and other applicable financial reporting standards as appropriate to profit-oriented entities. These financial statements comply with NZ IFRS and International Financial Reporting Standards (“IFRS”).
The financial statements should be read in conjunction with the Annual Report for the year ended 30 June 2017.
The accounting policies and computation methods used in the preparation of the financial statements are consistent with those used as at 30 June 2017 and 31 December 2016. Where necessary, comparative information has been reclassified to achieve consistency in disclosure with the current period.
NZ IFRS 15 – Revenue from Contracts with Customers becomes effective for annual reporting periods commencing on or after 1 January 2018, and is not expected to have an impact on the financial statements other than reclassifications and additional disclosures. Reclassifications in the six month comparative period to 31 December 2017 are expected to result in an increase in Passenger revenue of $3 million, a decrease in Other revenue of $10 million and a decrease in Sales and marketing expense of $7 million.
These financial statements have not been audited. The financial statements comply with NZ IAS 34: Interim Financial Reporting and IAS 34: Interim Financial Reporting and have been the subject of review by the auditor, pursuant to NZ SRE 2410 Review of Financial Statements Performed by the Independent Auditor of the Entity, issued by the External Reporting Board.
2. General Disclosures
Group composition
(a) The Group has a 49% interest in the Christchurch Engine Centre (“CEC”) which is recognised as an investment in associate and a 51% interest in ANZGT Field Services LLC which is recognised as an investment in joint ventures. The Group’s share of equity accounted earnings from the CEC was $15 million (31 December 2016: $10 million). Prior to 29 September 2017 the Group accounted for the investment in 11Ants Analytics Group Limited as a joint venture. On this date the Group acquired the remaining 50% interest for $85k and accounted for the entity as a wholly owned subsidiary.
Other significant items
(b) Prior to October 2016 the Group held an investment in Virgin Australia which was held at fair value with changes in fair value being recognised through earnings. The fair value movement of these shares from 30 June 2016 to the date of disposal was $22 million.
Interest-bearing liabilities
(c) Interest-bearing liabilities are recognised initially at fair value and subsequently measured at amortised cost. The fair value of interest-bearing liabilities as at 31 December 2017 is $2,673 million (30 June 2017: $2,458 million). All secured borrowings are secured over aircraft and are subject to both fixed and floating interest rates. Fixed interest rates were 1.0 percent in the six months to 31 December 2017 (six months to 31 December 2016: 1.0 percent). Finance lease liabilities are secured over aircraft or aircraft related assets and are subject to both fixed and floating interest rates. Fixed interest rates ranged from 0.7% to 3.4% in the six months to 31 December 2017 (six months to 31 December 2016: 0.7% to 3.4%). Unsecured bonds have a fixed interest rate of 4.25%.
Share capital
(d) During the six months ended 31 December 2017 the Group funded the purchase on-market of 4,932,709 shares for $17 million (31 December 2016: 4,433,313 shares for $9 million). The shares were used to settle obligations under long-term incentive plans. The total cost of the purchase including transaction costs has been deducted from Share Capital.
Hedge reserves
(e) As at 31 December 2017, $57 million of gains (30 June 2017: $22 million of gains) were held in the cash flow hedge reserve and $5 million of losses (30 June 2017: $13 million of losses) were held in the costs of hedging reserve. These reserves are combined within the Statement of Movements in Equity as “Hedge reserves”.
3. Segmental Information
Air New Zealand operates predominantly in one segment, its primary business being the transportation of passengers and cargo on an integrated network of scheduled airline services to, from and within New Zealand. Resource allocation decisions across the network are made to optimise the consolidated Group’s financial result.
6 MONTHS TO 31 DEC 2017
$M
6 MONTHS TO 31 DEC 2016
$M
Analysis of revenue by geographical region of original saleNew ZealandAustralia and Pacific IslandsUnited Kingdom and EuropeAsiaAmerica
1,677353131230338
1,582315135224328
Total Operating Revenue 2,729 2,584
The principal non-current asset of the Group is the aircraft fleet which is registered in New Zealand and employed across the worldwide network. Accordingly, there is no reasonable basis for allocating the assets to geographical segments.
4. Capital Commitments
31 DEC 2017$M
30 JUN 2017$M
Aircraft and enginesOther assets
1,3845
1,63710
1,389 1,647
Commitments as at reporting date include one Boeing 787-9 aircraft (delivery in the 2019 financial year), seven Airbus A321 NEOs and six Airbus A320 NEOs (delivery from 2019 to 2022 financial years) and twelve ATR72-600s (delivery from 2018 to 2020 financial years). In February 2018 the Group agreed to convert three Airbus A320 NEOs to A321 NEOs which is reflected in the above table.
5. Operating Lease Commitments
31 DEC 2017$M
30 JUN 2017$M
Aircraft Leases Payable*Not later than 1 yearLater than 1 year and not later than 5 yearsLater than 5 years
160425179
160433192
764 785
Property Leases PayableNot later than 1 yearLater than 1 year and not later than 5 yearsLater than 5 years
49144113
43109
70
306 222
*Includes lease commitments for five Airbus A320/321 NEO aircraft due to be delivered in the 2019 and 2020 financial years and one Boeing 787-9 aircraft due to be delivered in the 2019 financial year.
12 13
Condensed Notes to the Financial Statements (unaudited)
As at and for the six months to 31 December 2017
Condensed Notes to the Financial Statements (unaudited)
As at and for the six months to 31 December 2017
Air New Zealand Group
2018 Interim Financial Report
6. Contingent Liabilities
All significant legal disputes involving probable loss that can be reliably estimated have been provided for in the financial statements. There are no contingent liabilities for which it is practicable to estimate the financial effect.
Allegations of anti-competitive conduct in the air cargo business in Hong Kong and Singapore were the subject of proceedings by the Australian Competition and Consumer Commission (ACCC). Following two appeals of an initial judgment finding in favour of Air New Zealand, the High Court released its judgment on 14 June 2017 finding in favour of the ACCC. The level of penalty will be referred to the Federal Court for determination. An allowance for the estimated level of the penalty and costs has been made in the financial statements.
No other significant contingent liability claims are outstanding at balance date.
Outstanding letters of credit and performance bonds total $34 million (30 June 2017: $32 million).
The Group has a partnership agreement with Pratt and Whitney in which it holds a 49% interest in the CEC. By the nature of the agreement, joint and several liability exists between the two parties. Total liabilities of the CEC are $131 million (30 June 2017: $121 million).
7. Dividends
On 21 February 2018, the Board of Directors declared an interim dividend of 11.0 cents per Ordinary Share payable on 16 March 2018 to registered shareholders at 9 March 2018. The total dividend payable will be $124 million. Imputation credits will be attached and supplementary dividends paid to non-resident shareholders. The dividend has not been recognised in the December 2017 interim financial statements.
A final dividend in respect of the 2017 financial year of 11.0 cents per Ordinary Share was paid on 18 September 2017. Imputation credits were attached and supplementary dividends paid to non-resident shareholders.
The dividend reinvestment plan is currently suspended.
Independent Review Report
To the shareholders of Air New Zealand LimitedWe have reviewed the condensed Group interim financial statements of Air New Zealand Limited (“the Company”) and its subsidiaries (“the Group”) on pages 7 to 14, which comprise the Statement of Financial Position as at 31 December 2017, and the Statement of Financial Performance, Statement of Comprehensive Income, Statement of Changes in Equity and Statement of Cash Flows for the six months ended on that date, and condensed notes to the interim financial statements.
This report is made solely to Air New Zealand Limited’s shareholders, as a body. Our review has been undertaken so that we might state to Air New Zealand Limited’s shareholders those matters we are required to state to them in a review report and for no other purpose. To the fullest extent permitted by law, we do not accept or assume responsibility to anyone other than Air New Zealand Limited’s shareholders as a body, for our engagement, for this report, or for the opinions we have formed.
Directors’ ResponsibilitiesThe directors are responsible on behalf of the Group for the preparation and fair presentation of the condensed Group interim financial statements, in accordance with NZ IAS 34: Interim Financial Reporting and IAS 34: Interim Financial Reporting and for such internal control as the Board of Directors determine is necessary to enable the preparation and fair presentation of the condensed Group interim financial statements that are free from material misstatement, whether due to fraud or error.
The directors are also responsible for the publication of the condensed Group interim financial statements, whether in printed or electronic form.
Our ResponsibilitiesThe Auditor-General is the auditor of the Group pursuant to section 5(1)(f) of the Public Audit Act 2001. Pursuant to section 32 of the Public Audit Act 2001, the Auditor-General has appointed me, Peter Gulliver, using the staff and resources of Deloitte Limited, to carry out the annual audit of the Group.
Our responsibility is to express a conclusion on the condensed Group interim financial statements based on our review. We conducted our review in accordance with NZ SRE 2410 Review of Financial Statements Performed by the Independent Auditor of the Entity (NZ SRE 2410). NZ SRE 2410 requires us to conclude whether anything has come to our attention that causes us to believe that the condensed Group interim financial statements, taken as a whole, are not prepared, in all material respects, in accordance with NZ IAS 34: Interim Financial Reporting and IAS 34: Interim Financial Reporting. As the auditor of Air New Zealand Limited, NZ SRE 2410 requires that we comply with the ethical requirements relevant to the audit of the annual financial statements.
A review of the condensed Group interim financial statements in accordance with NZ SRE 2410 is a limited assurance engagement. The auditor performs procedures, primarily consisting of making enquiries, primarily of persons responsible for financial and accounting matters, and applying analytical and other review procedures. The procedures performed in a review are substantially less than those performed in an audit conducted in accordance with International Standards on Auditing (New Zealand). Accordingly we do not express an audit opinion on the condensed Group interim financial statements.
In addition to this review and the audit of the Group annual financial statements, we have carried out engagements in the areas of other assurance and non-assurance services which are compatible with the independence requirements of the Auditor-General’s Auditing Standards, which incorporate the independence requirements of Professional and Ethical Standard 1 (Revised): Code of Ethics for Assurance Practitioners issued by the New Zealand Auditing and Assurance Standards Board. In addition to these engagements, principals and employees of our firm deal with the Group on normal terms within the ordinary course of trading activities of the Group. These engagements and trading activities have not impaired our independence as auditor of the Group. Other than this review, the audit of the Group annual financial statements and these engagements and trading activities, we have no relationship with, or interests in, the Group.
ConclusionBased on our review, nothing has come to our attention that causes us to believe that the condensed Group interim financial statements do not present fairly, in all material respects, the financial position of the Group as at 31 December 2017 and of its financial performance and its cash flows for the six months ended on that date in accordance with NZ IAS 34: Interim Financial Reporting and IAS 34: Interim Financial Reporting.
Peter Gulliver, Partner for Deloitte Limited On behalf of the Auditor-General
22 February 2018 Auckland, New Zealand
14 15
Condensed Notes to the Financial Statements (unaudited)
As at and for the six months to 31 December 2017
Shareholder EnquiriesShareholder CommunicationAir New Zealand’s investor website www.airnzinvestor.co.nz provides shareholders with information on monthly operating statistics, financial results, stock exchange releases, corporate governance, annual meetings, investor presentations, important dates and contact details. Shareholders can also view webcasts of key events from this site.
Shareholders who would like to receive electronic news updates can register online at www.airnzinvestor.co.nz or email Investor Relations directly on [email protected].
Share RegistrarLink Market Services LimitedLevel 11, Deloitte House80 Queen Street, Auckland, 1010, New ZealandPO Box 91976, Auckland 1142, New Zealand
Phone: (64 9) 375 5998 (New Zealand) (61) 1300 554 474 (Australia)
Fax: (64 9) 375 5990
Email: [email protected]
Investor RelationsPrivate Bag 92007Auckland 1142, New Zealand
Phone: 0800 22 22 18 (New Zealand) (64 9) 336 2607 (Overseas)
Fax: (64 9) 336 2664
Email: [email protected]
Website: www.airnzinvestor.com
Air New Zealand Group

Discover a Better Way to Fly with Air New Zealand
betterwaytofly.com