Embed Size (px)
Citation preview
Interim Financial Report Q2 2016 / 2017
Heidelberg Group
Figures in € millions Q1 to Q2 Q2
2015 / 2016 2016 / 2017 2015 / 2016 2016 / 2017
Incoming orders 1,323 1,408 620 604
Net sales 1,162 1,072 599 586
EBITDA 1) 79 45 33 44
in percent of sales 6.8 4.2 5.6 7.5
Result of operating activities 2) 43 11 15 27
Net result after taxes – 14 – 28 – 9 9
Research and development costs 60 58 30 29
Investments 24 51 11 26
Equity 294 126 294 126
Net debt 3) 284 276 284 276
Leverage 4) 1.3 1.8 1.3 1.8
Free cash flow – 30 0 5 – 7
Earnings per share in € – 0.05 – 0.11 – 0.03 0.03
Number of employees at end of quarter (excluding trainees) 11,753 11,519 11,753 11,519
1) Result of operating activities before interest, taxes, depreciation and amortization, excluding special items2) Excluding special items3) Net total of financial liabilities less cash and cash equivalents and current securities4) Ratio of net debt to EBITDA excluding special items for the last four quarters
Key performance data
INTERIM FINANCIAL REPORT Q2 2016 / 2017
¬ Sales of € 1,072 million in first half of 2016 / 2017
¬ Incoming orders rise to € 1,408 million; order backlog up around 19 percent at € 765 million
¬ EBITDA excluding special items amounts to € 45 million in first half of year
¬ Result of operating activities excluding special items (EBIT) of € 11 million generated
¬ Positive net result after taxes of € 9 million in the second quarter
In individual cases, rounding could result in discrepancies concerning the totals and percentages contained in this interim financial report.
1
Interim consolidated financial report Q2 2016 / 2017
Heidelberg on the capital markets 02
Interim consolidated management report 04
Macroeconomic and industry-specific conditions 04
Business development 05
Results of operations, net assets and financial position 05
Segment report 08
Report on the regions 10
Employees 11
Risk and opportunity report 11
Future prospects 12
Supplementary report 12
Interim consolidated financial statements 13
Interim consolidated income statement – April 1, 2016 to September 30, 2016 14
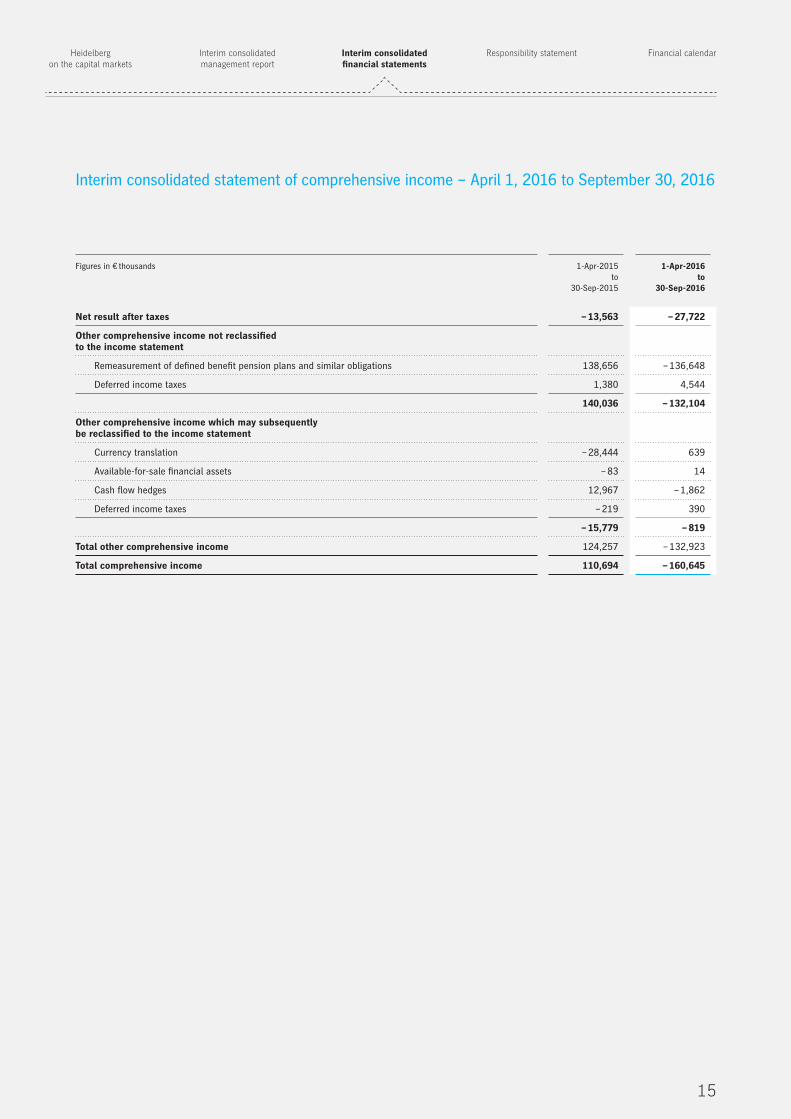
Interim consolidated statement of comprehensive income – April 1, 2016 to September 30, 2016 15
Interim consolidated income statement – July 1, 2016 to September 30, 2016 16
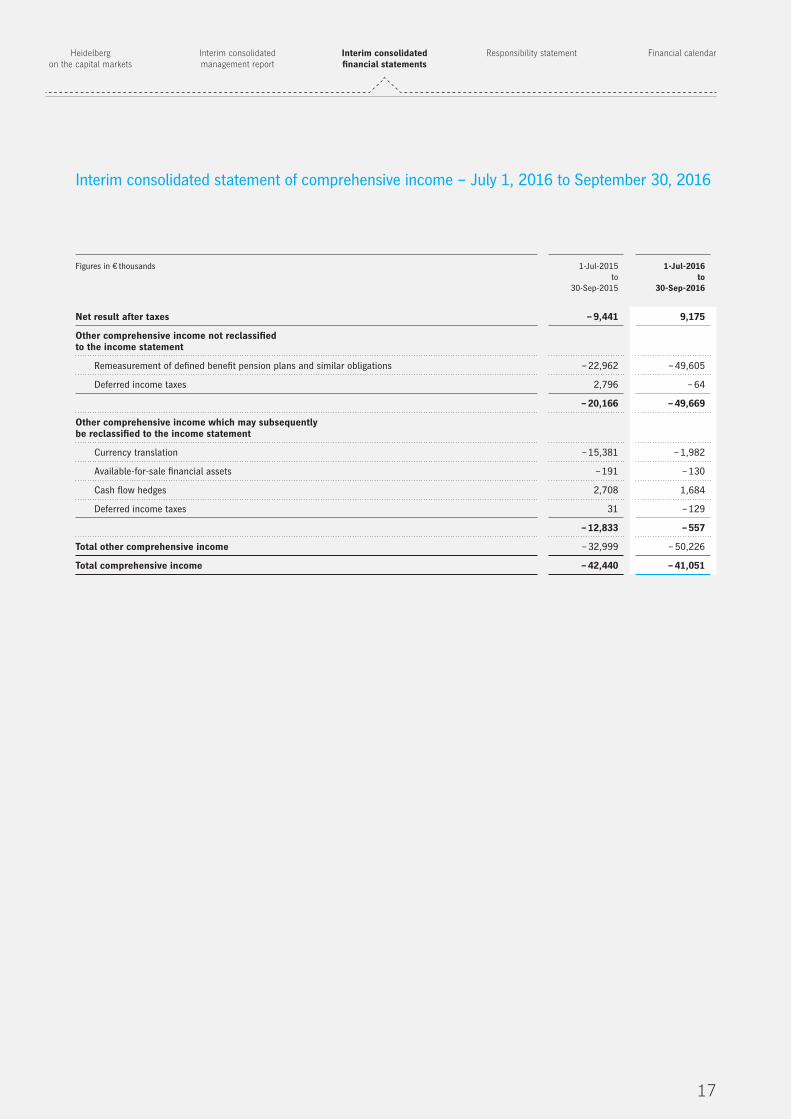
Interim consolidated statement of comprehensive income – July 1, 2016 to September 30, 2016 17
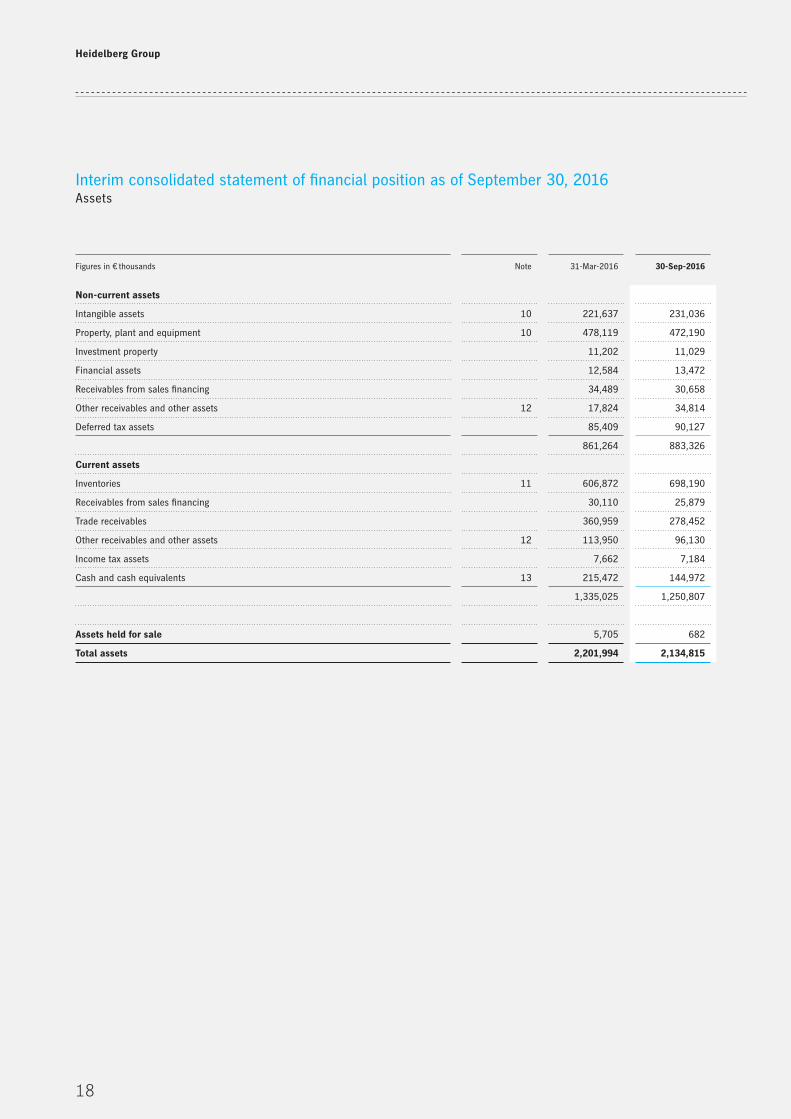
Interim consolidated statement of financial position 18
Statement of changes in consolidated equity 20
Interim consolidated statement of cash flows 22
Notes 23
Responsibility statement 32
Financial calendar 33
Publishing information 33
2
Heidelberg Group
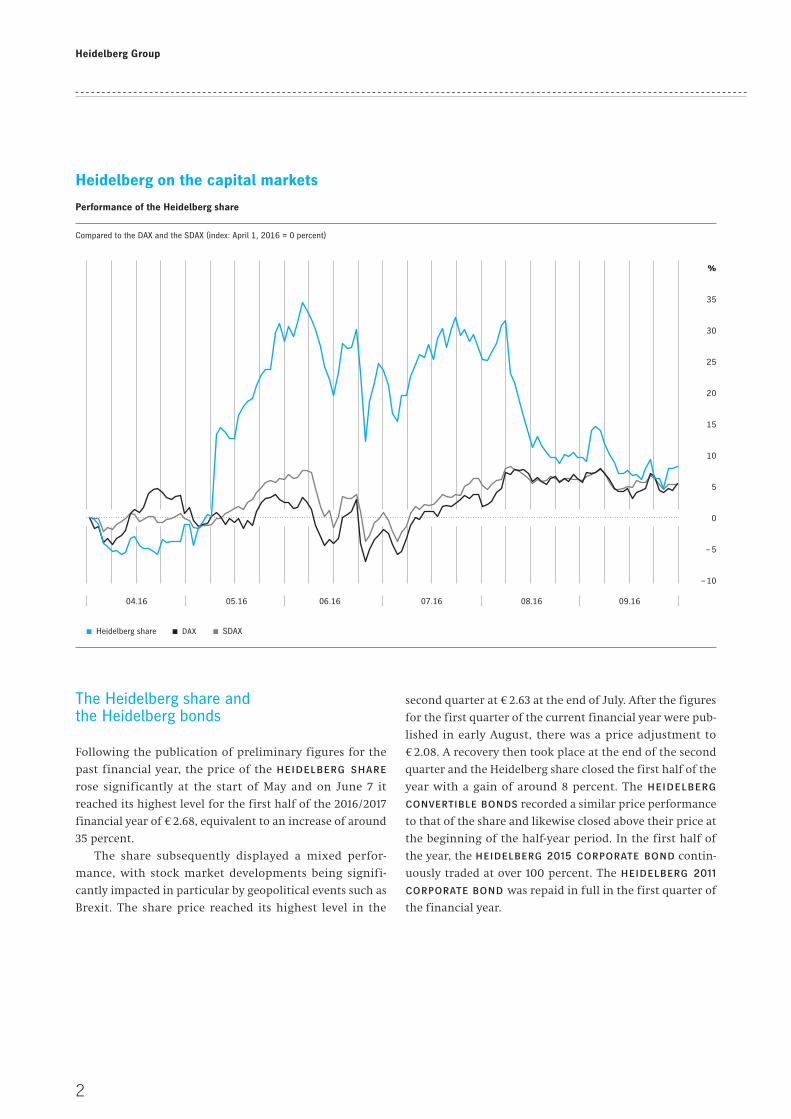
The Heidelberg share andthe Heidelberg bonds
Following the publication of preliminary figures for the
past financial year, the price of the heidelberg share
rose significantly at the start of May and on June 7 it
reached its highest level for the first half of the 2016 / 2017
financial year of € 2.68, equivalent to an increase of around
35 percent.
The share subsequently displayed a mixed perfor-
mance, with stock market developments being signifi-
cantly impacted in particular by geopolitical events such as
Brexit. The share price reached its highest level in the
second quarter at € 2.63 at the end of July. After the figures
for the first quarter of the current financial year were pub-
lished in early August, there was a price adjustment to
€ 2.08. A recovery then took place at the end of the second
quarter and the Heidelberg share closed the first half of the
year with a gain of around 8 percent. The heidelberg convertible bonds recorded a similar price performance
to that of the share and likewise closed above their price at
the beginning of the half-year period. In the first half of
the year, the heidelberg 2015 corporate bond contin-
uously traded at over 100 percent. The heidelberg 2011 corporate bond was repaid in full in the first quarter of
the financial year.
Heidelberg on the capital markets
Performance of the Heidelberg share
Compared to the DAX and the SDAX (index: April 1, 2016 = 0 percent)
DAX SDAX Heidelberg share
%
35
30
25
20
15
10
5
0
– 5
– 10
04.16 06.16 09.1608.1607.1605.16
3
Heidelberg on the capital markets
Interim consolidated financial statements
Interim consolidated management report
Responsibility statement Financial calendar
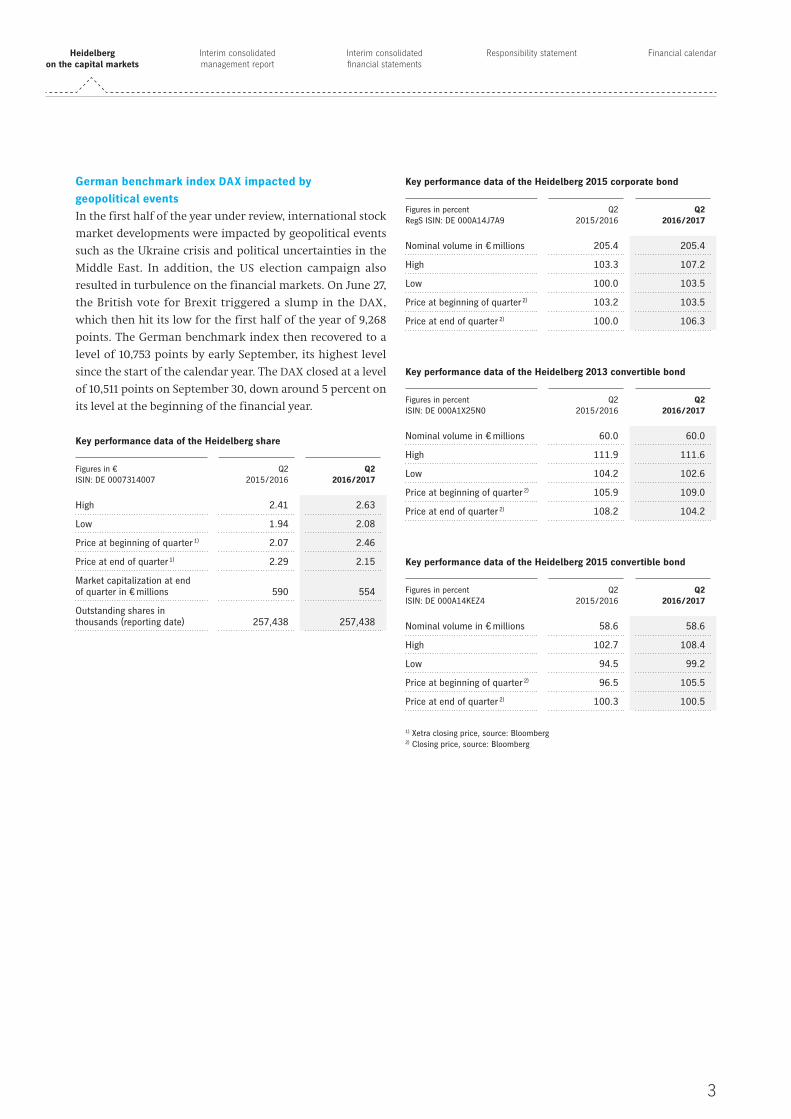
German benchmark index DAX impacted by geopolitical eventsIn the first half of the year under review, international stock
market developments were impacted by geopolitical events
such as the Ukraine crisis and political uncertainties in the
Middle East. In addition, the US election campaign also
resulted in turbulence on the financial markets. On June 27,
the British vote for Brexit triggered a slump in the DAX,
which then hit its low for the first half of the year of 9,268
points. The German benchmark index then recovered to a
level of 10,753 points by early September, its highest level
since the start of the calendar year. The DAX closed at a level
of 10,511 points on September 30, down around 5 percent on
its level at the beginning of the financial year.
Key performance data of the Heidelberg share
Figures in € ISIN: DE 0007314007
Q2 2015 / 2016
Q2 2016 / 2017
High 2.41 2.63
Low 1.94 2.08
Price at beginning of quarter 1) 2.07 2.46
Price at end of quarter 1) 2.29 2.15
Market capitalization at end of quarter in € millions 590 554
Outstanding shares in thousands (reporting date) 257,438 257,438
Key performance data of the Heidelberg 2015 corporate bond
Figures in percent RegS ISIN: DE 000A14J7A9
Q2 2015 / 2016
Q2 2016 / 2017
Nominal volume in € millions 205.4 205.4
High 103.3 107.2
Low 100.0 103.5
Price at beginning of quarter 2) 103.2 103.5
Price at end of quarter 2) 100.0 106.3
Key performance data of the Heidelberg 2013 convertible bond
Figures in percent ISIN: DE 000A1X25N0
Q2 2015 / 2016
Q2 2016 / 2017
Nominal volume in € millions 60.0 60.0
High 111.9 111.6
Low 104.2 102.6
Price at beginning of quarter 2) 105.9 109.0
Price at end of quarter 2) 108.2 104.2
Key performance data of the Heidelberg 2015 convertible bond
Figures in percent ISIN: DE 000A14KEZ4
Q2 2015 / 2016
Q2 2016 / 2017
Nominal volume in € millions 58.6 58.6
High 102.7 108.4
Low 94.5 99.2
Price at beginning of quarter 2) 96.5 105.5
Price at end of quarter 2) 100.3 100.5
1) Xetra closing price, source: Bloomberg2) Closing price, source: Bloomberg
4
Heidelberg Group
ECONOMIC REPORT
Macroeconomic andindustry-specific conditions
The global economic growth of 2.2 percent in the first half
of 2016 has remained modest up to now. While the situa-
tion in the emerging economies stabilized, economic
momentum in the advanced economies generally slowed
over the first half of the year. Uncertainties, for example
with regard to the potential negative effects of Brexit and
new concerns about the stability of banks in the euro zone,
are continuing to impact the economic development.
In the emerging economies, there are increasing signs
of an economic upturn. For example, the Chinese economy
picked up as a result of government stimulus measures,
although the pace of growth was still moderate at 6.7 per-
cent year-on-year. The same applies to the other emerging
economies in Asia. In Russia and Brazil, which had fallen
into a deep recession in the previous year, the latest indica-
tors signal an economic turning point – although there is
still the potential for setbacks.
Economic expansion in the advanced economies slowed
again somewhat in the second quarter of 2016. While in the
United States the anticipated recovery after the weak first
quarter did not materialize, production in the euro zone
and Japan increased at considerably slower rates of 0.4
percent and 0.2 percent respectively in the second quarter.
Within the euro zone, Spain and Germany presented bright
spots, while the development in France and Italy was disap-
pointing with stagnating economic growth.
The euro recovered from the Brexit shock over the
course of the summer. After trading at less than USD 1.10
immediately after the Brexit vote, the euro is now back
above USD 1.12. In relation to the Japanese yen, the euro
increased somewhat to a level of EUR / JPY 115 in August. But
with this increase the euro only recovered a small part of
the value it had lost since the beginning of the year.
In spite of many political and economic risk factors, sta-
tistics published by the German Engineering Federation
(VDMA) indicate that sales of printing presses by German
manufacturers increased by 6 percent in the period from
January to September 2016. However, a 7 percent decline in
incoming orders was recorded for the same period.
Source: Global Insight
Development of EUR / USD
October 2007 until October 2016
Oct. 07
Oct. 11
Oct. 09
Oct. 13
Oct. 08
Oct. 12
Oct. 10
Oct. 14
Oct. 15
Oct. 16
1.70
1.60
1.50
1.40
1.30
1.20
1.10
1.00
Development of EUR / JPY
October 2007 until October 2016
Source: Global Insight
Oct. 07
Oct. 11
Oct. 09
Oct. 13
Oct. 08
Oct. 12
Oct. 10
Oct. 14
Oct. 15
Oct. 16
170
150
130
110
Change in global GDP 1)
Figures in percent
* Forecast1) Data determined in accordance with the straight aggregate method
The chain-weighted method would deliver the following results: 2012: 2.6 %; 2013: 2.5 %; 2014: 2.7 %; 2015: 2.7 %; 2016: 2.4 %
Source: Global Insight (WMM); calendar year; as of September 2016
3.0
1.5
0
2.3 2.4 2.6 2.6 2.2
2012 2013 2014 2015 2016 *
5
Heidelberg on the capital markets
Interim consolidated financial statements
Interim consolidated management report
Responsibility statement Financial calendar
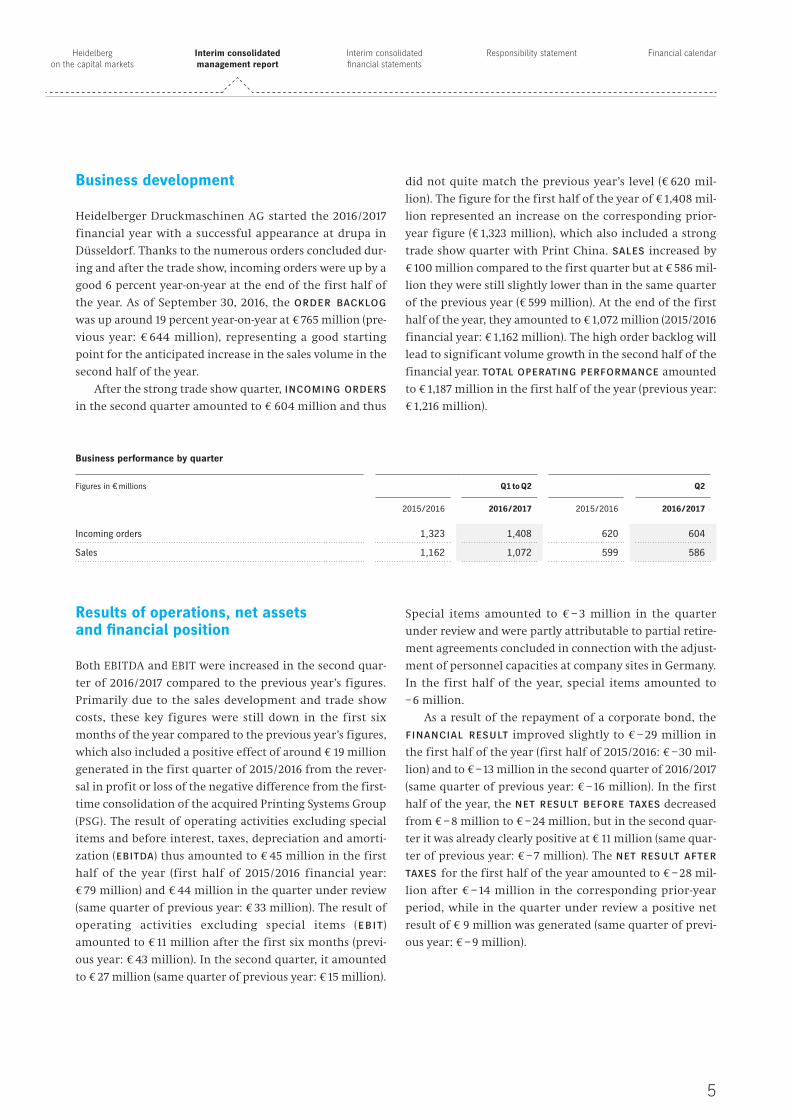
Business development
Heidelberger Druckmaschinen AG started the 2016 / 2017
financial year with a successful appearance at drupa in
Düsseldorf. Thanks to the numerous orders concluded dur-
ing and after the trade show, incoming orders were up by a
good 6 percent year-on-year at the end of the first half of
the year. As of September 30, 2016, the order backlog
was up around 19 percent year-on-year at € 765 million (pre-
vious year: € 644 million), representing a good starting
point for the anticipated increase in the sales volume in the
second half of the year.
After the strong trade show quarter, incoming orders
in the second quarter amounted to € 604 million and thus
did not quite match the previous year’s level (€ 620 mil-
lion). The figure for the first half of the year of € 1,408 mil-
lion represented an increase on the corresponding prior-
year figure (€ 1,323 million), which also included a strong
trade show quarter with Print China. sales increased by
€ 100 million compared to the first quarter but at € 586 mil-
lion they were still slightly lower than in the same quarter
of the previous year (€ 599 million). At the end of the first
half of the year, they amounted to € 1,072 million (2015 / 2016
financial year: € 1,162 million). The high order backlog will
lead to significant volume growth in the second half of the
financial year. total operating performance amounted
to € 1,187 million in the first half of the year (previous year:
€ 1,216 million).
Results of operations, net assets and financial position
Both EBITDA and EBIT were increased in the second quar-
ter of 2016 / 2017 compared to the previous year’s figures.
Primarily due to the sales development and trade show
costs, these key figures were still down in the first six
months of the year compared to the previous year’s figures,
which also included a positive effect of around € 19 million
generated in the first quarter of 2015 / 2016 from the rever-
sal in profit or loss of the negative difference from the first-
time consolidation of the acquired Printing Systems Group
(PSG). The result of operating activities excluding special
items and before interest, taxes, depreciation and amorti-
zation (ebitda) thus amounted to € 45 million in the first
half of the year (first half of 2015 / 2016 financial year:
€ 79 million) and € 44 million in the quarter under review
(same quarter of previous year: € 33 million). The result of
operating activities excluding special items (ebit)
amounted to € 11 million after the first six months (previ-
ous year: € 43 million). In the second quarter, it amounted
to € 27 million (same quarter of previous year: € 15 million).
Business performance by quarter
Figures in € millions Q1 to Q2 Q2
2015 / 2016 2016 / 2017 2015 / 2016 2016 / 2017
Incoming orders 1,323 1,408 620 604
Sales 1,162 1,072 599 586
Special items amounted to € – 3 million in the quarter
under review and were partly attributable to partial retire-
ment agreements concluded in connection with the adjust-
ment of personnel capacities at company sites in Germany.
In the first half of the year, special items amounted to
– 6 million.
As a result of the repayment of a corporate bond, the
financial result improved slightly to € – 29 million in
the first half of the year (first half of 2015 / 2016: € – 30 mil-
lion) and to € – 13 million in the second quarter of 2016 / 2017
(same quarter of previous year: € – 16 million). In the first
half of the year, the net result before taxes decreased
from € – 8 million to € – 24 million, but in the second quar-
ter it was already clearly positive at € 11 million (same quar-
ter of previous year: € – 7 million). The net result after taxes for the first half of the year amounted to € – 28 mil-
lion after € – 14 million in the corresponding prior-year
period, while in the quarter under review a positive net
result of € 9 million was generated (same quarter of previ-
ous year: € – 9 million).
6
Heidelberg Group
total assets amounted to € 2,135 million as of September
30, 2016, thereby declining compared with March 31, 2016
due to the repayment in full of the 2011 corporate bond
in the first quarter of 2016 / 2017 and hence lower financial
liabilities, as well as a further reduction in net working
capital.
On the assets side, inventories increased to € 698
million compared with March 31, 2016 (€ 607 million); this
was in line with expectations and serves to cover the higher
sales volumes that are anticipated in the coming quarters.
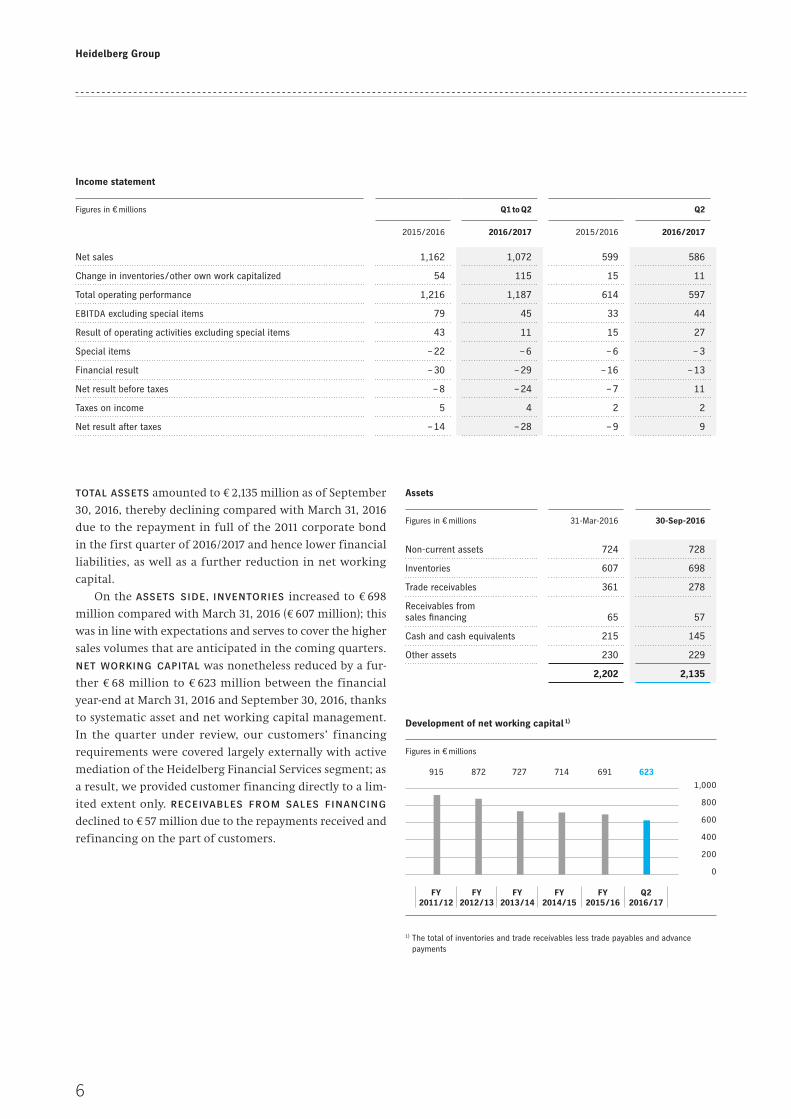
net working capital was nonetheless reduced by a fur-
ther € 68 million to € 623 million between the financial
year-end at March 31, 2016 and September 30, 2016, thanks
to systematic asset and net working capital management.
In the quarter under review, our customers’ financing
requirements were covered largely externally with active
mediation of the Heidelberg Financial Services segment; as
a result, we provided customer financing directly to a lim-
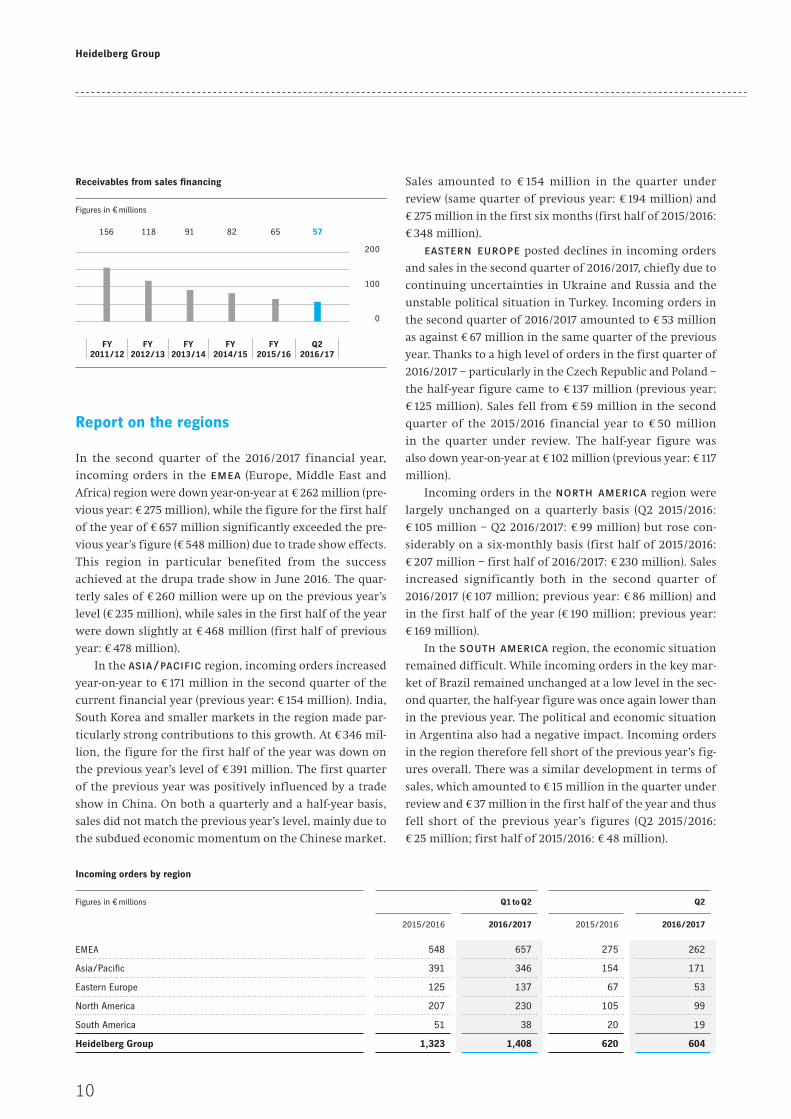
ited extent only. receivables from sales financing
declined to € 57 million due to the repayments received and
refinancing on the part of customers.
Income statement
Figures in € millions Q1 to Q2 Q2
2015 / 2016 2016 / 2017 2015 / 2016 2016 / 2017
Net sales 1,162 1,072 599 586
Change in inventories / other own work capitalized 54 115 15 11
Total operating performance 1,216 1,187 614 597
EBITDA excluding special items 79 45 33 44
Result of operating activities excluding special items 43 11 15 27
Special items – 22 – 6 – 6 – 3
Financial result – 30 – 29 – 16 – 13
Net result before taxes – 8 – 24 – 7 11
Taxes on income 5 4 2 2
Net result after taxes – 14 – 28 – 9 9
Development of net working capital 1)
Figures in € millions
915 872 727
FY 2011 / 12
FY 2012 / 13
FY 2013 / 14
FY 2014 / 15
1,000
800
600
400
200
0
714 623
FY 2015 / 16
Q2 2016 / 17
1) The total of inventories and trade receivables less trade payables and advance payments
691
Assets
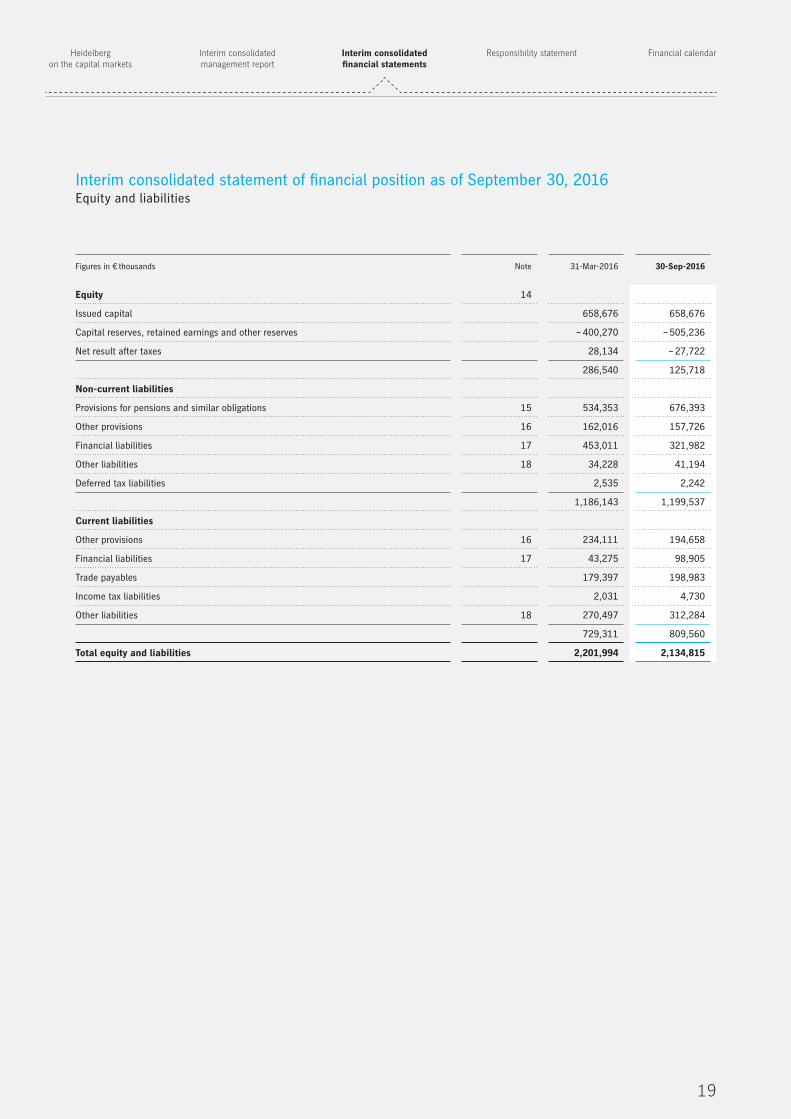
Figures in € millions 31-Mar-2016 30-Sep-2016
Non-current assets 724 728
Inventories 607 698
Trade receivables 361 278
Receivables from sales financing 65 57
Cash and cash equivalents 215 145
Other assets 230 229
2,202 2,135
7
Heidelberg on the capital markets
Interim consolidated financial statements
Interim consolidated management report
Responsibility statement Financial calendar
On the equity and liabilities side, the Heidelberg
Group’s equity decreased to € 126 million as of Septem
ber 30, 2016 in comparison to the end of the financial year
on March 31, 2016. This was primarily attributable to the
decrease in the domestic pension discount rate from 2.4
percent on March 31, 2016 to 1.7 percent on September 30,
2016. The equity ratio thus amounted to around 6 per cent
at the reporting date. Pension provisions recorded a corre
sponding increase from € 534 million at the start
of the financial year to € 676 million as of September 30,
2016, meaning that total provisions rose to € 1,029
million. As a result of the higher level of inventories, trade payables increased compared with the end of the previous
financial year (€ 179 million), amounting to € 199 million as
of September 30, 2016.
At € 276 million (March 31, 2016: € 281 million), net debt remained at a low level in the quarter under review.
Consequently, leverage (the ratio of net debt to EBITDA
excluding special items for the last four quarters)
was maintained at below the target level of 2. financial liabilities amounted to € 421 million in the quarter under
review, down significantly on the figure as of March 31,
2016 (€ 496 million) due to the repayment of a corporate
bond.
Equity and liabilities
Figures in € millions 31-Mar-2016 30-Sep-2016
Equity 287 126
Provisions 930 1,029
of which: pension provisions 534 676
Financial liabilities 496 421
Trade payables 179 199
Other equity and liabilities 310 360
2,202 2,135
The three pillars of our financing portfolio – corporate
bonds, the syndicated credit line and other instruments
such as convertible bonds – are wellbalanced. Heidelberg
currently has total credit facilities of around € 700 million
with balanced diversification and a balanced maturity
structure until 2022 and beyond. Net debt currently
amounting to € 276 million is financed by basic funding
until 2022 and beyond.
We supplement our financing with operating leases
where economically appropriate. Other offbalancesheet
financing instruments do not have any significant influ
ence on the economic position of the Group. Heidelberg
continues to have stable liquidity. Our financial framework
thus represents a solid foundation for the Company’s con
tinued strategic reorientation.
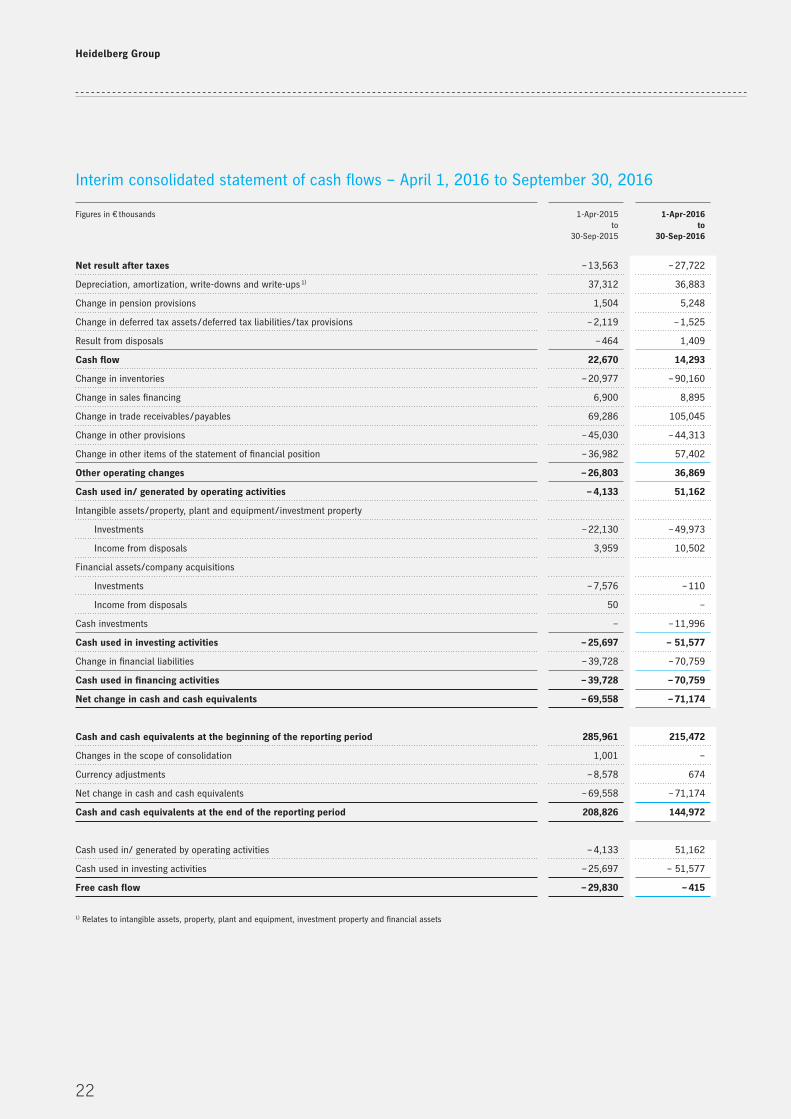
cash flow amounted to € 14 million after the first six
months of the current financial year (previous year:
€ 23 million). A net cash inflow of € 37 million was reported
in other operating changes in the first half of the year
compared with a net cash outflow of € –27 million in the
same period of the previous year. In addition to cash
inflows from the reduction of net working capital, it also
includes payments in connection with portfolio optimiza
tion measures of around € 12 million. cash used in investing activities increased to € –52 million (previous
year: € –26 million), chiefly due to a fixedincome cash
investment. Overall, free cash flow after six months was
at the breakeven point (previous year: € – 30 million).
Overview of net assets
Figures in € millions 31-Mar-2016 30-Sep-2016
Total assets 2,202 2,135
Net working capital 691 623
in percent of sales 1) 27.5 25.7
Equity 287 126
in percent of total equity and liabilities 13.0 5.9
Net debt 2) 281 276
1) Net working capital in relation to sales for the last four quarters2) Net total of financial liabilities and cash and cash equivalents and current securities
8
Heidelberg Group
Segment report
In the heidelberg equipment segment, sales in the sec-
ond quarter of the 2016 / 2017 financial year were up slightly
year-on-year at € 312 million (previous year: € 304 million),
while the sales figure for the first half of the year of € 527
million was lower than the prior-year figure of € 581 mil-
lion. After the first six months, the share of consolidated
sales attributable to the segment was just under 50 percent.
The order backlog rose to € 667 million as of September 30,
2016. The result of operating activities excluding special
Statement of cash flows of the Heidelberg Group
Figures in € millions Q1 to Q2 Q2
2015 / 2016 2016 / 2017 2015 / 2016 2016 / 2017
Net result after taxes – 14 – 28 – 9 9
Cash flow 23 14 9 31
Other operating changes – 27 37 5 8
of which: net working capital 88 70 26 13
of which: receivables from sales financing 7 9 3 5
of which: other – 122 – 42 – 23 – 10
Cash used in investing activities – 26 – 52 – 9 – 46
Free cash flow – 30 0 5 – 7
in percent of sales – 2.6 0.0 0.8 – 1.2
items and before interest, taxes, depreciation and amorti-
zation (ebitda) amounted to € 17 million in the second
quarter of the financial year after € 2 million in the same
quarter of the previous year. On a six-monthly basis,
EBITDA in the first half of the year amounted to € 3 million
after € 10 million in the first half of the 2015 / 2016 financial
year (including the positive effect from the first-time con-
solidation of PSG).
The Heidelberg Equipment segment had a total of 7,164
employees as of September 30, 2016. On a year-on-year
basis, the number of employees fell by 118.
Heidel berg Equipment
Figures in € millions Q1 to Q2 Q2
2015 / 2016 2016 / 2017 2015 / 2016 2016 / 2017
Incoming orders 743 810 340 320
Sales 581 527 304 312
Order backlog 568 667 568 667
EBITDA 1) 10 3 2 17
Result of operating activities 1) – 16 – 20 – 12 5
Employees 2) 7,282 7,164 7,282 7,164
1) Excluding special items2) At end of quarter (excluding trainees)
9
Heidelberg on the capital markets
Interim consolidated financial statements
Interim consolidated management report
Responsibility statement Financial calendar
With segment sales of € 273 million in the second quarter
(same quarter of previous year: € 294 million), the heidel-berg services segment recorded a year-on-year decline.
This was also the case with regard to the result of operating
activities excluding special items and before interest, taxes,
depreciation and amortization (ebitda) of € 27 million
(same quarter of previous year: € 31 million). EBITDA for
the first half of the year amounted to € 41 million (previous
year: € 67 million, including the positive effect from the
first-time consolidation of PSG). The share of sales attribut-
able to the segment was approximately 50 percent. The
Heidelberg Services segment had a total of 4,314 employees
as of September 30, 2016.
Our strategy of primarily mediating customer financing to
our external partners is accompanied by a reduction in the
volume directly financed by us. Receivables from sales
financing declined by € 12 million compared with the pre-
vious year to € 57 million as of September 30, 2016. The
decrease in the customer financing portfolio is reflected
Heidel berg Services
Figures in € millions Q1 to Q2 Q2
2015 / 2016 2016 / 2017 2015 / 2016 2016 / 2017
Incoming orders 577 596 279 283
Sales 578 543 294 273
Order backlog 76 98 76 98
EBITDA 1) 67 41 31 27
Result of operating activities 1) 57 32 27 22
Employees 2) 4,429 4,314 4,429 4,314
1) Excluding special items2) At end of quarter (excluding trainees)
in a break-even result (€ 0 million) of operating activities
excluding special items and before interest, taxes, depreci-
ation and amortization (ebitda) for the heidelberg financial services segment both in the second quarter
and in the first half of the year.
Heidel berg Financial Services
Figures in € millions Q1 to Q2 Q2
2015 / 2016 2016 / 2017 2015 / 2016 2016 / 2017
Sales 3 2 1 1
EBITDA 1) 2 0 0 0
Result of operating activities 1) 2 0 0 0
Employees 2) 42 41 42 41
1) Excluding special items2) At end of quarter (excluding trainees)
10
Heidelberg Group
Employees
In the second quarter of the 2016 / 2017 financial year, the
number of employees in the Heidelberg Group decreased
slightly. As of September 30, 2016, the Heidelberg Group
had a total of 11,519 employees (excluding 393 trainees), 46
fewer than on March 31, 2016. The number of employees
decreased by 234 compared with one year previously (Sep-
tember 30, 2015: 11,753 employees).
Incoming orders by region
Figures in € millions Q1 to Q2 Q2
2015 / 2016 2016 / 2017 2015 / 2016 2016 / 2017
EMEA 548 657 275 262
Asia / Pacific 391 346 154 171
Eastern Europe 125 137 67 53
North America 207 230 105 99
South America 51 38 20 19
Heidelberg Group 1,323 1,408 620 604
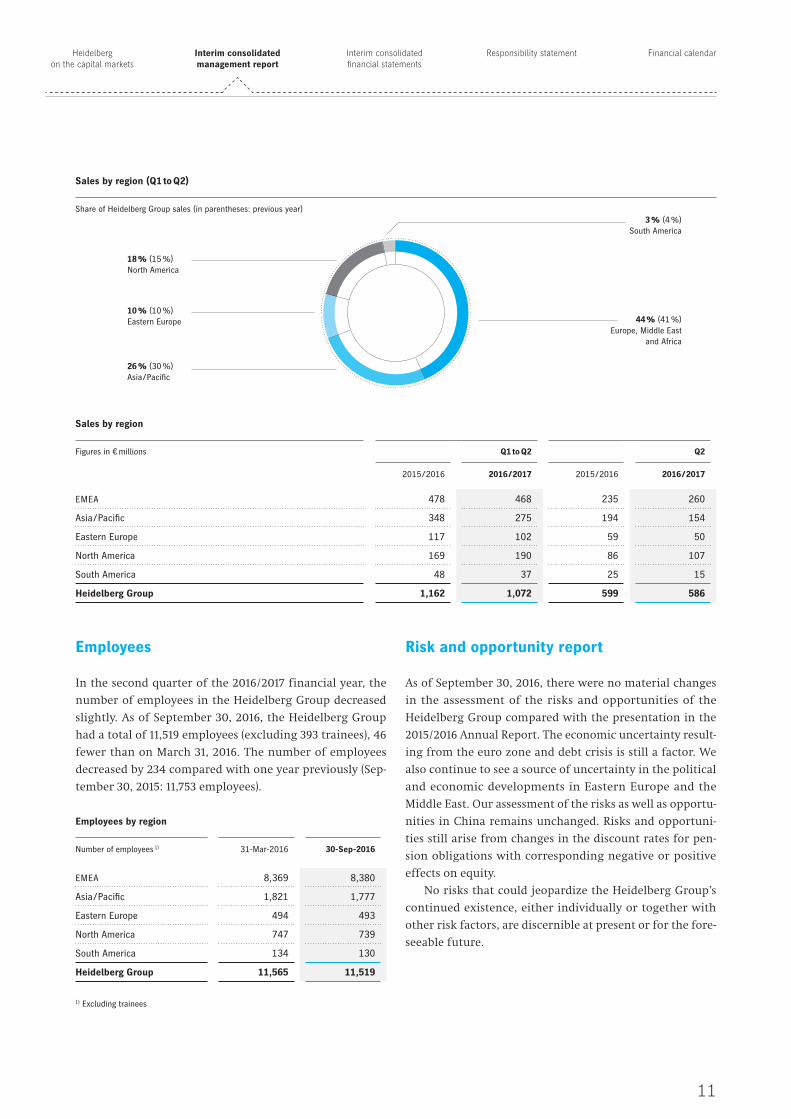
Sales by region
Figures in € millions Q1 to Q2 Q2
2015 / 2016 2016 / 2017 2015 / 2016 2016 / 2017
EMEA 478 468 235 260
Asia / Pacific 348 275 194 154
Eastern Europe 117 102 59 50
North America 169 190 86 107
South America 48 37 25 15
Heidelberg Group 1,162 1,072 599 586
Employees by region
Number of employees excluding trainees
31-Mar-2016 30-Sep-2016
EMEA 8,369 8,380
Asia / Pacific 1,821 1,777
Eastern Europe 494 493
North America 747 739
South America 134 130
Heidel berg Group 11,565 11,519
Receivables from sales financing
Figures in € millions
156 118 91
200
100
0
82 57
FY 2011 / 12
FY 2012 / 13
FY 2013 / 14
FY 2014 / 15
FY 2015 / 16
Q2 2016 / 17
65
Report on the regions
In the second quarter of the 2016 / 2017 financial year,
incoming orders in the emea (Europe, Middle East and
Africa) region were down year-on-year at € 262 million (pre-
vious year: € 275 million), while the figure for the first half
of the year of € 657 million significantly exceeded the pre-
vious year’s figure (€ 548 million) due to trade show effects.
This region in particular benefited from the success
achieved at the drupa trade show in June 2016. The quar-
terly sales of € 260 million were up on the previous year’s
level (€ 235 million), while sales in the first half of the year
were down slightly at € 468 million (first half of previous
year: € 478 million).
In the asia / pacific region, incoming orders increased
year-on-year to € 171 million in the second quarter of the
current financial year (previous year: € 154 million). India,
South Korea and smaller markets in the region made par-
ticularly strong contributions to this growth. At € 346 mil-
lion, the figure for the first half of the year was down on
the previous year’s level of € 391 million. The first quarter
of the previous year was positively influenced by a trade
show in China. On both a quarterly and a half-year basis,
sales did not match the previous year’s level, mainly due to
the subdued economic momentum on the Chinese market.
Sales amounted to € 154 million in the quarter under
review (same quarter of previous year: € 194 million) and
€ 275 million in the first six months (first half of 2015 / 2016:
€ 348 million).
eastern europe posted declines in incoming orders
and sales in the second quarter of 2016 / 2017, chiefly due to
continuing uncertainties in Ukraine and Russia and the
unstable political situation in Turkey. Incoming orders in
the second quarter of 2016 / 2017 amounted to € 53 million
as against € 67 million in the same quarter of the previous
year. Thanks to a high level of orders in the first quarter of
2016 / 2017 – particularly in the Czech Republic and Poland –
the half-year figure came to € 137 million (previous year:
€ 125 million). Sales fell from € 59 million in the second
quarter of the 2015 / 2016 financial year to € 50 million
in the quarter under review. The half-year figure was
also down year-on-year at € 102 million (previous year: € 117
million).
Incoming orders in the north america region were
largely unchanged on a quarterly basis (Q2 2015 / 2016:
€ 105 million – Q2 2016 / 2017: € 99 million) but rose con-
siderably on a six-monthly basis (first half of 2015 / 2016:
€ 207 million – first half of 2016 / 2017: € 230 million). Sales
increased significantly both in the second quarter of
2016 / 2017 (€ 107 million; previous year: € 86 million) and
in the first half of the year (€ 190 million; previous year:
€ 169 million).
In the south america region, the economic situation
remained difficult. While incoming orders in the key mar-
ket of Brazil remained unchanged at a low level in the sec-
ond quarter, the half-year figure was once again lower than
in the previous year. The political and economic situation
in Argentina also had a negative impact. Incoming orders
in the region therefore fell short of the previous year’s fig-
ures overall. There was a similar development in terms of
sales, which amounted to € 15 million in the quarter under
review and € 37 million in the first half of the year and thus
fell short of the previous year’s figures (Q2 2015 / 2016:
€ 25 million; first half of 2015 / 2016: € 48 million).
11
Heidelberg on the capital markets
Interim consolidated financial statements
Interim consolidated management report
Responsibility statement Financial calendar
Employees
In the second quarter of the 2016 / 2017 financial year, the
number of employees in the Heidelberg Group decreased
slightly. As of September 30, 2016, the Heidelberg Group
had a total of 11,519 employees (excluding 393 trainees), 46
fewer than on March 31, 2016. The number of employees
decreased by 234 compared with one year previously (Sep-
tember 30, 2015: 11,753 employees).
Incoming orders by region
Figures in € millions Q1 to Q2 Q2
2015 / 2016 2016 / 2017 2015 / 2016 2016 / 2017
EMEA 548 657 275 262
Asia / Pacific 391 346 154 171
Eastern Europe 125 137 67 53
North America 207 230 105 99
South America 51 38 20 19
Heidelberg Group 1,323 1,408 620 604
Sales by region
Figures in € millions Q1 to Q2 Q2
2015 / 2016 2016 / 2017 2015 / 2016 2016 / 2017
EMEA 478 468 235 260
Asia / Pacific 348 275 194 154
Eastern Europe 117 102 59 50
North America 169 190 86 107
South America 48 37 25 15
Heidelberg Group 1,162 1,072 599 586
Employees by region
Number of employees 1) 31-Mar-2016 30-Sep-2016
EMEA 8,369 8,380
Asia / Pacific 1,821 1,777
Eastern Europe 494 493
North America 747 739
South America 134 130
Heidel berg Group 11,565 11,519
1) Excluding trainees
Sales by region (Q1 to Q2)
Share of Heidel berg Group sales (in parentheses: previous year)
Risk and opportunity report
As of September 30, 2016, there were no material changes
in the assessment of the risks and opportunities of the
Heidelberg Group compared with the presentation in the
2015 / 2016 Annual Report. The economic uncertainty result-
ing from the euro zone and debt crisis is still a factor. We
also continue to see a source of uncertainty in the political
and economic developments in Eastern Europe and the
Middle East. Our assessment of the risks as well as opportu-
nities in China remains unchanged. Risks and opportuni-
ties still arise from changes in the discount rates for pen-
sion obligations with corresponding negative or positive
effects on equity.
No risks that could jeopardize the Heidelberg Group’s
continued existence, either individually or together with
other risk factors, are discernible at present or for the fore-
seeable future.
44 % (41 %)Europe, Middle East
and Africa
3 % (4 %)South America
18 % (15 %)North America
10 % (10 %)Eastern Europe
26 % (30 %)Asia / Pacific
12
Heidelberg Group
Future prospects
The development of global printing volumes is assumed to
be stable and is expected to increase moving ahead thanks
to the growth in the emerging nations, although media
consumption and structures within the printing industry
will continue to change in the industrialized nations. How-
ever, the investment behavior of the majority of our cus-
tomers is also influenced by country-specific and general
economic developments. The effects on the Heidelberg
Equipment segment are generally considerably more pro-
nounced and more direct than on the Heidelberg Services
segment, which is less cyclical in nature. Owing to the eco-
nomic risks and the ongoing consolidation of print shops
in some industrialized nations, we are not anticipating an
increase in the market volume for new sheetfed offset
presses in the coming years. Accordingly, we have adjusted
the structures here, further reduced production costs and
will optimize this area continuously. At the same time, we
have geared our portfolio towards profitability and further
expanded the growth areas Services and Digital in the past
financial year.
Our portfolio expansions in rapidly developing mar-
kets, possible acquisitions and the drupa industry trade
show will substantially affect sales performance in the
financial year 2016 / 2017 and the years ahead. Our invest-
ment priorities in the areas of digitalization, digital print-
ing and services are expected to contribute to average sales
growth of up to 4 percent per year. We are assuming that
this growth target will be achieved in the current financial
year 2016 / 2017 with the positive effects of the drupa trade
show.
The accelerated expansion of digital and service busi-
ness will continue to be the focus of portfolio alignment
and will further increase profitability in the medium term.
Given the associated inputs, the EBITDA margin before spe-
cial items is expected to initially remain at the level of the
previous year in the current financial year 2016 / 2017. The
Heidelberg Equipment segment is expected to contribute
to this result within a range of 4 to 6 percent, and the
Heidelberg Services segment between 9 and 11 percent. In
the Heidelberg Financial Services segment, we will primar-
ily continue to externalize retail financing and so keep the
volume low. It should continue to provide a positive
EBITDA contribution.
Based on the reorganization of Heidelberg and the fur-
ther implementation of all strategic measures, we intend
to establish a solid profitability level with an EBITDA mar-
gin for the Group as a whole of between 7 and 10 percent
in the following years.
Sustained positive result after taxes and leverage < 2 Thanks to the continuous optimization of our financing
framework, the financing costs are to be reduced further
in the financial year 2016 / 2017, thus improving the finan-
cial result. With this, Heidelberg is aiming for a moderate
increase in its net result after taxes in the financial year
2016 / 2017. Due to the profitability level achieved and
reduced financing costs, this should improve further in the
years that follow.
On the basis of the stable and long-term financial
framework and the further increase in profitability, we
have already reduced leverage to significantly below the
target still in place of 2. We therefore have the financial
flexibility to finance acquisitions and continue the strate-
gic development of Heidelberg.
Supplementary report
On October 27, 2016, the Supervisory Board of Heidelberger
Druckmaschinen Aktiengesellschaft appointed Rainer
Hundsdörfer as the new CEO and Chief Human Resources
Officer and Dr. Ulrich Hermann as a regular member of
the company’s Management Board with effect from Novem-
ber 14, 2016.
CEO Dr. Gerold Linzbach and Management Board mem-
ber Harald Weimer, responsible for the Heidelberg Services
segment, will be stepping down at their own request as of
Novem ber 13, 2016.
Important note This interim financial report contains forward-looking statements based on assumptions and estimates by the management of Heidelberger Druckmaschinen Aktiengesellschaft. Although the Management Board is of the opinion that these assumptions and estima-tions are realistic, actual future developments and results may deviate substantially from these forward-looking statements due to various factors. These factors could, for instance, include changes in the overall economic situation, exchange rates and inter-est rates, as well as changes within the print media industry. Heidelberger Druck-ma schinen Aktiengesellschaft provides no guarantee and assumes no liability for future development and results deviating from the assumptions and estimates made in this interim financial report. Heidelberg neither intends nor assumes any obligation to update the assumptions and estimates made in this interim financial report to reflect events or developments occurring after the publication of this interim report.
13
Interim consolidated financial statements for the period April 1, 2016 to September 30, 2016
Interim consolidated income statement – April 1, 2016 to September 30, 2016 14
Interim consolidated statement of comprehensive income – April 1, 2016 to September 30, 2016 15
Interim consolidated income statement – July 1, 2016 to September 30, 2016 16
Interim consolidated statement of comprehensive income – July 1, 2016 to September 30, 2016 17
Interim consolidated statement of financial position 18
Statement of changes in consolidated equity 20
Interim consolidated statement of cash flows 22
Notes 23
Responsibility statement 32
Financial calendar 33
Publishing information 33

14
Heidelberg Group
Interim consolidated income statement – April 1, 2016 to September 30, 2016
Figures in € thousands Note 1-Apr-2015to
30-Sep-2015
1-Apr-2016to
30-Sep-2016
Net sales 1,161,636 1,072,019
Change in inventories 46,501 82,710
Other own work capitalized 7,416 32,529
Total operating performance 1,215,553 1,187,258
Other operating income 3 55,732 42,679
Cost of materials 4 585,743 547,318
Staff costs 394,223 421,426
Depreciation and amortization 36,273 34,074
Other operating expenses 5 211,859 216,103
Special items 6 21,584 6,076
Result of operating activities 21,603 4,940
Financial income 7 4,684 3,390
Financial expenses 8 34,578 32,483
Financial result – 29,894 – 29,093
Net result before taxes – 8,291 – 24,153
Taxes on income 5,272 3,569
Net result after taxes – 13,563 – 27,722
Basic earnings per share according to IAS 33 (in € per share) 9 – 0.05 – 0.11
Diluted earnings per share according to IAS 33 (in € per share) 9 – 0.05 – 0.11
15
Heidelberg on the capital markets
Interim consolidated financial statements
Interim consolidated management report
Responsibility statement Financial calendar
Interim consolidated statement of comprehensive income – April 1, 2016 to September 30, 2016
Figures in € thousands 1-Apr-2015to
30-Sep-2015
1-Apr-2016to
30-Sep-2016
Net result after taxes – 13,563 – 27,722
Other comprehensive income not reclassified to the income statement
Remeasurement of defined benefit pension plans and similar obligations 138,656 – 136,648
Deferred income taxes 1,380 4,544
140,036 – 132,104
Other comprehensive income which may subsequently be reclassified to the income statement
Currency translation – 28,444 639
Available-for-sale financial assets – 83 14
Cash flow hedges 12,967 – 1,862
Deferred income taxes – 219 390
– 15,779 – 819
Total other comprehensive income 124,257 – 132,923
Total comprehensive income 110,694 – 160,645
16
Heidelberg Group
Interim consolidated income statement – July 1, 2016 to September 30, 2016
Figures in € thousands 1-Jul-2015to
30-Sep-2015
1-Jul-2016to
30-Sep-2016
Net sales 598,533 586,169
Change in inventories 11,142 – 5,928
Other own work capitalized 3,484 16,985
Total operating performance 613,159 597,226
Other operating income 19,634 24,171
Cost of materials 298,633 258,932
Staff costs 197,768 202,883
Depreciation and amortization 18,375 17,163
Other operating expenses 103,005 115,329
Special items 6,243 3,191
Result of operating activities 8,769 23,899
Financial income 1,736 571
Financial expenses 17,391 13,349
Financial result – 15,655 – 12,778
Net result before taxes – 6,886 11,121
Taxes on income 2,555 1,946
Net result after taxes – 9,441 9,175
Basic earnings per share according to IAS 33 (in € per share) – 0.03 0.03
Diluted earnings per share according to IAS 33 (in € per share) – 0.03 0.03
17
Heidelberg on the capital markets
Interim consolidated financial statements
Interim consolidated management report
Responsibility statement Financial calendar
Interim consolidated statement of comprehensive income – July 1, 2016 to September 30, 2016
Figures in € thousands 1-Jul-2015to
30-Sep-2015
1-Jul-2016to
30-Sep-2016
Net result after taxes – 9,441 9,175
Other comprehensive income not reclassified to the income statement
Remeasurement of defined benefit pension plans and similar obligations – 22,962 – 49,605
Deferred income taxes 2,796 – 64
– 20,166 – 49,669
Other comprehensive income which may subsequently be reclassified to the income statement
Currency translation – 15,381 – 1,982
Available-for-sale financial assets – 191 – 130
Cash flow hedges 2,708 1,684
Deferred income taxes 31 – 129
– 12,833 – 557
Total other comprehensive income – 32,999 – 50,226
Total comprehensive income – 42,440 – 41,051
18
Heidelberg Group
Interim consolidated statement of financial position as of September 30, 2016Assets
Figures in € thousands Note 31-Mar-2016 30-Sep-2016
Non-current assets
Intangible assets 10 221,637 231,036
Property, plant and equipment 10 478,119 472,190
Investment property 11,202 11,029
Financial assets 12,584 13,472
Receivables from sales financing 34,489 30,658
Other receivables and other assets 12 17,824 34,814
Deferred tax assets 85,409 90,127
861,264 883,326
Current assets
Inventories 11 606,872 698,190
Receivables from sales financing 30,110 25,879
Trade receivables 360,959 278,452
Other receivables and other assets 12 113,950 96,130
Income tax assets 7,662 7,184
Cash and cash equivalents 13 215,472 144,972
1,335,025 1,250,807
Assets held for sale 5,705 682
Total assets 2,201,994 2,134,815
19
Heidelberg on the capital markets
Interim consolidated financial statements
Interim consolidated management report
Responsibility statement Financial calendar
Interim consolidated statement of financial position as of September 30, 2016Equity and liabilities
Figures in € thousands Note 31-Mar-2016 30-Sep-2016
Equity 14
Issued capital 658,676 658,676
Capital reserves, retained earnings and other reserves – 400,270 – 505,236
Net result after taxes 28,134 – 27,722
286,540 125,718
Non-current liabilities
Provisions for pensions and similar obligations 15 534,353 676,393
Other provisions 16 162,016 157,726
Financial liabilities 17 453,011 321,982
Other liabilities 18 34,228 41,194
Deferred tax liabilities 2,535 2,242
1,186,143 1,199,537
Current liabilities
Other provisions 16 234,111 194,658
Financial liabilities 17 43,275 98,905
Trade payables 179,397 198,983
Income tax liabilities 2,031 4,730
Other liabilities 18 270,497 312,284
729,311 809,560
Total equity and liabilities 2,201,994 2,134,815
20
Heidelberg Group
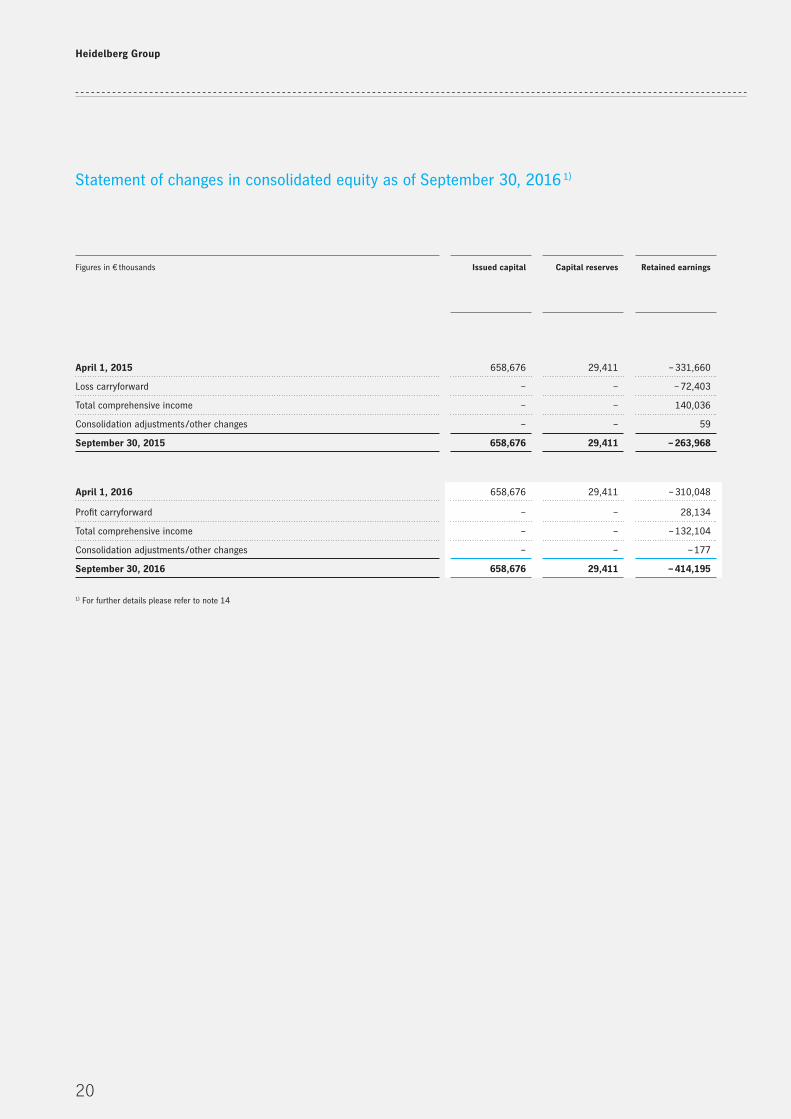
Statement of changes in consolidated equity as of September 30, 2016 1)
Figures in € thousands Issued capital Capital reserves Retained earnings Other retained earnings Total other retained earnings
Total capital reserves, retained
earnings and other retained earnings
Net resultafter taxes
Total
Currency translation
Fair value of other financial assets
Fair value of cash flow hedges
April 1, 2015 658,676 29,411 – 331,660 – 87,537 – 360 – 12,653 – 100,550 – 402,799 – 72,403 183,474
Loss carryforward – – – 72,403 – – – – – 72,403 72,403 0
Total comprehensive income – – 140,036 – 28,444 – 83 12,748 – 15,779 124,257 – 13,563 110,694
Consolidation adjustments /other changes – – 59 – – – – 59 – 59
September 30, 2015 658,676 29,411 – 263,968 – 115,981 – 443 95 – 116,329 – 350,886 – 13,563 294,227
April 1, 2016 658,676 29,411 – 310,048 – 121,358 – 803 2,528 – 119,633 – 400,270 28,134 286,540
Profit carryforward – – 28,134 – – – – 28,134 – 28,134 0
Total comprehensive income – – – 132,104 639 960 – 2,418 – 819 – 132,923 – 27,722 – 160,645
Consolidation adjustments /other changes – – – 177 – – – – – 177 – – 177
September 30, 2016 658,676 29,411 – 414,195 – 120,719 157 110 – 120,452 – 505,236 – 27,722 125,718
1) For further details please refer to note 14
21
Heidelberg on the capital markets
Interim consolidated financial statements
Interim consolidated management report
Responsibility statement Financial calendar
Figures in € thousands Issued capital Capital reserves Retained earnings Other retained earnings Total other retained earnings
Total capital reserves, retained
earnings and other retained earnings
Net resultafter taxes
Total
Currency translation
Fair value of other financial assets
Fair value of cash flow hedges
April 1, 2015 658,676 29,411 – 331,660 – 87,537 – 360 – 12,653 – 100,550 – 402,799 – 72,403 183,474
Loss carryforward – – – 72,403 – – – – – 72,403 72,403 0
Total comprehensive income – – 140,036 – 28,444 – 83 12,748 – 15,779 124,257 – 13,563 110,694
Consolidation adjustments /other changes – – 59 – – – – 59 – 59
September 30, 2015 658,676 29,411 – 263,968 – 115,981 – 443 95 – 116,329 – 350,886 – 13,563 294,227
April 1, 2016 658,676 29,411 – 310,048 – 121,358 – 803 2,528 – 119,633 – 400,270 28,134 286,540
Profit carryforward – – 28,134 – – – – 28,134 – 28,134 0
Total comprehensive income – – – 132,104 639 960 – 2,418 – 819 – 132,923 – 27,722 – 160,645
Consolidation adjustments /other changes – – – 177 – – – – – 177 – – 177
September 30, 2016 658,676 29,411 – 414,195 – 120,719 157 110 – 120,452 – 505,236 – 27,722 125,718
1) For further details please refer to note 14
22
Heidelberg Group
Interim consolidated statement of cash flows – April 1, 2016 to September 30, 2016
Figures in € thousands 1-Apr-2015to
30-Sep-2015
1-Apr-2016to
30-Sep-2016
Net result after taxes – 13,563 – 27,722
Depreciation, amortization, write-downs and write-ups 1) 37,312 36,883
Change in pension provisions 1,504 5,248
Change in deferred tax assets / deferred tax liabilities / tax provisions – 2,119 – 1,525
Result from disposals – 464 1,409
Cash flow 22,670 14,293
Change in inventories – 20,977 – 90,160
Change in sales financing 6,900 8,895
Change in trade receivables / payables 69,286 105,045
Change in other provisions – 45,030 – 44,313
Change in other items of the statement of financial position – 36,982 57,402
Other operating changes – 26,803 36,869
Cash used in/ generated by operating activities – 4,133 51,162
Intangible assets / property, plant and equipment / investment property
Investments – 22,130 – 49,973
Income from disposals 3,959 10,502
Financial assets/company acquisitions
Investments – 7,576 – 110
Income from disposals 50 –
Cash investments – – 11,996
Cash used in investing activities – 25,697 – 51,577
Change in financial liabilities – 39,728 – 70,759
Cash used in financing activities – 39,728 – 70,759
Net change in cash and cash equivalents – 69,558 – 71,174
Cash and cash equivalents at the beginning of the reporting period 285,961 215,472
Changes in the scope of consolidation 1,001 –
Currency adjustments – 8,578 674
Net change in cash and cash equivalents – 69,558 – 71,174
Cash and cash equivalents at the end of the reporting period 208,826 144,972
Cash used in/ generated by operating activities – 4,133 51,162
Cash used in investing activities – 25,697 – 51,577
Free cash flow – 29,830 – 415
1) Relates to intangible assets, property, plant and equipment, investment property and financial assets
23
Heidelberg on the capital markets
Interim consolidated financial statements
Interim consolidated management report
Responsibility statement Financial calendar
the consolidated financial statements for the 2015 / 2016
financial year. In accordance with the regulations of IAS 34,
a condensed scope of reporting was chosen as against the
consolidated financial statements as of March 31, 2016. All
amounts are generally stated in € thousands.
The International Accounting Standards Board (IASB)
and the IFRS Interpretations Committee (IFRS IC) have
approved the following changes to existing standards,
which are to be applied for the first time in financial year
2016 / 2017.
Scope of consolidation
The interim consolidated financial statements of Heidel
berger Druckmaschinen Aktiengesellschaft include a total
of 70 (March 31, 2016: 73) domestic and foreign companies
in which Heidelberger Druckmaschinen Aktiengesellschaft
has a controlling influence as defined by IFRS 10. Of these,
61 (March 31, 2016: 62) are located outside Germany. Subsid
iaries that are of minor importance are not included.
2
Notes
Accounting policies
The interim consolidated financial statements as of Sep
tember 30, 2016 are consistent with and were prepared in
line with the regulations of IAS 34 (Interim Financial
Reporting). They should be read in conjunction with the
consolidated financial statements as of March 31, 2016,
which were prepared in line with the International Finan
cial Reporting Standards (IFRS) as endorsed in the EU.
The interim consolidated financial statements were
generally prepared using the same accounting policies as
1
Traditionally, Heidelberg generates more sales in the sec
ond half of the financial year than in the first. Income that
is generated due to seasonal reasons, economic reasons, or
only occasionally within the financial year is not brought
forward or deferred in the interim consolidated financial
statements. Expenses that are incurred irregularly during
the financial year are deferred in cases in which they would
also be deferred at the end of the financial year.
This interim financial report has neither been audited
in accordance with Section 317 of the German Commercial
Code (HGB) nor reviewed by the auditors.
Standards Publicationby theIASB / IFRS IC
Effective date 1) Published in theOfficial Journalof the EU
Effects
Amendments to standards
Amendments to IAS 1: Disclosure Initiative 18-Dec-2014 1-Jan-2016 19-Dec-2015 No material effects
Amendments to IAS 16: Property, Plant and Equipment and IAS 38: Intangible Assets: Clarification of Acceptable Methods of Depreciation and Amortization
12-May-2014 1-Jan-2016 3-Dec-2015 None
Amendments to IAS 16 and IAS 41: Agriculture: Bearer Plants
30-Jun-2014 1-Jan-2016 24-Nov-2015 None
Amendments to IAS 27: Equity Method in Separate Financial Statements
12-Aug-2014 1-Jan-2016 23-Dec-2015 None
Amendments to IFRS 10, IFRS 12 and IAS 28: Investment Entities: Applying the Consolidation Exemption
18-Dec-2014 1-Jan-2016 23-Sep-2016 None
Amendments to IFRS 11: Joint Arrangements: Accounting for Acquisitions of Interests in Joint Operations
6-May-2014 1-Jan-2016 25-Nov-2015 None
Annual Improvements to IFRSs 2012 – 2014 Cycle 25-Sep-2014 1-Jan-2016 16-Dec-2015 No material effects
1) For financial years beginning on or after this date
24
Heidelberg Group
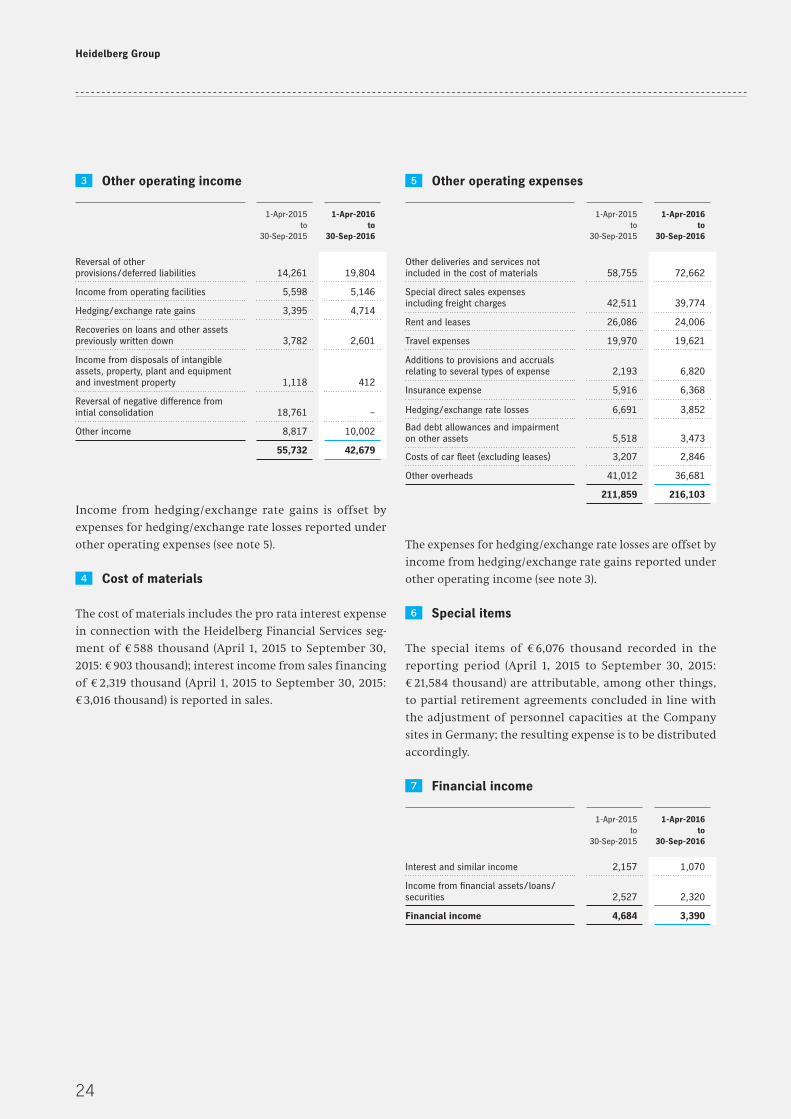
Other operating expenses
The expenses for hedging / exchange rate losses are offset by
income from hedging / exchange rate gains reported under
other operating income (see note 3).
Special items
The special items of € 6,076 thousand recorded in the
reporting period (April 1, 2015 to September 30, 2015:
€ 21,584 thousand) are attributable, among other things,
to partial retirement agreements concluded in line with
the adjustment of personnel capacities at the Company
sites in Germany; the resulting expense is to be distributed
accordingly.
Financial income
5
1-Apr-2015to
30-Sep-2015
1-Apr-2016to
30-Sep-2016
Other deliveries and services not included in the cost of materials 58,755 72,662
Special direct sales expenses including freight charges 42,511 39,774
Rent and leases 26,086 24,006
Travel expenses 19,970 19,621
Additions to provisions and accruals relating to several types of expense 2,193 6,820
Insurance expense 5,916 6,368
Hedging / exchange rate losses 6,691 3,852
Bad debt allowances and impairment on other assets 5,518 3,473
Costs of car fleet (excluding leases) 3,207 2,846
Other overheads 41,012 36,681
211,859 216,103
6
7
1-Apr-2015to
30-Sep-2015
1-Apr-2016to
30-Sep-2016
Interest and similar income 2,157 1,070
Income from financial assets / loans / securities 2,527 2,320
Financial income 4,684 3,390
Other operating income
Income from hedging / exchange rate gains is offset by
expenses for hedging / exchange rate losses reported under
other operating expenses (see note 5).
Cost of materials
The cost of materials includes the pro rata interest expense
in connection with the Heidelberg Financial Services seg
ment of € 588 thousand (April 1, 2015 to September 30,
2015: € 903 thousand); interest income from sales financing
of € 2,319 thousand (April 1, 2015 to September 30, 2015:
€ 3,016 thousand) is reported in sales.
3
1-Apr-2015to
30-Sep-2015
1-Apr-2016to
30-Sep-2016
Reversal of other provisions / deferred liabilities 14,261 19,804
Income from operating facilities 5,598 5,146
Hedging / exchange rate gains 3,395 4,714
Recoveries on loans and other assets previously written down 3,782 2,601
Income from disposals of intangible assets, property, plant and equipment and investment property 1,118 412
Reversal of negative difference from intial consolidation 18,761 –
Other income 8,817 10,002
55,732 42,679
4
25
Heidelberg on the capital markets
Interim consolidated financial statements
Interim consolidated management report
Responsibility statement Financial calendar
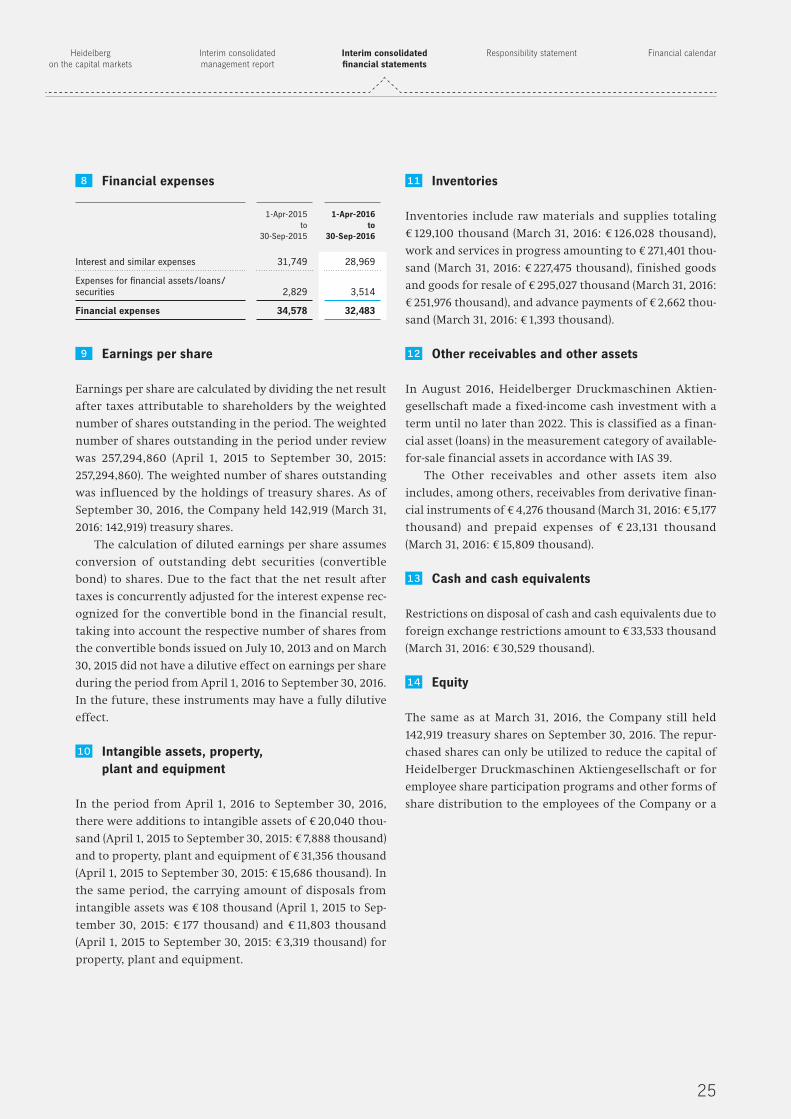
Financial expenses
Earnings per share
Earnings per share are calculated by dividing the net result
after taxes attributable to shareholders by the weighted
number of shares outstanding in the period. The weighted
number of shares outstanding in the period under review
was 257,294,860 (April 1, 2015 to September 30, 2015:
257,294,860). The weighted number of shares outstanding
was influenced by the holdings of treasury shares. As of
September 30, 2016, the Company held 142,919 (March 31,
2016: 142,919) treasury shares.
The calculation of diluted earnings per share assumes
conversion of outstanding debt securities (convertible
bond) to shares. Due to the fact that the net result after
taxes is concurrently adjusted for the interest expense rec
ognized for the convertible bond in the financial result,
taking into account the respective number of shares from
the convertible bonds issued on July 10, 2013 and on March
30, 2015 did not have a dilutive effect on earnings per share
during the period from April 1, 2016 to September 30, 2016.
In the future, these instruments may have a fully dilutive
effect.
Intangible assets, property, plant and equipment
In the period from April 1, 2016 to September 30, 2016,
there were additions to intangible assets of € 20,040 thou
sand (April 1, 2015 to September 30, 2015: € 7,888 thousand)
and to property, plant and equipment of € 31,356 thousand
(April 1, 2015 to September 30, 2015: € 15,686 thousand). In
the same period, the carrying amount of disposals from
intangible assets was € 108 thousand (April 1, 2015 to Sep
tember 30, 2015: € 177 thousand) and € 11,803 thousand
(April 1, 2015 to September 30, 2015: € 3,319 thousand) for
property, plant and equipment.
8
1-Apr-2015to
30-Sep-2015
1-Apr-2016to
30-Sep-2016
Interest and similar expenses 31,749 28,969
Expenses for financial assets / loans / securities 2,829 3,514
Financial expenses 34,578 32,483
9
10
Inventories
Inventories include raw materials and supplies totaling
€ 129,100 thousand (March 31, 2016: € 126,028 thousand),
work and services in progress amounting to € 271,401 thou
sand (March 31, 2016: € 227,475 thousand), finished goods
and goods for resale of € 295,027 thousand (March 31, 2016:
€ 251,976 thousand), and advance payments of € 2,662 thou
sand (March 31, 2016: € 1,393 thousand).
Other receivables and other assets
In August 2016, Heidelberger Druckmaschinen Aktien
gesellschaft made a fixedincome cash investment with a
term until no later than 2022. This is classified as a finan
cial asset (loans) in the measurement category of available
forsale financial assets in accordance with IAS 39.
The Other receivables and other assets item also
includes, among others, receivables from derivative finan
cial instruments of € 4,276 thousand (March 31, 2016: € 5,177
thousand) and prepaid expenses of € 23,131 thousand
(March 31, 2016: € 15,809 thousand).
Cash and cash equivalents
Restrictions on disposal of cash and cash equivalents due to
foreign exchange restrictions amount to € 33,533 thousand
(March 31, 2016: € 30,529 thousand).
Equity
The same as at March 31, 2016, the Company still held
142,919 treasury shares on September 30, 2016. The repur
chased shares can only be utilized to reduce the capital of
Heidelberger Druckmaschinen Aktiengesellschaft or for
employee share participation programs and other forms of
share distribution to the employees of the Company or a
11
12
13
14
26
Heidelberg Group
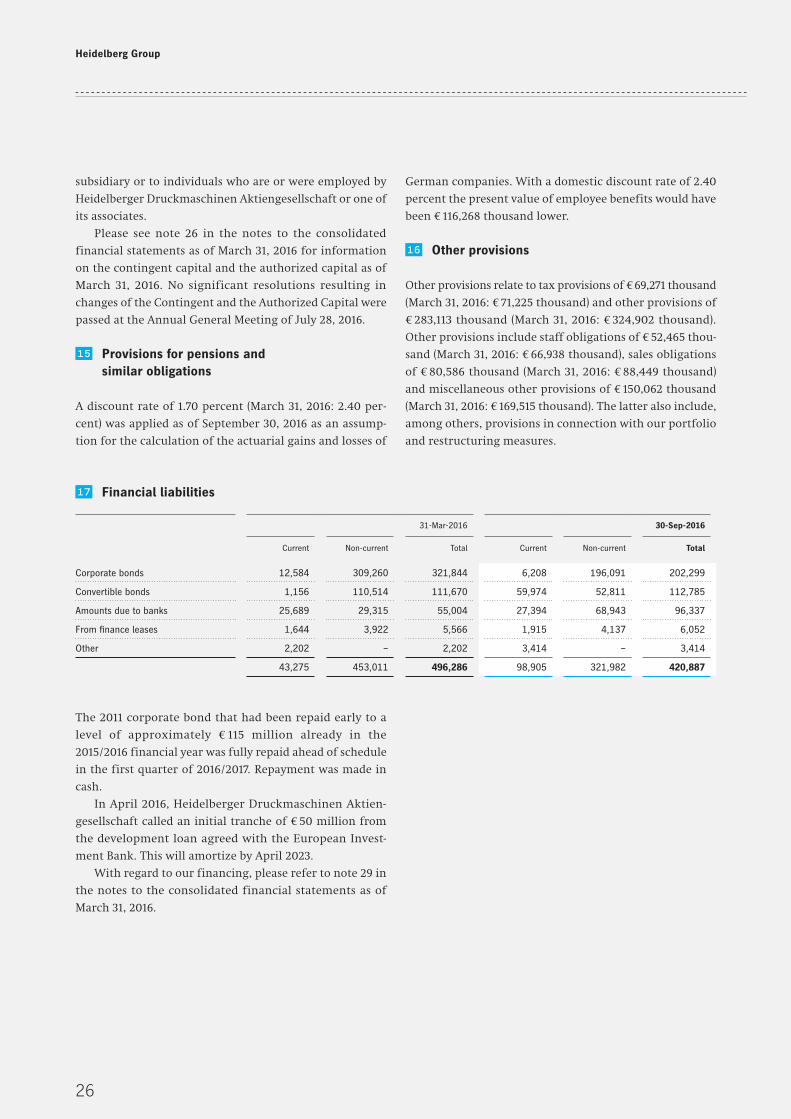
German companies. With a domestic discount rate of 2.40
percent the present value of employee benefits would have
been € 116,268 thousand lower.
Other provisions
Other provisions relate to tax provisions of € 69,271 thousand
(March 31, 2016: € 71,225 thousand) and other provisions of
€ 283,113 thousand (March 31, 2016: € 324,902 thousand).
Other provisions include staff obligations of € 52,465 thou-
sand (March 31, 2016: € 66,938 thousand), sales obligations
of € 80,586 thousand (March 31, 2016: € 88,449 thousand)
and miscellaneous other provisions of € 150,062 thousand
(March 31, 2016: € 169,515 thousand). The latter also include,
among others, provisions in connection with our portfolio
and restructuring measures.
16
subsidiary or to individuals who are or were employed by
Heidelberger Druckmaschinen Aktiengesellschaft or one of
its associates.
Please see note 26 in the notes to the consolidated
financial statements as of March 31, 2016 for information
on the contingent capital and the authorized capital as of
March 31, 2016. No significant resolutions resulting in
changes of the Contingent and the Authorized Capital were
passed at the Annual General Meeting of July 28, 2016.
Provisions for pensions and similar obligations
A discount rate of 1.70 percent (March 31, 2016: 2.40 per-
cent) was applied as of September 30, 2016 as an assump-
tion for the calculation of the actuarial gains and losses of
15
Financial liabilities
The 2011 corporate bond that had been repaid early to a
level of approximately € 115 million already in the
2015 / 2016 financial year was fully repaid ahead of schedule
in the first quarter of 2016 / 2017. Repayment was made in
cash.
In April 2016, Heidelberger Druckmaschinen Aktien-
gesellschaft called an initial tranche of € 50 million from
the development loan agreed with the European Invest-
ment Bank. This will amortize by April 2023.
With regard to our financing, please refer to note 29 in
the notes to the consolidated financial statements as of
March 31, 2016.
17
31-Mar-2016 30-Sep-2016
Current Non-current Total Current Non-current Total
Corporate bonds 12,584 309,260 321,844 6,208 196,091 202,299
Convertible bonds 1,156 110,514 111,670 59,974 52,811 112,785
Amounts due to banks 25,689 29,315 55,004 27,394 68,943 96,337
From finance leases 1,644 3,922 5,566 1,915 4,137 6,052
Other 2,202 – 2,202 3,414 – 3,414
43,275 453,011 496,286 98,905 321,982 420,887
27
Heidelberg on the capital markets
Interim consolidated financial statements
Interim consolidated management report
Responsibility statement Financial calendar
Other liabilities
Other liabilities include advance payments on orders
of € 154,215 thousand (March 31, 2016: € 97,682 thousand),
liabilities from derivative financial instruments of € 4,238
thousand (March 31, 2016: € 2,672 thousand), and de ferred
income of € 63,608 thousand (March 31, 2016: € 66,373
thousand).
Additional information on financial instruments
Financial assets and financial liabilities are allocated to the
three levels of the fair value hierarchy as set out in IFRS 13
depending on the availability of observable market data.
The individual levels are defined as follows:
level 1: Financial instruments traded on active markets
whose quoted prices can be used to measure fair
value without adjustment.
level 2: Measurement on the basis of measurement pro-
cedures whose inputs are derived from observ-
able market data, either directly or indirectly.
level 3: Measurement on the basis of measurement pro-
cedures whose inputs are not derived from
observable market data.
The Heidelberg Group is exposed to market price risks in
the form of interest rate and exchange rate fluctuations. In
general, derivative financial instruments are used to limit
these risks. Their fair values correspond to changes in value
arising from a notional revaluation taking into account the
market parameters applicable at the end of the reporting
period. The fair values are calculated using standardized
measurement procedures (discounted cash flow and option
pricing models). This corresponds to level 2 of the fair
value hierarchy set out in IFRS 13, as only input data observ-
able on the market, such as exchange rates, exchange rate
volatilities and interest rates, is used.
Securities are classified as financial assets available for
sale. In line with IAS 39, these financial instruments are
also carried at fair value. The underlying quoted prices for
the measurement of the vast majority of securities corre-
spond to level 1 of the fair value hierarchy set out in IFRS 13,
18
19
as only quoted prices observed on active markets are used
in measurement. If the fair value of securities cannot be
reliably determined, they are carried at cost.
The loans allocated to level 3 of the measurement hier-
archy relate to a fixed-income cash investment classified as
an available-for-sale financial asset that was made by Hei-
delberger Druckmaschinen Aktiengesellschaft in August
2016. The fair value is calculated using a standardized val-
uation method (discounted cash flow method). One of the
key input parameters for calculating the fair value is the
discount rate, which amounted to 12.9 percent as of Sep-
tember 30, 2016. If this had been 0.5 percentage points
higher (lower), the fair value would have been € 231 thou-
sand lower (€ 235 thousand higher) provided all other
assumptions were unchanged.
28
Heidelberg Group
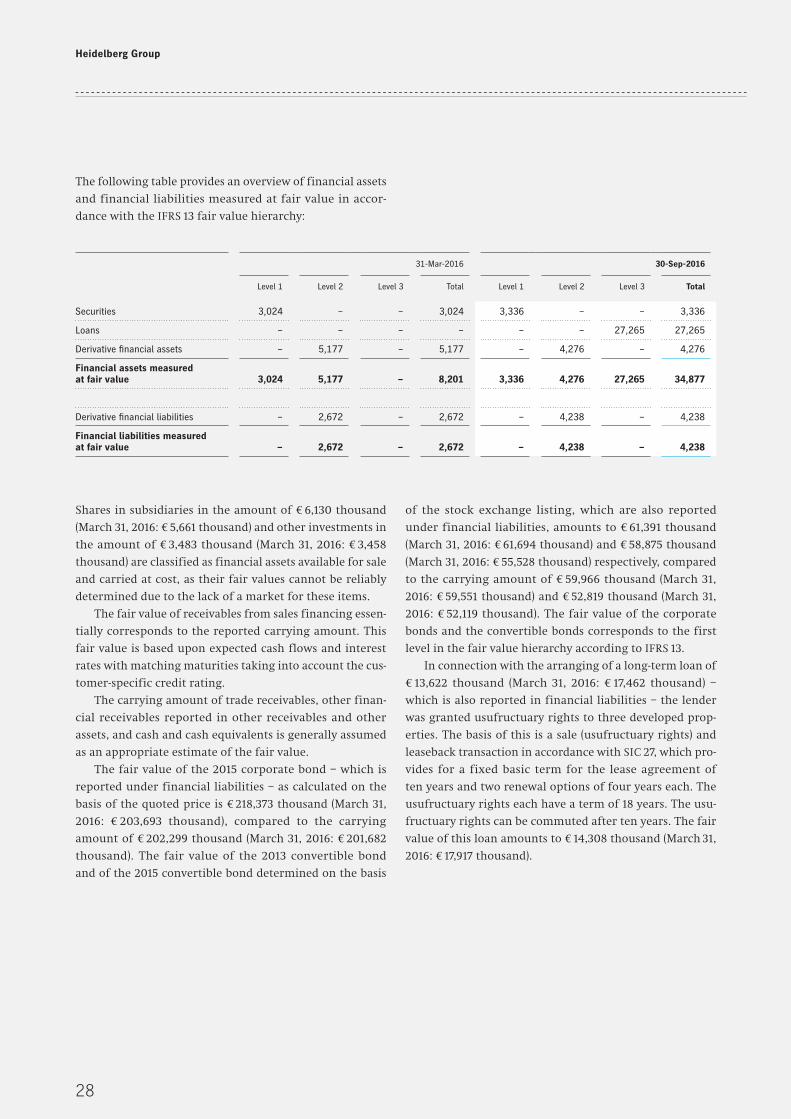
The following table provides an overview of financial assets
and financial liabilities measured at fair value in accor
dance with the IFRS 13 fair value hierarchy:
Shares in subsidiaries in the amount of € 6,130 thousand
(March 31, 2016: € 5,661 thousand) and other investments in
the amount of € 3,483 thousand (March 31, 2016: € 3,458
thousand) are classified as financial assets available for sale
and carried at cost, as their fair values cannot be reliably
determined due to the lack of a market for these items.
The fair value of receivables from sales financing essen
tially corresponds to the reported carrying amount. This
fair value is based upon expected cash flows and interest
rates with matching maturities taking into account the cus
tomerspecific credit rating.
The carrying amount of trade receivables, other finan
cial receivables reported in other receivables and other
assets, and cash and cash equivalents is generally assumed
as an appropriate estimate of the fair value.
The fair value of the 2015 corporate bond – which is
reported under financial liabilities – as calculated on the
basis of the quoted price is € 218,373 thousand (March 31,
2016: € 203,693 thousand), compared to the carrying
amount of € 202,299 thousand (March 31, 2016: € 201,682
thousand). The fair value of the 2013 convertible bond
and of the 2015 convertible bond determined on the basis
31-Mar-2016 30-Sep-2016
Level 1 Level 2 Level 3 Total Level 1 Level 2 Level 3 Total
Securities 3,024 – – 3,024 3,336 – – 3,336
Loans – – – – – – 27,265 27,265
Derivative financial assets – 5,177 – 5,177 – 4,276 – 4,276
Financial assets measured at fair value 3,024 5,177 – 8,201 3,336 4,276 27,265 34,877
Derivative financial liabilities – 2,672 – 2,672 – 4,238 – 4,238
Financial liabilities measured at fair value – 2,672 – 2,672 – 4,238 – 4,238
of the stock exchange listing, which are also reported
under financial liabilities, amounts to € 61,391 thousand
(March 31, 2016: € 61,694 thousand) and € 58,875 thousand
(March 31, 2016: € 55,528 thousand) respectively, compared
to the carrying amount of € 59,966 thousand (March 31,
2016: € 59,551 thousand) and € 52,819 thousand (March 31,
2016: € 52,119 thousand). The fair value of the corporate
bonds and the convertible bonds corresponds to the first
level in the fair value hierarchy according to IFRS 13.
In connection with the arranging of a longterm loan of
€ 13,622 thousand (March 31, 2016: € 17,462 thousand) –
which is also reported in financial liabilities – the lender
was granted usufructuary rights to three developed prop
erties. The basis of this is a sale (usufructuary rights) and
leaseback transaction in accordance with SIC 27, which pro
vides for a fixed basic term for the lease agreement of
ten years and two renewal options of four years each. The
usufructuary rights each have a term of 18 years. The usu
fructuary rights can be commuted after ten years. The fair
value of this loan amounts to € 14,308 thousand (March 31,
2016: € 17,917 thousand).
29
Heidelberg on the capital markets
Interim consolidated financial statements
Interim consolidated management report
Responsibility statement Financial calendar
The fair value of the amortizing loan issued in April 2014,
which is reported under financial liabilities, is € 14,925
thousand (March 31, 2016: € 17,527 thousand) compared to
the carrying amount of € 13,476 thousand (March 31, 2016:
€ 16,081 thousand).
The fair value of the initial tranche from the develop
ment loan agreed with the European Investment Bank
called in April 2016 is € 44,797 compared to the carrying
amount of € 50,597 thousand.
The fair value of each of these three financial liabilities
was calculated on the basis of the discounted cash flow
method using market interest rates and corresponds to the
second level in the fair value hierarchy according to IFRS 13.
The carrying amount of other financial liabilities, trade
payables and other liabilities is generally assumed as an
appropriate estimate of the fair value.
The carrying amount of the financial asset allocated to
level 3 of the measurement hierarchy in accordance with
IFRS 13 as of September 30, 2016 (€ 27,265 thousand) is rec
onciled as follows:
Carrying amount as of April 1, 2016 (€ 0 thousand), addi
tion (€ 26,996 thousand), other changes recognized in
equity or in profit or loss (€ 269 thousand).
Contingent liabilities and other financial liabilities
As of September 30, 2016, the contingent liabilities for war
ranties and guarantees amounted to € 4,417 thousand
(March 31, 2016: € 4,236 thousand).
Other financial liabilities amounted to € 171,786 thou
sand as of September 30, 2016 (March 31, 2016: € 181,451
thousand). Of this amount, € 150,042 thousand (March 31,
2016: € 162,717 thousand) related to lease and rental obliga
tions and € 21,744 thousand (March 31, 2016: € 18,734 thou
sand) related to investments and other purchase commit
ments.
Group segment reporting
Segment reporting is based on the management approach.
The Heidelberg Group consists of the business segments
Heidelberg Equipment, Heidelberg Services and Heidelberg
Financial Services. Heidelberg Equipment essentially com
prises new machinery business. Services, consumables, ser
vice parts and remarketed equipment business are bundled
in the Heidelberg Services segment. The Heidelberg Finan
cial Services segment comprises sales financing business.
Further information on the business activities, products
and services of the individual segments can be found in the
sections “Management and Control” and “Segments and
Business Areas” in the Group management report as of
March 31, 2016.
Segment information April 1, 2016 to September 30,
2016:
20
21
Heidel berg Equipment Heidel berg Services Heidel berg Financial Services Heidel berg Group
1-Apr-2015 to
30-Sep-2015
1-Apr-2016to
30-Sep-2016
1-Apr-2015 to
30-Sep-2015
1-Apr-2016to
30-Sep-2016
1-Apr-2015 to
30-Sep-2015
1-Apr-2016to
30-Sep-2016
1-Apr-2015 to
30-Sep-2015
1-Apr-2016to
30-Sep-2016
External sales 580,774 527,021 577,846 542,674 3,016 2,324 1,161,636 1,072,019
EBITDA excluding special items (segment result) 10,587 3,331 67,202 41,494 1,671 265 79,460 45,090
EBIT excluding special items – 15,875 – 20,497 57,394 31,572 1,668 – 59 43,187 11,016
30
Heidelberg Group
The segment result is reconciled to the net result before
taxes as follows:
External sales relate to the different regions as follows:
1-Apr-2015to
30-Sep-2015
1-Apr-2016to
30-Sep-2016
EBITDA excluding special items (segment result) 79,460 45,090
Depreciation and amortization 36,273 34,074
EBIT excluding special items 43,187 11,016
Special items 21,584 6,076
Financial result – 29,894 – 29,093
Net result before taxes – 8,291 – 24,153
1-Apr-2015to
30-Sep-2015
1-Apr-2016to
30-Sep-2016
Europe, Middle East and Africa
Germany 151,799 164,363
Other Europe, Middle East and Africa region 326,606 303,850
478,405 468,213
Asia / Pacific
China 175,591 118,368
Other Asia/Pacific region 172,689 156,159
348,280 274,527
Eastern Europe 117,283 102,263
North America
USA 134,755 154,029
Other North America region 34,663 36,437
169,418 190,466
South America 48,250 36,550
1,161,636 1,072,019
Supervisory Board / Management Board
The composition of the Supervisory Board and the Manage-
ment Board as at March 31, 2016 is presented on pages 146
to 148 of the consolidated financial statements as per
March 31, 2016.
The following changes in the Supervisory Board and in
the Management Board took place in the first six months
of financial year 2016 / 2017:
On July 28, 2016, with effect from the end of the Annual
General Meeting on July 28, 2016 until the end of the
Annual General Meeting that resolves discharges for the
2020/2021 financial year, the Annual General Meeting
elected Karen Heumann, founder and spokesperson of the
Executive Board of thjnk AG, Hamburg, who had been
appointed a new member of the Supervisory Board by
the court earlier, to the Supervisory Board as a shareholder
representative.
Edwin Eichler stepped down from the Supervisory
Board effective July 31, 2016.
On July 22, 2016, Dr. Gerold Linzbach informed the
Supervisory Board that he does not intend to extend his
contract beyond its scheduled expiration at the end of
August 2017. For further details, please refer to note 24.
22
31
Heidelberg on the capital markets
Interim consolidated financial statements
Interim consolidated management report
Responsibility statement Financial calendar
Related party transactions
As described in note 41 of the notes to the consolidated
financial statements as of March 31, 2016, business relation
ships exist between numerous companies and Heidelberger
Druckmaschinen Aktiengesellschaft and its subsidiaries in
the course of ordinary business. This also includes associ
ated companies, which are regarded as related companies
of the Heidelberg Group.
In the reporting period, transactions were performed
with related parties that resulted in liabilities of € 4,929
thousand (March 31, 2016: € 4,143 thousand), receivables of
€ 8,130 thousand (March 31, 2016: € 11,722 thousand),
expenses of € 2,506 thousand (April 1, 2015 to December 31,
2015: € 6,417 thousand) and income of € 1,810 thousand
(April 1, 2015 to December 31, 2015: € 3,205 thousand),
which essentially comprises sales. All transactions were
again conducted as at arm’s length and did not differ from
relationships with other companies.
Members of the Supervisory Board have received a
remuneration of € 232 thousand (April 1, 2015 to Septem
ber 30, 2015: € 217 thousand) from Heidelberger Druck
maschinen Aktiengesellschaft in line with employment
contracts in the reporting period.
23 Significant events after the end of the reporting period
On October 27, 2016, the Supervisory Board of Heidelberger
Druckmaschinen Aktiengesellschaft appointed Rainer
Hundsdörfer as the new CEO and Chief Human Resources
Officer and Dr. Ulrich Hermann as a regular member of
the company’s Management Board with effect from Novem
ber 14, 2016.
CEO Dr. Gerold Linzbach and Management Board mem
ber Harald Weimer, responsible for the Heidelberg Services
segment, will be stepping down at their own request as of
Novem ber 13, 2016.
Heidelberg, November 9, 2016
heidelberger druckmaschinenaktiengesellschaftThe Management Board
24
32
Heidelberg Group
Responsibility statement
To the best of our knowledge, and in accordance with the
applicable reporting principles for interim reporting, the
consolidated interim financial statements give a true and
fair view of the net assets, financial position and results of
operations of the Group, and the interim Group manage
ment report includes a fair review of the development and
performance of the business and the position of the Group,
together with a description of the principal opportunities
and risks associated with the expected development of the
Group over the remaining months of the current financial
year.
Heidelberg, November 9, 2016
heidelberger druckmaschinenaktiengesellschaftThe Management Board
Dr. Gerold Linzbach Dirk Kaliebe
Stephan Plenz Harald Weimer
Heidelberg on the capital markets
Financial calendarInterim consolidated financial statements
Interim consolidated management report
Responsibility statement
Publishing information
copyright © 2016Heidelberger Druckmaschinen
Aktiengesellschaft
Kurfürsten-Anlage 52 – 60
69115 Heidelberg
Germany
www.heidelberg.com
This report was published on November 9, 2016.
Produced on Heidelberg machines using Heidelberg technology.
All rights and technical changes reserved.
Printed in Germany.
This interim financial report is a translation of the official German interim financial report of Heidelberger Druckmaschinen Aktiengesellschaft. The Company disclaims responsibility for any misunderstanding or misinterpretation due to this translation.
Financial calendar
February 9, 2017 ¬ Publication of Third Quarter Figures 2016 / 2017
June 8, 2017 ¬ Press Conference, Annual Analysts’ and Investors’ Conference
July 27, 2017 ¬ Annual General Meeting
Subject to change
Print compensatedId-No. 1660085
www.bvdm-online.de
Printed with Saphira Eco
Printed with Saphira Eco
Heidelberger Druckmaschinen AktiengesellschaftKurfürsten-Anlage 52 – 6069115 HeidelbergGermanywww.heidelberg.com