Embed Size (px)
Citation preview
2
The Interim Management Report of the Repsol Group1 should be read in conjunction with the consolidated Management Report for 20202. In conjunction with this report, Repsol has published condensed interim consolidated financial statements3 for the first half of 2021 (hereinafter, “interim financial statements for the first half of 2021”). The Board of Directors of Repsol, S.A. approved both reports of Repsol, S.A. at its meeting of July 28, 2021. The financial information contained in this document, unless expressly indicated otherwise, has been prepared in accordance with the Group’s reporting model, as described below:
Repsol presents its segment results including joint ventures and other companies that are jointly managed in accordance with the Group’s investment percentage, considering operational and economic indicators within the same perspective and degree of detail as those for companies consolidated under the full consolidation method. Thus, the Group considers that the nature of its businesses and the way in which results are analyzed for decision-making purposes are adequately reflected in this report. Given the nature of its business and in order to make its disclosures more readily comparable with those of its peers, the Group relies on Adjusted Net Income when measuring the results of each business segment. Adjusted Net Income means the current cost of supply (CCS), net of taxes and minority interests and excluding certain specific items of income and expense (“Special items”). For current cost of supply (CCS) earnings, the cost of volumes sold is calculated on the basis of procurement and production costs incurred during the period in question and not based on weighted average cost, which is the accepted methodology under European accounting law and regulations. The difference between CCS earnings and earnings at weighted average cost is included in the so-called Inventory Effect, which also includes other adjustments to the valuation of inventories (write-offs, economic hedges, etc.) and is presented net of taxes and minority interests. This Inventory Effect largely affects the Industrial segment. Furthermore, Adjusted Net Income does not include Special Items, i.e. certain material items that are presented separately to provide a more reliable view of the ordinary management of the businesses. This standard report uses Alternative Performance Measures (APMs), meaning measures that are “adjusted” to those presented under IFRS-EU. The information, breakdowns and reconciliations are included in Appendix I — Alternative Performance Measures of this report and are updated quarterly on the Repsol website (www.repsol.com). The balance sheet, income statement and statement of cash flows prepared under the Group’s reporting model are presented in Appendix II.
The non-financial information regarding the sustainability indicators included in this document has been calculated in accordance with the corporate rules that set out the standard criteria and methodology to be applied in each case. For more information, see section 8 – Sustainability of the Group’s 2020 Management Report.
1 Hereinafter, the names “Repsol”, “Repsol Group” or “the Company” will be used indistinctly to refer to the group of companies comprising Repsol,
S.A. and its subsidiaries, associates and joint ventures. 2 This interim Management Report has been drawn up for the sole purpose of updating the information contained in the 2020 Management
Report. 3 The interim financial statements for the first half of the year have undergone a limited independent review by the Group’s auditor.
ABOUT THIS REPORT
Translation of a report originally issued in Spanish. In the event of a discrepancy, the Spanish version prevails.
3
............................................................................................... 4
....................................................................................................................................................... 8
.......................................................................................................................................................... 8
...................................................................................................................................................................... 8
.......................................................................................................................................... 10
......................................................................... 11
...................................................................................................................................................................................... 11
................................................................................................................................................................................. 15
.................................................................................................................................................................... 15
................................................................................................................................................. 17
................................................................................................................................................. 19
................................................................................................................................................................................... 19
.................................................................................................................................................................................. 22
................................................................................................................................................ 24
................................................................................................................................................... 26
.................................................................................................................................. 29
............................................................................................................................................................. 30
..................................................................................................................................................................................... 30
............................................................................................................................................................... 32
......................................................................................................................... 32
................................................................................................. 33
.................................................. 42
....................................................................................... 45
4
Prices and demand recovery
Solid cash generation at the businesses
Good results supported by an integrated model
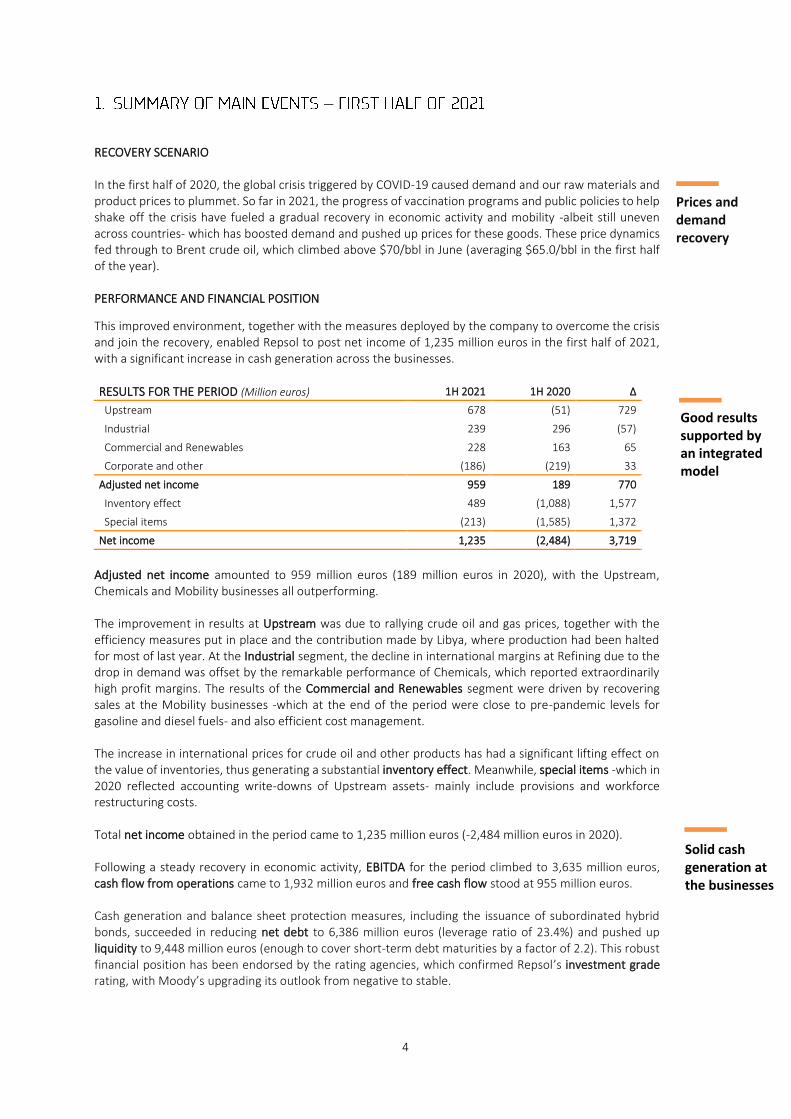
RECOVERY SCENARIO In the first half of 2020, the global crisis triggered by COVID-19 caused demand and our raw materials and product prices to plummet. So far in 2021, the progress of vaccination programs and public policies to help shake off the crisis have fueled a gradual recovery in economic activity and mobility -albeit still uneven across countries- which has boosted demand and pushed up prices for these goods. These price dynamics fed through to Brent crude oil, which climbed above $70/bbl in June (averaging $65.0/bbl in the first half of the year). PERFORMANCE AND FINANCIAL POSITION
This improved environment, together with the measures deployed by the company to overcome the crisis and join the recovery, enabled Repsol to post net income of 1,235 million euros in the first half of 2021, with a significant increase in cash generation across the businesses.
RESULTS FOR THE PERIOD (Million euros) 1H 2021 1H 2020 ∆
Upstream 678 (51) 729
Industrial 239 296 (57)
Commercial and Renewables 228 163 65
Corporate and other (186) (219) 33
Adjusted net income 959 189 770
Inventory effect 489 (1,088) 1,577
Special items (213) (1,585) 1,372
Net income 1,235 (2,484) 3,719
Adjusted net income amounted to 959 million euros (189 million euros in 2020), with the Upstream, Chemicals and Mobility businesses all outperforming. The improvement in results at Upstream was due to rallying crude oil and gas prices, together with the efficiency measures put in place and the contribution made by Libya, where production had been halted for most of last year. At the Industrial segment, the decline in international margins at Refining due to the drop in demand was offset by the remarkable performance of Chemicals, which reported extraordinarily high profit margins. The results of the Commercial and Renewables segment were driven by recovering sales at the Mobility businesses -which at the end of the period were close to pre-pandemic levels for gasoline and diesel fuels- and also efficient cost management. The increase in international prices for crude oil and other products has had a significant lifting effect on the value of inventories, thus generating a substantial inventory effect. Meanwhile, special items -which in 2020 reflected accounting write-downs of Upstream assets- mainly include provisions and workforce restructuring costs. Total net income obtained in the period came to 1,235 million euros (-2,484 million euros in 2020). Following a steady recovery in economic activity, EBITDA for the period climbed to 3,635 million euros, cash flow from operations came to 1,932 million euros and free cash flow stood at 955 million euros. Cash generation and balance sheet protection measures, including the issuance of subordinated hybrid bonds, succeeded in reducing net debt to 6,386 million euros (leverage ratio of 23.4%) and pushed up liquidity to 9,448 million euros (enough to cover short-term debt maturities by a factor of 2.2). This robust financial position has been endorsed by the rating agencies, which confirmed Repsol’s investment grade rating, with Moody’s upgrading its outlook from negative to stable.
5
Transformation of petrochemical facilities at multi-energy hubs
Increase in installed renewable capacity
Integrated energy transition and decarbonization strategy
Shareholder remuneration in the first half of the year amounted to 0.288 euros per share under the Repsol Flexible Dividend program, which replaces the 2020 interim dividend. Additionally, a cash dividend of 0.30 euros gross per share was paid out against 2020 results in July. In 2021, Repsol effected a capital reduction through the redemption of own shares, which had the effect of increasing earnings per share. The share price showed a significant recovery in the first half of the year when compared with the level reported at the beginning of the year. BUSINESS ACTIVITIES At Upstream, the resumption of production in Libya, coupled with cost reduction plans in place and the restructuring of asset operating plans, have allowed the Group to take advantage of the improved price environment. Production in the first half of the year (599.3 Kboe/d, down 11% on the previous year) was shaped by various factors, many of them circumstantial (winter storms in the United States, scheduled maintenance, operating incidents, etc.). The exploration campaign was carried out more selectively than in previous years, ending with one discovery in Bolivia and a delineation well in Indonesia with positive results. At Industrial, production, logistics and commercial structures were adjusted accordingly to adapt to weak Refining demand. Meanwhile, the Chemicals businesses were driven by historically high international margins to turn in an excellent performance. The Group also continued to focus on innovation and digitalization by launching new projects aligned with the Group’s decarbonization and circular economy strategy and aimed at transforming industrial facilities into multi-energy hubs capable of generating products with low, zero or even negative carbon footprints. At Commercial and Renewables, sales at service stations in Spain were up 16%, despite the gradual lifting of mobility restrictions and the effects of Storm Filomena. Meanwhile, the entry into commercial operation of the Delta I wind farm and the first phase of the Kappa photovoltaic farm, as well as the Chile business, have meant that Repsol now has 467.9 MW of total installed capacity in renewable generation assets. Repsol also continued to promote its customer-centric model of multi-energy products and services, which has allowed it to increase the number of electricity and gas retail customers compared to the same period of the previous year. Repsol has made further progress in transforming the company by flattening the organizational structure and setting up broader management scopes to streamline decision-making, gain flexibility and facilitate communication and collaboration flows. It also continued to focus on technology and digitalization, as key levers to accelerate the transition toward innovative business models that will enable the Company to decarbonize. DRIVING DECARBONIZATION Repsol accelerated compliance with the route set out in the 21-25 Strategic Plan to achieve its zero emissions target by 2050. Upstream has continually sought to prioritize quality over quantity and focus on geographic areas with the greatest competitive advantages. Following this approach, it either sold, or reached agreements to sell assets in Russia, Malaysia, Algeria and Norway in the first half of the year, ceasing production in Spain and focusing exploratory activity in a lower number of countries. The proceeds obtained and the resulting investment savings will help finance strategic projects and new low-carbon initiatives. At Industrial, highlights included the investments announced at the Tarragona industrial complexes, for circular economy projects; at Cartagena, where the Group plans to build an advanced biofuel plant; and also the integration into the consortium to develop Spain’s first alkaline electrolyzer plant in the Basque Country. At Commercial and Renewables, the first photovoltaic complex was brought online in Spain (Kappa, with 90.5 MW), operational testing got underway at Valdesolar (47.8 MW), construction work began on the future Delta II wind farm (859 MW) and also acquired the company Gana Energía which markets sell 100%
6
New projects to drive transformation
renewable energy. In the United States, the company started its renewables activity by acquiring a 40% stake in US company Hecate Energy. In the calls for expressions of interest for Next Generation European funds launched by the Government of Spain, Repsol presented a portfolio of 31 projects that combine technology, decarbonization and circular economy, the creation of quality jobs and territorial balance, for a total associated investment of 6,359 billion euros. Repsol has published a new integrated strategy targeting sustainable financing to accompany the energy transformation process. It offers flexibility and transparency when issuing financial instruments in the form of green and transition bonds, as well as financial instruments whose economic terms are linked to the attainment of Repsol’s key sustainability objectives as a company. SUSTAINABILITY In the first half of the year, the 2021 Global Sustainability Plan (GSP) was approved, and further progress was made toward the local Sustainability Plans in more than 20 countries and industrial complexes, as we continue to pursue the 2030 Agenda of the United Nations and our own 21-25 Strategic Plan. To achieve the goal of reducing greenhouse gas emissions to curb the effects of climate change, Repsol has implemented various improvement actions at its facilities, which have prevented 176 thousand metric tons of CO2 emissions. Amid COVID-19, Repsol has taken steps to protect the health and safety of its workers, without these affecting operations or the levels of service it offers. Both the injury frequency rate (IFR) and the process safety incident rate (PSIR) were down significantly compared to those of 2020.
7
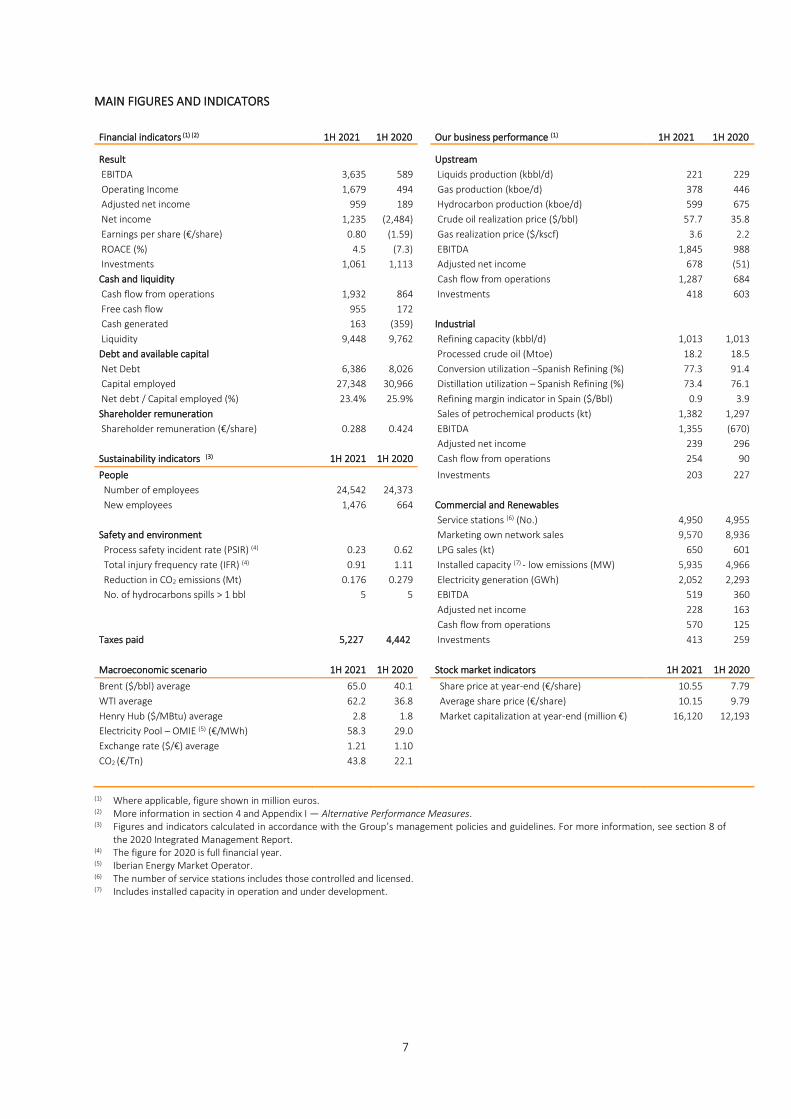
MAIN FIGURES AND INDICATORS
Financial indicators (1) (2) 1H 2021 1H 2020 Our business performance (1) 1H 2021 1H 2020
Result
Upstream
EBITDA 3,635 589 Liquids production (kbbl/d) 221 229
Operating Income 1,679 494 Gas production (kboe/d) 378 446
Adjusted net income 959 189 Hydrocarbon production (kboe/d) 599 675
Net income 1,235 (2,484) Crude oil realization price ($/bbl) 57.7 35.8
Earnings per share (€/share) 0.80 (1.59) Gas realization price ($/kscf) 3.6 2.2
ROACE (%) 4.5 (7.3) EBITDA 1,845 988
Investments 1,061 1,113 Adjusted net income 678 (51)
Cash and liquidity Cash flow from operations 1,287 684
Cash flow from operations 1,932 864 Investments 418 603
Free cash flow 955 172
Cash generated 163 (359) Industrial
Liquidity 9,448 9,762 Refining capacity (kbbl/d) 1,013 1,013
Debt and available capital Processed crude oil (Mtoe) 18.2 18.5
Net Debt 6,386 8,026 Conversion utilization –Spanish Refining (%) 77.3 91.4
Capital employed 27,348 30,966 Distillation utilization – Spanish Refining (%) 73.4 76.1
Net debt / Capital employed (%) 23.4% 25.9% Refining margin indicator in Spain ($/Bbl) 0.9 3.9
Shareholder remuneration Sales of petrochemical products (kt) 1,382 1,297
Shareholder remuneration (€/share) 0.288 0.424 EBITDA 1,355 (670) Adjusted net income 239 296
Sustainability indicators (3) 1H 2021 1H 2020 Cash flow from operations 254 90
People Investments 203 227
Number of employees 24,542 24,373 New employees 1,476 664 Commercial and Renewables
Service stations (6) (No.) 4,950 4,955
Safety and environment Marketing own network sales 9,570 8,936
Process safety incident rate (PSIR) (4) 0.23 0.62 LPG sales (kt) 650 601
Total injury frequency rate (IFR) (4) 0.91 1.11 Installed capacity (7) - low emissions (MW) 5,935 4,966
Reduction in CO2 emissions (Mt) 0.176 0.279 Electricity generation (GWh) 2,052 2,293
No. of hydrocarbons spills > 1 bbl 5 5 EBITDA 519 360
Adjusted net income 228 163
Cash flow from operations 570 125
Taxes paid 5,227 4,442 Investments 413 259
Macroeconomic scenario 1H 2021 1H 2020 Stock market indicators 1H 2021 1H 2020
Brent ($/bbl) average 65.0 40.1 Share price at year-end (€/share) 10.55 7.79
WTI average 62.2 36.8 Average share price (€/share) 10.15 9.79
Henry Hub ($/MBtu) average 2.8 1.8 Market capitalization at year-end (million €) 16,120 12,193
Electricity Pool – OMIE (5) (€/MWh) 58.3 29.0 Exchange rate ($/€) average 1.21 1.10 CO2 (€/Tn) 43.8 22.1
(1) Where applicable, figure shown in million euros. (2) More information in section 4 and Appendix I — Alternative Performance Measures. (3) Figures and indicators calculated in accordance with the Group’s management policies and guidelines. For more information, see section 8 of
the 2020 Integrated Management Report. (4) The figure for 2020 is full financial year. (5) Iberian Energy Market Operator. (6) The number of service stations includes those controlled and licensed. (7) Includes installed capacity in operation and under development.
8
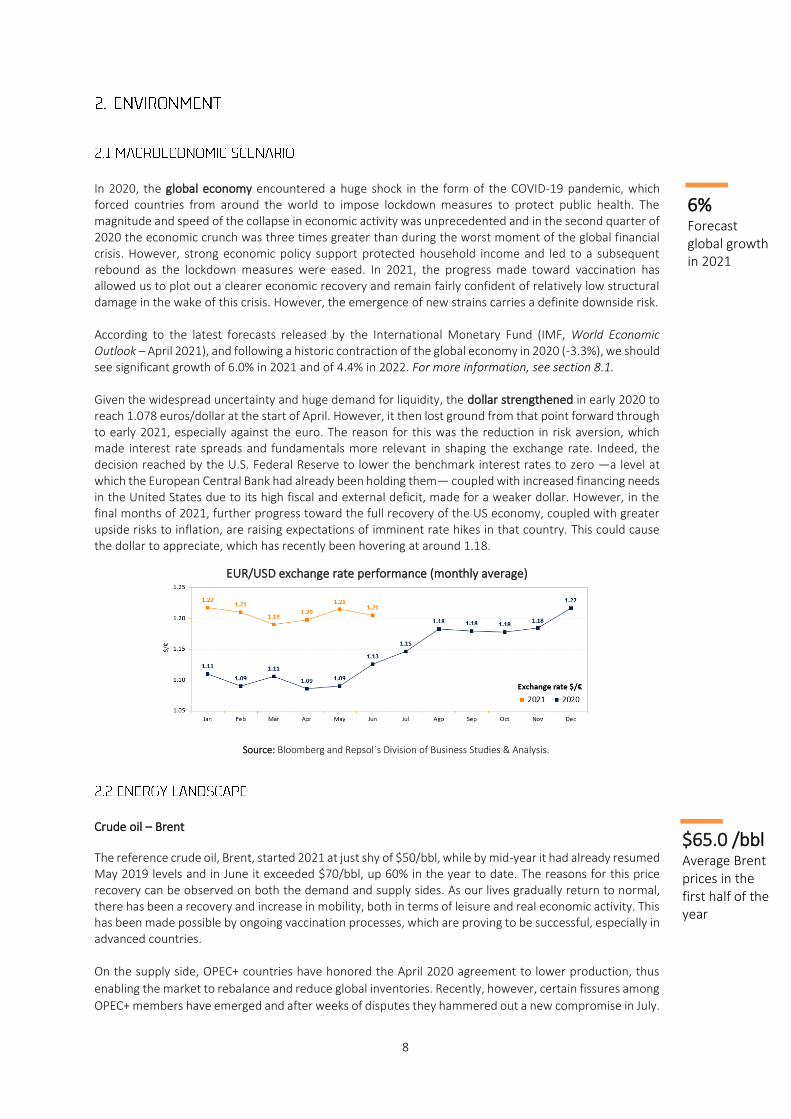
In 2020, the global economy encountered a huge shock in the form of the COVID-19 pandemic, which forced countries from around the world to impose lockdown measures to protect public health. The magnitude and speed of the collapse in economic activity was unprecedented and in the second quarter of 2020 the economic crunch was three times greater than during the worst moment of the global financial crisis. However, strong economic policy support protected household income and led to a subsequent rebound as the lockdown measures were eased. In 2021, the progress made toward vaccination has allowed us to plot out a clearer economic recovery and remain fairly confident of relatively low structural damage in the wake of this crisis. However, the emergence of new strains carries a definite downside risk. According to the latest forecasts released by the International Monetary Fund (IMF, World Economic Outlook – April 2021), and following a historic contraction of the global economy in 2020 (-3.3%), we should see significant growth of 6.0% in 2021 and of 4.4% in 2022. For more information, see section 8.1. Given the widespread uncertainty and huge demand for liquidity, the dollar strengthened in early 2020 to reach 1.078 euros/dollar at the start of April. However, it then lost ground from that point forward through to early 2021, especially against the euro. The reason for this was the reduction in risk aversion, which made interest rate spreads and fundamentals more relevant in shaping the exchange rate. Indeed, the decision reached by the U.S. Federal Reserve to lower the benchmark interest rates to zero —a level at which the European Central Bank had already been holding them— coupled with increased financing needs in the United States due to its high fiscal and external deficit, made for a weaker dollar. However, in the final months of 2021, further progress toward the full recovery of the US economy, coupled with greater upside risks to inflation, are raising expectations of imminent rate hikes in that country. This could cause the dollar to appreciate, which has recently been hovering at around 1.18.
EUR/USD exchange rate performance (monthly average)
Source: Bloomberg and Repsol´s Division of Business Studies & Analysis.
Crude oil – Brent
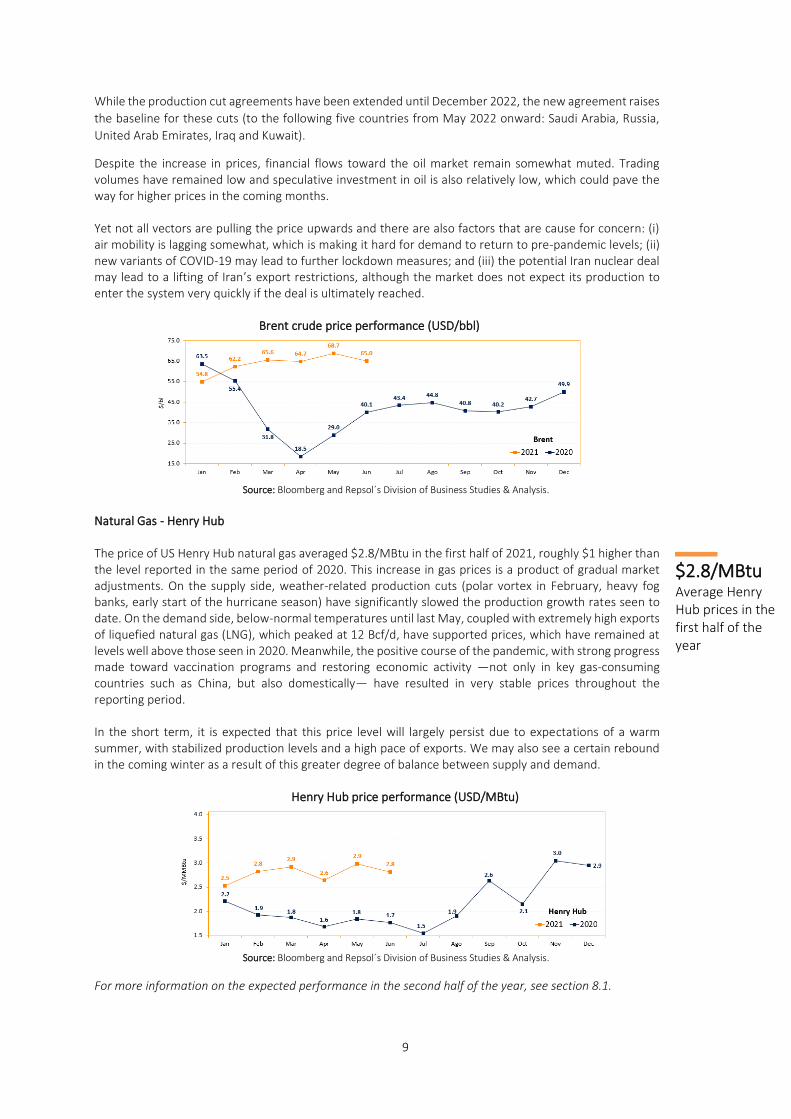
The reference crude oil, Brent, started 2021 at just shy of $50/bbl, while by mid-year it had already resumed May 2019 levels and in June it exceeded $70/bbl, up 60% in the year to date. The reasons for this price recovery can be observed on both the demand and supply sides. As our lives gradually return to normal, there has been a recovery and increase in mobility, both in terms of leisure and real economic activity. This has been made possible by ongoing vaccination processes, which are proving to be successful, especially in advanced countries. On the supply side, OPEC+ countries have honored the April 2020 agreement to lower production, thus
enabling the market to rebalance and reduce global inventories. Recently, however, certain fissures among
OPEC+ members have emerged and after weeks of disputes they hammered out a new compromise in July.
6% Forecast global growth in 2021
$65.0 /bbl Average Brent prices in the first half of the year
9
While the production cut agreements have been extended until December 2022, the new agreement raises
the baseline for these cuts (to the following five countries from May 2022 onward: Saudi Arabia, Russia,
United Arab Emirates, Iraq and Kuwait).
Despite the increase in prices, financial flows toward the oil market remain somewhat muted. Trading volumes have remained low and speculative investment in oil is also relatively low, which could pave the way for higher prices in the coming months. Yet not all vectors are pulling the price upwards and there are also factors that are cause for concern: (i) air mobility is lagging somewhat, which is making it hard for demand to return to pre-pandemic levels; (ii) new variants of COVID-19 may lead to further lockdown measures; and (iii) the potential Iran nuclear deal may lead to a lifting of Iran’s export restrictions, although the market does not expect its production to enter the system very quickly if the deal is ultimately reached.
Brent crude price performance (USD/bbl)
Source: Bloomberg and Repsol´s Division of Business Studies & Analysis.
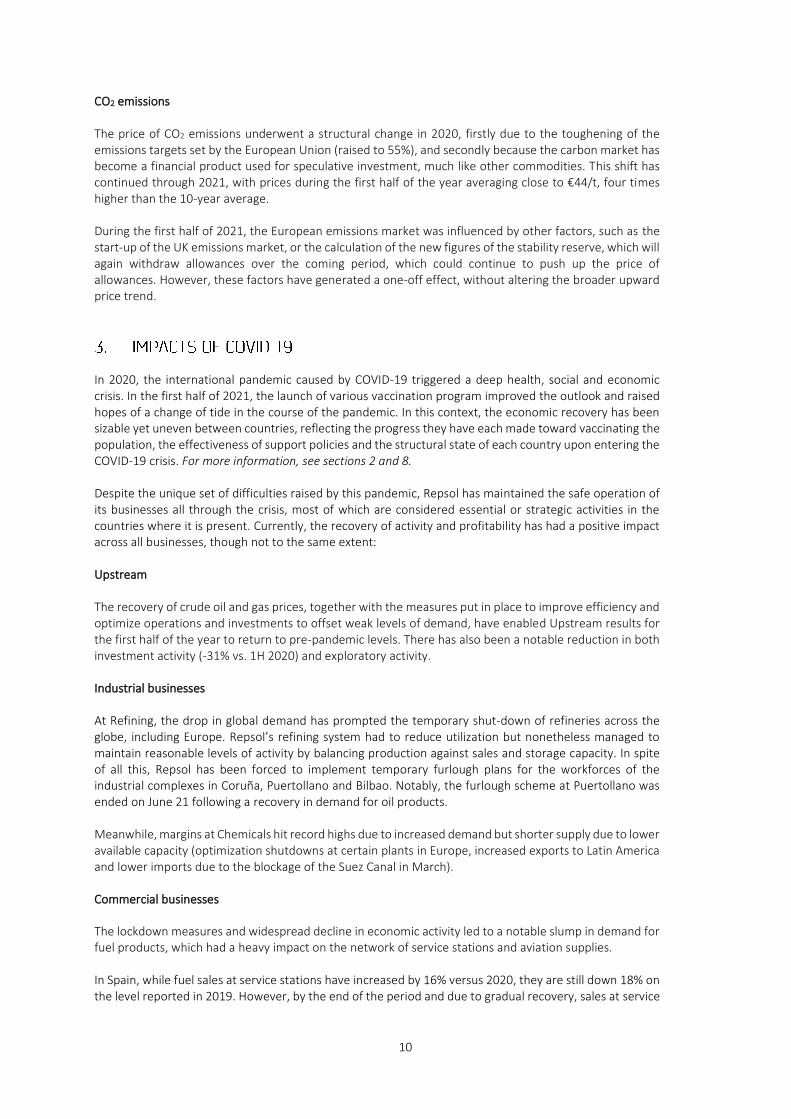
Natural Gas - Henry Hub The price of US Henry Hub natural gas averaged $2.8/MBtu in the first half of 2021, roughly $1 higher than the level reported in the same period of 2020. This increase in gas prices is a product of gradual market adjustments. On the supply side, weather-related production cuts (polar vortex in February, heavy fog banks, early start of the hurricane season) have significantly slowed the production growth rates seen to date. On the demand side, below-normal temperatures until last May, coupled with extremely high exports of liquefied natural gas (LNG), which peaked at 12 Bcf/d, have supported prices, which have remained at levels well above those seen in 2020. Meanwhile, the positive course of the pandemic, with strong progress made toward vaccination programs and restoring economic activity —not only in key gas-consuming countries such as China, but also domestically— have resulted in very stable prices throughout the reporting period. In the short term, it is expected that this price level will largely persist due to expectations of a warm summer, with stabilized production levels and a high pace of exports. We may also see a certain rebound in the coming winter as a result of this greater degree of balance between supply and demand.
Henry Hub price performance (USD/MBtu)
Source: Bloomberg and Repsol´s Division of Business Studies & Analysis.
For more information on the expected performance in the second half of the year, see section 8.1.
$2.8/MBtu Average Henry Hub prices in the first half of the year
10
CO2 emissions
The price of CO2 emissions underwent a structural change in 2020, firstly due to the toughening of the emissions targets set by the European Union (raised to 55%), and secondly because the carbon market has become a financial product used for speculative investment, much like other commodities. This shift has continued through 2021, with prices during the first half of the year averaging close to €44/t, four times higher than the 10-year average. During the first half of 2021, the European emissions market was influenced by other factors, such as the start-up of the UK emissions market, or the calculation of the new figures of the stability reserve, which will again withdraw allowances over the coming period, which could continue to push up the price of allowances. However, these factors have generated a one-off effect, without altering the broader upward price trend.
In 2020, the international pandemic caused by COVID-19 triggered a deep health, social and economic crisis. In the first half of 2021, the launch of various vaccination program improved the outlook and raised hopes of a change of tide in the course of the pandemic. In this context, the economic recovery has been sizable yet uneven between countries, reflecting the progress they have each made toward vaccinating the population, the effectiveness of support policies and the structural state of each country upon entering the COVID-19 crisis. For more information, see sections 2 and 8. Despite the unique set of difficulties raised by this pandemic, Repsol has maintained the safe operation of its businesses all through the crisis, most of which are considered essential or strategic activities in the countries where it is present. Currently, the recovery of activity and profitability has had a positive impact across all businesses, though not to the same extent: Upstream The recovery of crude oil and gas prices, together with the measures put in place to improve efficiency and optimize operations and investments to offset weak levels of demand, have enabled Upstream results for the first half of the year to return to pre-pandemic levels. There has also been a notable reduction in both investment activity (-31% vs. 1H 2020) and exploratory activity.
Industrial businesses At Refining, the drop in global demand has prompted the temporary shut-down of refineries across the globe, including Europe. Repsol’s refining system had to reduce utilization but nonetheless managed to maintain reasonable levels of activity by balancing production against sales and storage capacity. In spite of all this, Repsol has been forced to implement temporary furlough plans for the workforces of the industrial complexes in Coruña, Puertollano and Bilbao. Notably, the furlough scheme at Puertollano was ended on June 21 following a recovery in demand for oil products. Meanwhile, margins at Chemicals hit record highs due to increased demand but shorter supply due to lower available capacity (optimization shutdowns at certain plants in Europe, increased exports to Latin America and lower imports due to the blockage of the Suez Canal in March). Commercial businesses
The lockdown measures and widespread decline in economic activity led to a notable slump in demand for fuel products, which had a heavy impact on the network of service stations and aviation supplies. In Spain, while fuel sales at service stations have increased by 16% versus 2020, they are still down 18% on the level reported in 2019. However, by the end of the period and due to gradual recovery, sales at service
11
stations had reached levels already comparable to those seen pre-crisis (-12% vs. June 2019, on a like-for-like basis). Meanwhile, aviation kerosene sales remain very weak (-59% vs. first half of 2019), due to lower domestic consumption and low international activity. Sales at the LPG business were up year on year in the hospitality, hotel, services and automotive sectors, although still falling short of 2019 levels, supported by the partial recovery of the tourism sector. It is hard to predict to what extent and for how long the pandemic will affect Repsol’s businesses in future. Global demand for crude oil, gas and petroleum products as a result of the ongoing economic situation and especially the recovery of mobility will be affected by how the pandemic pans out. The development of new vaccines and roll-out plans, the containment measures used by the health authorities and the policies put in place to mitigate the social and economic impact of the crisis will all shape the scope and duration of both the crisis and the subsequent recovery.
Repsol posted a net income of 1,235 million euros in the first half of 2021. The opportunities presented by the improvement in the business environment (higher crude oil and gas prices, improvement in the international chemical margin -at historical levels-, progressive recovery of fuel demand due to the easing of mobility restrictions) have been adequately exploited thanks to the measures put in place by the company at the beginning of the pandemic to cope with the complex context of COVID-19 and the change in strategy due to expectations of an exit from the crisis.
Million euros 1H 2021 1H 2020 ∆
Upstream 678 (51) 729
Industrial 239 296 (57)
Commercial and Renewables 228 163 65
Corporate and other (186) (219) 33
Adjusted net income 959 189 770
Inventory effect 489 (1,088) 1,577
Special items (213) (1,585) 1,372
Net income 1,235 (2,484) 3,719
Adjusted Net Income: Recovering prices at the Upstream and Industrial businesses, coupled with increased sales at the commercial businesses, combined to push up EBITDA for the period (3,635 million euros vs. 589 million euros in the first half of 2020).
EBITDA (millions of euros) 1H 2021 1H 2020 ∆
Upstream 1,845 988 857
Industrial 1,355 (670) 2,025
Commercial and Renewables 519 360 159
Corporate and other (84) (89) 5
TOTAL 3,635 589 3,046
Adjusted net income came to 959 million euros, compared with 189 million euros in the same period of
the previous year.
Strong results
12
Upstream
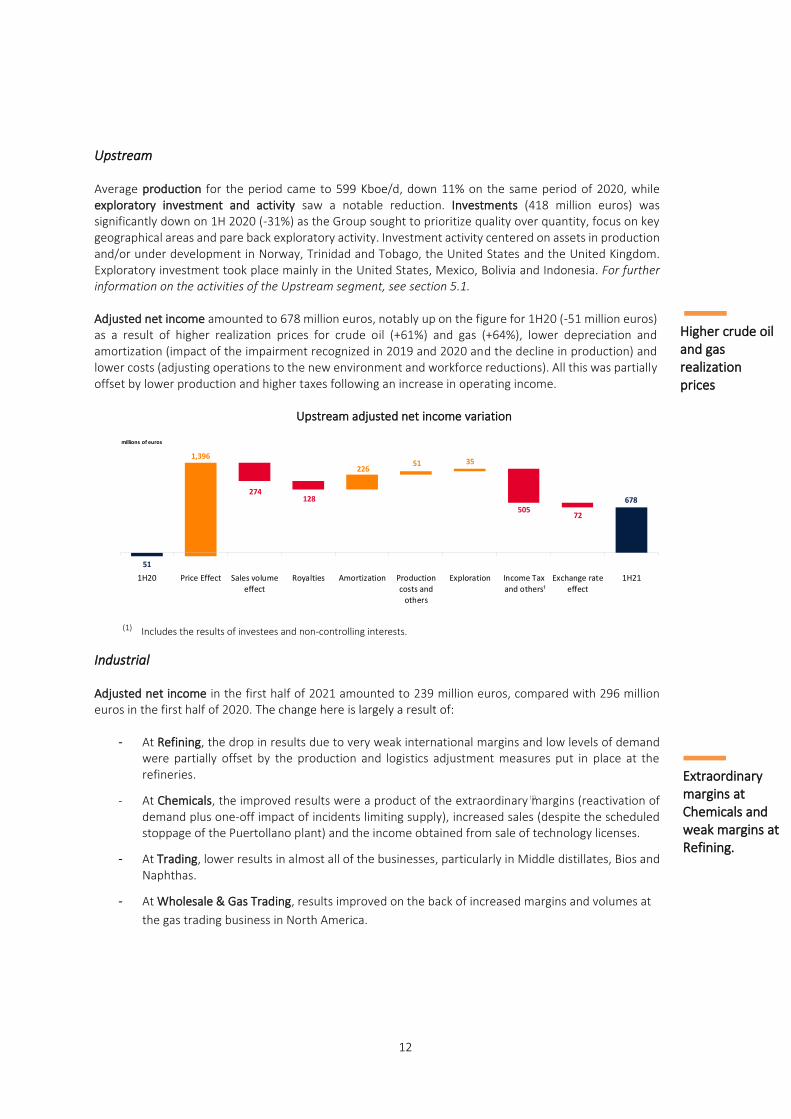
Average production for the period came to 599 Kboe/d, down 11% on the same period of 2020, while exploratory investment and activity saw a notable reduction. Investments (418 million euros) was significantly down on 1H 2020 (-31%) as the Group sought to prioritize quality over quantity, focus on key geographical areas and pare back exploratory activity. Investment activity centered on assets in production and/or under development in Norway, Trinidad and Tobago, the United States and the United Kingdom. Exploratory investment took place mainly in the United States, Mexico, Bolivia and Indonesia. For further information on the activities of the Upstream segment, see section 5.1. Adjusted net income amounted to 678 million euros, notably up on the figure for 1H20 (-51 million euros) as a result of higher realization prices for crude oil (+61%) and gas (+64%), lower depreciation and amortization (impact of the impairment recognized in 2019 and 2020 and the decline in production) and lower costs (adjusting operations to the new environment and workforce reductions). All this was partially offset by lower production and higher taxes following an increase in operating income.
Upstream adjusted net income variation
(1) Includes the results of investees and non-controlling interests.
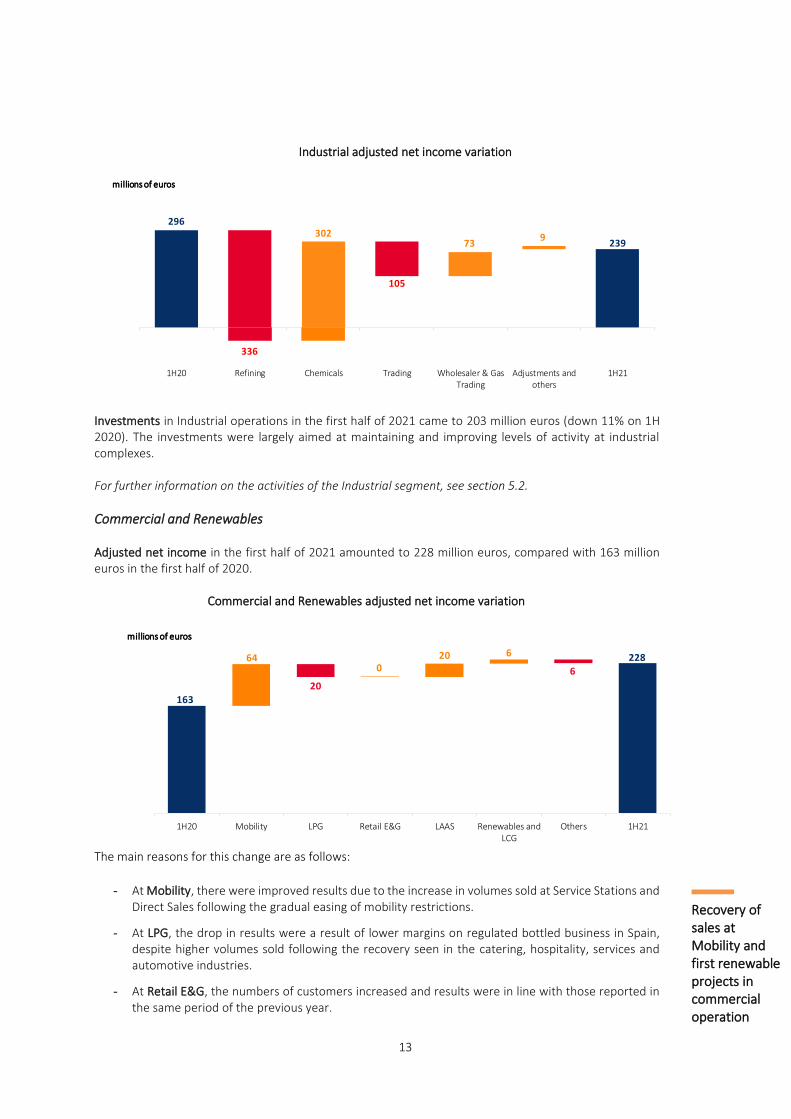
Industrial Adjusted net income in the first half of 2021 amounted to 239 million euros, compared with 296 million euros in the first half of 2020. The change here is largely a result of:
- At Refining, the drop in results due to very weak international margins and low levels of demand were partially offset by the production and logistics adjustment measures put in place at the refineries.
- At Chemicals, the improved results were a product of the extraordinary margins (reactivation of demand plus one-off impact of incidents limiting supply), increased sales (despite the scheduled stoppage of the Puertollano plant) and the income obtained from sale of technology licenses.
- At Trading, lower results in almost all of the businesses, particularly in Middle distillates, Bios and Naphthas.
- At Wholesale & Gas Trading, results improved on the back of increased margins and volumes at
the gas trading business in North America.
51
678274
128
50572
1,396
22651 35
1H20 Price Effect Sales volumeeffect
Royalties Amortization Productioncosts and
others
Exploration Income Taxand others
Exchange rateeffect
1H21
millions of euros
1
Higher crude oil and gas realization prices
(1)
Extraordinary margins at Chemicals and weak margins at Refining.
13
Industrial adjusted net income variation
Investments in Industrial operations in the first half of 2021 came to 203 million euros (down 11% on 1H 2020). The investments were largely aimed at maintaining and improving levels of activity at industrial complexes. For further information on the activities of the Industrial segment, see section 5.2.
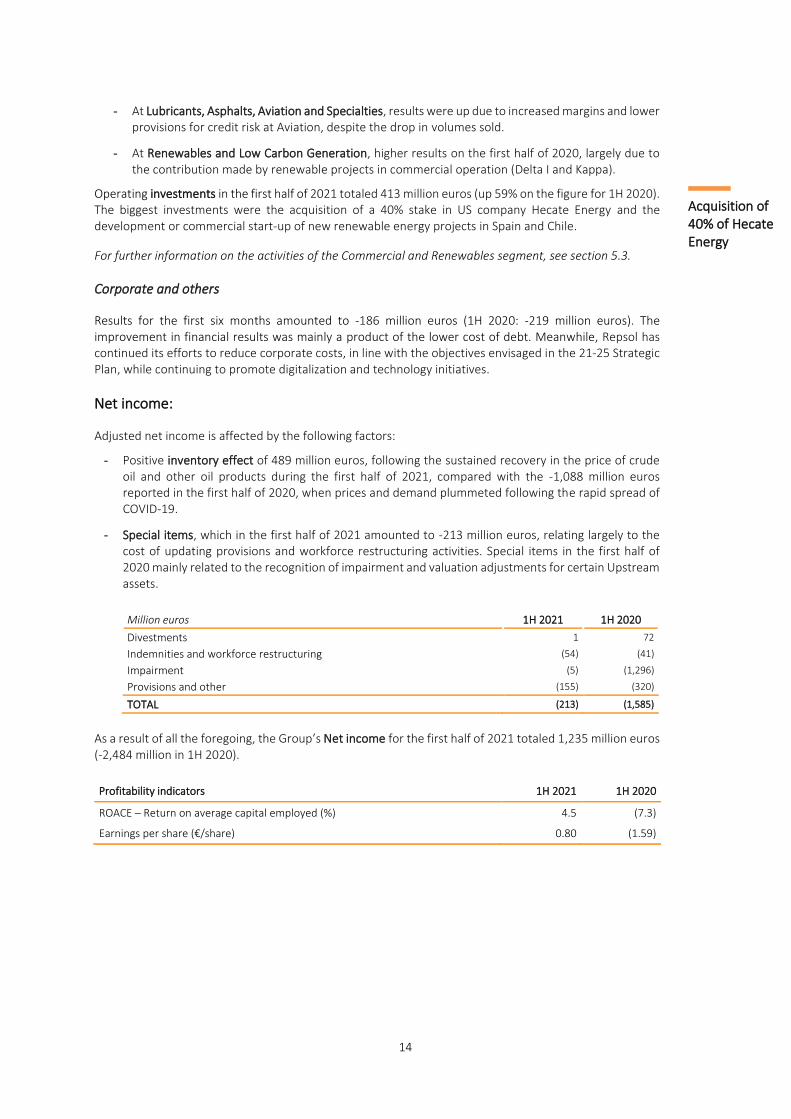
Commercial and Renewables Adjusted net income in the first half of 2021 amounted to 228 million euros, compared with 163 million euros in the first half of 2020.
Commercial and Renewables adjusted net income variation
The main reasons for this change are as follows:
- At Mobility, there were improved results due to the increase in volumes sold at Service Stations and Direct Sales following the gradual easing of mobility restrictions.
- At LPG, the drop in results were a result of lower margins on regulated bottled business in Spain, despite higher volumes sold following the recovery seen in the catering, hospitality, services and automotive industries.
- At Retail E&G, the numbers of customers increased and results were in line with those reported in the same period of the previous year.
296
239
336
9302
105
73
1H20 Refining Chemicals Trading Wholesaler & GasTrading
Adjustments andothers
1H21
millions of euros
163
228
20
664
020 6
1H20 Mobility LPG Retail E&G LAAS Renewables andLCG
Others 1H21
millions of euros
Recovery of sales at Mobility and first renewable projects in commercial operation
14
- At Lubricants, Asphalts, Aviation and Specialties, results were up due to increased margins and lower provisions for credit risk at Aviation, despite the drop in volumes sold.
- At Renewables and Low Carbon Generation, higher results on the first half of 2020, largely due to the contribution made by renewable projects in commercial operation (Delta I and Kappa).
Operating investments in the first half of 2021 totaled 413 million euros (up 59% on the figure for 1H 2020). The biggest investments were the acquisition of a 40% stake in US company Hecate Energy and the development or commercial start-up of new renewable energy projects in Spain and Chile.
For further information on the activities of the Commercial and Renewables segment, see section 5.3.
Corporate and others
Results for the first six months amounted to -186 million euros (1H 2020: -219 million euros). The improvement in financial results was mainly a product of the lower cost of debt. Meanwhile, Repsol has continued its efforts to reduce corporate costs, in line with the objectives envisaged in the 21-25 Strategic Plan, while continuing to promote digitalization and technology initiatives.
Net income:
Adjusted net income is affected by the following factors:
- Positive inventory effect of 489 million euros, following the sustained recovery in the price of crude oil and other oil products during the first half of 2021, compared with the -1,088 million euros reported in the first half of 2020, when prices and demand plummeted following the rapid spread of COVID-19.
- Special items, which in the first half of 2021 amounted to -213 million euros, relating largely to the cost of updating provisions and workforce restructuring activities. Special items in the first half of 2020 mainly related to the recognition of impairment and valuation adjustments for certain Upstream assets.
Million euros 1H 2021 1H 2020
Divestments 1 72
Indemnities and workforce restructuring (54) (41)
Impairment (5) (1,296)
Provisions and other (155) (320)
TOTAL (213) (1,585)
As a result of all the foregoing, the Group’s Net income for the first half of 2021 totaled 1,235 million euros (-2,484 million in 1H 2020).
Profitability indicators 1H 2021 1H 2020
ROACE – Return on average capital employed (%) 4.5 (7.3)
Earnings per share (€/share) 0.80 (1.59)
Acquisition of 40% of Hecate Energy
15
CASH FLOW (Million euros) 1H 2021 1H 2020
EBITDA 3,635 589
Changes in working capital (1,158) 459
Dividends received 11 19
Income taxes received/(paid) (343) (10)
Other collections/(payments) (213) (193)
I. Cash flow from operations 1,932 864
Payments on investments (1,107) (1,207)
Proceeds from divestments 130 515
II. Cash flow from investing activities (977) (692)
FREE CASH FLOW (I + II) 955 172
Dividends and other equity instruments (146) (128)
Net interest and leases (199) (253)
Treasury stock (447) (150)
CASH GENERATION 163 (359)
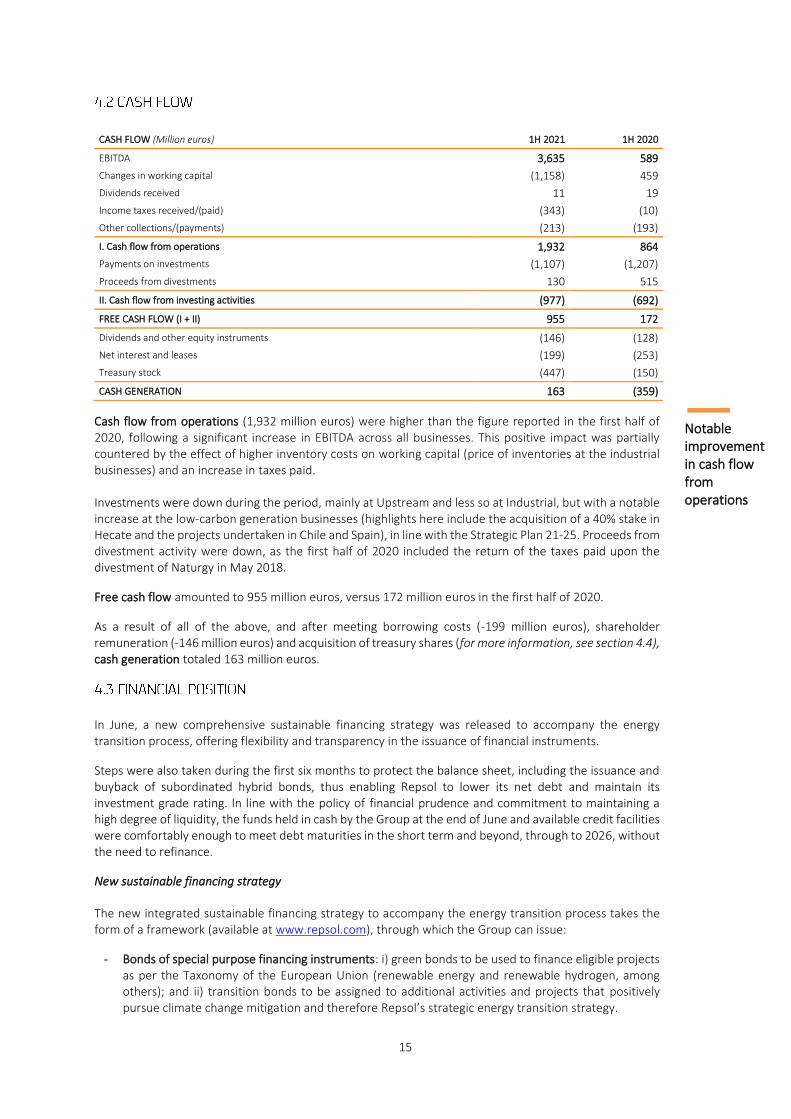
Cash flow from operations (1,932 million euros) were higher than the figure reported in the first half of 2020, following a significant increase in EBITDA across all businesses. This positive impact was partially countered by the effect of higher inventory costs on working capital (price of inventories at the industrial businesses) and an increase in taxes paid. Investments were down during the period, mainly at Upstream and less so at Industrial, but with a notable increase at the low-carbon generation businesses (highlights here include the acquisition of a 40% stake in Hecate and the projects undertaken in Chile and Spain), in line with the Strategic Plan 21-25. Proceeds from divestment activity were down, as the first half of 2020 included the return of the taxes paid upon the divestment of Naturgy in May 2018.
Free cash flow amounted to 955 million euros, versus 172 million euros in the first half of 2020.
As a result of all of the above, and after meeting borrowing costs (-199 million euros), shareholder remuneration (-146 million euros) and acquisition of treasury shares (for more information, see section 4.4), cash generation totaled 163 million euros.
In June, a new comprehensive sustainable financing strategy was released to accompany the energy transition process, offering flexibility and transparency in the issuance of financial instruments.
Steps were also taken during the first six months to protect the balance sheet, including the issuance and buyback of subordinated hybrid bonds, thus enabling Repsol to lower its net debt and maintain its investment grade rating. In line with the policy of financial prudence and commitment to maintaining a high degree of liquidity, the funds held in cash by the Group at the end of June and available credit facilities were comfortably enough to meet debt maturities in the short term and beyond, through to 2026, without the need to refinance.
New sustainable financing strategy
The new integrated sustainable financing strategy to accompany the energy transition process takes the form of a framework (available at www.repsol.com), through which the Group can issue:
- Bonds of special purpose financing instruments: i) green bonds to be used to finance eligible projects as per the Taxonomy of the European Union (renewable energy and renewable hydrogen, among others); and ii) transition bonds to be assigned to additional activities and projects that positively pursue climate change mitigation and therefore Repsol’s strategic energy transition strategy.
Notable improvement in cash flow from operations
16
- Bonds or financial instruments the economic conditions of which are linked to the attainment of the
key sustainability targets of Repsol as a company. These bonds (Sustainability-Linked Bonds, or SLBs) will have as their verifiable indicator the Carbon Intensity Indicator defined by Repsol, which measures the CO2e emissions for every unit of energy that the Company delivers to society (g CO2e/MJ).
Repsol’s new sustainable financing framework, in line with the principles of transparency and best practices, has been verified and certified by rating agency ISS. In July 2021, the Group completed the first issuance of SLB bonds under the new sustainable financing framework, worth a total of 1.25 billion euros. For more information, see section 8.3. Indebtedness
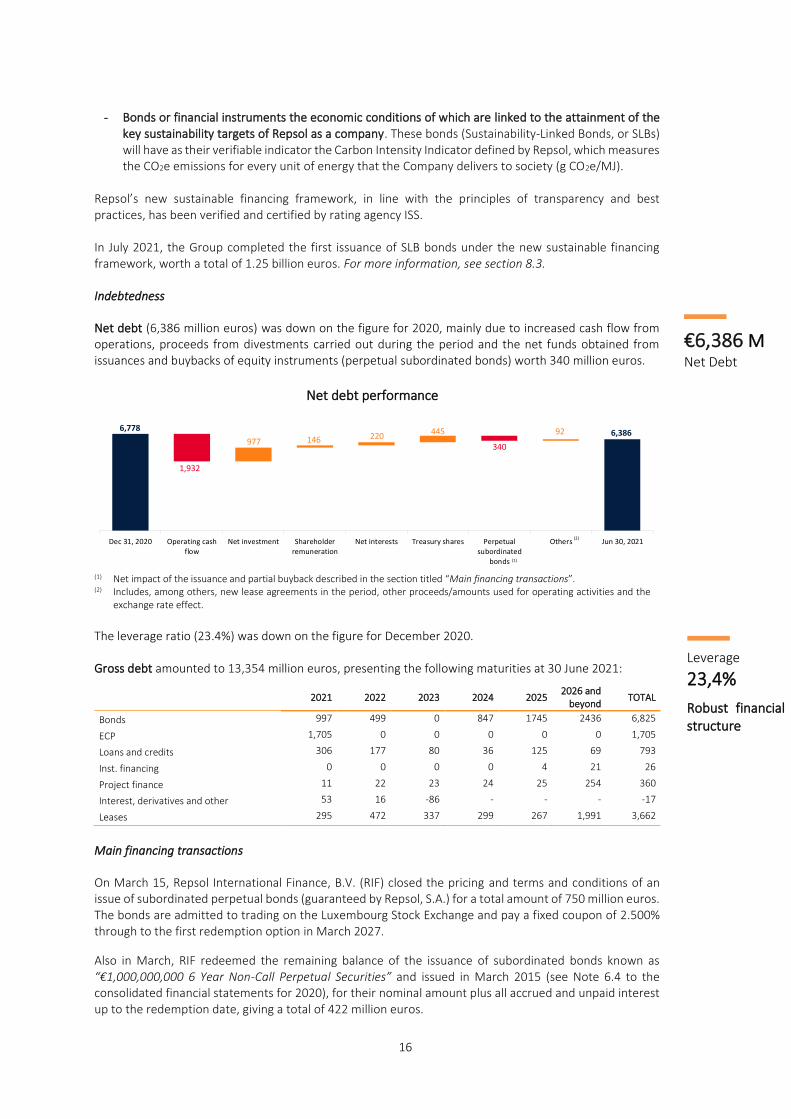
Net debt (6,386 million euros) was down on the figure for 2020, mainly due to increased cash flow from operations, proceeds from divestments carried out during the period and the net funds obtained from issuances and buybacks of equity instruments (perpetual subordinated bonds) worth 340 million euros.
Net debt performance
(1) Net impact of the issuance and partial buyback described in the section titled “Main financing transactions”. (2) Includes, among others, new lease agreements in the period, other proceeds/amounts used for operating activities and the
exchange rate effect.
The leverage ratio (23.4%) was down on the figure for December 2020. Gross debt amounted to 13,354 million euros, presenting the following maturities at 30 June 2021:
2021 2022 2023 2024 2025 2026 and
beyond TOTAL
Bonds 997 499 0 847 1745 2436 6,825
ECP 1,705 0 0 0 0 0 1,705
Loans and credits 306 177 80 36 125 69 793
Inst. financing 0 0 0 0 4 21 26
Project finance 11 22 23 24 25 254 360
Interest, derivatives and other 53 16 -86 - - - -17
Leases 295 472 337 299 267 1,991 3,662
Main financing transactions
On March 15, Repsol International Finance, B.V. (RIF) closed the pricing and terms and conditions of an issue of subordinated perpetual bonds (guaranteed by Repsol, S.A.) for a total amount of 750 million euros. The bonds are admitted to trading on the Luxembourg Stock Exchange and pay a fixed coupon of 2.500% through to the first redemption option in March 2027.
Also in March, RIF redeemed the remaining balance of the issuance of subordinated bonds known as “€1,000,000,000 6 Year Non-Call Perpetual Securities” and issued in March 2015 (see Note 6.4 to the consolidated financial statements for 2020), for their nominal amount plus all accrued and unpaid interest up to the redemption date, giving a total of 422 million euros.
6,7786,386
977340
1,932
146 220445 92
Dec 31, 2020 Operating cashflow
Net investment Shareholderremuneration
Net interests Treasury shares Perpetualsubordinated
bonds
Others Jun 30, 2021
(1)
(2)
€6,386 M Net Debt
Leverage
23,4%
Robust financial structure
17
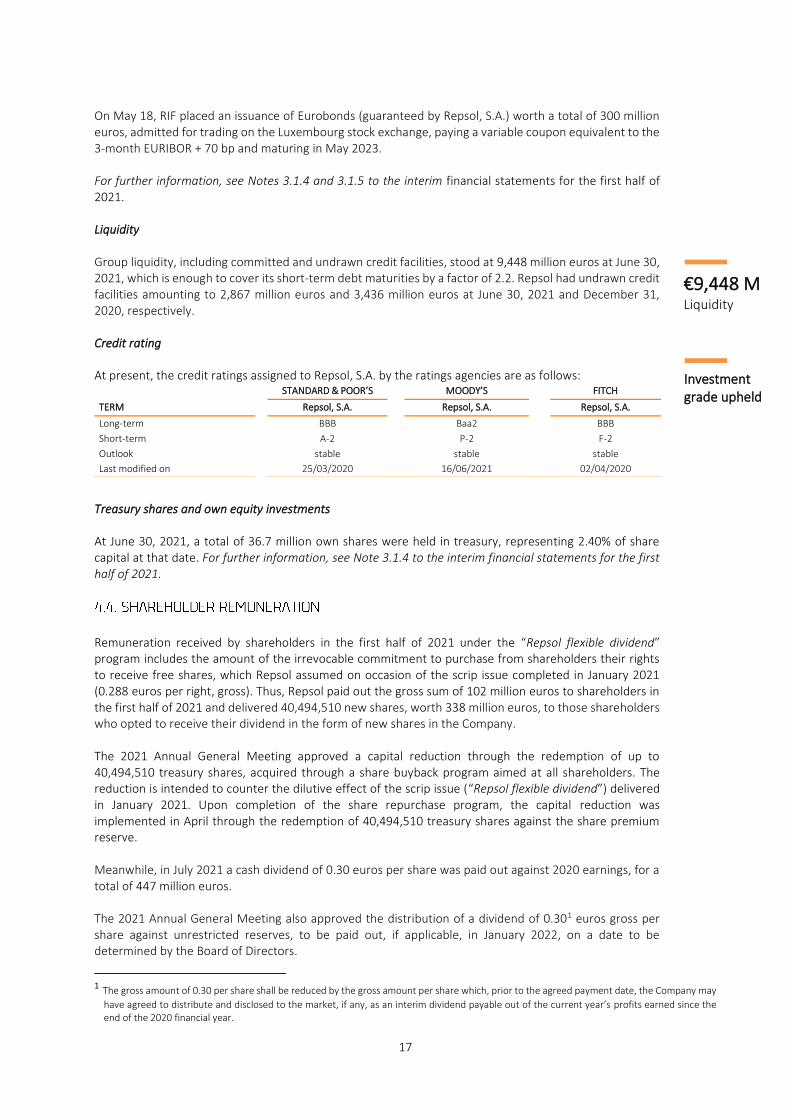
On May 18, RIF placed an issuance of Eurobonds (guaranteed by Repsol, S.A.) worth a total of 300 million euros, admitted for trading on the Luxembourg stock exchange, paying a variable coupon equivalent to the 3-month EURIBOR + 70 bp and maturing in May 2023. For further information, see Notes 3.1.4 and 3.1.5 to the interim financial statements for the first half of 2021. Liquidity Group liquidity, including committed and undrawn credit facilities, stood at 9,448 million euros at June 30, 2021, which is enough to cover its short-term debt maturities by a factor of 2.2. Repsol had undrawn credit facilities amounting to 2,867 million euros and 3,436 million euros at June 30, 2021 and December 31, 2020, respectively. Credit rating
At present, the credit ratings assigned to Repsol, S.A. by the ratings agencies are as follows:
Treasury shares and own equity investments At June 30, 2021, a total of 36.7 million own shares were held in treasury, representing 2.40% of share capital at that date. For further information, see Note 3.1.4 to the interim financial statements for the first half of 2021.
Remuneration received by shareholders in the first half of 2021 under the “Repsol flexible dividend” program includes the amount of the irrevocable commitment to purchase from shareholders their rights to receive free shares, which Repsol assumed on occasion of the scrip issue completed in January 2021 (0.288 euros per right, gross). Thus, Repsol paid out the gross sum of 102 million euros to shareholders in the first half of 2021 and delivered 40,494,510 new shares, worth 338 million euros, to those shareholders who opted to receive their dividend in the form of new shares in the Company. The 2021 Annual General Meeting approved a capital reduction through the redemption of up to 40,494,510 treasury shares, acquired through a share buyback program aimed at all shareholders. The reduction is intended to counter the dilutive effect of the scrip issue (“Repsol flexible dividend”) delivered in January 2021. Upon completion of the share repurchase program, the capital reduction was implemented in April through the redemption of 40,494,510 treasury shares against the share premium reserve. Meanwhile, in July 2021 a cash dividend of 0.30 euros per share was paid out against 2020 earnings, for a total of 447 million euros. The 2021 Annual General Meeting also approved the distribution of a dividend of 0.301 euros gross per share against unrestricted reserves, to be paid out, if applicable, in January 2022, on a date to be determined by the Board of Directors.
1 The gross amount of 0.30 per share shall be reduced by the gross amount per share which, prior to the agreed payment date, the Company may
have agreed to distribute and disclosed to the market, if any, as an interim dividend payable out of the current year’s profits earned since the end of the 2020 financial year.
STANDARD & POOR’S MOODY’S FITCH
TERM Repsol, S.A. Repsol, S.A. Repsol, S.A.
Long-term BBB Baa2 BBB
Short-term A-2 P-2 F-2
Outlook stable stable stable
Last modified on 25/03/2020 16/06/2021 02/04/2020
Investment grade upheld
€9,448 M Liquidity
18
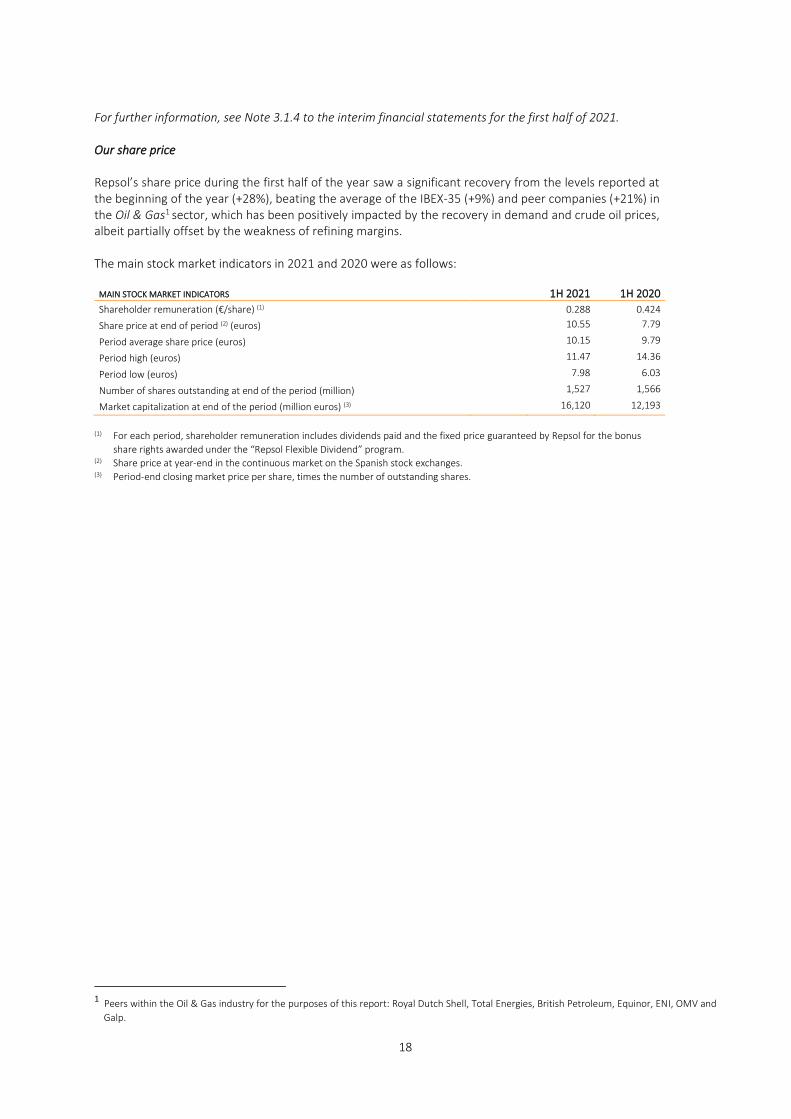
For further information, see Note 3.1.4 to the interim financial statements for the first half of 2021. Our share price Repsol’s share price during the first half of the year saw a significant recovery from the levels reported at the beginning of the year (+28%), beating the average of the IBEX-35 (+9%) and peer companies (+21%) in the Oil & Gas1 sector, which has been positively impacted by the recovery in demand and crude oil prices, albeit partially offset by the weakness of refining margins. The main stock market indicators in 2021 and 2020 were as follows:
MAIN STOCK MARKET INDICATORS
1H 2021 1H 2020
Shareholder remuneration (€/share) (1) 0.288 0.424
Share price at end of period (2) (euros) 10.55 7.79
Period average share price (euros) 10.15 9.79
Period high (euros) 11.47 14.36
Period low (euros) 7.98 6.03
Number of shares outstanding at end of the period (million) 1,527 1,566
Market capitalization at end of the period (million euros) (3) 16,120 12,193
(1) For each period, shareholder remuneration includes dividends paid and the fixed price guaranteed by Repsol for the bonus
share rights awarded under the “Repsol Flexible Dividend” program. (2) Share price at year-end in the continuous market on the Spanish stock exchanges. (3) Period-end closing market price per share, times the number of outstanding shares.
1 Peers within the Oil & Gas industry for the purposes of this report: Royal Dutch Shell, Total Energies, British Petroleum, Equinor, ENI, OMV and
Galp.
19
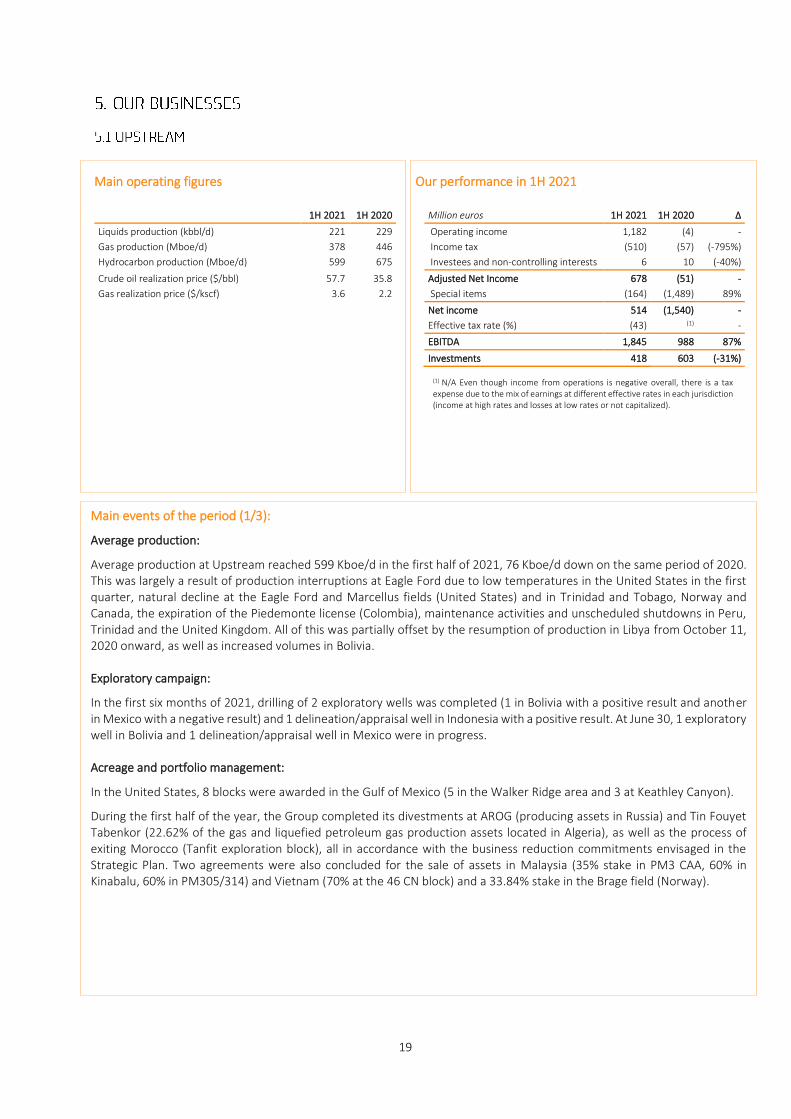
Main operating figures Our performance in 1H 2021
1H 2021 1H 2020 Million euros 1H 2021 1H 2020 ∆
Liquids production (kbbl/d) 221 229 Operating income 1,182 (4) -
Gas production (Mboe/d) 378 446 Income tax (510) (57) (-795%)
Hydrocarbon production (Mboe/d) 599 675 Investees and non-controlling interests 6 10 (-40%)
Crude oil realization price ($/bbl) 57.7 35.8 Adjusted Net Income 678 (51) -
Gas realization price ($/kscf) 3.6 2.2 Special items (164) (1,489) 89%
Net income 514 (1,540) -
Effective tax rate (%) (43) (1) -
EBITDA 1,845 988 87%
Investments 418 603 (-31%)
Main events of the period (1/3):
Average production:
Average production at Upstream reached 599 Kboe/d in the first half of 2021, 76 Kboe/d down on the same period of 2020. This was largely a result of production interruptions at Eagle Ford due to low temperatures in the United States in the first quarter, natural decline at the Eagle Ford and Marcellus fields (United States) and in Trinidad and Tobago, Norway and Canada, the expiration of the Piedemonte license (Colombia), maintenance activities and unscheduled shutdowns in Peru, Trinidad and the United Kingdom. All of this was partially offset by the resumption of production in Libya from October 11, 2020 onward, as well as increased volumes in Bolivia. Exploratory campaign:
In the first six months of 2021, drilling of 2 exploratory wells was completed (1 in Bolivia with a positive result and another in Mexico with a negative result) and 1 delineation/appraisal well in Indonesia with a positive result. At June 30, 1 exploratory well in Bolivia and 1 delineation/appraisal well in Mexico were in progress. Acreage and portfolio management:
In the United States, 8 blocks were awarded in the Gulf of Mexico (5 in the Walker Ridge area and 3 at Keathley Canyon).
During the first half of the year, the Group completed its divestments at AROG (producing assets in Russia) and Tin Fouyet Tabenkor (22.62% of the gas and liquefied petroleum gas production assets located in Algeria), as well as the process of exiting Morocco (Tanfit exploration block), all in accordance with the business reduction commitments envisaged in the Strategic Plan. Two agreements were also concluded for the sale of assets in Malaysia (35% stake in PM3 CAA, 60% in Kinabalu, 60% in PM305/314) and Vietnam (70% at the 46 CN block) and a 33.84% stake in the Brage field (Norway).
(1) N/A Even though income from operations is negative overall, there is a tax expense due to the mix of earnings at different effective rates in each jurisdiction (income at high rates and losses at low rates or not capitalized).
20
Main events of the period (2/3):
NORTH AMERICA
United States
▪ In February, the FEED (front-end engineering and design) process got under way for phase one of the Pikka project at the North Slope development in Alaska, which envisions the drilling of 43 wells and the construction of a plant capable of producing 80,000 barrels/day. The final investment decision is expected in 2022 and the start of production is slated for 2025.
▪ In May, the local unit has reached production figures of 20 Mboe at Buckskin, in deep waters off the Gulf of Mexico, within the space of two years and moreover with only two wells producing oil (together they produce 42 kboe/d, gross; 8.275 kboe/d for Repsol).
LATIN AMERICA
Brazil
▪ In March, Repsol and its partners Equinor and Petrobras approved the Development Concept for the BM-C-33 block, a gas and condensate field located within the Campos basin in Brazil’s pre-salt layer.
▪ In May, Repsol embarked on a project to develop CO2 capture projects for the production of green hydrocarbons and chemicals (environmentally friendly diesel and gasoline, or even special kerosene waxes) through industrial processes that do not emit greenhouse gases.
Peru:
▪ In February, Repsol returned exploratory block 103. Operations at the block had been suspended due to a force majeure event declared in 2008.
Bolivia
▪ In January, drilling of the Boicobo south-X1ST (BCS-X1ST) exploratory well was completed with positive results. Preliminary estimates place the discovery at around 1 TCF (trillion cubic feet) of reserves and prospective resources.
▪ In April and May, the Margarita block announced the commissioning of a new water treatment plant capable of processing 6,800 barrels of water per day and a new compression plant, which has helped increase recoverable reserves and gas deliveries to the market.
EUROPE AND AFRICA
Norway
▪ In January, the Mærsk Inspirer mobile offshore drilling and production unit was successfully installed at the YME field. After achieving this milestone, first oil is expected to be extracted in the second half of 2021. In May 2020, Repsol agreed with Maersk Drilling to take over the operation of the platform, thus generating further operational and contractual synergies for the YME license.
▪ In June, an agreement was reached to sell a 33.84% stake in the Brage field to Singapore-based company Lime Petroleum. There are five licenses involved in the operation (PL 053B, PL 055, PL 055B, PL 055D and PL 185), all of which expire in April 2030.
Spain
▪ In January, Repsol informed the Ministry for the Ecological Transition and the Demographic Challenge that it was withdrawing from four oil wells: Casablanca-11, Casablanca-12 and Rodaballo-1 at the Casablanca platform off the coast of Tarragona and at Albatros off the coast of Vizcaya.
▪ In June, the Cessation of Production (CoP) of the Casablanca platform in Tarragona was carried out after 40 years in operation.
21
Main events of the period (3/3):
Greece
▪ In March, following Repsol and Energean’s decision not to continue with the second phase of exploration, the Aitoloakarnania block was relinquished.
Algeria
▪ In June, Repsol completed the transfer of its stake in the Tin Fouyet Tabenkor (TFT) production asset. Repsol had held a 22.62% stake in the gas and liquefied petroleum gas (LPG) producing asset.
Libya
▪ Following the joint ceasefire declaration agreed between the officially established UN-backed government in Tripoli (GNA) and the Libyan National Army (LNA) with the backing of the international community in September 2020, production was restored on 11 October 2020, with no interruptions since then.
Morocco
▪ In the first half of the year, Repsol returned the Tanfit I-VI exploration concession at the Missour Basin, where it was the operator and held a 37.5% WI, thus ending its presence in the country.
ASIA, RUSSIA AND REST OF THE WORLD
Indonesia
▪ In January, Repsol received clearance from local regulator SSK Migas to proceed with phase I development of the Kali Berau Dalam field at the Sakakemang block in South Sumatra. The aim under Phase I of the development plan is to produce gas reserves in the order of 445.10 billion cubic feet (BCF).
▪ In April, the Kaliberau Dalam-3X delineation/appraisal well at the Sakakemang block was completed with positive results.
Malaysia and Vietnam
▪ In June, Repsol agreed to sell its interests at the PM3 CAA, Kinabalu, PM305/314 assets in Malaysia and block 46 CN in Vietnam (an asset connected to the PM3 CAA production facilities) to a subsidiary of Hibiscus Petroleum, a listed company based in Kuala Lumpur. The deal, which is expected to be completed during the second half of 2021, is subject to regulatory approval and waiver of the partners’ pre-emption rights.
▪ Russia
▪ In May, Repsol sold its 49% WI in AR Oil & Gas (AROG), its joint venture with Alliance Oil (51%), thus marking an end to Repsol’s oil production activity in Russia. AR Oil & Gas (AROG) is the owner of Saneco and Tatneftteotdacha, two small producers with oil assets in the Samara region and the Republic of Tatarstan. However, Repsol retains an interest in exploratory activities in Russia through its partnership with Gazprom Neft.
22
Main operating figures Our performance in 1H 2021
1H 2021 1H 2020 Million euros 1H 2021 1H 2020 ∆
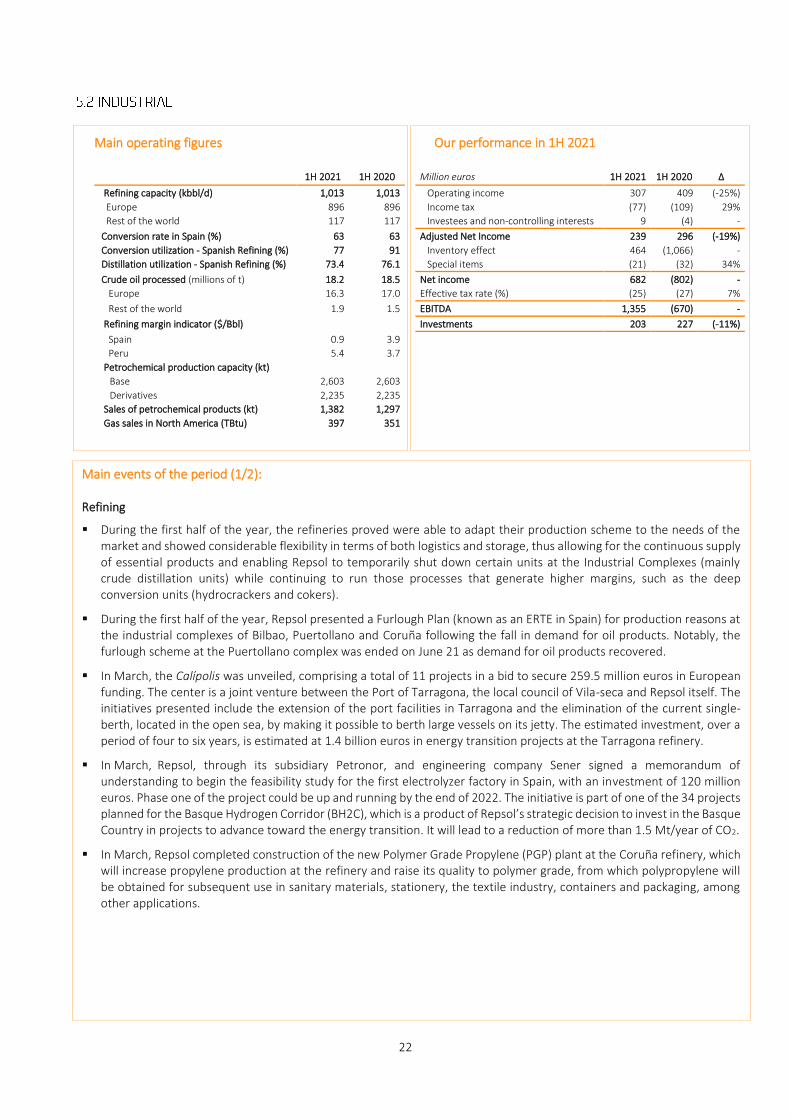
Refining capacity (kbbl/d) 1,013 1,013 Operating income 307 409 (-25%)
Europe 896 896 Income tax (77) (109) 29%
Rest of the world 117 117 Investees and non-controlling interests 9 (4) -
Conversion rate in Spain (%) 63 63 Adjusted Net Income 239 296 (-19%)
Conversion utilization - Spanish Refining (%) 77 91 Inventory effect 464 (1,066) -
Distillation utilization - Spanish Refining (%) 73.4 76.1 Special items (21) (32) 34%
Crude oil processed (millions of t) 18.2 18.5 Net income 682 (802) -
Europe 16.3 17.0 Effective tax rate (%) (25) (27) 7%
Rest of the world 1.9 1.5 EBITDA 1,355 (670) -
Refining margin indicator ($/Bbl) Investments 203 227 (-11%)
Spain 0.9 3.9 Peru 5.4 3.7 Petrochemical production capacity (kt)
Base 2,603 2,603 Derivatives 2,235 2,235
Sales of petrochemical products (kt) 1,382 1,297 Gas sales in North America (TBtu) 397 351
Main events of the period (1/2): Refining
▪ During the first half of the year, the refineries proved were able to adapt their production scheme to the needs of the market and showed considerable flexibility in terms of both logistics and storage, thus allowing for the continuous supply of essential products and enabling Repsol to temporarily shut down certain units at the Industrial Complexes (mainly crude distillation units) while continuing to run those processes that generate higher margins, such as the deep conversion units (hydrocrackers and cokers).
▪ During the first half of the year, Repsol presented a Furlough Plan (known as an ERTE in Spain) for production reasons at the industrial complexes of Bilbao, Puertollano and Coruña following the fall in demand for oil products. Notably, the furlough scheme at the Puertollano complex was ended on June 21 as demand for oil products recovered.
▪ In March, the Calípolis was unveiled, comprising a total of 11 projects in a bid to secure 259.5 million euros in European funding. The center is a joint venture between the Port of Tarragona, the local council of Vila-seca and Repsol itself. The initiatives presented include the extension of the port facilities in Tarragona and the elimination of the current single-berth, located in the open sea, by making it possible to berth large vessels on its jetty. The estimated investment, over a period of four to six years, is estimated at 1.4 billion euros in energy transition projects at the Tarragona refinery.
▪ In March, Repsol, through its subsidiary Petronor, and engineering company Sener signed a memorandum of understanding to begin the feasibility study for the first electrolyzer factory in Spain, with an investment of 120 million euros. Phase one of the project could be up and running by the end of 2022. The initiative is part of one of the 34 projects planned for the Basque Hydrogen Corridor (BH2C), which is a product of Repsol’s strategic decision to invest in the Basque Country in projects to advance toward the energy transition. It will lead to a reduction of more than 1.5 Mt/year of CO2.
▪ In March, Repsol completed construction of the new Polymer Grade Propylene (PGP) plant at the Coruña refinery, which will increase propylene production at the refinery and raise its quality to polymer grade, from which polypropylene will be obtained for subsequent use in sanitary materials, stationery, the textile industry, containers and packaging, among other applications.
.
23
Main events of the period (2/2):
Chemicals
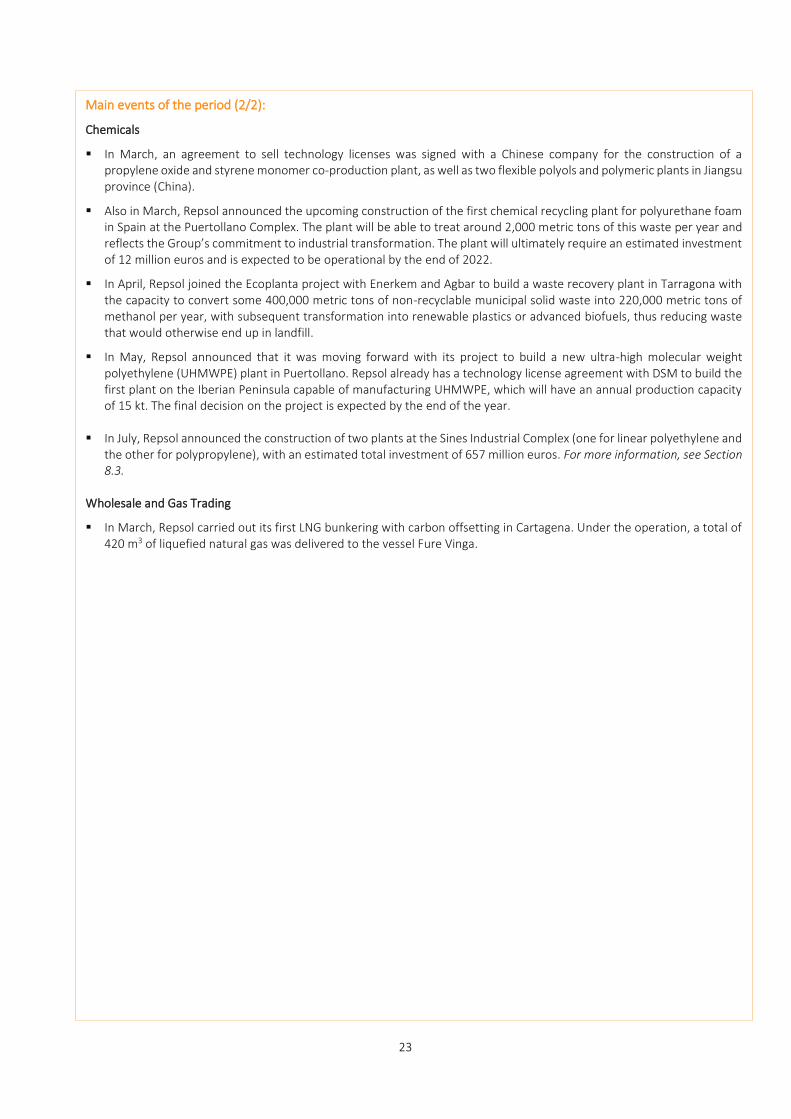
▪ In March, an agreement to sell technology licenses was signed with a Chinese company for the construction of a propylene oxide and styrene monomer co-production plant, as well as two flexible polyols and polymeric plants in Jiangsu province (China).
▪ Also in March, Repsol announced the upcoming construction of the first chemical recycling plant for polyurethane foam in Spain at the Puertollano Complex. The plant will be able to treat around 2,000 metric tons of this waste per year and reflects the Group’s commitment to industrial transformation. The plant will ultimately require an estimated investment of 12 million euros and is expected to be operational by the end of 2022.
▪ In April, Repsol joined the Ecoplanta project with Enerkem and Agbar to build a waste recovery plant in Tarragona with the capacity to convert some 400,000 metric tons of non-recyclable municipal solid waste into 220,000 metric tons of methanol per year, with subsequent transformation into renewable plastics or advanced biofuels, thus reducing waste that would otherwise end up in landfill.
▪ In May, Repsol announced that it was moving forward with its project to build a new ultra-high molecular weight polyethylene (UHMWPE) plant in Puertollano. Repsol already has a technology license agreement with DSM to build the first plant on the Iberian Peninsula capable of manufacturing UHMWPE, which will have an annual production capacity of 15 kt. The final decision on the project is expected by the end of the year.
▪ In July, Repsol announced the construction of two plants at the Sines Industrial Complex (one for linear polyethylene and
the other for polypropylene), with an estimated total investment of 657 million euros. For more information, see Section 8.3.
Wholesale and Gas Trading
▪ In March, Repsol carried out its first LNG bunkering with carbon offsetting in Cartagena. Under the operation, a total of 420 m3 of liquefied natural gas was delivered to the vessel Fure Vinga.
24
Main operating figures Our performance in 1H 2021
1H
2021 1H
2020 Million euros
1H 2021
1H 2020
∆
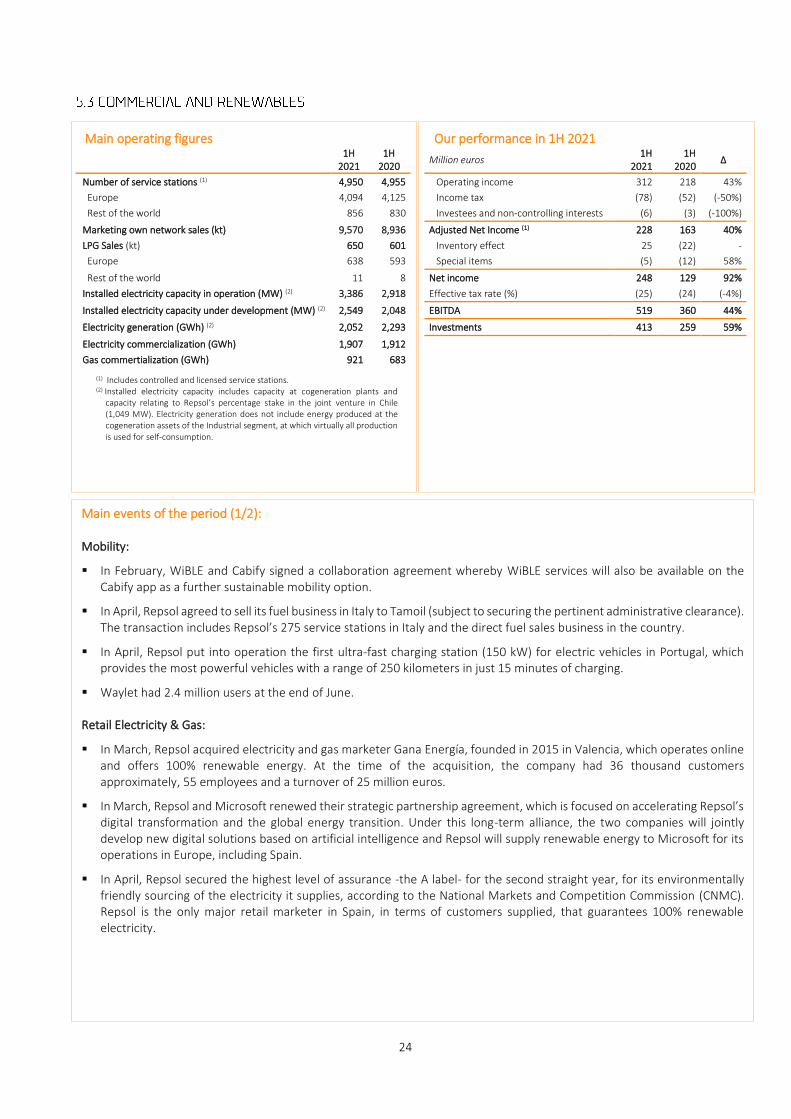
Number of service stations (1) 4,950 4,955 Operating income 312 218 43%
Europe 4,094 4,125 Income tax (78) (52) (-50%)
Rest of the world 856 830 Investees and non-controlling interests (6) (3) (-100%)
Marketing own network sales (kt) 9,570 8,936 Adjusted Net Income (1) 228 163 40%
LPG Sales (kt) 650 601 Inventory effect 25 (22) -
Europe 638 593 Special items (5) (12) 58%
Rest of the world 11 8 Net income 248 129 92%
Installed electricity capacity in operation (MW) (2) 3,386 2,918 Effective tax rate (%) (25) (24) (-4%)
Installed electricity capacity under development (MW) (2) 2,549 2,048 EBITDA 519 360 44%
Electricity generation (GWh) (2) 2,052 2,293 Investments 413 259 59%
Electricity commercialization (GWh) 1,907 1,912
Gas commertialization (GWh) 921 683
Main events of the period (1/2): Mobility:
▪ In February, WiBLE and Cabify signed a collaboration agreement whereby WiBLE services will also be available on the Cabify app as a further sustainable mobility option.
▪ In April, Repsol agreed to sell its fuel business in Italy to Tamoil (subject to securing the pertinent administrative clearance). The transaction includes Repsol’s 275 service stations in Italy and the direct fuel sales business in the country.
▪ In April, Repsol put into operation the first ultra-fast charging station (150 kW) for electric vehicles in Portugal, which provides the most powerful vehicles with a range of 250 kilometers in just 15 minutes of charging.
▪ Waylet had 2.4 million users at the end of June.
Retail Electricity & Gas:
▪ In March, Repsol acquired electricity and gas marketer Gana Energía, founded in 2015 in Valencia, which operates online and offers 100% renewable energy. At the time of the acquisition, the company had 36 thousand customers approximately, 55 employees and a turnover of 25 million euros.
▪ In March, Repsol and Microsoft renewed their strategic partnership agreement, which is focused on accelerating Repsol’s digital transformation and the global energy transition. Under this long-term alliance, the two companies will jointly develop new digital solutions based on artificial intelligence and Repsol will supply renewable energy to Microsoft for its operations in Europe, including Spain.
▪ In April, Repsol secured the highest level of assurance -the A label- for the second straight year, for its environmentally friendly sourcing of the electricity it supplies, according to the National Markets and Competition Commission (CNMC). Repsol is the only major retail marketer in Spain, in terms of customers supplied, that guarantees 100% renewable electricity.
(1) Includes controlled and licensed service stations.
(2) Installed electricity capacity includes capacity at cogeneration plants and capacity relating to Repsol’s percentage stake in the joint venture in Chile (1,049 MW). Electricity generation does not include energy produced at the cogeneration assets of the Industrial segment, at which virtually all production is used for self-consumption.
25
Main events of the period (2/2):
Lubricants, Asphalts, Aviation and Specialties:
▪ In March, Repsol launched EV-FLUIDS, a new range of lubricants exclusively for electric vehicles and motorbikes, thus cementing its leadership in lubricants in the Iberian Peninsula.
LPG:
▪ On January 1, the P15Y marking on I350 cylinders began at the Algeciras factory and at approved workshops. The marking increases the useful life of the products by a further five years.
▪ In February, Repsol sold the last 4,230 piped propane supply points to Redexis. This latest deal comes on top of the one carried out in 2015, in which Redexis acquired 70,000 points.
▪ In March, Repsol launched the new QueroGás platform, which allows orders to be placed for Repsol Gas cylinders in Portugal.
Low Carbon Generation:
▪ In May, Repsol started work on Delta II, which will have a total capacity of 859 MW, distributed among 26 wind farms located in the three provinces of Aragon (Zaragoza, Huesca and Teruel). In this phase one of construction, Repsol has begun work on the first two wind farms, totaling 60 MW, which are scheduled to come on stream in the first quarter of 2022. Delta II is slated for completion in 2023, whereupon it will be able to supply electricity to around 800,000 homes.
▪ In May, Repsol signed an agreement to acquire 40% of Hecate Energy, a US company engaged in the development of photovoltaic and battery projects for energy storage. Hecate Energy has a portfolio of over 40 GW of renewable and storage projects under development. Of this number, 16.8 GW relate to advanced photovoltaic projects and 4.3 GW to battery projects. The vast majority of Hecate Energy’s assets are located in US electricity markets.
The agreement is fully aligned with Repsol’s 21-25 Strategic Plan and represents a significant step toward the goals of achieving low-emission generation capacity and the internationalization of this business by 2025, making Repsol a major player in the US photovoltaic and battery sector.
▪ In May, Repsol and Krean (Mondragon Corporation) joined forces to promote the creation of citizen cooperatives for renewable generation, through the launch of Ekiluz. This type of energy community will enable widespread access to photovoltaic electricity, even in complex environments such as city centers or rural areas, by installing solar panels for a very long period of operation (25 years or even longer).
▪ During the first half of the year, commercial operation under phase one of the Kappa photovoltaic project got underway, with 90.5 MW of installed capacity, while phase one of the Valdesolar photovoltaic project, with 47.8 MW of installed capacity, began operational testing. In addition, Repsol and the Ibereólica Renovables Group began construction of phase two of the Cabo Leones III wind farm in Chile, with a capacity of 110 MW (55 MW relating to Repsol). Phase one of this wind farm, with an installed capacity of 78 MW (39 MW relating to Repsol), began commercial operation in December 2020.
▪ Phase two of the Kappa project (36.1 MW) and phases two and three of the Valdesolar photovoltaic plant (215.9 MW)
are due to be completed in the latter half of the year.
26
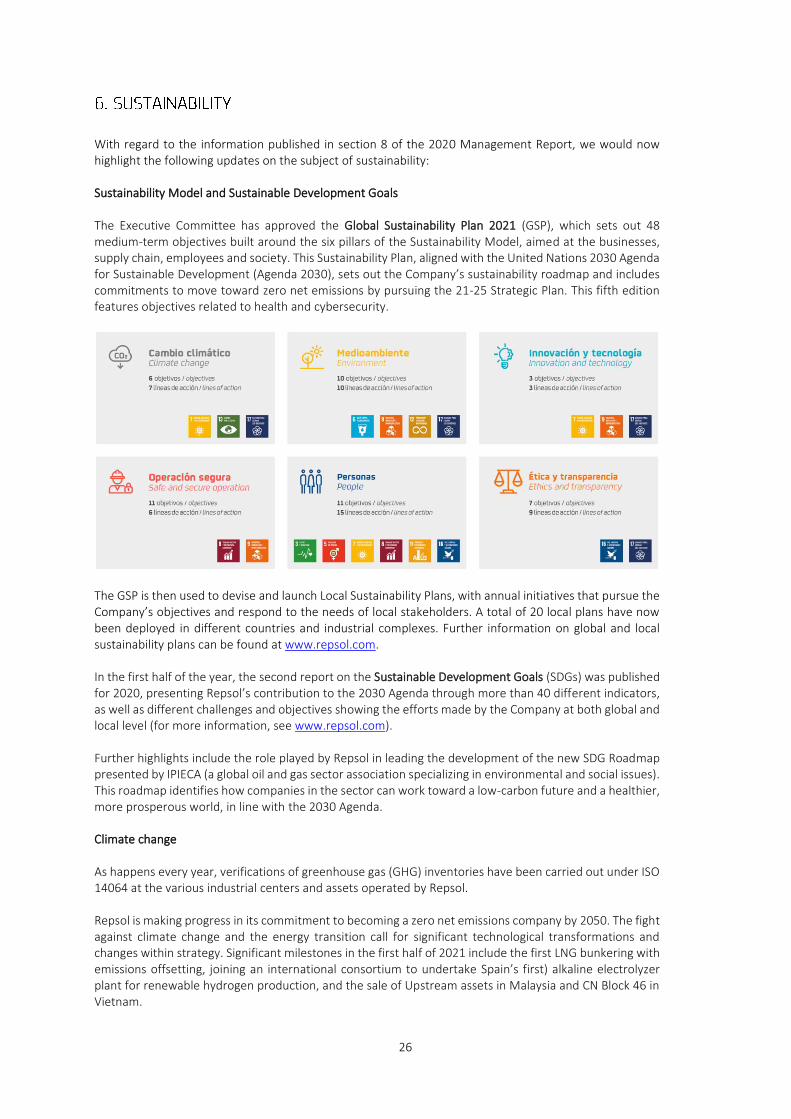
With regard to the information published in section 8 of the 2020 Management Report, we would now highlight the following updates on the subject of sustainability: Sustainability Model and Sustainable Development Goals The Executive Committee has approved the Global Sustainability Plan 2021 (GSP), which sets out 48 medium-term objectives built around the six pillars of the Sustainability Model, aimed at the businesses, supply chain, employees and society. This Sustainability Plan, aligned with the United Nations 2030 Agenda for Sustainable Development (Agenda 2030), sets out the Company’s sustainability roadmap and includes commitments to move toward zero net emissions by pursuing the 21-25 Strategic Plan. This fifth edition features objectives related to health and cybersecurity.
The GSP is then used to devise and launch Local Sustainability Plans, with annual initiatives that pursue the Company’s objectives and respond to the needs of local stakeholders. A total of 20 local plans have now been deployed in different countries and industrial complexes. Further information on global and local sustainability plans can be found at www.repsol.com.
In the first half of the year, the second report on the Sustainable Development Goals (SDGs) was published for 2020, presenting Repsol’s contribution to the 2030 Agenda through more than 40 different indicators, as well as different challenges and objectives showing the efforts made by the Company at both global and local level (for more information, see www.repsol.com).
Further highlights include the role played by Repsol in leading the development of the new SDG Roadmap presented by IPIECA (a global oil and gas sector association specializing in environmental and social issues). This roadmap identifies how companies in the sector can work toward a low-carbon future and a healthier, more prosperous world, in line with the 2030 Agenda.
Climate change As happens every year, verifications of greenhouse gas (GHG) inventories have been carried out under ISO 14064 at the various industrial centers and assets operated by Repsol. Repsol is making progress in its commitment to becoming a zero net emissions company by 2050. The fight against climate change and the energy transition call for significant technological transformations and changes within strategy. Significant milestones in the first half of 2021 include the first LNG bunkering with emissions offsetting, joining an international consortium to undertake Spain’s first) alkaline electrolyzer plant for renewable hydrogen production, and the sale of Upstream assets in Malaysia and CN Block 46 in Vietnam.
27
Repsol has also devised a global sustainable financing framework to accompany and support its decarbonization strategy. For more information, see Section 4.3. Circular economy During the first half of the year, the Company made further progress in developing its roster of strategic projects, such as the construction of the biorefinery in Cartagena and the production of new grades of the Reciclex® range, a material featuring a high percentage of recycled plastics. The progress made toward these projects will help the Company accomplish its long-term objectives: achieving a production capacity of two million metric tons of advanced biofuels by 2050 and recycling the equivalent of 20% of our polyolefin production by 2030.
Meanwhile, Repsol continues to define new projects that reflect its strategic objectives. Notable examples include the construction of the first polyurethane foam recycling plant at Puertollano and the alliance with Enerkem and Agbar to build the first plant on the Iberian Peninsula (Tarragona) that will transform waste into chemical by-products. Technology and digitalization
During the first half of the year, the Company continued to make progress in the development of cutting-edge decarbonization technologies. Highlights include the launch of Tech Lab at the pilot photoelectrocatalysis plant for the production of renewable hydrogen developed together with Enagas, and the start of the conceptual engineering of the demo e-fuels and waste-to-gas plants. The Company has also been working toward the design of advanced industrial products, such as the EMS (Energy Management System) product, a highly efficient energy management system that relies on artificial intelligence algorithms and advanced optimization. It is mainly aimed at customers in the commercial segment and will be tested in real environments thanks to the collaboration agreements signed with various partners. In addition, state-of-the-art enabling technologies such as robotization, computational chemistry and advanced simulation continue to be implemented as key levers in transforming the Company’s assets in order to optimize operations and facilitate decision-making. On the subject of digitalization, more than 40% of the cases included in Repsol’s digital portfolio contribute directly to the SDGs. New digital cases and functionalities with a direct impact on sustainability were implemented in the first half of 2021, especially in the realm of emissions reductions and energy consumption. Notable examples here include various initiatives that rely on satellite imagery to detect fugitive methane emissions by applying Artificial Intelligence models or deploying a single, standard methodology for calculating emissions at all our Upstream assets; in the industrial realm, we have the transportation of raw materials and products at industrial facilities to achieve low CO2 emissions; initiatives to reduce emissions at the trading business by lowering bunker consumption (fuel in ships); or the market launch of new functionalities for our customers, such as “origin of your energy”, which introduces Repsol’s renewable energy farms to customers, who can choose the wind turbine or the section of solar panels from which they want their energy to come and view the production of their farm in real time. Repsol has also continued to migrate its applications to the cloud, which has positively impacted energy efficiency. It has also continued to strengthen the technologies that allow for remote and distributed working arrangements.
In the calls for expressions of interest for Next Generation European funds launched by the Government of Spain, Repsol presented a portfolio of 31 projects that combine technology, decarbonization and circular economy, the creation of quality jobs and territorial balance, for a total associated investment of 6,359 billion euros. There are eight renewable hydrogen projects, nine circular economy projects, four renewable generation and storage projects, eight distributed energy and electric mobility projects, one addressing digital transformation infrastructure and the last one focusing on transforming the energy value chain through artificial intelligence and data economics.
28
People Repsol has continued to focus on the proper management of COVID-19, carrying out local actions in countries, adapting protocols accordingly as the pandemic has evolved (maximum human presence on site, secure facilities, diagnostic protocols, etc.), monitoring cases and liaising and providing all the necessary information to the health authorities in order to mitigate the risk. At the operational level, Repsol is in the midst of a transformation process. A new organizational structure has been implemented to put our customers at the center of our commercial business and to meet any and all energy and mobility needs. At the corporate and business staffing areas, Repsol has proceeded to flatten the organizational structure and set up broader management scopes to streamline decision-making, gain flexibility and facilitate communication and collaboration flows. At some of the industrial complexes, temporary furlough schemes (known as ERTEs in Spain) have been presented to address the drop in demand and prevailing market conditions. The total headcount in June 2021 was 24,542. Employees on permanent contracts numbered 21,965, compared with 22,281 in December 2020. An Expert Group on Human Rights was also set up at Repsol in the first half of the year, comprising the company’s specialized areas and departments on all matters relating to human rights. This group coordinates the global strategy, optimizes internal coordination between the businesses and expert areas, undertakes new projects and shares best practices on human rights. One of its first initiatives was to launch a new course on human rights available to all employees in 2021 and to be rolled out across the value chain from 2022 onward.
Safe operation Due to the ongoing threat posed by the COVID-19 health crisis, we have been forced to run our main operations under unprecedented conditions for a long period of time. While this situation persists, Repsol has focused on business continuity and had to cope with limited on-site presence of personnel. It has also sought to prioritize health aspects, requiring us to rethink processes, toughen risk management and continue to ensure the sound management of the health emergency. In these complex times, accident ratios have continued to fall, as they had been doing prior to 2020. Safety, crisis and emergency management training has been maintained and redesigned to make us more ready and to incorporate aspects of remote management, while making us more adept at responding to lasting global crises.
Responsible tax policy In the first half of 2021, Repsol paid 5,227 million euros in taxes and similar public levies, having filed more than 25,000 tax returns. Repsol’s tax contribution relating to environmental protection amounted to 2,600 million euros1 (2,262 million euros in the first half of 2020).
1 It includes both the tax burden borne (electricity taxes, energy efficiency fund, cost of CO2 emissions, etc.) and the taxes collected from third
parties (excise taxes on fuels -according to Eurostat criteria- some of which have a partial environmental component).
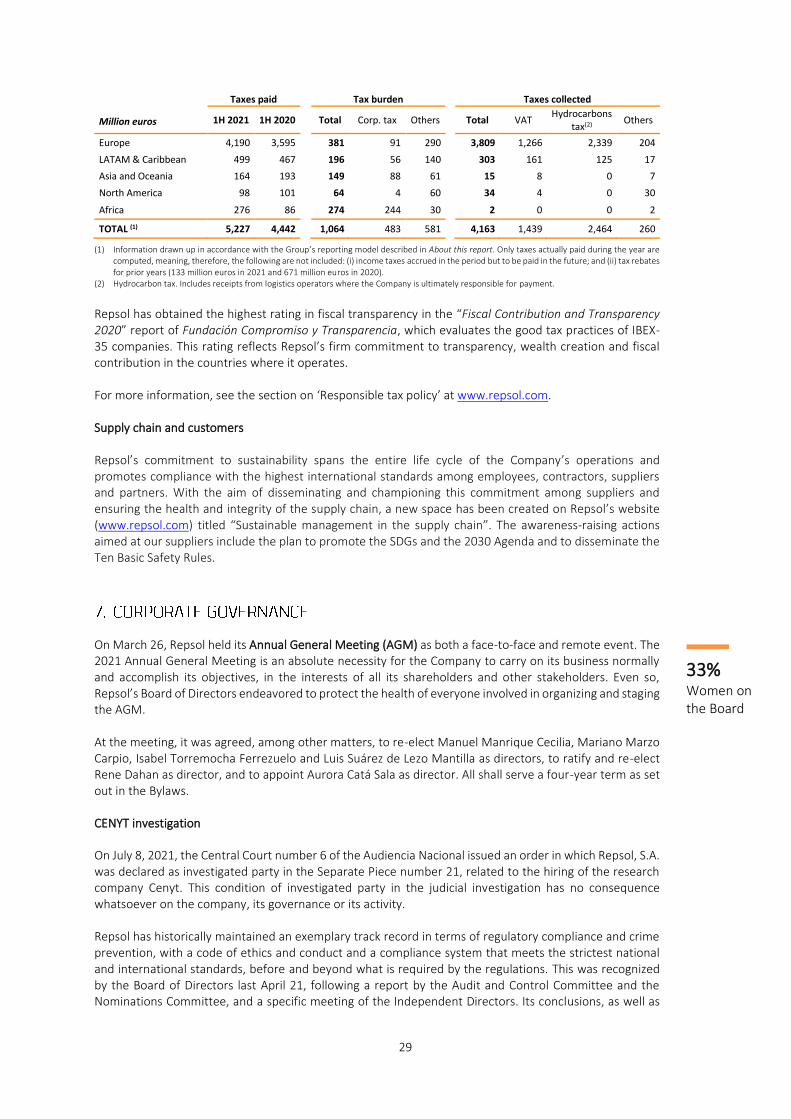
29
Taxes paid Tax burden Taxes collected
1H 2021 1H 2020
Total Corp. tax Others
Total VAT Hydrocarbons
tax(2) Others Million euros
Europe 4,190 3,595 381 91 290 3,809 1,266 2,339 204
LATAM & Caribbean 499 467 196 56 140 303 161 125 17
Asia and Oceania 164 193 149 88 61 15 8 0 7
North America 98 101 64 4 60 34 4 0 30
Africa 276 86 274 244 30 2 0 0 2
TOTAL (1) 5,227 4,442 1,064 483 581 4,163 1,439 2,464 260
(1) Information drawn up in accordance with the Group’s reporting model described in About this report. Only taxes actually paid during the year are computed, meaning, therefore, the following are not included: (i) income taxes accrued in the period but to be paid in the future; and (ii) tax rebates for prior years (133 million euros in 2021 and 671 million euros in 2020).
(2) Hydrocarbon tax. Includes receipts from logistics operators where the Company is ultimately responsible for payment.
Repsol has obtained the highest rating in fiscal transparency in the “Fiscal Contribution and Transparency 2020” report of Fundación Compromiso y Transparencia, which evaluates the good tax practices of IBEX-35 companies. This rating reflects Repsol’s firm commitment to transparency, wealth creation and fiscal contribution in the countries where it operates.
For more information, see the section on ‘Responsible tax policy’ at www.repsol.com.
Supply chain and customers Repsol’s commitment to sustainability spans the entire life cycle of the Company’s operations and promotes compliance with the highest international standards among employees, contractors, suppliers and partners. With the aim of disseminating and championing this commitment among suppliers and ensuring the health and integrity of the supply chain, a new space has been created on Repsol’s website (www.repsol.com) titled “Sustainable management in the supply chain”. The awareness-raising actions aimed at our suppliers include the plan to promote the SDGs and the 2030 Agenda and to disseminate the Ten Basic Safety Rules.
On March 26, Repsol held its Annual General Meeting (AGM) as both a face-to-face and remote event. The 2021 Annual General Meeting is an absolute necessity for the Company to carry on its business normally and accomplish its objectives, in the interests of all its shareholders and other stakeholders. Even so, Repsol’s Board of Directors endeavored to protect the health of everyone involved in organizing and staging the AGM. At the meeting, it was agreed, among other matters, to re-elect Manuel Manrique Cecilia, Mariano Marzo Carpio, Isabel Torremocha Ferrezuelo and Luis Suárez de Lezo Mantilla as directors, to ratify and re-elect Rene Dahan as director, and to appoint Aurora Catá Sala as director. All shall serve a four-year term as set out in the Bylaws. CENYT investigation
On July 8, 2021, the Central Court number 6 of the Audiencia Nacional issued an order in which Repsol, S.A. was declared as investigated party in the Separate Piece number 21, related to the hiring of the research company Cenyt. This condition of investigated party in the judicial investigation has no consequence whatsoever on the company, its governance or its activity. Repsol has historically maintained an exemplary track record in terms of regulatory compliance and crime prevention, with a code of ethics and conduct and a compliance system that meets the strictest national and international standards, before and beyond what is required by the regulations. This was recognized by the Board of Directors last April 21, following a report by the Audit and Control Committee and the Nominations Committee, and a specific meeting of the Independent Directors. Its conclusions, as well as
33% Women on the Board
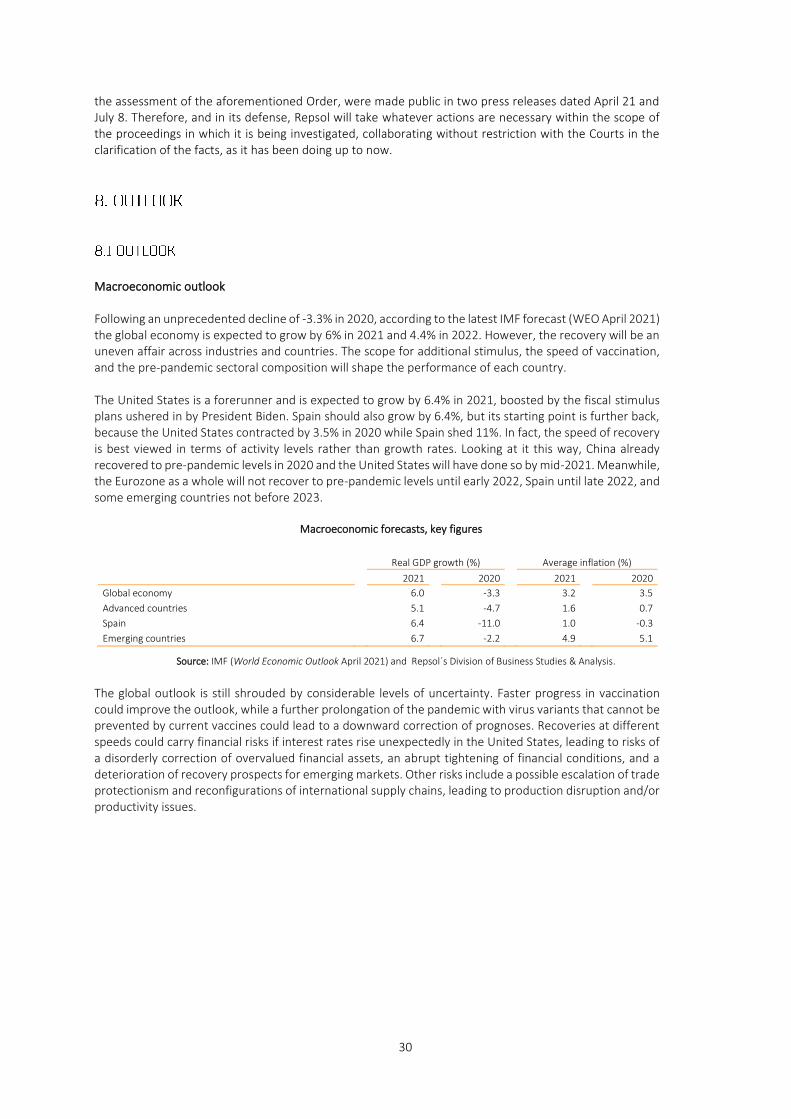
30
the assessment of the aforementioned Order, were made public in two press releases dated April 21 and July 8. Therefore, and in its defense, Repsol will take whatever actions are necessary within the scope of the proceedings in which it is being investigated, collaborating without restriction with the Courts in the clarification of the facts, as it has been doing up to now.
Macroeconomic outlook Following an unprecedented decline of -3.3% in 2020, according to the latest IMF forecast (WEO April 2021) the global economy is expected to grow by 6% in 2021 and 4.4% in 2022. However, the recovery will be an uneven affair across industries and countries. The scope for additional stimulus, the speed of vaccination, and the pre-pandemic sectoral composition will shape the performance of each country. The United States is a forerunner and is expected to grow by 6.4% in 2021, boosted by the fiscal stimulus plans ushered in by President Biden. Spain should also grow by 6.4%, but its starting point is further back, because the United States contracted by 3.5% in 2020 while Spain shed 11%. In fact, the speed of recovery is best viewed in terms of activity levels rather than growth rates. Looking at it this way, China already recovered to pre-pandemic levels in 2020 and the United States will have done so by mid-2021. Meanwhile, the Eurozone as a whole will not recover to pre-pandemic levels until early 2022, Spain until late 2022, and some emerging countries not before 2023.
Macroeconomic forecasts, key figures
Real GDP growth (%) Average inflation (%)
2021 2020 2021 2020
Global economy 6.0 -3.3 3.2 3.5
Advanced countries 5.1 -4.7 1.6 0.7
Spain 6.4 -11.0 1.0 -0.3
Emerging countries 6.7 -2.2 4.9 5.1
Source: IMF (World Economic Outlook April 2021) and Repsol´s Division of Business Studies & Analysis.
The global outlook is still shrouded by considerable levels of uncertainty. Faster progress in vaccination could improve the outlook, while a further prolongation of the pandemic with virus variants that cannot be prevented by current vaccines could lead to a downward correction of prognoses. Recoveries at different speeds could carry financial risks if interest rates rise unexpectedly in the United States, leading to risks of a disorderly correction of overvalued financial assets, an abrupt tightening of financial conditions, and a deterioration of recovery prospects for emerging markets. Other risks include a possible escalation of trade protectionism and reconfigurations of international supply chains, leading to production disruption and/or productivity issues.
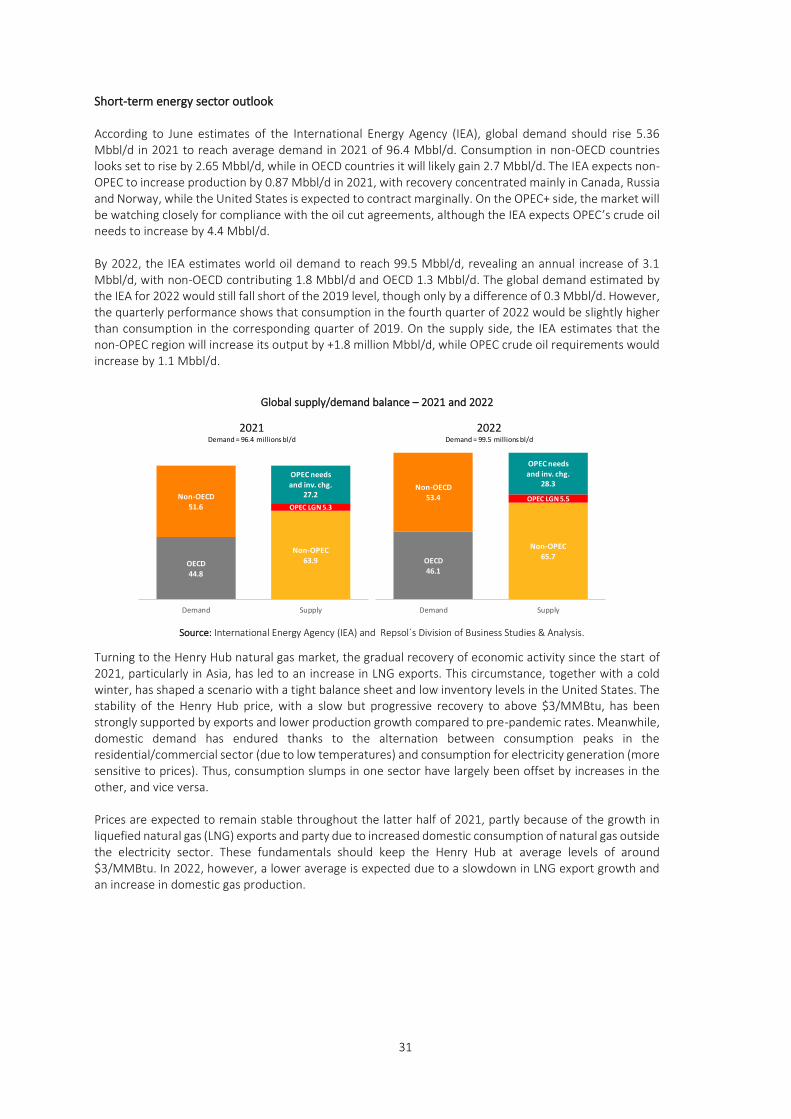
31
Short-term energy sector outlook According to June estimates of the International Energy Agency (IEA), global demand should rise 5.36 Mbbl/d in 2021 to reach average demand in 2021 of 96.4 Mbbl/d. Consumption in non-OECD countries looks set to rise by 2.65 Mbbl/d, while in OECD countries it will likely gain 2.7 Mbbl/d. The IEA expects non-OPEC to increase production by 0.87 Mbbl/d in 2021, with recovery concentrated mainly in Canada, Russia and Norway, while the United States is expected to contract marginally. On the OPEC+ side, the market will be watching closely for compliance with the oil cut agreements, although the IEA expects OPEC’s crude oil needs to increase by 4.4 Mbbl/d. By 2022, the IEA estimates world oil demand to reach 99.5 Mbbl/d, revealing an annual increase of 3.1 Mbbl/d, with non-OECD contributing 1.8 Mbbl/d and OECD 1.3 Mbbl/d. The global demand estimated by the IEA for 2022 would still fall short of the 2019 level, though only by a difference of 0.3 Mbbl/d. However, the quarterly performance shows that consumption in the fourth quarter of 2022 would be slightly higher than consumption in the corresponding quarter of 2019. On the supply side, the IEA estimates that the non-OPEC region will increase its output by +1.8 million Mbbl/d, while OPEC crude oil requirements would increase by 1.1 Mbbl/d.
Global supply/demand balance – 2021 and 2022
Source: International Energy Agency (IEA) and Repsol´s Division of Business Studies & Analysis.
Turning to the Henry Hub natural gas market, the gradual recovery of economic activity since the start of 2021, particularly in Asia, has led to an increase in LNG exports. This circumstance, together with a cold winter, has shaped a scenario with a tight balance sheet and low inventory levels in the United States. The stability of the Henry Hub price, with a slow but progressive recovery to above $3/MMBtu, has been strongly supported by exports and lower production growth compared to pre-pandemic rates. Meanwhile, domestic demand has endured thanks to the alternation between consumption peaks in the residential/commercial sector (due to low temperatures) and consumption for electricity generation (more sensitive to prices). Thus, consumption slumps in one sector have largely been offset by increases in the other, and vice versa. Prices are expected to remain stable throughout the latter half of 2021, partly because of the growth in liquefied natural gas (LNG) exports and party due to increased domestic consumption of natural gas outside the electricity sector. These fundamentals should keep the Henry Hub at average levels of around $3/MMBtu. In 2022, however, a lower average is expected due to a slowdown in LNG export growth and an increase in domestic gas production.
OECD44.8
Non-OECD51.6
Non-OPEC
63.9
OPEC LGN 5.3
OPEC needs and inv. chg.
27.2
Demand Supply
2021Demand = 96.4 millions bl/d
OECD46.1
Non-OECD53.4
Non-OPEC
65.7
OPEC LGN 5.5
OPEC needs
and inv. chg.28.3
Demand Supply
2022Demand = 99.5 millions bl/d
32
The Group’s business plans for the second half of 2021 are in line with the new Strategic Plan 21-25, albeit in a more favorable price scenario than the one envisioned in the plan. In this first year of the plan, given the still uncertain environment, the Group will continue to prioritize capital efficiency and discipline, throttled investment activity and a prudent financial policy. In the second half of the year, low-carbon platforms and, in particular, the renewable energy business will continue to be our main pillar in the energy transition and in investment. The aim will be to increase renewable generation capacity by commissioning projects currently under construction in Spain and Chile and making further progress in developing new projects. The Upstream segment will continue to focus on value generation through asset rotation and active portfolio management. At Industrial, further progress will be made toward the decarbonization program by promoting projects associated with the energy transition, increasing plant reliability and flexibility, identifying and utilizing high-value products and incorporating energy efficiency measures. The commercial businesses will continue to focus on optimizing operations, supporting our customers through the energy transition and placing them at the center of our decisions. This will be based on digital solutions and with an end-to-end differentiated value proposition, thus maximizing the value of the business and bolstering our competitive position. In the second half of the year, Repsol will continue to prioritize efficiency in corporate areas by automating processes, thus making the entire organization more profitable. In the current environment, Repsol expects that in 2021 it will be able to generate cash to finance its investment needs and reward its shareholders.
In July, the Group, through Repsol Europe Finance (with the guarantee of Repsol, S.A.) completed an issuance of Eurobonds linked to sustainability targets (SLB) for a total of 1,250 million euros. The issue consists of a 650 million euros tranche paying a fixed annual coupon of 0.375% and maturing in July 2029, and a further 600 million euros tranche paying a fixed annual coupon of 0.875% and maturing in July 2033. Also in July, Repsol announced the construction of two plants at the Sines Industrial Complex (one for linear polyethylene and the other for polypropylene), each able to produce 300,000 metric tons per year and with an estimated total investment of 657 million euros. These facilities, which will be operational in 2025, will produce 100% recyclable materials and can be used for highly specialized applications aligned with the energy transition in the pharmaceutical, automotive and food industries. The Portuguese government has considered this investment to be of potential national interest.
33
Repsol’s financial disclosures contain figures and measurements prepared in accordance with the regulations applicable to financial information, as well as other measurements prepared in accordance with the Group’s Reporting Model known as Alternative Performance Measurements (APMs). APMs are measurements which are “adjusted” compared to those presented as IFRS-EU or with information on Oil and Gas Exploration and Production Activities, and the reader should therefore consider them in addition to, but not instead of, the latter. APMs are highly useful for users of financial information as they are the measures employed by Repsol’s Management to evaluate its financial performance, cash flows, or its financial position when making operational or strategic decisions for the Group. For quarterly historical information on our APMs, please visit www.repsol.com. 1. Financial performance measurements Adjusted net income Adjusted net income is the key financial performance measurement which Management (Executive Committee) relies on when making decisions. Repsol presents its segment results including joint ventures and other companies that are jointly managed in accordance with the Group’s investment percentage, considering operational and economic indicators within the same perspective and degree of detail as those for companies consolidated under the full consolidation method. Thus, the Group considers that the nature of its businesses and the way in which results are analyzed for decision-making purposes is adequately reflected. Adjusted net income is calculated as the Result from continuing operations at Current Cost of Supply (CCS), net of taxes and non-controlling interests, and without including specific income and expenses (Special items) or the so-called Inventory effect. Financial result is taken to Adjusted net income for the “Corporate and other” segment. Adjusted net income is a useful APM for investors to evaluate the performance of operating segments while permitting
increased comparability with Oil & Gas sector companies that use different inventory measurement methods (see the
following section).
Inventory effect
For current cost of supply (CCS) earnings, the cost of volumes sold is calculated on the basis of procurement and production costs1 incurred during the period in question and not based on weighted average cost (WAC), which is the accepted methodology under European accounting law and regulations. The difference between CCS earnings and earnings at weighted average cost is included in the so-called Inventory Effect, which also includes other adjustments to the valuation of inventories (write-offs, economic hedges, etc.) and is presented net of taxes and minority interests. This Inventory Effect largely affects the Industrial segment. Repsol management considers that this measurement is useful for investors, considering the significant variations arising in the prices of inventories between periods. WAC is a generally accepted European accounting method for measuring inventories. It factors in purchase prices and historic production costs, valuing inventory at the lower between this cost and its market value.
1 To calculate the cost of supply, international quotations on the benchmark markets in which the Company operates are used. The relevant average
monthly price is applied to each quality of distilled crude. Quotations are obtained from daily crude oil publications according to Platts, plus freight costs estimated by Worldscale (an association that publishes world reference prices for freight costs between specific ports). All other production costs (fixed and variable costs) are valued at the cost recognized in the accounts.
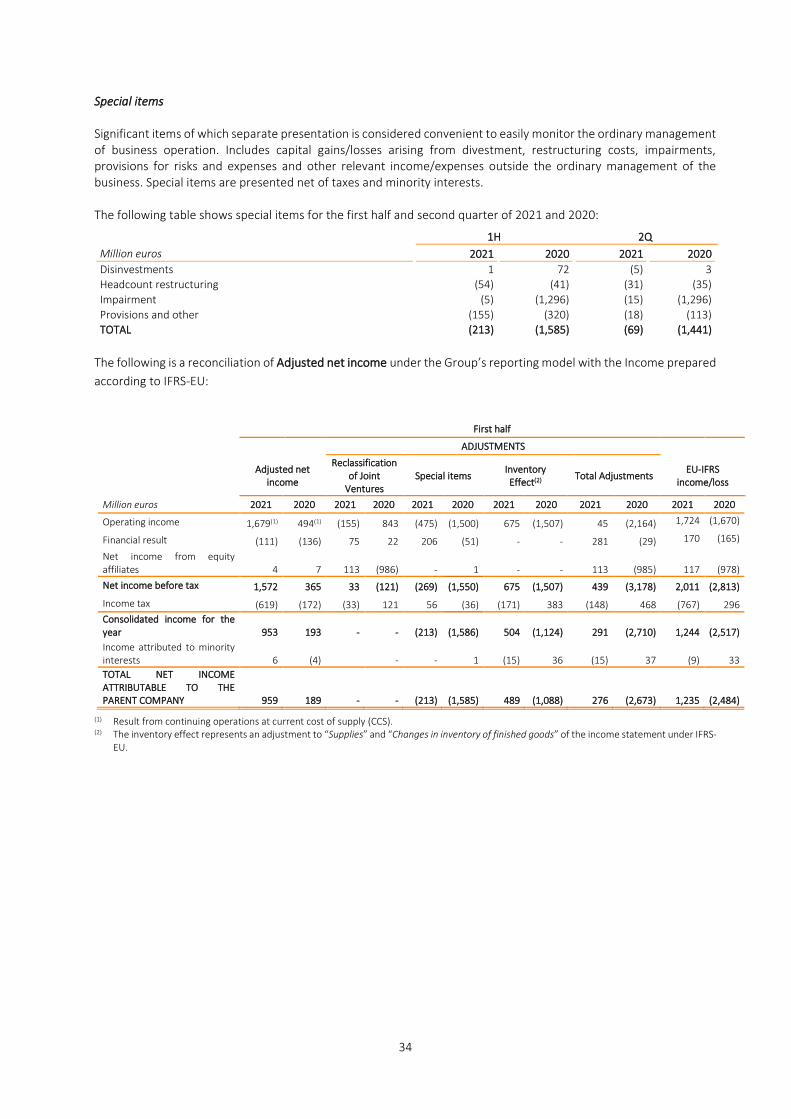
34
Special items Significant items of which separate presentation is considered convenient to easily monitor the ordinary management of business operation. Includes capital gains/losses arising from divestment, restructuring costs, impairments, provisions for risks and expenses and other relevant income/expenses outside the ordinary management of the business. Special items are presented net of taxes and minority interests. The following table shows special items for the first half and second quarter of 2021 and 2020:
The following is a reconciliation of Adjusted net income under the Group’s reporting model with the Income prepared
according to IFRS-EU:
First half
ADJUSTMENTS
Adjusted net
income
Reclassification of Joint
Ventures Special items
Inventory Effect(2)
Total Adjustments EU-IFRS
income/loss
Million euros 2021 2020 2021 2020 2021 2020 2021 2020 2021 2020 2021 2020
Operating income 1,679(1) 494(1) (155) 843 (475) (1,500) 675 (1,507) 45 (2,164) 1,724 (1,670)
Financial result (111) (136) 75 22 206 (51) - - 281 (29) 170 (165)
Net income from equity affiliates 4 7 113 (986) - 1 - - 113 (985) 117 (978)
Net income before tax 1,572 365 33 (121) (269) (1,550) 675 (1,507) 439 (3,178) 2,011 (2,813)
Income tax (619) (172) (33) 121 56 (36) (171) 383 (148) 468 (767) 296
Consolidated income for the year 953 193 - - (213) (1,586) 504 (1,124) 291 (2,710) 1,244 (2,517)
Income attributed to minority interests 6 (4) - - 1 (15) 36 (15) 37 (9) 33
TOTAL NET INCOME ATTRIBUTABLE TO THE PARENT COMPANY 959 189 - - (213) (1,585) 489 (1,088) 276 (2,673) 1,235 (2,484)
(1) Result from continuing operations at current cost of supply (CCS). (2) The inventory effect represents an adjustment to “Supplies” and “Changes in inventory of finished goods” of the income statement under IFRS-
EU.
1H 2Q
Million euros 2021 2020 2021 2020
Disinvestments 1 72 (5) 3
Headcount restructuring (54) (41) (31) (35)
Impairment (5) (1,296) (15) (1,296)
Provisions and other (155) (320) (18) (113)
TOTAL (213) (1,585) (69) (1,441)
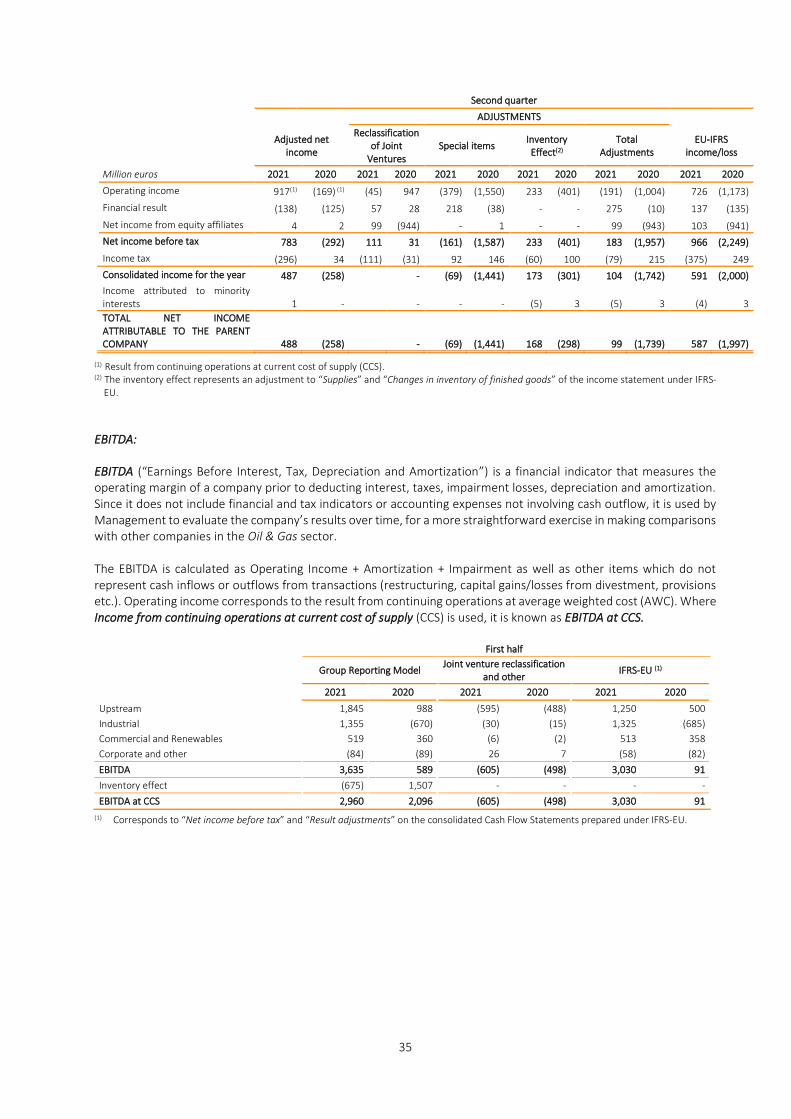
35
Second quarter
ADJUSTMENTS
Adjusted net
income
Reclassification of Joint
Ventures Special items
Inventory Effect(2)
Total Adjustments
EU-IFRS income/loss
Million euros 2021 2020 2021 2020 2021 2020 2021 2020 2021 2020 2021 2020
Operating income 917(1) (169) (1) (45) 947 (379) (1,550) 233 (401) (191) (1,004) 726 (1,173)
Financial result (138) (125) 57 28 218 (38) - - 275 (10) 137 (135)
Net income from equity affiliates 4 2 99 (944) - 1 - - 99 (943) 103 (941)
Net income before tax 783 (292) 111 31 (161) (1,587) 233 (401) 183 (1,957) 966 (2,249)
Income tax (296) 34 (111) (31) 92 146 (60) 100 (79) 215 (375) 249
Consolidated income for the year 487 (258) - (69) (1,441) 173 (301) 104 (1,742) 591 (2,000)
Income attributed to minority interests 1 - - - - (5) 3 (5) 3 (4) 3
TOTAL NET INCOME ATTRIBUTABLE TO THE PARENT COMPANY 488 (258) - (69) (1,441) 168 (298) 99 (1,739) 587 (1,997)
(1) Result from continuing operations at current cost of supply (CCS).
(2) The inventory effect represents an adjustment to “Supplies” and “Changes in inventory of finished goods” of the income statement under IFRS-EU.
EBITDA:
EBITDA (“Earnings Before Interest, Tax, Depreciation and Amortization”) is a financial indicator that measures the operating margin of a company prior to deducting interest, taxes, impairment losses, depreciation and amortization. Since it does not include financial and tax indicators or accounting expenses not involving cash outflow, it is used by Management to evaluate the company’s results over time, for a more straightforward exercise in making comparisons with other companies in the Oil & Gas sector. The EBITDA is calculated as Operating Income + Amortization + Impairment as well as other items which do not represent cash inflows or outflows from transactions (restructuring, capital gains/losses from divestment, provisions etc.). Operating income corresponds to the result from continuing operations at average weighted cost (AWC). Where Income from continuing operations at current cost of supply (CCS) is used, it is known as EBITDA at CCS. First half
Group Reporting Model
Joint venture reclassification and other
IFRS-EU (1)
2021 2020 2021 2020 2021 2020
Upstream 1,845 988 (595) (488) 1,250 500
Industrial 1,355 (670) (30) (15) 1,325 (685)
Commercial and Renewables 519 360 (6) (2) 513 358
Corporate and other (84) (89) 26 7 (58) (82)
EBITDA 3,635 589 (605) (498) 3,030 91
Inventory effect (675) 1,507 - - - -
EBITDA at CCS 2,960 2,096 (605) (498) 3,030 91
(1) Corresponds to “Net income before tax” and “Result adjustments” on the consolidated Cash Flow Statements prepared under IFRS-EU.
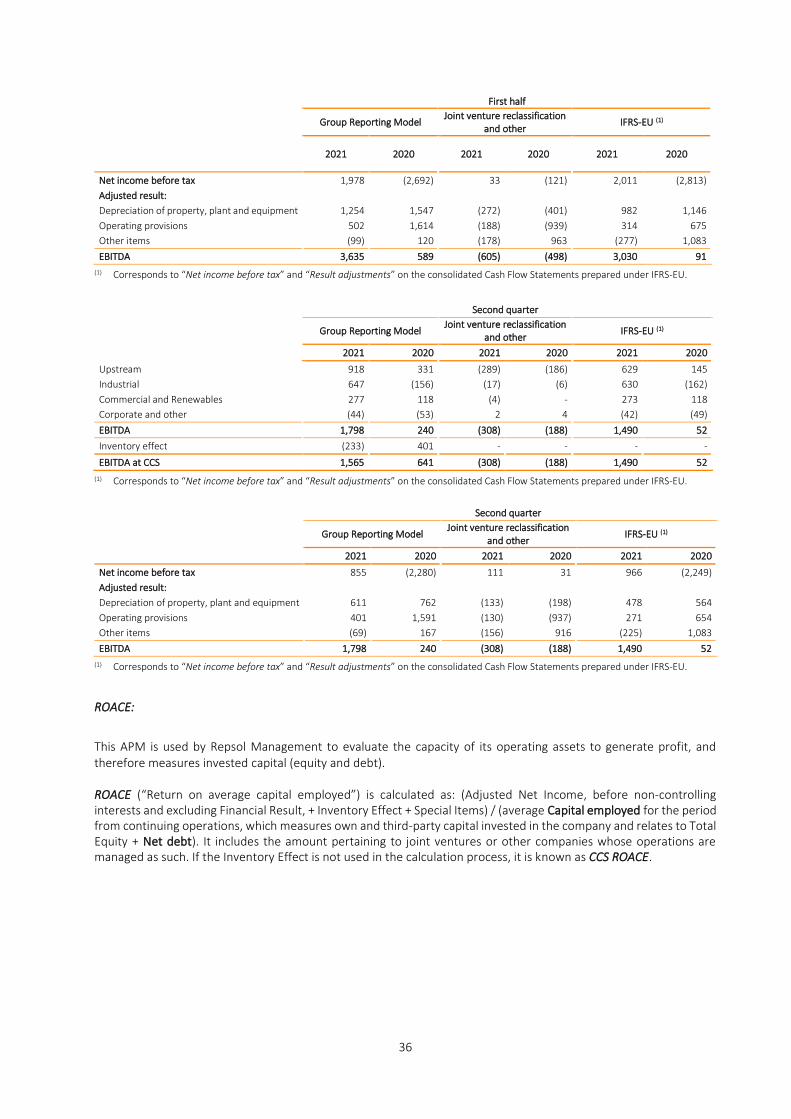
36
First half
Group Reporting Model Joint venture reclassification
and other IFRS-EU (1)
2021 2020 2021 2020 2021 2020
Net income before tax 1,978 (2,692) 33 (121) 2,011 (2,813)
Adjusted result:
Depreciation of property, plant and equipment 1,254 1,547 (272) (401) 982 1,146
Operating provisions 502 1,614 (188) (939) 314 675
Other items (99) 120 (178) 963 (277) 1,083
EBITDA 3,635 589 (605) (498) 3,030 91
(1) Corresponds to “Net income before tax” and “Result adjustments” on the consolidated Cash Flow Statements prepared under IFRS-EU.
Second quarter
Group Reporting Model
Joint venture reclassification and other
IFRS-EU (1)
2021 2020 2021 2020 2021 2020
Upstream 918 331 (289) (186) 629 145
Industrial 647 (156) (17) (6) 630 (162)
Commercial and Renewables 277 118 (4) - 273 118
Corporate and other (44) (53) 2 4 (42) (49)
EBITDA 1,798 240 (308) (188) 1,490 52
Inventory effect (233) 401 - - - -
EBITDA at CCS 1,565 641 (308) (188) 1,490 52
(1) Corresponds to “Net income before tax” and “Result adjustments” on the consolidated Cash Flow Statements prepared under IFRS-EU.
Second quarter
Group Reporting Model
Joint venture reclassification and other
IFRS-EU (1)
2021 2020 2021 2020 2021 2020
Net income before tax 855 (2,280) 111 31 966 (2,249)
Adjusted result:
Depreciation of property, plant and equipment 611 762 (133) (198) 478 564
Operating provisions 401 1,591 (130) (937) 271 654
Other items (69) 167 (156) 916 (225) 1,083
EBITDA 1,798 240 (308) (188) 1,490 52
(1) Corresponds to “Net income before tax” and “Result adjustments” on the consolidated Cash Flow Statements prepared under IFRS-EU.
ROACE:
This APM is used by Repsol Management to evaluate the capacity of its operating assets to generate profit, and therefore measures invested capital (equity and debt). ROACE (“Return on average capital employed”) is calculated as: (Adjusted Net Income, before non-controlling interests and excluding Financial Result, + Inventory Effect + Special Items) / (average Capital employed for the period from continuing operations, which measures own and third-party capital invested in the company and relates to Total Equity + Net debt). It includes the amount pertaining to joint ventures or other companies whose operations are managed as such. If the Inventory Effect is not used in the calculation process, it is known as CCS ROACE.
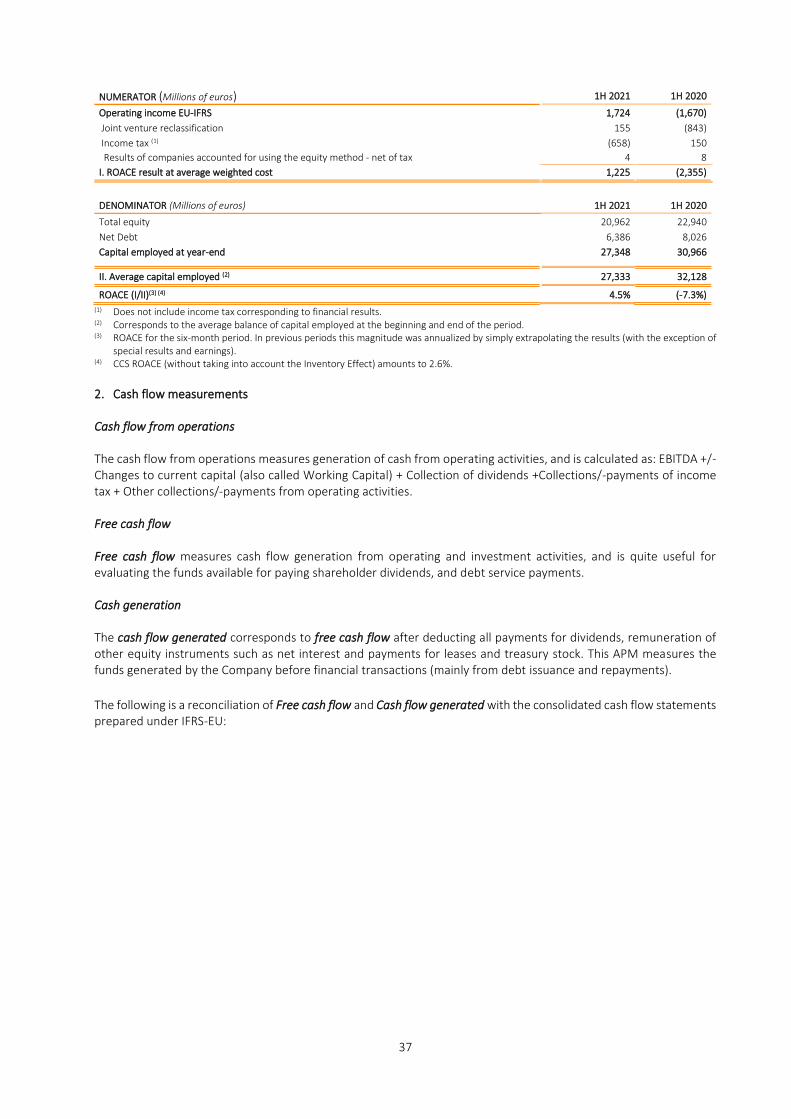
37
(1) Does not include income tax corresponding to financial results. (2) Corresponds to the average balance of capital employed at the beginning and end of the period.
(3) ROACE for the six-month period. In previous periods this magnitude was annualized by simply extrapolating the results (with the exception of special results and earnings).
(4) CCS ROACE (without taking into account the Inventory Effect) amounts to 2.6%.
2. Cash flow measurements
Cash flow from operations The cash flow from operations measures generation of cash from operating activities, and is calculated as: EBITDA +/- Changes to current capital (also called Working Capital) + Collection of dividends +Collections/-payments of income tax + Other collections/-payments from operating activities. Free cash flow Free cash flow measures cash flow generation from operating and investment activities, and is quite useful for evaluating the funds available for paying shareholder dividends, and debt service payments. Cash generation The cash flow generated corresponds to free cash flow after deducting all payments for dividends, remuneration of other equity instruments such as net interest and payments for leases and treasury stock. This APM measures the funds generated by the Company before financial transactions (mainly from debt issuance and repayments).
The following is a reconciliation of Free cash flow and Cash flow generated with the consolidated cash flow statements prepared under IFRS-EU:
NUMERATOR (Millions of euros) 1H 2021 1H 2020
Operating income EU-IFRS 1,724 (1,670)
Joint venture reclassification 155 (843)
Income tax (1) (658) 150
Results of companies accounted for using the equity method - net of tax 4 8
I. ROACE result at average weighted cost 1,225 (2,355)
DENOMINATOR (Millions of euros) 1H 2021 1H 2020
Total equity 20,962 22,940
Net Debt 6,386 8,026
Capital employed at year-end 27,348 30,966
II. Average capital employed (2) 27,333 32,128
ROACE (I/II)(3) (4) 4.5% (-7.3%)
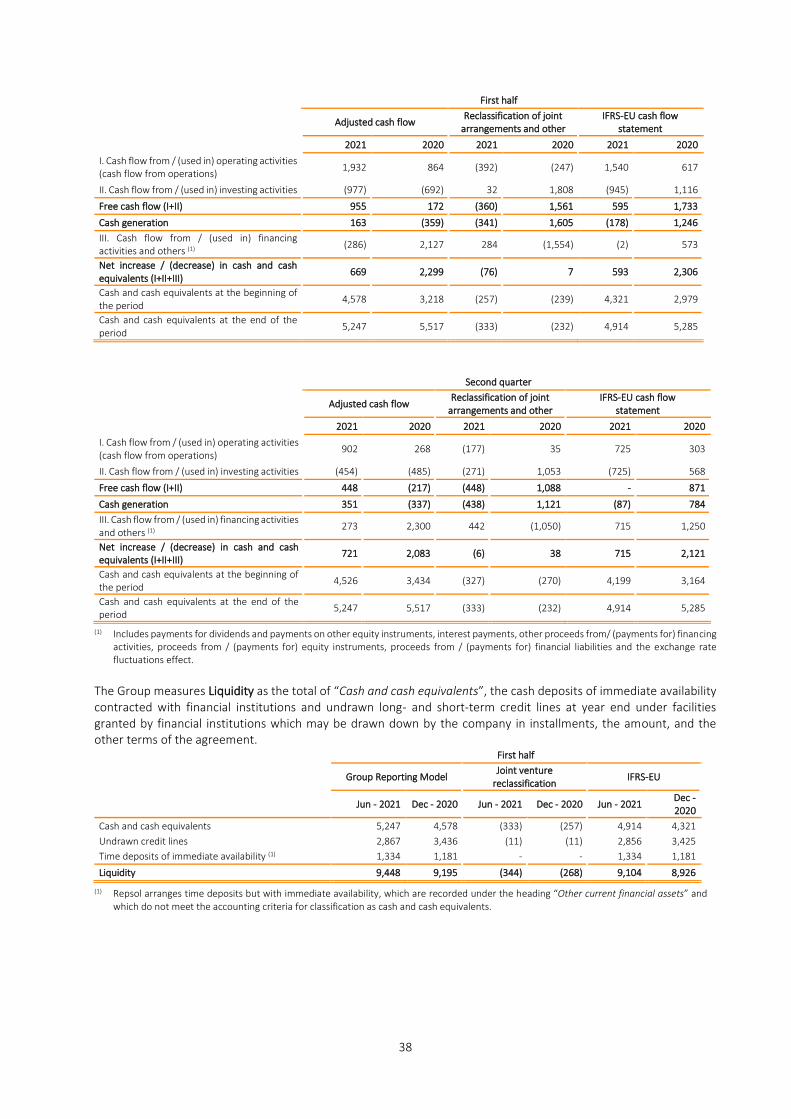
38
First half
Adjusted cash flow
Reclassification of joint arrangements and other
IFRS-EU cash flow statement
2021 2020 2021 2020 2021 2020
I. Cash flow from / (used in) operating activities (cash flow from operations)
1,932 864 (392) (247) 1,540 617
II. Cash flow from / (used in) investing activities (977) (692) 32 1,808 (945) 1,116
Free cash flow (I+II) 955 172 (360) 1,561 595 1,733
Cash generation 163 (359) (341) 1,605 (178) 1,246
III. Cash flow from / (used in) financing activities and others (1)
(286) 2,127 284 (1,554) (2) 573
Net increase / (decrease) in cash and cash equivalents (I+II+III)
669 2,299 (76) 7 593 2,306
Cash and cash equivalents at the beginning of the period
4,578 3,218 (257) (239) 4,321 2,979
Cash and cash equivalents at the end of the period
5,247 5,517 (333) (232) 4,914 5,285
Second quarter
Adjusted cash flow
Reclassification of joint arrangements and other
IFRS-EU cash flow statement
2021 2020 2021 2020 2021 2020
I. Cash flow from / (used in) operating activities (cash flow from operations)
902 268 (177) 35 725 303
II. Cash flow from / (used in) investing activities (454) (485) (271) 1,053 (725) 568
Free cash flow (I+II) 448 (217) (448) 1,088 - 871
Cash generation 351 (337) (438) 1,121 (87) 784
III. Cash flow from / (used in) financing activities and others (1)
273 2,300 442 (1,050) 715 1,250
Net increase / (decrease) in cash and cash equivalents (I+II+III)
721 2,083 (6) 38 715 2,121
Cash and cash equivalents at the beginning of the period
4,526 3,434 (327) (270) 4,199 3,164
Cash and cash equivalents at the end of the period
5,247 5,517 (333) (232) 4,914 5,285
(1) Includes payments for dividends and payments on other equity instruments, interest payments, other proceeds from/ (payments for) financing activities, proceeds from / (payments for) equity instruments, proceeds from / (payments for) financial liabilities and the exchange rate fluctuations effect.
The Group measures Liquidity as the total of “Cash and cash equivalents”, the cash deposits of immediate availability contracted with financial institutions and undrawn long- and short-term credit lines at year end under facilities granted by financial institutions which may be drawn down by the company in installments, the amount, and the other terms of the agreement. First half
Group Reporting Model Joint venture
reclassification IFRS-EU
Jun - 2021 Dec - 2020 Jun - 2021 Dec - 2020 Jun - 2021 Dec - 2020
Cash and cash equivalents 5,247 4,578 (333) (257) 4,914 4,321
Undrawn credit lines 2,867 3,436 (11) (11) 2,856 3,425
Time deposits of immediate availability (1) 1,334 1,181 - - 1,334 1,181
Liquidity 9,448 9,195 (344) (268) 9,104 8,926
(1) Repsol arranges time deposits but with immediate availability, which are recorded under the heading “Other current financial assets” and which do not meet the accounting criteria for classification as cash and cash equivalents.
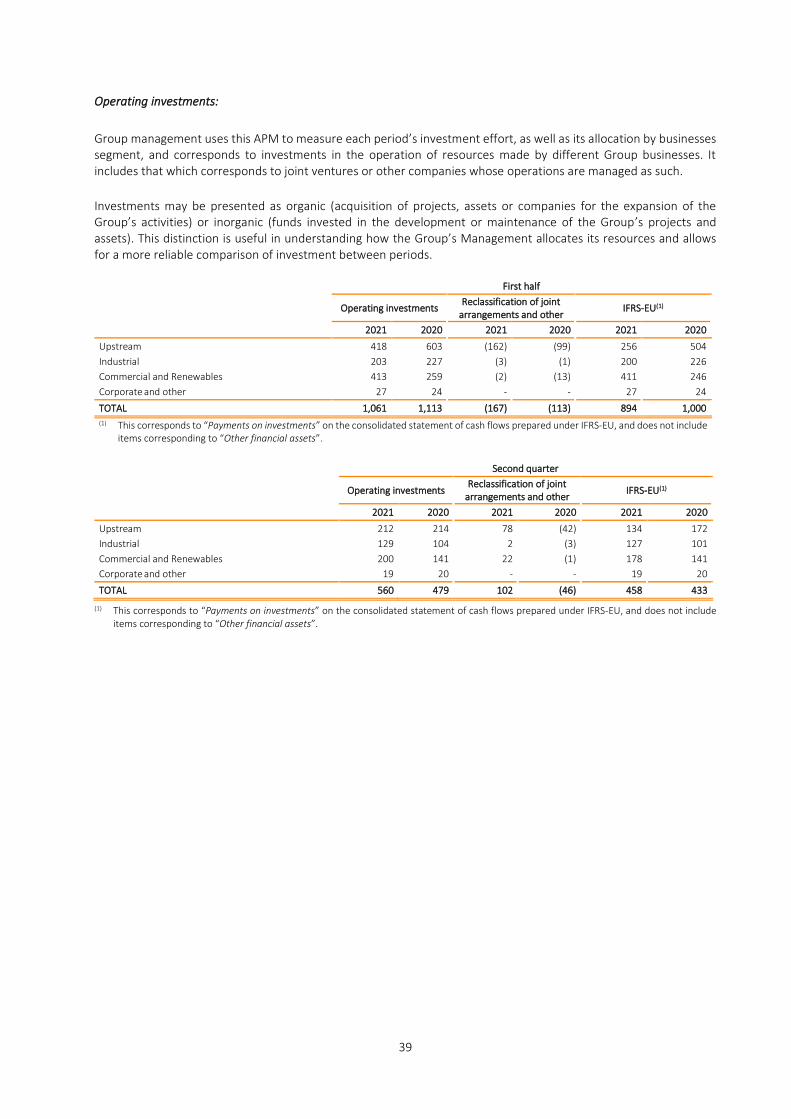
39
Operating investments:
Group management uses this APM to measure each period’s investment effort, as well as its allocation by businesses segment, and corresponds to investments in the operation of resources made by different Group businesses. It includes that which corresponds to joint ventures or other companies whose operations are managed as such.
Investments may be presented as organic (acquisition of projects, assets or companies for the expansion of the Group’s activities) or inorganic (funds invested in the development or maintenance of the Group’s projects and assets). This distinction is useful in understanding how the Group’s Management allocates its resources and allows for a more reliable comparison of investment between periods. First half
Operating investments Reclassification of joint
arrangements and other IFRS-EU(1)
2021 2020 2021 2020 2021 2020
Upstream 418 603 (162) (99) 256 504
Industrial 203 227 (3) (1) 200 226
Commercial and Renewables 413 259 (2) (13) 411 246
Corporate and other 27 24 - - 27 24
TOTAL 1,061 1,113 (167) (113) 894 1,000
(1) This corresponds to “Payments on investments” on the consolidated statement of cash flows prepared under IFRS-EU, and does not include items corresponding to “Other financial assets”.
Second quarter
Operating investments Reclassification of joint
arrangements and other IFRS-EU(1)
2021 2020 2021 2020 2021 2020
Upstream 212 214 78 (42) 134 172
Industrial 129 104 2 (3) 127 101
Commercial and Renewables 200 141 22 (1) 178 141
Corporate and other 19 20 - - 19 20
TOTAL 560 479 102 (46) 458 433
(1) This corresponds to “Payments on investments” on the consolidated statement of cash flows prepared under IFRS-EU, and does not include items corresponding to “Other financial assets”.
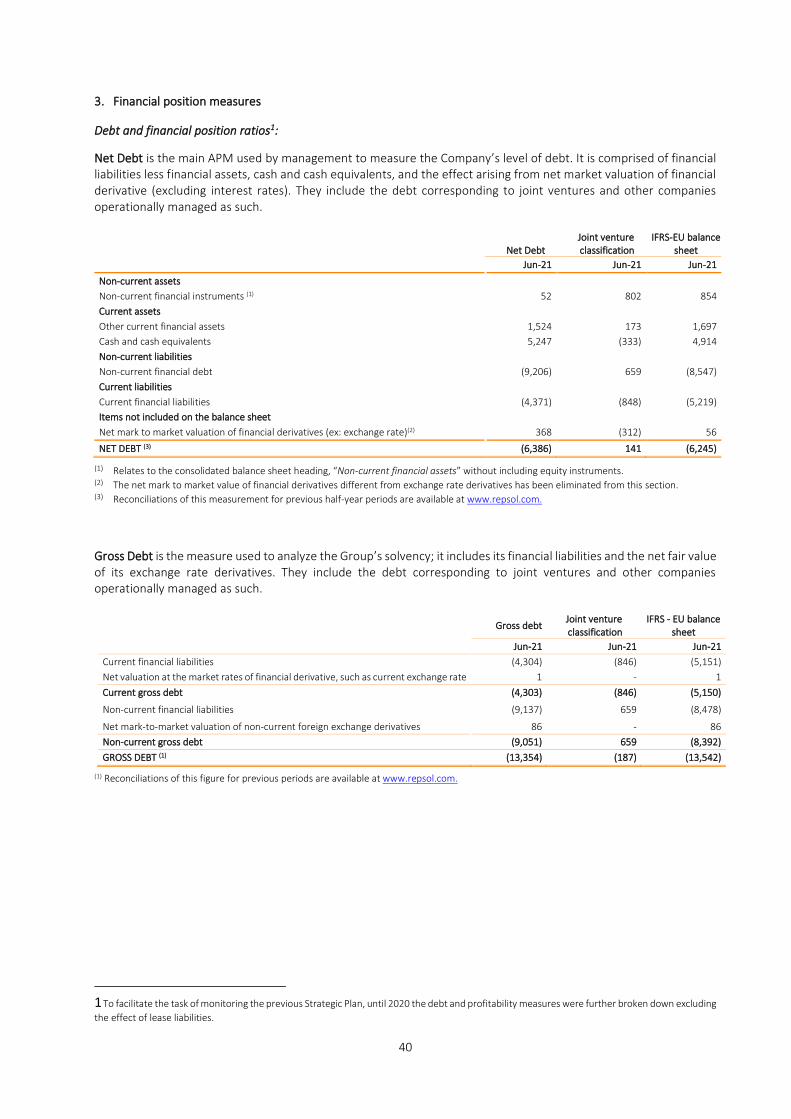
40
3. Financial position measures
Debt and financial position ratios1:
Net Debt is the main APM used by management to measure the Company’s level of debt. It is comprised of financial liabilities less financial assets, cash and cash equivalents, and the effect arising from net market valuation of financial derivative (excluding interest rates). They include the debt corresponding to joint ventures and other companies operationally managed as such.
Net Debt
Joint venture classification
IFRS-EU balance sheet
Jun-21 Jun-21 Jun-21
Non-current assets
Non-current financial instruments (1) 52 802 854
Current assets
Other current financial assets 1,524 173 1,697
Cash and cash equivalents 5,247 (333) 4,914
Non-current liabilities
Non-current financial debt (9,206) 659 (8,547)
Current liabilities
Current financial liabilities (4,371) (848) (5,219)
Items not included on the balance sheet
Net mark to market valuation of financial derivatives (ex: exchange rate)(2) 368 (312) 56
NET DEBT (3) (6,386) 141 (6,245)
(1) Relates to the consolidated balance sheet heading, “Non-current financial assets” without including equity instruments. (2) The net mark to market value of financial derivatives different from exchange rate derivatives has been eliminated from this section. (3) Reconciliations of this measurement for previous half-year periods are available at www.repsol.com.
Gross Debt is the measure used to analyze the Group’s solvency; it includes its financial liabilities and the net fair value of its exchange rate derivatives. They include the debt corresponding to joint ventures and other companies operationally managed as such.
Gross debt Joint venture classification
IFRS - EU balance sheet
Jun-21 Jun-21 Jun-21
Current financial liabilities (4,304) (846) (5,151)
Net valuation at the market rates of financial derivative, such as current exchange rate 1 - 1
Current gross debt (4,303) (846) (5,150)
Non-current financial liabilities (9,137) 659 (8,478)
Net mark-to-market valuation of non-current foreign exchange derivatives 86 - 86
Non-current gross debt (9,051) 659 (8,392)
GROSS DEBT (1) (13,354) (187) (13,542)
(1) Reconciliations of this figure for previous periods are available at www.repsol.com.
1 To facilitate the task of monitoring the previous Strategic Plan, until 2020 the debt and profitability measures were further broken down excluding
the effect of lease liabilities.
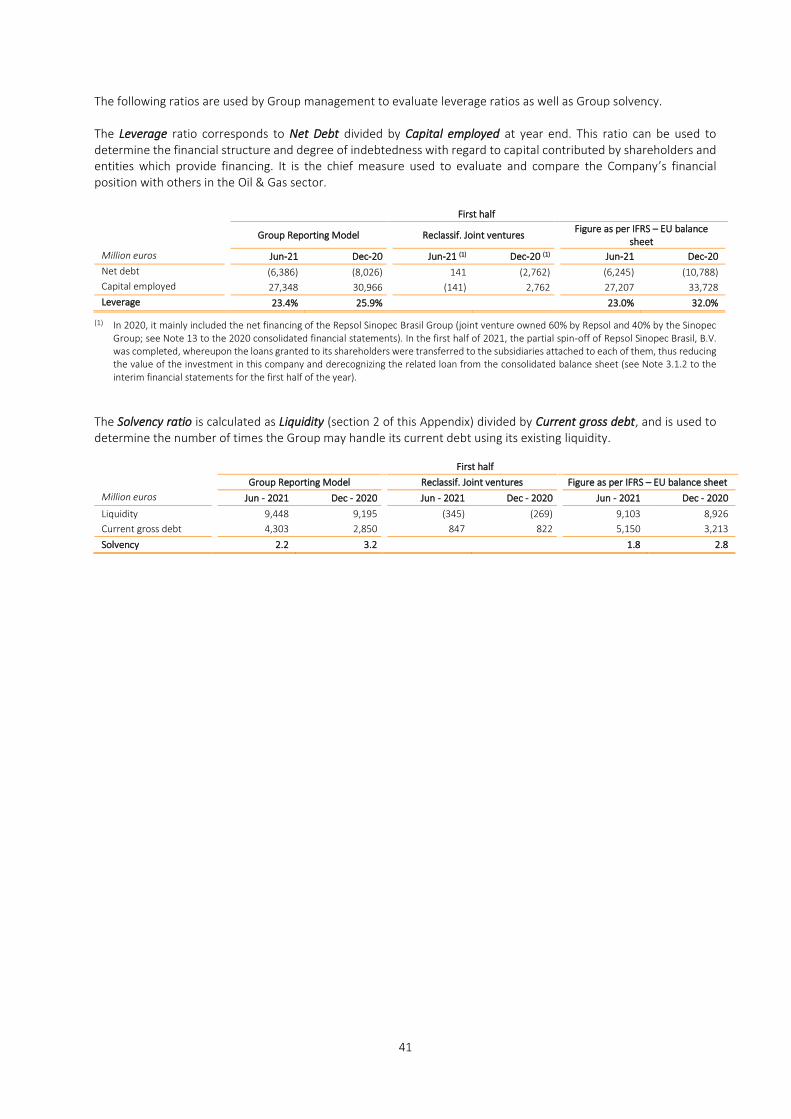
41
The following ratios are used by Group management to evaluate leverage ratios as well as Group solvency. The Leverage ratio corresponds to Net Debt divided by Capital employed at year end. This ratio can be used to determine the financial structure and degree of indebtedness with regard to capital contributed by shareholders and entities which provide financing. It is the chief measure used to evaluate and compare the Company’s financial position with others in the Oil & Gas sector.
First half
Group Reporting Model Reclassif. Joint ventures
Figure as per IFRS – EU balance sheet
Million euros Jun-21 Dec-20 Jun-21 (1) Dec-20 (1) Jun-21 Dec-20
Net debt (6,386) (8,026) 141 (2,762) (6,245) (10,788)
Capital employed 27,348 30,966 (141) 2,762 27,207 33,728
Leverage 23.4% 25.9% 23.0% 32.0%
(1) In 2020, it mainly included the net financing of the Repsol Sinopec Brasil Group (joint venture owned 60% by Repsol and 40% by the Sinopec Group; see Note 13 to the 2020 consolidated financial statements). In the first half of 2021, the partial spin-off of Repsol Sinopec Brasil, B.V. was completed, whereupon the loans granted to its shareholders were transferred to the subsidiaries attached to each of them, thus reducing the value of the investment in this company and derecognizing the related loan from the consolidated balance sheet (see Note 3.1.2 to the interim financial statements for the first half of the year).
The Solvency ratio is calculated as Liquidity (section 2 of this Appendix) divided by Current gross debt, and is used to determine the number of times the Group may handle its current debt using its existing liquidity.
First half
Group Reporting Model Reclassif. Joint ventures Figure as per IFRS – EU balance sheet
Million euros Jun - 2021 Dec - 2020 Jun - 2021 Dec - 2020 Jun - 2021 Dec - 2020
Liquidity 9,448 9,195 (345) (269) 9,103 8,926
Current gross debt 4,303 2,850 847 822 5,150 3,213
Solvency 2.2 3.2 1.8 2.8
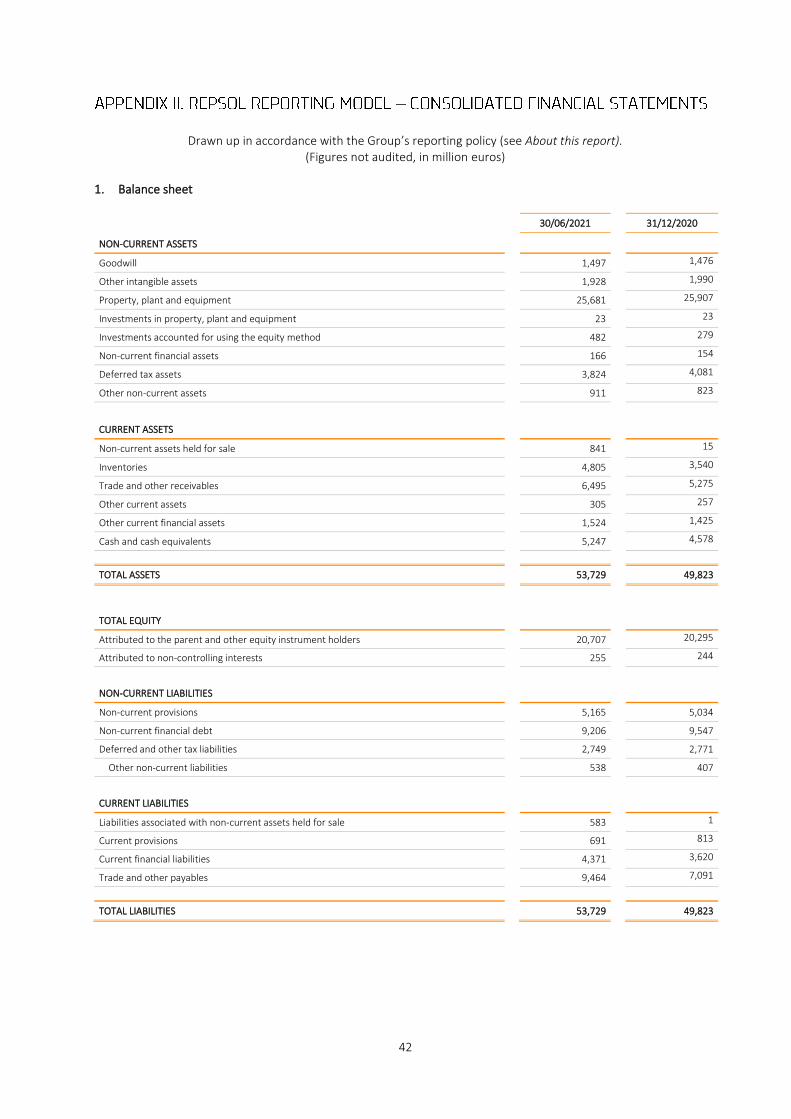
42
Drawn up in accordance with the Group’s reporting policy (see About this report).
(Figures not audited, in million euros)
1. Balance sheet
30/06/2021 31/12/2020
NON-CURRENT ASSETS
Goodwill 1,497 1,476
Other intangible assets 1,928 1,990
Property, plant and equipment 25,681 25,907
Investments in property, plant and equipment 23 23
Investments accounted for using the equity method 482 279
Non-current financial assets 166 154
Deferred tax assets 3,824 4,081
Other non-current assets 911 823
CURRENT ASSETS
Non-current assets held for sale 841 15
Inventories 4,805 3,540
Trade and other receivables 6,495 5,275
Other current assets 305 257
Other current financial assets 1,524 1,425
Cash and cash equivalents 5,247 4,578
TOTAL ASSETS 53,729 49,823
TOTAL EQUITY
Attributed to the parent and other equity instrument holders 20,707 20,295
Attributed to non-controlling interests 255 244
NON-CURRENT LIABILITIES
Non-current provisions 5,165 5,034
Non-current financial debt 9,206 9,547
Deferred and other tax liabilities 2,749 2,771
Other non-current liabilities 538 407
CURRENT LIABILITIES
Liabilities associated with non-current assets held for sale 583 1
Current provisions 691 813
Current financial liabilities 4,371 3,620
Trade and other payables 9,464 7,091
TOTAL LIABILITIES 53,729 49,823
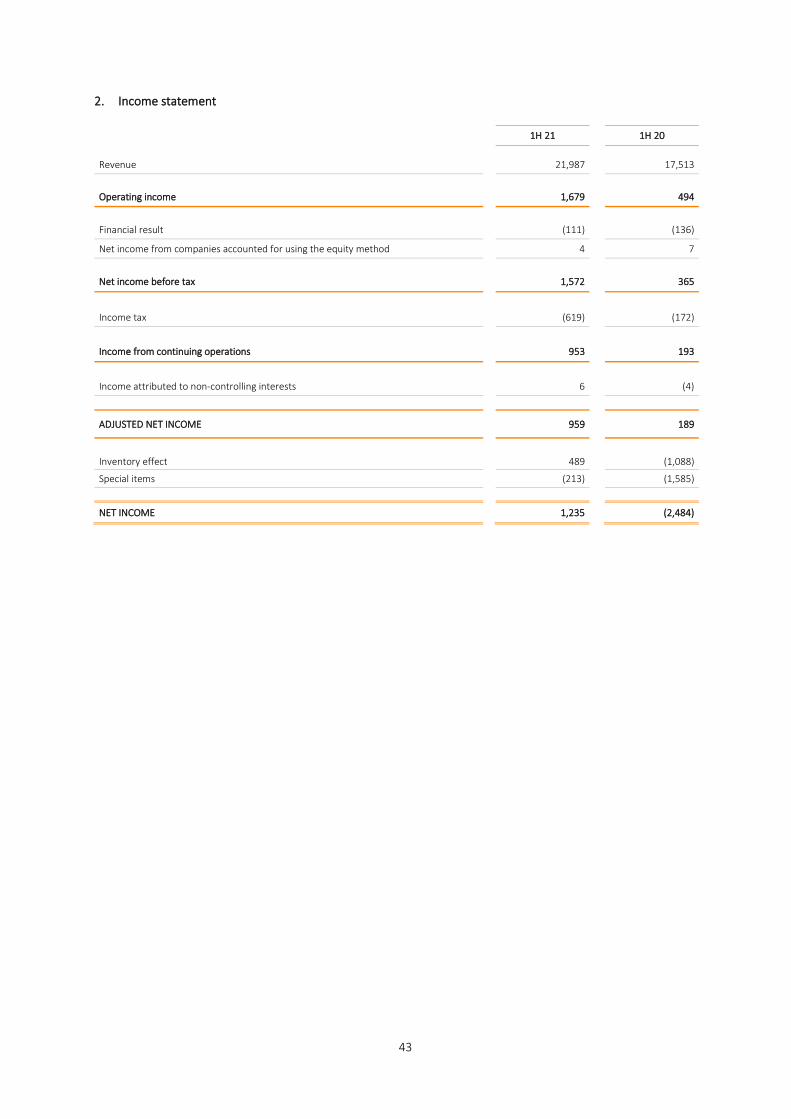
43
2. Income statement
1H 21 1H 20
Revenue 21,987 17,513
Operating income
1,679 494
Financial result (111) (136)
Net income from companies accounted for using the equity method 4 7
Net income before tax
1,572 365
Income tax (619) (172)
Income from continuing operations
953 193
Income attributed to non-controlling interests 6 (4)
ADJUSTED NET INCOME
959
189
Inventory effect 489 (1,088)
Special items (213) (1,585)
NET INCOME
1,235 (2,484)
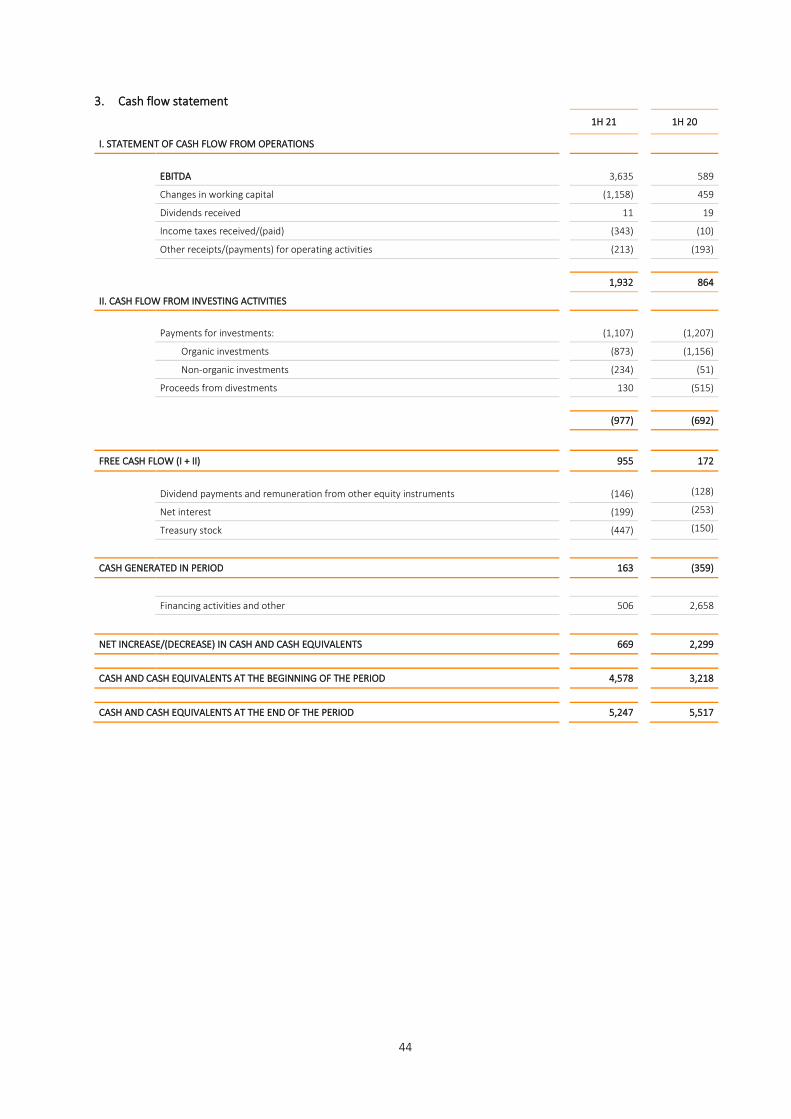
44
3. Cash flow statement
1H 21 1H 20
I. STATEMENT OF CASH FLOW FROM OPERATIONS
EBITDA 3,635 589
Changes in working capital (1,158) 459
Dividends received 11 19
Income taxes received/(paid) (343) (10)
Other receipts/(payments) for operating activities (213) (193)
1,932 864
II. CASH FLOW FROM INVESTING ACTIVITIES
Payments for investments: (1,107) (1,207)
Organic investments (873) (1,156)
Non-organic investments (234) (51)
Proceeds from divestments 130 (515)
(977) (692)
FREE CASH FLOW (I + II) 955 172
Dividend payments and remuneration from other equity instruments (146) (128)
Net interest (199) (253)
Treasury stock (447) (150)
CASH GENERATED IN PERIOD 163 (359)
Financing activities and other 506 2,658
NET INCREASE/(DECREASE) IN CASH AND CASH EQUIVALENTS 669 2,299
CASH AND CASH EQUIVALENTS AT THE BEGINNING OF THE PERIOD 4,578 3,218
CASH AND CASH EQUIVALENTS AT THE END OF THE PERIOD 5,247 5,517
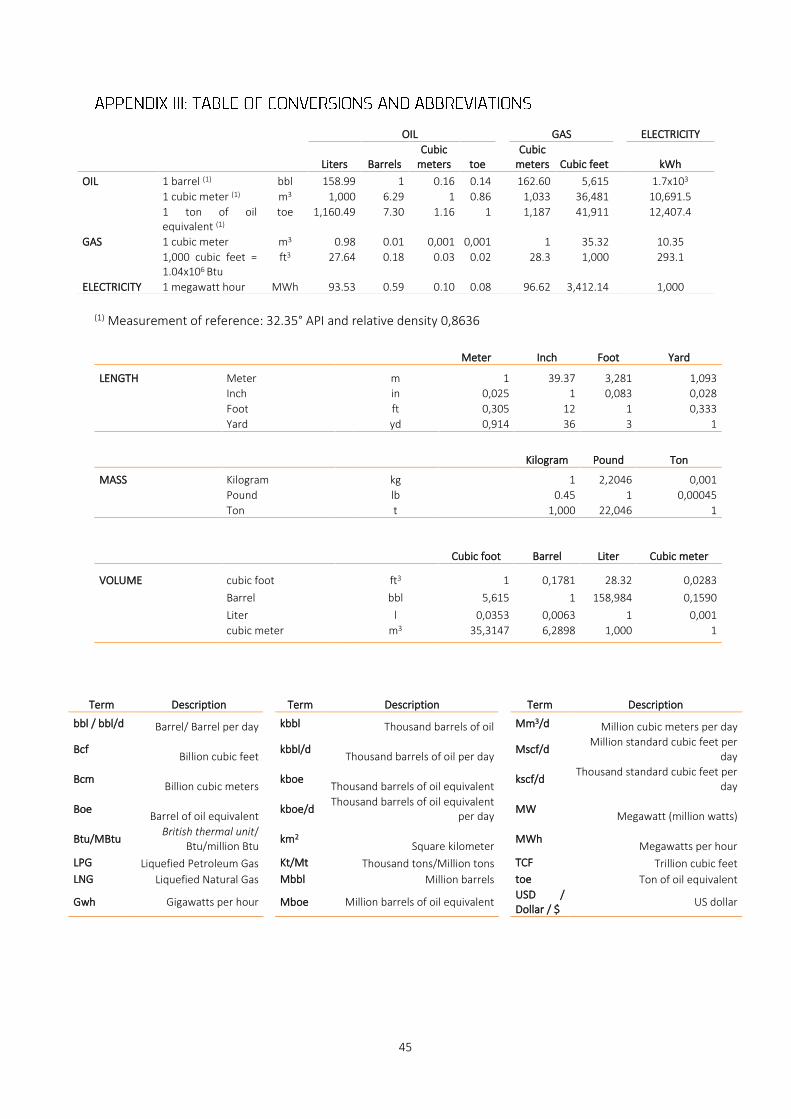
45
(1) Measurement of reference: 32.35° API and relative density 0,8636
Meter Inch Foot Yard
LENGTH Meter m 1 39.37 3,281 1,093
Inch in 0,025 1 0,083 0,028
Foot ft 0,305 12 1 0,333
Yard yd 0,914 36 3 1
Kilogram Pound Ton
MASS Kilogram kg 1 2,2046 0,001
Pound lb 0.45 1 0,00045
Ton t 1,000 22,046 1
Cubic foot Barrel Liter Cubic meter
VOLUME cubic foot
ft3 1 0,1781 28.32 0,0283
Barrel bbl 5,615 1 158,984 0,1590
Liter l 0,0353 0,0063 1 0,001
cubic meter m3 35,3147 6,2898 1,000 1
Term Description Term Description Term Description
bbl / bbl/d Barrel/ Barrel per day kbbl Thousand barrels of oil Mm3/d Million cubic meters per day
Bcf Billion cubic feet
kbbl/d Thousand barrels of oil per day
Mscf/d Million standard cubic feet per
day
Bcm Billion cubic meters
kboe Thousand barrels of oil equivalent
kscf/d Thousand standard cubic feet per
day
Boe Barrel of oil equivalent
kboe/d Thousand barrels of oil equivalent
per day MW
Megawatt (million watts)
Btu/MBtu British thermal unit/
Btu/million Btu km2
Square kilometer MWh
Megawatts per hour
LPG Liquefied Petroleum Gas Kt/Mt Thousand tons/Million tons TCF Trillion cubic feet
LNG Liquefied Natural Gas Mbbl Million barrels toe Ton of oil equivalent
Gwh Gigawatts per hour Mboe Million barrels of oil equivalent USD / Dollar / $
US dollar
OIL GAS ELECTRICITY
Liters Barrels Cubic
meters toe
Cubic meters Cubic feet kWh
OIL 1 barrel (1) bbl 158.99 1 0.16 0.14 162.60 5,615 1.7x10³
1 cubic meter (1) m3 1,000 6.29 1 0.86 1,033 36,481 10,691.5
1 ton of oil equivalent (1)
toe 1,160.49 7.30 1.16 1 1,187 41,911 12,407.4
GAS 1 cubic meter m3 0.98 0.01 0,001 0,001 1 35.32 10.35
1,000 cubic feet = 1.04x10⁶ Btu
ft3 27.64 0.18 0.03 0.02 28.3 1,000 293.1
ELECTRICITY 1 megawatt hour MWh 93.53 0.59 0.10 0.08 96.62 3,412.14 1,000