Embed Size (px)
Citation preview

–––Q3 2015
INTERIM REPORT
Interim group management report 4 Key figures for the Group 6 Strategy 8 Performance 14 Outlook 2015
15 Developments in the business segments 16 Industrial 17 Building and Facility 18 Discontinued operations
Interim consolidated financial statements 21 Consolidated income statement 22 Consolidated statement of comprehensive income 23 Consolidated balance sheet 24 Consolidated statement of changes in equity 25 Consolidated statement of cash flows
26 Notes to the interim consolidated financial statements
37 Review report
38 Bilfinger shares 39 Financial calendar
2
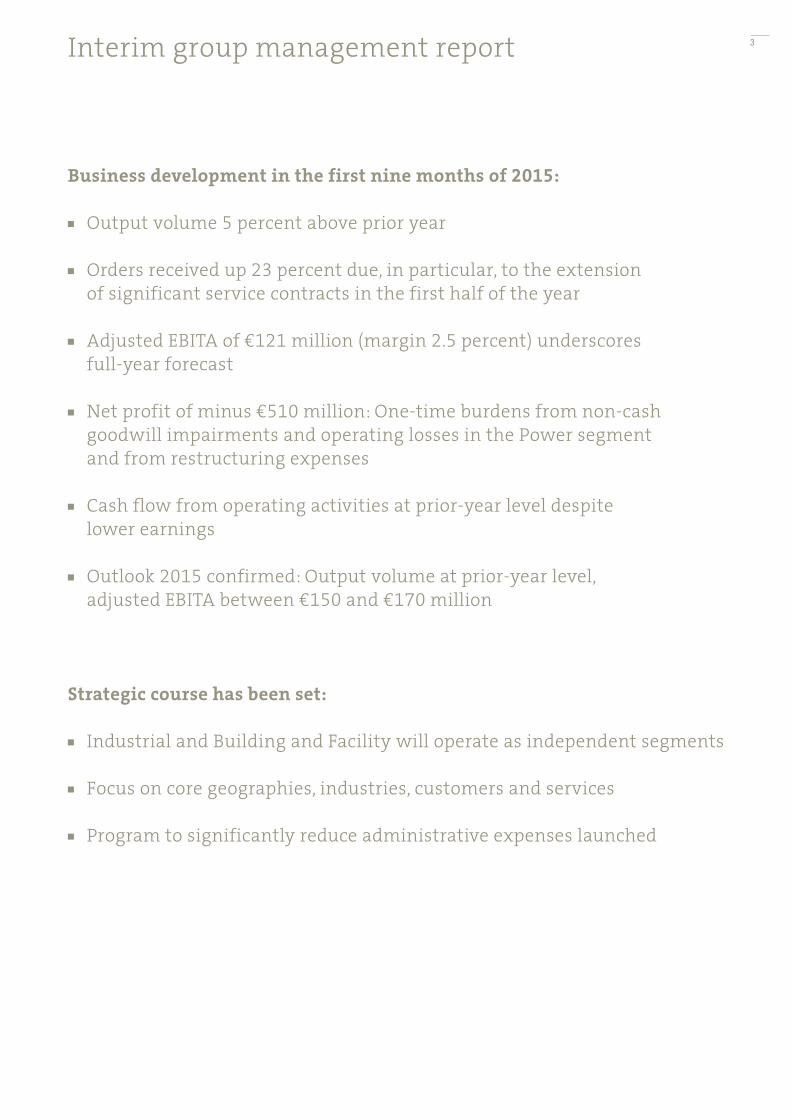
Business development in the first nine months of 2015:
Output volume 5 percent above prior year
Orders received up 23 percent due, in particular, to the extension of significant service contracts in the first half of the year
Adjusted EBITA of €121 million (margin 2.5 percent) underscores full-year forecast
Net profit of minus €510 million: One-time burdens from non-cash goodwill impairments and operating losses in the Power segment and from restructuring expenses
Cash flow from operating activities at prior-year level despite lower earnings
Outlook 2015 confirmed: Output volume at prior-year level, adjusted EBITA between €150 and €170 million
Strategic course has been set:
Industrial and Building and Facility will operate as independent segments
Focus on core geographies, industries, customers and services
Program to significantly reduce administrative expenses launched
Interim group management report 3
Key figures for the Group *
€ million Q1- Q 3 Q 3
2015 2014 ∆ in % 2015 2014 ∆ in % 1-12 / 2014
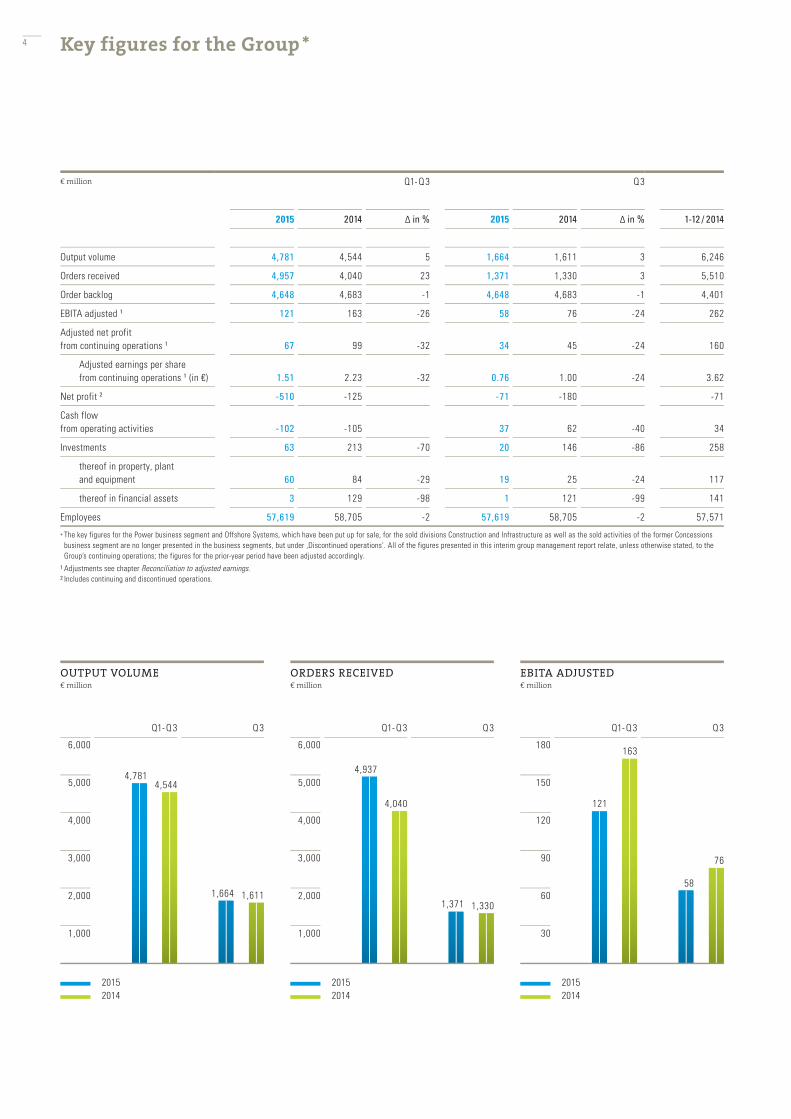
Output volume 4,781 4,544 5 1,664 1,611 3 6,246
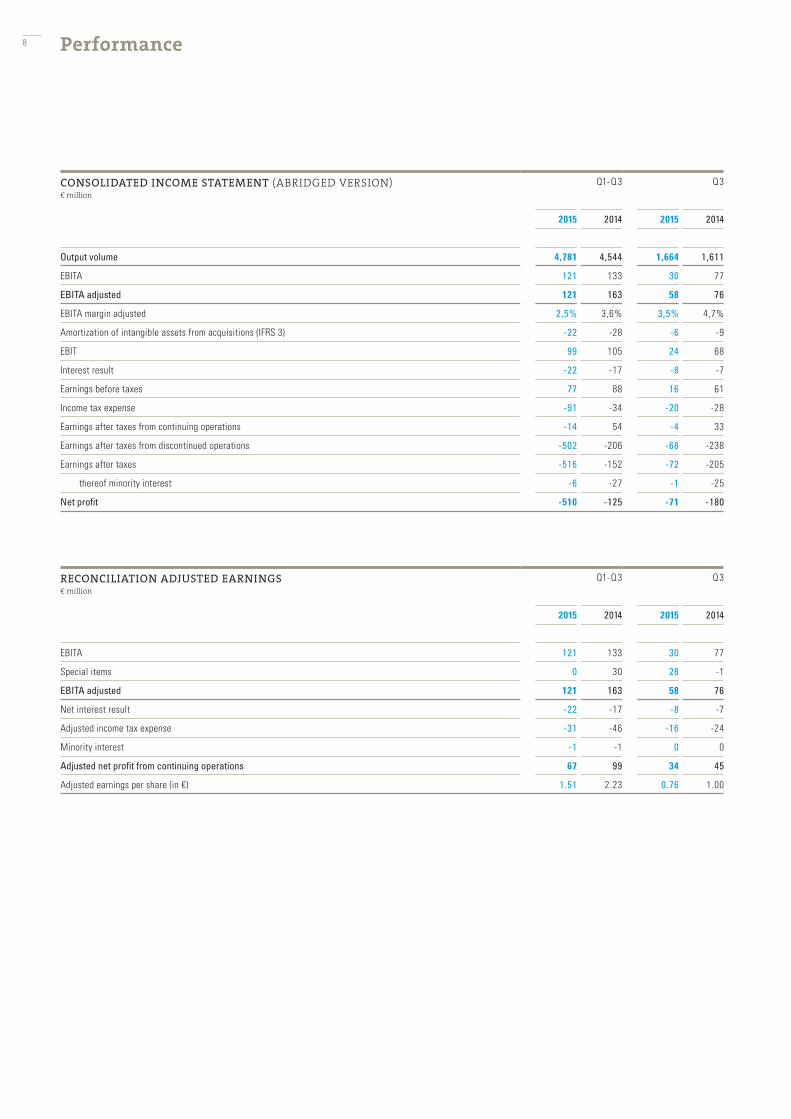
Orders received 4,957 4,040 23 1,371 1,330 3 5,510
Order backlog 4,648 4,683 -1 4,648 4,683 -1 4,401
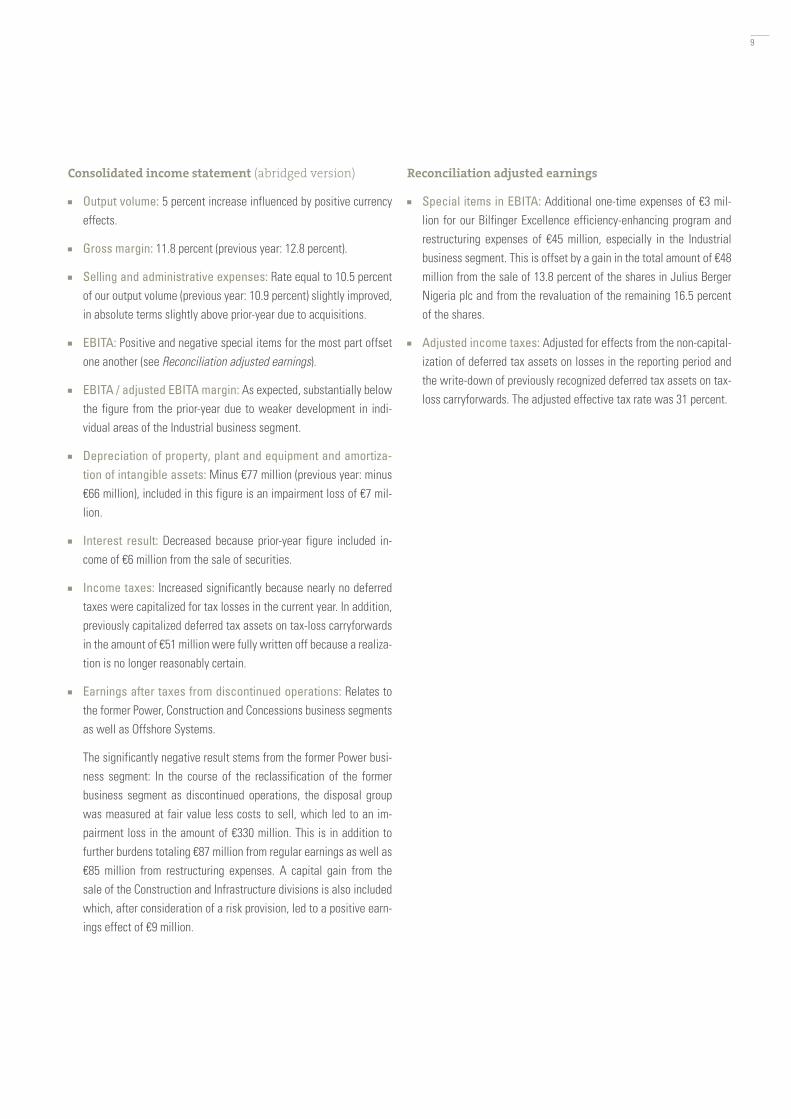
EBITA adjusted 1 121 163 -26 58 76 -24 262
Adjusted net profit from continuing operations 1 67 99 -32 34 45 -24 160
Adjusted earnings per share from continuing operations 1 (in €) 1.51 2.23 -32 0.76 1.00 -24 3.62
Net profit 2 -510 -125 -71 -180 -71
Cash flow from operating activities -102 -105 37 62 -40 34
Investments 63 213 -70 20 146 -86 258
thereof in property, plant and equipment 60 84 -29 19 25 -24 117
thereof in financial assets 3 129 -98 1 121 -99 141
Employees 57,619 58,705 -2 57,619 58,705 -2 57,571
* The key figures for the Power business segment and Offshore Systems, which have been put up for sale, for the sold divisions Construction and Infrastructure as well as the sold activities of the former Concessions business segment are no longer presented in the business segments, but under ‚Discontinued operations‘. All of the figures presented in this interim group management report relate, unless otherwise stated, to the Group’s continuing operations; the figures for the prior-year period have been adjusted accordingly.
1 Adjustments see chapter Reconciliation to adjusted earnings. 2 Includes continuing and discontinued operations.
20152014
OUTPUT VOLUME€ million
Q1- Q 3 Q 3
1,611
4,5444,781
1,664
6,000
5,000
4,000
3,000
2,000
1,000
20152014
ORDERS RECEIVED€ million
Q1- Q 3 Q 3
1,330
4,040
4,937
1,371
6,000
5,000
4,000
3,000
2,000
1,000
20152014
EBITA ADJUSTED€ million
Q1- Q 3 Q 3
76
163
121
58
180
150
120
90
60
30
4
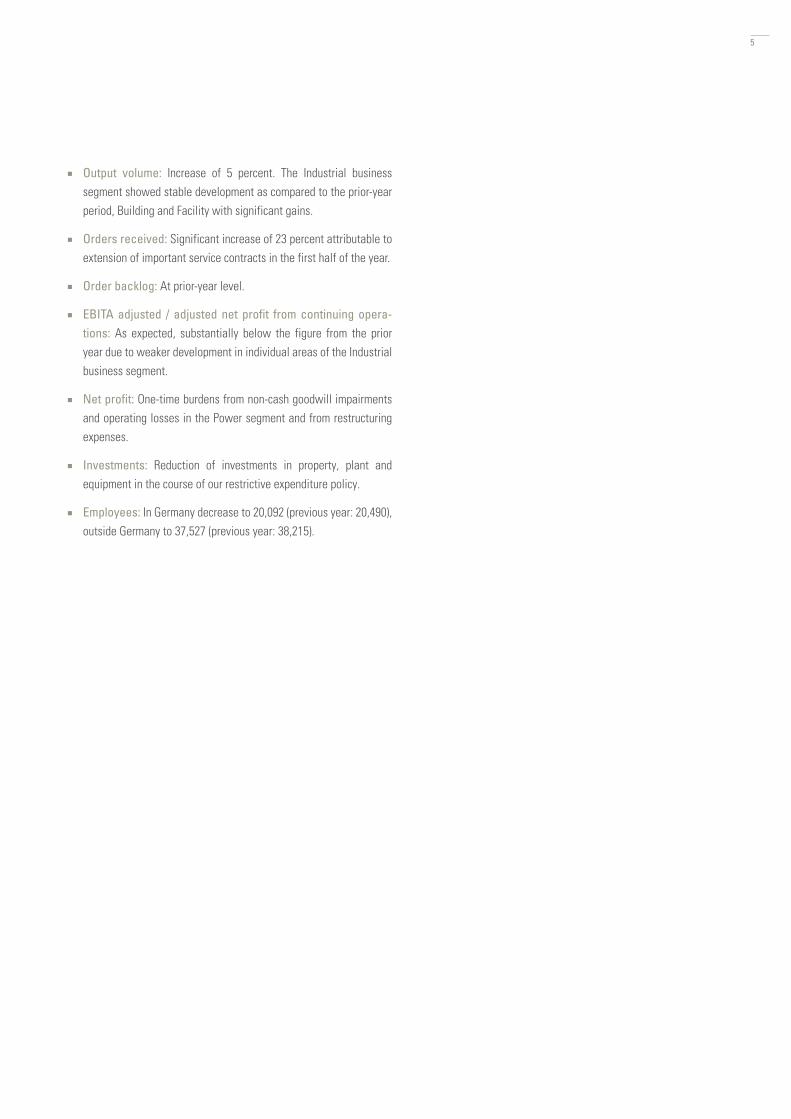
Output volume: Increase of 5 percent. The Industrial business segment showed stable development as compared to the prior-year period, Building and Facility with significant gains.
Orders received: Significant increase of 23 percent attributable to extension of important service contracts in the first half of the year.
Order backlog: At prior-year level.
EBITA adjusted / adjusted net profit from continuing opera-tions: As expected, substantially below the figure from the prior year due to weaker development in individual areas of the Industrial business segment.
Net profit: One-time burdens from non-cash goodwill impairments and operating losses in the Power segment and from restructuring expenses.
Investments: Reduction of investments in property, plant and equipment in the course of our restrictive expenditure policy.
Employees: In Germany decrease to 20,092 (previous year: 20,490), outside Germany to 37,527 (previous year: 38,215).
5

Strategy: Focus, Focus, Focus
Bilfinger is facing far-reaching changes. The company is narrowing the focus of its business from three to two segments, concentrating activi-ties that are currently spread around the globe on the home market of Europe and replacing a complex structure with a transparent and fast-moving organization. As a result, Bilfinger’s profitability will increase sustainably.
Reduce complexity
Two independent segments: The two business segments Indus-trial and Building and Facility will operate as independent segments within Bilfinger and will be given greater entrepreneurial freedom. With this independence, each segment will be able to develop its strengths in a more targeted manner.
Core business Industrial: In the Industrial segment, Bilfinger is concentrating on markets in Central and Northern Europe. A focused sales strategy will help to further improve cooperation with strategi-cally important customers and to further expand the market position in core regions. Bilfinger will consistently restructure Industrial’s low-margin operations. The segment will thus get back on a path to success and, in the medium term, once again be able to increase volume and earnings.
Core business Building and Facility: In the Building and Facility business segment, Bilfinger will concentrate its strategic focus more intensively on real-estate services and will continue its successful growth path. The Group will expand its position as a strong real-estate services provider on the European market. Through organic growth and selective acquisitions, Bilfinger seeks to increase output volume with a continued good earnings margin in the Building and Facility segment.
Non-core business: The Executive Board has identified areas with an output volume of approximately €1 billion which in the future will no longer be part of the core business. For these activities, Bilfinger will review all strategic options, without bias.
Return to profitable growth
Key account management: We intend to grow profitably through intensified key account management with defined, strategically im-portant customers.
Operational excellence: Program for the optimization of service order processes launched. Primary objectives include the standardi-zation and efficiency enhancement of procedures in workshops and logistics chains as well as in information technology and resource planning.
Reduction of administrative expenses: The administrative struc-ture will be adjusted to the business activities that are being fo-cused on. The goal is to make the entire organization more efficient and to significantly reduce administrative expenses which are cur-rently above 10 percent of output volume.
Improve cash conversion
Cash: Establishment of a task force, Group-wide introduction of best practice processes, intensive training and monthly monitoring with the goal of accelerating internal billing processes and signifi-cantly improving receivables management.
6

Change in the Executive Board
Michael Bernhardt appointed Member of the Executive Board and Labor Director: The Supervisory Board of Bilfinger SE has ap-pointed Michael Bernhardt, 48, as Member of the Executive Board. On November 1, 2015, he assumed responsibility for human resourc-es and the function of Labor Director, which had previously been car-ried out in the Executive Board by Dr. Jochen Keysberg on an interim basis. Michael Bernhardt comes from the former Bayer Material Science AG, now Covestro AG, where he held the same position.
7
Performance
CONSOLIDATED INCOME STATEMENT (ABRIDGED VERSION)€ million
Q1- Q 3 Q 3
2015 2014 2015 2014
Output volume 4,781 4,544 1,664 1,611
EBITA 121 133 30 77
EBITA adjusted 121 163 58 76
EBITA margin adjusted 2,5% 3,6% 3,5% 4,7%
Amortization of intangible assets from acquisitions (IFRS 3) -22 -28 -6 -9
EBIT 99 105 24 68
Interest result -22 -17 -8 -7
Earnings before taxes 77 88 16 61
Income tax expense -91 -34 -20 -28
Earnings after taxes from continuing operations -14 54 -4 33
Earnings after taxes from discontinued operations -502 -206 -68 -238
Earnings after taxes -516 -152 -72 -205
thereof minority interest -6 -27 -1 -25
Net profit -510 -125 -71 -180
RECONCILIATION ADJUSTED EARNINGS€ million
Q1- Q 3 Q 3
2015 2014 2015 2014
EBITA 121 133 30 77
Special items 0 30 28 -1
EBITA adjusted 121 163 58 76
Net interest result -22 -17 -8 -7
Adjusted income tax expense -31 -46 -16 -24
Minority interest -1 -1 0 0
Adjusted net profit from continuing operations 67 99 34 45
Adjusted earnings per share (in €) 1.51 2.23 0.76 1.00
8
Consolidated income statement (abridged version)
Output volume: 5 percent increase influenced by positive currency effects.
Gross margin: 11.8 percent (previous year: 12.8 percent).
Selling and administrative expenses: Rate equal to 10.5 percent of our output volume (previous year: 10.9 percent) slightly improved, in absolute terms slightly above prior-year due to acquisitions.
EBITA: Positive and negative special items for the most part offset one another (see Reconciliation adjusted earnings).
EBITA / adjusted EBITA margin: As expected, substantially below the figure from the prior-year due to weaker development in indi-vidual areas of the Industrial business segment.
Depreciation of property, plant and equipment and amortiza-tion of intangible assets: Minus €77 million (previous year: minus €66 million), included in this figure is an impairment loss of €7 mil-lion.
Interest result: Decreased because prior-year figure included in-come of €6 million from the sale of securities.
Income taxes: Increased significantly because nearly no deferred taxes were capitalized for tax losses in the current year. In addition, previously capitalized deferred tax assets on tax-loss carryforwards in the amount of €51 million were fully written off because a realiza-tion is no longer reasonably certain.
Earnings after taxes from discontinued operations: Relates to the former Power, Construction and Concessions business segments as well as Offshore Systems.
The significantly negative result stems from the former Power busi-ness segment: In the course of the reclassification of the former business segment as discontinued operations, the disposal group was measured at fair value less costs to sell, which led to an im-pairment loss in the amount of €330 million. This is in addition to further burdens totaling €87 million from regular earnings as well as €85 million from restructuring expenses. A capital gain from the sale of the Construction and Infrastructure divisions is also included which, after consideration of a risk provision, led to a positive earn-ings effect of €9 million.
Reconciliation adjusted earnings
Special items in EBITA: Additional one-time expenses of €3 mil-lion for our Bilfinger Excellence efficiency-enhancing program and restructuring expenses of €45 million, especially in the Industrial business segment. This is offset by a gain in the total amount of €48 million from the sale of 13.8 percent of the shares in Julius Berger Nigeria plc and from the revaluation of the remaining 16.5 percent of the shares.
Adjusted income taxes: Adjusted for effects from the non-capital-ization of deferred tax assets on losses in the reporting period and the write-down of previously recognized deferred tax assets on tax-loss carryforwards. The adjusted effective tax rate was 31 percent.
9
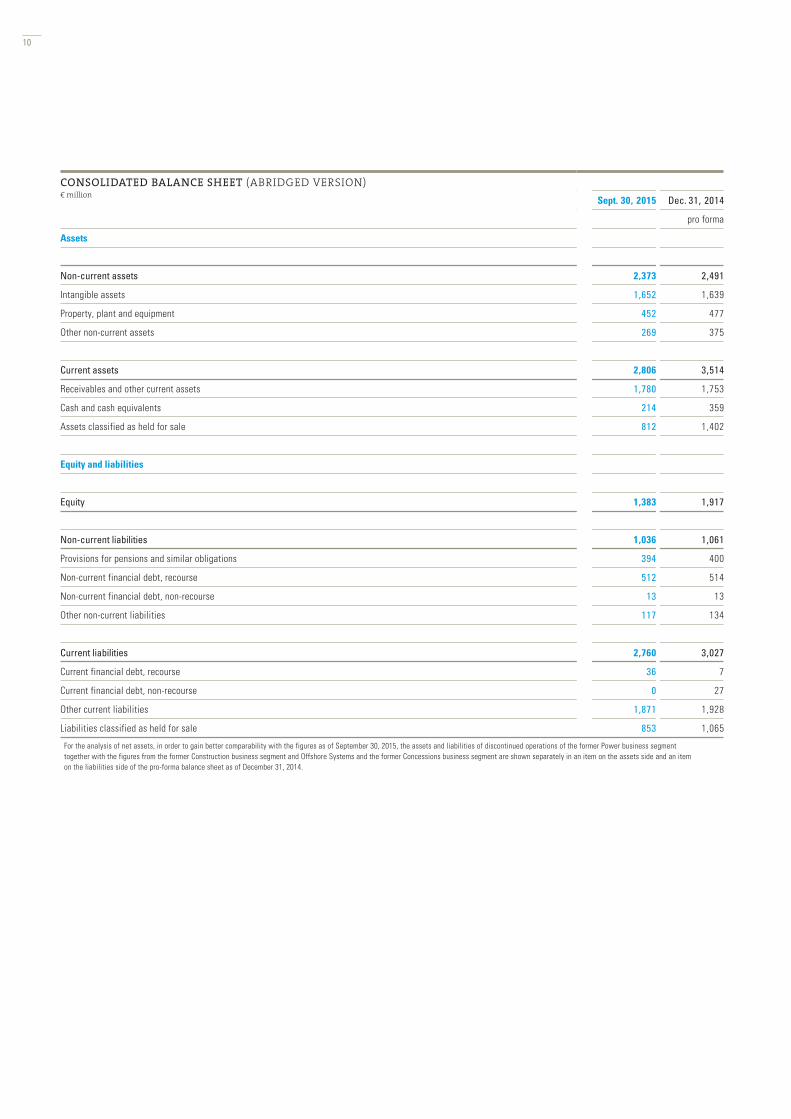
CONSOLIDATED BALANCE SHEET (ABRIDGED VERSION)€ million
Sept. 30, 2015 Dec. 31, 2014
pro forma
Assets
Non-current assets 2,373 2,491
Intangible assets 1,652 1,639
Property, plant and equipment 452 477
Other non-current assets 269 375
Current assets 2,806 3,514
Receivables and other current assets 1,780 1,753
Cash and cash equivalents 214 359
Assets classified as held for sale 812 1,402
Equity and liabilities
Equity 1,383 1,917
Non-current liabilities 1,036 1,061
Provisions for pensions and similar obligations 394 400
Non-current financial debt, recourse 512 514
Non-current financial debt, non-recourse 13 13
Other non-current liabilities 117 134
Current liabilities 2,760 3,027
Current financial debt, recourse 36 7
Current financial debt, non-recourse 0 27
Other current liabilities 1,871 1,928
Liabilities classified as held for sale 853 1,065
For the analysis of net assets, in order to gain better comparability with the figures as of September 30, 2015, the assets and liabilities of discontinued operations of the former Power business segment together with the figures from the former Construction business segment and Offshore Systems and the former Concessions business segment are shown separately in an item on the assets side and an item on the liabilities side of the pro-forma balance sheet as of December 31, 2014.
10
Assets
Intangible assets: Increase in goodwill is currency-related.
Other non-current assets: Decrease due to the write-down of recognized deferred tax assets on tax-loss carryforwards, sale and/or reclassification of the Nigerian companies as well as two motor-way concession projects.
Assets classified as held for sale: Decrease due to sale of the Construction and Infrastructure divisions as well as impairment in the Power segment.
Equity and liabilities
Equity: Reduction as a result of the negative earnings after taxes and dividend payments with opposing effects from items not rec-ognized in the income statement – for the most part from currency translation. The equity ratio amounts to 27 percent (end of 2014: 32 percent).
Provisions for pensions and similar obligations: Slight decrease as a result of changes in the discount rate – in the euro zone an in-crease from 2.0 to 2.25 percent and a decrease in Switzerland from 1.5 to 0.85 percent.
Financial debt, recourse: Relates primarily to a bond in the amount of €500 million maturing in December 2019, net financial debt amounts to €334 million (previous year, pro forma: €319 mil-lion).
11
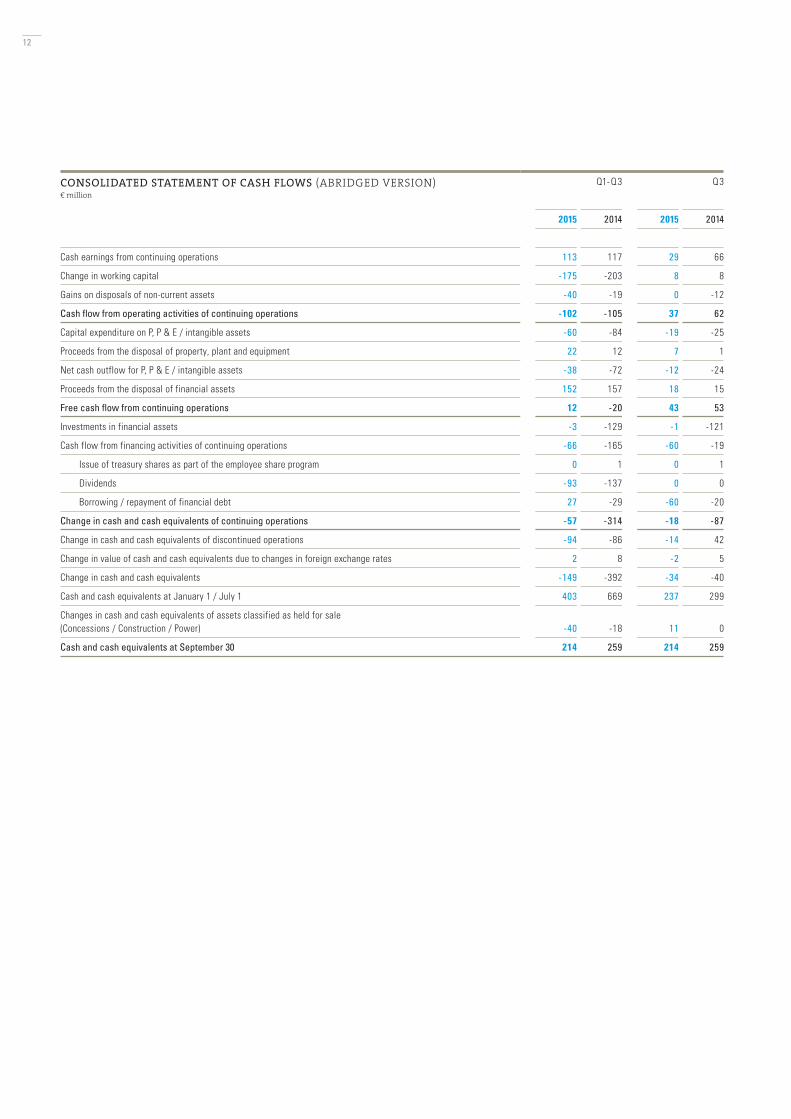
CONSOLIDATED STATEMENT OF CASH FLOWS (ABRIDGED VERSION)€ million
Q1- Q 3 Q 3
2015 2014 2015 2014
Cash earnings from continuing operations 113 117 29 66
Change in working capital -175 -203 8 8
Gains on disposals of non-current assets -40 -19 0 -12
Cash flow from operating activities of continuing operations -102 -105 37 62
Capital expenditure on P, P & E / intangible assets -60 -84 -19 -25
Proceeds from the disposal of property, plant and equipment 22 12 7 1
Net cash outflow for P, P & E / intangible assets -38 -72 -12 -24
Proceeds from the disposal of financial assets 152 157 18 15
Free cash flow from continuing operations 12 -20 43 53
Investments in financial assets -3 -129 -1 -121
Cash flow from financing activities of continuing operations -66 -165 -60 -19
Issue of treasury shares as part of the employee share program 0 1 0 1
Dividends -93 -137 0 0
Borrowing / repayment of financial debt 27 -29 -60 -20
Change in cash and cash equivalents of continuing operations -57 -314 -18 -87
Change in cash and cash equivalents of discontinued operations -94 -86 -14 42
Change in value of cash and cash equivalents due to changes in foreign exchange rates 2 8 -2 5
Change in cash and cash equivalents -149 -392 -34 -40
Cash and cash equivalents at January 1 / July 1 403 669 237 299
Changes in cash and cash equivalents of assets classified as held for sale (Concessions / Construction / Power) -40 -18 11 0
Cash and cash equivalents at September 30 214 259 214 259
12
Cash earnings from continuing operations: No significant change because lower earnings impacted primarily by high deferred tax expense (write-down of previously recognized deferred tax as-sets on tax-loss carryforwards).
Change in working capital: The increase in working capital during the year, which is typical for our business, slowed slightly.
Cash flow from operating activities of continuing operations: At prior-year level despite lower earnings.
Net cash outflow for investments in property, plant and equip-ment / intangible assets: In the context of our restrictive expendi-ture policy, reduction of investments in property, plant and equip-ment to €60 million (previous year: €84 million). This was countered by payments received in the amount of €22 million (previous year: €12 million).
Proceeds from the disposal of financial assets: The net cash inflow resulted from proceeds from the sale of the Construction (€73 million) and Infrastructure (€18 million) divisions, from the sale of investments in the Nigerian business (€49 million) as well as from the sale of Power’s office property in Oberhausen (€13 million).
Cash flow from financing activities of continuing operations: Dividends paid to the shareholders of Bilfinger accounted for €88 million and the partial utilization of the syndicated credit facility re-sulted in an inflow of €30 million.
Change in cash and cash equivalents from discontinued operations: Relates primarily to Construction and Offshore Systems (minus €62 million) as well as Power (minus €28 million).
13
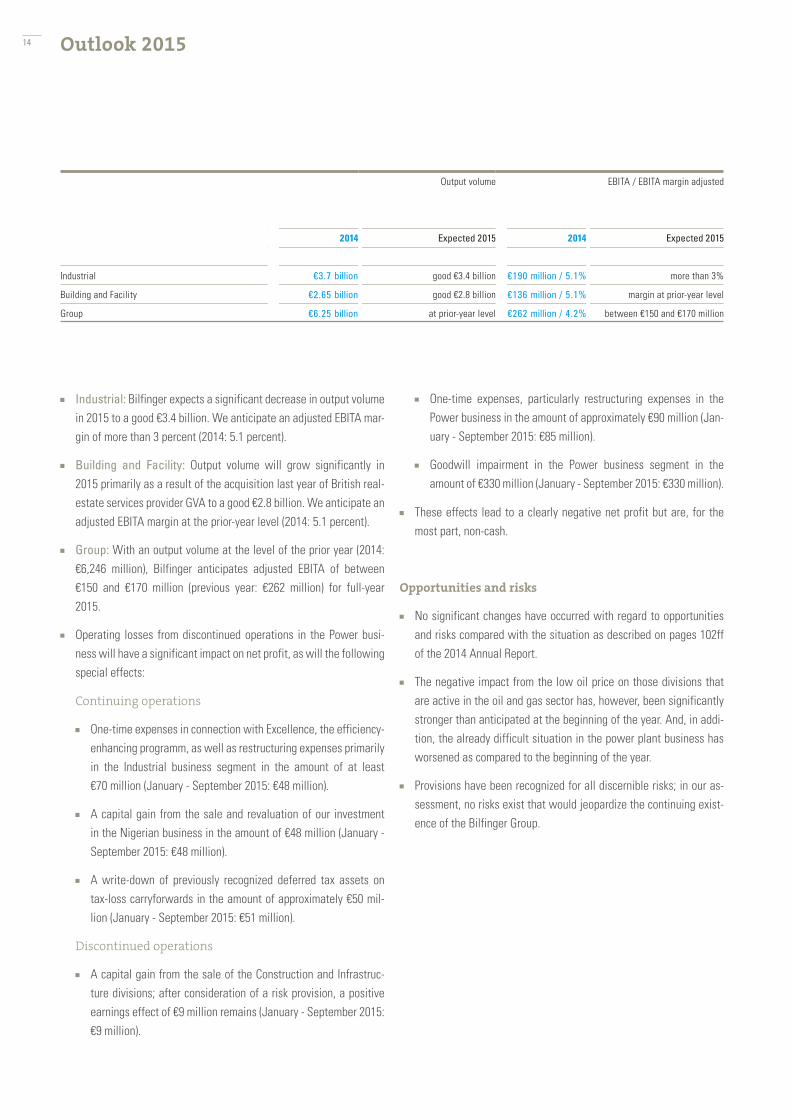
Outlook 2015
Industrial: Bilfinger expects a significant decrease in output volume in 2015 to a good €3.4 billion. We anticipate an adjusted EBITA mar-gin of more than 3 percent (2014: 5.1 percent).
Building and Facility: Output volume will grow significantly in 2015 primarily as a result of the acquisition last year of British real-estate services provider GVA to a good €2.8 billion. We anticipate an adjusted EBITA margin at the prior-year level (2014: 5.1 percent).
Group: With an output volume at the level of the prior year (2014: €6,246 million), Bilfinger anticipates adjusted EBITA of between €150 and €170 million (previous year: €262 million) for full-year 2015.
Operating losses from discontinued operations in the Power busi-ness will have a significant impact on net profit, as will the following special effects:
Continuing operations
One-time expenses in connection with Excellence, the efficiency-enhancing programm, as well as restructuring expenses primarily in the Industrial business segment in the amount of at least €70 million (January - September 2015: €48 million).
A capital gain from the sale and revaluation of our investment in the Nigerian business in the amount of €48 million (January - September 2015: €48 million).
A write-down of previously recognized deferred tax assets on tax-loss carryforwards in the amount of approximately €50 mil-lion (January - September 2015: €51 million).
Discontinued operations
A capital gain from the sale of the Construction and Infrastruc-ture divisions; after consideration of a risk provision, a positive earnings effect of €9 million remains (January - September 2015: €9 million).
One-time expenses, particularly restructuring expenses in the Power business in the amount of approximately €90 million (Jan-uary - September 2015: €85 million).
Goodwill impairment in the Power business segment in the amount of €330 million (January - September 2015: €330 million).
These effects lead to a clearly negative net profit but are, for the most part, non-cash.
Opportunities and risks
No significant changes have occurred with regard to opportunities and risks compared with the situation as described on pages 102ff of the 2014 Annual Report.
The negative impact from the low oil price on those divisions that are active in the oil and gas sector has, however, been significantly stronger than anticipated at the beginning of the year. And, in addi-tion, the already difficult situation in the power plant business has worsened as compared to the beginning of the year.
Provisions have been recognized for all discernible risks; in our as-sessment, no risks exist that would jeopardize the continuing exist-ence of the Bilfinger Group.
Output volume EBITA / EBITA margin adjusted
2014 Expected 2015 2014 Expected 2015
Industrial €3.7 billion good €3.4 billion €190 million / 5.1% more than 3%
Building and Facility €2.65 billion good €2.8 billion €136 million / 5.1% margin at prior-year level
Group €6.25 billion at prior-year level €262 million / 4.2% between €150 and €170 million
14
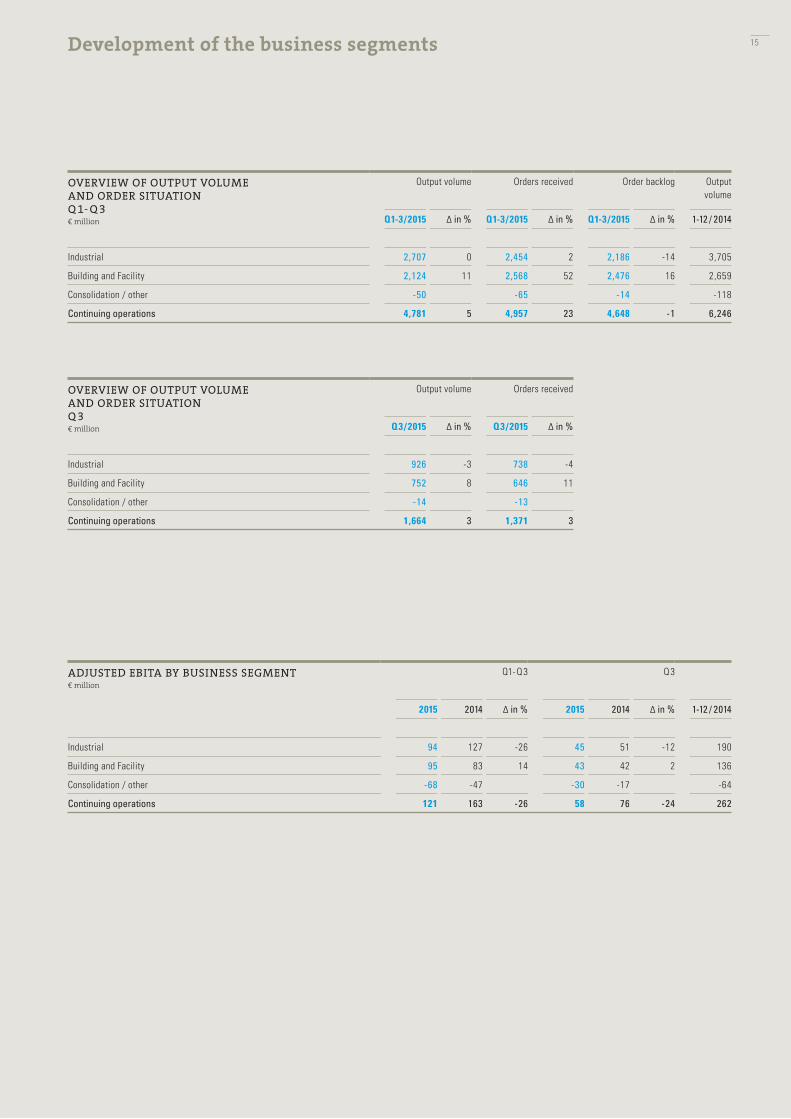
Development of the business segments
OVERVIEW OF OUTPUT VOLUME AND ORDER SITUATIONQ 1- Q 3€ million
Output volume Orders received Order backlog Output volume
Q1-3/2015 ∆ in % Q1-3/2015 ∆ in % Q1-3/2015 ∆ in % 1-12 / 2014
Industrial 2,707 0 2,454 2 2,186 -14 3,705
Building and Facility 2,124 11 2,568 52 2,476 16 2,659
Consolidation / other -50 -65 -14 -118
Continuing operations 4,781 5 4,957 23 4,648 -1 6,246
OVERVIEW OF OUTPUT VOLUME AND ORDER SITUATIONQ 3€ million
Output volume Orders received
Q3/2015 ∆ in % Q3/2015 ∆ in %
Industrial 926 -3 738 -4
Building and Facility 752 8 646 11
Consolidation / other -14 -13
Continuing operations 1,664 3 1,371 3
ADJUSTED EBITA BY BUSINESS SEGMENT€ million
Q1- Q 3 Q 3
2015 2014 ∆ in % 2015 2014 ∆ in % 1-12 / 2014
Industrial 94 127 -26 45 51 -12 190
Building and Facility 95 83 14 43 42 2 136
Consolidation / other -68 -47 -30 -17 -64
Continuing operations 121 163 -26 58 76 -24 262
15
Market situation process industry: Stable development of the maintenance business for facilities in the process industry and, on the other hand, ongoing limited willingness to invest on the part of our customers in the project business.
Market situation oil and gas: Reluctance to invest as a result of the low oil price.
USA: End of the upswing triggered by the shale gas boom. Stabiliza-tion at lower level.
Scandinavia: Unchanged reduced budgets for maintenance of pro-duction and processing facilities.
UK: Currently good business development
European maintenance business in mid and downstream less volatile.
Strategic measures: Bilfinger will benefit from a growing trend toward outsourcing as well as from the digitalization and increased networking of industry.
In the operating business, a focused sales strategy will help to further improve cooperation with strategically important customers and to further expand the market position in the core regions of Central and Northern Europe.
Low-margin areas from Industrial will be repositioned. The focus in this regard is on the optimization of organizational and cost structures.
As a consequence of the developments described, capacity adjust-ments in individual areas of the business segment are necessary.
Output volume: Stable development as a result of positive ex-change rate effects.
Orders received: Increase of 2 percent, also as a result of ex-change rates.
After the balance sheet date: Extension of framework agreements with two longstanding customers in the oil and gas sector for the maintenance of offshore facilities in the British North Sea. Terms of five years each, total volume €150 million.
Order backlog: 14 percent below prior year, ongoing caution on the part of oil and gas customers.
EBITA / EBITA adjusted: Decrease because divisions active in the oil and gas business could not meet original earnings expectations.
Outlook: The forecast for the Industrial segment is described in Outlook 2015 on page 14.
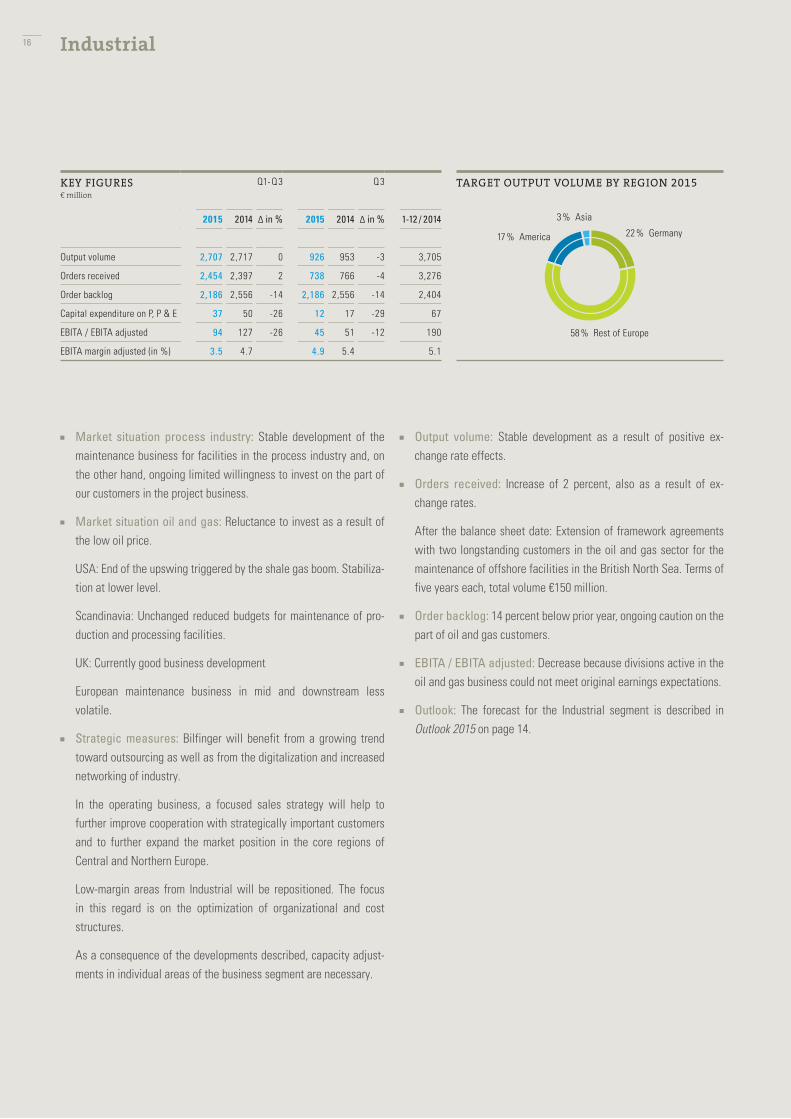
Industrial
KEY FIGURES€ million
Q1- Q 3 Q 3
2015 2014 ∆ in % 2015 2014 ∆ in % 1-12 / 2014
Output volume 2,707 2,717 0 926 953 -3 3,705
Orders received 2,454 2,397 2 738 766 -4 3,276
Order backlog 2,186 2,556 -14 2,186 2,556 -14 2,404
Capital expenditure on P, P & E 37 50 -26 12 17 -29 67
EBITA / EBITA adjusted 94 127 -26 45 51 -12 190
EBITA margin adjusted (in %) 3.5 4.7 4.9 5.4 5.1
TARGET OUTPUT VOLUME BY REGION 2015
22 % Germany
58 % Rest of Europe
17 % America
3 % Asia
16
Market situation Facility Services and Real Estate: Further growth in market for outsourced real-estate services in Germany. Good demand from multinational customers for comprehensive con-sulting and management services from a single source on important European markets. In addition, increasing requirements in relation to the energy efficiency of real estate.
Market situation Building: Construction sector in Germany gener-ally stable, growing demand, especially in residential construction, for construction-related services in existing buildings such as con-sulting, design, management and logistics.
Strategic measures: Continuation of profitable growth course and expansion of strong position in Europe through customer-oriented integrated real-estate services. Utilization of additional growth im-pulses in areas including industrial customers, digitalization and en-ergy efficiency.
Output volume: Increase of 11 percent also as a result of positive exchange rate effects and the acquisition of British real-estate con-sultancy GVA in the middle of 2014.
Orders received: Gain of 52 percent due primarily to the extension of important facility management contracts in the first half of the year. In addition, order successes in German construction business: In the third quarter, successes included three important orders in Frankfurt am Main, Heilbronn and Regensburg with a total volume of approximately €50 million.
After the balance sheet date: Service agreements with BMW and Zeiss for technical facility management services at German produc-tion locations, total volume of more than €55 million.
Order backlog: 16 percent above prior-year.
EBITA / EBITA adjusted: Increase stems from acquisition and currency effects.
Outlook: The forecast for the Building and Facility segment is described in Outlook 2015 on page 14.
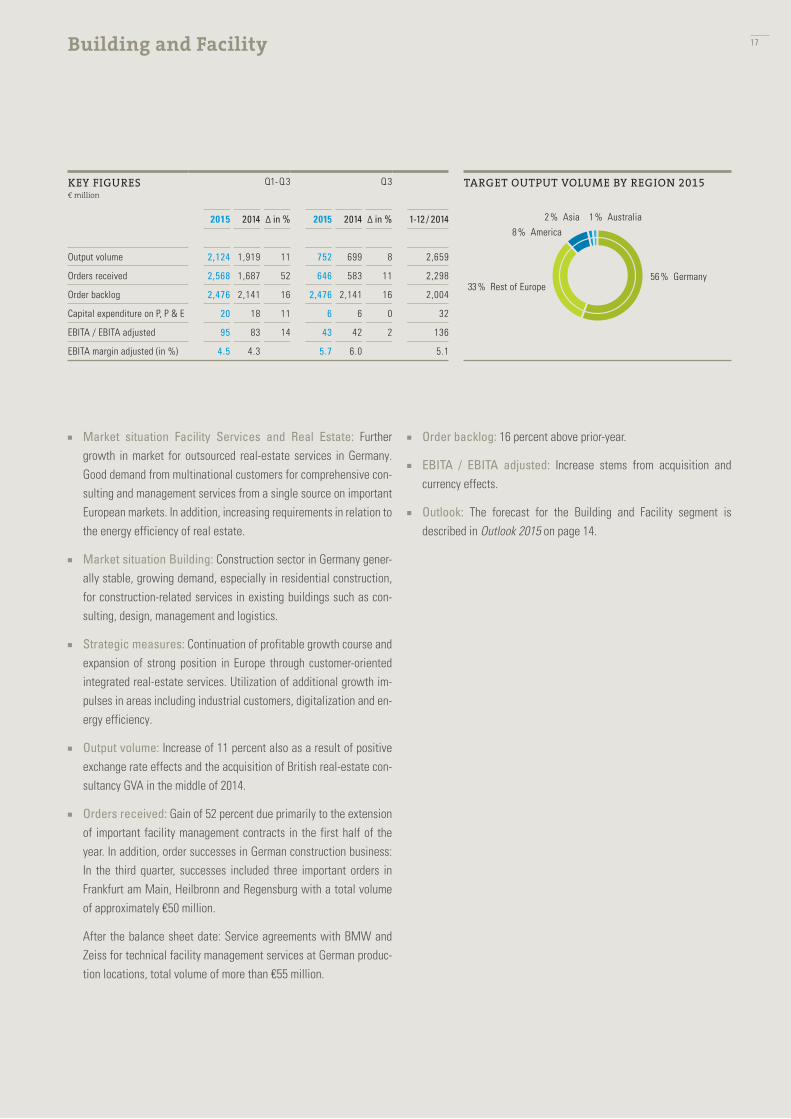
Building and Facility
KEY FIGURES€ million
Q1- Q 3 Q 3
2015 2014 ∆ in % 2015 2014 ∆ in % 1-12 / 2014
Output volume 2,124 1,919 11 752 699 8 2,659
Orders received 2,568 1,687 52 646 583 11 2,298
Order backlog 2,476 2,141 16 2,476 2,141 16 2,004
Capital expenditure on P, P & E 20 18 11 6 6 0 32
EBITA / EBITA adjusted 95 83 14 43 42 2 136
EBITA margin adjusted (in %) 4.5 4.3 5.7 6.0 5.1
TARGET OUTPUT VOLUME BY REGION 2015
56 % Germany33 % Rest of Europe
2 % Asia 1 % Australia
8 % America
17
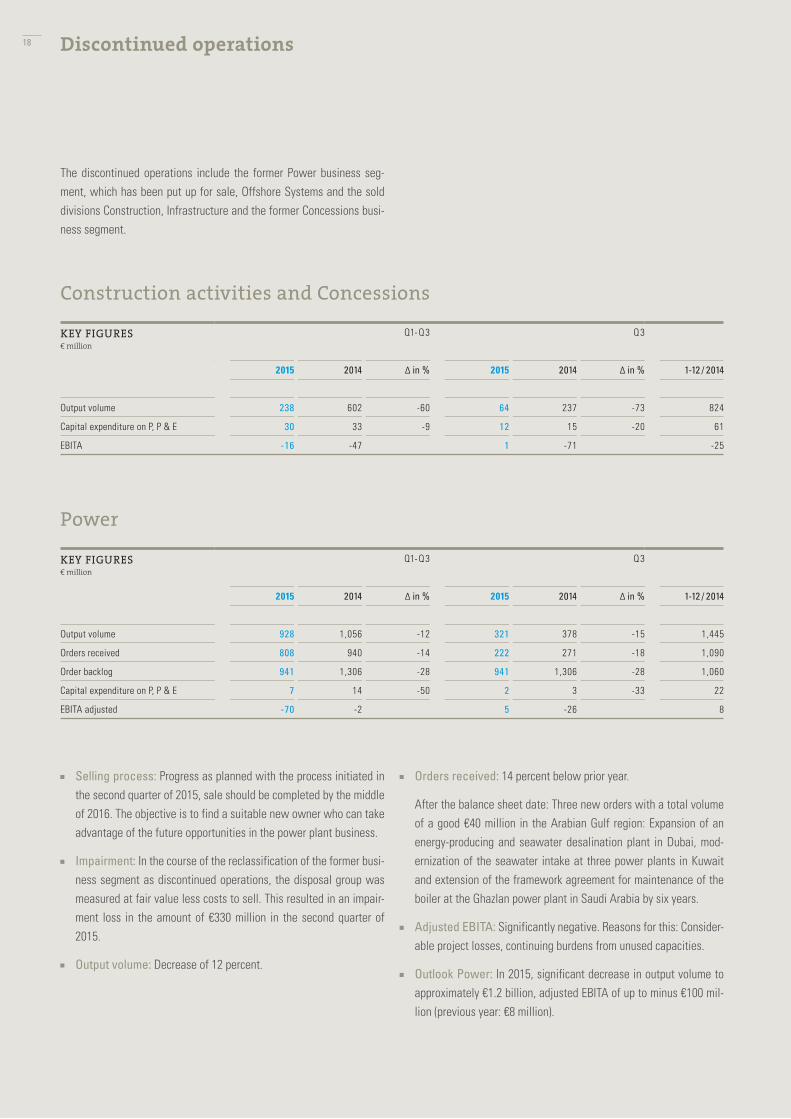
Discontinued operations
The discontinued operations include the former Power business seg-ment, which has been put up for sale, Offshore Systems and the sold divisions Construction, Infrastructure and the former Concessions busi-ness segment.
KEY FIGURES€ million
Q1- Q 3 Q 3
2015 2014 ∆ in % 2015 2014 ∆ in % 1-12 / 2014
Output volume 238 602 -60 64 237 -73 824
Capital expenditure on P, P & E 30 33 -9 12 15 -20 61
EBITA -16 -47 1 -71 -25
Construction activities and Concessions
KEY FIGURES€ million
Q1- Q 3 Q 3
2015 2014 ∆ in % 2015 2014 ∆ in % 1-12 / 2014
Output volume 928 1,056 -12 321 378 -15 1,445
Orders received 808 940 -14 222 271 -18 1,090
Order backlog 941 1,306 -28 941 1,306 -28 1,060
Capital expenditure on P, P & E 7 14 -50 2 3 -33 22
EBITA adjusted -70 -2 5 -26 8
Power
Selling process: Progress as planned with the process initiated in the second quarter of 2015, sale should be completed by the middle of 2016. The objective is to find a suitable new owner who can take advantage of the future opportunities in the power plant business.
Impairment: In the course of the reclassification of the former busi-ness segment as discontinued operations, the disposal group was measured at fair value less costs to sell. This resulted in an impair-ment loss in the amount of €330 million in the second quarter of 2015.
Output volume: Decrease of 12 percent.
Orders received: 14 percent below prior year.
After the balance sheet date: Three new orders with a total volume of a good €40 million in the Arabian Gulf region: Expansion of an energy-producing and seawater desalination plant in Dubai, mod-ernization of the seawater intake at three power plants in Kuwait and extension of the framework agreement for maintenance of the boiler at the Ghazlan power plant in Saudi Arabia by six years.
Adjusted EBITA: Significantly negative. Reasons for this: Consider-able project losses, continuing burdens from unused capacities.
Outlook Power: In 2015, significant decrease in output volume to approximately €1.2 billion, adjusted EBITA of up to minus €100 mil-lion (previous year: €8 million).
18

19

Interim consolidated financial statements 21 Consolidated income statement 22 Consolidated statement of comprehensive income 23 Consolidated balance sheet 24 Consolidated statement of changes in equity 25 Consolidated statement of cash flows
26 Notes to the interim consolidated financial statements
37 Review report
38 Bilfinger shares 39 Financial calendar
20
Interim consolidated financial statements
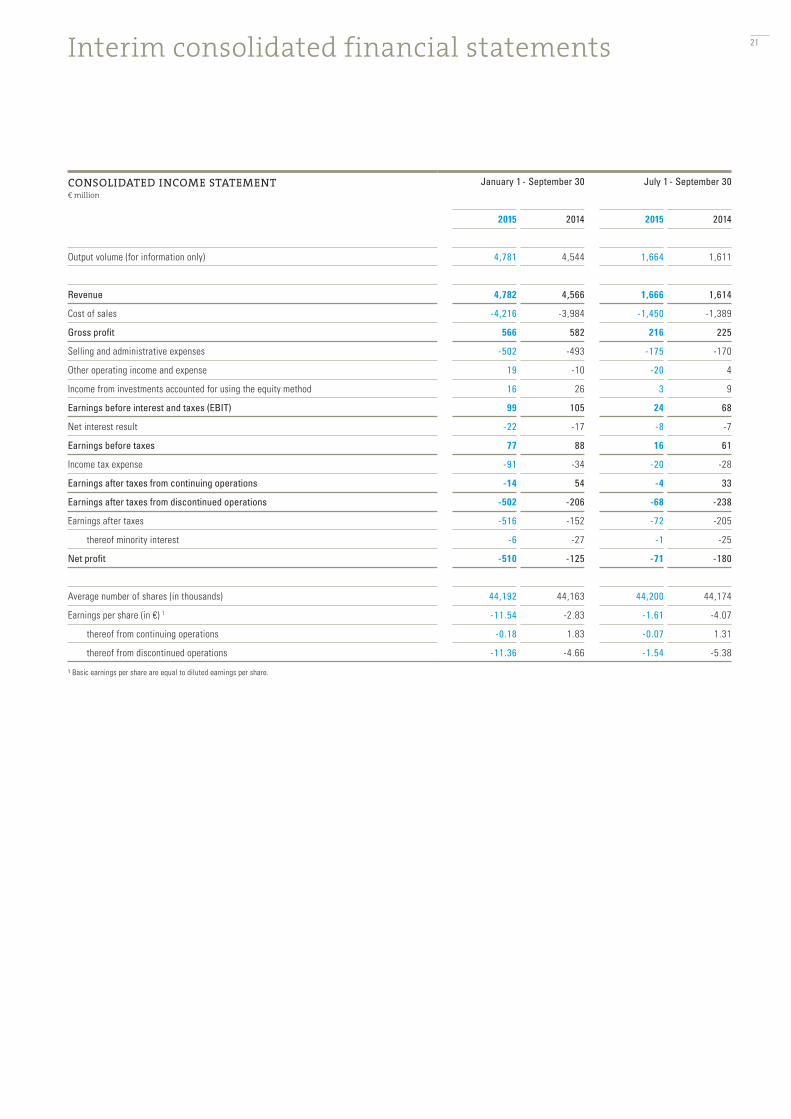
CONSOLIDATED INCOME STATEMENT€ million
January 1 - September 30 July 1 - September 30
2015 2014 2015 2014
Output volume (for information only) 4,781 4,544 1,664 1,611
Revenue 4,782 4,566 1,666 1,614
Cost of sales -4,216 -3,984 -1,450 -1,389
Gross profit 566 582 216 225
Selling and administrative expenses -502 -493 -175 -170
Other operating income and expense 19 -10 -20 4
Income from investments accounted for using the equity method 16 26 3 9
Earnings before interest and taxes (EBIT) 99 105 24 68
Net interest result -22 -17 -8 -7
Earnings before taxes 77 88 16 61
Income tax expense -91 -34 -20 -28
Earnings after taxes from continuing operations -14 54 -4 33
Earnings after taxes from discontinued operations -502 -206 -68 -238
Earnings after taxes -516 -152 -72 -205
thereof minority interest -6 -27 -1 -25
Net profit -510 -125 -71 -180
Average number of shares (in thousands) 44,192 44,163 44,200 44,174
Earnings per share (in €) 1 -11.54 -2.83 -1.61 -4.07
thereof from continuing operations -0.18 1.83 -0.07 1.31
thereof from discontinued operations -11.36 -4.66 -1.54 -5.38
1 Basic earnings per share are equal to diluted earnings per share.
21
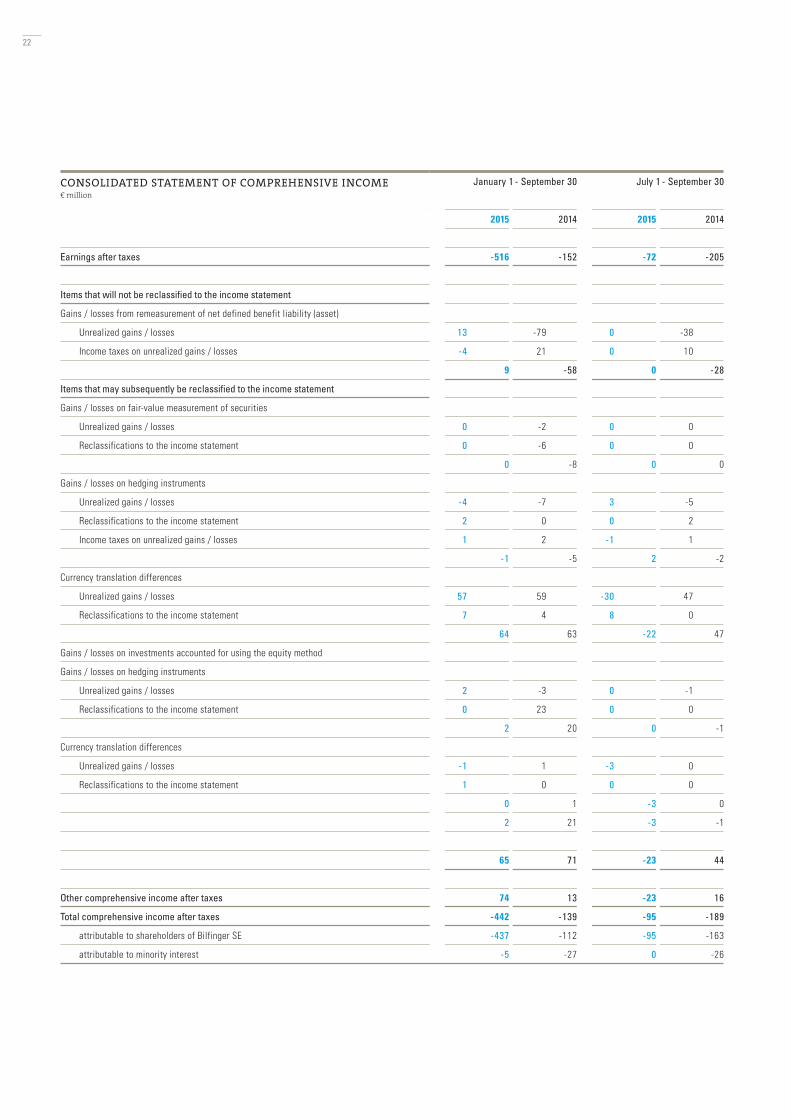
CONSOLIDATED STATEMENT OF COMPREHENSIVE INCOME€ million
January 1 - September 30 July 1 - September 30
2015 2014 2015 2014
Earnings after taxes -516 -152 -72 -205
Items that will not be reclassified to the income statement
Gains / losses from remeasurement of net defined benefit liability (asset)
Unrealized gains / losses 13 -79 0 -38
Income taxes on unrealized gains / losses -4 21 0 10
9 -58 0 -28
Items that may subsequently be reclassified to the income statement
Gains / losses on fair-value measurement of securities
Unrealized gains / losses 0 -2 0 0
Reclassifications to the income statement 0 -6 0 0
0 -8 0 0
Gains / losses on hedging instruments
Unrealized gains / losses -4 -7 3 -5
Reclassifications to the income statement 2 0 0 2
Income taxes on unrealized gains / losses 1 2 -1 1
-1 -5 2 -2
Currency translation differences
Unrealized gains / losses 57 59 -30 47
Reclassifications to the income statement 7 4 8 0
64 63 -22 47
Gains / losses on investments accounted for using the equity method
Gains / losses on hedging instruments
Unrealized gains / losses 2 -3 0 -1
Reclassifications to the income statement 0 23 0 0
2 20 0 -1
Currency translation differences
Unrealized gains / losses -1 1 -3 0
Reclassifications to the income statement 1 0 0 0
0 1 -3 0
2 21 -3 -1
65 71 -23 44
Other comprehensive income after taxes 74 13 -23 16
Total comprehensive income after taxes -442 -139 -95 -189
attributable to shareholders of Bilfinger SE -437 -112 -95 -163
attributable to minority interest -5 -27 0 -26
22
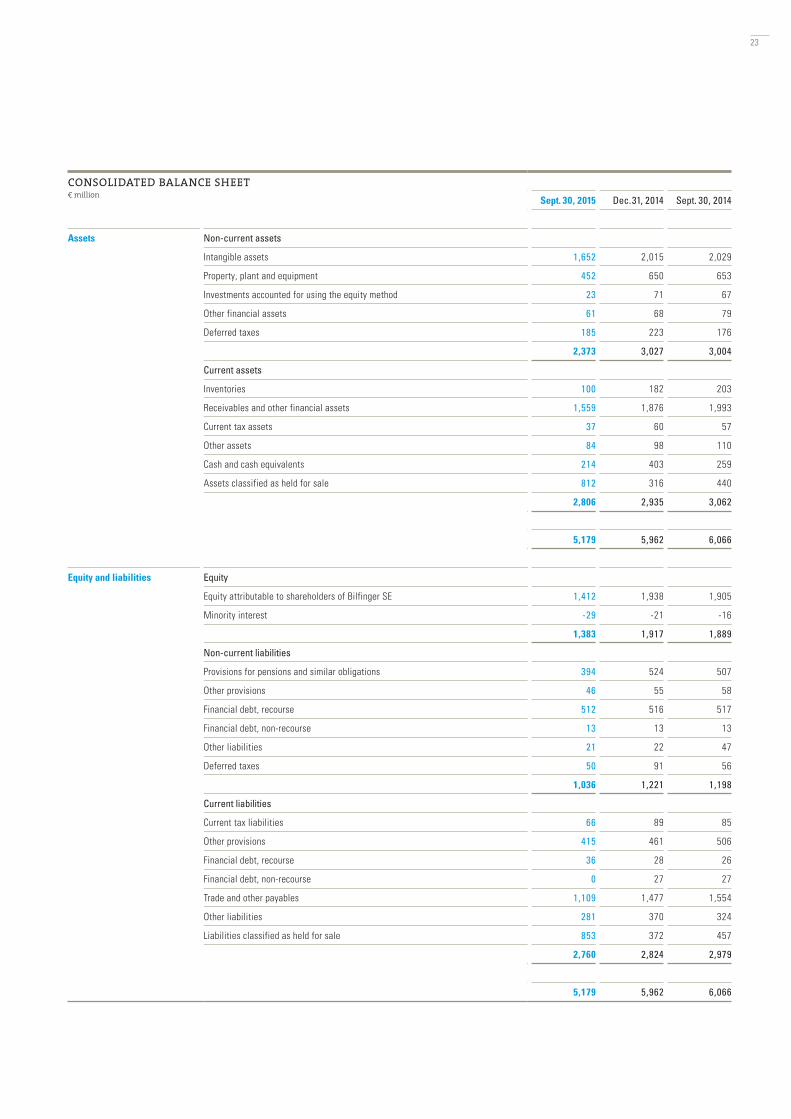
CONSOLIDATED BALANCE SHEET € million
Sept. 30, 2015 Dec. 31, 2014 Sept. 30, 2014
Assets Non-current assets
Intangible assets 1,652 2,015 2,029
Property, plant and equipment 452 650 653
Investments accounted for using the equity method 23 71 67
Other financial assets 61 68 79
Deferred taxes 185 223 176
2,373 3,027 3,004
Current assets
Inventories 100 182 203
Receivables and other financial assets 1,559 1,876 1,993
Current tax assets 37 60 57
Other assets 84 98 110
Cash and cash equivalents 214 403 259
Assets classified as held for sale 812 316 440
2,806 2,935 3,062
5,179 5,962 6,066
Equity and liabilities Equity
Equity attributable to shareholders of Bilfinger SE 1,412 1,938 1,905
Minority interest -29 -21 -16
1,383 1,917 1,889
Non-current liabilities
Provisions for pensions and similar obligations 394 524 507
Other provisions 46 55 58
Financial debt, recourse 512 516 517
Financial debt, non-recourse 13 13 13
Other liabilities 21 22 47
Deferred taxes 50 91 56
1,036 1,221 1,198
Current liabilities
Current tax liabilities 66 89 85
Other provisions 415 461 506
Financial debt, recourse 36 28 26
Financial debt, non-recourse 0 27 27
Trade and other payables 1,109 1,477 1,554
Other liabilities 281 370 324
Liabilities classified as held for sale 853 372 457
2,760 2,824 2,979
5,179 5,962 6,066
23
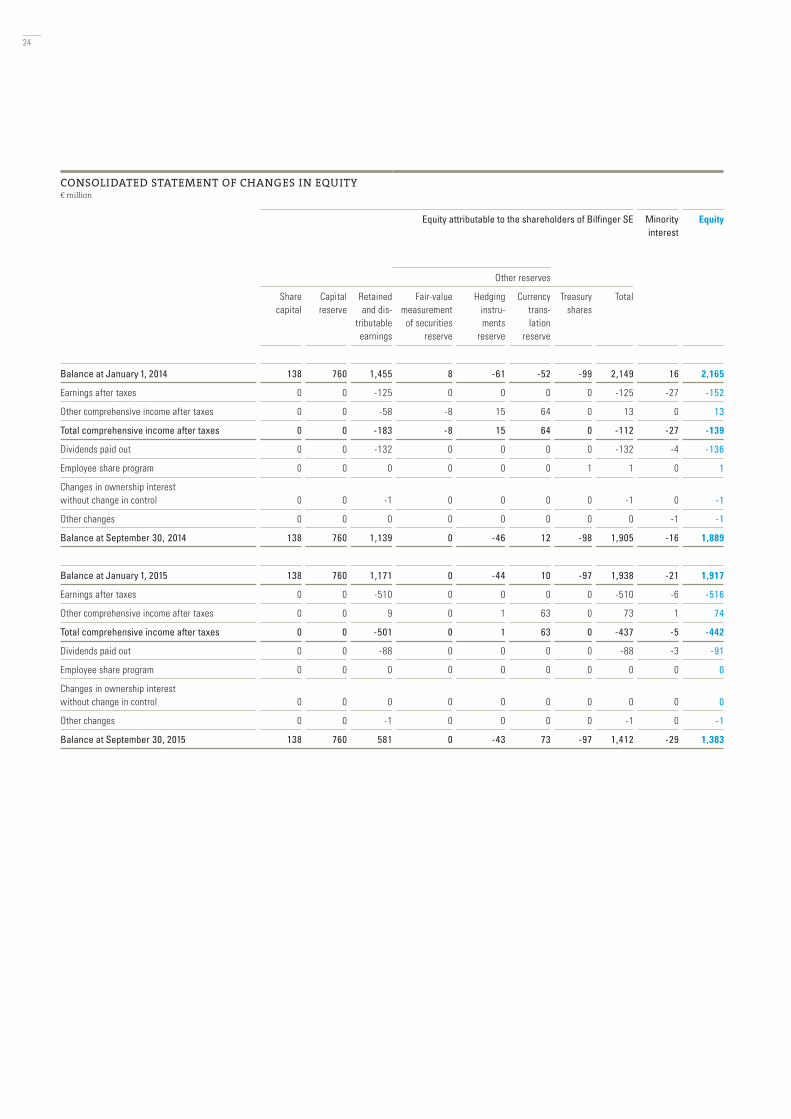
CONSOLIDATED STATEMENT OF CHANGES IN EQUITY€ million
Equity attributable to the shareholders of Bilfinger SE Minorityinterest
Equity
Other reserves
Sharecapital
Capital reserve
Retainedand dis-
tributableearnings
Fair-value measurement
of securitiesreserve
Hedginginstru-ments
reserve
Currencytrans-lation
reserve
Treasuryshares
Total
Balance at January 1, 2014 138 760 1,455 8 -61 -52 -99 2,149 16 2,165
Earnings after taxes 0 0 -125 0 0 0 0 -125 -27 -152
Other comprehensive income after taxes 0 0 -58 -8 15 64 0 13 0 13
Total comprehensive income after taxes 0 0 -183 -8 15 64 0 -112 -27 -139
Dividends paid out 0 0 -132 0 0 0 0 -132 -4 -136
Employee share program 0 0 0 0 0 0 1 1 0 1
Changes in ownership interest without change in control 0 0 -1 0 0 0 0 -1 0 -1
Other changes 0 0 0 0 0 0 0 0 -1 -1
Balance at September 30, 2014 138 760 1,139 0 -46 12 -98 1,905 -16 1,889
Balance at January 1, 2015 138 760 1,171 0 -44 10 -97 1,938 -21 1,917
Earnings after taxes 0 0 -510 0 0 0 0 -510 -6 -516
Other comprehensive income after taxes 0 0 9 0 1 63 0 73 1 74
Total comprehensive income after taxes 0 0 -501 0 1 63 0 -437 -5 -442
Dividends paid out 0 0 -88 0 0 0 0 -88 -3 -91
Employee share program 0 0 0 0 0 0 0 0 0 0
Changes in ownership interest without change in control 0 0 0 0 0 0 0 0 0 0
Other changes 0 0 -1 0 0 0 0 -1 0 -1
Balance at September 30, 2015 138 760 581 0 -43 73 -97 1,412 -29 1,383
24
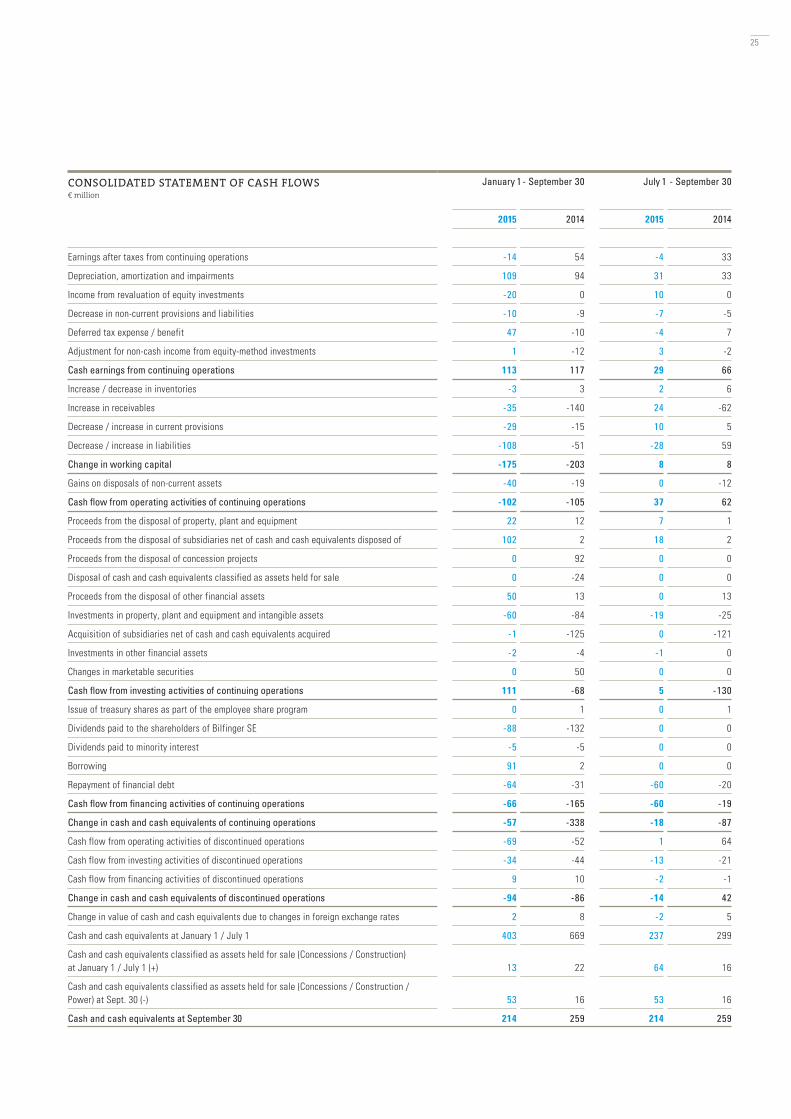
CONSOLIDATED STATEMENT OF CASH FLOWS€ million
January 1 - September 30 July 1 - September 30
2015 2014 2015 2014
Earnings after taxes from continuing operations -14 54 -4 33
Depreciation, amortization and impairments 109 94 31 33
Income from revaluation of equity investments -20 0 10 0
Decrease in non-current provisions and liabilities -10 -9 -7 -5
Deferred tax expense / benefit 47 -10 -4 7
Adjustment for non-cash income from equity-method investments 1 -12 3 -2
Cash earnings from continuing operations 113 117 29 66
Increase / decrease in inventories -3 3 2 6
Increase in receivables -35 -140 24 -62
Decrease / increase in current provisions -29 -15 10 5
Decrease / increase in liabilities -108 -51 -28 59
Change in working capital -175 -203 8 8
Gains on disposals of non-current assets -40 -19 0 -12
Cash flow from operating activities of continuing operations -102 -105 37 62
Proceeds from the disposal of property, plant and equipment 22 12 7 1
Proceeds from the disposal of subsidiaries net of cash and cash equivalents disposed of 102 2 18 2
Proceeds from the disposal of concession projects 0 92 0 0
Disposal of cash and cash equivalents classified as assets held for sale 0 -24 0 0
Proceeds from the disposal of other financial assets 50 13 0 13
Investments in property, plant and equipment and intangible assets -60 -84 -19 -25
Acquisition of subsidiaries net of cash and cash equivalents acquired -1 -125 0 -121
Investments in other financial assets -2 -4 -1 0
Changes in marketable securities 0 50 0 0
Cash flow from investing activities of continuing operations 111 -68 5 -130
Issue of treasury shares as part of the employee share program 0 1 0 1
Dividends paid to the shareholders of Bilfinger SE -88 -132 0 0
Dividends paid to minority interest -5 -5 0 0
Borrowing 91 2 0 0
Repayment of financial debt -64 -31 -60 -20
Cash flow from financing activities of continuing operations -66 -165 -60 -19
Change in cash and cash equivalents of continuing operations -57 -338 -18 -87
Cash flow from operating activities of discontinued operations -69 -52 1 64
Cash flow from investing activities of discontinued operations -34 -44 -13 -21
Cash flow from financing activities of discontinued operations 9 10 -2 -1
Change in cash and cash equivalents of discontinued operations -94 -86 -14 42
Change in value of cash and cash equivalents due to changes in foreign exchange rates 2 8 -2 5
Cash and cash equivalents at January 1 / July 1 403 669 237 299
Cash and cash equivalents classified as assets held for sale (Concessions / Construction) at January 1 / July 1 (+) 13 22 64 16
Cash and cash equivalents classified as assets held for sale (Concessions / Construction / Power) at Sept. 30 (-) 53 16 53 16
Cash and cash equivalents at September 30 214 259 214 259
25
Notes to the interim consolidated financial statements
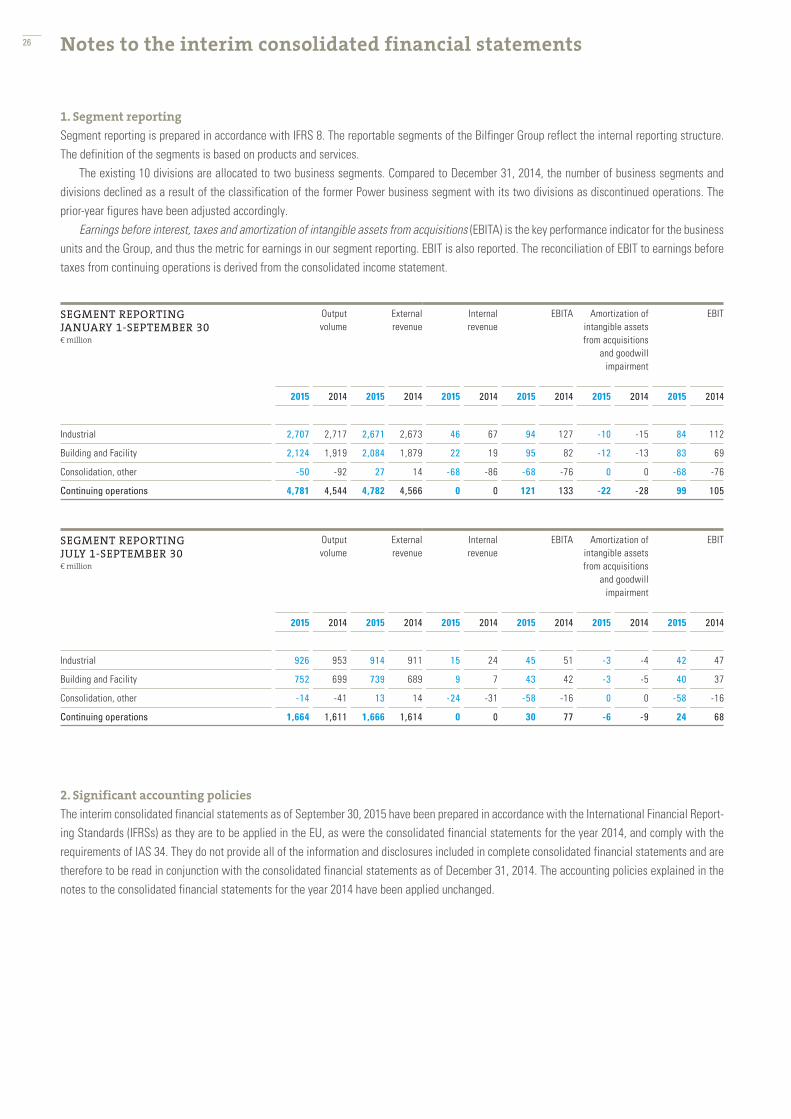
1. Segment reporting
Segment reporting is prepared in accordance with IFRS 8. The reportable segments of the Bilfinger Group reflect the internal reporting structure. The definition of the segments is based on products and services.
The existing 10 divisions are allocated to two business segments. Compared to December 31, 2014, the number of business segments and divisions declined as a result of the classification of the former Power business segment with its two divisions as discontinued operations. The prior-year figures have been adjusted accordingly.
Earnings before interest, taxes and amortization of intangible assets from acquisitions (EBITA) is the key performance indicator for the business units and the Group, and thus the metric for earnings in our segment reporting. EBIT is also reported. The reconciliation of EBIT to earnings before taxes from continuing operations is derived from the consolidated income statement.
2. Significant accounting policies
The interim consolidated financial statements as of September 30, 2015 have been prepared in accordance with the International Financial Report-ing Standards (IFRSs) as they are to be applied in the EU, as were the consolidated financial statements for the year 2014, and comply with the requirements of IAS 34. They do not provide all of the information and disclosures included in complete consolidated financial statements and are therefore to be read in conjunction with the consolidated financial statements as of December 31, 2014. The accounting policies explained in the notes to the consolidated financial statements for the year 2014 have been applied unchanged.
SEGMENT REPORTING JANUARY 1-SEPTEMBER 30€ million
Output volume
External revenue
Internal revenue
EBITA Amortization of intangible assets from acquisitions
and goodwill impairment
EBIT
2015 2014 2015 2014 2015 2014 2015 2014 2015 2014 2015 2014
Industrial 2,707 2,717 2,671 2,673 46 67 94 127 -10 -15 84 112
Building and Facility 2,124 1,919 2,084 1,879 22 19 95 82 -12 -13 83 69
Consolidation, other -50 -92 27 14 -68 -86 -68 -76 0 0 -68 -76
Continuing operations 4,781 4,544 4,782 4,566 0 0 121 133 -22 -28 99 105
SEGMENT REPORTING JULY 1-SEPTEMBER 30€ million
Output volume
External revenue
Internal revenue
EBITA Amortization of intangible assets from acquisitions
and goodwill impairment
EBIT
2015 2014 2015 2014 2015 2014 2015 2014 2015 2014 2015 2014
Industrial 926 953 914 911 15 24 45 51 -3 -4 42 47
Building and Facility 752 699 739 689 9 7 43 42 -3 -5 40 37
Consolidation, other -14 -41 13 14 -24 -31 -58 -16 0 0 -58 -16
Continuing operations 1,664 1,611 1,666 1,614 0 0 30 77 -6 -9 24 68
26
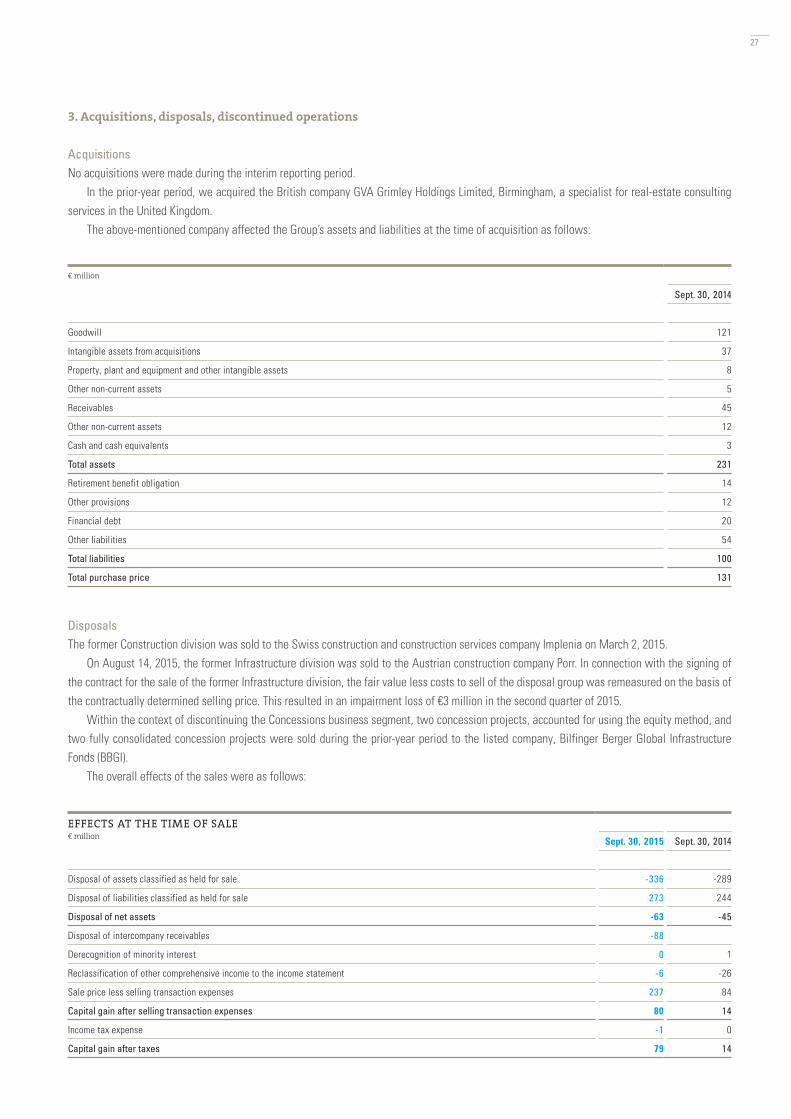
3. Acquisitions, disposals, discontinued operations
AcquisitionsNo acquisitions were made during the interim reporting period.
In the prior-year period, we acquired the British company GVA Grimley Holdings Limited, Birmingham, a specialist for real-estate consulting services in the United Kingdom.
The above-mentioned company affected the Group’s assets and liabilities at the time of acquisition as follows:
DisposalsThe former Construction division was sold to the Swiss construction and construction services company Implenia on March 2, 2015.
On August 14, 2015, the former Infrastructure division was sold to the Austrian construction company Porr. In connection with the signing of the contract for the sale of the former Infrastructure division, the fair value less costs to sell of the disposal group was remeasured on the basis of the contractually determined selling price. This resulted in an impairment loss of €3 million in the second quarter of 2015.
Within the context of discontinuing the Concessions business segment, two concession projects, accounted for using the equity method, and two fully consolidated concession projects were sold during the prior-year period to the listed company, Bilfinger Berger Global Infrastructure Fonds (BBGI).
The overall effects of the sales were as follows:
€ million
Sept. 30, 2014
Goodwill 121
Intangible assets from acquisitions 37
Property, plant and equipment and other intangible assets 8
Other non-current assets 5
Receivables 45
Other non-current assets 12
Cash and cash equivalents 3
Total assets 231
Retirement benefit obligation 14
Other provisions 12
Financial debt 20
Other liabilities 54
Total liabilities 100
Total purchase price 131
EFFECTS AT THE TIME OF SALE€ million Sept. 30, 2015 Sept. 30, 2014
Disposal of assets classified as held for sale -336 -289
Disposal of liabilities classified as held for sale 273 244
Disposal of net assets -63 -45
Disposal of intercompany receivables -88
Derecognition of minority interest 0 1
Reclassification of other comprehensive income to the income statement -6 -26
Sale price less selling transaction expenses 237 84
Capital gain after selling transaction expenses 80 14
Income tax expense -1 0
Capital gain after taxes 79 14
27
A risk provision in the amount of €67 million was made in the first quarter of 2015 for contractual guarantees and warranty obligations as well as follow-up costs and process risks from concluded projects retained in the context of selling the Construction activities.
Furthermore, the remaining investment of 30.3 percent in the publicly listed Julius Berger Nigeria plc, Abuja, as well as the investment of 10 percent in that company’s subsidiary Julius Berger International GmbH, Wiesbaden, were sold. As of June 30, 2015, the sale of 13.8 percent of the shares in Julius Berger Nigeria plc as well as all shares in Julius Berger International GmbH took effect; a net disposal gain of €28 million was realized from the completed sales transactions. A change of status occurred for the investment in Julius Berger Nigeria plc, which was previously accounted for using the equity method, because a significant influence no longer exists. The shares not transferred as of June 30, 2015 in the amount of 16.5 percent were classified as held for sale and were remeasured at fair value less costs to sell. This resulted in a gain of €30 million. Fair value was measured on the basis of the contractually determined selling price. Because fulfillment of the underlying purchase agreement is subject to uncertainties, the shares not yet transferred were measured through profit and loss as of the balance sheet date based on the stock exchange price. This resulted in an impairment of €10 million.
Discontinued operationsDiscontinued operations comprise
__ the disposed equity interests of the former Concessions business segment,__ the disposed activities of the former Construction division,__ the disposed former Infrastructure division,__ a significant portion of the former Offshore Systems and Grids division, put up for sale on December 16, 2014,__ the former Power business segment, put up for sale on June 17, 2015, as well as__ abandoned construction activities.
The former Construction division put up for sale was sold to the Swiss construction and construction services company Implenia on March 2, 2015.The former Infrastructure division put up for sale was sold to the Austrian construction company Porr on August 14, 2015.
In accordance with the provisions of IFRS 5, the investments put up for sale were presented as discontinued operations as of the time of reclassification:
__ In the consolidated balance sheet the affected assets and liabilities (disposal group) are presented separately under Assets classified as held for sale and Liabilities classified as held for sale.
__ In the consolidated income statement, the income and expenses of discontinued operations are presented separately from the income and expenses of continuing operations, and are summarized separately in one item as earnings after taxes from discontinued operations.
__ In the consolidated statement of cash flows, cash flows from discontinued operations are also presented separately from the cash flows from continuing operations.
28
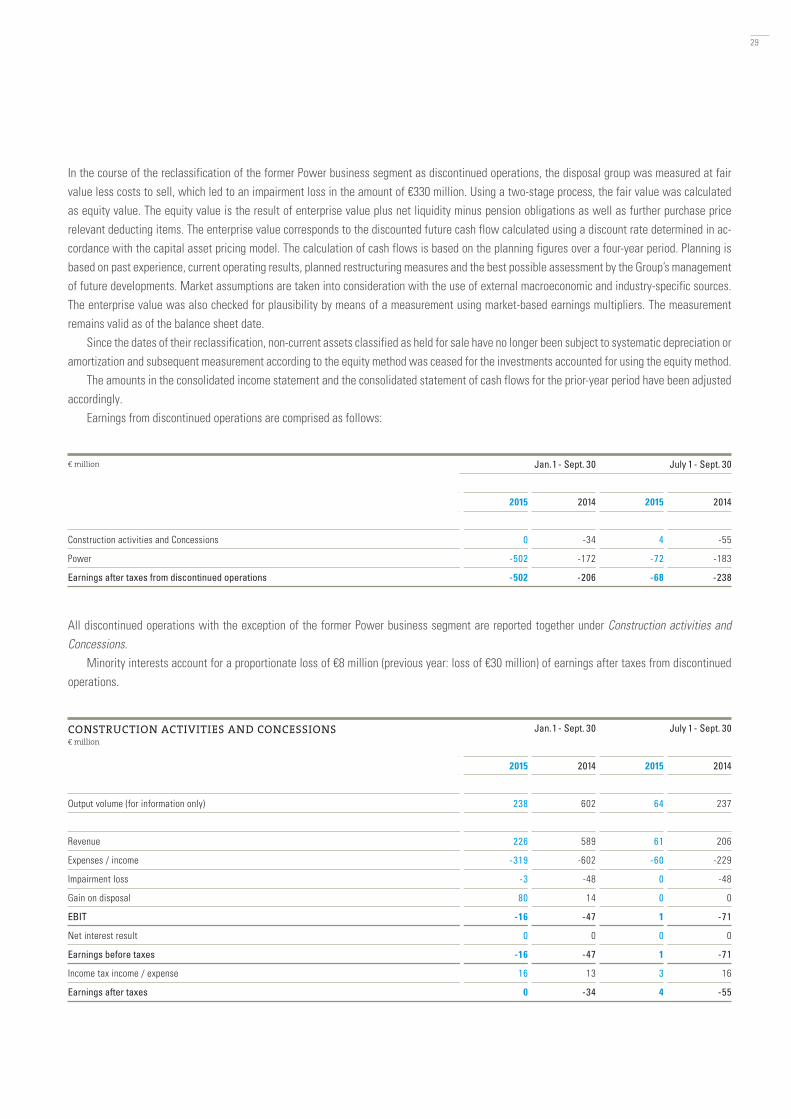
In the course of the reclassification of the former Power business segment as discontinued operations, the disposal group was measured at fair value less costs to sell, which led to an impairment loss in the amount of €330 million. Using a two-stage process, the fair value was calculated as equity value. The equity value is the result of enterprise value plus net liquidity minus pension obligations as well as further purchase price relevant deducting items. The enterprise value corresponds to the discounted future cash flow calculated using a discount rate determined in ac-cordance with the capital asset pricing model. The calculation of cash flows is based on the planning figures over a four-year period. Planning is based on past experience, current operating results, planned restructuring measures and the best possible assessment by the Group’s management of future developments. Market assumptions are taken into consideration with the use of external macroeconomic and industry-specific sources. The enterprise value was also checked for plausibility by means of a measurement using market-based earnings multipliers. The measurement remains valid as of the balance sheet date.
Since the dates of their reclassification, non-current assets classified as held for sale have no longer been subject to systematic depreciation or amortization and subsequent measurement according to the equity method was ceased for the investments accounted for using the equity method.
The amounts in the consolidated income statement and the consolidated statement of cash flows for the prior-year period have been adjusted accordingly.
Earnings from discontinued operations are comprised as follows:
All discontinued operations with the exception of the former Power business segment are reported together under Construction activities and Concessions.
Minority interests account for a proportionate loss of €8 million (previous year: loss of €30 million) of earnings after taxes from discontinued operations.
€ million Jan. 1 - Sept. 30 July 1 - Sept. 30
2015 2014 2015 2014
Construction activities and Concessions 0 -34 4 -55
Power -502 -172 -72 -183
Earnings after taxes from discontinued operations -502 -206 -68 -238
CONSTRUCTION ACTIVITIES AND CONCESSIONS€ million
Jan. 1 - Sept. 30 July 1 - Sept. 30
2015 2014 2015 2014
Output volume (for information only) 238 602 64 237
Revenue 226 589 61 206
Expenses / income -319 -602 -60 -229
Impairment loss -3 -48 0 -48
Gain on disposal 80 14 0 0
EBIT -16 -47 1 -71
Net interest result 0 0 0 0
Earnings before taxes -16 -47 1 -71
Income tax income / expense 16 13 3 16
Earnings after taxes 0 -34 4 -55
29
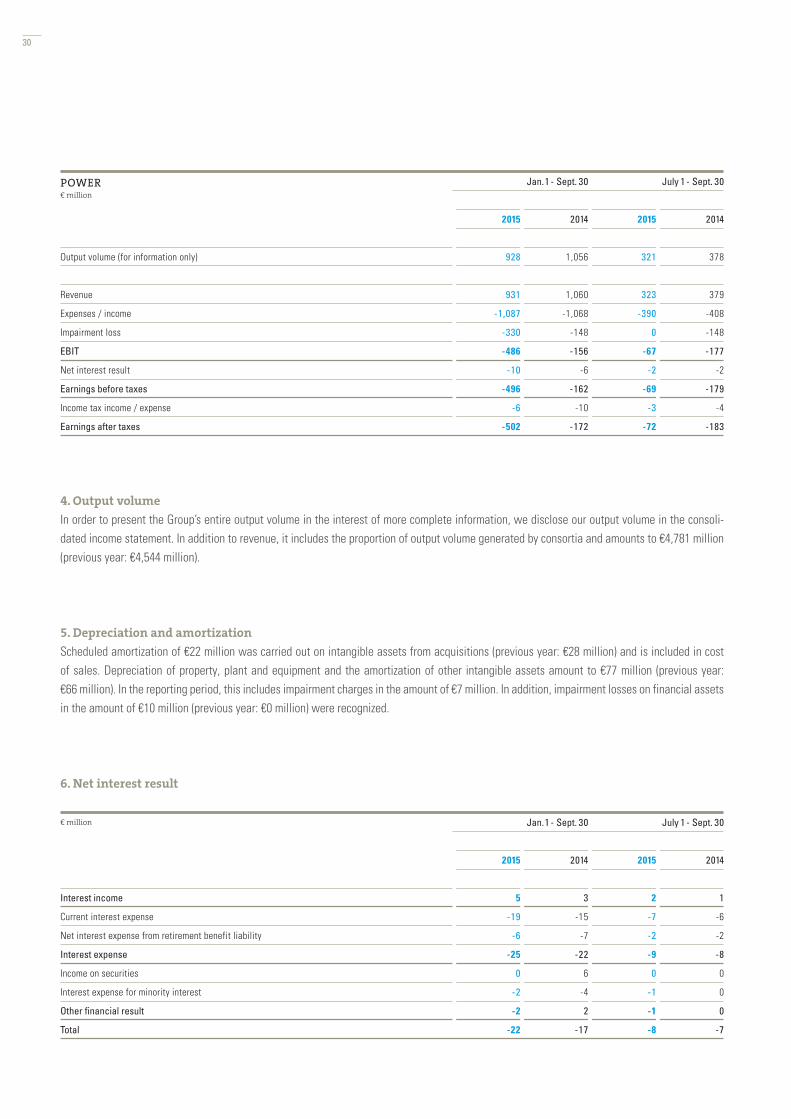
4. Output volume
In order to present the Group’s entire output volume in the interest of more complete information, we disclose our output volume in the consoli-dated income statement. In addition to revenue, it includes the proportion of output volume generated by consortia and amounts to €4,781 million (previous year: €4,544 million).
5. Depreciation and amortization
Scheduled amortization of €22 million was carried out on intangible assets from acquisitions (previous year: €28 million) and is included in cost of sales. Depreciation of property, plant and equipment and the amortization of other intangible assets amount to €77 million (previous year: €66 million). In the reporting period, this includes impairment charges in the amount of €7 million. In addition, impairment losses on financial assets in the amount of €10 million (previous year: €0 million) were recognized.
6. Net interest result
€ million Jan. 1 - Sept. 30 July 1 - Sept. 30
2015 2014 2015 2014
Interest income 5 3 2 1
Current interest expense -19 -15 -7 -6
Net interest expense from retirement benefit liability -6 -7 -2 -2
Interest expense -25 -22 -9 -8
Income on securities 0 6 0 0
Interest expense for minority interest -2 -4 -1 0
Other financial result -2 2 -1 0
Total -22 -17 -8 -7
POWER€ million
Jan. 1 - Sept. 30 July 1 - Sept. 30
2015 2014 2015 2014
Output volume (for information only) 928 1,056 321 378
Revenue 931 1,060 323 379
Expenses / income -1,087 -1,068 -390 -408
Impairment loss -330 -148 0 -148
EBIT -486 -156 -67 -177
Net interest result -10 -6 -2 -2
Earnings before taxes -496 -162 -69 -179
Income tax income / expense -6 -10 -3 -4
Earnings after taxes -502 -172 -72 -183
30
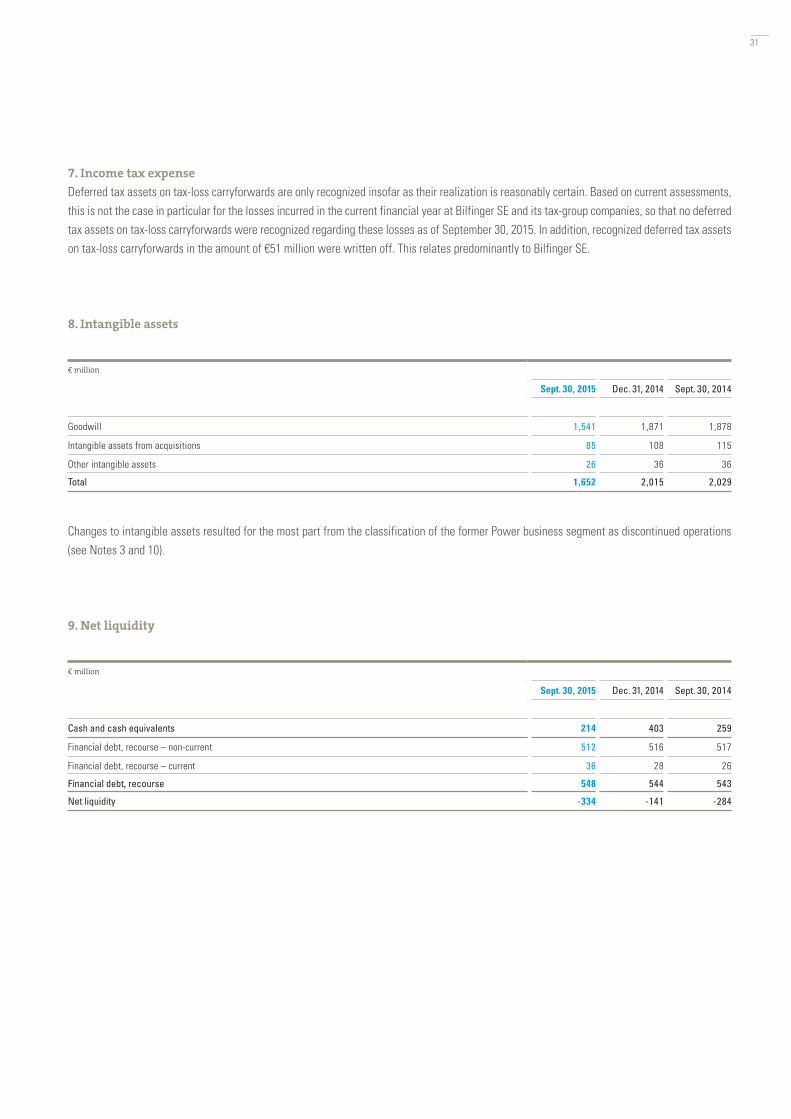
7. Income tax expense
Deferred tax assets on tax-loss carryforwards are only recognized insofar as their realization is reasonably certain. Based on current assessments, this is not the case in particular for the losses incurred in the current financial year at Bilfinger SE and its tax-group companies, so that no deferred tax assets on tax-loss carryforwards were recognized regarding these losses as of September 30, 2015. In addition, recognized deferred tax assets on tax-loss carryforwards in the amount of €51 million were written off. This relates predominantly to Bilfinger SE.
8. Intangible assets
Changes to intangible assets resulted for the most part from the classification of the former Power business segment as discontinued operations (see Notes 3 and 10).
9. Net liquidity
€ million
Sept. 30, 2015 Dec. 31, 2014 Sept. 30, 2014
Goodwill 1,541 1,871 1,878
Intangible assets from acquisitions 85 108 115
Other intangible assets 26 36 36
Total 1,652 2,015 2,029
€ million
Sept. 30, 2015 Dec. 31, 2014 Sept. 30, 2014
Cash and cash equivalents 214 403 259
Financial debt, recourse – non-current 512 516 517
Financial debt, recourse – current 36 28 26
Financial debt, recourse 548 544 543
Net liquidity -334 -141 -284
31
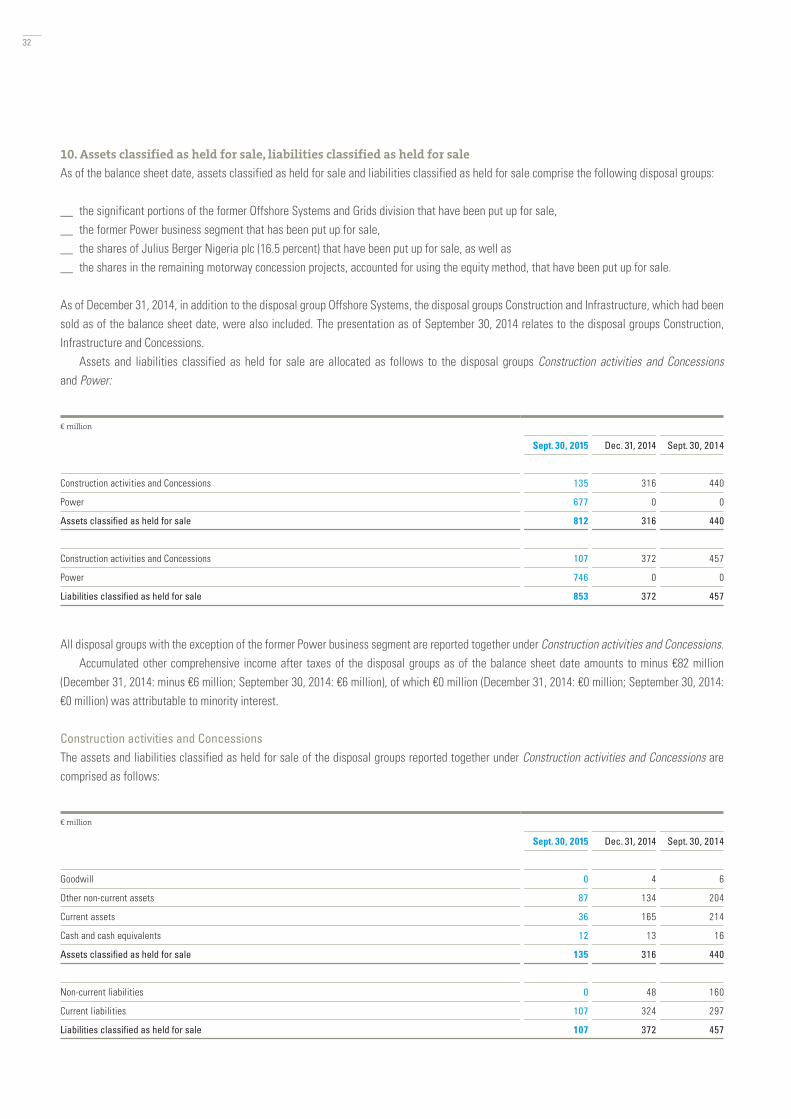
10. Assets classified as held for sale, liabilities classified as held for sale
As of the balance sheet date, assets classified as held for sale and liabilities classified as held for sale comprise the following disposal groups:
__ the significant portions of the former Offshore Systems and Grids division that have been put up for sale,__ the former Power business segment that has been put up for sale, __ the shares of Julius Berger Nigeria plc (16.5 percent) that have been put up for sale, as well as__ the shares in the remaining motorway concession projects, accounted for using the equity method, that have been put up for sale.
As of December 31, 2014, in addition to the disposal group Offshore Systems, the disposal groups Construction and Infrastructure, which had been sold as of the balance sheet date, were also included. The presentation as of September 30, 2014 relates to the disposal groups Construction, Infrastructure and Concessions.
Assets and liabilities classified as held for sale are allocated as follows to the disposal groups Construction activities and Concessions and Power:
All disposal groups with the exception of the former Power business segment are reported together under Construction activities and Concessions.Accumulated other comprehensive income after taxes of the disposal groups as of the balance sheet date amounts to minus €82 million
(December 31, 2014: minus €6 million; September 30, 2014: €6 million), of which €0 million (December 31, 2014: €0 million; September 30, 2014: €0 million) was attributable to minority interest.
Construction activities and ConcessionsThe assets and liabilities classified as held for sale of the disposal groups reported together under Construction activities and Concessions are comprised as follows:
€ million
Sept. 30, 2015 Dec. 31, 2014 Sept. 30, 2014
Goodwill 0 4 6
Other non-current assets 87 134 204
Current assets 36 165 214
Cash and cash equivalents 12 13 16
Assets classified as held for sale 135 316 440
Non-current liabilities 0 48 160
Current liabilities 107 324 297
Liabilities classified as held for sale 107 372 457
€ million
Sept. 30, 2015 Dec. 31, 2014 Sept. 30, 2014
Construction activities and Concessions 135 316 440
Power 677 0 0
Assets classified as held for sale 812 316 440
Construction activities and Concessions 107 372 457
Power 746 0 0
Liabilities classified as held for sale 853 372 457
32
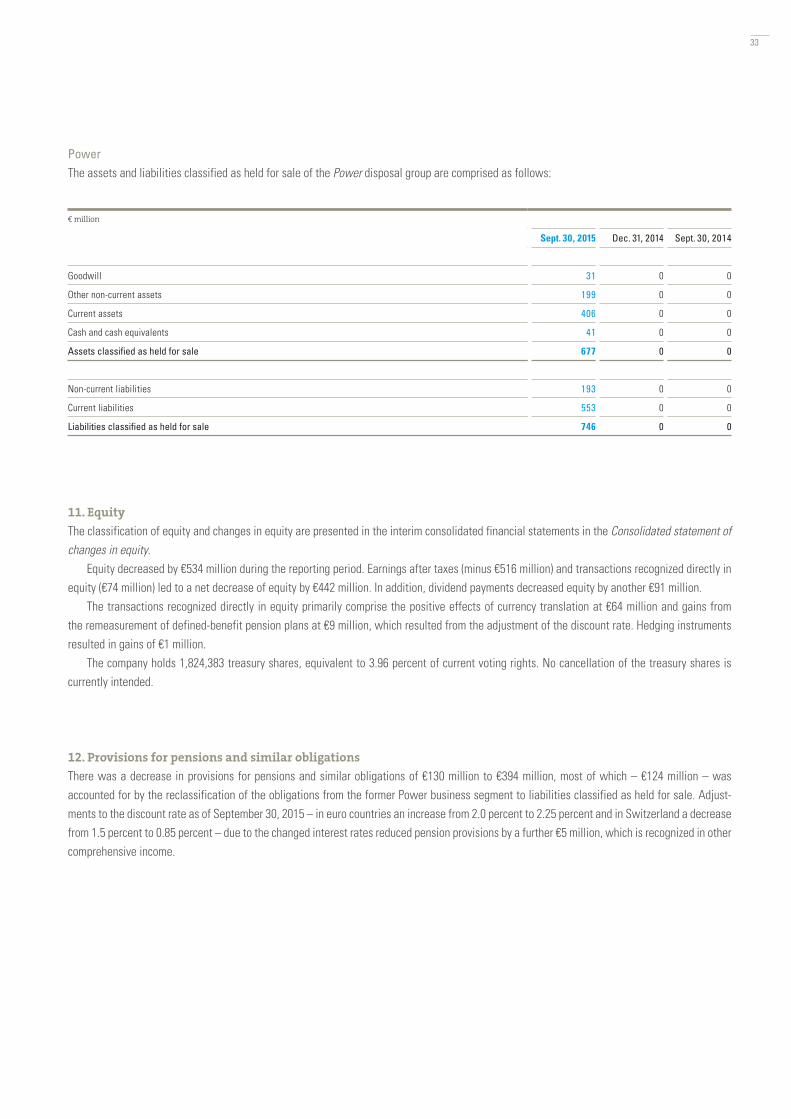
PowerThe assets and liabilities classified as held for sale of the Power disposal group are comprised as follows:
11. Equity
The classification of equity and changes in equity are presented in the interim consolidated financial statements in the Consolidated statement of changes in equity.
Equity decreased by €534 million during the reporting period. Earnings after taxes (minus €516 million) and transactions recognized directly in equity (€74 million) led to a net decrease of equity by €442 million. In addition, dividend payments decreased equity by another €91 million.
The transactions recognized directly in equity primarily comprise the positive effects of currency translation at €64 million and gains from the remeasurement of defined-benefit pension plans at €9 million, which resulted from the adjustment of the discount rate. Hedging instruments resulted in gains of €1 million.
The company holds 1,824,383 treasury shares, equivalent to 3.96 percent of current voting rights. No cancellation of the treasury shares is currently intended.
12. Provisions for pensions and similar obligations
There was a decrease in provisions for pensions and similar obligations of €130 million to €394 million, most of which – €124 million – was accounted for by the reclassification of the obligations from the former Power business segment to liabilities classified as held for sale. Adjust-ments to the discount rate as of September 30, 2015 – in euro countries an increase from 2.0 percent to 2.25 percent and in Switzerland a decrease from 1.5 percent to 0.85 percent – due to the changed interest rates reduced pension provisions by a further €5 million, which is recognized in other comprehensive income.
€ million
Sept. 30, 2015 Dec. 31, 2014 Sept. 30, 2014
Goodwill 31 0 0
Other non-current assets 199 0 0
Current assets 406 0 0
Cash and cash equivalents 41 0 0
Assets classified as held for sale 677 0 0
Non-current liabilities 193 0 0
Current liabilities 553 0 0
Liabilities classified as held for sale 746 0 0
33
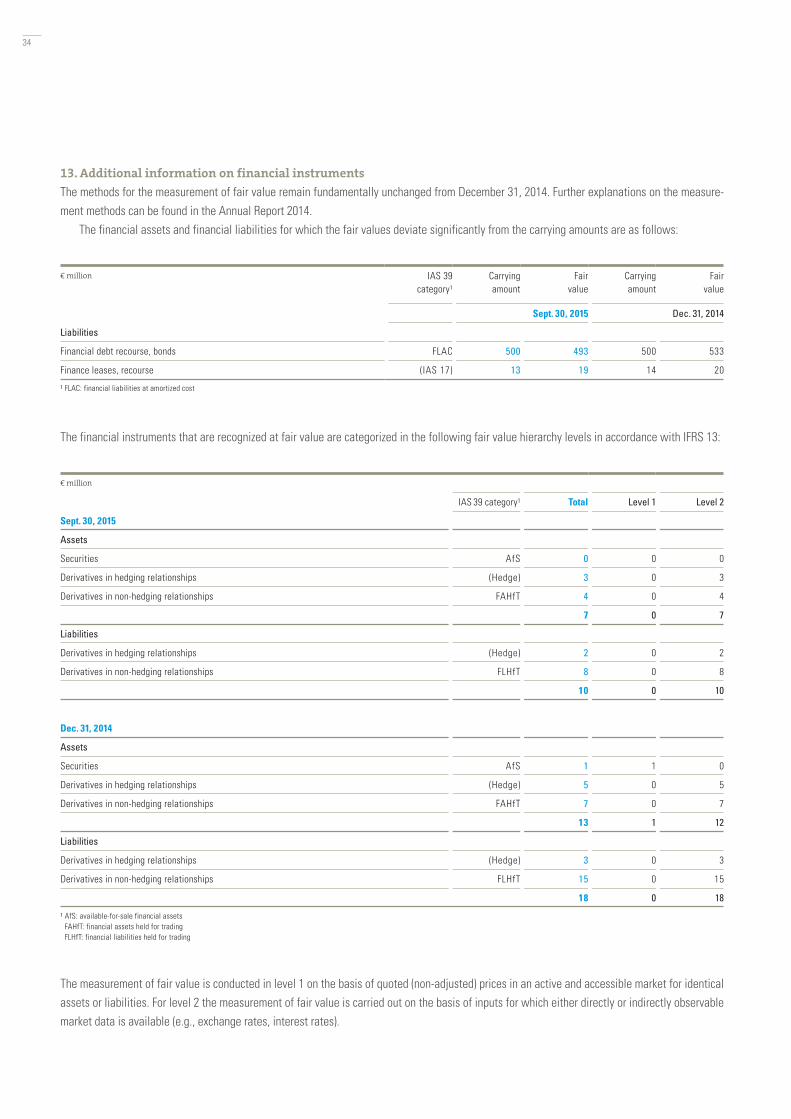
13. Additional information on financial instruments
The methods for the measurement of fair value remain fundamentally unchanged from December 31, 2014. Further explanations on the measure-ment methods can be found in the Annual Report 2014.
The financial assets and financial liabilities for which the fair values deviate significantly from the carrying amounts are as follows:
The financial instruments that are recognized at fair value are categorized in the following fair value hierarchy levels in accordance with IFRS 13:
The measurement of fair value is conducted in level 1 on the basis of quoted (non-adjusted) prices in an active and accessible market for identical assets or liabilities. For level 2 the measurement of fair value is carried out on the basis of inputs for which either directly or indirectly observable market data is available (e.g., exchange rates, interest rates).
€ million
IAS 39 category¹ Total Level 1 Level 2
Sept. 30, 2015
Assets
Securities AfS 0 0 0
Derivatives in hedging relationships (Hedge) 3 0 3
Derivatives in non-hedging relationships FAHfT 4 0 4
7 0 7
Liabilities
Derivatives in hedging relationships (Hedge) 2 0 2
Derivatives in non-hedging relationships FLHfT 8 0 8
10 0 10
Dec. 31, 2014
Assets
Securities AfS 1 1 0
Derivatives in hedging relationships (Hedge) 5 0 5
Derivatives in non-hedging relationships FAHfT 7 0 7
13 1 12
Liabilities
Derivatives in hedging relationships (Hedge) 3 0 3
Derivatives in non-hedging relationships FLHfT 15 0 15
18 0 18 1 AfS: available-for-sale financial assets FAHfT: financial assets held for trading FLHfT: financial liabilities held for trading
€ million IAS 39 category¹
Carrying amount
Fair value
Carrying amount
Fair value
Sept. 30, 2015 Dec. 31, 2014
Liabilities
Financial debt recourse, bonds FLAC 500 493 500 533
Finance leases, recourse (IAS 17) 13 19 14 20
1 FLAC: financial liabilities at amortized cost
34
14. Related-party disclosures
Most of the transactions between fully consolidated companies of the Group and related companies or persons involve associates and joint ventures.
15. Contingent liabilities
Contingent liabilities of €53 million (December 31, 2014: €25 million) generally relate to guarantees provided for former Group companies that were sold and companies in which Bilfinger holds a minority interest. In addition, we are jointly and severally liable as partners in companies constituted under the German Civil Code and in connection with consortia and joint ventures.
16. Events after the balance sheet date
After the balance sheet date, a longstanding legal dispute with a subcontractor for a former construction project in Qatar was settled amicably out of court. As of the balance sheet date, a sufficient risk provision was in place. No further events have occurred after the balance sheet date that are of particular significance for the Group’s profitability, cash flows or financial position. Our business and economic environment has not changed significantly.
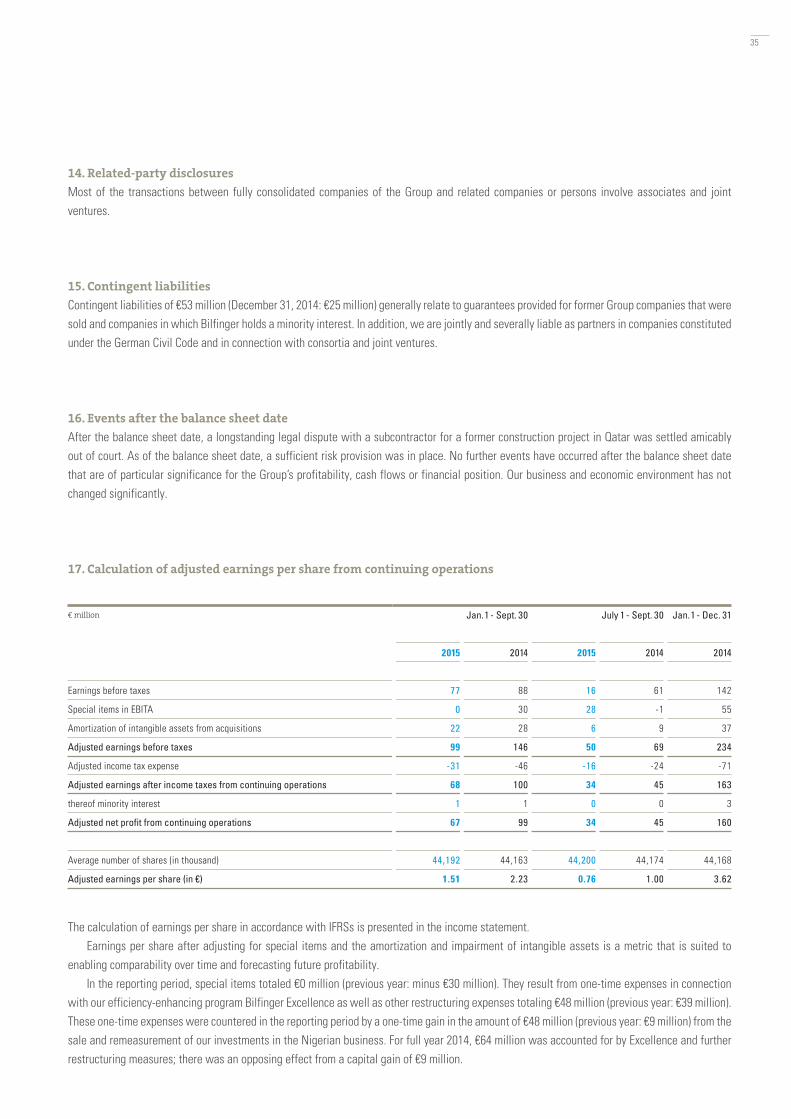
17. Calculation of adjusted earnings per share from continuing operations
The calculation of earnings per share in accordance with IFRSs is presented in the income statement.Earnings per share after adjusting for special items and the amortization and impairment of intangible assets is a metric that is suited to
enabling comparability over time and forecasting future profitability.In the reporting period, special items totaled €0 million (previous year: minus €30 million). They result from one-time expenses in connection
with our efficiency-enhancing program Bilfinger Excellence as well as other restructuring expenses totaling €48 million (previous year: €39 million). These one-time expenses were countered in the reporting period by a one-time gain in the amount of €48 million (previous year: €9 million) from the sale and remeasurement of our investments in the Nigerian business. For full year 2014, €64 million was accounted for by Excellence and further restructuring measures; there was an opposing effect from a capital gain of €9 million.
€ million Jan. 1 - Sept. 30 July 1 - Sept. 30 Jan. 1 - Dec. 31
2015 2014 2015 2014 2014
Earnings before taxes 77 88 16 61 142
Special items in EBITA 0 30 28 -1 55
Amortization of intangible assets from acquisitions 22 28 6 9 37
Adjusted earnings before taxes 99 146 50 69 234
Adjusted income tax expense -31 -46 -16 -24 -71
Adjusted earnings after income taxes from continuing operations 68 100 34 45 163
thereof minority interest 1 1 0 0 3
Adjusted net profit from continuing operations 67 99 34 45 160
Average number of shares (in thousand) 44,192 44,163 44,200 44,174 44,168
Adjusted earnings per share (in €) 1.51 2.23 0.76 1.00 3.62
35
Amortization of intangible assets from acquisitions and goodwill impairment totaling €22 million (previous year: €28 million) relates to the amorti-zation of intangible assets resulting from purchase-price allocation following acquisitions and is therefore of a temporary nature.
The adjusted income taxes are calculated on the basis of a normalized tax rate of 31 percent. The deviation to the income taxes presented in the income statement is the result of the adjustment of tax effects from the special items in EBITA and the amortization of intangible assets from acqui-sitions. Also in the reporting period, effects from not recognizing deferred taxes on losses incurred in the reporting period and from the write-down of previously recognized deferred tax assets on tax-loss carryforwards of Bilfinger SE in particular were adjusted and, for the prior-year period as well as for full year 2014, the reduction of recognized tax-loss carryforwards pursuant to Section 8c of the German Corporate Income Tax Act (KStG).
Adjusted earnings is a metric that is not defined under IFRSs. Its disclosure is to be regarded as supplementary information.
Mannheim, November 9, 2015
Bilfinger SEThe Executive Board
Disclaimer___
All statements made in this report that relate to the future have been made in good faith and based on the best knowledge available. How-ever, as those statements also depend on factors beyond our control, actual developments may differ from our forecasts.
Dr. Jochen KeysbergMichael Bernhardt
Per H. Utnegaard Axel Salzmann
36
We have reviewed the interim condensed consolidated financial statements, comprising the income statement, the statement of comprehensive income, the balance sheet, the statement of changes in equity, the statement of cash flows and notes, and the interim group management report of Bilfinger SE, Mannheim, for the period from January 1 to September 30, 2015, which are part of the quarterly financial report pursuant to Sec. 37x (3) WpHG [“Wertpapierhandelsgesetz”: German Securities Trading Act]. The preparation of the interim condensed consolidated financial statements in accordance with IFRSs [International Financial Reporting Standards] on interim financial reporting as adopted by the EU and of the group management report in accordance with the requirements of the WpHG applicable to interim group management reports is the responsibility of the Company’s management. Our responsibility is to issue a report on the interim condensed consolidated financial statements and the interim group management report based on our review.
We conducted our review of the interim condensed consolidated financial statements and the interim group management report in accordance with German generally accepted standards for the review of financial statements promulgated by the Institut der Wirtschaftsprüfer [Institute of Public Auditors in Germany] (IDW). Those standards require that we plan and perform the review to obtain a certain level of assurance in our critical appraisal to preclude that the interim condensed consolidated financial statements are not prepared, in all material respects, in accordance with IFRSs on interim financial reporting as adopted by the EU and that the interim group management report is not prepared, in all material respects, in accordance with the provisions of the WpHG applicable to interim group management reports. A review is limited primarily to making inquiries of company personnel and applying analytical procedures and thus does not provide the assurance that we would obtain from an audit of financial statements. In accordance with our engagement, we have not performed an audit and, accordingly, we do not express an audit opinion.
Based on our review, nothing has come to our attention that causes us to believe that the interim condensed consolidated financial statements are not prepared, in all material respects, in accordance with IFRSs on interim financial reporting as adopted by the EU or that the interim group management report is not prepared, in all material respects, in accordance with the provisions of the WpHG applicable to interim group manage-ment reports.
Mannheim, November 9, 2015
Ernst & Young GmbH Wirtschaftsprüfungsgesellschaft
Review Report
Prof. Dr. Peter WollmertWirtschaftsprüfer[German Public Auditor]
Karen SomesWirtschaftsprüferin[German Public Auditor]
37
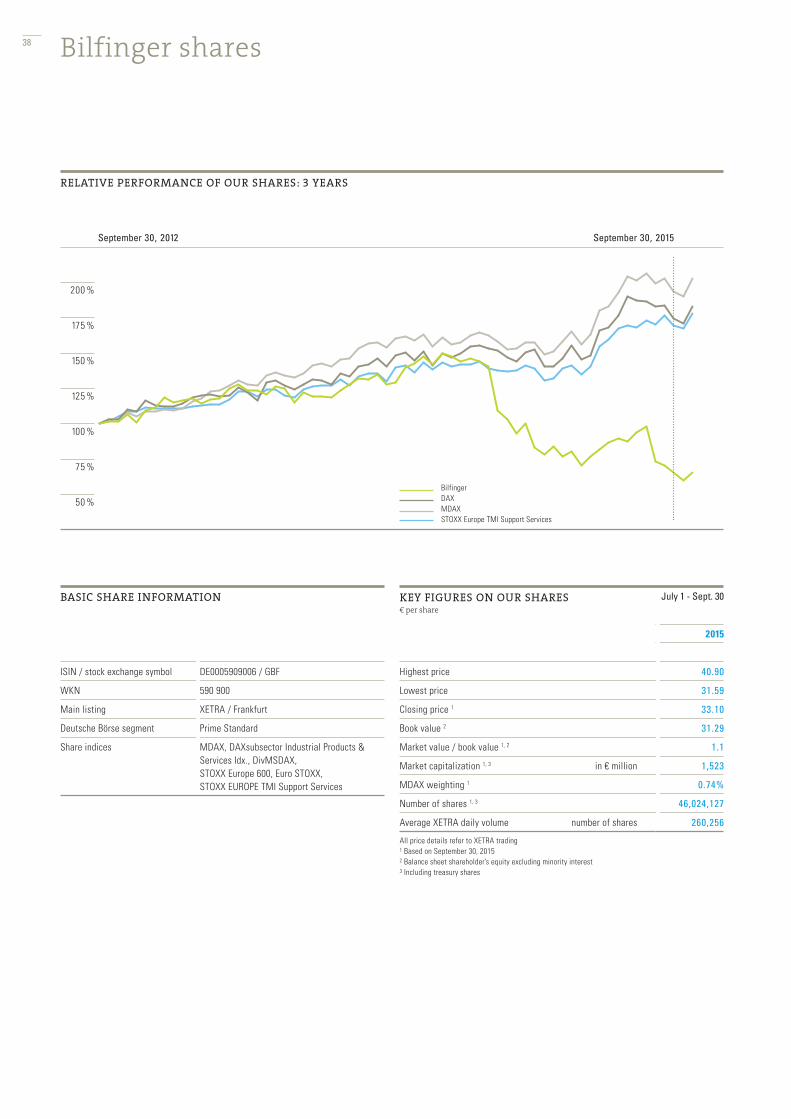
Bilfinger shares
BASIC SHARE INFORMATION
ISIN / stock exchange symbol DE0005909006 / GBF
WKN 590 900
Main listing XETRA / Frankfurt
Deutsche Börse segment Prime Standard
Share indices MDAX, DAXsubsector Industrial Products & Services Idx., DivMSDAX, STOXX Europe 600, Euro STOXX, STOXX EUROPE TMI Support Services
KEY FIGURES ON OUR SHARES€ per share
July 1 - Sept. 30
2015
Highest price 40.90
Lowest price 31.59
Closing price 1 33.10
Book value 2 31.29
Market value / book value 1, 2 1.1
Market capitalization 1, 3 in € million 1,523
MDAX weighting 1 0.74%
Number of shares 1, 3 46,024,127
Average XETRA daily volume number of shares 260,256
All price details refer to XETRA trading1 Based on September 30, 20152 Balance sheet shareholder’s equity excluding minority interest3 Including treasury shares
RELATIVE PERFORMANCE OF OUR SHARES: 3 YEARS
200 %
175 %
150 %
125 %
100 %
75 %
50 %
September 30, 2015September 30, 2012
BilfingerDAXMDAXSTOXX Europe TMI Support Services
38
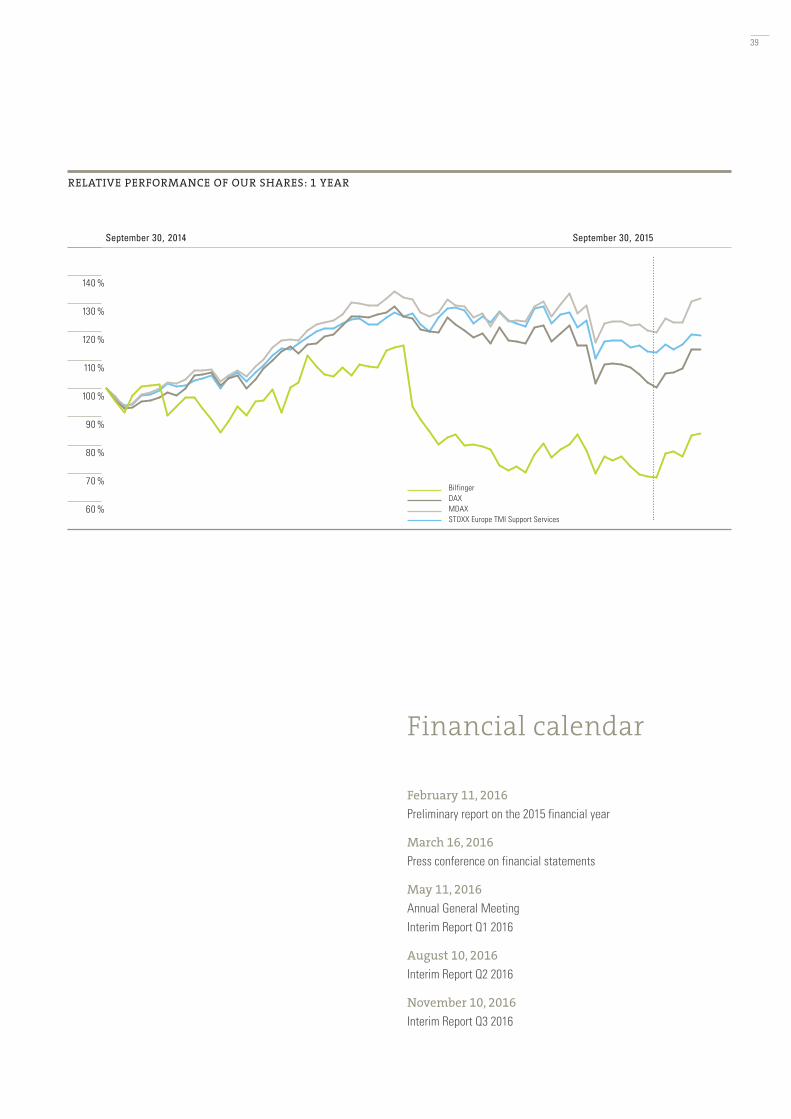
140 %
130 %
120 %
110 %
100 %
90 %
80 %
70 %
60 %
BilfingerDAXMDAXSTOXX Europe TMI Support Services
September 30, 2015September 30, 2014
RELATIVE PERFORMANCE OF OUR SHARES: 1 YEAR
Financial calendar
February 11, 2016Preliminary report on the 2015 financial year
March 16, 2016Press conference on financial statements
May 11, 2016Annual General MeetingInterim Report Q1 2016
August 10, 2016Interim Report Q2 2016
November 10, 2016Interim Report Q3 2016
39

carbon neutralnatureOffice.com | DE-134-806255
print production
Investor RelationsAndreas MüllerPhone +49-621-459-2312 Fax +49-621-459-2761E-mail: [email protected]
Corporate CommunicationsMartin BüllesbachPhone +49-621-459-2475Fax +49-621-459-2500E-mail: [email protected]
HeadquartersCarl-Reiß-Platz 1-568165 Mannheim, GermanyPhone +49-621-459-0Fax +49-621-459-2366
You will find the addresses of our branches and affiliates in Germany and abroad in the Internet atwww.bilfinger.com
© 2015 Bilfinger SE
Date of publicationNovember 12, 2015