Embed Size (px)
Citation preview
INTERIM RESULTS FOR THE PERIOD ENDED JUNE 30, 2011
Highlights
Golar LNG reports consolidated operating income of $21.3 million for the second quarter of 2011
and a net loss of $0.6 million after interest rate swap valuation losses of $5.7 million
Golar LNG increases its cash dividend to $0.275 cents per share
Golar’s total order book increased to 8 LNG carriers and 1 newbuild FSRU
Significant improvement in TCE rates for the quarter due to all modern vessels on charter
Golar reports weak results from trading operation and will reduce this activity
Spot and short-term LNG shipping market continue to improve
Successful acquisition of 100% of Golar LNG Energy Limited shares through transactions
involving raising $352 million in new Golar LNG equity
Financial Review
Golar LNG Limited (“Golar” or the “Company”) reports consolidated net loss of $0.6 million and
consolidated operating income of $21.3 million for the three months ended June 30, 2011 (the
“second quarter”).
Revenues in the second quarter were $74.0 million as compared to $67.5 million for the first quarter
of 2011 (the “first quarter”). The improvement reflects the fact that the Company’s four modern
vessels were all fully employed during the quarter at improved rates, partly offset by the effect of
Golar Maria being in drydock. These vessels will now continue under their current charters through
the balance of 2011 until the charters cease during 2012. Vessel utilization for the second quarter
increased to 97% as compared to 91% for the first quarter. Average daily time charter equivalent
rates (“TCEs”) for the second quarter increased to $91,666 from $80,694 in the first quarter as a
result of improved utilisation.
Voyage expenses decreased during the second quarter to $0.8 million as compared to $3.8 million in
the first quarter. Vessel operating expenses were however higher at $16.2 million for the second
quarter compared to $14.0 million for the first quarter, mainly due to the reactivation costs incurred
for the Gimi prior to the vessel entering the charter market. Operating costs have also increased
though as a function of the US dollar weakening against the Euro and thereby increasing the cost of
crew remunerated in Euro’s.
The total loss for Golar Commodities in the second quarter amounts to $11.7 million, of which $2.5
million is included in administrative expenses, $0.5 million in financial expenses and $0.1 million in
depreciation. The remaining $8.7 million represents trading losses, inclusive of unrealised mark-to-
market valuation losses, as at the end of the quarter. All trades entered into to date have now been
delivered and a gain of approximately $5.0 million is expected to be recognised so far in the third
quarter.
Net interest expense for the second quarter at $6.7 million is slightly down from $6.9 million in the
first quarter due to a slight reduction in LIBOR.
Other financial items have increased to a loss of $9.0 million for the second quarter from a small loss
in the first quarter. The increase is largely a result of increased losses on the mark-to-market
valuation of interest rate swaps of $5.7 million due to the reduction in longer term interest rates. The
Company will however, due to its floating interest rate exposure show improved long term results as
a function of the lower interest.
The Company reports operating revenues of $141.4 million, operating income of $41.8 million and a
net income of $16.4 million for the six months ended June 30, 2011. This compares to operating
revenues of $109.0 million, operating income of $23.7 million and a net loss of $8.5 million for the
six months ended June 30, 2010.
Financing, corporate and other matters
Dividends
The Board has decided to increase the quarterly dividend to $0.275 per share. The increase is a
reflection of the solid improvement in the LNG shipping market over the last nine months. The Board
has also taken account of the Company’s large capital spend obligations when evaluating this
increase in dividend. The record date for the dividend is September 13, 2011, ex-dividend date is
September 9, 2011 and the dividend will be paid on or about September 27, 2011.
Acquisition of Golar LNG Energy (“Golar Energy”)
As previously announced, the company increased its ownership of Golar Energy during the quarter
from 61.1% to 99.6%. On June 3, 2011 a compulsory offer was made to acquire the remaining 0.4%
resulting in the delisting of Golar Energy from Oslo Axess on July 4, 2011. Of the 92,333,112 Golar
Energy shares acquired 70,315,792, were exchanged for newly issued Golar LNG shares where the
seller received one newly-issued Golar LNG share for every 6.06 Golar Energy shares, increasing the
Company’s share capital by 11,603,253. The new Golar LNG shares were effectively issued for
$30.30 per share and the total amount of new equity was correspondingly $352 million. The
remaining Golar Energy shares were acquired at a price of approximately $5 per share.
Golar LNG Partners LP ("Golar Partners")
As previously announced, in April 2011, the Company completed a public offering of 13.8 million
common units (including 1.8 million units issued in respect of an over-allotment option) of its
subsidiary, Golar Partners, which is listed on the NASDAQ stock exchange under the symbol
"GMLP". As a result of the offering the Company’s ownership of Golar Partners was reduced to
approximately 65%. Golar Partners owns and operates a fleet of two LNG carriers and two FSRUs
each under long-term charters. The 13.8 million units were priced at $22.50 per unit resulting in gross
proceeds of $310.5 million. As part of the transaction the Company has agreed to offer to Golar
Partners the right to acquire all its LNG carrier and FSRU assets that in the future obtain contracts of
greater than 5 years. The Company expects to sell Golar Freeze and Khannur (both FSRU’s with
long-term contracts) to Golar Partners during 2011 and 2012 respectively as well as others assets as
new long-term contracts are secured. Golar LNG owns as of August 17, 2011 26,074,577 Golar LNG
Partners units which is unchanged from the initial public offering. The value of these shares as of
August 16, 2011 was $674 million.
Newbuilding
As previously announced, the Company has entered into firm contracts to build six 160,000 m3 LNG
carriers with Samsung Heavy Industries Co Ltd. Four vessels are to be delivered in 2013 and two in
early 2014. The Company is also announcing that it has now added to its newbuilding programme
with orders for two further LNG 160,000 m3 carriers and a 170,000 m
3 FSRU, withal from Samsung.
The LNG carriers will be delivered in 2014 and the FSRU in September of 2013. Proceeds from the
Golar LNG Partners IPO and expected sale of Golar Freeze and Khannur to that entity will go
towards financing the Company’s newbuilding programme. The vessels contracting prices are seen as
favourable in the current market. The total cost of all nine newbuildings amounts to approximately
$1.8 billion. In line with the Company’s other recently ordered vessels, these newbuilding contracts
have been acquired from a Company affiliated to Golar’s main shareholder, World Shipholding,
based on the original contract price.
Financing
The payments of the newbuilding program are significantly back ended. The Board anticipates that a
combination of new long-term charters and long–term debt financing combined with likely drop
downs to Golar LNG Partners will minimise the need for new equity for the newbuilding programme.
The increase of dividend illustrates the Boards confidence in the Company’s ability to finance its
existing commitments.
In April 2011, the Company entered into a new $80 million revolving credit facility with a company
related to its major shareholder, World Shipholding. This facility is now fully drawn and is scheduled
to be repaid within the next 18 months.
Shares and options
In line with the share swap noted above, 897,360 Golar LNG options were issued in the quarter. One
Golar LNG option was issued for 6.06 Golar Energy option held by directors and employees at a
strike price calculated to give the same intrinsic value to holders. Also during the quarter a total of
145,778 Golar LNG options were exercised. In connection with this, the Company issued 145,778
new shares. The total number of remaining Golar LNG options is 1,151,582. The total number of
shares outstanding in Golar excluding options is 79,947,731.
Gimi
The Gimi, which was previously in lay-up, commenced its re-activation in June and is expected to
become available for chartering towards the end of August. The vessel is going through an extensive
refitting programme and is expected to be available for chartering by the beginning of September.
The expenditure on the vessel has increased to $20 million. Part of this increase is related to
increasing the longevity of the vessel and its ability to perform under long-term charters. The
Company is currently in specific discussions with regard to both short and long-term employment for
the vessel and is hopeful that a conclusion can be reached shortly.
The Board has observed a modest increase in operating and administrative expenses. Part of this has
been linked to the set up of Golar Commodities and Golar Partners. The Board has implemented
action to closely monitor and seek to reverse this trend and is hopeful that such action will show
improvements already in the second half of the year.
Shipping
During the quarter, there has remained strong demand for available modern LNG carriers. Charterers
continue to secure forward available tonnage both well in advance of the commencement of their
actual need (1-2 years) and for longer durations than the market had witnessed previously (5-10
years). Structural need for shipping continues to outstrip supply of tonnage, either forcing prospective
Charterers to adjust their requirements, or leave many potential chartering opportunities uncovered.
Small windows of availability will continue to exist in the form of backhaul and short intra-regional
voyages; however, the market is expected to remain structurally tight for the foreseeable future.
Throughout the quarter, charter rates remained strong, pushing beyond $90,000 per day, on a round
trip basis, for modern steam vessels tonnage. The anticipated structural tightness during 2012-2014 is
expected to allow Owners to continue to demand improved freight economics.
The worldwide LNG fleet currently stands at 359 vessels including FSRUs with a further 61 on
order; 39 vessels have been ordered since January 1, 2011. There is today very limited shipyard
capacity available before the last quarter of 2014 and diminishing availability for 2015.
In the period 2014 to 2015, substantial new LNG supply is anticipated from Australia and the Middle
East, which will require significant and as yet unsecured additional shipping capacity. Additional
shipping capacity will also be needed to support the development of new liquefaction capacity, as
well as the growing short term / spot LNG trading business (which accounts for, on average, between
18-22% of the overall LNG trade). The development of potential U.S. LNG export capacity will
further increase the demand for tonnage.
Golar currently has four existing modern vessels and eight newbuildings available for employment
over the next three years. With fundamental evidence of a structural deficit in the supply of LNG
carriers in this same time period, the Board believes that the Company is advantageously positioned
to lock in solid long term returns. The Company has already entered into specific discussions with
regards to chartering its open tonnage and expects that a large part of this open position will be
covered with charters by year end.
Additional demand for tonnage is to a large extent being driven by the large arbitrage opportunities in
the existing market. These arbitrages support longer voyages and therefore increased shipping
requirement. Golar’s vessels will be delivered with historically low boil off rates and will have in all
material respects have superior operating performance relative to the existing fleet.
Regasification
Work is continuing on schedule on the Company’s FSRU project in West Java, Indonesia. The
vessel Khannur is undergoing conversion operations in the Jurong yard in Singapore and the
construction of the mooring facility for the vessel is also underway. The conversion project is
progressing in accordance with the cost and time budget and the Company expects the terminal to be
operational during the first quarter of 2012.
Market interest for the Company to provide floating regasification solutions remains strong. Golar is
involved in four bidding/offer processes and expects another three processes to commence in the near
term. Although the process is not completely finalised, we do not anticipate to be successful in the
tender for the third FSRU in Brazil due to a lower bid. The Board is obviously disappointed but is
hopeful that its decision to build a modern 170,000 m3 FSRU on a speculative basis will give the
Company a competitive timing advantage in future tender processes. The Board is currently
considering an option to convert one of the existing 160,000 m3 LNG carrier newbuildings into a
further FSRU.
Golar Commodities
The Board is clearly disappointed with the performance of Golar Commodities since its start up. Part
of the reason for the under-performance is linked to the dramatic change in trading which has
occurred as a function of the tightening shipping market. Golar has further not been successful in
integrating the Golar commodity team based in Tulsa fully into the Golar organisation.
The Board will, as a result of the lack of performance and the strengthening of the shipping market,
reduce the trading activities until market opportunities open up again.
LNG Market
Incremental LNG supplies remained available in the market but were limited primarily to West
African and Middle East supply sources.
Japan’s appetite for incremental supply remained strong throughout the quarter as a result of the
shutdown in nuclear production capacity. Supplied largely through divertible volumes from Qatar,
Japanese longer term demand for supplies were largely addressed through a series of agreements with
producers.
South American markets were very active with considerable supply moving into both Argentina and
Brazil on the back of high season peak demand loads. Re-export opportunities out of the United
States and Europe remained modest with only 14 cargoes exported thus far in 2011.
New projects slated to come on line in the coming quarters have been delayed. Woodside announced
a further delay in the start up of their Pluto Project Train 1 to end first quarter 2012 while the
developing project in Angola, slated to come on line in February 2012, has indicated a delay into the
2nd
quarter and possibly later. This new production together with debottlenecking projects and the
ramp up of the significant number of new projects that have recently started up could add up to 47
million tonnes of LNG (or approximately 21% of total current production) to the market by the end
of 2012. The fleet will in the same timeframe is expected to increase with only 10 ships or 3% of the
existing fleet.
Outlook
The focus of the Company in the near term will be to leverage its open LNG carrier and FSRU
positions into high value long-term contracted employment. On the back of natural gas and LNG
taking an ever prominent role in the evolving global energy industry, market fundamentals are very
supportive of the ability to lock in long term relationships with LNG players in need of reliable LNG
carrier capacity to support their growing trade requirements.
With the addition of a newbuild FSRU vessel, the Company has increased its commitment to this
market space where Golar is already a leader. Successful operational track records on our three
existing FSRU’s and a positive outlook for delivery of the next vessel in Indonesia creates a solid
platform in a fast expanding industry. The outlook for the Company’s FSRU business remains strong
and we believe that next committed project will be realized prior to the end of 2011 or early 2012.
The Company will, as stated above, reduce its LNG trading activity until markets change or a more
successful trading model has been established.
Operating income in the third quarter is expected to increase as a function of already realised gains
from commodity trades. The results from vessel operations in the second half of the year should be
positively impacted by the addition of Gimi. Results for 2012 are likely to improve as a function of
the four existing modern vessels timecharters that come up for re-contracting in 2012. The
commencement of the Khannur Charter in the first quarter of 2012 is likely to increase operating
income, before depreciation and amortisation, by in excess of $40 million per annum.
The Board is pleased with the large investments the Company has been able to execute in the recent
months. The development in the market shows a strong trend which is likely to continue for at least
the next few years. With its shipping exposure and the organisational and corporate set up Golar is
well positioned to convert this opportunity into long term value for shareholders.
Shareholders should expect strong growth in operating income over the next four quarters.
Forward Looking Statements
This press release contains forward looking statements. These statements are based upon various
assumptions, many of which are based, in turn, upon further assumptions, including examination of
historical operating trends made by the management of Golar LNG. Although Golar LNG believes
that these assumptions were reasonable when made, because assumptions are inherently subject to
significant uncertainties and contingencies, which are difficult or impossible to predict and are
beyond its control, Golar LNG cannot give assurance that it will achieve or accomplish these
expectations, beliefs or intentions.
Included among the factors that, in the Company's view, could cause actual results to differ
materially from the forward looking statements contained in this press release are the following:
inability of the Company to obtain financing for the new building vessels at all or on favourable
terms; changes in demand; a material decline or prolonged weakness in rates for LNG carriers;
political events affecting production in areas in which natural gas is produced and demand for natural
gas in areas to which our vessels deliver; changes in demand for natural gas generally or in particular
regions; changes in the financial stability of our major customers; adoption of new rules and
regulations applicable to LNG carriers and FSRU’s; actions taken by regulatory authorities that may
prohibit the access of LNG carriers or FSRU’s to various ports; our inability to achieve successful
utilisation of our expanded fleet and inability to expand beyond the carriage of LNG; increases in
costs including: crew wages, insurance, provisions, repairs and maintenance; changes in general
domestic and international political conditions; the current turmoil in the global financial markets and
deterioration thereof; changes in applicable maintenance or regulatory standards that could affect our
anticipated dry-docking or maintenance and repair costs; our ability to timely complete our FSRU
conversions; failure of shipyards to comply with delivery schedules on a timely basis and other
factors listed from time to time in registration statements and reports that we have filed with or
furnished to the Securities and Exchange Commission, including our Registration Statement on Form
20-F and subsequent announcements and reports. Nothing contained in this press release shall
constitute an offer of any securities for sale.
August 17, 2011
The Board of Directors
Golar LNG Limited
Hamilton, Bermuda.
Questions should be directed to:
Golar Management Limited - +44 207 063 7900
Doug Arnell – Chief Executive Officer
Brian Tienzo – Chief Financial Officer
Golar LNG Limited
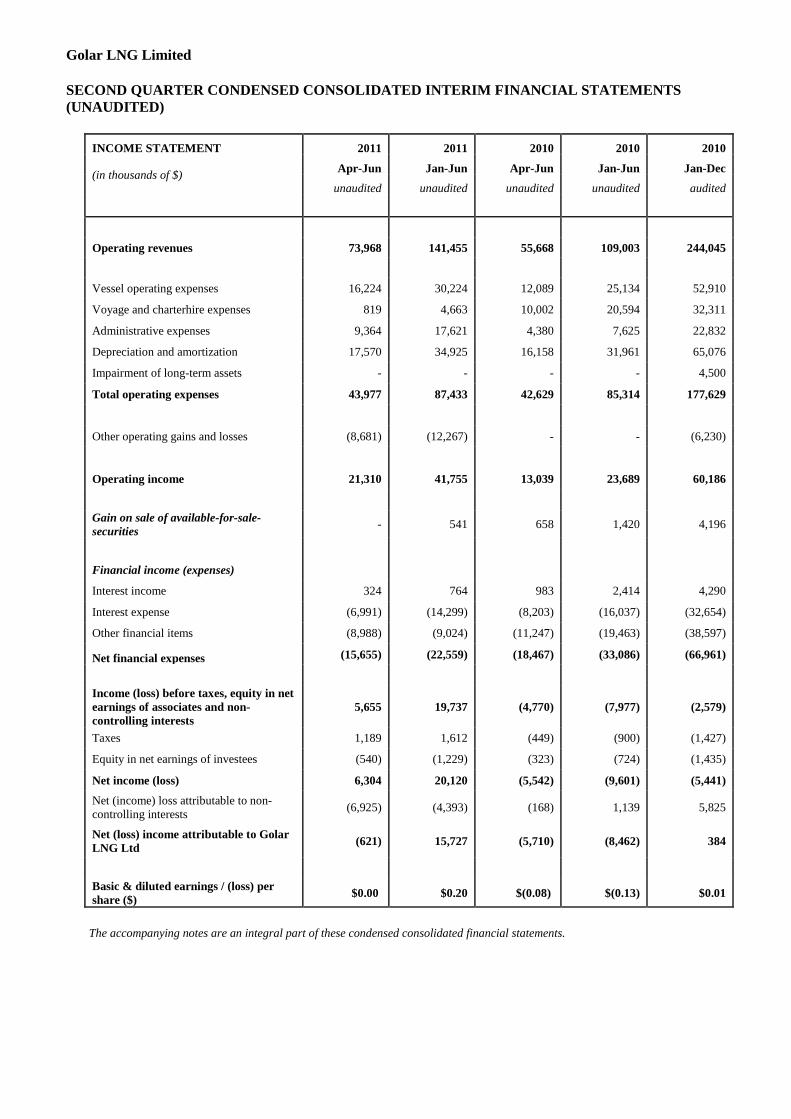
SECOND QUARTER CONDENSED CONSOLIDATED INTERIM FINANCIAL STATEMENTS
(UNAUDITED)
INCOME STATEMENT 2011 2011 2010 2010 2010
(in thousands of $) Apr-Jun Jan-Jun Apr-Jun Jan-Jun Jan-Dec
unaudited unaudited unaudited unaudited audited
Operating revenues 73,968 141,455 55,668 109,003 244,045
Vessel operating expenses 16,224 30,224 12,089 25,134 52,910
Voyage and charterhire expenses 819 4,663 10,002 20,594 32,311
Administrative expenses 9,364 17,621 4,380 7,625 22,832
Depreciation and amortization 17,570 34,925 16,158 31,961 65,076
Impairment of long-term assets - - - - 4,500
Total operating expenses 43,977 87,433 42,629 85,314 177,629
Other operating gains and losses (8,681) (12,267) - - (6,230)
Operating income 21,310 41,755 13,039 23,689 60,186
Gain on sale of available-for-sale-
securities - 541 658 1,420 4,196
Financial income (expenses)
Interest income 324 764 983 2,414 4,290
Interest expense (6,991) (14,299) (8,203) (16,037) (32,654)
Other financial items (8,988) (9,024) (11,247) (19,463) (38,597)
Net financial expenses (15,655) (22,559) (18,467) (33,086) (66,961)
Income (loss) before taxes, equity in net
earnings of associates and non-
controlling interests
5,655 19,737 (4,770) (7,977) (2,579)
Taxes 1,189 1,612 (449) (900) (1,427)
Equity in net earnings of investees (540) (1,229) (323) (724) (1,435)
Net income (loss) 6,304 20,120 (5,542) (9,601) (5,441)
Net (income) loss attributable to non-
controlling interests (6,925) (4,393) (168) 1,139 5,825
Net (loss) income attributable to Golar
LNG Ltd (621) 15,727 (5,710) (8,462) 384
Basic & diluted earnings / (loss) per
share ($) $0.00 $0.20 $(0.08) $(0.13) $0.01
The accompanying notes are an integral part of these condensed consolidated financial statements.
Golar LNG Limited
SECOND QUARTER CONDENSED CONSOLIDATED INTERIM FINANCIAL STATEMENTS
(UNAUDITED)
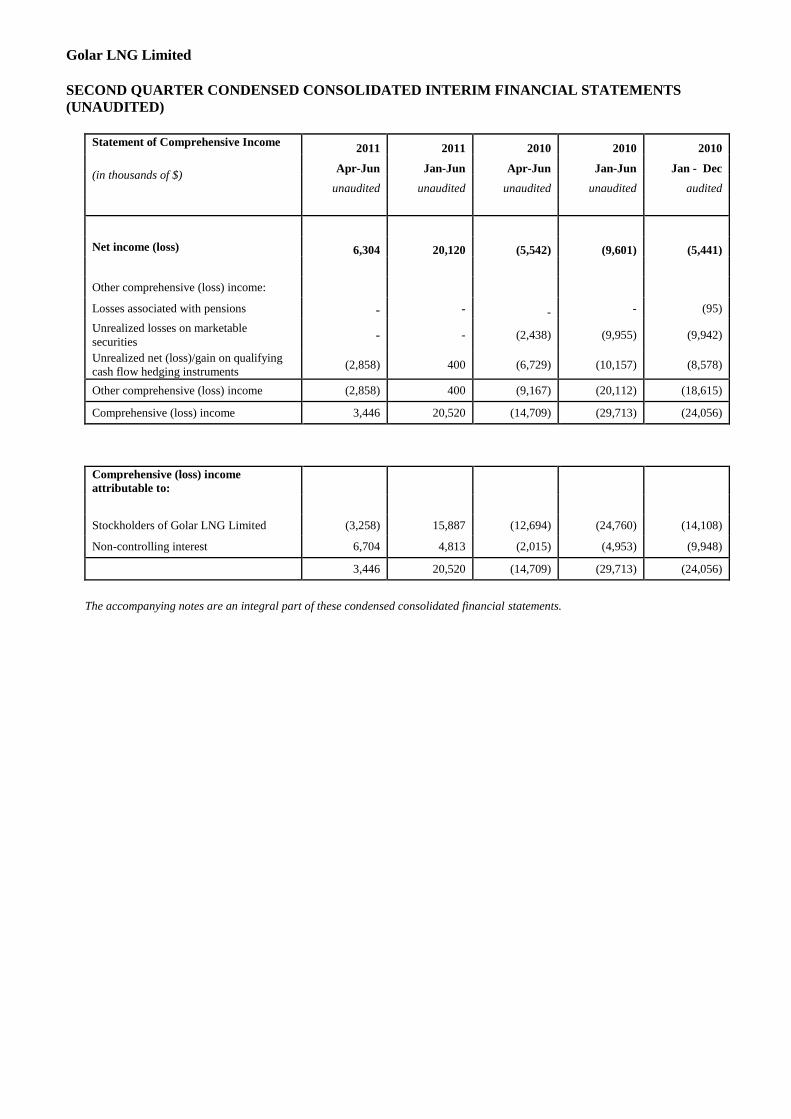
Statement of Comprehensive Income 2011 2011 2010 2010 2010
(in thousands of $) Apr-Jun Jan-Jun Apr-Jun Jan-Jun Jan - Dec
unaudited unaudited unaudited unaudited audited
Net income (loss) 6,304 20,120 (5,542) (9,601) (5,441)
Other comprehensive (loss) income:
Losses associated with pensions - - - - (95)
Unrealized losses on marketable
securities - - (2,438) (9,955) (9,942)
Unrealized net (loss)/gain on qualifying
cash flow hedging instruments (2,858) 400 (6,729) (10,157) (8,578)
Other comprehensive (loss) income (2,858) 400 (9,167) (20,112) (18,615)
Comprehensive (loss) income 3,446 20,520 (14,709) (29,713) (24,056)
Comprehensive (loss) income
attributable to:
Stockholders of Golar LNG Limited (3,258) 15,887 (12,694) (24,760) (14,108)
Non-controlling interest 6,704 4,813 (2,015) (4,953) (9,948)
3,446 20,520 (14,709) (29,713) (24,056)
The accompanying notes are an integral part of these condensed consolidated financial statements.
Golar LNG Limited
SECOND QUARTER CONDENSED CONSOLIDATED INTERIM FINANCIAL STATEMENTS
(UNAUDITED)
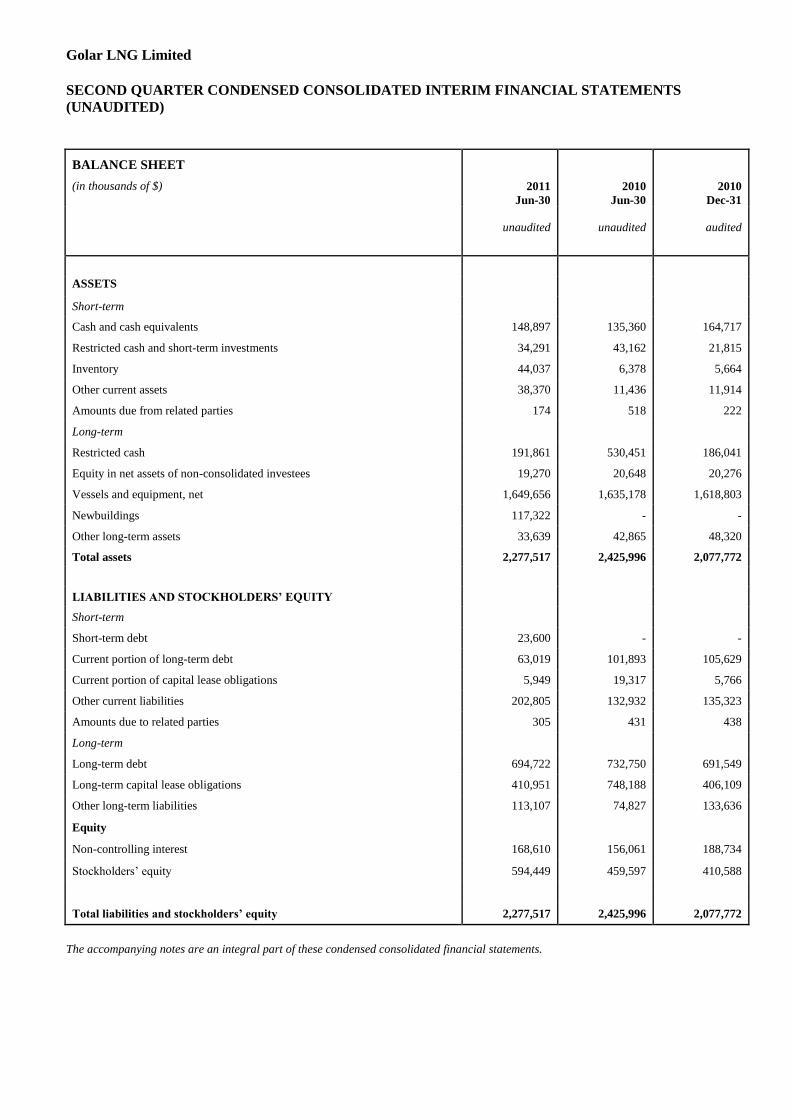
BALANCE SHEET
(in thousands of $) 2011
Jun-30
2010
Jun-30
2010
Dec-31
unaudited unaudited
audited
ASSETS
Short-term
Cash and cash equivalents 148,897 135,360 164,717
Restricted cash and short-term investments 34,291 43,162 21,815
Inventory 44,037 6,378 5,664
Other current assets 38,370 11,436 11,914
Amounts due from related parties 174 518 222
Long-term
Restricted cash 191,861 530,451 186,041
Equity in net assets of non-consolidated investees 19,270 20,648 20,276
Vessels and equipment, net 1,649,656 1,635,178 1,618,803
Newbuildings 117,322 - -
Other long-term assets 33,639 42,865 48,320
Total assets 2,277,517 2,425,996 2,077,772
LIABILITIES AND STOCKHOLDERS’ EQUITY
Short-term
Short-term debt 23,600 - -
Current portion of long-term debt 63,019 101,893 105,629
Current portion of capital lease obligations 5,949 19,317 5,766
Other current liabilities 202,805 132,932 135,323
Amounts due to related parties 305 431 438
Long-term
Long-term debt 694,722 732,750 691,549
Long-term capital lease obligations 410,951 748,188 406,109
Other long-term liabilities 113,107 74,827 133,636
Equity
Non-controlling interest 168,610 156,061 188,734
Stockholders’ equity 594,449 459,597 410,588
Total liabilities and stockholders’ equity 2,277,517 2,425,996 2,077,772
The accompanying notes are an integral part of these condensed consolidated financial statements.
Golar LNG Limited
SECOND QUARTER CONDENSED CONSOLIDATED INTERIM FINANCIAL STATEMENTS (UNAUDITED)
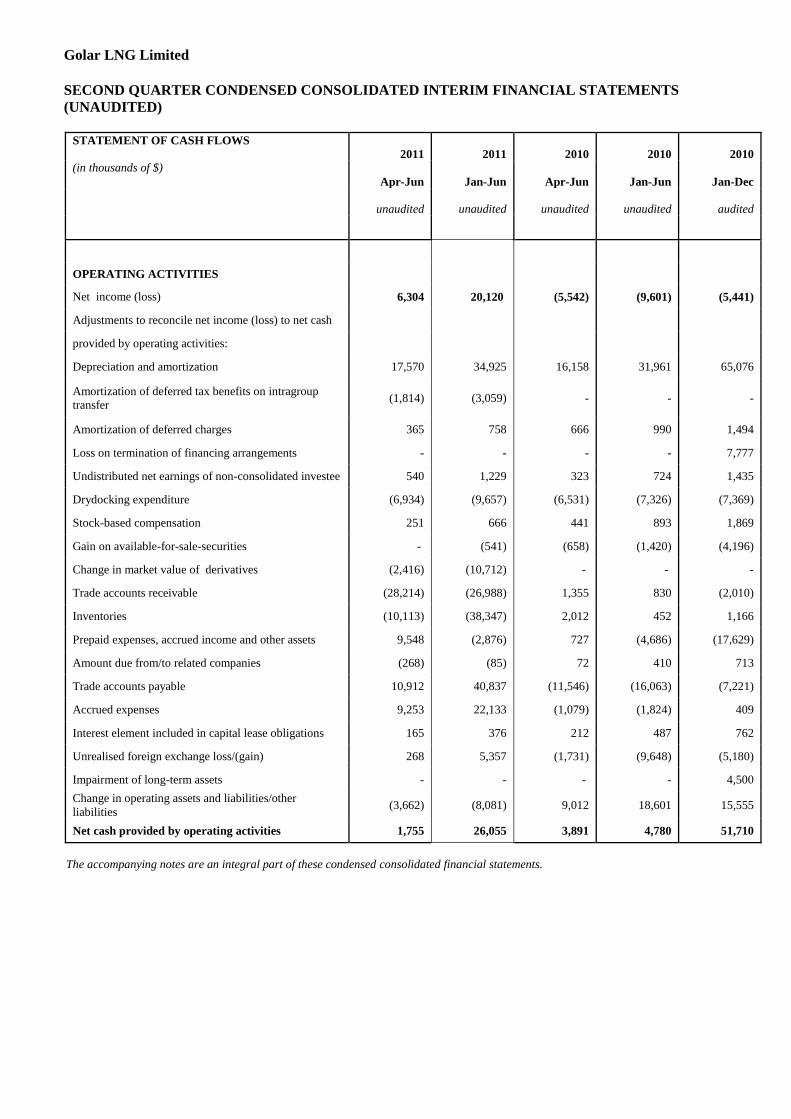
STATEMENT OF CASH FLOWS
2011 2011 2010 2010
2010
(in thousands of $)
Apr-Jun Jan-Jun Apr-Jun Jan-Jun
Jan-Dec
unaudited unaudited unaudited unaudited
audited
OPERATING ACTIVITIES
Net income (loss) 6,304 20,120 (5,542) (9,601) (5,441)
Adjustments to reconcile net income (loss) to net cash
provided by operating activities:
Depreciation and amortization 17,570 34,925 16,158 31,961 65,076
Amortization of deferred tax benefits on intragroup
transfer (1,814) (3,059) - - -
Amortization of deferred charges 365 758 666 990 1,494
Loss on termination of financing arrangements - - - - 7,777
Undistributed net earnings of non-consolidated investee 540 1,229 323 724 1,435
Drydocking expenditure (6,934) (9,657) (6,531) (7,326) (7,369)
Stock-based compensation 251 666 441 893 1,869
Gain on available-for-sale-securities - (541) (658) (1,420) (4,196)
Change in market value of derivatives (2,416) (10,712) - - -
Trade accounts receivable (28,214) (26,988) 1,355 830 (2,010)
Inventories (10,113) (38,347) 2,012 452 1,166
Prepaid expenses, accrued income and other assets 9,548 (2,876) 727 (4,686) (17,629)
Amount due from/to related companies (268) (85) 72 410 713
Trade accounts payable 10,912 40,837 (11,546) (16,063) (7,221)
Accrued expenses 9,253 22,133 (1,079) (1,824) 409
Interest element included in capital lease obligations 165 376 212 487 762
Unrealised foreign exchange loss/(gain) 268 5,357 (1,731) (9,648) (5,180)
Impairment of long-term assets - - - - 4,500
Change in operating assets and liabilities/other
liabilities (3,662) (8,081) 9,012 18,601 15,555
Net cash provided by operating activities 1,755 26,055 3,891 4,780 51,710
The accompanying notes are an integral part of these condensed consolidated financial statements.
Golar LNG Limited
SECOND QUARTER CONDENSED CONSOLIDATED INTERIM FINANCIAL STATEMENTS (UNAUDITED)
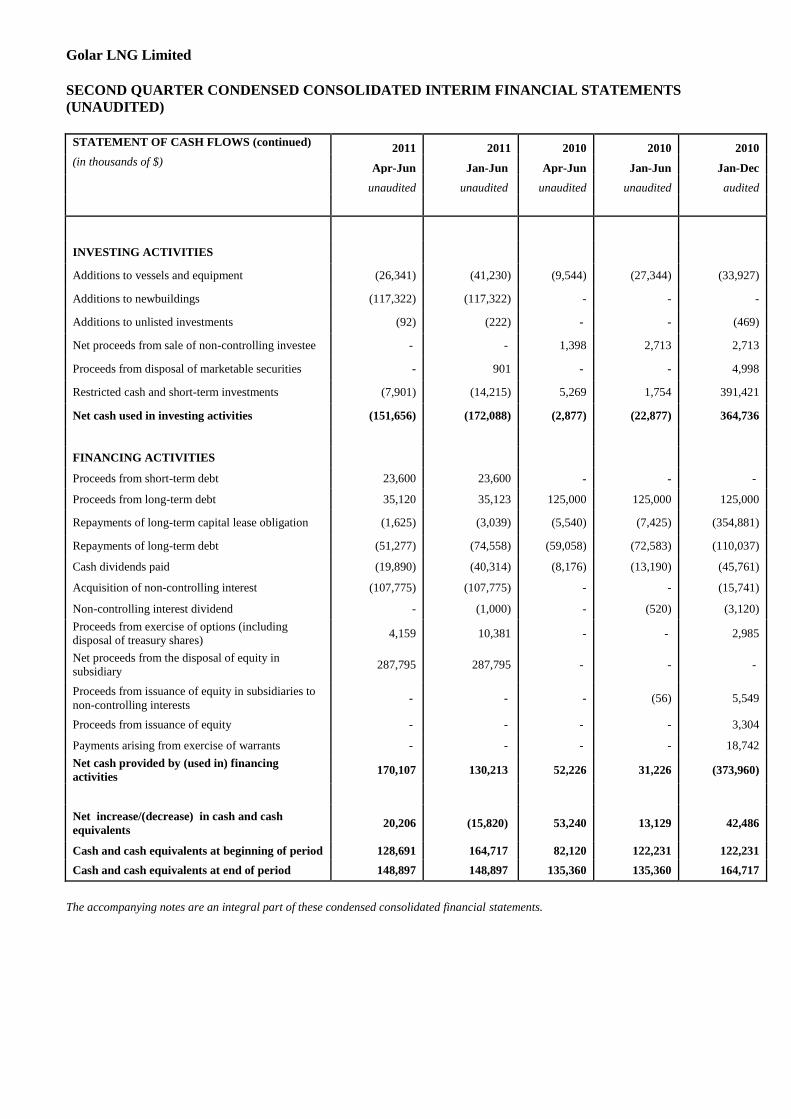
STATEMENT OF CASH FLOWS (continued) 2011 2011 2010 2010 2010
(in thousands of $) Apr-Jun Jan-Jun Apr-Jun Jan-Jun Jan-Dec
unaudited unaudited unaudited unaudited audited
INVESTING ACTIVITIES
Additions to vessels and equipment (26,341) (41,230) (9,544) (27,344) (33,927)
Additions to newbuildings (117,322) (117,322) - - -
Additions to unlisted investments (92) (222) - - (469)
Net proceeds from sale of non-controlling investee - - 1,398 2,713 2,713
Proceeds from disposal of marketable securities - 901 - - 4,998
Restricted cash and short-term investments (7,901) (14,215) 5,269 1,754 391,421
Net cash used in investing activities (151,656) (172,088) (2,877) (22,877) 364,736
FINANCING ACTIVITIES
Proceeds from short-term debt 23,600 23,600 - - -
Proceeds from long-term debt 35,120 35,123 125,000 125,000 125,000
Repayments of long-term capital lease obligation (1,625) (3,039) (5,540) (7,425) (354,881)
Repayments of long-term debt (51,277) (74,558) (59,058) (72,583) (110,037)
Cash dividends paid (19,890) (40,314) (8,176) (13,190) (45,761)
Acquisition of non-controlling interest (107,775) (107,775) - - (15,741)
Non-controlling interest dividend - (1,000) - (520) (3,120)
Proceeds from exercise of options (including
disposal of treasury shares) 4,159 10,381 - - 2,985
Net proceeds from the disposal of equity in
subsidiary 287,795 287,795 - - -
Proceeds from issuance of equity in subsidiaries to
non-controlling interests - - - (56) 5,549
Proceeds from issuance of equity - - - - 3,304
Payments arising from exercise of warrants - - - - 18,742
Net cash provided by (used in) financing
activities 170,107 130,213 52,226 31,226 (373,960)
Net increase/(decrease) in cash and cash
equivalents 20,206 (15,820) 53,240 13,129 42,486
Cash and cash equivalents at beginning of period 128,691 164,717 82,120 122,231 122,231
Cash and cash equivalents at end of period 148,897 148,897 135,360 135,360 164,717
The accompanying notes are an integral part of these condensed consolidated financial statements.
Golar LNG Limited
SECOND QUARTER CONDENSED CONSOLIDATED INTERIM FINANCIAL STATEMENTS
(UNA(UNAUDITED)
STATEMENT OF CHANGES IN
EQUITY
(in thousands of $) Share
Capital
Treasury
Shares
Additional
Paid in
Capital
Contrib-
uted
Surplus
Accumulated
Other
Comprehensi-
ve loss
Accumulated
Retained
Earnings
Total before
Non-
Controlling
Interest
Non-
Controlling
Interest
Total
Stockholders
Equity
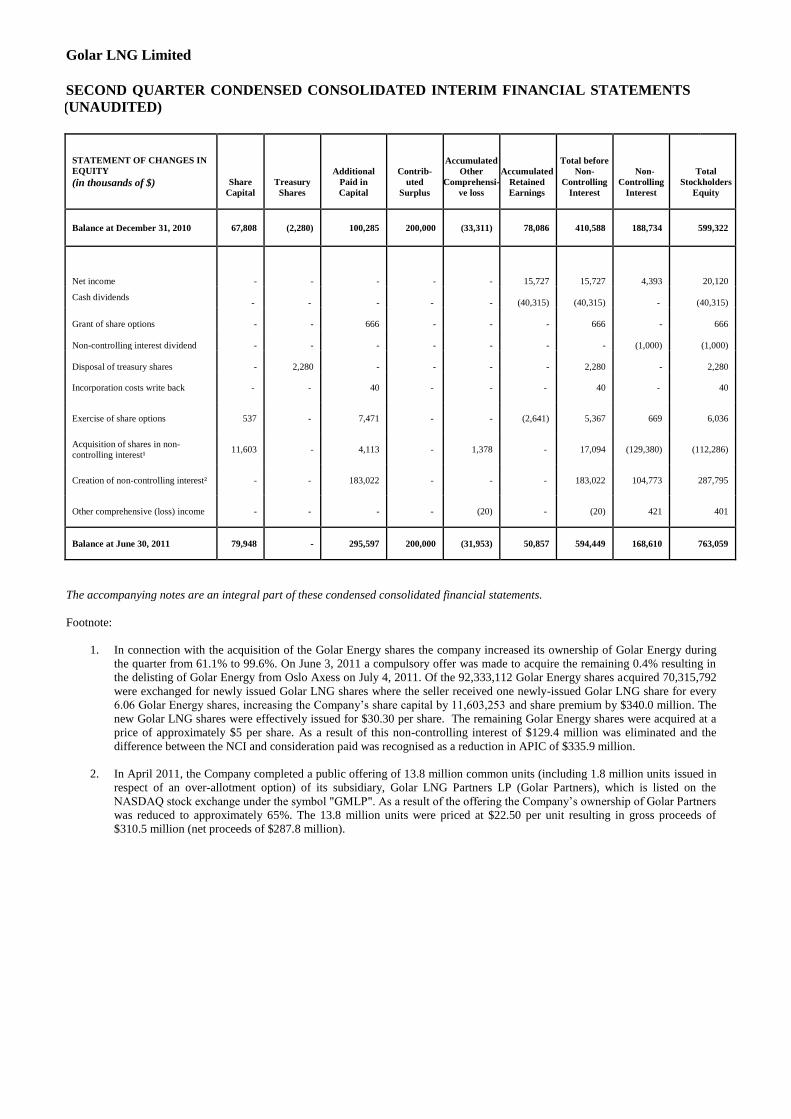
Balance at December 31, 2010 67,808 (2,280) 100,285 200,000 (33,311) 78,086 410,588 188,734 599,322
Net income - - - - - 15,727 15,727 4,393 20,120
Cash dividends
-
-
-
-
-
(40,315)
(40,315)
-
(40,315)
Grant of share options - - 666 - - - 666 - 666
Non-controlling interest dividend - - - - - - - (1,000) (1,000)
Disposal of treasury shares - 2,280 - - - - 2,280 - 2,280
Incorporation costs write back - - 40 - - - 40 - 40
Exercise of share options 537 - 7,471 - - (2,641) 5,367 669 6,036
Acquisition of shares in non-
controlling interest¹ 11,603 - 4,113 - 1,378 - 17,094 (129,380) (112,286)
Creation of non-controlling interest² - - 183,022 - - - 183,022 104,773 287,795
Other comprehensive (loss) income - - - - (20) - (20) 421 401
Balance at June 30, 2011 79,948 - 295,597 200,000 (31,953) 50,857 594,449 168,610 763,059
The accompanying notes are an integral part of these condensed consolidated financial statements.
Footnote:
1. In connection with the acquisition of the Golar Energy shares the company increased its ownership of Golar Energy during
the quarter from 61.1% to 99.6%. On June 3, 2011 a compulsory offer was made to acquire the remaining 0.4% resulting in
the delisting of Golar Energy from Oslo Axess on July 4, 2011. Of the 92,333,112 Golar Energy shares acquired 70,315,792
were exchanged for newly issued Golar LNG shares where the seller received one newly-issued Golar LNG share for every
6.06 Golar Energy shares, increasing the Company’s share capital by 11,603,253 and share premium by $340.0 million. The
new Golar LNG shares were effectively issued for $30.30 per share. The remaining Golar Energy shares were acquired at a
price of approximately $5 per share. As a result of this non-controlling interest of $129.4 million was eliminated and the
difference between the NCI and consideration paid was recognised as a reduction in APIC of $335.9 million.
2. In April 2011, the Company completed a public offering of 13.8 million common units (including 1.8 million units issued in
respect of an over-allotment option) of its subsidiary, Golar LNG Partners LP (Golar Partners), which is listed on the
NASDAQ stock exchange under the symbol "GMLP". As a result of the offering the Company’s ownership of Golar Partners
was reduced to approximately 65%. The 13.8 million units were priced at $22.50 per unit resulting in gross proceeds of
$310.5 million (net proceeds of $287.8 million).
Golar LNG Limited
Notes to Condensed Consolidated Interim Financial Statements
1. GENERAL
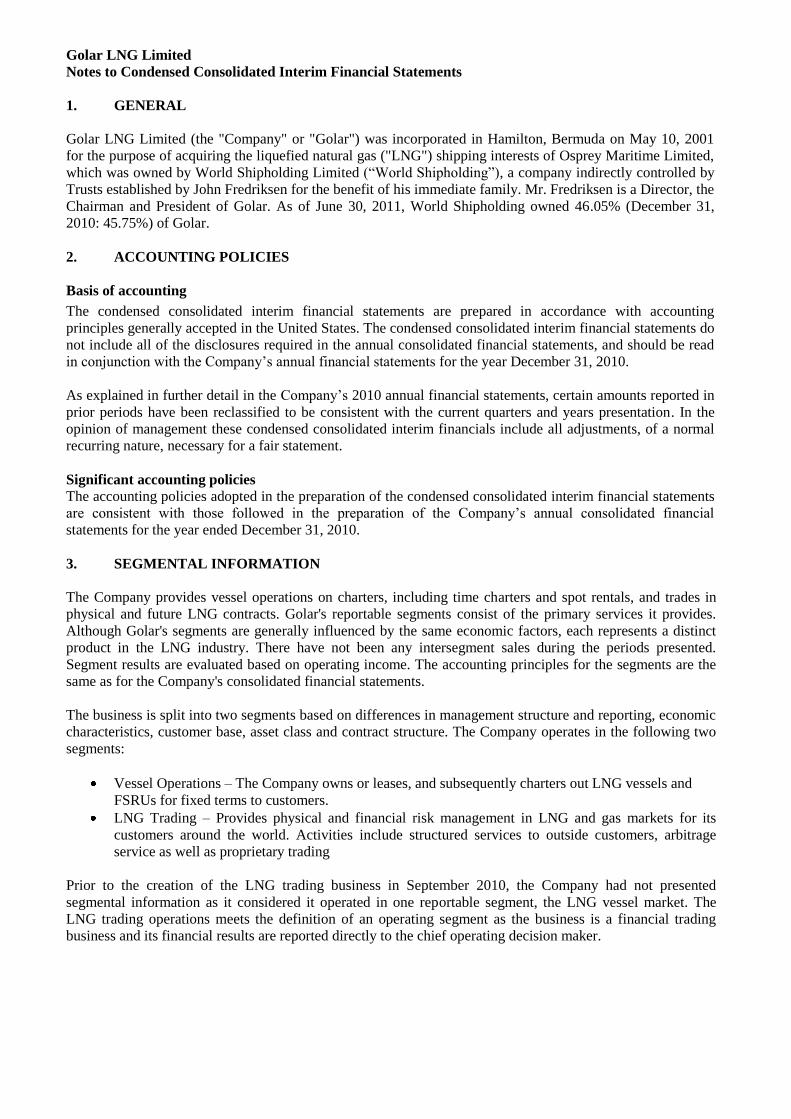
Golar LNG Limited (the "Company" or "Golar") was incorporated in Hamilton, Bermuda on May 10, 2001
for the purpose of acquiring the liquefied natural gas ("LNG") shipping interests of Osprey Maritime Limited,
which was owned by World Shipholding Limited (“World Shipholding”), a company indirectly controlled by
Trusts established by John Fredriksen for the benefit of his immediate family. Mr. Fredriksen is a Director, the
Chairman and President of Golar. As of June 30, 2011, World Shipholding owned 46.05% (December 31,
2010: 45.75%) of Golar.
2. ACCOUNTING POLICIES
Basis of accounting
The condensed consolidated interim financial statements are prepared in accordance with accounting
principles generally accepted in the United States. The condensed consolidated interim financial statements do
not include all of the disclosures required in the annual consolidated financial statements, and should be read
in conjunction with the Company’s annual financial statements for the year December 31, 2010.
As explained in further detail in the Company’s 2010 annual financial statements, certain amounts reported in
prior periods have been reclassified to be consistent with the current quarters and years presentation. In the
opinion of management these condensed consolidated interim financials include all adjustments, of a normal
recurring nature, necessary for a fair statement.
Significant accounting policies The accounting policies adopted in the preparation of the condensed consolidated interim financial statements
are consistent with those followed in the preparation of the Company’s annual consolidated financial
statements for the year ended December 31, 2010.
3. SEGMENTAL INFORMATION
The Company provides vessel operations on charters, including time charters and spot rentals, and trades in
physical and future LNG contracts. Golar's reportable segments consist of the primary services it provides.
Although Golar's segments are generally influenced by the same economic factors, each represents a distinct
product in the LNG industry. There have not been any intersegment sales during the periods presented.
Segment results are evaluated based on operating income. The accounting principles for the segments are the
same as for the Company's consolidated financial statements.
The business is split into two segments based on differences in management structure and reporting, economic
characteristics, customer base, asset class and contract structure. The Company operates in the following two
segments:
Vessel Operations – The Company owns or leases, and subsequently charters out LNG vessels and
FSRUs for fixed terms to customers.
LNG Trading – Provides physical and financial risk management in LNG and gas markets for its
customers around the world. Activities include structured services to outside customers, arbitrage
service as well as proprietary trading
Prior to the creation of the LNG trading business in September 2010, the Company had not presented
segmental information as it considered it operated in one reportable segment, the LNG vessel market. The
LNG trading operations meets the definition of an operating segment as the business is a financial trading
business and its financial results are reported directly to the chief operating decision maker.
Golar LNG Limited
Notes to Condensed Consolidated Interim Financial Statements (continued)
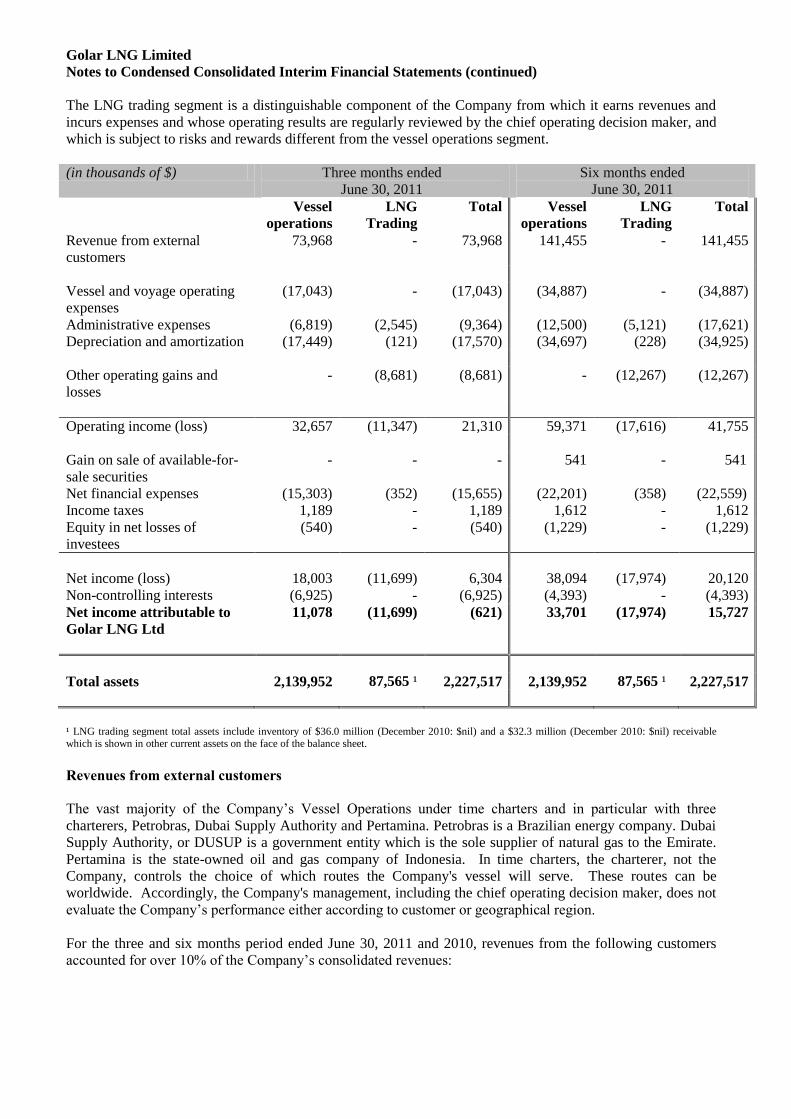
The LNG trading segment is a distinguishable component of the Company from which it earns revenues and
incurs expenses and whose operating results are regularly reviewed by the chief operating decision maker, and
which is subject to risks and rewards different from the vessel operations segment.
(in thousands of $) Three months ended
June 30, 2011
Six months ended
June 30, 2011
Vessel
operations
LNG
Trading
Total Vessel
operations
LNG
Trading
Total
Revenue from external
customers
73,968 - 73,968 141,455
- 141,455
Vessel and voyage operating
expenses
(17,043) - (17,043) (34,887) - (34,887)
Administrative expenses (6,819) (2,545) (9,364) (12,500) (5,121) (17,621)
Depreciation and amortization (17,449) (121) (17,570) (34,697) (228) (34,925)
Other operating gains and
losses
- (8,681) (8,681) -
(12,267) (12,267)
Operating income (loss) 32,657 (11,347) 21,310 59,371 (17,616) 41,755
Gain on sale of available-for-
sale securities
- - - 541 - 541
Net financial expenses (15,303) (352) (15,655) (22,201) (358) (22,559)
Income taxes 1,189 - 1,189 1,612 - 1,612
Equity in net losses of
investees
(540) - (540) (1,229) - (1,229)
Net income (loss) 18,003 (11,699) 6,304 38,094 (17,974) 20,120
Non-controlling interests (6,925) - (6,925) (4,393) - (4,393)
Net income attributable to
Golar LNG Ltd
11,078 (11,699) (621) 33,701 (17,974) 15,727
Total assets 2,139,952 87,565 ¹ 2,227,517 2,139,952 87,565 ¹ 2,227,517
¹ LNG trading segment total assets include inventory of $36.0 million (December 2010: $nil) and a $32.3 million (December 2010: $nil) receivable which is shown in other current assets on the face of the balance sheet.
Revenues from external customers
The vast majority of the Company’s Vessel Operations under time charters and in particular with three
charterers, Petrobras, Dubai Supply Authority and Pertamina. Petrobras is a Brazilian energy company. Dubai
Supply Authority, or DUSUP is a government entity which is the sole supplier of natural gas to the Emirate.
Pertamina is the state-owned oil and gas company of Indonesia. In time charters, the charterer, not the
Company, controls the choice of which routes the Company's vessel will serve. These routes can be
worldwide. Accordingly, the Company's management, including the chief operating decision maker, does not
evaluate the Company’s performance either according to customer or geographical region.
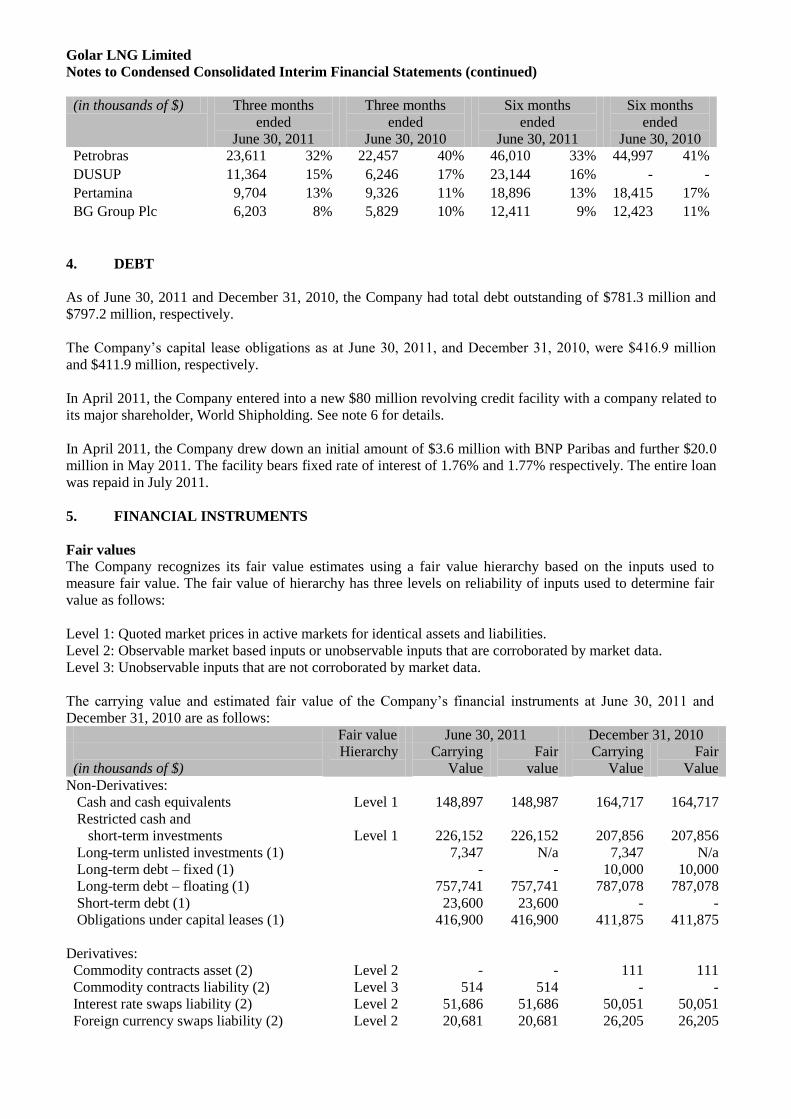
For the three and six months period ended June 30, 2011 and 2010, revenues from the following customers
accounted for over 10% of the Company’s consolidated revenues:
Golar LNG Limited
Notes to Condensed Consolidated Interim Financial Statements (continued)
(in thousands of $) Three months
ended June 30, 2011
Three months
ended June 30, 2010
Six months ended
June 30, 2011
Six months ended
June 30, 2010 Petrobras 23,611 32%
22,457 40% 46,010 33% 44,997 41%
DUSUP 11,364 15% 6,246 17% 23,144 16% - -
Pertamina 9,704 13% 9,326 11% 18,896 13% 18,415 17%
BG Group Plc 6,203 8% 5,829 10% 12,411 9% 12,423 11%
4. DEBT
As of June 30, 2011 and December 31, 2010, the Company had total debt outstanding of $781.3 million and
$797.2 million, respectively.
The Company’s capital lease obligations as at June 30, 2011, and December 31, 2010, were $416.9 million
and $411.9 million, respectively.
In April 2011, the Company entered into a new $80 million revolving credit facility with a company related to
its major shareholder, World Shipholding. See note 6 for details.
In April 2011, the Company drew down an initial amount of $3.6 million with BNP Paribas and further $20.0
million in May 2011. The facility bears fixed rate of interest of 1.76% and 1.77% respectively. The entire loan
was repaid in July 2011.
5. FINANCIAL INSTRUMENTS
Fair values
The Company recognizes its fair value estimates using a fair value hierarchy based on the inputs used to
measure fair value. The fair value of hierarchy has three levels on reliability of inputs used to determine fair
value as follows:
Level 1: Quoted market prices in active markets for identical assets and liabilities.
Level 2: Observable market based inputs or unobservable inputs that are corroborated by market data.
Level 3: Unobservable inputs that are not corroborated by market data.
The carrying value and estimated fair value of the Company’s financial instruments at June 30, 2011 and
December 31, 2010 are as follows:
Fair value June 30, 2011 December 31, 2010
(in thousands of $)
Hierarchy Carrying
Value
Fair
value
Carrying
Value
Fair
Value
Non-Derivatives:
Cash and cash equivalents Level 1 148,897 148,987 164,717 164,717
Restricted cash and
short-term investments
Level 1
226,152
226,152
207,856
207,856
Long-term unlisted investments (1) 7,347 N/a 7,347 N/a
Long-term debt – fixed (1) - - 10,000 10,000
Long-term debt – floating (1) 757,741 757,741 787,078 787,078
Short-term debt (1) 23,600 23,600 - -
Obligations under capital leases (1) 416,900 416,900 411,875 411,875
Derivatives:
Commodity contracts asset (2) Level 2 - - 111 111
Commodity contracts liability (2) Level 3 514 514 - -
Interest rate swaps liability (2) Level 2 51,686 51,686 50,051 50,051
Foreign currency swaps liability (2) Level 2
20,681 20,681 26,205 26,205
Golar LNG Limited
Notes to Condensed Consolidated Interim Financial Statements (continued)
5. FINANCIAL INSTRUMENTS (continued)
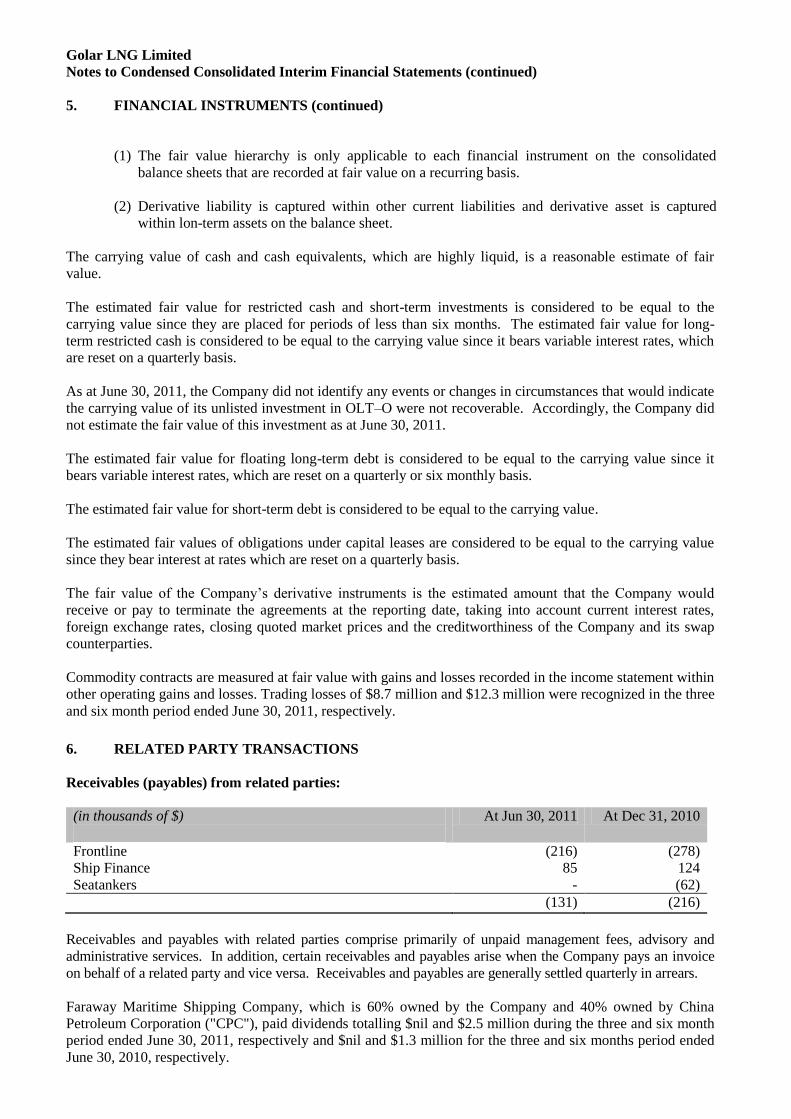
(1) The fair value hierarchy is only applicable to each financial instrument on the consolidated
balance sheets that are recorded at fair value on a recurring basis.
(2) Derivative liability is captured within other current liabilities and derivative asset is captured
within lon-term assets on the balance sheet.
The carrying value of cash and cash equivalents, which are highly liquid, is a reasonable estimate of fair
value.
The estimated fair value for restricted cash and short-term investments is considered to be equal to the
carrying value since they are placed for periods of less than six months. The estimated fair value for long-
term restricted cash is considered to be equal to the carrying value since it bears variable interest rates, which
are reset on a quarterly basis.
As at June 30, 2011, the Company did not identify any events or changes in circumstances that would indicate
the carrying value of its unlisted investment in OLT–O were not recoverable. Accordingly, the Company did
not estimate the fair value of this investment as at June 30, 2011.
The estimated fair value for floating long-term debt is considered to be equal to the carrying value since it
bears variable interest rates, which are reset on a quarterly or six monthly basis.
The estimated fair value for short-term debt is considered to be equal to the carrying value.
The estimated fair values of obligations under capital leases are considered to be equal to the carrying value
since they bear interest at rates which are reset on a quarterly basis.
The fair value of the Company’s derivative instruments is the estimated amount that the Company would
receive or pay to terminate the agreements at the reporting date, taking into account current interest rates,
foreign exchange rates, closing quoted market prices and the creditworthiness of the Company and its swap
counterparties.
Commodity contracts are measured at fair value with gains and losses recorded in the income statement within
other operating gains and losses. Trading losses of $8.7 million and $12.3 million were recognized in the three
and six month period ended June 30, 2011, respectively.
6. RELATED PARTY TRANSACTIONS
Receivables (payables) from related parties:
(in thousands of $)
At Jun 30, 2011 At Dec 31, 2010
Frontline (216) (278) Ship Finance 85 124 Seatankers - (62)
(131) (216)
Receivables and payables with related parties comprise primarily of unpaid management fees, advisory and
administrative services. In addition, certain receivables and payables arise when the Company pays an invoice
on behalf of a related party and vice versa. Receivables and payables are generally settled quarterly in arrears.
Faraway Maritime Shipping Company, which is 60% owned by the Company and 40% owned by China
Petroleum Corporation ("CPC"), paid dividends totalling $nil and $2.5 million during the three and six month
period ended June 30, 2011, respectively and $nil and $1.3 million for the three and six months period ended
June 30, 2010, respectively.
Golar LNG Limited
Notes to Condensed Consolidated Interim Financial Statements (continued)
6. RELATED PARTY TRANSACTIONS
Receivables (payables) from related parties (continued):
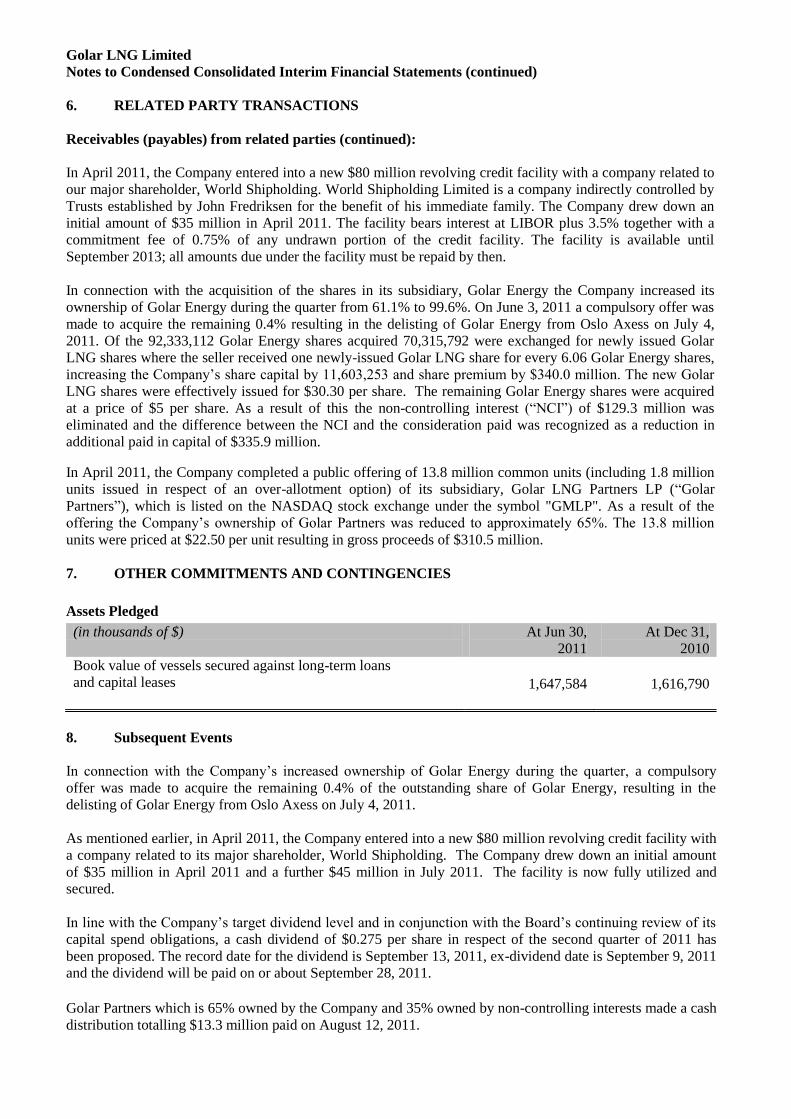
In April 2011, the Company entered into a new $80 million revolving credit facility with a company related to
our major shareholder, World Shipholding. World Shipholding Limited is a company indirectly controlled by
Trusts established by John Fredriksen for the benefit of his immediate family. The Company drew down an
initial amount of $35 million in April 2011. The facility bears interest at LIBOR plus 3.5% together with a
commitment fee of 0.75% of any undrawn portion of the credit facility. The facility is available until
September 2013; all amounts due under the facility must be repaid by then.
In connection with the acquisition of the shares in its subsidiary, Golar Energy the Company increased its
ownership of Golar Energy during the quarter from 61.1% to 99.6%. On June 3, 2011 a compulsory offer was
made to acquire the remaining 0.4% resulting in the delisting of Golar Energy from Oslo Axess on July 4,
2011. Of the 92,333,112 Golar Energy shares acquired 70,315,792 were exchanged for newly issued Golar
LNG shares where the seller received one newly-issued Golar LNG share for every 6.06 Golar Energy shares,
increasing the Company’s share capital by 11,603,253 and share premium by $340.0 million. The new Golar
LNG shares were effectively issued for $30.30 per share. The remaining Golar Energy shares were acquired
at a price of $5 per share. As a result of this the non-controlling interest (“NCI”) of $129.3 million was
eliminated and the difference between the NCI and the consideration paid was recognized as a reduction in
additional paid in capital of $335.9 million.
In April 2011, the Company completed a public offering of 13.8 million common units (including 1.8 million
units issued in respect of an over-allotment option) of its subsidiary, Golar LNG Partners LP (“Golar
Partners”), which is listed on the NASDAQ stock exchange under the symbol "GMLP". As a result of the
offering the Company’s ownership of Golar Partners was reduced to approximately 65%. The 13.8 million
units were priced at $22.50 per unit resulting in gross proceeds of $310.5 million.
7. OTHER COMMITMENTS AND CONTINGENCIES
Assets Pledged
(in thousands of $) At Jun 30, 2011
At Dec 31, 2010
Book value of vessels secured against long-term loans and capital leases
1,647,584
1,616,790
8. Subsequent Events
In connection with the Company’s increased ownership of Golar Energy during the quarter, a compulsory
offer was made to acquire the remaining 0.4% of the outstanding share of Golar Energy, resulting in the
delisting of Golar Energy from Oslo Axess on July 4, 2011.
As mentioned earlier, in April 2011, the Company entered into a new $80 million revolving credit facility with
a company related to its major shareholder, World Shipholding. The Company drew down an initial amount
of $35 million in April 2011 and a further $45 million in July 2011. The facility is now fully utilized and
secured.
In line with the Company’s target dividend level and in conjunction with the Board’s continuing review of its
capital spend obligations, a cash dividend of $0.275 per share in respect of the second quarter of 2011 has
been proposed. The record date for the dividend is September 13, 2011, ex-dividend date is September 9, 2011
and the dividend will be paid on or about September 28, 2011.
Golar Partners which is 65% owned by the Company and 35% owned by non-controlling interests made a cash
distribution totalling $13.3 million paid on August 12, 2011.
Responsibility Statement
We confirm, to the best of our knowledge, that the condensed consolidated interim financial statements for the
period January 1 to June 30, 2011 have been prepared in accordance with U.S generally accepted accounting
principles, and give a true and fair view of the Company’s assets, liabilities, financial position and profit or
loss as a whole. We also confirm, to the best of our knowledge, that the interim management report includes a
fair review of important events that have occurred during the first nine months of the financial year and their
impact on the condensed interim financial statements, a description of the principal risks and uncertainties for
the remaining six months of the financial year, and major related parties transactions.
The Board of Directors