Embed Size (px)
DESCRIPTION
International Helicopter Safety Symposium 2005. Mr. Bob Frazier, AEPCO Contracted System Safety Manager. Mr. Colin Gale United Kingdom AHIPT AH/M&L/S&S. Apache Cooperative Project Office AH-64D Aircraft Safety Model “Potential Cumulative Risk Model”. Background. - PowerPoint PPT Presentation
Citation preview
International Helicopter Safety Symposium 2005
Mr. Bob Frazier, AEPCOContracted
System Safety Manager
Mr. Colin GaleUnited Kingdom
AHIPT AH/M&L/S&S
Apache Cooperative Project Office AH-64D Aircraft Safety Model
“Potential Cumulative Risk Model”
Background• USG and UK have cooperative agreements and have
formed Cooperative Project Office (CPO)– The UK attends and participates at the Joint Apache System Safety Working
Group Meetings.– Under CPO MOU the US/UK have formed 7 working groups. Through Safety
working group AAH PMO became aware of the UK Safety Management Program and the UK Aircraft Safety Model and program for managing risks.
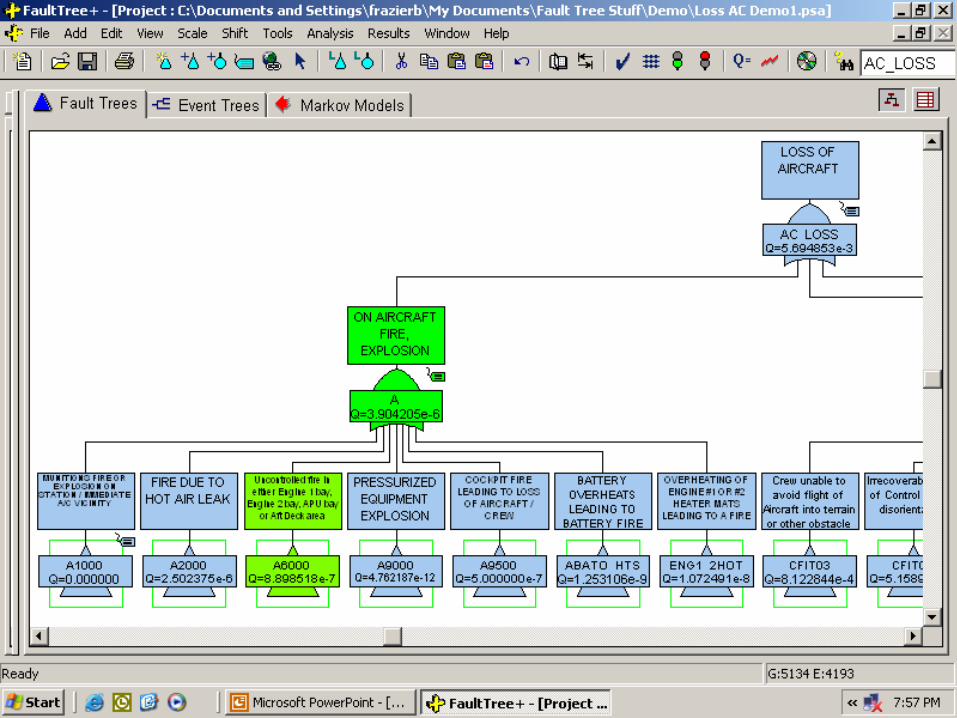
– Apache PMO recognized the UK Safety Model using a Fault Tree as a potential method for modeling cumulative system risk.
– The Apache PM attends and participates as a member of the UK AHIPTL Safety Panel.
• UK MoD requires hazard risk to be ‘As Low As Reasonably Practicable’ (ALARP)
– UK Guidance material suggests a target probability of 10-6 per flying hour for loss of aircraft or death (JSP 553).
– Demonstrate with Analyzable Safety Case (DERA report ‘Guidance for the Provision of an Aircraft Safety Case’).
– Recommended practices highlight the technique of Fault Tree Analysis (e.g. SAE ARP 4761).
Risk Management Tools• UK Risk Management Tools
– Hazard Log Database (HLD):• ‘bottom up’ approach of user’s view of causes of failure, classification of
severity.• Fault probability data is traceable via decisions at System Safety Review
Group (SSRG) and captured in HLD.• Source documents are referenced in Apache HLD.• SSRG risk decisions are recorded in the HLD.
– Aircraft Safety Model (ASM):• ‘top down’ approach of catastrophic hazards and contributing failure
mechanisms, by construction of Fault Tree diagrams.
• These are Complimentary Approaches
• Aircraft Safety Model:– The UK Safety Model developed by Westland Helicopters Limited under
contract to the MoD with guidance from DERA (now QinetiQ) supported by ERA (Independent Safety Advisor to AAH IPT).
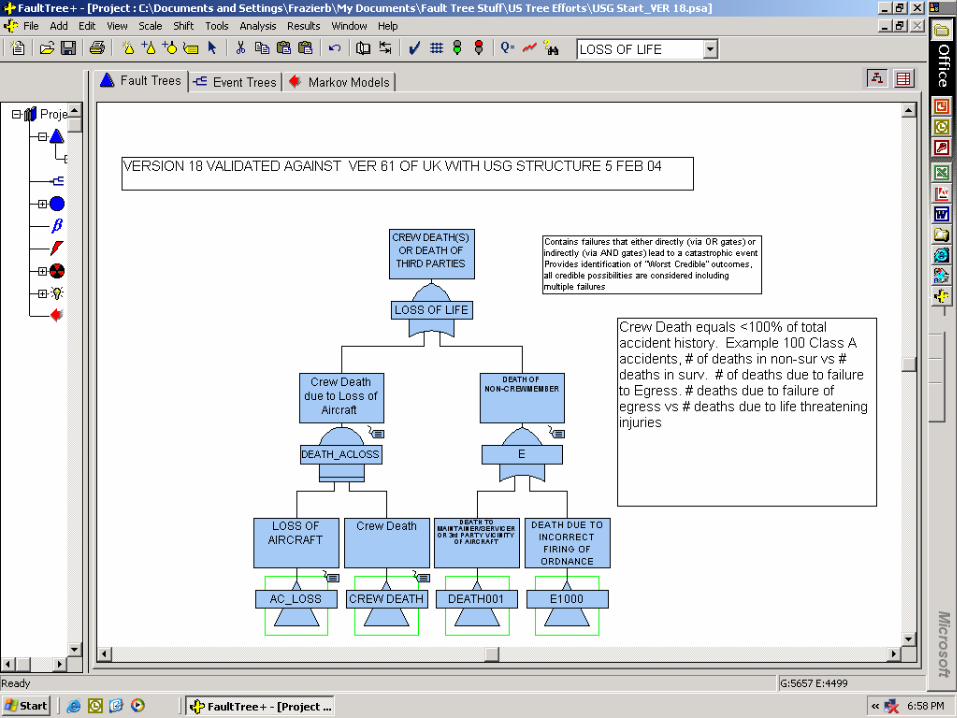
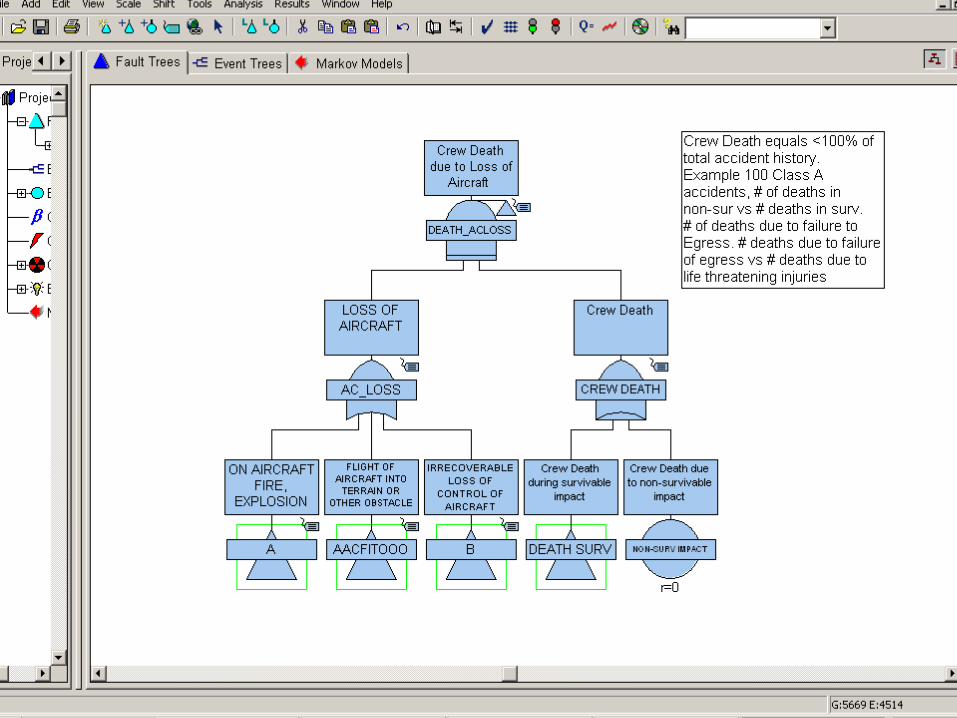
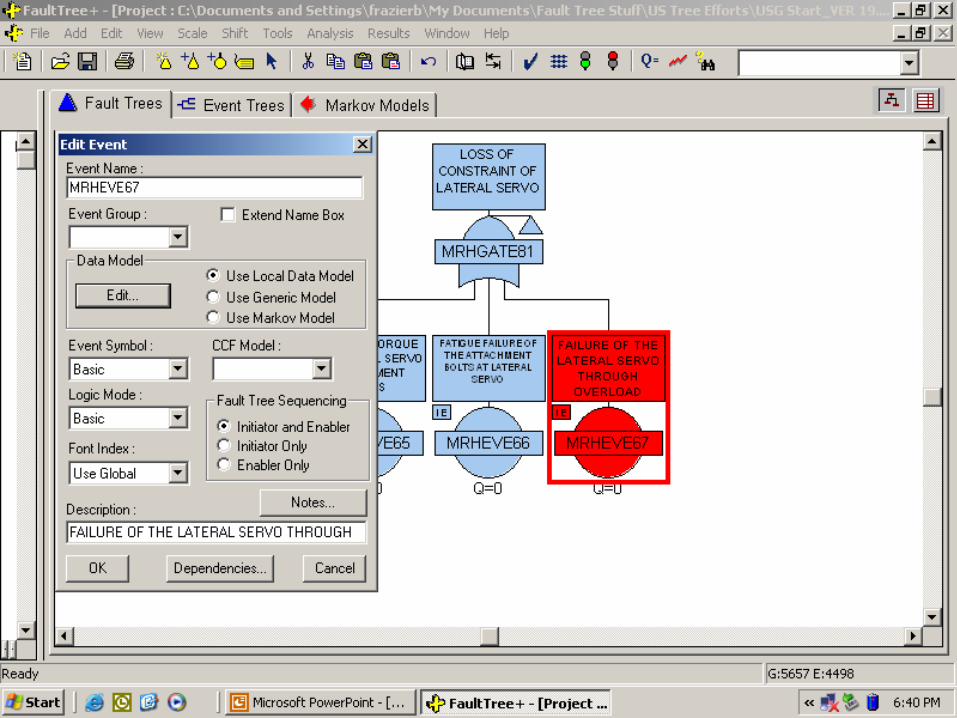
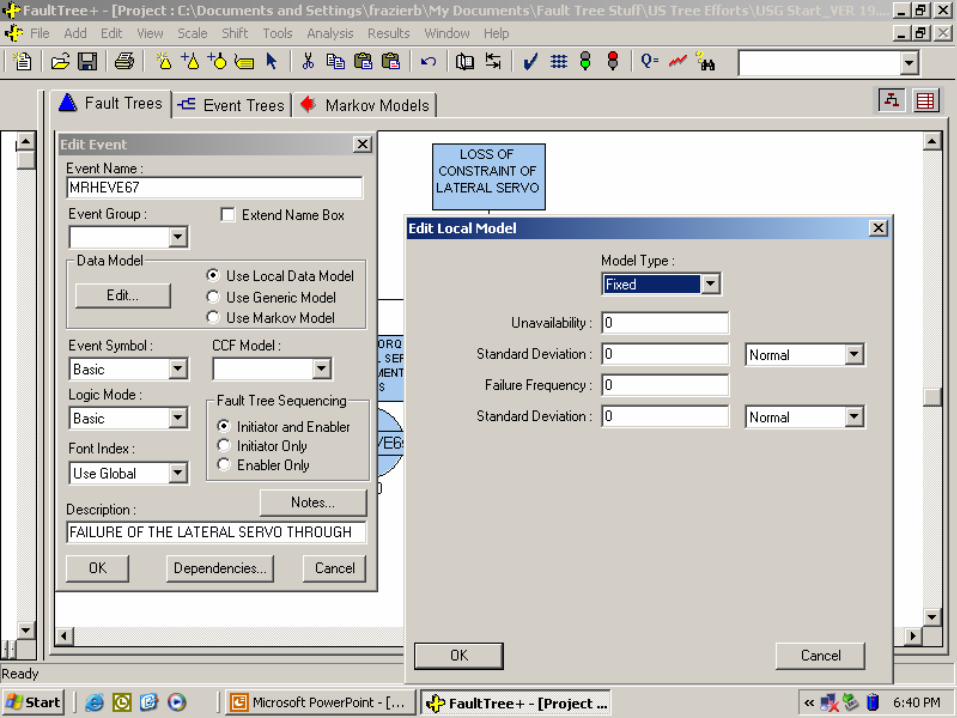
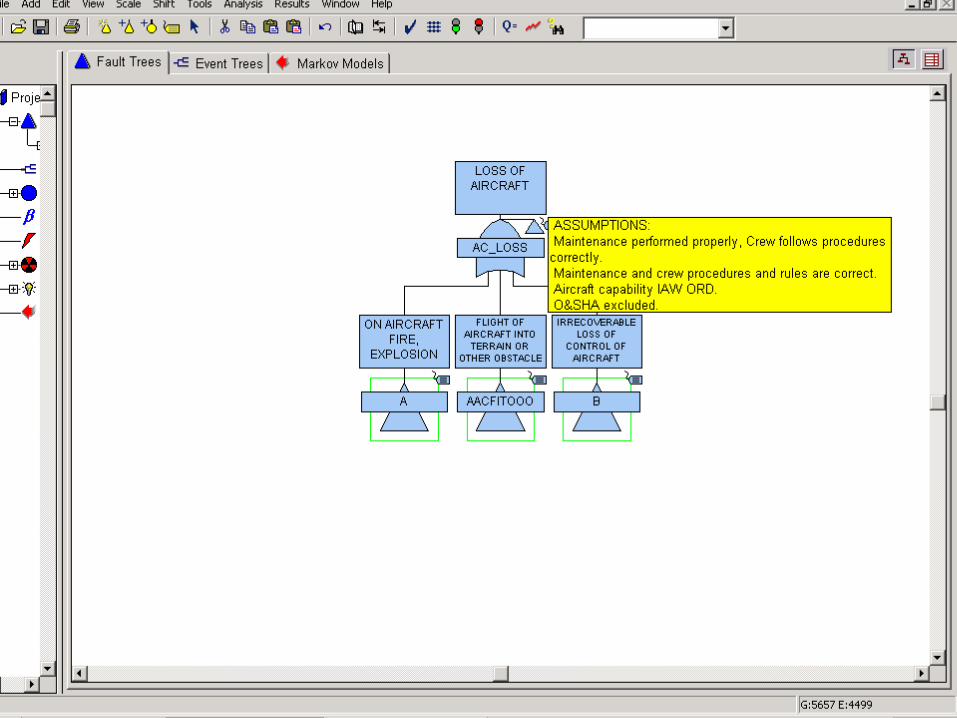
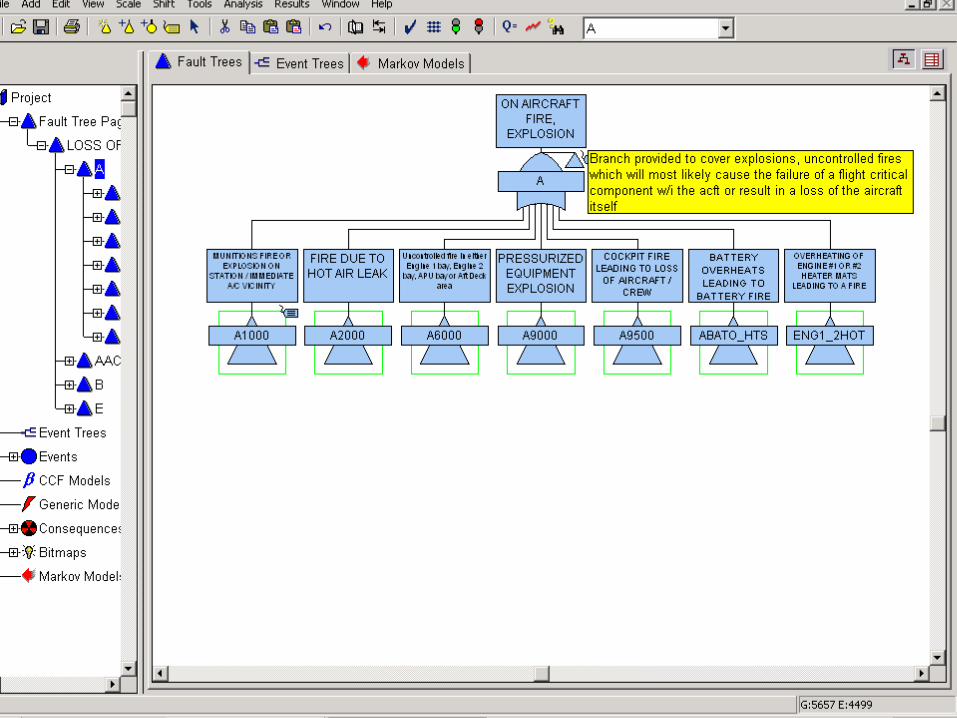
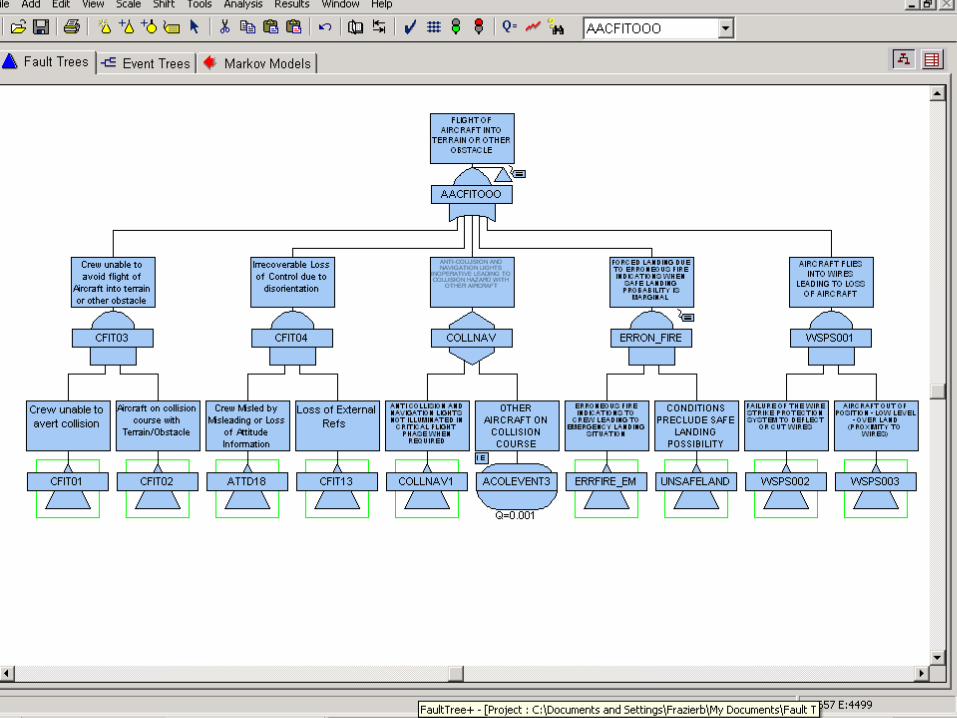
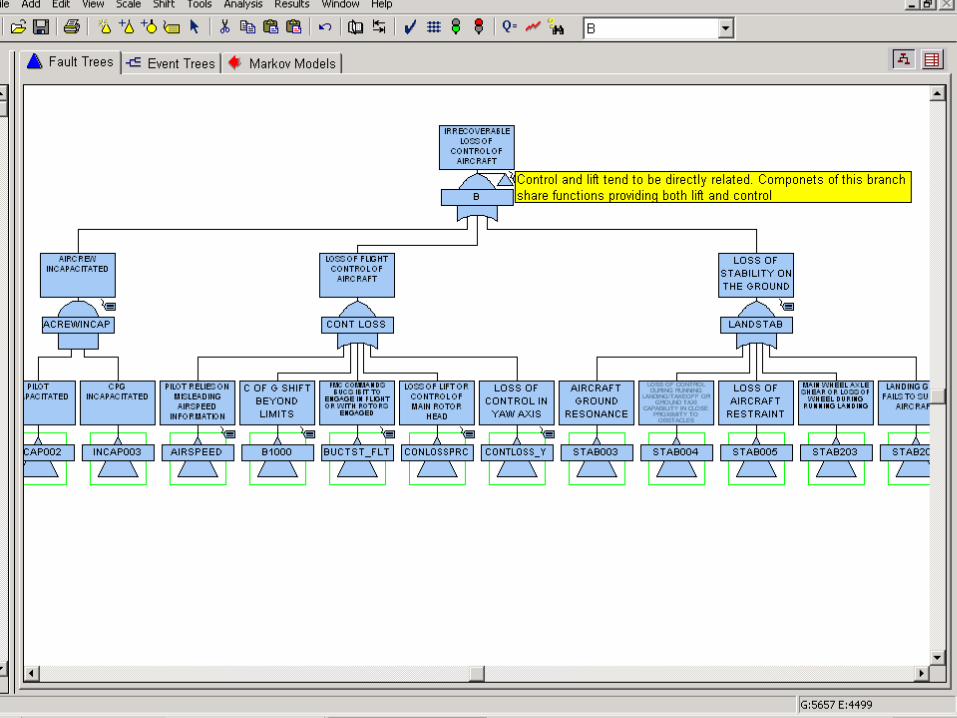
• The model uses a Fault Tree “top down” approach of catastrophic hazards and contributing failure mechanisms, through the construction of Fault Tree logic diagrams.
• Fault probability data is traceable via decisions at review and source documents referenced in Apache Hazard Log Database.
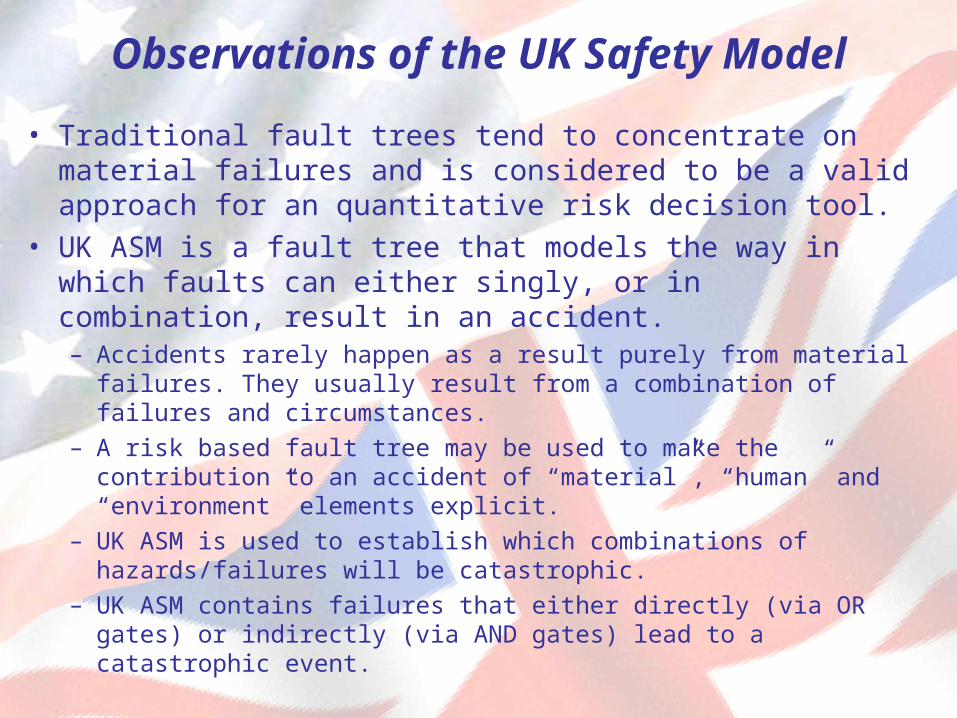
Observations of the UK Safety Model
• Traditional fault trees tend to concentrate on material failures and is considered to be a valid approach for an quantitative risk decision tool.
• UK ASM is a fault tree that models the way in which faults can either singly, or in combination, result in an accident.– Accidents rarely happen as a result purely from material failures.
They usually result from a combination of failures and circumstances.
– A risk based fault tree may be used to make the contribution to an accident of “material”, “human” and “environment” elements explicit.
– UK ASM is used to establish which combinations of hazards/failures will be catastrophic.
– UK ASM contains failures that either directly (via OR gates) or indirectly (via AND gates) lead to a catastrophic event.
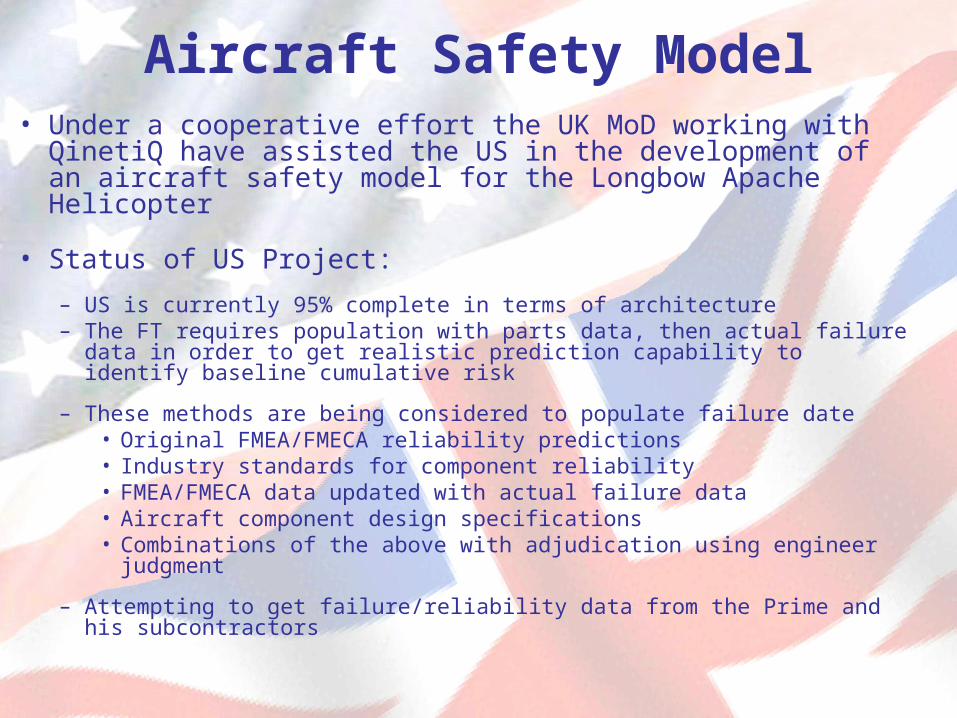
Aircraft Safety Model• Under a cooperative effort the UK MoD working with QinetiQ
have assisted the US in the development of an aircraft safety model for the Longbow Apache Helicopter
• Status of US Project:
– US is currently 95% complete in terms of architecture – The FT requires population with parts data, then actual failure data in
order to get realistic prediction capability to identify baseline cumulative risk
– These methods are being considered to populate failure date• Original FMEA/FMECA reliability predictions• Industry standards for component reliability• FMEA/FMECA data updated with actual failure data• Aircraft component design specifications• Combinations of the above with adjudication using engineer judgment
– Attempting to get failure/reliability data from the Prime and his subcontractors
Aircraft Safety Model
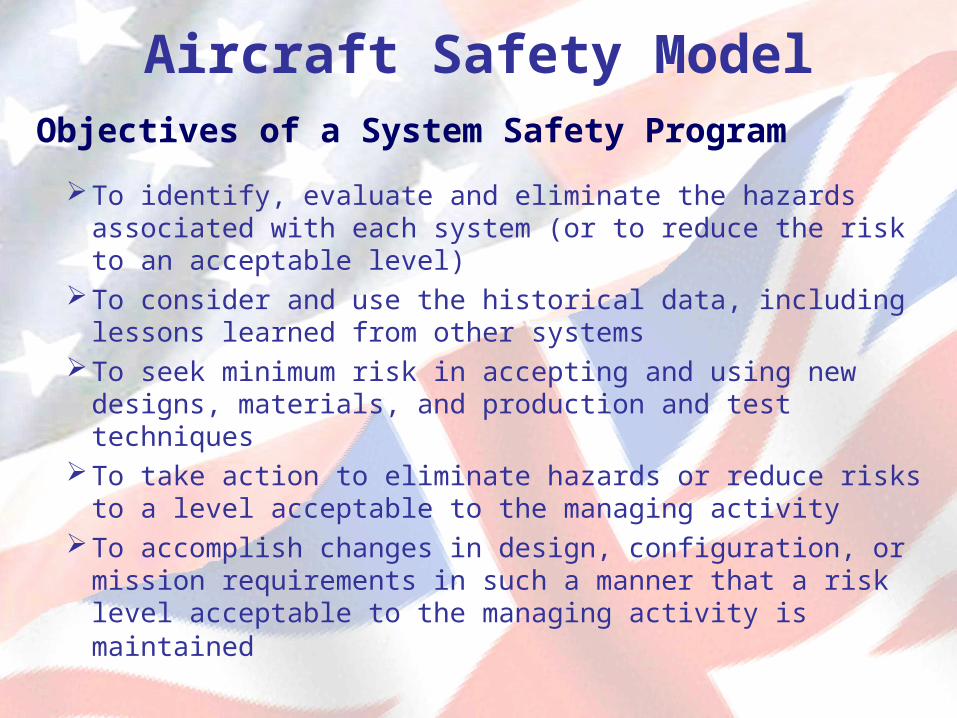
Objectives of a System Safety Program
To identify, evaluate and eliminate the hazards associated with each system (or to reduce the risk to an acceptable level)
To consider and use the historical data, including lessons learned from other systems
To seek minimum risk in accepting and using new designs, materials, and production and test techniques
To take action to eliminate hazards or reduce risks to a level acceptable to the managing activity
To accomplish changes in design, configuration, or mission requirements in such a manner that a risk level acceptable to the managing activity is maintained
Aircraft Safety Model
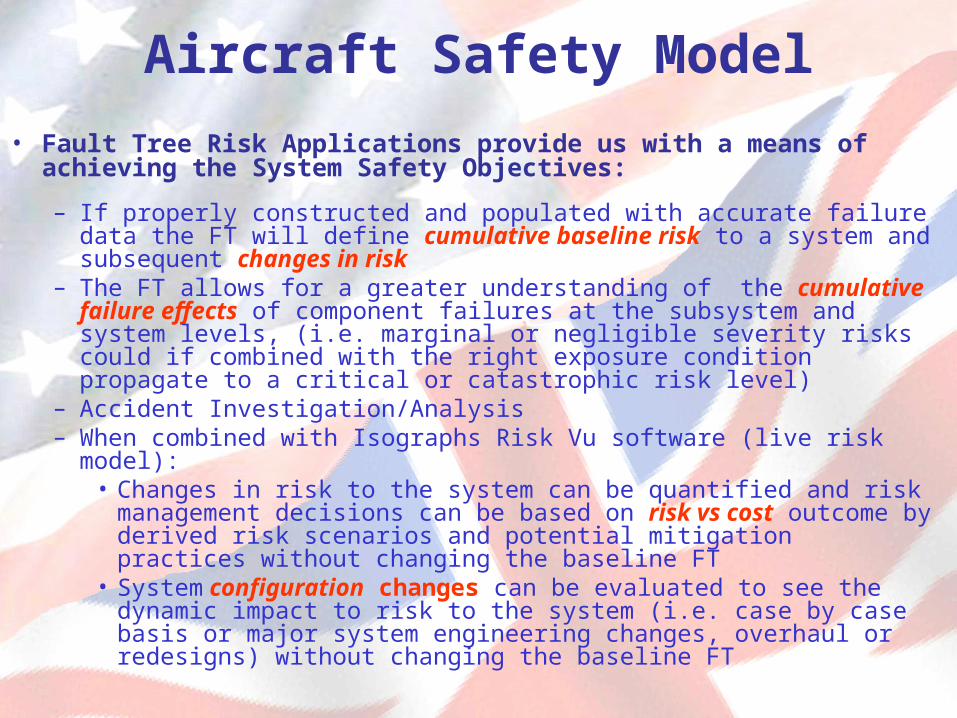
• Fault Tree Risk Applications provide us with a means of achieving the System Safety Objectives:
– If properly constructed and populated with accurate failure data the FT will define cumulative baseline risk to a system and subsequent changes in risk
– The FT allows for a greater understanding of the cumulative failure effects of component failures at the subsystem and system levels, (i.e. marginal or negligible severity risks could if combined with the right exposure condition propagate to a critical or catastrophic risk level)
– Accident Investigation/Analysis– When combined with Isographs Risk Vu software (live risk model):
• Changes in risk to the system can be quantified and risk management decisions can be based on risk vs cost outcome by derived risk scenarios and potential mitigation practices without changing the baseline FT
• System configuration changes can be evaluated to see the dynamic impact to risk to the system (i.e. case by case basis or major system engineering changes, overhaul or redesigns) without changing the baseline FT
Aircraft Safety Model
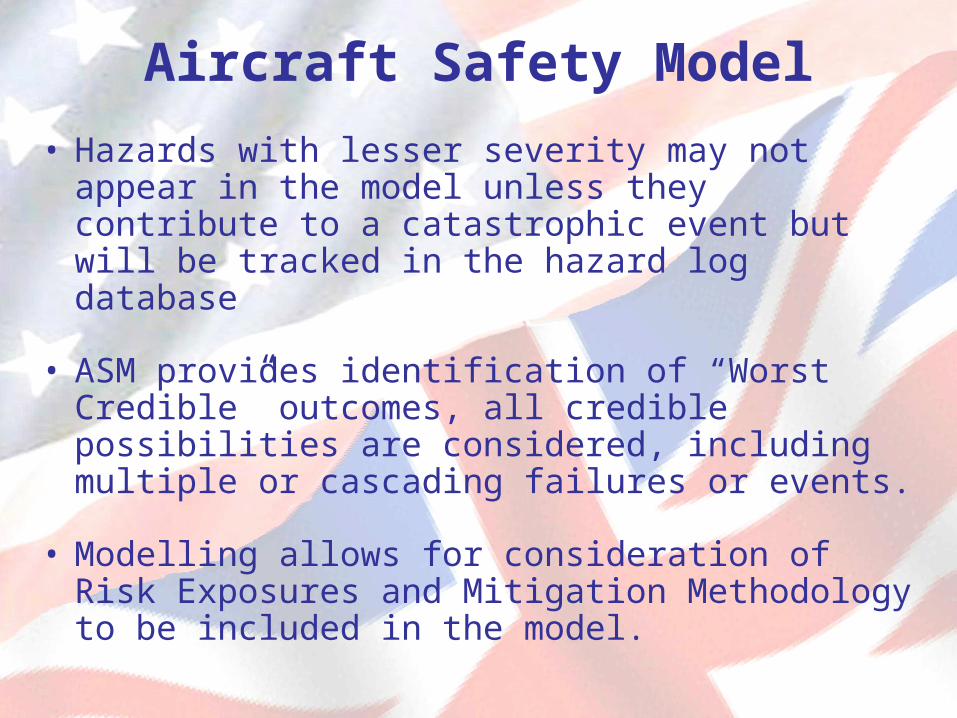
• Hazards with lesser severity may not appear in the model unless they contribute to a catastrophic event but will be tracked in the hazard log database
• ASM provides identification of “Worst Credible” outcomes, all credible possibilities are considered, including multiple or cascading failures or events.
• Modelling allows for consideration of Risk Exposures and Mitigation Methodology to be included in the model.
Aircraft Safety Model
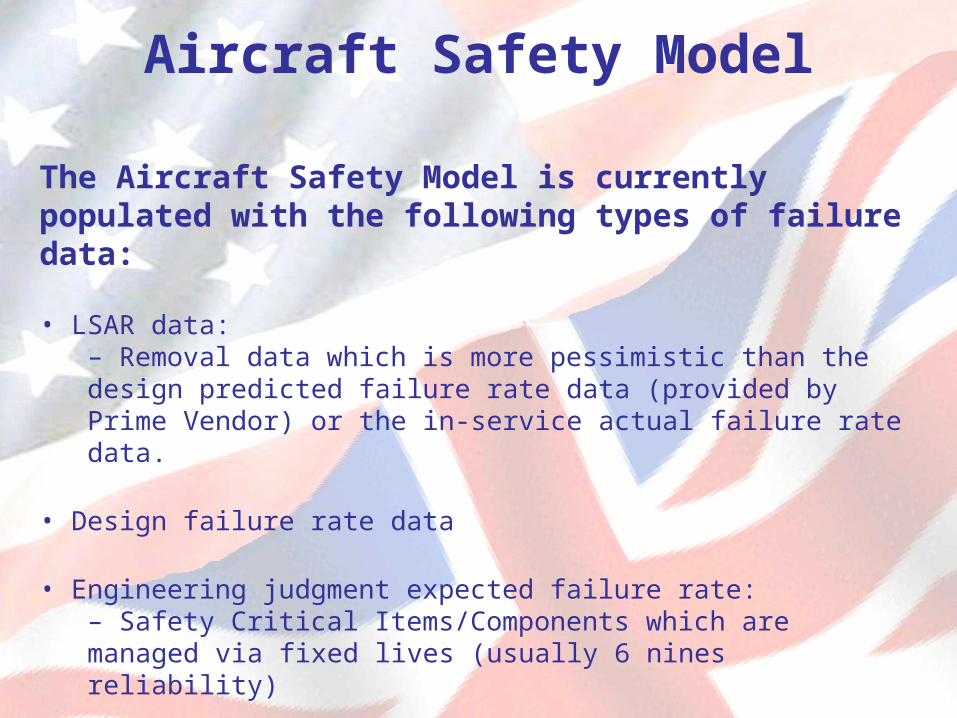
The Aircraft Safety Model is currently populated with the following types of failure data:
• LSAR data: – Removal data which is more pessimistic than the design predicted failure rate data (provided by Prime Vendor) or the in-service actual failure rate data.
• Design failure rate data
• Engineering judgment expected failure rate:– Safety Critical Items/Components which are managed via fixed lives (usually 6 nines reliability)
• Unpopulated
Path Ahead
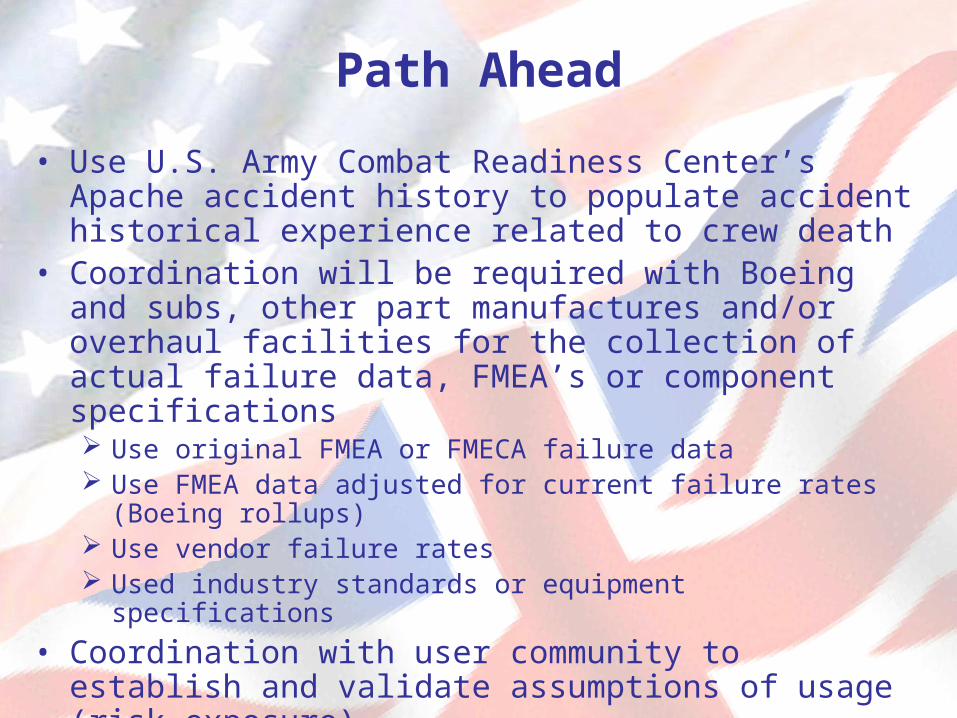
• Use U.S. Army Combat Readiness Center’s Apache accident history to populate accident historical experience related to crew death
• Coordination will be required with Boeing and subs, other part manufactures and/or overhaul facilities for the collection of actual failure data, FMEA’s or component specifications Use original FMEA or FMECA failure data Use FMEA data adjusted for current failure rates (Boeing rollups) Use vendor failure rates Used industry standards or equipment specifications
• Coordination with user community to establish and validate assumptions of usage (risk exposure)
• Complete undeveloped structures
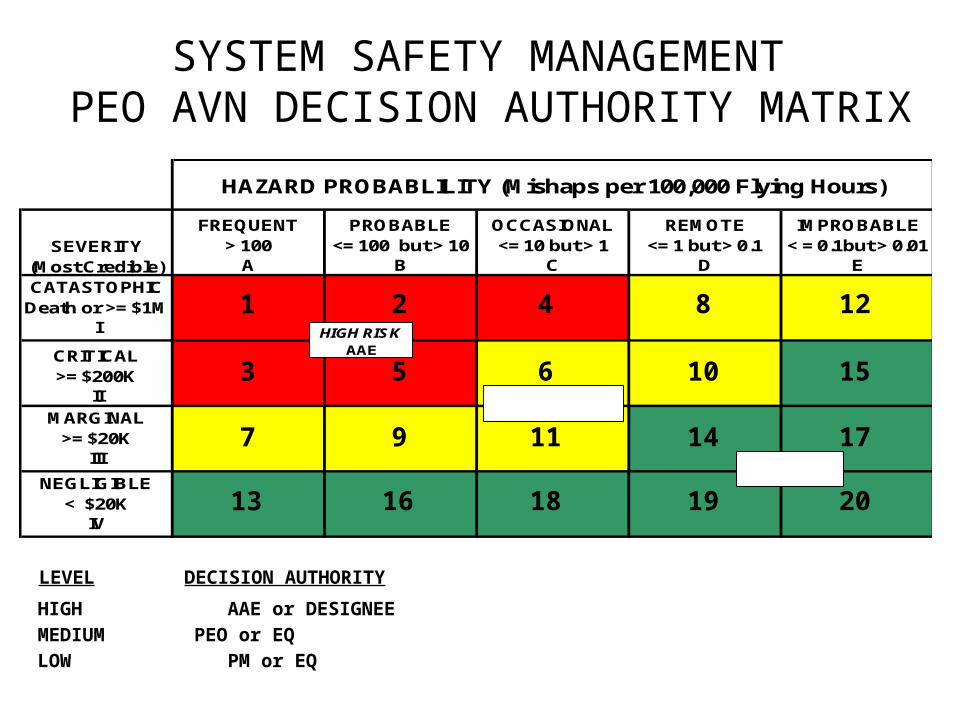
SYSTEM SAFETY MANAGEMENT PEO AVN DECISION AUTHORITY MATRIX
SEVERITY (Most Credible)
FREQUENT > 100
A
PROBABLE <= 100 but > 10
B
OCCASIONAL <= 10 but > 1
C
REMOTE <= 1 but > 0.1
D
IMPROBABLE < = 0.1but > 0.01
E
CATASTOPHIC Death or >= $1M
I
CRITICAL >= $200K
II
MARGINAL >= $20K
III
NEGLIGIBLE < $20K
IV
HAZARD PROBABLILITY (Mishaps per 100,000 Flying Hours)
HIGH RISKAAE
MEDIUM RISKPEO
LOW RISKPM
LEVEL DECISION AUTHORITY
HIGH AAE or DESIGNEE
MEDIUM PEO or EQLOW PM or EQ
1 2 4 8 12
3 5 6 10 15
7 9 11 14 17
13 16 18 19 20
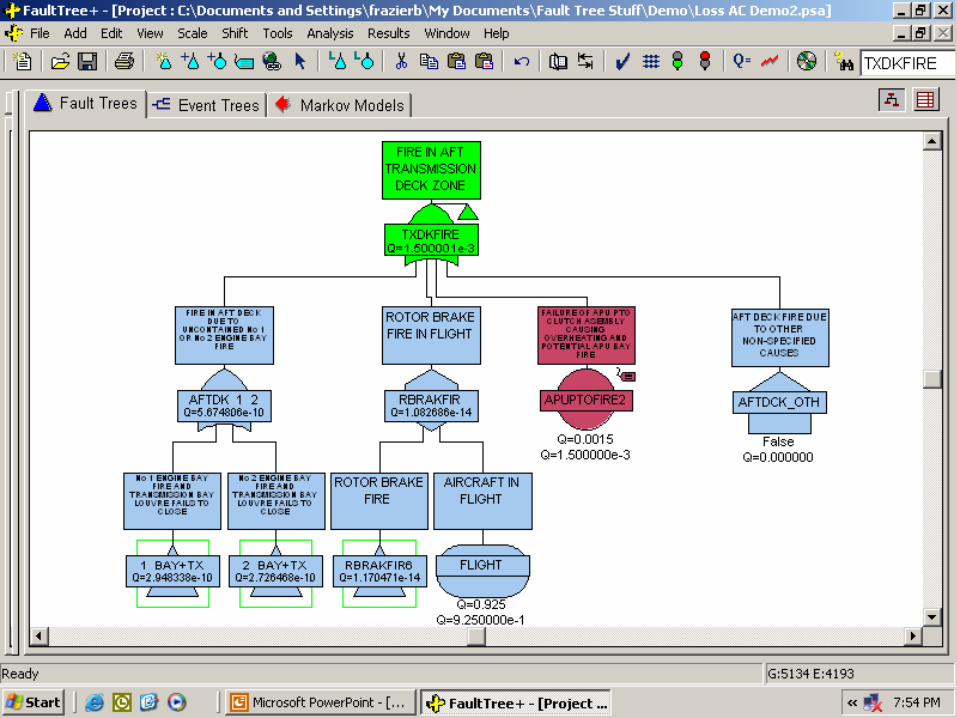
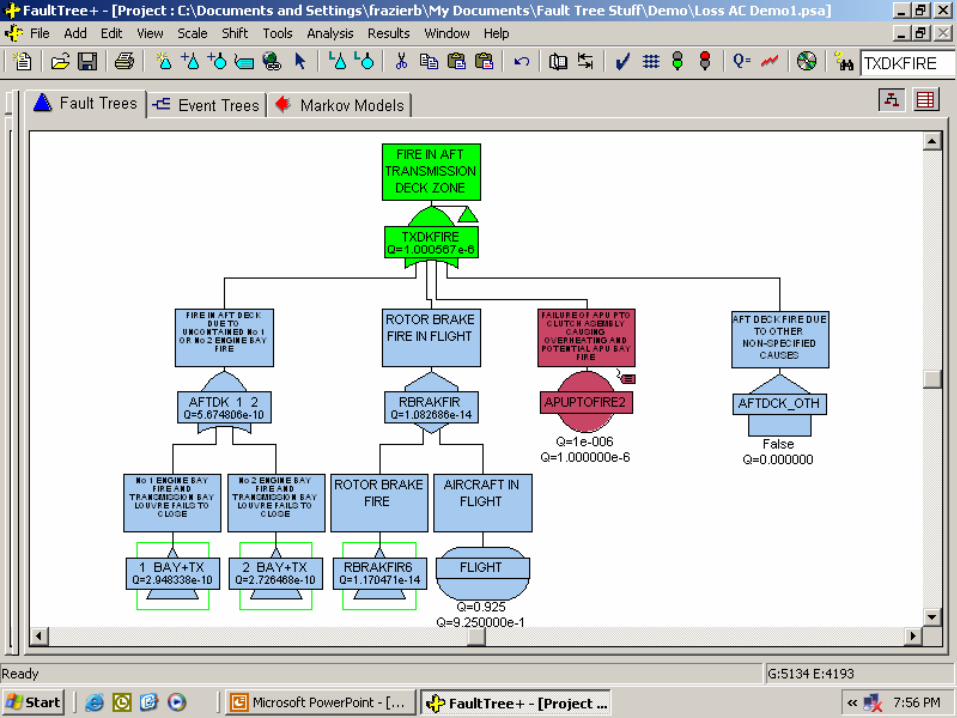
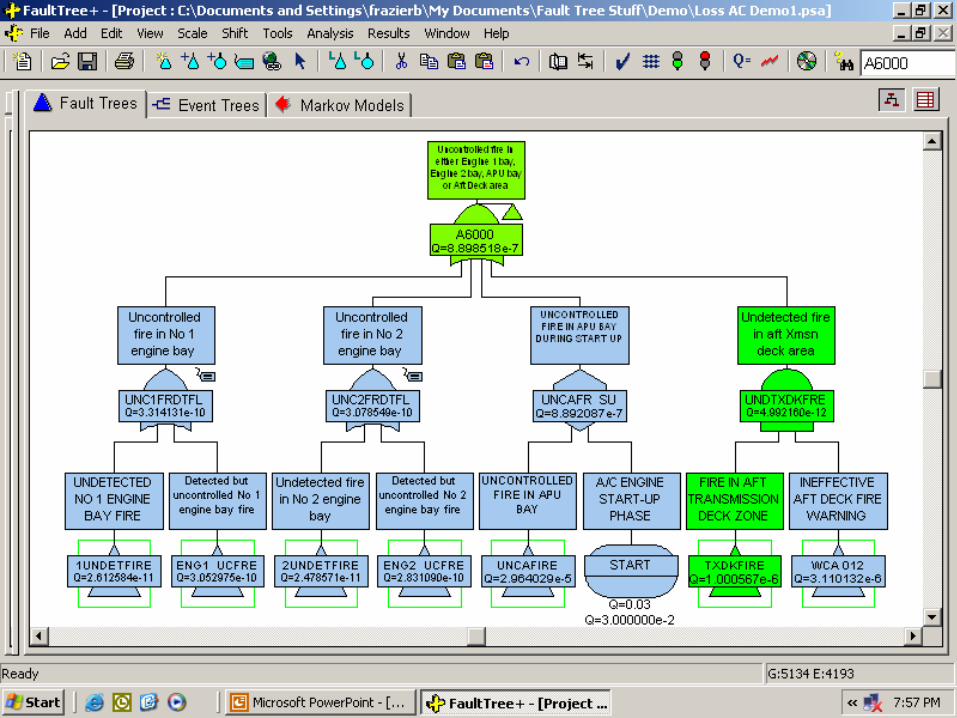
EXAMPLE CASE STUDY
Auxiliary Power Unit (APU) Power Takeoff Clutch (PTC)


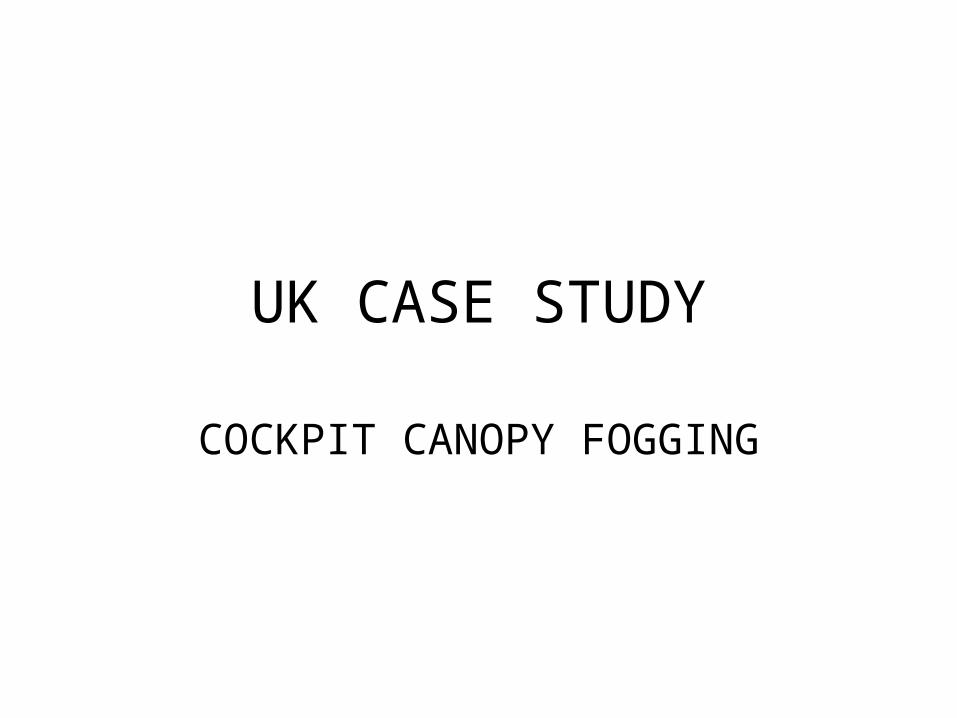
UK CASE STUDY
COCKPIT CANOPY FOGGING
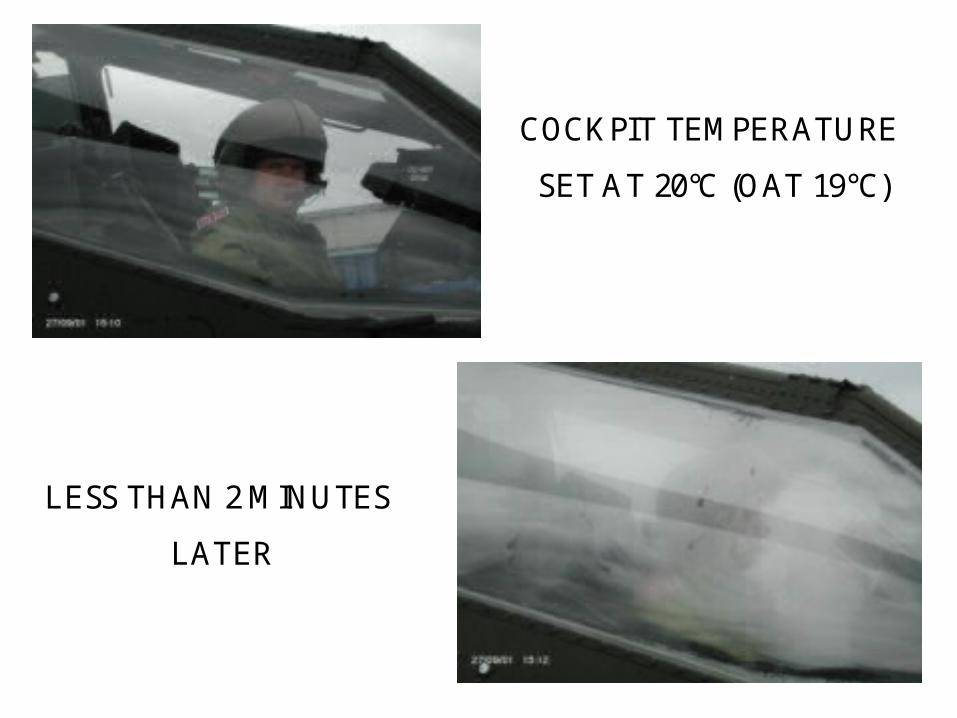
COCKPIT TEMPERATURE
SET AT 20°C (OAT 19°C)
LESS THAN 2 MINUTES
LATER
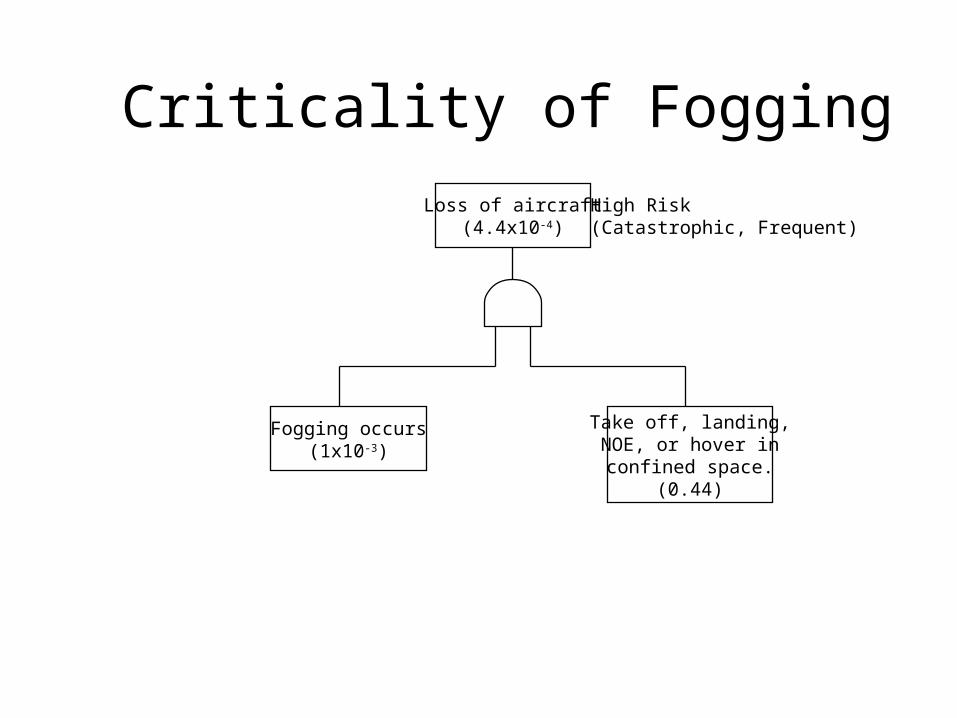
Criticality of Fogging
Loss of aircraft(4.4x10⁻⁴)
Fogging occurs(1x10⁻³)
Take off, landing,NOE, or hover inconfined space.
(0.44)
High Risk(Catastrophic, Frequent)
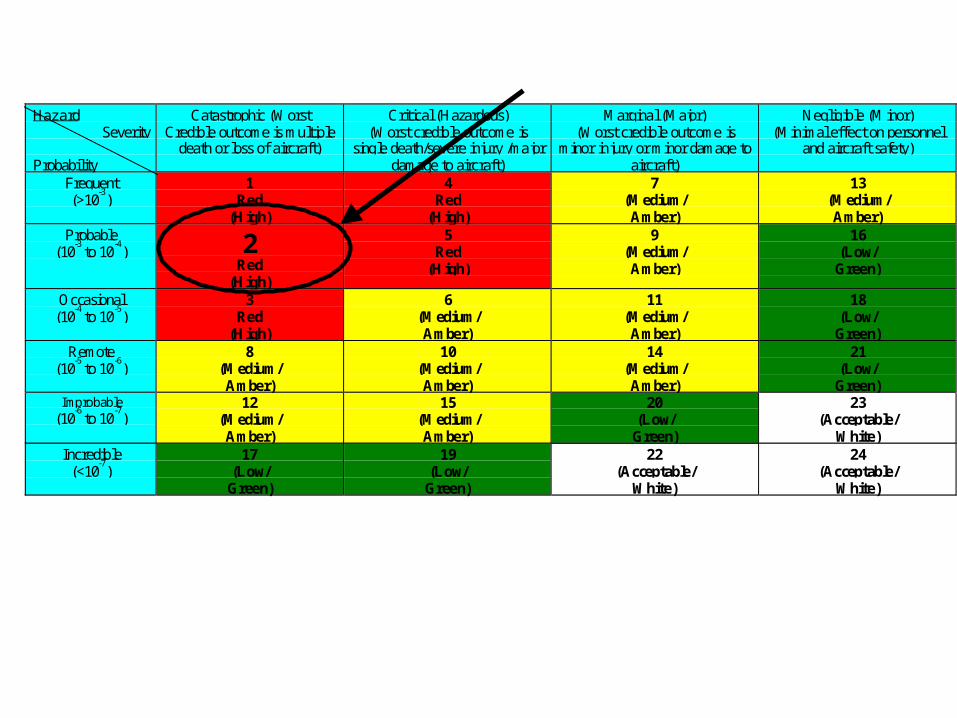
HazardSeverity
Probability
Catastrophic (WorstCredible outcome is multiple
death or loss of aircraft)
Critical (Hazardous)(Worst credible outcome is
single death/severe injury /majordamage to aircraft)
Marginal (Major)(Worst credible outcome is
minor injury or minor damage toaircraft)
Negligible (Minor)(Minimal effect on personnel
and aircraft safety)
Frequent(>10
-3)
1Red
(High)
4Red
(High)
7(Medium/Amber)
13(Medium/Amber)
Probable(10
-3 to 10
-4) 2
Red(High)
5Red
(High)
9(Medium/Amber)
16(Low/
Green)
Occasional(10
-4 to 10
-5)
3Red
(High)
6(Medium/Amber)
11(Medium/Amber)
18(Low/
Green)Remote
(10-5
to 10-6
)8
(Medium/Amber)
10(Medium/Amber)
14(Medium/Amber)
21(Low/
Green)Improbable
(10-6
to 10-7
)12
(Medium/Amber)
15(Medium/Amber)
20(Low/
Green)
23(Acceptable/
White)Incredible
(<10-7
)17
(Low/Green)
19(Low/
Green)
22(Acceptable/
White)
24(Acceptable/
White)
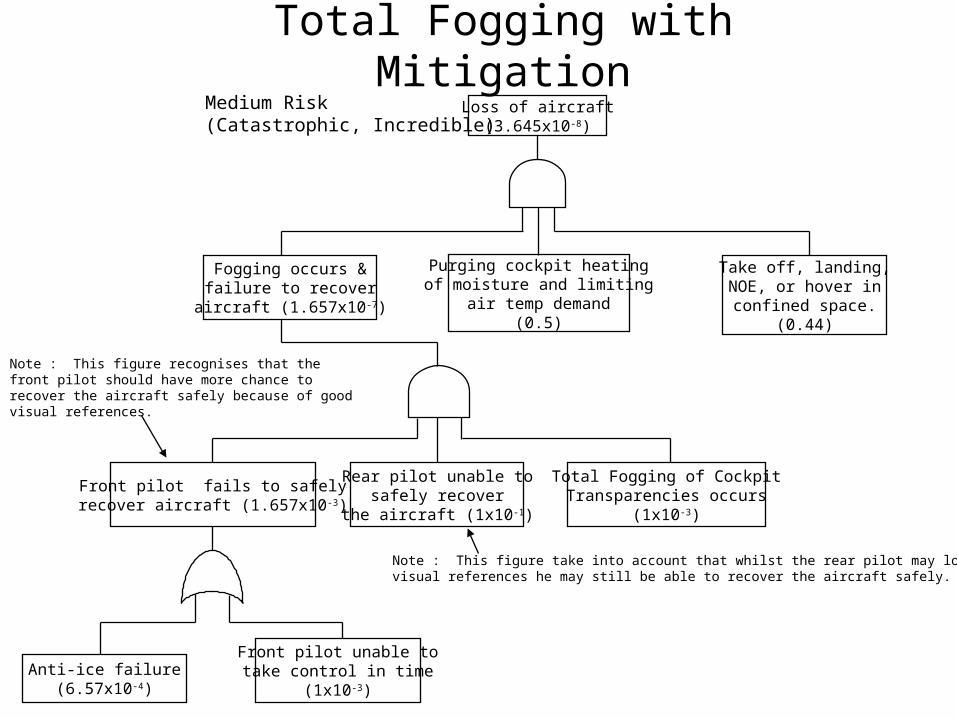
Total Fogging with MitigationLoss of aircraft
(3.645x10⁻⁸)
Fogging occurs &failure to recover
aircraft (1.657x10⁻⁷)
Take off, landing,NOE, or hover inconfined space.
(0.44)
Medium Risk(Catastrophic, Incredible)
Front pilot fails to safelyrecover aircraft (1.657x10⁻³)
Total Fogging of CockpitTransparencies occurs
(1x10⁻³)
Anti-ice failure(6.57x10⁻⁴)
Front pilot unable totake control in time
(1x10⁻³)
Purging cockpit heatingof moisture and limiting
air temp demand(0.5)
Rear pilot unable tosafely recover
the aircraft (1x10⁻¹)
Note : This figure take into account that whilst the rear pilot may losevisual references he may still be able to recover the aircraft safely.
Note : This figure recognises that the front pilot should have more chance to recover the aircraft safely because of good visual references.
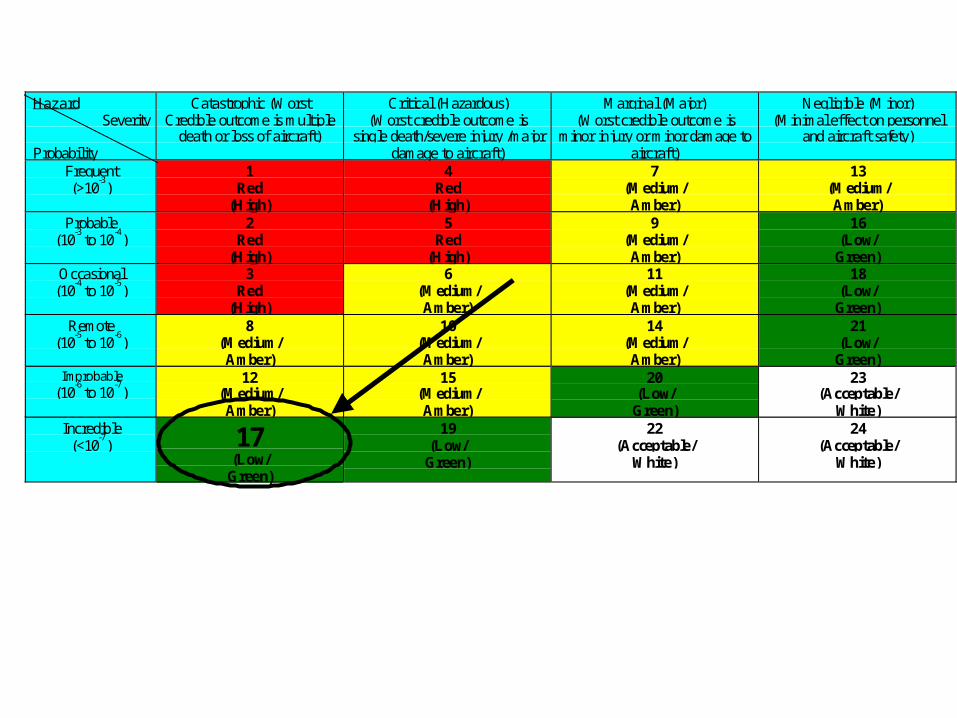
HazardSeverity
Probability
Catastrophic (WorstCredible outcome is multiple
death or loss of aircraft)
Critical (Hazardous)(Worst credible outcome is
single death/severe injury /majordamage to aircraft)
Marginal (Major)(Worst credible outcome is
minor injury or minor damage toaircraft)
Negligible (Minor)(Minimal effect on personnel
and aircraft safety)
Frequent(>10
-3)
1Red
(High)
4Red
(High)
7(Medium/Amber)
13(Medium/Amber)
Probable(10
-3 to 10
-4)
2Red
(High)
5Red
(High)
9(Medium/Amber)
16(Low/
Green)Occasional
(10-4
to 10-5
)3
Red(High)
6(Medium/Amber)
11(Medium/Amber)
18(Low/
Green)Remote
(10-5
to 10-6
)8
(Medium/Amber)
10(Medium/Amber)
14(Medium/Amber)
21(Low/
Green)Improbable
(10-6
to 10-7
)12
(Medium/Amber)
15(Medium/Amber)
20(Low/
Green)
23(Acceptable/
White)Incredible
(<10-7
) 17(Low/
Green)
19(Low/
Green)
22(Acceptable/
White)
24(Acceptable/
White)
Any Questions?