Embed Size (px)
Citation preview
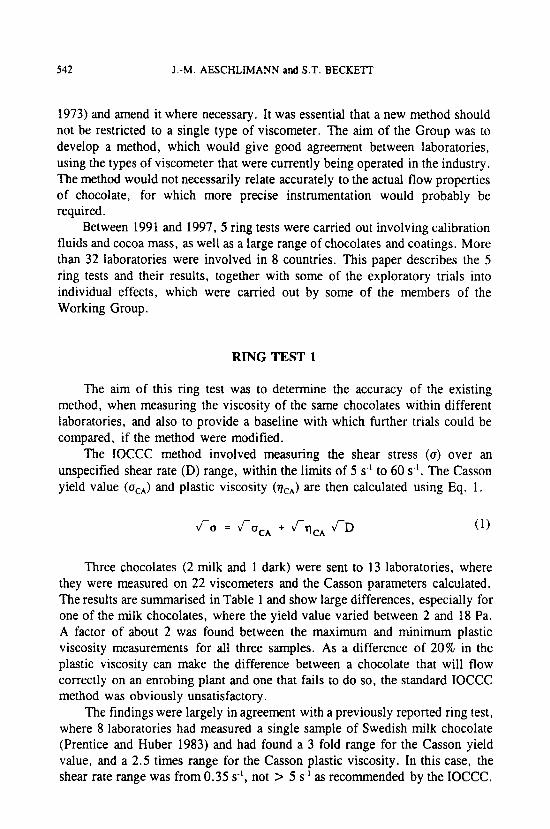
INTERNATIONAL INTER-LABORATORY TRIALS TO DETERMINE THE FACTORS AFFECTING THE MEASUREMENT OF CHOCOLATE VISCOSITY
J.-M. AESCHLIMANN and S.T. BECKETT'
Nestle PTC York Haxby Road
York, YO91 IXY, United Kingdom
(Manuscript received December 22, 1999; accepted for Publication October 14, 2000)
ABSTRACT
The working group of the International mce of Cocoa, Chocolate and Sugar Confectionery (IOCCC) pevormed a sequence ofjive ring tests to improve the agreement of the standard method for measuring viscosity of chocolate between laboratories. Repofling shear stress measurements instead of using the Casson equation improved the agreement, as did standardising the method of cleaning the concentric cylinder and calibrating the viscometers. In the revised method, the standard deviation for shear stress measurement at shear rates greater than 5 &from 23 laboratories was less than 8%. However, the Casson yield values had a seven-fold range and the Casson plastic viscosity a two-fold range, which was unacceptably high. A new method (IOCCC 2000) has been published as a result of this work and is available from CAOBISCO in Bruxelles, Belgium.
INTRODUCTION
The manufacture of chocolate involves the use of very expensive, but high throughput machinery (Beckett 1999). This has resulted in chocolate now being manufactured at a limited number of factories, before being transported, either in liquid or solid form, to other locations. For good quality products and accurate weight control, this chocolate must have the correct viscosity. For this and for legal contract reasons (where chocolate is supplied to another company) it is desirable to have a method of measuring chocolate viscosity that has a high level of reproducibility.
In 1991 the IOCCC (International Office of Cocoa, Chocolate and Sugar Confectionery) created a Working Group to evaluate its current method (IOCCC
' Dr. S.T. Becken is the corresponding author.
Journal of Texture Studies 31 (2000) 541-576. All Rights Reserved. OCbpyright 2000 by Food & Nutrition Press, Inc.. Trumbuli, Connecticut. 54 1
542 J.-M. AESCHLIMANN and S.T. BECKETT
1973) and amend it where necessary. It was essential that a new method should not be restricted to a single type of viscometer. The aim of the Group was to develop a method, which would give good agreement between laboratories, using the types of viscometer that were currently being operated in the industry. The method would not necessarily relate accurately to the actual flow properties of chocolate, for which more precise instrumentation would probably be required.
Between 1991 and 1997, 5 ring tests were carried out involving calibration fluids and cocoa mass, as well as a large range of chocolates and coatings. More than 32 laboratories were involved in 8 countries. This paper describes the 5 ring tests and their results, together with some of the exploratory trials into individual effects, which were carried out by some of the members of the Working Group.
RING TEST 1
The aim of this ring test was to determine the accuracy of the existing method, when measuring the viscosity of the same chocolates within different laboratories, and also to provide a baseline with which further trials could be compared, if the method were modified.
The IOCCC method involved measuring the shear stress (a) over an unspecified shear rate (D) range, within the limits of 5 s-’ to 60 s’. The Casson yield value (acA) and plastic viscosity (q,--) are then calculated using Eq. 1.
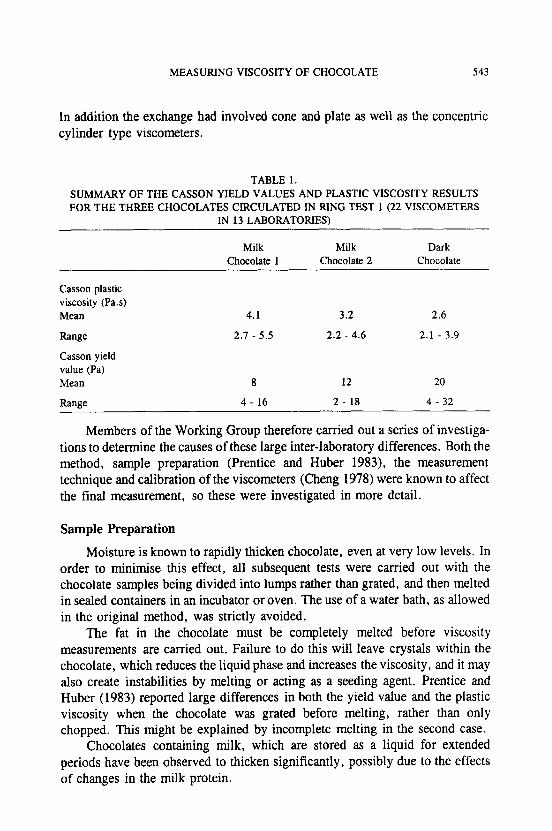
Three chocolates (2 milk and 1 dark) were sent to 13 laboratories, where they were measured on 22 viscometers and the Casson parameters calculated. The results are summarised in Table 1 and show large differences, especially for one of the milk chocolates, where the yield value varied between 2 and 18 Pa. A factor of about 2 was found between the maximum and minimum plastic viscosity measurements for all three samples. As a difference of 20% in the plastic viscosity can make the difference between a chocolate that will flow correctly on an enrobing plant and one that fails to do so, the standard IOCCC method was obviously unsatisfactory.
The findings were largely in agreement with a previously reported ring test, where 8 laboratories had measured a single sample of Swedish milk chocolate (Prentice and Huber 1983) and had found a 3 fold range for the Casson yield value, and a 2.5 times range for the Casson plastic viscosity. In this case, the shear rate range was from 0.35 s-’, not > 5 s-’ as recommended by the IOCCC.
MEASURING VISCOSITY OF CHOCOLATE 543
In addition the exchange had involved cone and plate as well as the concentric cylinder type viscometers.
TABLE 1 . SUMMARY OF THE CASSON YIELD VALUES AND PLASTIC VISCOSITY RESULTS FOR THE THREE CHOCOLATES CIRCULATED IN RING TEST 1 (22 VISCOMETERS
IN 13 LABORATORIES)
Milk Milk Dark Chocolate 1 Chocolate 2 Chocolate
Casson plastic viscosity (Pas) Mean 4.1 3.2 2.6
Range 2.1 - 5.5 2.2 - 4.6 2.1 - 3.9
Casson yield value (Pa) Mean 8 12 20
Range 4 - 16 2 - 18 4 - 32
Members of the Working Group therefore carried out a series of investiga- tions to determine the causes of these large inter-laboratory differences. Both the method, sample preparation (Prentice and Huber 1983), the measurement technique and calibration of the viscometers (Cheng 1978) were known to affect the final measurement, so these were investigated in more detail.
Sample Preparation
Moisture is known to rapidly thicken chocolate, even at very low levels. In order to minimise this effect, all subsequent tests were carried out with the chocolate samples being divided into lumps rather than grated, and then melted in sealed containers in an incubator or oven. The use of a water bath, as allowed in the original method, was strictly avoided.
The fat in the chocolate must be completely melted before viscosity measurements are carried out. Failure to do this will leave crystals within the chocolate, which reduces the liquid phase and increases the viscosity, and it may also create instabilities by melting or acting as a seeding agent. Prentice and Huber (1983) reported large differences in both the yield value and the plastic viscosity when the chocolate was grated before melting, rather than only chopped. This might be explained by incomplete melting in the second case.
Chocolates containing milk, which are stored as a liquid for extended periods have been observed to thicken significantly, possibly due to the effects of changes in the milk protein.
544 J.-M. AESCHLIMANN and S.T. BECKETT
Two sets of experiments were therefore carried out, (1) determine how long a sample must be stored at 50C to ensure that all the sample is at this tempera- ture, (2) determine the effect on the viscosity of different types of chocolate when being stored at this temperature.
Determination of Melting Time. The 100 g samples of chocolate at room temperature were placed in two different ventilated ovens, which were set to 52C. It took between 60 and 75 min for the chocolate to reach 50C. The Working Group therefore recommended that any solid chocolate sample, or one that had been tempered or cooled below 40C, should be placed in an oven at 52C for a minimum of 75 min before a viscosity measurement is carried out.
Determination of the Maximum Storage Time at Elevated Temperature. Four members of the Working Group placed their own chocolates and coatings (dark, milk and white) in an oven and then carried out viscosity measurements at 0.5, 1, 3 , and 5 or 8 hours after the chocolate had reached 50C. There was almost no change in Casson plastic viscosity and yield values for dark chocolate. For the white chocolates two laboratories reported very large increases in both parameters, while one reported no change (this may be a recipe effect, as the chocolates were different). For milk chocolate small ( C 10%) changes in Casson plastic viscosity were reported, but only one laboratory found a change in Casson yield value.
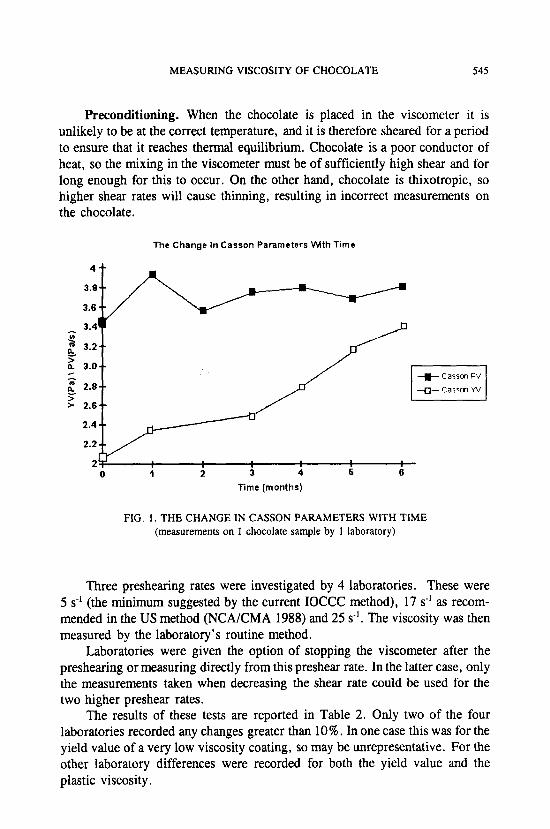
It was therefore recommended that milk chocolates should only be melted for a maximum of 2 or 3 h before the measurement is taken. A lower oven temperature may be required for white chocolates, which are more heat sensitive. Even in the solid state the viscosity of the chocolate will change. Figure 1 shows the Casson yield value and plastic viscosity of a milk chocolate, which was stored at 15C and then measured at monthly intervals. There was a tendency for both parameters to increase, but the effect was much bigger for the Casson yield value. The degree of thickening is probably temperature related.
Effect of Measuring Conditions
There are many factors that can affect the viscosity measurement. Several, such as the make of the viscometer and the type of measuring system (bob and cylinder), which were reported to have an effect (Cheng 1978 and Franke 1998) were easier to evaluate during ring tests, because of the many different types it was then possible to compare. Other factors, such as the effect of the precondi- tioning of the chocolate within the viscometer, the length of time over which the measurement is taken and the effect of small differences in temperature were all evaluated by individual members of the Working Group.
MEASURING VISCOSITY OF CHOCOLATE 545
Preconditioning. When the chocolate is placed in the viscometer it is unlikely to be at the correct temperature, and it is therefore sheared for a period to ensure that it reaches thermal equilibrium. Chocolate is a poor conductor of heat, so the mixing in the viscometer must be of sufficiently high shear and for long enough for this to occur. On the other hand, chocolate is thixotropic, so higher shear rates will cause thinning, resulting in incorrect measurements on the chocolate.
The Change In Casson Parameters M t h Time
I ' 3.2.- P > n 3.0--
a" 2.8.- F
2.6.-
/
0 I 2 3 4 5 6
Time (months)
FIG. 1. THE CHANGE IN CASSON PARAMETERS WITH TIME (measurements on 1 chocolate sample by 1 laboratory)
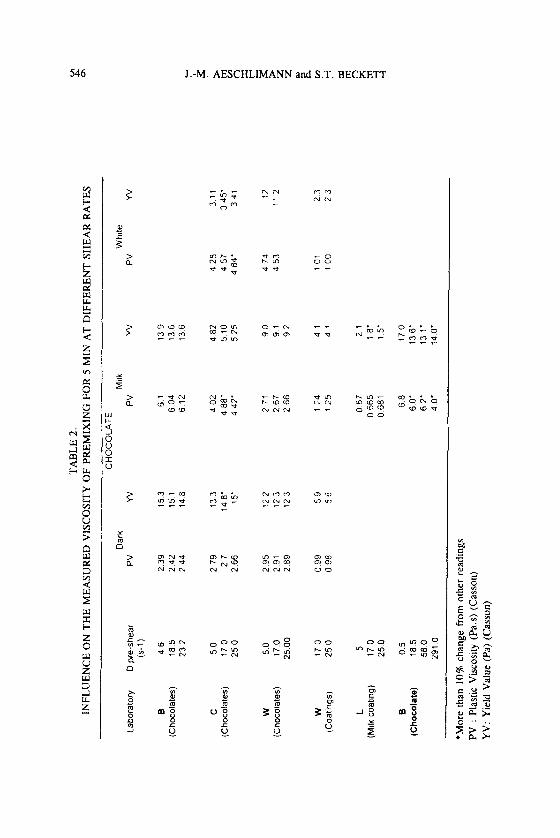
Three preshearing rates were investigated by 4 laboratories. These were 5 s-' (the minimum suggested by the current IOCCC method), 17 s-' as recom- mended in the US method (NCAKMA 1988) and 25 s-'. The viscosity was then measured by the laboratory's routine method.
Laboratories were given the option of stopping the viscometer after the preshearing or measuring directly from this preshear rate. In the latter case, only the measurements taken when decreasing the shear rate could be used for the two higher preshear rates.
The results of these tests are reported in Table 2. Only two of the four laboratories recorded any changes greater than 10%. In one case this was for the yield value of a very low viscosity coating, so may be unrepresentative. For the other laboratory differences were recorded for both the yield value and the plastic viscosity.
TA
BL
E 2
. IN
FLU
ENC
E O
N T
HE
ME
ASU
RE
D V
ISC
OSI
TY O
F PR
EMIX
ING
FO
R 5
MIN
AT
DIF
FER
ENT
SHEA
R R
ATE
S
CH
OC
OLA
TE
Labo
rato
ry
B (C
hoco
late
s)
C (C
hoco
late
s)
W
(Cho
cola
tes)
W
(Coa
tings
)
L (M
ilk c
oatin
g)
B
(Cho
cola
te)
D p
re-s
hear
(S
-1)
46
18
5
23
2
50
17
0
25 0
50
17
0
25 0
0
17 0
25
0
5 17
0
25 0
05
18
5
58 0
29
1 0
Dar
k P
V
w
2 39
15
3
2 42
15
1
2 44
14
8
2 79
13
3
27
14
8'
2 66
15
'
2 95
12
2
2 91
12
3
2 89
12
3
0 99
5
9
0 98
5
6
Milk
P
V
61
6
04
6
12
4 0
2
4 88
' 4
42'
2 71
2
67
2
66
12
4
12
5
0 6
7
0 6
65
0
681
68
6
0' 6
2'
4 0'
Whi
le
W
PV
w
13 9
13
6
13 6
4 82
5
10
5 25
90
9
1
92
41
4
1
21
1
8'
1 5'
17 0
13
6'
13 1
' 14
0'
4 28
4
57
4 84
'
4 74
4
53
10
1
1 00
3 11
3
45'
3 4
1
12
11 2
23
2
3
W
*Mor
e th
an 1
0% ch
ange
fro
m o
ther
rea
ding
s PV
: P
last
ic V
iscos
ity (
Pas
) (C
asso
n)
YV
: Y
ield
Val
ue (P
a) (
Cas
son)
MEASURING VISCOSITY OF CHOCOLATE 541
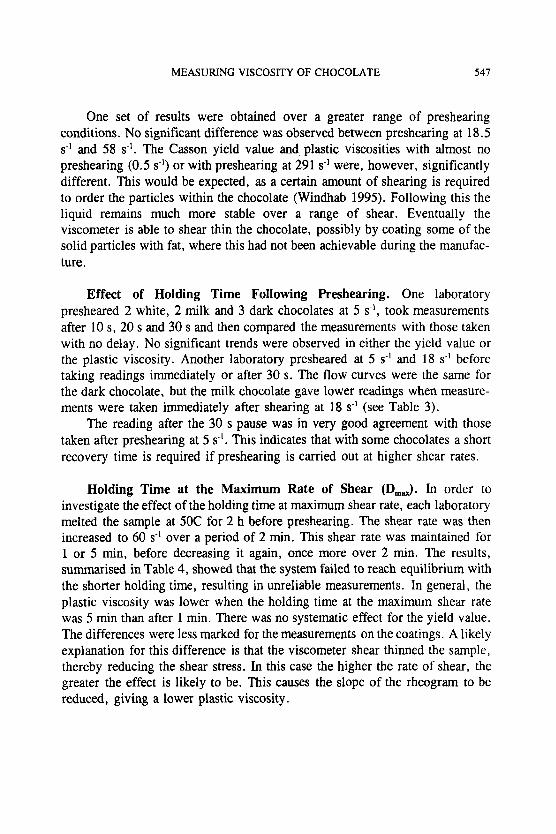
One set of results were obtained over a greater range of preshearing conditions. No significant difference was observed between preshearing at 18.5 s-l and 58 s-I. The Casson yield value and, plastic viscosities with almost no preshearing (0.5 s-') or with preshearing at 291 s.] were, however, significantly different. This would be expected, as a certain amount of shearing is required to order the particles within the chocolate (Windhab 1995). Following this the liquid remains much more stable over a range of shear. Eventually the viscometer is able to shear thin the chocolate, possibly by coating some of the solid particles with fat, where this had not been achievable during the manufac- ture.
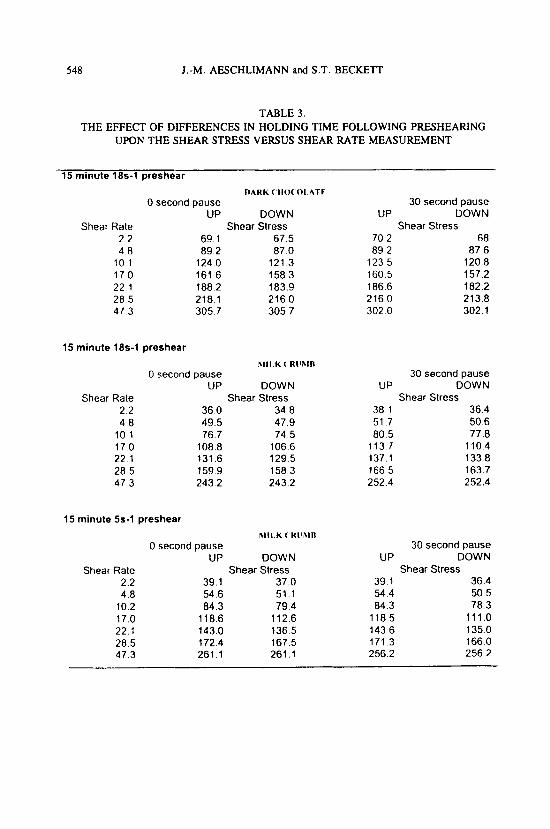
Effect of Holding Time Following Preshearing. One laboratory presheared 2 white, 2 milk and 3 dark chocolates at 5 s-', took measurements after 10 s, 20 s and 30 s and then compared the measurements with those taken with no delay. No significant trends were observed in either the yield value or the plastic viscosity. Another laboratory presheared at 5 s-' and 18 s-' before taking readings immediately or after 30 s. The flow curves were the same for the dark chocolate, but the milk chocolate gave lower readings when measure- ments were taken immediately after shearing at 18 s-' (see Table 3).
The reading after the 30 s pause was in very good agreement with those taken after preshearing at 5 s'. This indicates that with some chocolates a short recovery time is required if preshearing is carried out at higher shear rates.
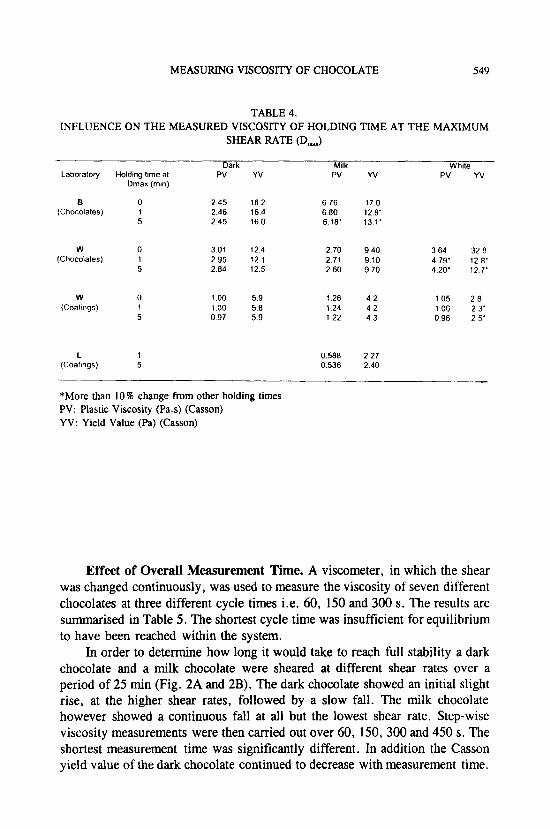
Holding Time at the Maximum Rate of Shear (D,d. In order to investigate the effect of the holding time at maximum shear rate, each laboratory melted the sample at 50C for 2 h before preshearing. The shear rate was then increased to 60 s-' over a period of 2 min. This shear rate was maintained for 1 or 5 min, before decreasing it again, once more over 2 min. The results, summarised in Table 4, showed that the system failed to reach equilibrium with the shorter holding time, resulting in unreliable measurements. In general, the plastic viscosity was lower when the holding time at the maximum shear rate was 5 min than after 1 min. There was no systematic effect for the yield value. The differences were less marked for the measurements on the coatings. A likely explanation for this difference is that the viscometer shear thinned the sample, thereby reducing the shear stress. In this case the higher the rate of shear, the greater the effect is likely to be. This causes the slope of the rheogram to be reduced, giving a lower plastic viscosity.
548 J.-M. AESCHLIMANN and S.T. BECKETT
TABLE 3 . THE EFFECT OF DIFFERENCES IN HOLDING TIME FOLLOWING PRESHEARING
UPON THE SHEAR STRESS VERSUS SHEAR RATE MEASUREMENT
15 minute 18s-1 preshear DARK ( HO( 0 1 ATF
0 second pause
Shear Rate Shear Stress UP DOWN
2 2 69 1 67 5 4 8 89 2 87 0
10 1 124 0 121 3 17 0 161 6 158 3 22 1 188 2 183 9 28 5 218 1 216 0 47 3 305 7 305 7
15 minute 18s-I preshear
\ l i l K ( RlIhlR 0 second pause
Shear Rate Shear Stress UP DOWN
2 2 36 0 34 8 4 8 49 5 47 9
10 1 76 7 74 5 17 0 108 8 106 6 22 1 131 6 129 5 28 5 159 9 158 3 47 3 243 2 243 2
30 second pause UP DOWN
Shear Stress 70 2 68 89 2 87 6
123 5 120 8 160 5 157 2 186 6 182 2 216 0 213 8 302 0 302 1
30secondpause UP DOWN
Shear Stress 38 1 36 4 51 7 50 6 80 5 77.8
113 7 1104 137 1 133 8 166 5 163 7 252 4 2 52.4
15 minute 55-1 preshear hl l l K ( R ~ ' 3 l B
Osecondpause 30secondpause UP DOWN UP DOWN
2 2 39 1 37 0 39 1 36 4 4 8 54 6 51 1 5 4 4 50 5
10 2 84 3 79 4 84 3 78 3 17 0 1186 112 6 1185 111 0 22 1 143 0 136 5 143 6 135 0 28 5 172 4 167 5 171 3 166 0 47 3 261 1 261 I 256 2 256 2
Shear Rate Shear Stress Shear Stress
MEASURING VISCOSITY OF CHOCOLATE 549
TABLE 4. INFLUENCE ON THE MEASURED VISCOSITY OF HOLDING TIME AT THE MAXIMUM
SHEAR RATE (DmJ
Dark Milk White Laboratory Holding time at PV w PV w PV w
Dmax (min)
B 0 245 162 676 170 (Chocolates) 1 246 164 680 128.
5 245 160 618' 131'
W 0 (Chocolates) 1
5
2 70 940 301 124 295 12 1 271 910
260 970 284 125
W 0 100 5 9
5 097 5 9 (Coahngs) 1 100 5 a
126 4 2 124 4 2 122 4 3
364 32 a 4 79- 12 a* 4 2 0 ' 12 7'
105 2 a 106 23' 096 25 '
L 1 0588 227 (Coatings) 5 0.536 240
*More than 10 76 change from other holding times PV: Plastic Viscosity (Pas) (Casson) YV: Yield Value (Pa) (Casson)
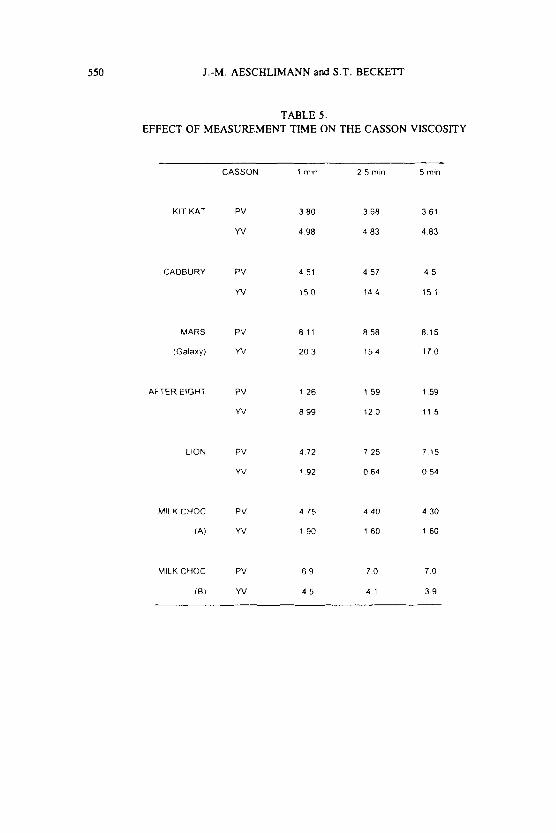
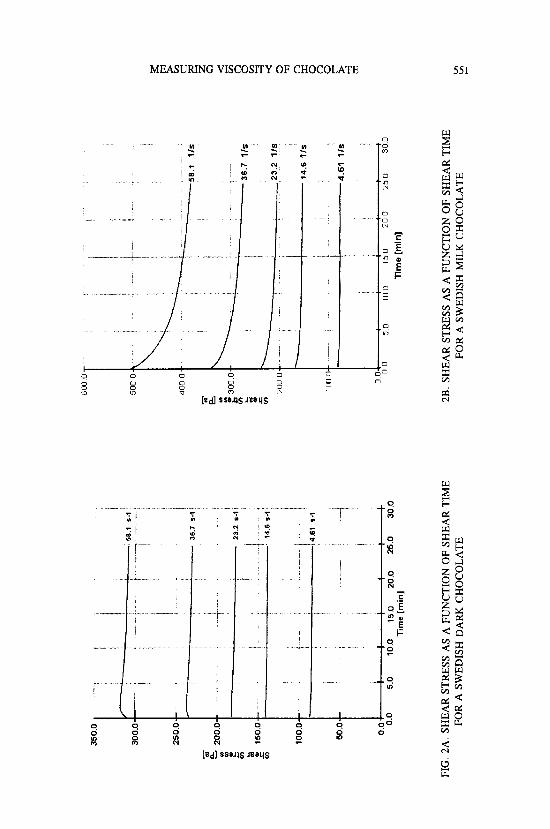
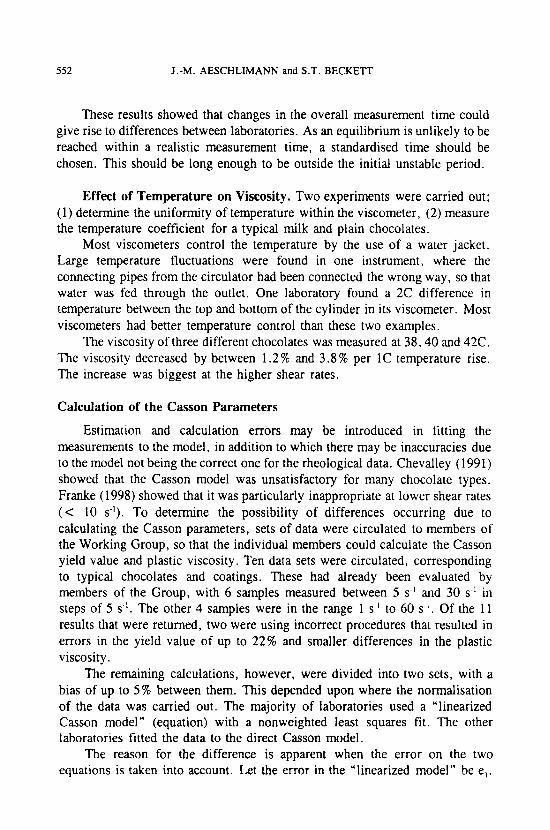
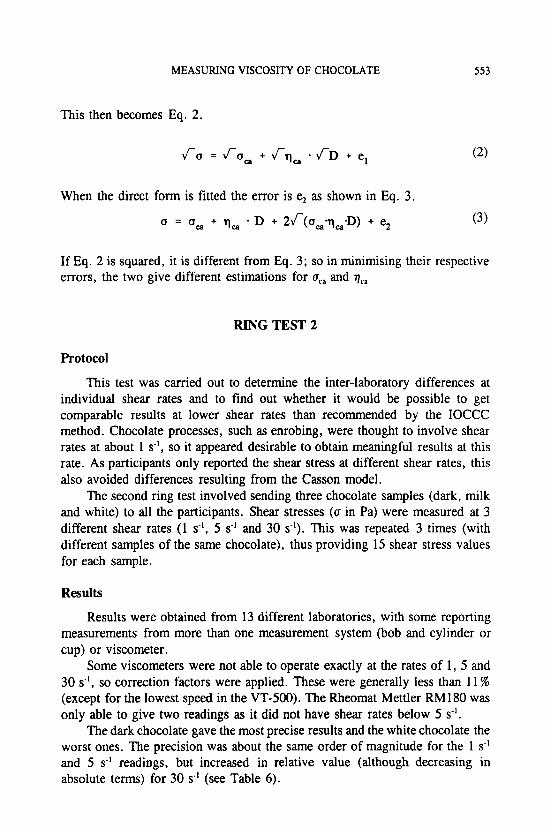
Effect of Overall Measurement Time. A viscometer, in which the shear was changed continuously, was used to measure the viscosity of seven different chocolates at three different cycle times i.e. 60, 150 and 300 s. The results are summarised in Table 5 . The shortest cycle time was insufficient for equilibrium to have been reached within the system.
In order to determine how long it would take to reach full stability a dark chocolate and a milk chocolate were sheared at different shear rates over a period of 25 min (Fig. 2A and 2B). The dark chocolate showed an initial slight rise, at the higher shear rates, followed by a slow fall. The milk chocolate however showed a continuous fall at all but the lowest shear rate. Step-wise viscosity measurements were then carried out over 60, 150, 300 and 450 s. The shortest measurement time was significantly different. In addition the Casson yield value of the dark chocolate continued to decrease with measurement time.
550 J.-M. AESCHLIMANN and S.T. BECKETT
TABLE 5 . EFFECT OF MEASUREMENT TIME ON THE CASSON VISCOSITY
KIT KAT
CADBURY
MARS
IGalaxy)
AFTER EIGHT
LION
MILK CHOC
(A)
MILK CHOC
(6)
CASSON
PV
W
PV
W
PV
W
PV
W
PV
W
PV
W
PV
W
1 rnin
3 80
4 98
4 51
1 5 0
8 1 1
20 3
I 2 6
8 99
4 72
1 9 2
4 75
1 9 0
6 9
4 5
2 5 min
3 68
4 83
4 57
14 4
8 58
154
1 5 9
12 0
7 25
0 64
4 4 0
1 6 0
7 0
4 1
5 min
3 61
4 a3
4 5
15 1
8 15
1 7 0
1 59
11 5
7 15
0 54
4 30
160
7 0
3 9
350.0
I -
7
I
I
I ,
36.7
5
-1 I i
25
0 0
50
0.
0.
0 00
5
0
10
0 T
ime 15
0
[min
] 2
00
2
50
300
FIG
. 2A
. SH
EAR
STR
ESS
AS
A F
UN
CTI
ON
OF
SHE
AR
TIM
E FO
R A
SW
EDIS
H D
AR
K C
HO
CO
LATE
I
00
L
i +
00
50
10
0
15
0
20
0
25
0
300
lim
e [m
in]
2B. S
HEA
R S
TRES
S A
S A
FU
NC
TIO
N O
F SH
EA
R T
IME
FOR
A S
WED
ISH
MIL
K C
HO
CO
LATE
552 J.-M. AESCHLIMANN and S.T. BECKETT
These results showed that changes in the overall measurement time could give rise to differences between laboratories. As an equilibrium is unlikely to be reached within a realistic measurement time, a standardised time should be chosen. This should be long enough to be outside the initial unstable period.
Effect of Temperature on Viscosity. Two experiments were carried out; (1) determine the uniformity of temperature within the viscometer, (2) measure the temperature coefficient for a typical milk and plain chocolates.
Most viscometers control the temperature by the use of a water jacket. Large temperature fluctuations were found in one instrument, where the connecting pipes from the circulator had been connected the wrong way, so that water was fed through the outlet. One laboratory found a 2C difference in temperature between the top and bottom of the cylinder in its viscometer. Most viscometers had better temperature control than these two examples.
The viscosity of three different chocolates was measured at 38.40 and 42C. The viscosity decreased by between 1.2% and 3.8% per 1C temperature rise. The increase was biggest at the higher shear rates.
Calculation of the Casson Parameters
Estimation and calculation errors may be introduced in fitting the measurements to the model, in addition to which there may be inaccuracies due to the model not being the correct one for the rheological data. Chevalley (1991) showed that the Casson model was unsatisfactory for many chocolate types. Franke (1998) showed that it was particularly inappropriate at lower shear rates (< 10 s-I). To determine the possibility of differences occurring due to calculating the Casson parameters, sets of data were circulated to members of the Working Group, so that the individual members could calculate the Casson yield value and plastic viscosity. Ten data sets were circulated, corresponding to typical chocolates and coatings. These had already been evaluated by members of the Group, with 6 samples measured between 5 s-I and 30 s-I in steps of 5 s-’. The other 4 samples were in the range 1 s-’ to 60 s.‘. Of the 11 results that were returned, two were using incorrect procedures that resulted in errors in the yield value of up to 22% and smaller differences in the plastic viscosity.
The remaining calculations, however, were divided into two sets, with a bias of up to 5% between them. This depended upon where the normalisation of the data was carried out. The majority of laboratories used a “linearized Casson model” (equation) with a nonweighted least squares fit. The other laboratories fitted the data to the direct Casson model.
The reason for the difference is apparent when the error on the two equations is taken into account. Let the error in the “linearized model” be e l .
MEASURING VISCOSITY OF CHOCOLATE 553
This then becomes Eq. 2.
When the direct form is fitted the error is e, as shown in Eq. 3.
o = uca + qa - D + 24-(aca-qc,.D) + e2 (3)
If Eq. 2 is squared, it is different from Eq. 3; so in minimising their respective errors, the two give different estimations for a,, and q,,
RING TEST 2
Protocol
This test was carried out to determine the inter-laboratory differences at individual shear rates and to find out whether it would be possible to get comparable results at lower shear rates than recommended by the IOCCC method. Chocolate processes, such as enrobing, were thought to involve shear rates at about 1 s-', so it appeared desirable to obtain meaningful results at this rate. As participants only reported the shear stress at different shear rates, this also avoided differences resulting from the Casson model.
The second ring test involved sending three chocolate samples (dark, milk and white) to all the participants. Shear stresses (a in Pa) were measured at 3 different shear rates (1 s-I, 5 s-' and 30 s-I). This was repeated 3 times (with different samples of the same chocolate), thus providing 15 shear stress values for each sample.
Results
Results were obtained from 13 different laboratories, with some reporting measurements from more than one measurement system (bob and cylinder or cup) or viscometer.
Some viscometers were not able to operate exactly at the rates of 1, 5 and 30 s.', so correction factors were applied. These were generally less than 11 % (except for the lowest speed in the VT-500). The Rheomat Mettler RM 180 was only able to give two readings as it did not have shear rates below 5 s-I.
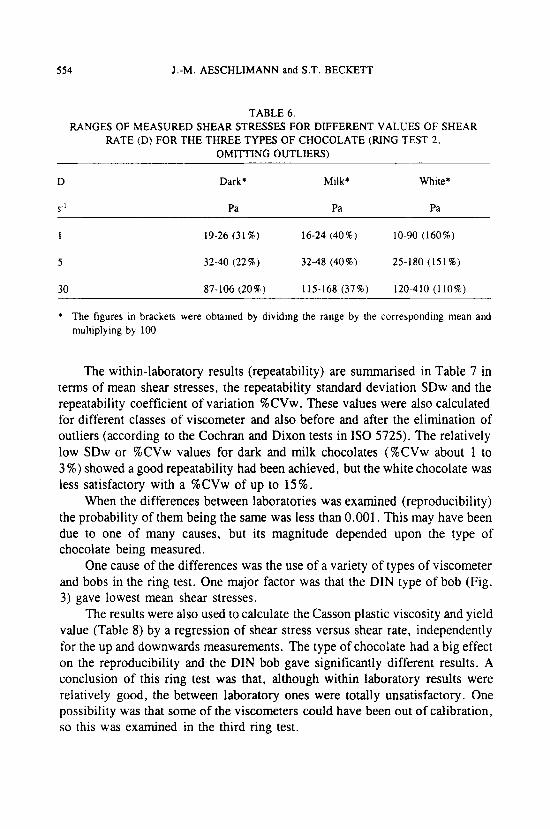
The dark chocolate gave the most precise results and the white chocolate the worst ones. The precision was about the same order of magnitude for the 1 s-' and 5 s-' readings, but increased in relative value (although decreasing in absolute terms) for 30 s-' (see Table 6).
554 J.-M. AESCHLIMANN and S.T. BECKETT
TABLE 6. RANGES OF MEASURED SHEAR STRESSES FOR DIFFERENT VALUES OF SHEAR
RATE (D) FOR THE THREE TYPES OF CHOCOLATE (RING TEST 2, OMIITING OUTLIERS)
D Dark' Milk* White*
S ' Pa Pa Pa
1 19-26 (31 %) 16-24 (40%) 10-90 (160%)
5 32-40 (22%) 32-48 (40%) 25-180 (151%)
30 87-106 (20%) 115-168 (37%) 120-410 (110%)
* The figures in brackers were obtained by dividing the range by the corresponding mean and multiplying by 100
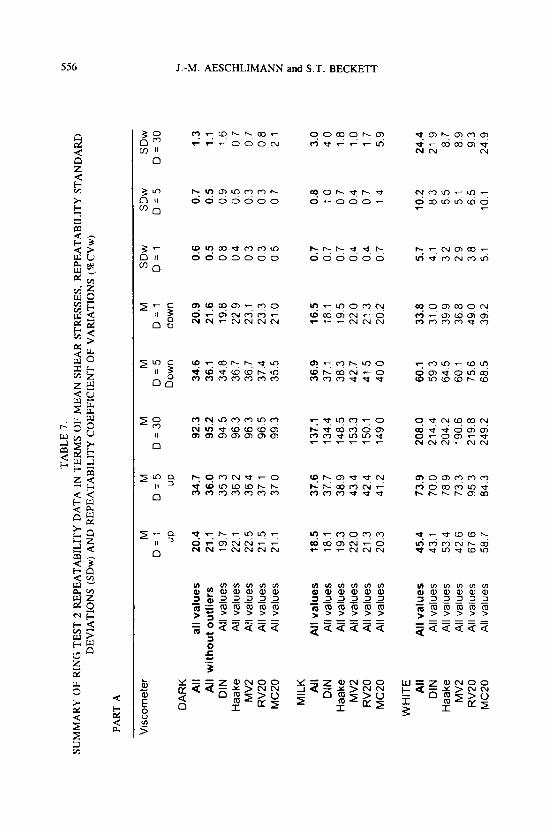
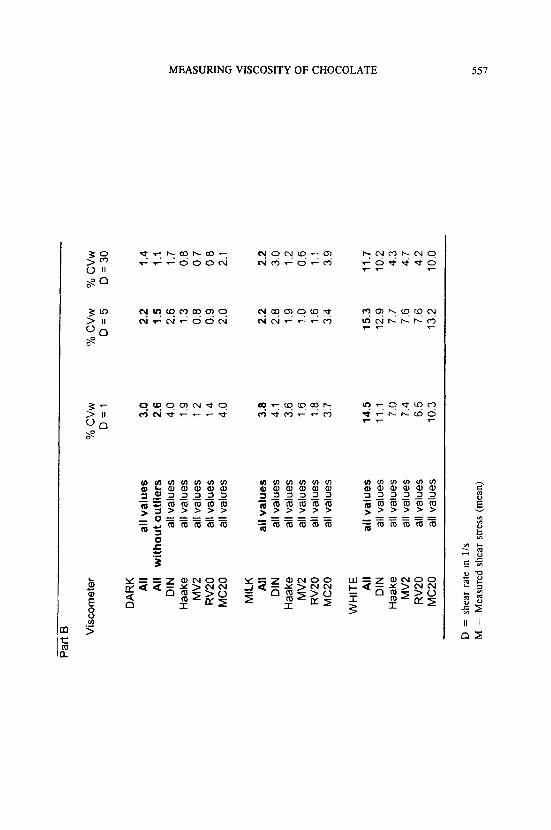
The within-laboratory results (repeatability) are summarised in Table 7 in terms of mean shear stresses, the repeatability standard deviation SDw and the repeatability coefficient of variation %CVw. These values were also calculated for different classes of viscometer and also before and after the elimination of outliers (according to the Cochran and Dixon tests in I S 0 5725). The relatively low SDw or %CVw values for dark and milk chocolates (%CVw about 1 to 3 %) showed a good repeatability had been achieved, but the white chocolate was less satisfactory with a %CVw of up to 15%.
When the differences between laboratories was examined (reproducibility) the probability of them being the same was less than 0.001. This may have been due to one of many causes, but its magnitude depended upon the type of chocolate being measured.
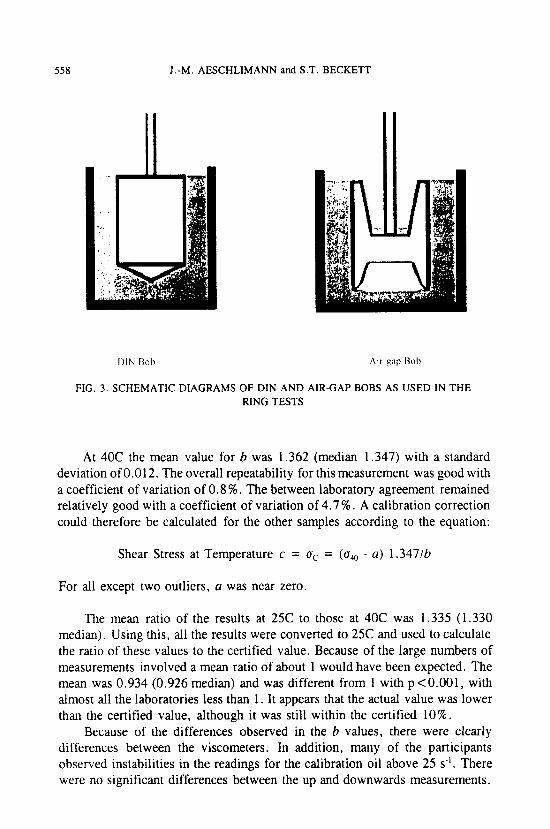
One cause of the differences was the use of a variety of types of viscometer and bobs in the ring test. One major factor was that the DIN type of bob (Fig. 3) gave lowest mean shear stresses.
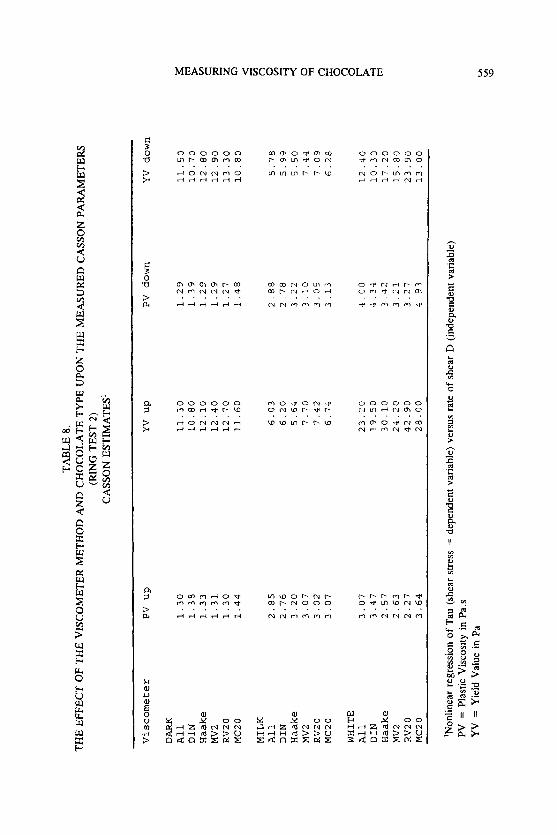
The results were also used to calculate the Casson plastic viscosity and yield value (Table 8) by a regression of shear stress versus shear rate, independently for the up and downwards measurements. The type of chocolate had a big effect on the reproducibility and the DIN bob gave significantly different results. A conclusion of this ring test was that, although within laboratory results were relatively good, the between laboratory ones were totally unsatisfactory. One possibility was that some of the viscometers could have been out of calibration, so this was examined in the third ring test.
MEASURING VISCOSITY OF CHOCOLATE
RING TEST 3
555
Protocol
For this trial, the same calibration oil was circulated to all participants, who were asked to record readings before making measurements on the other samples. This should give an estimation of the best possible agreement that might be achieved for a stable sample and determine how much of the difference between laboratories was due to other factors, such as pretreatment etc. The calibration oil is Newtonian. The results obtained showed which viscometers were significantly out of calibration and allowed their readings for the chocolate samples to be adjusted to take this into account. In addition to the calibration oil, a milk chocolate (of the type used in the previous two trials) and a dark coating (chocolate-like material, but containing other fats, so cannot legally be called chocolate) were sent to the participants. The two chocolates were chosen as having very different flow properties, with the dark coating having a higher Casson yield value but a lower Casson plastic viscosity than the milk chocolate.
The shear stress was measured at 5 s-l intervals between 5 s-' and 30 s-I. The sample was held at a constant shear rate for 2 min before taking the shear stress value and then increasing the shear rate as quickly as possible to the next level. This procedure was then repeated in the descending direction. As with the previous trial each sample was measured 3 times using different samples of the same chocolate.
Results
Calibration Oil. In this trial 16 laboratories returned 21 sets of results. The calibration oil had been certified at 25C, but the protocol had requested that measurements be taken at 40C (the temperature required for the chocolate measurements). Several laboratories carried out readings at both temperatures, so it was possible to calculate a temperature coefficient.
The oil used was AK 2000 batch n.3089 OH: 1.940 Pa.s at 25C. The range was within f 10% i.e. 1.75 Pa.s to 2.13 Pas . For each laboratory and replicate, a linear regression model (Bingham) was applied to the up and downward readings according to:
Estimated shear stress (Pa) = a + b (shear rate [s-]])
Repeatability and reproducibility estimations were also performed on these two parameters.
Overall the mean value for a was 0.190 (median 0.131) with a standard deviation of 0.245. The nonzero value was largely accounted for by two of the viscometers. If these were removed a had a mean value of 0.020.
TA
BL
E 7
. SU
MM
AR
Y O
F R
ING
TES
T 2
REP
EATA
BILI
TY D
AT
A I
N TE
RM
S O
F M
EAN
SH
EAR
ST
RE
SSE
S. R
EPEA
TABI
LITY
ST
AN
DA
RD
D
EVIA
TIO
NS
(SD
w) A
ND
REP
EATA
BILI
TY C
OEF
FIC
IEN
T O
F V
AR
IATI
ON
S (%
CV
w)
PAR
T A
v,
v,
Q\
Vis
com
eter
DA
RK
A
ll al
l val
ues
A
ll w
ithou
t o
utl
iers
D
IN
All
valu
es
Haa
ke
All
valu
es
MV
2 A
ll va
lues
R
V20
A
ll va
lues
M
C20
A
ll va
lues
MIL
K
All
All v
alu
es
DIN
A
ll va
lues
H
aake
A
ll va
lues
M
V2
All
valu
es
RV
20
All
valu
es
MC
20
All
valu
es
WH
ITE
A
l I A
ll va
lues
D
IN
All
valu
es
Haa
ke
All
valu
es
MV
2 A
ll va
lues
R
V20
A
ll va
lues
M
C20
A
ll va
lues
M
D=
l
UP
20.4
21
.l
19.7
22
.1
22.5
21
.5
21.1
18.5
18
.1
19.3
22
.0
21.3
20
.3
45.4
43
.1
53.4
42
.6
67 6
58
.7
M
D=
5
UP
34.7
36
.0
35 3
36
2
36 4
37
1
37 0
37.6
37
7
38 9
43
4
42 4
41
2
73.9
70
0
78 9
73
3
95 3
84
3
M
D =
30
92.3
95
.2
94.5
96
.3
96.3
96
.5
99.3
137.
1 13
4.4
148.
5 15
3.3
150.
1 14
9.0
208.
0 21
4.4
204.
2 19
0.6
219.
8 24
9.2
M
D=
5
Dow
n
34.6
36
.1
34 8
36
7
36 7
37
4
35 5
36.9
37
1
38 3
42
7
41 5
40
0
60.1
59
3
64 5
60
1
75 6
68
5
M
D=
l
dow
n
20.9
21
.6
19.8
22
.9
23.1
23
.3
21 .o
16.5
18
1
19.5
22
.0
21.3
20
.2
33.8
31
.O
39.9
36
.8
49 0
39
.2
SD
w
D=
l
0.6
0.5
08
0
4
03
0
3
05
0.7
07
0
7
04
0
4
07
5.7
41
3
2
29
3
8
51
SO
W
D=
5
0.7
0.5
09
0
5
03
0
3
07
0.8
10
0
7
04
0
7
14
10.2
8
3
55
5
1
65
10
1
SD
w
D =
30
L.
1.3
% i? ? F
1.1
1.6
0.7
07
0.
8 2.
1
0 z z [”
9
m
3.0
40
1.
8 1 .
o 1.
7 5.
9
m
0
24.4
21
9
8.7
89
9
3
24 9
Vis
com
eter
DA
RK
A
l I
all v
alue
s 3.
0 2.
2 1.
4 A
ll w
itho
ut o
utlie
rs
2.6
1.5
1 .I
DIN
al
l val
ues
4.0
2.6
1.7
Haa
ke
all v
alue
s 1.
9 1.
3 0.
8 M
V2
all v
alue
s 1.
2 0.
8 0.
7 R
V20
al
l val
ues
1.4
0.9
0.8
MC
20
all v
alue
s 4.
0 2.
0 2.
1
MIL
K
All
all v
alue
s 3.
8 2.
2 2.
2 D
IN
all v
alue
s 4.
1 2.
8 3.
0 H
aake
al
l val
ues
3.6
1.9
1.2
MV
2 al
l val
ues
1.6
1 .o
0.6
RV
20
all v
alue
s 1.
8 1.
6 1.
1 M
C20
al
l val
ues
3.7
3.4
3.9
WH
ITE
A
l I al
l val
ues
14.5
15
.3
11.7
D
IN
all v
alue
s 11
.1
12.9
10
.2
Haa
ke
all v
alue
s 7.
0 7.
7 4.
3 M
V2
all v
alue
s 7
4
7.6
4.7
RV
20
all v
alue
s 6.
5 7.
6 4.
2 M
C20
al
l val
ues
10.3
13
.2
10.0
D =
she
ar r
ate
in l
/s
M =
Mea
sure
d sh
ear
stre
ss (
mea
n)
ul
ul
-1
558 J.-M. AESCHLIMANN and S .T. BECKETT
FIG, 3 . SCHEMATIC DIAGRAMS OF DIN AND AIR-GAP BOBS AS USED IN THE RING TESTS
At 40C the mean value for b was 1.362 (median 1.347) with a standard deviation of 0.012. The overall repeatability for this measurement was good with a coefficient of variation of 0.8%. The between laboratory agreement remained relatively good with a coefficient of variation of 4.7%. A calibration correction could therefore be calculated for the other samples according to the equation:
Shear Stress at Temperature c = a, = (a, - a) 1.347/6
For all except two outliers, a was near zero.
The mean ratio of the results at 25C to those at 40C was 1.335 (1.330 median). Using this, all the results were converted to 25C and used to calculate the ratio of these values to the certified value. Because of the large numbers of measurements involved a mean ratio of about 1 would have been expected. The mean was 0.934 (0.926 median) and was different from 1 with p<O.OOl, with almost all the laboratories less than 1. It appears that the actual value was lower than the certified value, although it was still within the certified 10%.
Because of the differences observed in the b values, there were clearly differences between the viscometers. In addition, many of the participants observed instabilities in the readings for the calibration oil above 25 s-'. There were no significant differences between the up and downwards measurements.
TA
BL
E 8
. T
HE
EFF
ECT
OF
THE
VIS
CO
MET
ER M
ETH
OD
AN
D C
HO
CO
LATE
TY
PE U
PON
TH
E M
EA
SUR
ED
CA
SSO
N P
AR
AM
ETER
S (R
ING
TE
ST 2
) C
ASS
ON
EST
IMA
TES'
Visc
omet
er
PV u
p w
UP
PV do
wn
YV down
DA
RK
A1
1
DIN
Ha
ake
Mv2
RV2 0
MC2 0
MIL
K
A1
1
DIN
MV2
RV2 0
MC2 0
Haak
e
WH
ITE
A
1 1
DIN
Ha
ake
MV2
RV2 0
MC2 0
1.30
1.38
1.3
3
1.31
1.30
1.44
2.85
2.76
3.20
3.07
3.02
3 .07
3.07
3.47
2.57
2.63
2.27
3.64
11.30
10.80
12.10
12.40
12.70
11.60
6.03
6.20
5.64
7.70
7.42
6.74
23.20
19.50
30.10
24.20
42.90
28.00
1.29
1.39
1.29
1.29
1.27
1.48
2.88
2 .78
3 .22
3.10
3.05
3.13
4.00
4.3-1
3.42
3.21
3.21
4.93
11.50
10.70
12.80
12.90
13.30
10.80
5.78
5.99
5.50
7.44
7.09
6.28
12.40
10.30
17.20
15.80
23.90
13.00
c
'Non
linea
r re
gres
sion
of T
au (
shea
r st
ress
= d
epen
dent
var
iabl
e) v
ersu
s ra
te o
f sh
ear
D (
inde
pend
ent v
aria
ble)
PV
= P
last
ic V
isco
sity
in P
a.s
YV =
Yie
ld V
alue
in
Pa
560 J.-M. AESCHLIMANN and S.T. BECKE?T
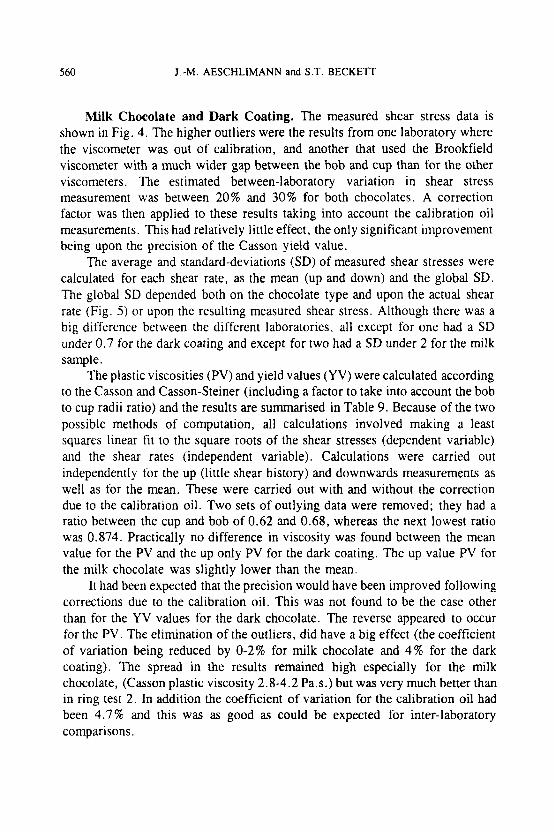
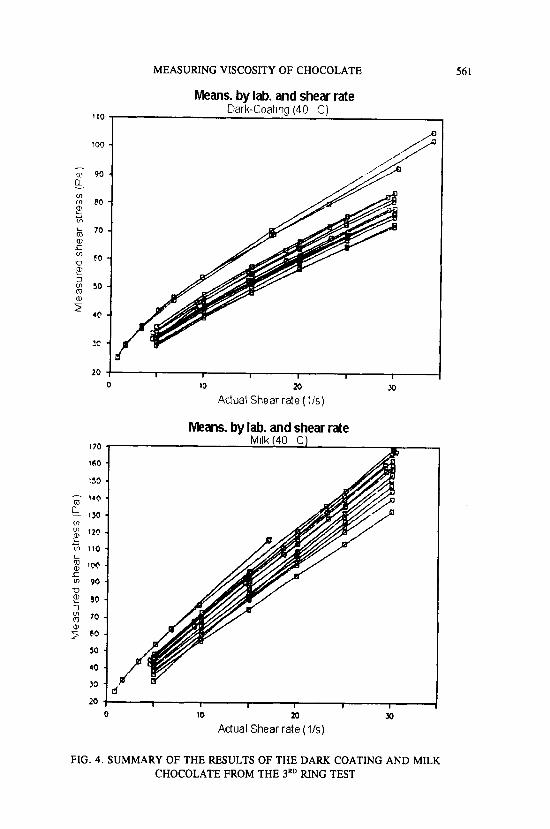
Milk Chocolate and Dark Coating. The measured shear stress data is shown in Fig. 4. The higher outliers were the results from one laboratory where the viscometer was out of calibration, and another that used the Brookfield viscometer with a much wider gap between the bob and cup than for the other viscometers. The estimated between-laboratory variation in shear stress measurement was between 20% and 30% for both chocolates. A correction factor was then applied to these results taking into account the calibration oil measurements. This had relatively little effect, the only significant improvement being upon the precision of the Casson yield value.
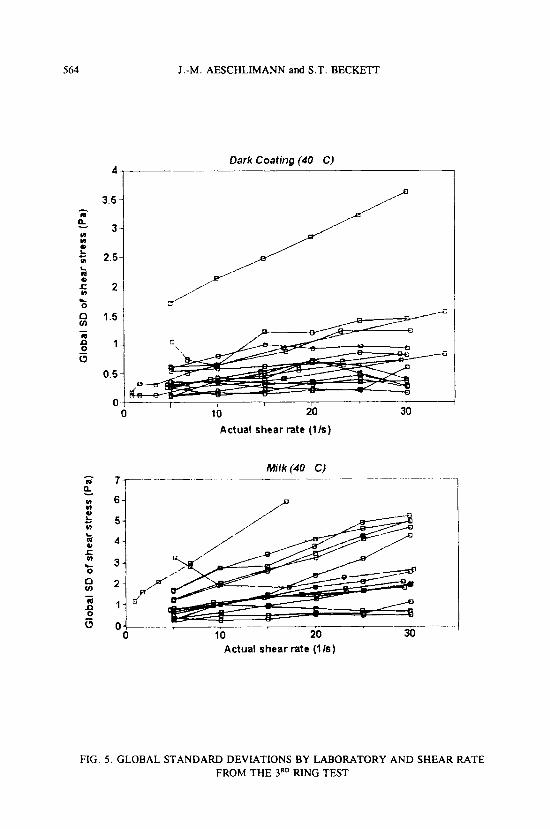
The average and standard-deviations (SD) of measured shear stresses were calculated for each shear rate, as the mean (up and down) and the global SD. The global SD depended both on the chocolate type and upon the actual shear rate (Fig. 5) or upon the resulting measured shear stress. Although there was a big difference between the different laboratories, all except for one had a SD under 0.7 for the dark coating and except for two had a SD under 2 for the milk sample.
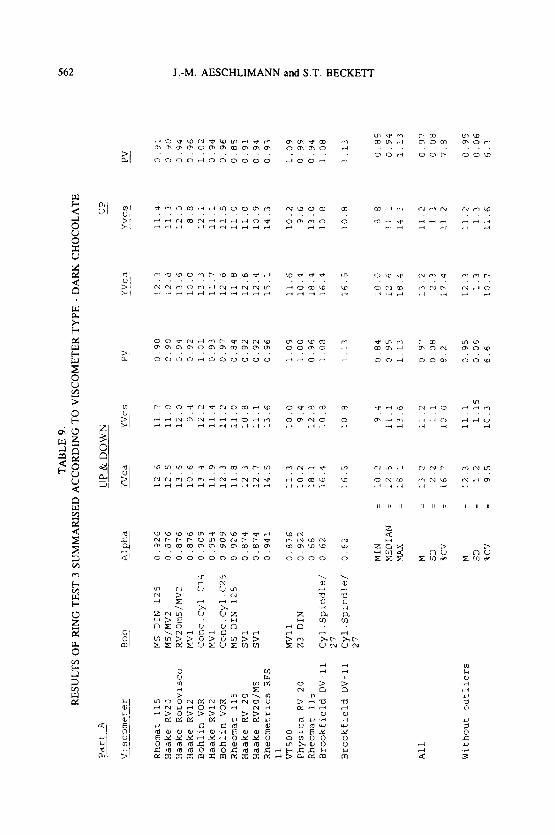
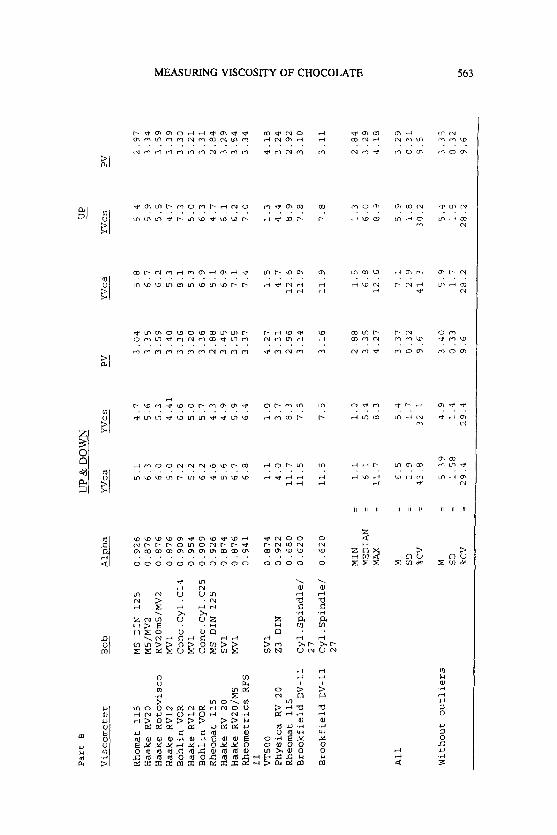
The plastic viscosities (PV) and yield values (W) were calculated according to the Casson and Casson-Steiner (including a factor to take into account the bob to cup radii ratio) and the results are sumarised in Table 9. Because of the two possible methods of computation, all calculations involved making a least squares linear fit to the square roots of the shear stresses (dependent variable) and the shear rates (independent variable). Calculations were carried out independently for the up (little shear history) and downwards measurements as well as for the mean. These were carried out with and without the correction due to the calibration oil. Two sets of outlying data were removed; they had a ratio between the cup and bob of 0.62 and 0.68, whereas the next lowest ratio was 0.874. Practically no difference in viscosity was found between the mean value for the PV and the up only PV for the dark coating. The up value PV for the milk chocolate was slightly lower than the mean.
It had been expected that the precision would have been improved following corrections due to the calibration oil. This was not found to be the case other than for the YV values for the dark chocolate. The reverse appeared to occur for the PV. The elimination of the outliers, did have a big effect (the coefficient of variation being reduced by 0-2% for milk chocolate and 4% for the dark coating). The spread in the results remained high especially for the milk chocolate, (Casson plastic viscosity 2.8-4.2 Pas.) but was very much better than in ring test 2. In addition the coefficient of variation for the calibration oil had been 4.7% and this was as good as could be expected for inter-laboratory comparisons.
MEASURING VISCOSITY OF CHOCOLATE 561
Means. by lab. and shear rate Darl+Coating (40 C)
110
I I I I I I
10 20 )(3 0
Actual Shear rate (l/s)
Means. by lab. and shear rate I70
160
:50
- 940 m 4_ rx m I= 129 P? m 110 Y
L g tm
E 40
L
v 3 1 70 Q)
90
2 El so 4 0
33
I I I I I I
0 10 M x)
Actual Shear rate ( l / s )
FIG. 4. SUMMARY OF THE RESULTS OF THE DARK COATING AND MILK CHOCOLATE FROM THE 3RD RING TEST
TA
BL
E 9
. R
ESU
LT
S O
F R
ING
TE
ST 3
SU
MM
AR
ISE
D A
CC
OR
DIN
G T
O V
ISC
OM
ET
ER
TY
PE -
DA
RK
CH
OC
OL
AT
E
Part A
Viscometer
Rhomat 11
5 Haake RV20
Haake Rotovisco
Haake RV12
Bohlin VOR
Haake RV12
Bohlin VOR
Rheomat
115
Haake RV
20
Haake R
V20/
M5
Rheometrics RFS
11
VT
500
Physica RV
20
Rheornat 115
Brookfield DV-11
Brookfield DV-11
A1
1
Without
outliers
MS DI
N 125
0.926
M5/MV2
0.876
RV2OmS/MV2
0.876
MVl
0.876
Conc.Cyl.Cl4 0.909
MV 1
0.954
Con
c . P
{l.
C25
0.9
09
MS D
IN 125
0.926
SV1
0.874
sv1
0.874
0.941
Mvll
0.876
23 D
IN
0.922
0.6
8
Cyl.Spindle/ 0 62
27
Cyl.Spindle/ 0.62
27
MIN
MEDIAN
MAX
M SD
% cv
M SD
%C'
J
LIP
& D
OW
N
WC
d
~ 12 5
12.5
13 .
6
10.6
13 .J
11.9
12.3
11.8
12 3
12.7
14.5
11.3
10.2
18.1
16.4
16.5
= 10.2
= 12.5
=
18 1
=
13 2
=
2.2
=
1
6.7
=
12.3
= 1.2
= 9.5
u"cs
li.?
11.0
12
.0
9.4
12.2
11.4
11
.2
11.0
10.8
11.1
13 .6
10.0
9.4
12.8
10.8
10.8
3.4
11.1
13.6
11.2
1.1
10.0
11.1
10.3
1.15
PV
-
0.90
0.30
0.94
0.92
1.01
0.93
0.97
0.84
0.92
0.92
0.96
1.09
1.00
0.96
1.08
1.13
0 84
0 95
1 13
0 9
7
0.08
8.2
0.95
0.06
6.6
YVCd
__
_
12.3
13.6
10.0
13 3
11.7
12.6
11.8
12.6
12.4
15.1
11.6
10.4
18.4
16.4
16.5
12.a
10 .o
L
2.6
18 .1
13.2
2.3
17.1
12.3
1.3
10 7
up
YVCS
__
11.4
11 3
12 0
8.8
12.1
11.1
11.5
11.0
11.0
10.9
14.3
10.2
9.6
13.0
10.8
10.8
8.8
11.1
14. 3
11.2
1.3
11.2
11.2
13
11
6
PV
-
0.91
0.9
0
0.94
0.96
1.02
0.94
0.96
0.85
0.91
0.94
0.93
1.09
0.99
0.94
1.08
1.13
0.85
0.9
4
1.13
0.97
0.08
7.8
0.95
0.06
6.3
b
Part
B
Viscorneter
Rhornat 115
Haake RV20
Haake Rotovisco
Haake RV12
Bohlin VOR
Haake RV12
Bohlin VOR
Rheomat 115
Haake RV
20
Haake RV20/M5
Rheornetrics RFS
11
VTSO
O Physica RV
20
Rheornat 115
Brookfield DV-11
Brookfield DV-11
A1
1
Without
outliers
Bob
A
lph
a
MS DI
N 125
M5/MV2
RV2Orn5/MV2
MV1
Conc.Cyl.Cl4
MV
1 Conc.Cyl.C25
MS DIN 125
sv1
MV
1
0.926
0.876
0.876
0.876
0.909
0.954
0.909
0.926
0.874
0.876
0.941
sv1
0.874
23 DIN
0.922
0.680
Cyl.Spindle/
0.620
27
Cyl.Spindle/ 0.620
27
MIN
MEDIAN
MA
X
M SD
% cv
M SD
% cv
UP
&D
OW
N
Wca
yv
cs
5.1
4.7
6.3
5.6
6.0
5.3
5.0
4.41
1.2
6.6
5.2
5.0
6.2
5.7
4.6
4.3
5.6
4.9
6.7
5.9
6.8
6.4
1.1
1.0
4.0
3.7
11.7
8.3
11.5
7.5
11.5
7.5
=
1.1
1.0
=
6.1
5.4
=
11.7
8.3
=
6.5
5.4
7.9
1.7
= 43.8
32.1
=
5.39
4.9
=
1.58
1.4
=
29.4
29.1
PV
- 3.04
3.35
3.59
3 .40
3.36
3.20
3 .36
2.88
3.45
3.55
3.37
4.27
3.31
2.96
3.14
3.16
2.88
3.35
4.27
3.37
0.32
9.6
3 .4
0
0.33
9.6
5.8
6.7
6.2
5.3
8.1
5.3
6.9
5.1
6.9
7.1
7.4
1.5
4.7
12.6
11.9
11.9
1.5
6.8
12.6
7.1
2.9
41.3
5.9
1.7
28.2
vp
we
s _
_
5.4
5.9
5.5
4.7
7.3
5.0
6.3
4.7
6.1
6.2
7.0
1.3
4.4
8.9
7.8
7.8
1.3
6.0
8.9
5.9
1.8
30.2
5.4
1.5
28.2
PV
- 2.97
3.34
3.59
3.39
3.30
3 .21
3.31
2.84
3.29
3.54
3.34
4.18
3.24
2.92
3.10
3.11
2.84
3 .29
4.18
3 .29
0.31
9.5
3.35
0.32
9.6
m
vl
w
564
4
3.5 - a s 3 I
I
L
n e ;; 2.5 a a 5 2 c 0
1.5 - a n 0 - 0 ’
0.5
0
J.-M. AESCHLIMANN and S.T. BECKETT
Dark Coating (40 C)
I 10 20 30
Actual shear rate ( l k )
Actual shear rate (in)
FIG. 5 . GLOBAL STANDARD DEVIATIONS BY LABORATORY AND SHEAR RATE FROM THE 3RD RING TEST
MEASURING VISCOSITY OF CHOCOLATE 565
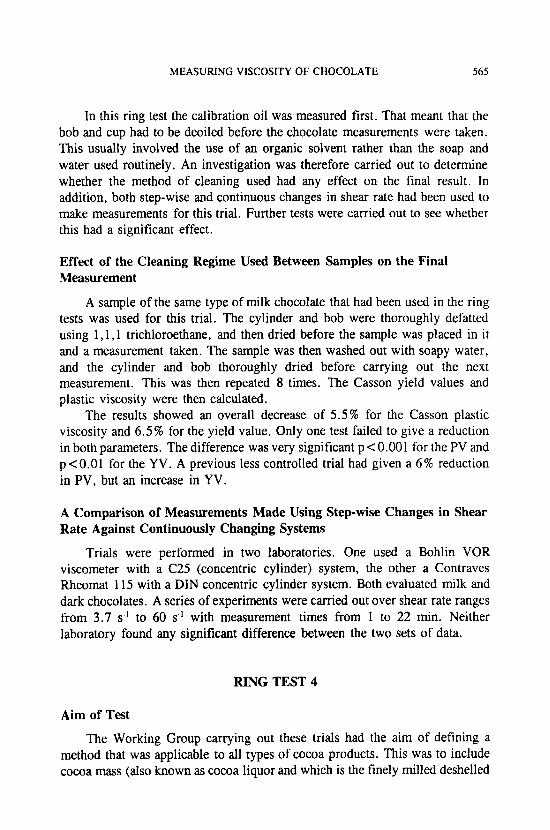
In this ring test the calibration oil was measured first. That meant that the bob and cup had to be deoiled before the chocolate measurements were taken. This usually involved the use of an organic solvent rather than the soap and water used routinely. An investigation was therefore carried out to determine whether the method of cleaning used had any effect on the final result. In addition, both step-wise and continuous changes in shear rate had been used to make measurements for this trial. Further tests were carried out to see whether this had a significant effect.
Effect of the Cleaning Regime Used Between Samples on the Final Measurement
A sample of the same type of milk chocolate that had been used in the ring tests was used for this trial. The cylinder and bob were thoroughly defatted using 1, l . l trichloroethane, and then dried before the sample was placed in it and a measurement taken. The sample was then washed out with soapy water, and the cylinder and bob thoroughly dried before carrying out the next measurement. This was then repeated 8 times. The Casson yield values and plastic viscosity were then calculated.
The results showed an overall decrease of 5.5% for the Casson plastic viscosity and 6.5% for the yield value. Only one test failed to give a reduction in both parameters. The difference was very significant p < 0.001 for the PV and p<O.Ol for the YV. A previous less controlled trial had given a 6% reduction in PV, but an increase in YV.
A Comparison of Measurements Made Using Step-wise Changes in Shear Rate Against Continuously Changing Systems
Trials were performed in two laboratories. One used a Bohlin VOR viscometer with a C25 (concentric cylinder) system, the other a Contraves Rheomat 115 with a DIN concentric cylinder system. Both evaluated milk and dark chocolates. A series of experiments were carried out over shear rate ranges from 3.7 s-' to 60 s-' with measurement times from 1 to 22 min. Neither laboratory found any significant difference between the two sets of data.
RING TEST 4
Aim of Test
The Working Group carrying out these trials had the aim of defining a method that was applicable to all types of cocoa products. This was to include cocoa mass (also known as cocoa liquor and which is the finely milled deshelled
566 I . -M. AESCHLIMANN and S.T. BECKETT
cocoa beans). This material is much thinner than the chocolates that had been previously measured as it contains about 55% of fat (cocoa butter). There is a tendency for this fat to separate, resulting in a nonuniform product. The 4th ring test was designed to determine whether the new draft method, which had then been prepared by the Group, was applicable to this material. A much lower viscosity calibration oil was also circulated. This had a viscosity, which had been expected to match that of the cocoa mass, whereas in practice it was somewhat lower.
Protocol
The shear stress was measured at 1 s.', 5 s.', 10 s-', 20 s-' and 50 s-'; after holding the sample at a constant shear rate for 2 min before taking the reading and then increasing the shear rate as quickly as possible to the next level. This procedure was then repeated in the descending direction (50 s.' to 1 s.') and also with 3 different replicates of the cocoa liquor.
Results
Calibration Oil. Sixteen sets of data were received. As with the previous ring test the intercept a was determined together with the slope b (viscosity q ) . This time there appeared to be a small, but significant value for a, being 0.051 Pa (the up curve giving 0.073 Pa and the downward 0.037 Pa). The value for b was 1.494 Pa.s, with the up and downwards curves being slightly different at 1.525 Pa.s and 1.492 Pa.% respectively.
The median of the within laboratory coefficient of variation (repeatability) was 0.3%, whilst the between laboratories reproducibility was 5.9%. The latter was slightly larger than for the previous ring test, but the viscosity was lower and the results were taken over a larger shear rate range.
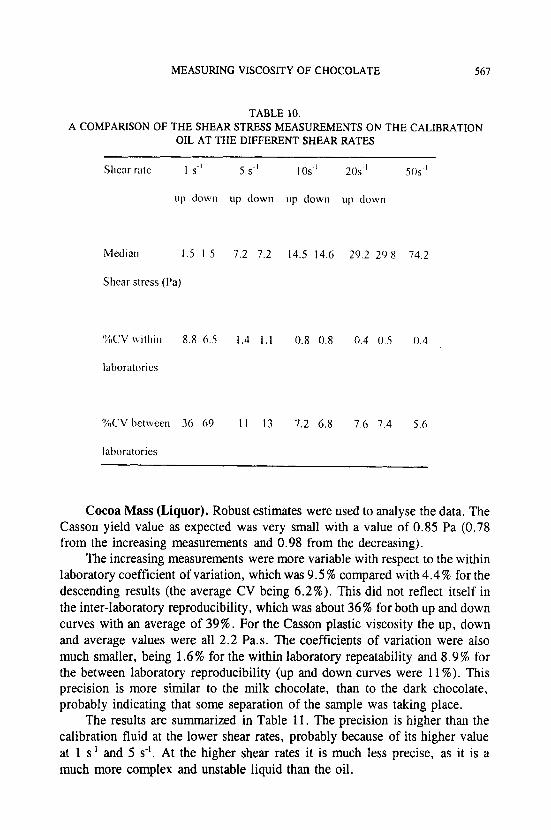
The statistical data analysis was carried out using robust estimates 1.e. making them insensitive to extreme values. Means are replaced by medians and standard deviations by a robust equivalent described by Rousseeuw and Croux (1993). One outlier was due to a software fault in the instrument, which highlighted the importance of carrying out calibration checks. The data was analysed for its precision at each of the different shear rates. This is summarised in Table 10. These results show the large differences that still exist for readings below 5 s-', even for such stable liquids as calibration oil.
MEASURING VISCOSITY OF CHOCOLATE 561
TABLE 10. A COMPARISON OF THE SHEAR STRESS MEASUREMENTS ON THE CALIBRATION
OIL AT THE DIFFERENT SHEAR RATES
Shear rate 1 s-I 5 s-I 10s-I 20s ' 50s I
11l1 down up down tip down lip down
Med I an 1.5 1 5 7.2 7.2 14.5 14.6 29.2 29 8 74 2
Shear stress (Pa)
YKVwithin 8.8 6.5 1.4 1.1 0.8 0.8 0.4 0 5 0.4
laboralories
%CV hetween 36 69 1 1 13 7.2 6.8 7.6 7 4 5.6
laboratories
Cocoa Mass (Liquor). Robust estimates were used to analyse the data. The Casson yield value as expected was very small with a value of 0.85 Pa (0.78 from the increasing measurements and 0.98 from the decreasing).
The increasing measurements were more variable with respect to the within laboratory coefficient of variation, which was 9.5% compared with 4.4% for the descending results (the average CV being 6.2%). This did not reflect itself in the inter-laboratory reproducibility, which was about 36% for both up and down curves with an average of 39%. For the Casson plastic viscosity the up, down and average values were all 2.2 Pa.s. The coefficients of variation were also much smaller, being 1.6% for the within laboratory repeatability and 8.9% for the between laboratory reproducibility (up and down curves were 11 %). This precision is more similar to the milk chocolate, than to the dark chocolate, probably indicating that some separation of the sample was taking place.
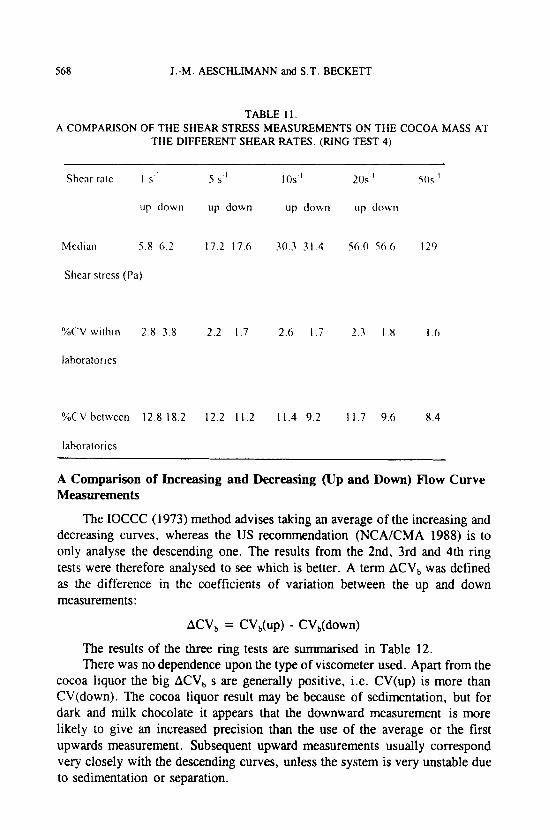
The results are summarized in Table 11. The precision is higher than the calibration fluid at the lower shear rates, probably because of its higher value at 1 s-I and 5 s'. At the higher shear rates it is much less precise, as it is a much more complex and unstable liquid than the oil.
568 J.-M. AESCHLIMANN and S.T. BECKETT
TABLE 11. A COMPARISON OF THE SHEAR STRESS MEASUREMENTS ON THE COCOA MASS AT
THE DIFFERENT SHEAR RATES. (RING TEST 4)
up down up down up down up do\cii
Median 5 8 6 2 1 7 2 1 7 6 3 0 3 31 4 5 6 0 566 129
Shear stress (Pa)
YnCVwIthin 2 8 3 8 2 2 1 7 2 6 I 7 2 3 I 8 I 0
laboratories
%CV between 12.8 18.2 12.2 11.2 11.4 9.2 11.7 9.6 8.4
laboratories
A Comparison of Increasing and Decreasing (Up and Down) Flow Curve Measurements
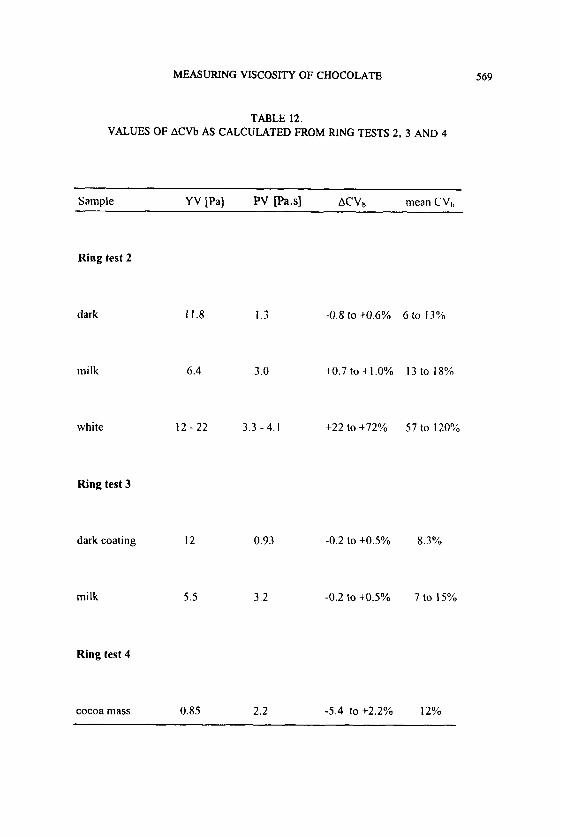
The IOCCC (1973) method advises taking an average of the increasing and decreasing curves, whereas the US recommendation (NCAICMA 1988) is to only analyse the descending one. The results from the 2nd, 3rd and 4th ring tests were therefore analysed to see which is better. A term ACV, was defined as the difference in the coefficients of variation between the up and down measurements :
Acvb = cvb(up) - CV,(down)
The results of the three ring tests are summarised in Table 12. There was no dependence upon the type of viscometer used. Apart from the
cocoa liquor the big ACV, s are generally positive, i.e. CV(up) is more than CV(down). The cocoa liquor result may be because of sedimentation, but for dark and milk chocolate it appears that the downward measurement is more likely to give an increased precision than the use of the average or the first upwards measurement. Subsequent upward measurements usually correspond very closely with the descending curves, unless the system is very unstable due to sedimentation or separation.
MEASURING VISCOSITY OF CHOCOLATE 569
TABLE 12. VALUES OF ACVb AS CALCULATED FROM RING TESTS 2 . 3 AND 4
~~ -
Sample YV [Pa] PV [Pa.s] ACVh mean CVh
Ring test 2
dark
inilk
white
Ring test 3
11.8 1.3 -0.8 to +0.6% 6 to 13%
6.4 3.0 +0.7 to + I .O% 13 to 18%
12 - 22 3.3 -4 .1 +22 to +72% 57 to I2070
0.93 -0.2 10 +O.5% 8.3Yu
3.2 -0.2 to +0.5% 7 to 15%
dark coating 12
inilk 5.5
Ring test 4
cocoa mass 0.85 2.2 -5.4 to +2.2% 12%
570 J.-M. AESCHLIMANN and S.T. BECKETT
RING TEST 5
Aim
The aim of the final ring test was to determine whether the revised method (IOCCC 2000) was able to give any improved agreement between the laborato- ries and also to validate the method by providing reliable precision estimates. Ten new laboratories, which had not previously been involved with this project, took part in this test. This was to ensure that someone who had not been involved in writing it could understand the revised method and also that any improved precision was due to better methodology, not just the bringing together of the laboratories. A calibration oil was circulated together with 4 samples: cocoa mass, dark coating, milk chocolate and white chocolate. As in the previous trials three different samples from the same material were evaluated.
Results
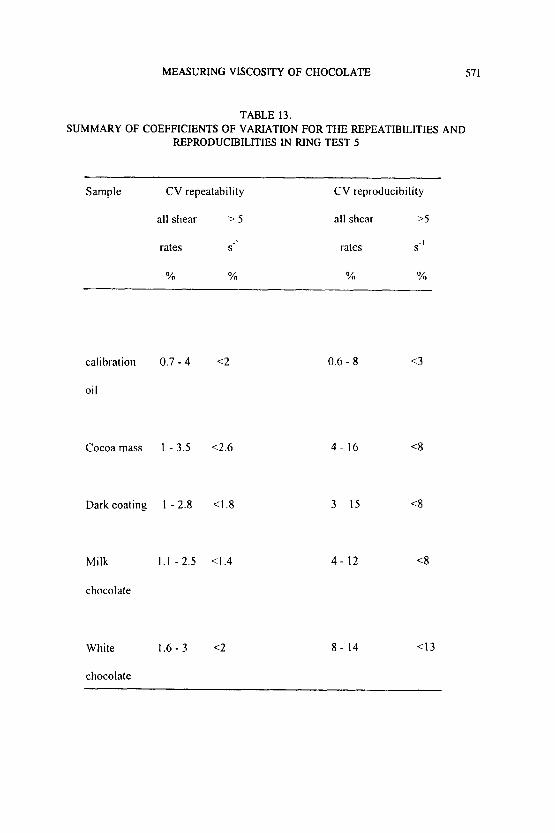
As for the previous test, the statistical analysis was carried out using robust estimates, which are insensitive to extreme values. Where the shear rates were not the exact value required, a method, based on interpolation, was used to determine the shear stress at the correct shear rate. The coefficients of variation of the repeatability and reproducibility are summarised in Table 13.
Calibration Oil. The sample used was manufactured by Poulten Selfe and Lee LtD and was oil PSL no. 2840sp/2000, batch n. 10165, calibrated: Aug. 15, 1996, Expiry date: Aug. 14, 1997 (all results were reported well before this date). Certified value: 7 = 1957 mPa.s (+0.65% for a confidence probability 95%) at 40C. The results were analysed to determine the intercept a and the slope 6. 25 data sets were analysed and gave the following result:
intercept a: Median = 0.031, SD = 0.783 which gives p(a=O) = 0.84 i.e. a is very probably zero.
slope b: Median = 2.011, SD = 0.102 which gives p(b=q) = 0.014 i.e. the actual value is different from the certified value. One laboratory recalibrated its viscometers because of this and subsequently had to change them back again. The majority of laboratories had a near zero intercept and most were within 5% of the certified viscosity for slope b.
A stress correction factor was also able to be applied because of the Newtonian behaviour of the oil. For a given viscometer the average value for the intercept Q (M(a)) and for the slope b (M(6)) were calculated for the three replicates. The stress correction was then calculated from:
a’ = (a-M(a)) x q/M(b) where q = 1.957 Pa
MEASURING VISCOSITY OF CHOCOLATE 571
TABLE 13. SUMMARY OF COEFFICIENTS OF VARIATION FOR THE REPEATIBILITIES AND
REPRODUCIBILITIES IN RING TEST 5
Sample CV repeatability
all shear > 5
rates S-'
% %l
~~ ~ ~~
CV reproducibility
all shear >5
rates S- ' Ya %l
calibration 0.7 - 4 <2
oi I
Cocoa mass 1 - 3.5 <2.6
Dark coating 1 - 2.8 <I .8
Milk 1 . 1 - 2.5 4 . 4
chocolate
0.6 - 8 <3
4 - 16
3 - 15
4 - 12
White 1 . 6 - 3 <2 8 - 14 <I3
chocolate

572 J.-M. AESCHLIMANN and S.T. BECKETT
This improved the between laboratory reproducibility by a factor of 2 to 7, but had little effect on the repeatability.
Although the coefficient of variation of the repeatability was slightly larger than for ring test 4 being between 0.7 % and 4 % (but < 2 % for shear rates > 5 s-I, as had been used in the previous trial). the CV for the between laboratories reproducibility was better at 0.6% to 8% ( < 3 % for > 5 s-I). The differences between the up and downwards measurements was small, almost always being less than 5 % . In general the shear stress for the up curve was lower than that for the downward one.
Cocoa Mass (Liquor). The results were comparable with ring test 4. The coefficient of variation for the repeatability was from 1 % to 3.5 % depending upon shear rate (<2 .6% for 2 5 s-I) and with the between laboratory values of 4% to 16% ( < 8 % for > 5 s?). The latter was improved by a factor of less than 2 by applying the stress correction factor calculated from the calibration oil results. The downward measurements were slightly more reproducible than the upward readings. The difference between the two was normally less than 5%. In general below 10 s-I, the upward shear stress was lower than the downward reading, but this reversed at the higher shear rates. It is therefore better to evaluate the two sets of data separately.
Dark Coating. Here the precision was very similar to that for cocoa mass with a coefficient of variation for the repeatability of 1 .O% to 2.8% (< 1.8% for > 5 s . ' ) and that for the reproducibility of 3% -15% ( < 8 % for > 5 s-'). By applying the calibration oil correction factor the latter was reduced by a factor of less than 2. The upward shear stress was normally greater than the downward reading, but the difference was small, usually much less than 5%. The downwards measurements were significantly more reproducible than the upwards ones.
Milk Chocolate. Unlike in ring test 3, the results for the milk chocolate were very similar to those for the dark coating. The coefficient of variation for the repeatability being 1.1 % to 2.5% (< 1.4% for 2 5 s-I) and for between laboratories of 4% to 12% (<8% for 2 5 s-I). This reproducibility was not improved by using the calibration oil correction factor. The downward measurement was slightly more reproducible and usually smaller in absolute terms than the upward one, but the differences were small.
White Chocolate. Although the precision was not as good as for the other samples it was very much better than for the only other white chocolate sample, in the first ring test. The coefficient of variation for the within laboratory repeatability was quite similar to the others being 1.6% to 3% ( < 2 % for
MEASURING VISCOSITY OF CHOCOLATE 573
2 5 d). The inter-laboratory reproducibility was rather worse at 8% to 14% ( < 13 % for > 5 s-I). Applying the correction calculated from the calibration oil did not improve the reproducibility, The difference between the up and down curves was normally less than 5 % , with the increasing shear stress being greater than the decreasing one. The downward curve had the greater precision.
THE CASSON MODEL
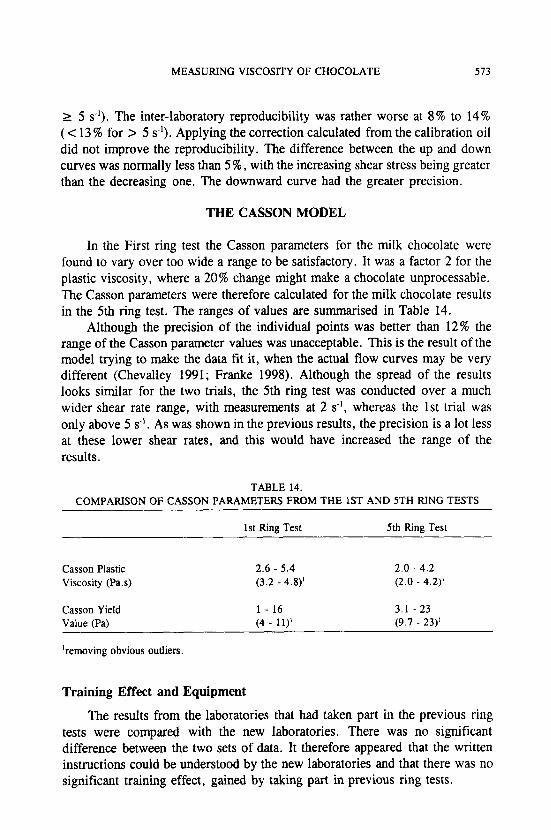
In the First ring test the Casson parameters for the milk chocolate were found to vary over too wide a range to be satisfactory. It was a factor 2 for the plastic viscosity, where a 20% change might make a chocolate unprocessable. The Casson parameters were therefore calculated for the milk chocolate results in the 5th ring test. The ranges of values are summarised in Table 14.
Although the precision of the individual points was better than 12% the range of the Casson parameter values was unacceptable. This is the result of the model trying to make the data fit it, when the actual flow curves may be very different (Chevalley 1991; Franke 1998). Although the spread of the results looks similar for the two trials, the 5th ring test was conducted over a much wider shear rate range, with measurements at 2 s-I, whereas the 1st trial was only above 5 s-I. As was shown in the previous results, the precision is a lot less at these lower shear rates, and this would have increased the range of the results.
TABLE 14. COMPARISON OF CASSON PARAMETERS FROM THE 1ST AND 5TH RING TESTS
1st Ring Test 5th Ring Test
Casson Plastic Viscosity (Pa.s)
2.6 - 5.4 (3.2 - 4.8)'
2 .0 - 4.2 (2.0 - 4.2)'
Casson Yield 1 - 16 3.1 - 23 Value (Pa) (4 - 11)' (9.7 - 23)'
'removing obvious outliers.
Training Effect and Equipment
The results from the laboratories that had taken part in the previous ring tests were compared with the new laboratories. There was no significant difference between the two sets of data. It therefore appeared that the written instructions could be understood by the new laboratories and that there was no significant training effect, gained by taking part in previous ring tests.
514 1.-M. AESCHLIMANN and S.T. BECKETT
Statistical analysis was also carried out to try to correlate the measurements for the calibration oil with the equipment used. No significant effect could be found to relate this either to the viscometer or the measuring bob. The one exception was the cone and plate measuring system, which gave satisfactory results for the calibration oil, but gave significmtly different results for the other samples. This confirmed the recommendation that only concentric cylinder systems should be used when good interlaboratory agreement is required when measuring the viscosity of chocolate.
CONCLUSION
When good interlaboratory agreement is required when measuring chocolate viscosity it is preferable to report the results as shear stresses at several shear rates rather than use the Casson model. Because it does not exactly fit the flow curve, it will just introduce additional differences. It may be more useful for within laboratory measurements, as repeatability measurements are more precise than interlaboratory reproducibility. The new IOCCC method notes that all models should be used with care. The Windhab model is suggested as a possible alternative. The reason for this choice was that the measured parameters were considered to relate to actual physical reactions within the chocolate. Great care must be taken in carrying out the measurements particularly with regard to sample preparation and instrument calibration. Corrections, obtained by using a correction factor based on calibration oil measurements, have very little effect other than for cocoa liquor. Other factors which are important are the cleaning regime, bob type and measurement time. A concentric cylinder system with a narrow gap was found to be satisfactory, but correction calculations are required when the ratio of inner to outer cylinder is less than 0.85 (preferably <0.95). Any reputable make of viscometer should be capable of producing reproducible results, whether it is operated in the continuous or the step-wise mode.
PARTICIPANTS
Barry SA
Belin-Lu Biscuits
Callebaut SA
Mme M Cardon, G de Ginestel, J Pontillon, Meulan Hardricourt, France
L Lambert, Centre Jean Thkes, France
D de Schepper, P van Hauwermeiren, Lebbe-Weize, Belgium
ETH - Zurich
Fennema B.V.
General Biscuits
Haake Mess-Technik
Guittard Chocolate
Karlshamns
MEASURING VISCOSITY OF CHOCOLATE 575
Kraft Jacobs Suchard
Lindt & Spriingli
Marabou
Nestle
P Braun, Prof. E. Windhab, Frau B Wolf, Zurich, Switzerland
P Brinkman, H Veltkamp, Deventer, The Netherlands
M Grauwen, Belgium
Frau E-M Kutschmann
E Seguine, Burlingame, California
J Alander, U Hansson, L Sandstrom Karlshamns, Sweden
I C Ciurea, R Keller, N McElhinney, Neuchatel, Switzerland
Frau J Hunt, Munich, Germany
W Ammann, W Nievergelt, Kilchberg, Switzerland
T Ericsson (Wassholm), Sundyberg, Sweden
J-M Aeschlimann, Mme M Bilat, P Desachy, I D Roberts, 0 Robin, Vers-Chez-Les Blanc. Switzerland
Mme Beatrice Bailleul, J Ferrand, Beauvais, France
S Bize, Mme J Chevalley, Broc, Switzerland
S T Beckett, York, UK
Tscheuschner & Bindler (also Deutsches Institut f i r Lebensmitteltechnik)
Mme A Finke, Prof. H-D Tscheuschner
576
Unilever
(Loders Croklaan)
Koninklijkr Verkade
J.-M. AESCHLIMANN and S.T. B E C E ' M
Wilbur Chocolate
F Cain, Wormerveer, Netherlands
G Talbot, Bishop's Stortford, UK
NV F S M van Kleef, Zaandam, The Netherlands
R Schwarz, Lititz, Pennsylvania
REFERENCES
BECKETT, S.T. 1999. Industrial Chocolate Manufacture and Use, Blackwells, Oxford, UK.
CHENG, D.C.-H. 1978. A comparison of 14 commercial viscometers and a home-made instrument, Warren Spring Report LR 282 (MH) UK.
CHEVALLEY, J . 1991. An adaptation of the Casson equation for the rheology of chocolate J . Texture Studies 22, 219-229.
FRANKE, K. 1998. Reliable data from rheological measurement. Chocolate and Confectionery 2(6), 4-6.
International Office of Cocoa, Chocolate and Sugar Confectionery (IOCCC). 1973. Viscosity of chocolate - determination of Casson yield value and Casson Plastic Viscosity, Rev. Int. Choc. 10 (Sept), 216-218.
International Office of Cocoa, Chocolate and Sugar Confectionery (IOCCC). 2000. Viscosity of Cocoa and Chocolate Products. Analytical Method 46 - 2000 available from CAOBISCO, Rue Defacqz 1 , 1000 Bruxelles, Belgium.
NCA/CMA Viscosity Subcommittee. 1988. Method for determination of Casson yield value and plastic viscosity for chocolate. Manufacturing Confectioner
PRENTICE, J.H. and HUBER, D. 1983. Results of the collaborative study on measuring rheological properties of foodstuffs. In Physical Properties of Foods, (Jowitt, Escher, Hallstrom, Meffert, Spiess and Vos, eds.) pp. 123- 183, Applied Science.
ROUSSEEUW, P.J. and CROUX, C. 1993. Alternatives to the median absolute deviation, J. Am. Statistical Assoc. 88, 1273-1283.
WINDHAB. E.J. 1995. Rheology in food processing. In Physico-chemical Aspects of Food Processing, (Beckett, ed.) pp. 80-1 16, Chapman & Hall, London.
(January) 72-75.