Embed Size (px)
Citation preview
International Journal of Environment, Agriculture and Biotechnology (IJEAB) Vol-2, Issue-1, Jan-Feb- 2017
http://dx.doi.org/10.22161/ijeab/2.1.23 ISSN: 2456-1878
www.ijeab.com Page | 181
The Suitability of Groundwater for Domestic
and Irrigation Purposes: A Case Study of Ikere-
Ekiti, SW-Nigeria Talabi A.O.
Department of Geology, Ekiti State University, P. M. B. 5363, Ado-Ekiti, Nigeria.
Abstract— Shallow groundwater in Ikere-Ekiti was
assessed for potability and irrigation employing chemical
and bacterial analyses. Twenty two groundwater samples
were collected and analyzed using Atomic absorption
spectrometer for cations and ion chromatographic
method for anions determinations (˚C), pH and electrical
conductivity (EC) (µS/cm) were measured in the field
using pH Testr meter. The bacteriological analysis was
carried out using nutrient agar medium to obtain plate
count of living bacteria. Results of the analysis revealed
that all EC values were less than 1000µS/cm indicating
fresh water. The pH with average values of 9.48, 7.82 and
7.44 in migmatite, granite and charnockitic terrains
respectively exceeded the approved standard (6.5 – 8.5)
for drinking water in two samples from migmatite, one
sample from granitic terrain and none from the
charnockites. Sodium was the dominant cation with
average concentrations (mg/L) of 95.65, 38.33 and 6.61
in migmatite, granite and charnockite respectively while
K+ ions in the same order of rock units have average
concentrations (mg/L) of 60.49, 32.33 and 15.77. The
average concentrations (mg/L) of Ca2+ ions in
groundwater located on migmatite, granite and
charnockitic terrains were 36.67, 24.63 and 10.98
respectively while those for Mg2+ were 9.94, 7.48 and
4.57. The order of cation abundance was Na+> K+ >
Ca2+> Mg2+. In respect of the major anions, Cl- was
dominant with average concentrations (mg/L) in
charnockites (187.20) within approved standard of
250mg/L while the average values (mg/L) in migmatite
(475.2) and granite (340.62) exceeded the standard value.
Following the same sequence of rock units, HCO3-
average concentrations (mg/L) were 34.6mg/L,
27.07mg/L and 25.7. Sulphate and nitrate were less
dominant ions and the order of anions abundance in the
groundwater was Cl- > HCO3-> SO4
2-> NO3-. Bacteria
evaluation revealed that all sampled groundwater tested
positive to bacteria with TBC values (CFU/100ml)
ranging from 1.76X10⁸ to 1.78X10⁹ in migmatite, 5.3x10⁵
to 8.9x10⁸ in granite and 2.55x10⁷ to 8.2x10⁸ in
charnockite. Gibb’s diagram revealed that chemical
weathering of rock-forming minerals has contributed to
solute source in the groundwater of the area. Water type
on migmatite was mainly NaCl while granite and
charnockite had NaCl and CaCl types revealing
lithologic effects. Irrigation water quality assessment
employing Sodium absorption ratio (SAR), Soluble
sodium percent (SSP), Residual sodium bicarbonate
(RSBC) and Permeability index (PI) revealed that the
groundwater is suitable for irrigation purpose.
Groundwater in the study area is low mineralized,
chemically potable, suitable for irrigation but infected by
bacteria pollutants. Differences in rock types affected the
chemistry of the groundwater as reflected in their
physico-chemical compositions, water facies and
irrigation quality.
Keywords— Rock units, groundwater, potable, bacteria,
irrigation.
I. INTRODUCTION
All over the world, population surge, industrialization and
rising standards of living have put water demand on the
rise; though without corresponding increase in the
required quantity of the resource (Ali 2012). Records of
population in Nigeria revealed that the population of the
study area (Ikere-Ekiti) was 59,257 in 1963, 114,780 in
1991 and 147,355 in 2006 (NPC 2006). The population of
the area will continue to increase considering the fact that
the study area is the gateway to Ekiti-State and its
nearness to Ado-Ekiti, the state capital has resulted into
human migration into the town. With increasing
population and reduction in surface water supply during
the dry season and contamination by floods during the
rainy season, the increase in demand for domestic water
can only be met through digging of localized shallow
wells that tap the small discrete bodies of groundwater
present in the weathered zone of basement terrains of the
area. In addition to the above crucial factors, the rock
types in an area, particularly the thickness of their
weathered products/fracture characteristics and rainfall
contribute greatly to the chemistry of its groundwater.
This in essence determines groundwater suitability for
domestic, agricultural and industrial application. As
groundwater migrates, it reacts with the minerals that
International Journal of Environment, Agriculture and Biotechnology (IJEAB) Vol-2, Issue-1, Jan-Feb- 2017
http://dx.doi.org/10.22161/ijeab/2.1.23 ISSN: 2456-1878
www.ijeab.com Page | 182
make up the host-rocks. These mineral may be soluble
and percolate into the groundwater system thereby
altering the exisisting geochemical characteristics of the
groundwater. It is obvious that groundwater can be
contaminated through natural processes such as chemical
weathering and dissolution (Abimbola et al. 2002; Amadi
et al. 2015). Thus, water- rock interactions alter greatly
the chemistry of groundwater apart from contributions
from anthropogenic contaminants. Groundwater is
generally preferred to surface water due to natural
protection from pathogenic contamination and buffer
against climatic variability. At Ikere-Ekiti, access to
groundwater provides the only realistic option for a
sustainable safe drinking water supply. The town has
sizable numbers of boreholes and wells which if properly
managed will serve as recipe to safe drinking water.
Specific publications on the study area are few. Odeyemi
et al. (2011) worked on Bacteriological, Physicochemical
and Mineral Studies of Water Samples from Artesian
bore-hole, spring and Hand dug well located at Oke-Osun
of the study area and concluded that the groundwater was
contaminated by bacteria. Aturamu (2012) also concluded
that the groundwater at Ikere-Ekiti was contaminated
bacteriologically. Similar researches in other parts of
Ekiti-State (Omotoyinbo 2007; Ayodele and Aturamu
2011) as well as the work of Talabi and Ogundana (2014)
covering the whole state also revealed bacterial
contamination of groundwater.
Groundwater regime is dynamic and possible
amelioration of bacterial contamination of groundwater in
the area cannot be ruled out especially with recent health
education in the state. However, according to World
Health Organization (2004) about 85% of communicable
diseases are water borne or water related. The quality of
groundwater in an area is a function of its chemistry and
the nature of the aquifer characteristics (Amadi et al.
2015). Groundwater quality appraisal is gaining
importance, due to intense urbanization, industrialization
and agricultural activities putting the soil and
groundwater to greater risk of contamination (Sayyed and
Wagh, 2011; Tiwari 2011). Water pollution also threats
human health, economic development and social
prosperity (Milovanovic 2007).
This study was tailored towards assessing the suitability
of groundwater at Ikere-Ekiti for domestic and irrigation
purposes. The research attempted deciphering the effects
of rock units on the chemistry of the groundwater and
discussed potential adverse chemical/health effects of the
groundwater on domestic uses and irrigation.
II. LOCATION, GEOLOGY AND
HYDROGEOLOGY OF THE STUDY AREA
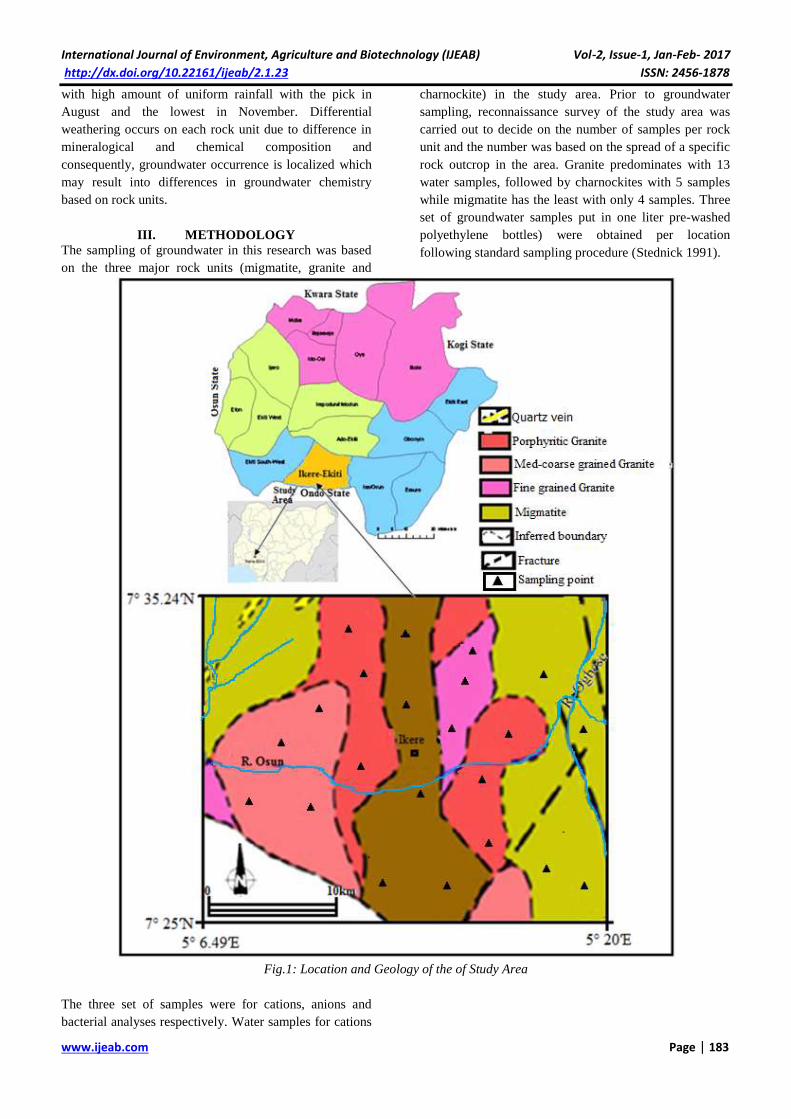
Ikere-Ekiti is situated in the southern part of Ekiti-State,
southwestern Nigeria between latitudes 7° 29′ and 7°
31′N and longitudes 5° 12′ and 5° 14′E covering a total
area of 346.5 km2. It is a town endowed with magnificent
hills, including Orole and Olosunta. The town is the
gateway to Ekiti State, located between Ado-Ekiti (the
capital of Ekiti State) and Akure (the capital of Ondo
State) (Fig. 1). The town is situated in the humid tropical
region and rugged basement terrain that is generally 250m
above sea level. The mean annual rainfall is 1500mm
while the annual temperature ranged from 23 - 28°C with
mean annual relative humidity of 75%.
Geologically, Ikere-Ekiti is underlain by crystalline
igneous and metamorphic rocks of the Precambrian
basement complex. The area is made up of migmatite-
gneiss quartzite complex, charnockites and Older
granites. The Precambrian basement complex was
affected by the Pan-African orogeny (600Ma±150Ma)
thereby occupying the re-activated region which resulted
from the plate collision between the passive continental
margin of the West African Craton and the active
Pheurasian continental margin (Burke and Dewey 1972;
Dada 2006).
The migmatite-gneiss complex is the most widespread
and abundant rock type in the Basement Complex into
which other successions of rocks have been emplaced
(McCurr 1973; Rahaman 1988).
The Older Granites and charnockites occur as intrusive
bodies of various dimensions in the pre-existing basement
rocks, that is, the migmatite-gneiss units and the schist
belts. One striking feature of the older granites is their
occurrence as picturesque inselbergs and such prominent
hills rising sharply above their surrounding plains in the
study area include Olsunta and Orole hills. The
charnockitic rocks outcropped as oval or semi-circular
hills of between five and ten meters (10m) high with a lot
of boulders at some outcrops. Most of the charnockitic
rocks in the study area occurr along the margins of Older
Granites bodies especially the porphyritic granites.
Differential weathering occurs on each rock unit due to
difference in mineralogical and chemical composition and
consequently, groundwater occurrence is localized and
these variations may result into differences in
groundwater chemistry based on rock units.
The major surface water in the study area is river Osun
rising from the hills at the western end of the area with
highest topographical point of 598m above main sea
level. River Owururu is a major tributary which along
with other tributaries/streams meander through
intersecting valleys. The volume of water in the streams
depends on the response to wet and dry seasons. During
the rainy season, there is a great increase in water volume
in the major rivers while there is hardly water in some of
the streams during the dry season. Rainfall is the
dominant factor that determines the occurrences of
groundwater. Rainy season, in the area is characterized
International Journal of Environment, Agriculture and Biotechnology (IJEAB) Vol-2, Issue-1, Jan-Feb- 2017
http://dx.doi.org/10.22161/ijeab/2.1.23 ISSN: 2456-1878
www.ijeab.com Page | 183
with high amount of uniform rainfall with the pick in
August and the lowest in November. Differential
weathering occurs on each rock unit due to difference in
mineralogical and chemical composition and
consequently, groundwater occurrence is localized which
may result into differences in groundwater chemistry
based on rock units.
III. METHODOLOGY
The sampling of groundwater in this research was based
on the three major rock units (migmatite, granite and
charnockite) in the study area. Prior to groundwater
sampling, reconnaissance survey of the study area was
carried out to decide on the number of samples per rock
unit and the number was based on the spread of a specific
rock outcrop in the area. Granite predominates with 13
water samples, followed by charnockites with 5 samples
while migmatite has the least with only 4 samples. Three
set of groundwater samples put in one liter pre-washed
polyethylene bottles) were obtained per location
following standard sampling procedure (Stednick 1991).
Fig.1: Location and Geology of the of Study Area
The three set of samples were for cations, anions and
bacterial analyses respectively. Water samples for cations
International Journal of Environment, Agriculture and Biotechnology (IJEAB) Vol-2, Issue-1, Jan-Feb- 2017
http://dx.doi.org/10.22161/ijeab/2.1.23 ISSN: 2456-1878
www.ijeab.com Page | 184
determination were acidified to a pH<4 using
concentrated Nitric acid and all samples were preserved
(refrigerated) prior to analyses.
Temperature, pH and EC of water samples were measured
in-situ employing portable pH Testr meter. In addition,
water level and depth of sampled wells were measured
using dip-meter. TDS was estimated in this research
employing the relationship that:
TDS = EC * 0.75. (1)
While total hardness (TH) was calculated using the
relation:
TH = 2.5Ca2+ + 4.1Mg2+ (Fournier, 1981) (2)
In this research all laboratory analyses were carried out at
Fatlab Nigeria Company limited, Ibadan Nigeria. Ions
analyses were carried out using Atomic absorption
spectrometer for cations and ion chromatographic method
for anions determinations.
The basic criterion by which the sanitary quality of water
may be judged is the kind and number of bacteria present
in it. The presence of the coliform group of bacteria in
water is accepted traditionally as an indication of
pathogenic content particularly Escheria coli which are
normal inhabitants of the large intestine of human begins
and other animals and are consequently present in faeces.
The samples were analyzed for bacteria count employing
nutrient organ medium to obtain plate count of living
bacteria.
Furthermore, the data from the hydrochemical analysis
were subjected to evaluation for irrigation purpose
employing sodium adsorption ratio (SAR) (Richard
1954), soluble sodium percentage (SSP) (Todd 1980),
residual sodium bicarbonate (RSBC) (Gupta 1983),
Kelly‘s ratio (KR) (Kelly 1963), permeability index (PI)
(Doneen 1964) and magnesium adsorption ratio (MR)
(Raghunath 1987). The irrigation parameters in this study
were estimated employing:
SAR = Na+ (3)
√ (Ca2+ + Mg2+)/2
SSP = Na++ K+ (4)
Ca2+ + Mg2+ + Na+ + K+
RSBC = HCO3- - Ca2+ (5)
KR = Na+ (6)
Ca2+ + Mg2+
PI = Na+ + √HCO3- x100 (7)
Ca2+ + Mg2+ + Na+
MAR = Mg2+ x100
Ca2+ + Mg2+
Furthermore, the sodium in irrigation waters denoted as
per cent sodium was determined using the following
formula (Wilcox 1995);
% Na = (Na+) X 100/ (Ca2+ + Mg2+ + Na+ + K+) (8)
where the quantities of Ca2+, Mg2+, Na+ and K+ are
expressed in milliequivalents per litre (epm). Data
obtained from the analysis were subjected to statistical
evaluation employing Microsoft excel software.
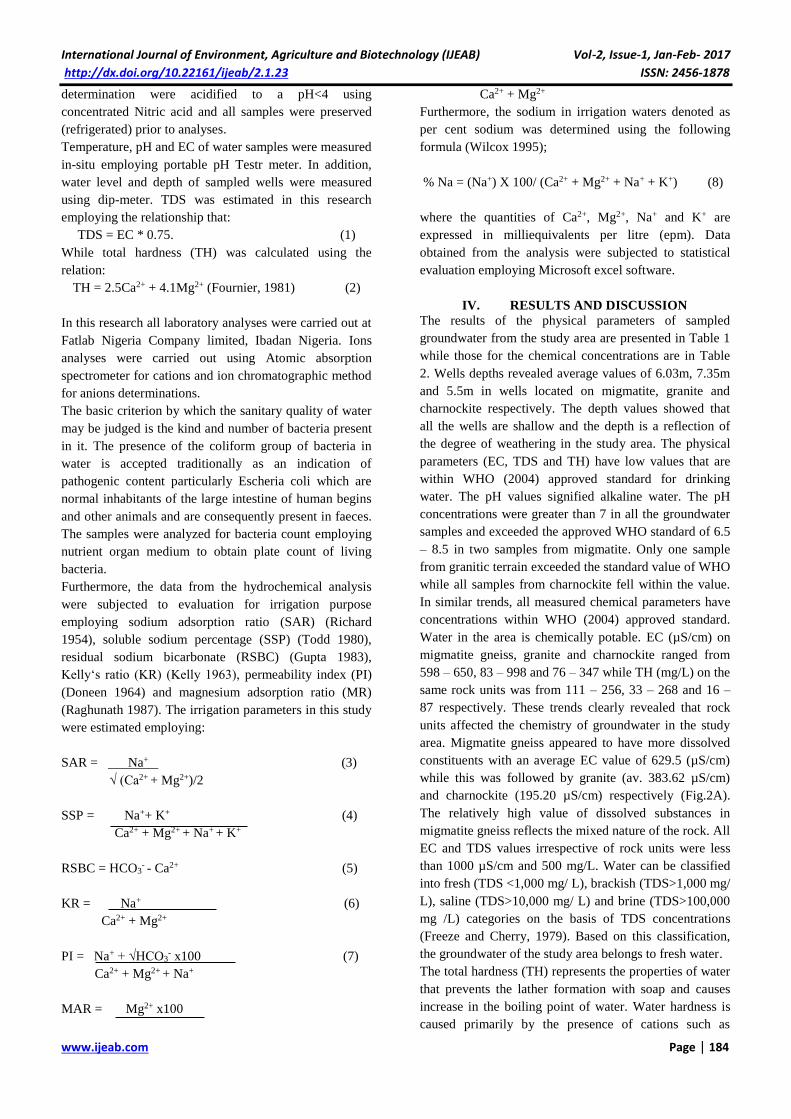
IV. RESULTS AND DISCUSSION
The results of the physical parameters of sampled
groundwater from the study area are presented in Table 1
while those for the chemical concentrations are in Table
2. Wells depths revealed average values of 6.03m, 7.35m
and 5.5m in wells located on migmatite, granite and
charnockite respectively. The depth values showed that
all the wells are shallow and the depth is a reflection of
the degree of weathering in the study area. The physical
parameters (EC, TDS and TH) have low values that are
within WHO (2004) approved standard for drinking
water. The pH values signified alkaline water. The pH
concentrations were greater than 7 in all the groundwater
samples and exceeded the approved WHO standard of 6.5
– 8.5 in two samples from migmatite. Only one sample
from granitic terrain exceeded the standard value of WHO
while all samples from charnockite fell within the value.
In similar trends, all measured chemical parameters have
concentrations within WHO (2004) approved standard.
Water in the area is chemically potable. EC (µS/cm) on
migmatite gneiss, granite and charnockite ranged from
598 – 650, 83 – 998 and 76 – 347 while TH (mg/L) on the
same rock units was from 111 – 256, 33 – 268 and 16 –
87 respectively. These trends clearly revealed that rock
units affected the chemistry of groundwater in the study
area. Migmatite gneiss appeared to have more dissolved
constituents with an average EC value of 629.5 (µS/cm)
while this was followed by granite (av. 383.62 µS/cm)
and charnockite (195.20 µS/cm) respectively (Fig.2A).
The relatively high value of dissolved substances in
migmatite gneiss reflects the mixed nature of the rock. All
EC and TDS values irrespective of rock units were less
than 1000 µS/cm and 500 mg/L. Water can be classified
into fresh (TDS <1,000 mg/ L), brackish (TDS>1,000 mg/
L), saline (TDS>10,000 mg/ L) and brine (TDS>100,000
mg /L) categories on the basis of TDS concentrations
(Freeze and Cherry, 1979). Based on this classification,
the groundwater of the study area belongs to fresh water.
The total hardness (TH) represents the properties of water
that prevents the lather formation with soap and causes
increase in the boiling point of water. Water hardness is
caused primarily by the presence of cations such as
International Journal of Environment, Agriculture and Biotechnology (IJEAB) Vol-2, Issue-1, Jan-Feb- 2017
http://dx.doi.org/10.22161/ijeab/2.1.23 ISSN: 2456-1878
www.ijeab.com Page | 185
calcium and magnesium and anions such as carbonate,
bicarbonate, chloride and sulfate in water. Hard water is
not suitable for domestic purpose. Water hardness has no
known adverse effects; however, some evidence indicates
its role in heart disease (Schroeder 1960). McGowan
(2000) indicated that water containing calcium carbonate
at concentrations below 60 mg/L is generally considered
as soft; moderately hard (60–120 mg/L), hard (120–180
mg/L) and very hard (>180 mg/L). Thus groundwater on
migmatite gneiss was in the moderately hard to vey hard
category while the groundwater from granite and
charnockite fell into soft to very hard and soft to
moderately hard classes respectively. Sixty percent (60%)
of groundwater from charnockitic terrain fell into the soft
water category while the remaining 40% were in
moderately hard class.
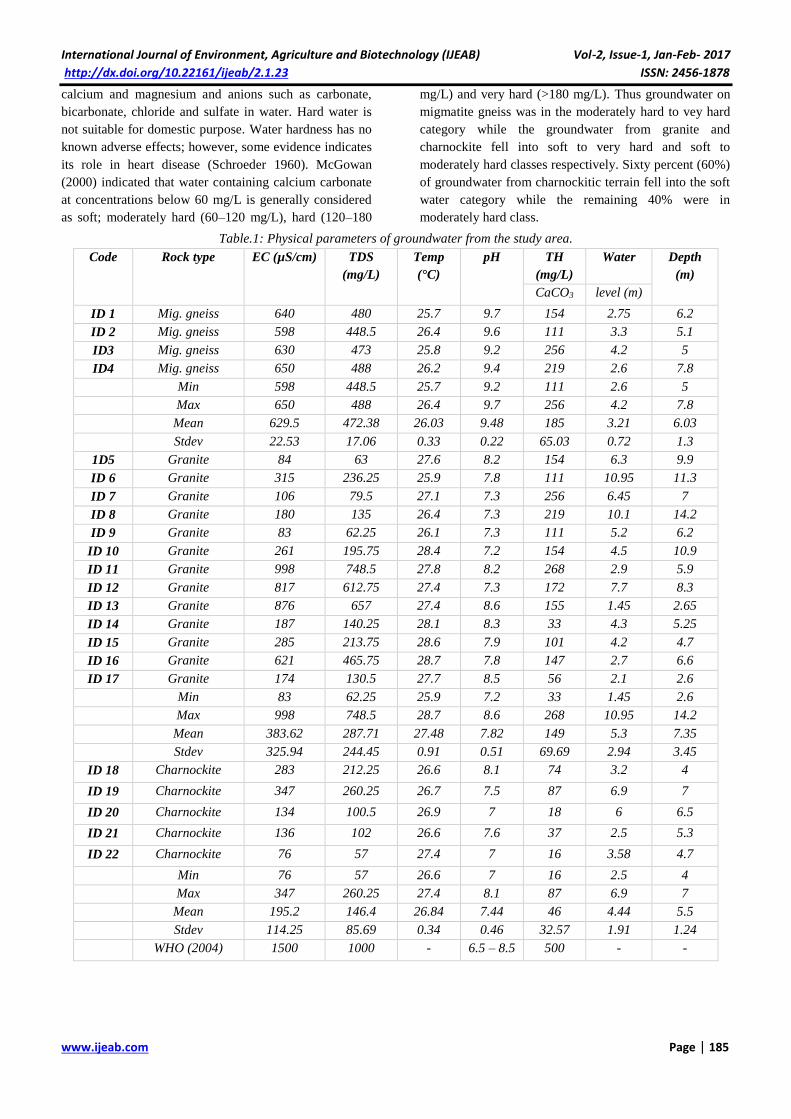
Table.1: Physical parameters of groundwater from the study area.
Code Rock type EC (µS/cm) TDS
(mg/L)
Temp
(°C)
pH TH
(mg/L)
Water Depth
(m)
CaCO3 level (m)
ID 1 Mig. gneiss 640 480 25.7 9.7 154 2.75 6.2
ID 2 Mig. gneiss 598 448.5 26.4 9.6 111 3.3 5.1
ID3 Mig. gneiss 630 473 25.8 9.2 256 4.2 5
ID4 Mig. gneiss 650 488 26.2 9.4 219 2.6 7.8
Min 598 448.5 25.7 9.2 111 2.6 5
Max 650 488 26.4 9.7 256 4.2 7.8
Mean 629.5 472.38 26.03 9.48 185 3.21 6.03
Stdev 22.53 17.06 0.33 0.22 65.03 0.72 1.3
1D5 Granite 84 63 27.6 8.2 154 6.3 9.9
ID 6 Granite 315 236.25 25.9 7.8 111 10.95 11.3
ID 7 Granite 106 79.5 27.1 7.3 256 6.45 7
ID 8 Granite 180 135 26.4 7.3 219 10.1 14.2
ID 9 Granite 83 62.25 26.1 7.3 111 5.2 6.2
ID 10 Granite 261 195.75 28.4 7.2 154 4.5 10.9
ID 11 Granite 998 748.5 27.8 8.2 268 2.9 5.9
ID 12 Granite 817 612.75 27.4 7.3 172 7.7 8.3
ID 13 Granite 876 657 27.4 8.6 155 1.45 2.65
ID 14 Granite 187 140.25 28.1 8.3 33 4.3 5.25
ID 15 Granite 285 213.75 28.6 7.9 101 4.2 4.7
ID 16 Granite 621 465.75 28.7 7.8 147 2.7 6.6
ID 17 Granite 174 130.5 27.7 8.5 56 2.1 2.6
Min 83 62.25 25.9 7.2 33 1.45 2.6
Max 998 748.5 28.7 8.6 268 10.95 14.2
Mean 383.62 287.71 27.48 7.82 149 5.3 7.35
Stdev 325.94 244.45 0.91 0.51 69.69 2.94 3.45
ID 18 Charnockite 283 212.25 26.6 8.1 74 3.2 4
ID 19 Charnockite 347 260.25 26.7 7.5 87 6.9 7
ID 20 Charnockite 134 100.5 26.9 7 18 6 6.5
ID 21 Charnockite 136 102 26.6 7.6 37 2.5 5.3
ID 22 Charnockite 76 57 27.4 7 16 3.58 4.7
Min 76 57 26.6 7 16 2.5 4
Max 347 260.25 27.4 8.1 87 6.9 7
Mean 195.2 146.4 26.84 7.44 46 4.44 5.5
Stdev 114.25 85.69 0.34 0.46 32.57 1.91 1.24
WHO (2004) 1500 1000 - 6.5 – 8.5 500 - -
International Journal of Environment, Agriculture and Biotechnology (IJEAB) Vol-2, Issue-1, Jan-Feb- 2017
http://dx.doi.org/10.22161/ijeab/2.1.23 ISSN: 2456-1878
www.ijeab.com Page | 186
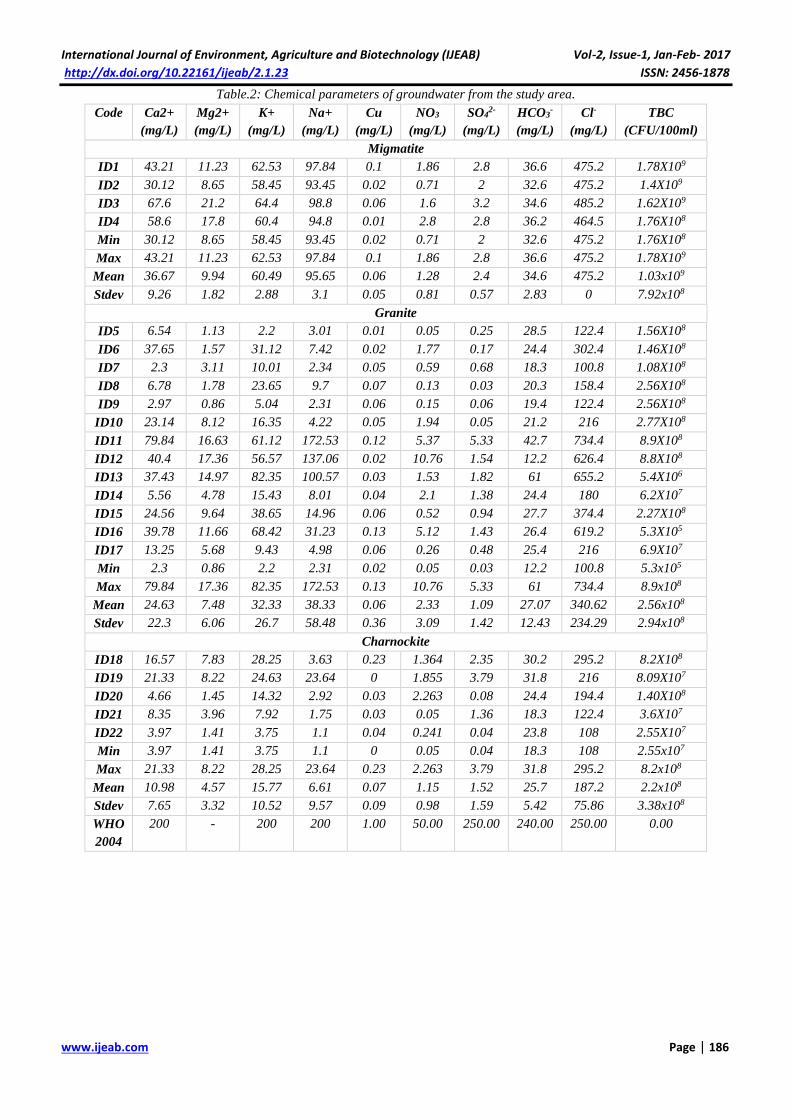
Table.2: Chemical parameters of groundwater from the study area.
Code Ca2+
(mg/L)
Mg2+
(mg/L)
K+
(mg/L)
Na+
(mg/L)
Cu
(mg/L)
NO3
(mg/L)
SO42-
(mg/L)
HCO3-
(mg/L)
Cl-
(mg/L)
TBC
(CFU/100ml)
Migmatite
ID1 43.21 11.23 62.53 97.84 0.1 1.86 2.8 36.6 475.2 1.78X10⁹
ID2 30.12 8.65 58.45 93.45 0.02 0.71 2 32.6 475.2 1.4X10⁹
ID3 67.6 21.2 64.4 98.8 0.06 1.6 3.2 34.6 485.2 1.62X10⁹
ID4 58.6 17.8 60.4 94.8 0.01 2.8 2.8 36.2 464.5 1.76X10⁸
Min 30.12 8.65 58.45 93.45 0.02 0.71 2 32.6 475.2 1.76X108
Max 43.21 11.23 62.53 97.84 0.1 1.86 2.8 36.6 475.2 1.78X10⁹
Mean 36.67 9.94 60.49 95.65 0.06 1.28 2.4 34.6 475.2 1.03x10⁹
Stdev 9.26 1.82 2.88 3.1 0.05 0.81 0.57 2.83 0 7.92x10⁸
Granite
ID5 6.54 1.13 2.2 3.01 0.01 0.05 0.25 28.5 122.4 1.56X10⁸
ID6 37.65 1.57 31.12 7.42 0.02 1.77 0.17 24.4 302.4 1.46X10⁸
ID7 2.3 3.11 10.01 2.34 0.05 0.59 0.68 18.3 100.8 1.08X10⁸
ID8 6.78 1.78 23.65 9.7 0.07 0.13 0.03 20.3 158.4 2.56X10⁸
ID9 2.97 0.86 5.04 2.31 0.06 0.15 0.06 19.4 122.4 2.56X10⁸
ID10 23.14 8.12 16.35 4.22 0.05 1.94 0.05 21.2 216 2.77X10⁸
ID11 79.84 16.63 61.12 172.53 0.12 5.37 5.33 42.7 734.4 8.9X10⁸
ID12 40.4 17.36 56.57 137.06 0.02 10.76 1.54 12.2 626.4 8.8X10⁸
ID13 37.43 14.97 82.35 100.57 0.03 1.53 1.82 61 655.2 5.4X10⁶
ID14 5.56 4.78 15.43 8.01 0.04 2.1 1.38 24.4 180 6.2X10⁷
ID15 24.56 9.64 38.65 14.96 0.06 0.52 0.94 27.7 374.4 2.27X10⁸
ID16 39.78 11.66 68.42 31.23 0.13 5.12 1.43 26.4 619.2 5.3X10⁵
ID17 13.25 5.68 9.43 4.98 0.06 0.26 0.48 25.4 216 6.9X10⁷
Min 2.3 0.86 2.2 2.31 0.02 0.05 0.03 12.2 100.8 5.3x105
Max 79.84 17.36 82.35 172.53 0.13 10.76 5.33 61 734.4 8.9x10⁸
Mean 24.63 7.48 32.33 38.33 0.06 2.33 1.09 27.07 340.62 2.56x10⁸
Stdev 22.3 6.06 26.7 58.48 0.36 3.09 1.42 12.43 234.29 2.94x10⁸
Charnockite
ID18 16.57 7.83 28.25 3.63 0.23 1.364 2.35 30.2 295.2 8.2X10⁸
ID19 21.33 8.22 24.63 23.64 0 1.855 3.79 31.8 216 8.09X10⁷
ID20 4.66 1.45 14.32 2.92 0.03 2.263 0.08 24.4 194.4 1.40X10⁸
ID21 8.35 3.96 7.92 1.75 0.03 0.05 1.36 18.3 122.4 3.6X10⁷
ID22 3.97 1.41 3.75 1.1 0.04 0.241 0.04 23.8 108 2.55X10⁷
Min 3.97 1.41 3.75 1.1 0 0.05 0.04 18.3 108 2.55x107
Max 21.33 8.22 28.25 23.64 0.23 2.263 3.79 31.8 295.2 8.2x10⁸
Mean 10.98 4.57 15.77 6.61 0.07 1.15 1.52 25.7 187.2 2.2x10⁸
Stdev 7.65 3.32 10.52 9.57 0.09 0.98 1.59 5.42 75.86 3.38x10⁸
WHO
2004
200 - 200 200 1.00 50.00 250.00 240.00 250.00 0.00
International Journal of Environment, Agriculture and Biotechnology (IJEAB) Vol-2, Issue-1, Jan-Feb- 2017
http://dx.doi.org/10.22161/ijeab/2.1.23 ISSN: 2456-1878
www.ijeab.com Page | 187
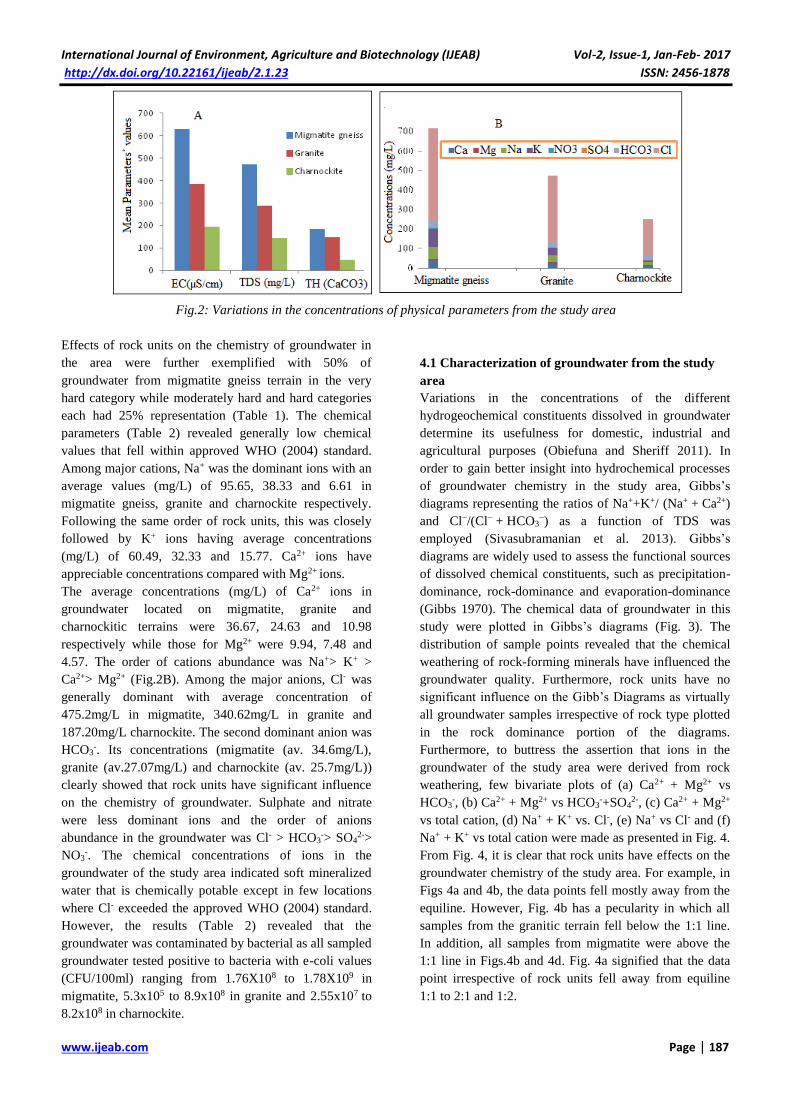
Fig.2: Variations in the concentrations of physical parameters from the study area
Effects of rock units on the chemistry of groundwater in
the area were further exemplified with 50% of
groundwater from migmatite gneiss terrain in the very
hard category while moderately hard and hard categories
each had 25% representation (Table 1). The chemical
parameters (Table 2) revealed generally low chemical
values that fell within approved WHO (2004) standard.
Among major cations, Na+ was the dominant ions with an
average values (mg/L) of 95.65, 38.33 and 6.61 in
migmatite gneiss, granite and charnockite respectively.
Following the same order of rock units, this was closely
followed by K+ ions having average concentrations
(mg/L) of 60.49, 32.33 and 15.77. Ca2+ ions have
appreciable concentrations compared with Mg2+ ions.
The average concentrations (mg/L) of Ca2+ ions in
groundwater located on migmatite, granite and
charnockitic terrains were 36.67, 24.63 and 10.98
respectively while those for Mg2+ were 9.94, 7.48 and
4.57. The order of cations abundance was Na+> K+ >
Ca2+> Mg2+ (Fig.2B). Among the major anions, Cl- was
generally dominant with average concentration of
475.2mg/L in migmatite, 340.62mg/L in granite and
187.20mg/L charnockite. The second dominant anion was
HCO3-. Its concentrations (migmatite (av. 34.6mg/L),
granite (av.27.07mg/L) and charnockite (av. 25.7mg/L))
clearly showed that rock units have significant influence
on the chemistry of groundwater. Sulphate and nitrate
were less dominant ions and the order of anions
abundance in the groundwater was Cl- > HCO3-> SO4
2->
NO3-. The chemical concentrations of ions in the
groundwater of the study area indicated soft mineralized
water that is chemically potable except in few locations
where Cl- exceeded the approved WHO (2004) standard.
However, the results (Table 2) revealed that the
groundwater was contaminated by bacterial as all sampled
groundwater tested positive to bacteria with e-coli values
(CFU/100ml) ranging from 1.76X10⁸ to 1.78X10⁹ in
migmatite, 5.3x10⁵ to 8.9x10⁸ in granite and 2.55x10⁷ to
8.2x10⁸ in charnockite.
4.1 Characterization of groundwater from the study
area
Variations in the concentrations of the different
hydrogeochemical constituents dissolved in groundwater
determine its usefulness for domestic, industrial and
agricultural purposes (Obiefuna and Sheriff 2011). In
order to gain better insight into hydrochemical processes
of groundwater chemistry in the study area, Gibbs’s
diagrams representing the ratios of Na++K+/ (Na+ + Ca2+)
and Cl−/(Cl− + HCO3−) as a function of TDS was
employed (Sivasubramanian et al. 2013). Gibbs’s
diagrams are widely used to assess the functional sources
of dissolved chemical constituents, such as precipitation-
dominance, rock-dominance and evaporation-dominance
(Gibbs 1970). The chemical data of groundwater in this
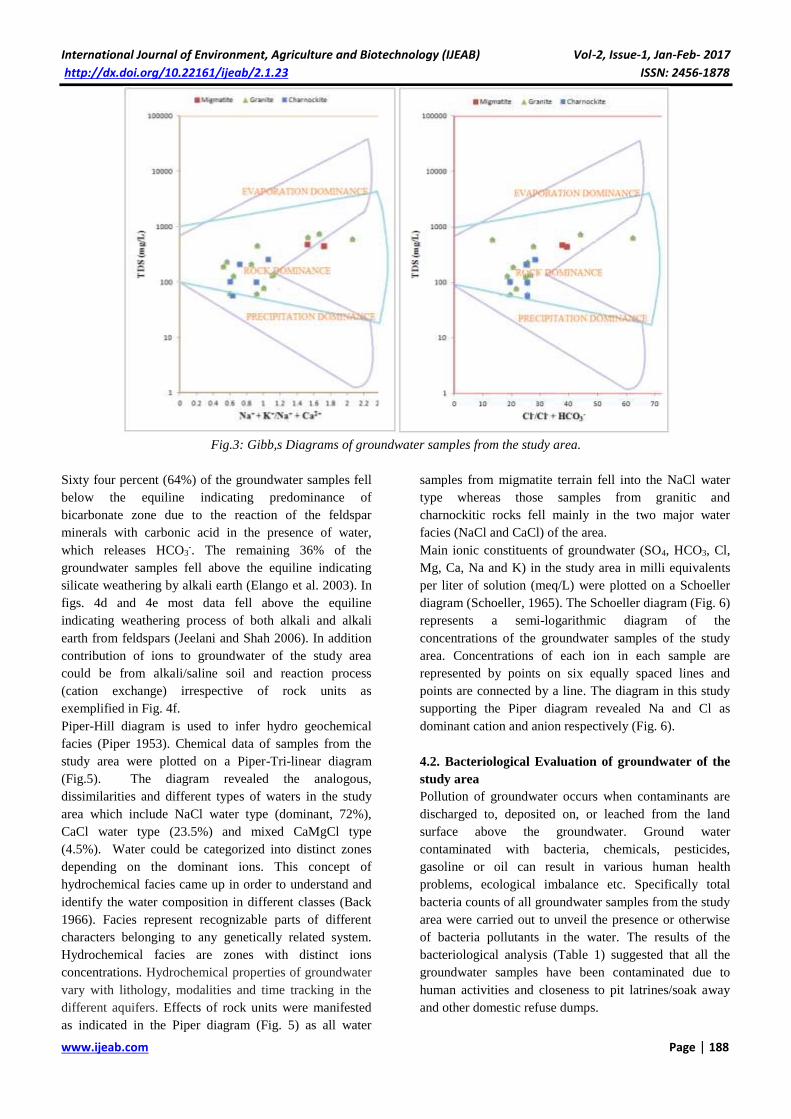
study were plotted in Gibbs’s diagrams (Fig. 3). The
distribution of sample points revealed that the chemical
weathering of rock-forming minerals have influenced the
groundwater quality. Furthermore, rock units have no
significant influence on the Gibb’s Diagrams as virtually
all groundwater samples irrespective of rock type plotted
in the rock dominance portion of the diagrams.
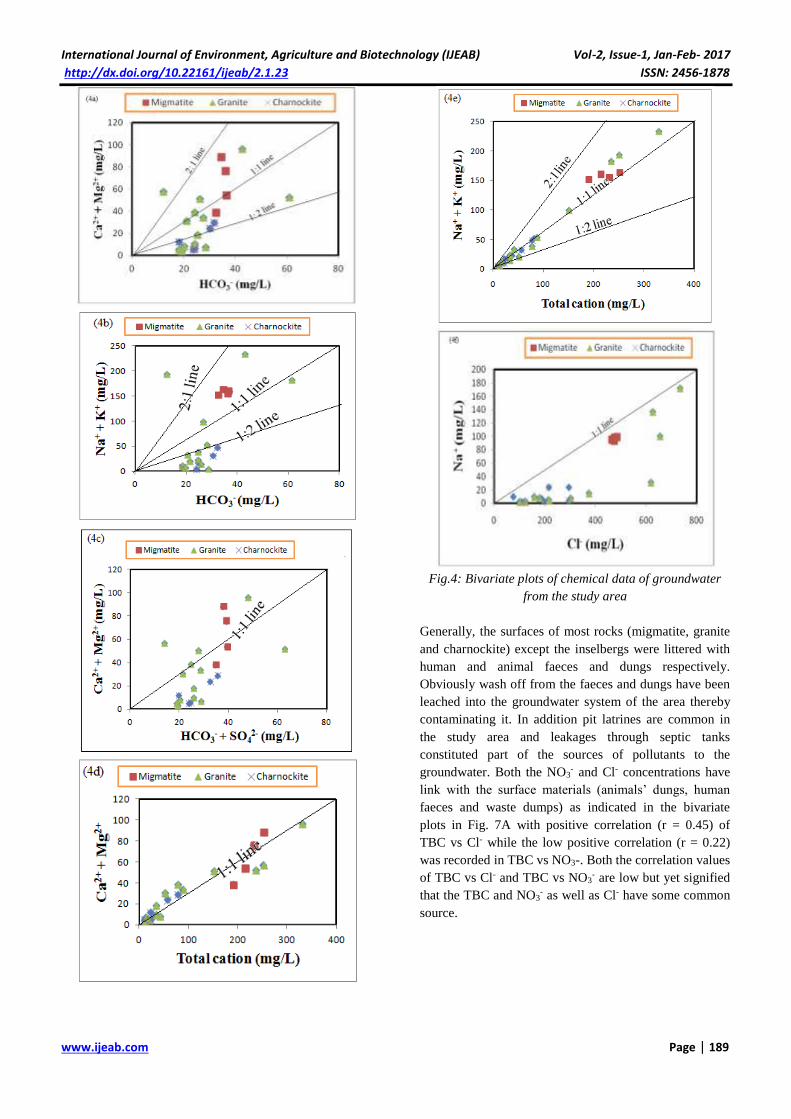
Furthermore, to buttress the assertion that ions in the
groundwater of the study area were derived from rock
weathering, few bivariate plots of (a) Ca2+ + Mg2+ vs
HCO3-, (b) Ca2+ + Mg2+ vs HCO3
-+SO42-, (c) Ca2+ + Mg2+
vs total cation, (d) Na+ + K+ vs. Cl-, (e) Na+ vs Cl- and (f)
Na+ + K+ vs total cation were made as presented in Fig. 4.
From Fig. 4, it is clear that rock units have effects on the
groundwater chemistry of the study area. For example, in
Figs 4a and 4b, the data points fell mostly away from the
equiline. However, Fig. 4b has a pecularity in which all
samples from the granitic terrain fell below the 1:1 line.
In addition, all samples from migmatite were above the
1:1 line in Figs.4b and 4d. Fig. 4a signified that the data
point irrespective of rock units fell away from equiline
1:1 to 2:1 and 1:2.
International Journal of Environment, Agriculture and Biotechnology (IJEAB) Vol-2, Issue-1, Jan-Feb- 2017
http://dx.doi.org/10.22161/ijeab/2.1.23 ISSN: 2456-1878
www.ijeab.com Page | 188
Fig.3: Gibb,s Diagrams of groundwater samples from the study area.
Sixty four percent (64%) of the groundwater samples fell
below the equiline indicating predominance of
bicarbonate zone due to the reaction of the feldspar
minerals with carbonic acid in the presence of water,
which releases HCO3-. The remaining 36% of the
groundwater samples fell above the equiline indicating
silicate weathering by alkali earth (Elango et al. 2003). In
figs. 4d and 4e most data fell above the equiline
indicating weathering process of both alkali and alkali
earth from feldspars (Jeelani and Shah 2006). In addition
contribution of ions to groundwater of the study area
could be from alkali/saline soil and reaction process
(cation exchange) irrespective of rock units as
exemplified in Fig. 4f.
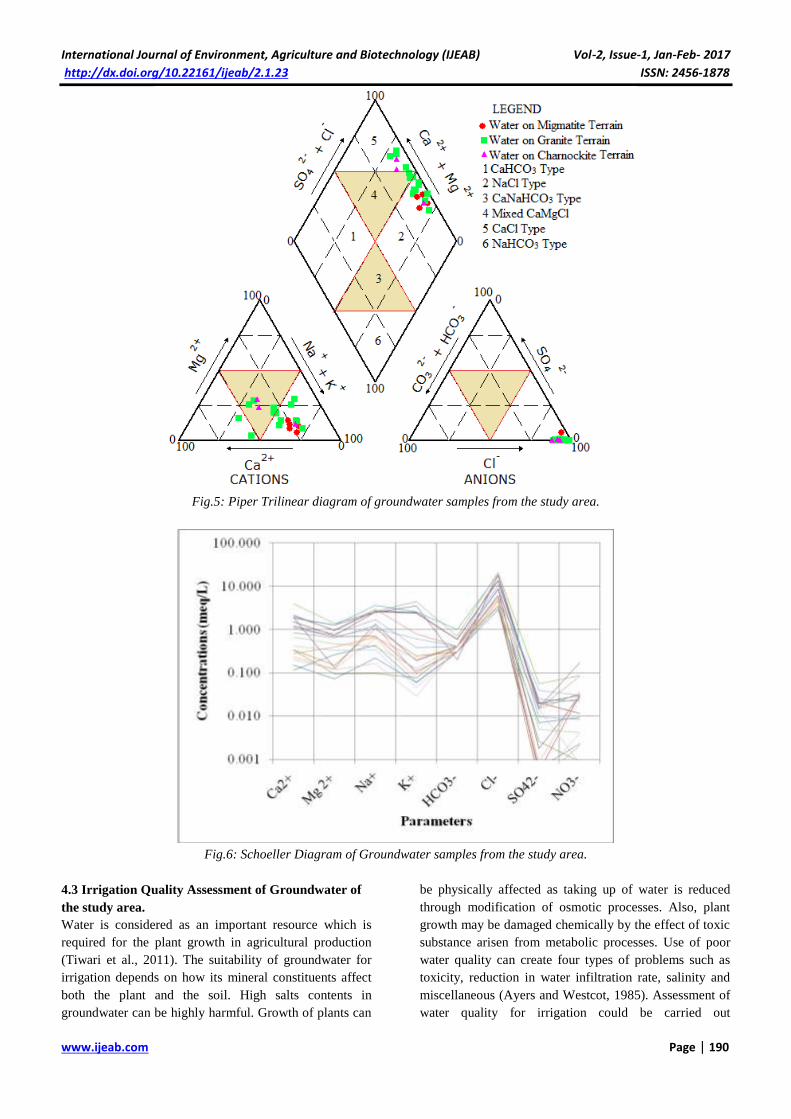
Piper-Hill diagram is used to infer hydro geochemical
facies (Piper 1953). Chemical data of samples from the
study area were plotted on a Piper-Tri-linear diagram
(Fig.5). The diagram revealed the analogous,
dissimilarities and different types of waters in the study
area which include NaCl water type (dominant, 72%),
CaCl water type (23.5%) and mixed CaMgCl type
(4.5%). Water could be categorized into distinct zones
depending on the dominant ions. This concept of
hydrochemical facies came up in order to understand and
identify the water composition in different classes (Back
1966). Facies represent recognizable parts of different
characters belonging to any genetically related system.
Hydrochemical facies are zones with distinct ions
concentrations. Hydrochemical properties of groundwater
vary with lithology, modalities and time tracking in the
different aquifers. Effects of rock units were manifested
as indicated in the Piper diagram (Fig. 5) as all water
samples from migmatite terrain fell into the NaCl water
type whereas those samples from granitic and
charnockitic rocks fell mainly in the two major water
facies (NaCl and CaCl) of the area.
Main ionic constituents of groundwater (SO4, HCO3, Cl,
Mg, Ca, Na and K) in the study area in milli equivalents
per liter of solution (meq/L) were plotted on a Schoeller
diagram (Schoeller, 1965). The Schoeller diagram (Fig. 6)
represents a semi-logarithmic diagram of the
concentrations of the groundwater samples of the study
area. Concentrations of each ion in each sample are
represented by points on six equally spaced lines and
points are connected by a line. The diagram in this study
supporting the Piper diagram revealed Na and Cl as
dominant cation and anion respectively (Fig. 6).
4.2. Bacteriological Evaluation of groundwater of the
study area
Pollution of groundwater occurs when contaminants are
discharged to, deposited on, or leached from the land
surface above the groundwater. Ground water
contaminated with bacteria, chemicals, pesticides,
gasoline or oil can result in various human health
problems, ecological imbalance etc. Specifically total
bacteria counts of all groundwater samples from the study
area were carried out to unveil the presence or otherwise
of bacteria pollutants in the water. The results of the
bacteriological analysis (Table 1) suggested that all the
groundwater samples have been contaminated due to
human activities and closeness to pit latrines/soak away
and other domestic refuse dumps.
International Journal of Environment, Agriculture and Biotechnology (IJEAB) Vol-2, Issue-1, Jan-Feb- 2017
http://dx.doi.org/10.22161/ijeab/2.1.23 ISSN: 2456-1878
www.ijeab.com Page | 189
Fig.4: Bivariate plots of chemical data of groundwater
from the study area
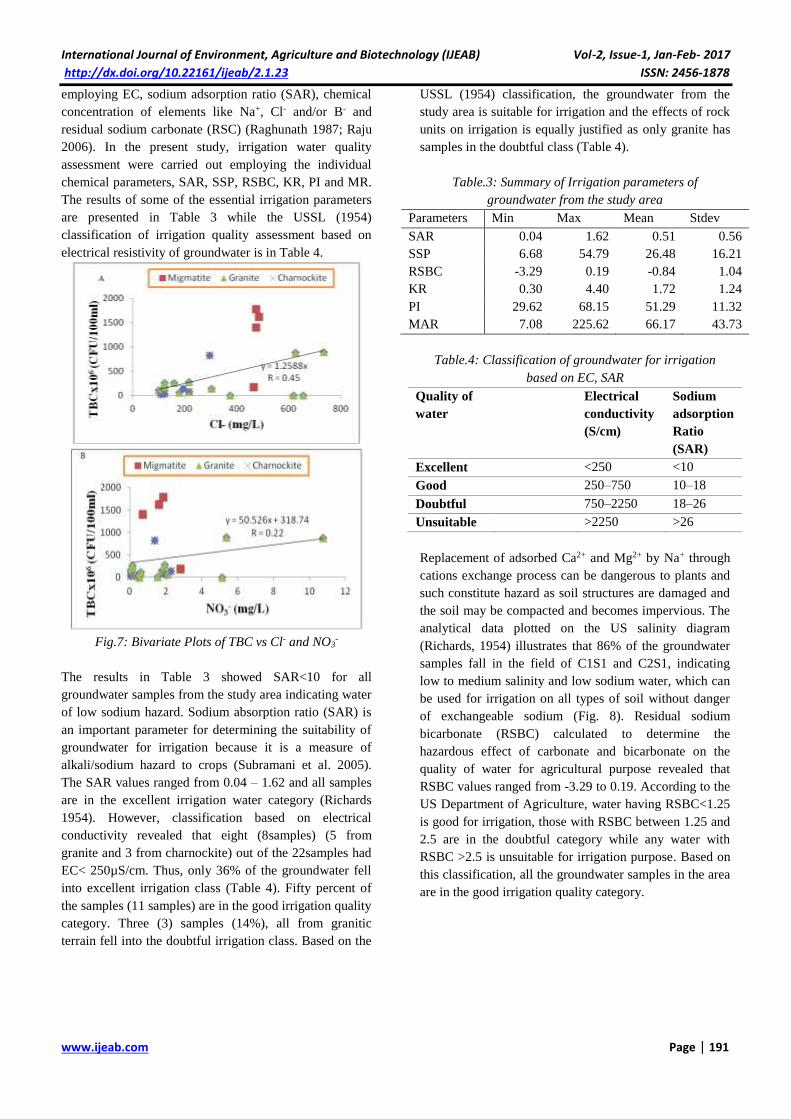
Generally, the surfaces of most rocks (migmatite, granite
and charnockite) except the inselbergs were littered with
human and animal faeces and dungs respectively.
Obviously wash off from the faeces and dungs have been
leached into the groundwater system of the area thereby
contaminating it. In addition pit latrines are common in
the study area and leakages through septic tanks
constituted part of the sources of pollutants to the
groundwater. Both the NO3- and Cl- concentrations have
link with the surface materials (animals’ dungs, human
faeces and waste dumps) as indicated in the bivariate
plots in Fig. 7A with positive correlation (r = 0.45) of
TBC vs Cl- while the low positive correlation (r = 0.22)
was recorded in TBC vs NO3-. Both the correlation values
of TBC vs Cl- and TBC vs NO3- are low but yet signified
that the TBC and NO3- as well as Cl- have some common
source.
International Journal of Environment, Agriculture and Biotechnology (IJEAB) Vol-2, Issue-1, Jan-Feb- 2017
http://dx.doi.org/10.22161/ijeab/2.1.23 ISSN: 2456-1878
www.ijeab.com Page | 190
Fig.5: Piper Trilinear diagram of groundwater samples from the study area.
Fig.6: Schoeller Diagram of Groundwater samples from the study area.
4.3 Irrigation Quality Assessment of Groundwater of
the study area.
Water is considered as an important resource which is
required for the plant growth in agricultural production
(Tiwari et al., 2011). The suitability of groundwater for
irrigation depends on how its mineral constituents affect
both the plant and the soil. High salts contents in
groundwater can be highly harmful. Growth of plants can
be physically affected as taking up of water is reduced
through modification of osmotic processes. Also, plant
growth may be damaged chemically by the effect of toxic
substance arisen from metabolic processes. Use of poor
water quality can create four types of problems such as
toxicity, reduction in water infiltration rate, salinity and
miscellaneous (Ayers and Westcot, 1985). Assessment of
water quality for irrigation could be carried out
International Journal of Environment, Agriculture and Biotechnology (IJEAB) Vol-2, Issue-1, Jan-Feb- 2017
http://dx.doi.org/10.22161/ijeab/2.1.23 ISSN: 2456-1878
www.ijeab.com Page | 191
employing EC, sodium adsorption ratio (SAR), chemical
concentration of elements like Na+, Cl- and/or B- and
residual sodium carbonate (RSC) (Raghunath 1987; Raju
2006). In the present study, irrigation water quality
assessment were carried out employing the individual
chemical parameters, SAR, SSP, RSBC, KR, PI and MR.
The results of some of the essential irrigation parameters
are presented in Table 3 while the USSL (1954)
classification of irrigation quality assessment based on
electrical resistivity of groundwater is in Table 4.
Fig.7: Bivariate Plots of TBC vs Cl- and NO3
-
The results in Table 3 showed SAR<10 for all
groundwater samples from the study area indicating water
of low sodium hazard. Sodium absorption ratio (SAR) is
an important parameter for determining the suitability of
groundwater for irrigation because it is a measure of
alkali/sodium hazard to crops (Subramani et al. 2005).
The SAR values ranged from 0.04 – 1.62 and all samples
are in the excellent irrigation water category (Richards
1954). However, classification based on electrical
conductivity revealed that eight (8samples) (5 from
granite and 3 from charnockite) out of the 22samples had
EC< 250µS/cm. Thus, only 36% of the groundwater fell
into excellent irrigation class (Table 4). Fifty percent of
the samples (11 samples) are in the good irrigation quality
category. Three (3) samples (14%), all from granitic
terrain fell into the doubtful irrigation class. Based on the
USSL (1954) classification, the groundwater from the
study area is suitable for irrigation and the effects of rock
units on irrigation is equally justified as only granite has
samples in the doubtful class (Table 4).
Table.3: Summary of Irrigation parameters of
groundwater from the study area
Parameters Min Max Mean Stdev
SAR 0.04 1.62 0.51 0.56
SSP 6.68 54.79 26.48 16.21
RSBC -3.29 0.19 -0.84 1.04
KR 0.30 4.40 1.72 1.24
PI 29.62 68.15 51.29 11.32
MAR 7.08 225.62 66.17 43.73
Table.4: Classification of groundwater for irrigation
based on EC, SAR
Quality of
water
Electrical
conductivity
(S/cm)
Sodium
adsorption
Ratio
(SAR)
Excellent <250 <10
Good 250–750 10–18
Doubtful 750–2250 18–26
Unsuitable >2250 >26
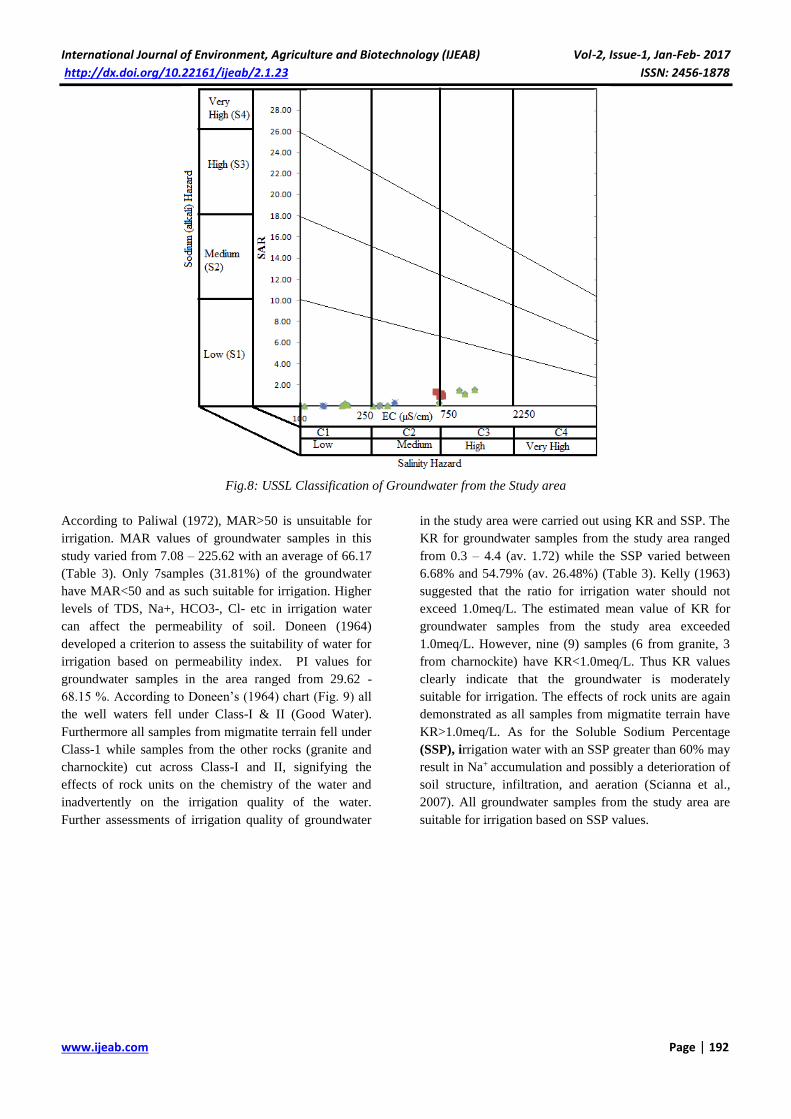
Replacement of adsorbed Ca2+ and Mg2+ by Na+ through
cations exchange process can be dangerous to plants and
such constitute hazard as soil structures are damaged and
the soil may be compacted and becomes impervious. The
analytical data plotted on the US salinity diagram
(Richards, 1954) illustrates that 86% of the groundwater
samples fall in the field of C1S1 and C2S1, indicating
low to medium salinity and low sodium water, which can
be used for irrigation on all types of soil without danger
of exchangeable sodium (Fig. 8). Residual sodium
bicarbonate (RSBC) calculated to determine the
hazardous effect of carbonate and bicarbonate on the
quality of water for agricultural purpose revealed that
RSBC values ranged from -3.29 to 0.19. According to the
US Department of Agriculture, water having RSBC<1.25
is good for irrigation, those with RSBC between 1.25 and
2.5 are in the doubtful category while any water with
RSBC >2.5 is unsuitable for irrigation purpose. Based on
this classification, all the groundwater samples in the area
are in the good irrigation quality category.
International Journal of Environment, Agriculture and Biotechnology (IJEAB) Vol-2, Issue-1, Jan-Feb- 2017
http://dx.doi.org/10.22161/ijeab/2.1.23 ISSN: 2456-1878
www.ijeab.com Page | 192
Fig.8: USSL Classification of Groundwater from the Study area
According to Paliwal (1972), MAR>50 is unsuitable for
irrigation. MAR values of groundwater samples in this
study varied from 7.08 – 225.62 with an average of 66.17
(Table 3). Only 7samples (31.81%) of the groundwater
have MAR<50 and as such suitable for irrigation. Higher
levels of TDS, Na+, HCO3-, Cl- etc in irrigation water
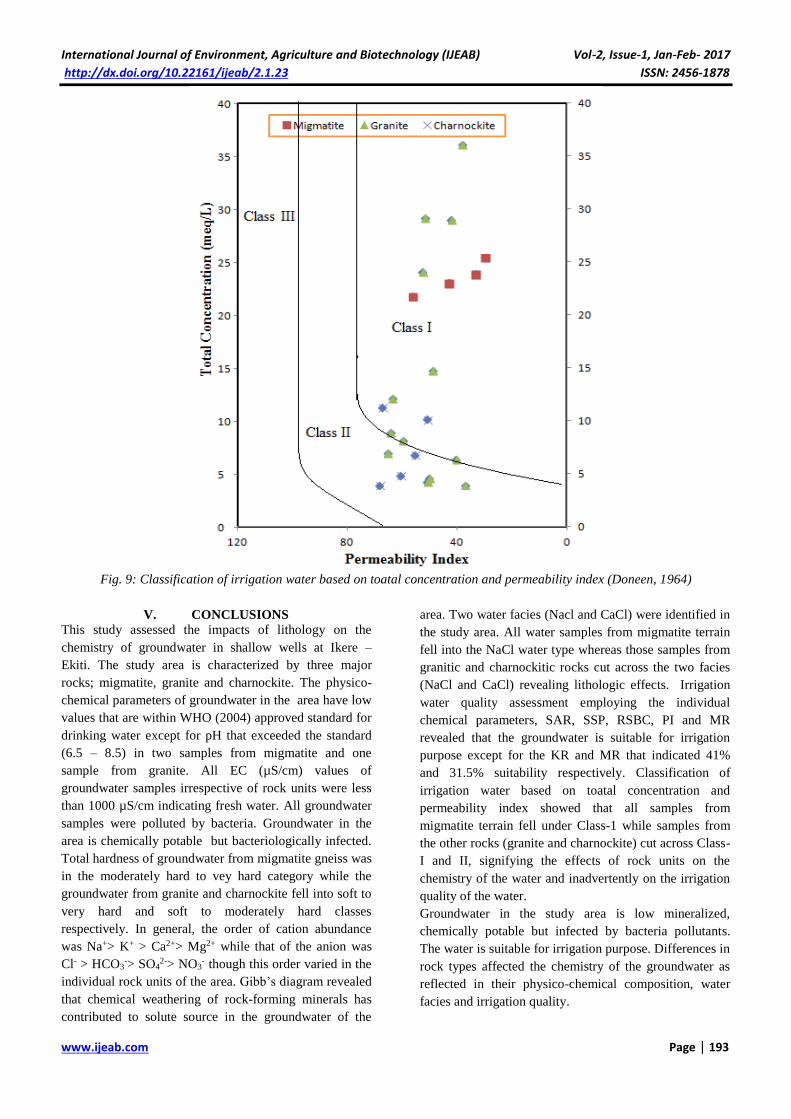
can affect the permeability of soil. Doneen (1964)
developed a criterion to assess the suitability of water for
irrigation based on permeability index. PI values for
groundwater samples in the area ranged from 29.62 -
68.15 %. According to Doneen’s (1964) chart (Fig. 9) all
the well waters fell under Class-I & II (Good Water).
Furthermore all samples from migmatite terrain fell under
Class-1 while samples from the other rocks (granite and
charnockite) cut across Class-I and II, signifying the
effects of rock units on the chemistry of the water and
inadvertently on the irrigation quality of the water.
Further assessments of irrigation quality of groundwater
in the study area were carried out using KR and SSP. The
KR for groundwater samples from the study area ranged
from 0.3 – 4.4 (av. 1.72) while the SSP varied between
6.68% and 54.79% (av. 26.48%) (Table 3). Kelly (1963)
suggested that the ratio for irrigation water should not
exceed 1.0meq/L. The estimated mean value of KR for
groundwater samples from the study area exceeded
1.0meq/L. However, nine (9) samples (6 from granite, 3
from charnockite) have KR<1.0meq/L. Thus KR values
clearly indicate that the groundwater is moderately
suitable for irrigation. The effects of rock units are again
demonstrated as all samples from migmatite terrain have
KR>1.0meq/L. As for the Soluble Sodium Percentage
(SSP), irrigation water with an SSP greater than 60% may
result in Na+ accumulation and possibly a deterioration of
soil structure, infiltration, and aeration (Scianna et al.,
2007). All groundwater samples from the study area are
suitable for irrigation based on SSP values.
International Journal of Environment, Agriculture and Biotechnology (IJEAB) Vol-2, Issue-1, Jan-Feb- 2017
http://dx.doi.org/10.22161/ijeab/2.1.23 ISSN: 2456-1878
www.ijeab.com Page | 193
Fig. 9: Classification of irrigation water based on toatal concentration and permeability index (Doneen, 1964)
V. CONCLUSIONS
This study assessed the impacts of lithology on the
chemistry of groundwater in shallow wells at Ikere –
Ekiti. The study area is characterized by three major
rocks; migmatite, granite and charnockite. The physico-
chemical parameters of groundwater in the area have low
values that are within WHO (2004) approved standard for
drinking water except for pH that exceeded the standard
(6.5 – 8.5) in two samples from migmatite and one
sample from granite. All EC (µS/cm) values of
groundwater samples irrespective of rock units were less
than 1000 µS/cm indicating fresh water. All groundwater
samples were polluted by bacteria. Groundwater in the
area is chemically potable but bacteriologically infected.
Total hardness of groundwater from migmatite gneiss was
in the moderately hard to vey hard category while the
groundwater from granite and charnockite fell into soft to
very hard and soft to moderately hard classes
respectively. In general, the order of cation abundance
was Na+> K+ > Ca2+> Mg2+ while that of the anion was
Cl- > HCO3-> SO4
2-> NO3- though this order varied in the
individual rock units of the area. Gibb’s diagram revealed
that chemical weathering of rock-forming minerals has
contributed to solute source in the groundwater of the
area. Two water facies (Nacl and CaCl) were identified in
the study area. All water samples from migmatite terrain
fell into the NaCl water type whereas those samples from
granitic and charnockitic rocks cut across the two facies
(NaCl and CaCl) revealing lithologic effects. Irrigation
water quality assessment employing the individual
chemical parameters, SAR, SSP, RSBC, PI and MR
revealed that the groundwater is suitable for irrigation
purpose except for the KR and MR that indicated 41%
and 31.5% suitability respectively. Classification of
irrigation water based on toatal concentration and
permeability index showed that all samples from
migmatite terrain fell under Class-1 while samples from
the other rocks (granite and charnockite) cut across Class-
I and II, signifying the effects of rock units on the
chemistry of the water and inadvertently on the irrigation
quality of the water.
Groundwater in the study area is low mineralized,
chemically potable but infected by bacteria pollutants.
The water is suitable for irrigation purpose. Differences in
rock types affected the chemistry of the groundwater as
reflected in their physico-chemical composition, water
facies and irrigation quality.
International Journal of Environment, Agriculture and Biotechnology (IJEAB) Vol-2, Issue-1, Jan-Feb- 2017
http://dx.doi.org/10.22161/ijeab/2.1.23 ISSN: 2456-1878
www.ijeab.com Page | 194
REFERENCES
[1] Abimbola AF, Odukoya AM, Adesanya OK (2002)
The environmental impact assessment of waste
disposal site on ground water in Oke Ado and
Lagos, southwestern Nigeria. Proceedings 15th
Annual conference Nigerian Association of
Hydrogeologists Kaduna, Nigeria, 42pp.
[2] Ali KA (2012) Development of Water Supply
Infrastructure in Nigeria: Challenges and Prospects.
Being 2012 Nigerian Society of Engineers October
Lecture.
[3] Amadi AN1, Tukur A, Okunlola, IA, Olasehinde,
PI1, Jimoh MO (2015) Lithologic Influence on the
Hydrogeochemical Characteristics of Groundwater
in Zango, North-west Nigeria
[4] Aturamu AO (2012) Physical, Chemical and
Bacterial Analyses of Groundwater in Ikere
Township, South western Nigeria. International
Journal of Science and Technology. Vol.2, No.5,
pp.301-308.
[5] Ayers RS, Westcot DW (1985) Water quality for
agriculture, irrigation and drainage (Paper No. 29).
FAO, Rome.
[6] Ayodele O S, Aturamu AO (2011) Portability Status
of Some Hand Dug Wells in Ekiti State,
Southwestern Nigeria. International Journal of
Science and Technology. Volume 1 No. 2, pp.102 –
109
[7] Back W (1966) Hydrochemical facies and
groundwater flow patterns in Northern part of
Atlantic Coastal Plain. USGS Professional Paper
498-A. Washington D. C.; USGS.
[8] Burke KC, Dewey FJ (1972) Orogeny in Africa. In:
Dessauvagie, T.F.J. and Whiteman, A.J., Ed.,
African Geology, Ibadan University Press, Ibadan,
583-608.
[9] Dada SS (2006) Proterozoic Evolution of Nigeria.
In: Oshi, O., Ed., The Basement Complex of Nigeria
and Its Mineral Resources (A Tribute to Prof.
M. A. O. Rahaman), Akin Jinad & Co., Ibadan, 29-
44.
[10] Doneen LD (1964) Notes on water quality in
agriculture. Davis: Water Science and Engineering,
University of California.
[11] Elango L, Kannan R, Senthilkumar M (2003) Major
ion chemistry and identification of
hydrogeochemical processes of ground water in a
part of Kancheepuram district, Tamil Nadu, India,
Environmental Geosciences, 10(4), pp 157–
166.
[12] Fournier RO (1981) Application of water
Geochemistry to geothermal exploration and
reservoir engineering in L. Rybach and L.J.P.
Muffler, eds., Geothermal Systems, Principles and
Case histories, John Wiley & Sons, New York. Pp.
109 – 143.
[13] Freeze RA, Cherry JA (1979) Groundwater.
Prentice-Hall, Englewood Cliffs, NJ USA.
[14] Gibbs RJ (1970) Mechanisms controlling world
water chemistry. Science 17:1088–1090
[15] Gupta, S. K. and Gupta, I. C. (1987). Management
of Saline Soil and Water. Oxford and IBH
Publication. Co. New Delhi, India, pp. 399.
[16] Jeelani G and Shah A Q 2006 Geochemical
characteristics of water and sediment from the Dal
Lake, Kashmir Himalaya, India: Constraints on
weathering and anthropogenic activity; Env. Geol.
50 12–23.
[17] Kelly W P (1963) Use of Saline Irrigation Water.
Soil Sci. Vol. 95(4):pp. 355-391.
[18] McCurry P (1973) Geology of Degree Sheet 21,
Zaria, Nigeria. Overseas Geol. Mineral Res., 10
(45): 1-45.
[19] Milovanovic Mimoza (2007). Water quality
assessment and determination of pollution sources
along the Axios/Vardar River, Southeastern Europe.
Science Direct, Desalination 213,l 159–173
[20] McGowan W (2000) Water processing: residential,
commercial, light-industrial, 3rd ed. Lisle, IL, Water
Quality Association.
[21] National Population Commision. (2006) 1963, 1991,
and 2006 Cencus of Each Local Government Area
of Ekiti State. Ado-Ekiti: National Population
Commision, Ekiti State Chapter.
[22] Obiefuna GI, Sheriff A (2011) Assessment of
shallow ground water quality of Pindiga Gombe
Area, Yola Area, NE, Nigeria for irrigation and
domestic purposes. Res J Environ Earth Sci
3(2):131–141
[23] Odeyemi AT, Akinjogunla OJ, Ojo MA (2011)
Bacteriological, Physicochemical and Mineral
Studies of Water Samples from Artesian bore-hole,
Spring and Hand dug Well located at Oke-Osun,
Ikere-Ekiti, Nigeria. Scholars Research Library
Archives of Applied Science Research, 3 (3):94-108
[24] Omotoyinbo OS (2007) Determination of the Level
of Contamination of Underground Water (hand- dug
well) by Organic Waste: A case Study of Ado-Ekiti,
Nigeria. Ethiopia Journ of Education and Sc, vol3
no1, P43-50
[25] Paliwal, K.V. (1972). Irrigation with saline water,
Monogram no. 2 (New series). New Delhi, IAR1,
p198.
[26] Piper AM (1953) A Graphic Procedure in the
Geochemical Interpretation of Water Analysis,
Washington D.C., United States Geological Survey.
ISBN ASIN: B0007HRZ36.
International Journal of Environment, Agriculture and Biotechnology (IJEAB) Vol-2, Issue-1, Jan-Feb- 2017
http://dx.doi.org/10.22161/ijeab/2.1.23 ISSN: 2456-1878
www.ijeab.com Page | 195
[27] Rahaman MA (1988) Recent Advances in the Study
of the Basement Complex of Nigeria. In:
Precambrian Geology of Nigeria,
Geological Survey of Nigeria Publication, 11-43.
[28] Raghunath IIM (1987) Groundwater. Second
edition; Wiley Eastern Ltd, New Delhi, India.
[29] Raju NJ (2006) “Hydrogeochemical parameters for
assessment of groundwater quality in the upper
Gunjanaeru River basin, Cuddapah District,
Andhara Pradesh, South India,” Environmental
Geology.
[30] Richards LA (1954) Diagnosis and improvement of
Saline and Alkali Soils. Agricultural Handbook 60,
USDA and IBH Publishing Co. Ltd. New
Delhi, India: pp 98-99.
[31] Sawyer CN, McCarty PL (1967) Chemistry for
sanitary engineers. McGraw-Hill, New York
[32] Sayyed MRG, Wagh GS (2011) An assessment of
groundwater quality for agricultural use: a case
study from solid waste disposal site SE of Pune,
India. Proceedings of the International Academy of
Ecology and Environmental Sciences, 1(3-4): 195-
201
[33] Schroeder HA (1960) Relations between hardness of
water and death rates from certain chronic and
degenerative diseases in the United States, J. Chron
disease, 12:586-591
[34] Schoeller H (1965) Qualitative evaluation of
groundwater resources. In: Methods and techniques
of groundwater investigations and development,
UNESCO, pp 54–83.
[35] Sivasubramanian P, Balasubramanian N,
Soundranayagam JP, Chandrasekar N (2013)
Hydrochemical characteristics of coastal aquifers of
Kadaladi, Ramanathapuram District, Tamilnadu,
India. Appl Water Sci 3:603–612
[36] Stednick JD (1991) “Wildland water quality
sampling and analysis,” Academic Press Inc., San
Deigo, 216p.
[37] Subramani T, Elango L, Damodarasamy SR (2005)
“Groundwater quality and its suitability for drinking
and agricultural use in Chithar River Basin, Tamil
Nadu, India,” Environmental Geology, Vol. 47, pp.
1099–1110.
[38] Talabi AO, Ogundana AK (2014) Bacteriological
Evaluation of Groundwater In Ekiti-State,
Southwestern Nigeria. International Journal
of Scientific & Technology research volume 3, issue
9, pp. 288 – 293.
[39] Todd KD (1980) Ground water hydrology. 2nd ed.
New York: John Wiley and Sons.
[40] Tiwari RN (2011). Assessment of groundwater
quality and pollution potential of Jawa Block Rewa
District, Madhya Pradesh, India. Proceedings of the
International Academy of Ecology and
Environmental Sciences, 2011, 1(3-4):202-212
[41] US Salinity Laboratory (1954) “Diagnosis and
improvement of saline and alkali soils,” Agricultural
Handbook, USDA, No. 60, pp. 160.
[42] World Health Organization (WHO) (2004)
Guidelines for Drinking-Water Quality. Third
Edition Incorporating the First and Second Addenda.
Vol. 1. Recommendations.