Embed Size (px)
Citation preview
International Migration, Remittances andSubsistence Farming: Evidence from Nepal
Amina Maharjan*, Siegfried Bauer* and Beatrice Knerr**
ABSTRACT
Although international migration is playing an increasingly important role in Nepal, atboth the macro and household levels, and in particular for the poverty reduction of ruralfamilies, empirical work focusing on this phenomenon has been largely absent. With aspecial view on the rural poor, in this paper we investigate the impact of internationallabour migration on subsistence agricultural production in the Western Mid Hills ofNepal, based on a survey conducted among smallholders with migrating family mem-bers. The results demonstrate that international migration leads to negligence of cereals– paddy, wheat, maize and millet, in particular, being the major subsistence crops. Whilebearing a negative impact on family labour input, its impact on hired farm labour ispositive. Yet it does not affect material inputs such as fertilizer, and although it helps toease households’ liquidity and capital constraints, it does not contribute to moving sub-sistence farming towards more profitable commercial farming. Therefore, althoughmigration reduces poverty in the short run and also allows for higher daily consumption,its negative impact on cereal production requires attention by policymakers.
INTRODUCTION
With increasing economic liberalization and globalization, and rapid progress in transportand communication facilities, international labour mobility has increased tremendously; andas a global phenomenon it affects almost all countries (see IOM, 2008). As migrants havebecome used to sending money back to those they have left behind, their remittances havebecome an essential means of livelihood security for hundreds of thousands of poor familiesworldwide and a major source of foreign exchange for many low-income countries. Theamount of such transfers reached almost US$300 billion in 2008 (World Bank, 2009).In the early twenty-first century, Nepal has developed into an important country of
out-migration. Migration from Nepal has expanded tremendously since the mid-1990s,accompanied by a continuous broadening of the variety of destinations. An estimated 17 percent of the country’s adult male (i.e. > 15 years) and 2 per cent of its female populationwere involved in migration in 2008 (CBS, 2009). Remittances to the country reached US$2.7billion in 2008 (MOF, 2010). In 2008, they contributed 22 per cent to GDP, thus gaining
* Department of Project and Regional Planning, University of Giessen, Germany.
** Department of Development Economics, Migration and Agricultural Policy (DEMAP), University of
Kassel, Germany.
� 2012 The AuthorsPublished by Blackwell Publishing Ltd., International Migration � 2012 IOM9600 Garsington Road, Oxford OX4 2DQ, UK, International Migrationand 350 Main Street, Malden, MA 02148, USA. ISSN 0020-7985
doi:10.1111/j.1468-2435.2012.00767.x
Nepal ninth position on the global scale of shares and the top position in South Asia (Rathaet al., 2010).In 2009, about 24 per cent of the population is estimated to have been living below the pov-
erty line of US$1 per day (MOF, 2010) Yet between the National Living Standard Surveys of1995 ⁄ 96 and 2003 ⁄04, the national headcount poverty rate declined from 42 per cent to 31 percent (in urban areas from 22% to 10%; and in rural areas from 43% to 35%), in spite of armedconflicts and poor economic growth (World Bank, 2006). Almost 20 per cent of the reduction inpoverty over that period can be attributed to increased labour migration as calculated byLokshin et al. (2007), which clearly indicates its importance for the poorer households.Agriculture is still the major economic sector in Nepal, contributing 33 per cent to the total
GDP and supporting about 75 per cent of the population (CBS, 2009). Hence, it is still thebasis of livelihoods for the majority of the population, particularly in rural areas. However,adverse weather conditions and structural limitations such as small land holdings and a lackof basic infrastructure and of mechanization constrain productivity and hinder the commer-cialization of products. Cereals are the predominant crops, but they earn little cash incomefor the farm households. Livelihood strategies in rural Nepal essentially consist of three com-ponents: subsistence agriculture production, wage labour and migration, and improvementsin all these sectors are important in order to alleviate the poverty situation in rural Nepal.Rural households in Nepal increasingly use international migration as a way of escaping
from poverty. Yet when a household member leaves, the resulting loss of labour force usuallydepresses the farm’s crop output, as crop production is comparatively labour intensive – andeven without out-migration, labour shortages are common during the peak agricultural sea-son. Under these conditions, a traditional exchange labour system has developed, locallyknown as ‘‘Perma’’, under which farm households plan their planting and harvesting activi-ties in such a way that the joint labour requirements can be met through mutual exchange.However, large-scale out-migration of the workforce has made this system increasingly dys-functional with regard to meeting the labour demand at the village level. Without compensat-ing labour-saving technologies or labour hiring, out-migration thus results in declining cropproduction. Hence, since the late 1990s, it has become increasingly common for farmhouseholds to hire in labour to substitute for the failing ‘‘Perma’’. Remittances could play asignificant role in financing such external labour, as well as labour-saving and productivity-enhancing technologies such as fertilizer or irrigation facilities.Against the described background, the research presented here tests the hypothesis that
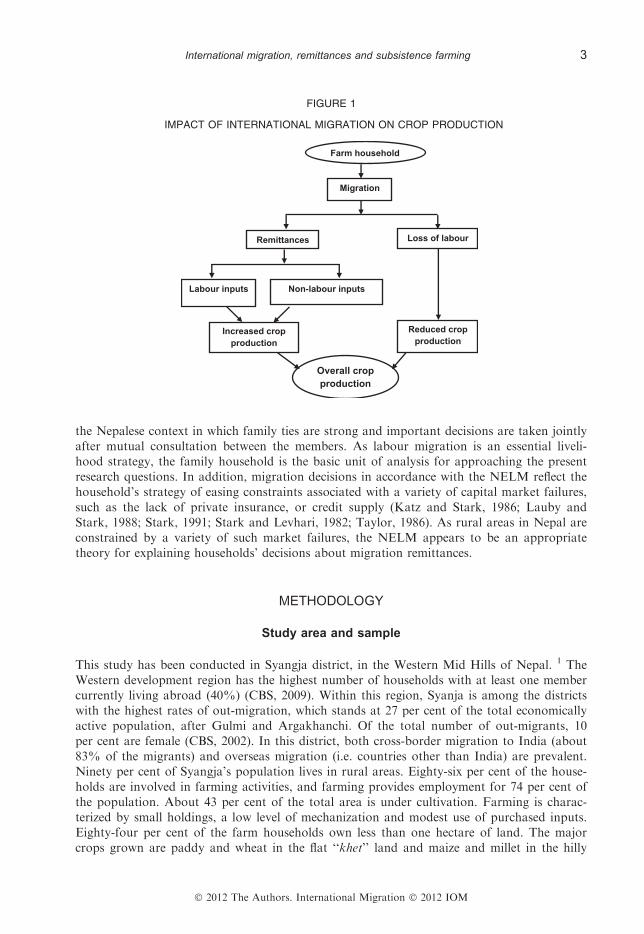
remittances from international migration increase crop production in migrants’ smallholderfarm households, assuming that they are used to replace lost family labour by hired-in labourand productivity-enhancing technologies, and expands subsistence to more commercialfarming. The structure of the analysis is graphically presented in Figure 1.The essential research questions hence are as follows:
• Does migration lead to a loss in family labour? To what extent is the lost laboursubstituted in crop production?
• Are remittances used for the purchasing of labour and non-labour inputs in farming?• What is the impact of international migration on the extent of subsistence crop
production?• Do migration and remittances lead to the expansion of subsistence farming towards
more commercial farming?
The research is based on the concept of the New Economics of Labour Migration(NELM), because it considers the household or family as the decision-making unit, reflecting
2 Maharjan, Bauer and Knerr
� 2012 The Authors. International Migration � 2012 IOM
the Nepalese context in which family ties are strong and important decisions are taken jointlyafter mutual consultation between the members. As labour migration is an essential liveli-hood strategy, the family household is the basic unit of analysis for approaching the presentresearch questions. In addition, migration decisions in accordance with the NELM reflect thehousehold’s strategy of easing constraints associated with a variety of capital market failures,such as the lack of private insurance, or credit supply (Katz and Stark, 1986; Lauby andStark, 1988; Stark, 1991; Stark and Levhari, 1982; Taylor, 1986). As rural areas in Nepal areconstrained by a variety of such market failures, the NELM appears to be an appropriatetheory for explaining households’ decisions about migration remittances.
METHODOLOGY
Study area and sample
This study has been conducted in Syangja district, in the Western Mid Hills of Nepal. 1 TheWestern development region has the highest number of households with at least one membercurrently living abroad (40%) (CBS, 2009). Within this region, Syanja is among the districtswith the highest rates of out-migration, which stands at 27 per cent of the total economicallyactive population, after Gulmi and Argakhanchi. Of the total number of out-migrants, 10per cent are female (CBS, 2002). In this district, both cross-border migration to India (about83% of the migrants) and overseas migration (i.e. countries other than India) are prevalent.Ninety per cent of Syangja’s population lives in rural areas. Eighty-six per cent of the house-holds are involved in farming activities, and farming provides employment for 74 per cent ofthe population. About 43 per cent of the total area is under cultivation. Farming is charac-terized by small holdings, a low level of mechanization and modest use of purchased inputs.Eighty-four per cent of the farm households own less than one hectare of land. The majorcrops grown are paddy and wheat in the flat ‘‘khet’’ land and maize and millet in the hilly
Farm household
Migration
Remittances
Reduced crop production
Loss of labour
Labour inputs Non-labour inputs
Increased crop production
Overall crop production
FIGURE 1
IMPACT OF INTERNATIONAL MIGRATION ON CROP PRODUCTION
International migration, remittances and subsistence farming 3
� 2012 The Authors. International Migration � 2012 IOM
‘‘bari’’ uplands. In some parts of the district, cash crops such as ginger, coffee and vegetablesare also grown. Although Syangja has surplus cereal production, 35 per cent of its popula-tion live below the poverty line. In 2006, the district had an average per capita income ofUS$245, and only about 15 enterprises employing more than ten people (CBS, 2007).Similar characteristics of migration and development can be found among the other hill
districts, except for those in the Mid- and Far-Western hills. 2 Syangja has been selected ran-domly among the districts with high levels of emigration, and it is well-suited to representthe situation in other hill districts in Nepal.The analysis is primarily based on data collected during 2007 from four Village Develop-
ment Committees (VDCs) of Syangja through the use of a semi-structured questionnaire.The VDCs were selected according to migration intensity. Using the raw data from the 2001population census sample survey (PCSS) conducted by the Central Bureau of Statistics, Gov-ernment of Nepal, the percentage of households involved in international migration was cal-culated. Then, two VDCs with comparatively high and two VDCs with medium levels ofinternational migration were randomly selected. In each VDC, efforts were made to have anequal number of migrant and non-migrant households. A total of 280 households were sur-veyed in the four VDCs, covering about 10 per cent of the total households in the VDCs, asreported in the 2001 PCSS.
Analytical approach
A simple way to investigate the impact of migration on crop production would be ordinaryleast squares (OLS) analysis. However, the OLS estimate of migration effects is supposed tobe biased, because the migration regressor is likely to be correlated with the error term. Bothmigration as well as agricultural production decisions might be simultaneously determined bythe same set of household characteristics, thus creating the problem of endogeneity. For thisresearch, therefore, the effect of migration on agricultural production is estimated by using atwo-stage least squares (2SLS) regression with instrumental variables (IVs) in order to con-trol for the simultaneous bias. In the first stage, the determinants of the migration decisionare estimated by
Mi ¼ lþ cIi þ kXi þ ei ð1Þ
where Mi is the number of migrants in the household; Ii is the vector of regressors excludedfrom the interest equation; the Xi are the household and community characteristics; and ei isthe error term.In the second stage, the predicted migration variable is included as an independent variable
in the regression:Interest variable ¼ aþ bMi þ dXi þ mi ð2Þ
where the Mi are the predicted fitted values from the first-stage regression; Xi is the samevector of explanatory variables; vi is the error term; and b is the unbiased and consistentestimation of the average effect of migration on the outcome of choice.The most challenging part in the estimation of IVs is their correct identification. They should
predict the migration decision, but not affect the variables of interest. Only when an IV satisfiesthese two conditions is it classified as valid. In this research, family migration network and com-munity migration network are used as instruments to identify the migration equation, in linewith the literature on impacts of migration (McCarthy et al., 2006; Rozelle et al., 1999; Tayloret al., 2003; Taylor and Lopez-Feldman, 2007). They are included in the following way:
• Family migration network. This is a dummy variable taking value ‘1’ if the household hadmembers from its extended family involved in international migration, and 0 otherwise.
4 Maharjan, Bauer and Knerr
� 2012 The Authors. International Migration � 2012 IOM
• Community migration network. For this variable, the proportion of households withmigrant members at ward level as shown in the 2001 PCSS is used.
In analysing the impact of international migration on crop production, the correlationbetween the error terms of the two regressions, with the system of multiple regressions, alsorequires attention. Since male and female labour are at least partially substitutable, the errorterms in the equations with hired male and female, and family male and female, labour mightbe correlated. In order to correct for such a correlation, seemingly unrelated regression(SUR) is used as an adequate tool. In addition, it is difficult to simultaneously consider theproblem of endogeneity and the cross-equation residual correlation. Therefore, for analysingthe variables of interest wherever the endogeneity problem is observed, the IV 2SLS methodis used; in the case of cross-equation residual correlation, SUR is applied; and where neitherproblem is observed, OLS is used.
Interest ⁄dependent variables
In order to investigate the impact of migration on agricultural production, first the mostimportant crops cultivated by the households are identified. None of the households coveredin the survey was cultivating non-cereal crops such as cash crops or vegetables, except inkitchen gardens. The most important crops, as reported by the farmers in the household sur-vey, were paddy, wheat, maize and millet. The labour and non-labour inputs used in theircultivation are analysed together with their total output. Among the non-labour inputs, seed,manure and fertilizer are the most important. Only chemical fertilizer is purchased from out-side. Therefore, the impact of international migration on chemical fertilizer is included in theanalysis of farm investment out of remittances for farming. All variables are transformed intonatural logarithms to meet the linearity assumption. Inputs used are aggregated per annumand per farm household, whereby labour input is measured by the number of person–daysused in the production of the four cereal crops:
• Male labour, including both household and exchange labour.• Female labour, including both household and exchange labour.• Hired-in male labour.• Hired-in female labour.• Fertilizer use for growing the four main crops, measured by the household’s total
expenditures in Nepalese Rupees (NRs).• Total production of the four major crops, summed up for each household. To aggre-
gate them into one equivalent term, they are weighted by prices in terms of NRs.
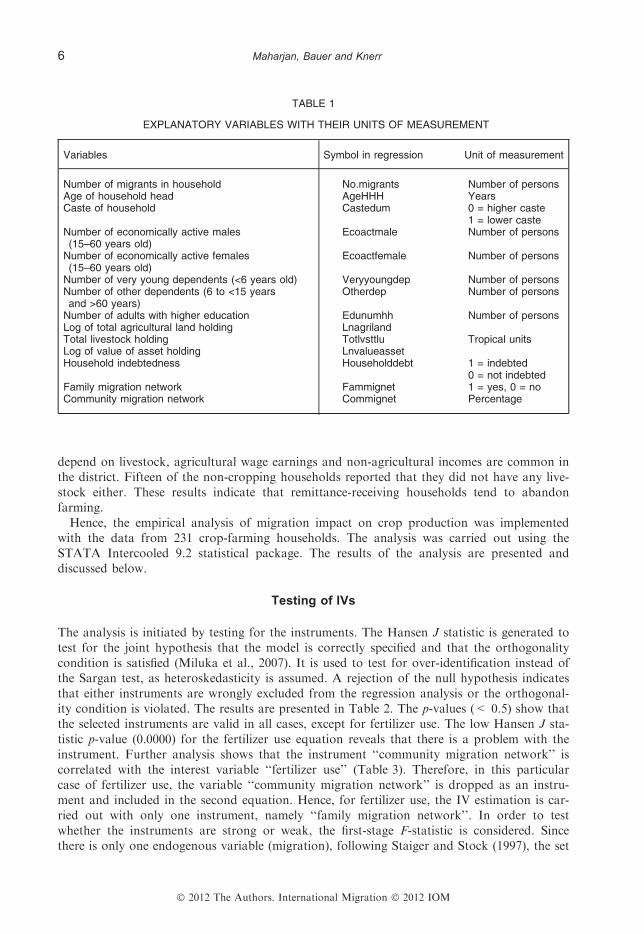
The explanatory variables, with their symbols and units of measurement, are shown inTable 1.
RESULTS AND DISCUSSION
Of the 280 households covered in the study, only 231 reported cropping activities. On furtheranalysis, it was found that 41 of the non-reporting were landless or near landless (<0.015hectare), six had rented out their land and two had no adults for farming and, hence, werenot cultivating any crops. Of the 41 landless ⁄near landless households, 16 were non-migrants’and 25 migrants’ households. Due to land scarcity, landless ⁄near landless households that
International migration, remittances and subsistence farming 5
� 2012 The Authors. International Migration � 2012 IOM
depend on livestock, agricultural wage earnings and non-agricultural incomes are common inthe district. Fifteen of the non-cropping households reported that they did not have any live-stock either. These results indicate that remittance-receiving households tend to abandonfarming.Hence, the empirical analysis of migration impact on crop production was implemented
with the data from 231 crop-farming households. The analysis was carried out using theSTATA Intercooled 9.2 statistical package. The results of the analysis are presented anddiscussed below.
Testing of IVs
The analysis is initiated by testing for the instruments. The Hansen J statistic is generated totest for the joint hypothesis that the model is correctly specified and that the orthogonalitycondition is satisfied (Miluka et al., 2007). It is used to test for over-identification instead ofthe Sargan test, as heteroskedasticity is assumed. A rejection of the null hypothesis indicatesthat either instruments are wrongly excluded from the regression analysis or the orthogonal-ity condition is violated. The results are presented in Table 2. The p-values (< 0.5) show thatthe selected instruments are valid in all cases, except for fertilizer use. The low Hansen J sta-tistic p-value (0.0000) for the fertilizer use equation reveals that there is a problem with theinstrument. Further analysis shows that the instrument ‘‘community migration network’’ iscorrelated with the interest variable ‘‘fertilizer use’’ (Table 3). Therefore, in this particularcase of fertilizer use, the variable ‘‘community migration network’’ is dropped as an instru-ment and included in the second equation. Hence, for fertilizer use, the IV estimation is car-ried out with only one instrument, namely ‘‘family migration network’’. In order to testwhether the instruments are strong or weak, the first-stage F-statistic is considered. Sincethere is only one endogenous variable (migration), following Staiger and Stock (1997), the set
TABLE 1
EXPLANATORY VARIABLES WITH THEIR UNITS OF MEASUREMENT
Variables Symbol in regression Unit of measurement
Number of migrants in household No.migrants Number of personsAge of household head AgeHHH YearsCaste of household Castedum 0 = higher caste
1 = lower casteNumber of economically active males(15–60 years old)
Ecoactmale Number of persons
Number of economically active females(15–60 years old)
Ecoactfemale Number of persons
Number of very young dependents (<6 years old) Veryyoungdep Number of personsNumber of other dependents (6 to <15 yearsand >60 years)
Otherdep Number of persons
Number of adults with higher education Edunumhh Number of personsLog of total agricultural land holding LnagrilandTotal livestock holding Totlvsttlu Tropical unitsLog of value of asset holding LnvalueassetHousehold indebtedness Householddebt 1 = indebted
0 = not indebtedFamily migration network Fammignet 1 = yes, 0 = noCommunity migration network Commignet Percentage
6 Maharjan, Bauer and Knerr
� 2012 The Authors. International Migration � 2012 IOM
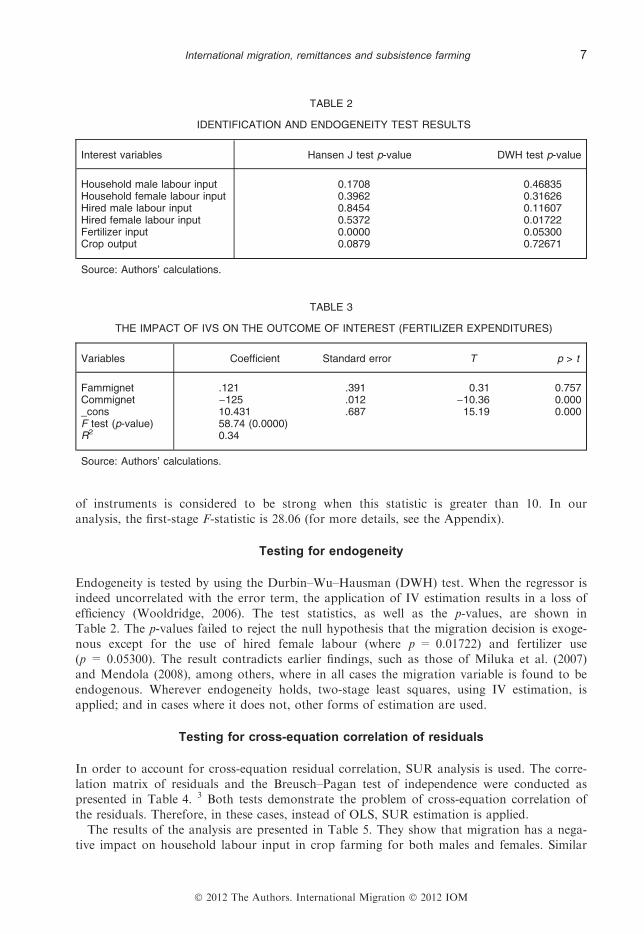
of instruments is considered to be strong when this statistic is greater than 10. In ouranalysis, the first-stage F-statistic is 28.06 (for more details, see the Appendix).
Testing for endogeneity
Endogeneity is tested by using the Durbin–Wu–Hausman (DWH) test. When the regressor isindeed uncorrelated with the error term, the application of IV estimation results in a loss ofefficiency (Wooldridge, 2006). The test statistics, as well as the p-values, are shown inTable 2. The p-values failed to reject the null hypothesis that the migration decision is exoge-nous except for the use of hired female labour (where p = 0.01722) and fertilizer use(p = 0.05300). The result contradicts earlier findings, such as those of Miluka et al. (2007)and Mendola (2008), among others, where in all cases the migration variable is found to beendogenous. Wherever endogeneity holds, two-stage least squares, using IV estimation, isapplied; and in cases where it does not, other forms of estimation are used.
Testing for cross-equation correlation of residuals
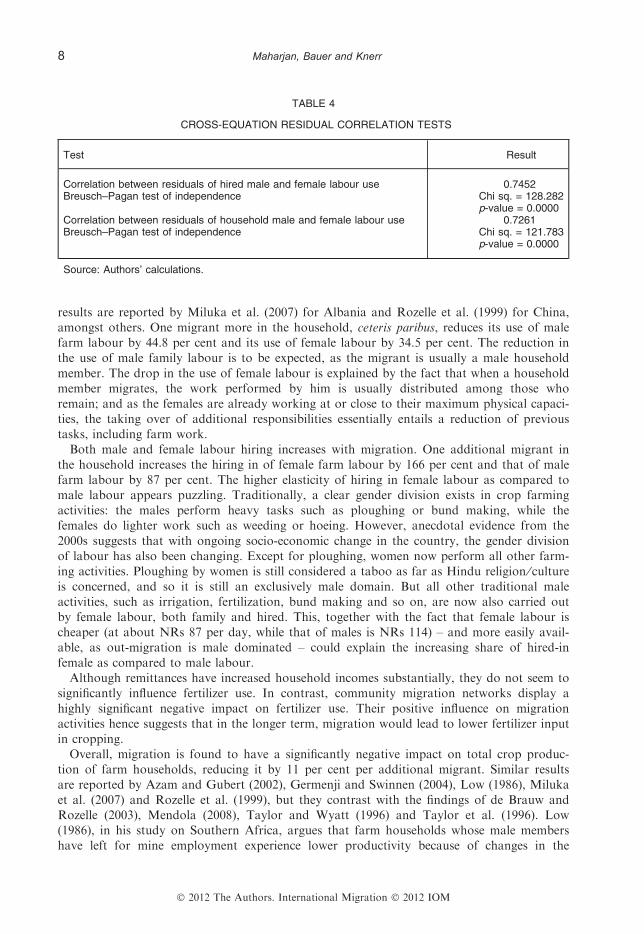
In order to account for cross-equation residual correlation, SUR analysis is used. The corre-lation matrix of residuals and the Breusch–Pagan test of independence were conducted aspresented in Table 4. 3 Both tests demonstrate the problem of cross-equation correlation ofthe residuals. Therefore, in these cases, instead of OLS, SUR estimation is applied.The results of the analysis are presented in Table 5. They show that migration has a nega-
tive impact on household labour input in crop farming for both males and females. Similar
TABLE 2
IDENTIFICATION AND ENDOGENEITY TEST RESULTS
Interest variables Hansen J test p-value DWH test p-value
Household male labour input 0.1708 0.46835Household female labour input 0.3962 0.31626Hired male labour input 0.8454 0.11607Hired female labour input 0.5372 0.01722Fertilizer input 0.0000 0.05300Crop output 0.0879 0.72671
Source: Authors’ calculations.
TABLE 3
THE IMPACT OF IVS ON THE OUTCOME OF INTEREST (FERTILIZER EXPENDITURES)
Variables Coefficient Standard error T p > t
Fammignet .121 .391 0.31 0.757Commignet )125 .012 )10.36 0.000_cons 10.431 .687 15.19 0.000F test (p-value) 58.74 (0.0000)R2 0.34
Source: Authors’ calculations.
International migration, remittances and subsistence farming 7
� 2012 The Authors. International Migration � 2012 IOM
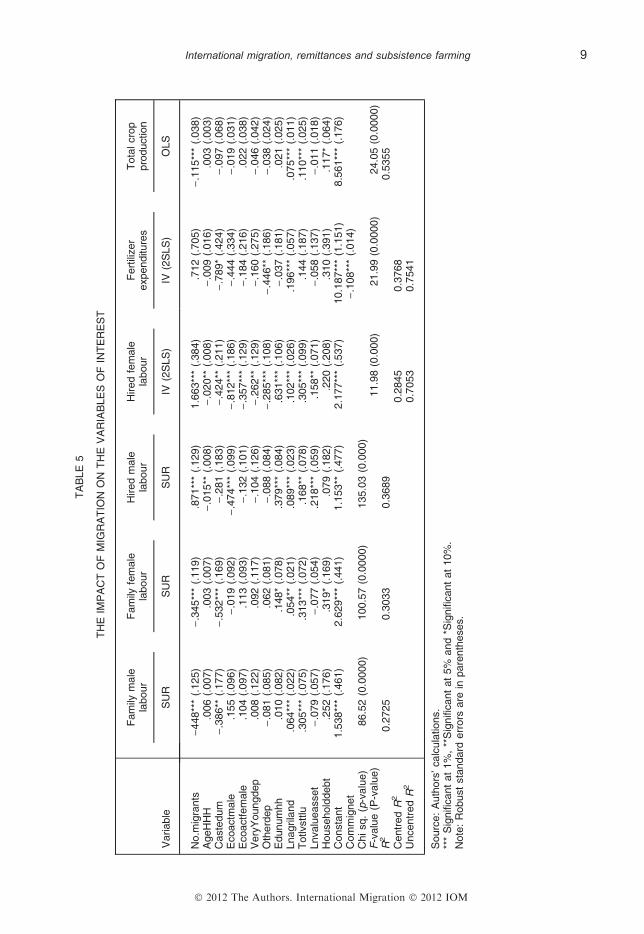
results are reported by Miluka et al. (2007) for Albania and Rozelle et al. (1999) for China,amongst others. One migrant more in the household, ceteris paribus, reduces its use of malefarm labour by 44.8 per cent and its use of female labour by 34.5 per cent. The reduction inthe use of male family labour is to be expected, as the migrant is usually a male householdmember. The drop in the use of female labour is explained by the fact that when a householdmember migrates, the work performed by him is usually distributed among those whoremain; and as the females are already working at or close to their maximum physical capaci-ties, the taking over of additional responsibilities essentially entails a reduction of previoustasks, including farm work.Both male and female labour hiring increases with migration. One additional migrant in
the household increases the hiring in of female farm labour by 166 per cent and that of malefarm labour by 87 per cent. The higher elasticity of hiring in female labour as compared tomale labour appears puzzling. Traditionally, a clear gender division exists in crop farmingactivities: the males perform heavy tasks such as ploughing or bund making, while thefemales do lighter work such as weeding or hoeing. However, anecdotal evidence from the2000s suggests that with ongoing socio-economic change in the country, the gender divisionof labour has also been changing. Except for ploughing, women now perform all other farm-ing activities. Ploughing by women is still considered a taboo as far as Hindu religion ⁄ cultureis concerned, and so it is still an exclusively male domain. But all other traditional maleactivities, such as irrigation, fertilization, bund making and so on, are now also carried outby female labour, both family and hired. This, together with the fact that female labour ischeaper (at about NRs 87 per day, while that of males is NRs 114) – and more easily avail-able, as out-migration is male dominated – could explain the increasing share of hired-infemale as compared to male labour.Although remittances have increased household incomes substantially, they do not seem to
significantly influence fertilizer use. In contrast, community migration networks display ahighly significant negative impact on fertilizer use. Their positive influence on migrationactivities hence suggests that in the longer term, migration would lead to lower fertilizer inputin cropping.Overall, migration is found to have a significantly negative impact on total crop produc-
tion of farm households, reducing it by 11 per cent per additional migrant. Similar resultsare reported by Azam and Gubert (2002), Germenji and Swinnen (2004), Low (1986), Milukaet al. (2007) and Rozelle et al. (1999), but they contrast with the findings of de Brauw andRozelle (2003), Mendola (2008), Taylor and Wyatt (1996) and Taylor et al. (1996). Low(1986), in his study on Southern Africa, argues that farm households whose male membershave left for mine employment experience lower productivity because of changes in the
TABLE 4
CROSS-EQUATION RESIDUAL CORRELATION TESTS
Test Result
Correlation between residuals of hired male and female labour use 0.7452Breusch–Pagan test of independence Chi sq. = 128.282
p-value = 0.0000Correlation between residuals of household male and female labour use 0.7261Breusch–Pagan test of independence Chi sq. = 121.783
p-value = 0.0000
Source: Authors’ calculations.
8 Maharjan, Bauer and Knerr
� 2012 The Authors. International Migration � 2012 IOM
TA
BLE
5
TH
EIM
PA
CT
OF
MIG
RA
TIO
NO
NT
HE
VA
RIA
BLE
SO
FIN
TE
RE
ST
Variable
Fam
ilym
ale
labour
Fam
ilyfe
male
labour
Hired
male
labour
Hired
fem
ale
labour
Fert
ilizer
expenditure
sT
ota
lcro
ppro
duction
SU
RS
UR
SU
RIV
(2S
LS
)IV
(2S
LS
)O
LS
No.m
igra
nts
)448**
*(.
125)
).3
45**
*(.
119)
.871**
*(.
129)
1.6
63**
*(.
384)
.712
(.705)
).1
15**
*(.
038)
AgeH
HH
.006
(.007)
.003
(.007)
).0
15**
(.008)
).0
20**
(.008)
).0
09
(.016)
.003
(.003)
Caste
dum
).3
86**
(.177)
).5
32**
*(.
169)
).2
81
(.183)
).4
24**
(.211)
).7
89*
(.424)
).0
97
(.068)
Ecoactm
ale
.155
(.096)
).0
19
(.092)
).4
74**
*(.
099)
).8
12**
*(.
186)
).4
44
(.334)
).0
19
(.031)
Ecoactf
em
ale
.104
(.097)
.113
(.093)
).1
32
(.101)
).3
57**
*(.
129)
).1
84
(.216)
.022
(.038)
Very
Youngdep
.008
(.122)
.092
(.117)
).1
04
(.126)
).2
62**
(.129)
).1
60
(.275)
).0
46
(.042)
Oth
erd
ep
).0
81
(.085)
.062
(.081)
).0
88
(.084)
).2
85**
*(.
108)
).4
46**
(.186)
).0
38
(.024)
Edunum
hh
.010
(.082)
.148*
(.078)
.379**
*(.
084)
.631**
*(.
106)
).0
37
(.181)
.021
(.025)
Lnagrila
nd
.064**
*(.
022)
.054**
(.021)
.089**
*(.
023)
.102**
*(.
026)
.196**
*(.
057)
.075**
*(.
011)
Totlvstt
lu.3
05**
*(.
075)
.313**
*(.
072)
.168**
(.078)
.305**
*(.
099)
.144
(.187)
.110**
*(.
025)
Lnvalu
easset
).0
79
(.057)
).0
77
(.054)
.218**
*(.
059)
.158**
(.071)
).0
58
(.137)
).0
11
(.018)
Household
debt
.252
(.176)
.319*
(.169)
.079
(.182)
.220
(.208)
.310
(.391)
.117*
(.064)
Consta
nt
1.5
38**
*(.
461)
2.6
29**
*(.
441)
1.1
53**
(.477)
2.1
77**
*(.
537)
10.1
87**
*(1
.151)
8.5
61**
*(.
176)
Com
mig
net
).1
08**
*(.
014)
Chisq.
(p-v
alu
e)
86.5
2(0
.0000)
100.5
7(0
.0000)
135.0
3(0
.000)
F-v
alu
e(P
-valu
e)
11.9
8(0
.000)
21.9
9(0
.0000)
24.0
5(0
.0000)
R2
0.2
725
0.3
033
0.3
689
0.5
355
Centr
ed
R2
0.2
845
0.3
768
Uncentr
ed
R2
0.7
053
0.7
541
Sourc
e:
Auth
ors
’calc
ula
tions.
***
Sig
nifi
cant
at
1%
,**
Sig
nifi
cant
at
5%
and
*Sig
nifi
cant
at
10%
.N
ote
:R
obust
sta
ndard
err
ors
are
inpare
nth
eses.
International migration, remittances and subsistence farming 9
� 2012 The Authors. International Migration � 2012 IOM
productivity and quantity of household labour. Similarly, Germenji and Swinnen (2004) findnegative relations between migration and farm efficiency in Albania, the reason for which isfound to be reduced labour effort.The overall results suggest that male emigration leads to losses of family farm labour that
are not sufficiently replaced by other inputs to keep up the former production levels, thusleading to an overall negative impact on the households’ total crop production. Hence, ourhypothesis that international labour migration would increase crop production does not holdtrue. The negative impact can be explained mainly by considering two aspects. First, interna-tional labour migration leads to the neglect of crop farming as a result of an additionalsource of income in the form of remittances. This is in line with the Nepalese people’s generalperceptions of farming, which is considered as ‘‘a last resort’’. Subsistence cereal farming isassociated with poverty and hard work, particularly in the Mid Hills, so most farmers wishto escape from it. In the study area, cereals are still the predominant farm crop, grown morefor the households’ immediate food security than for earning cash income. This is not a verycompetitive activity in the Mid Hills when the cost of family labour is taken into consider-ation. Basically, it is continued because of the lack of other income opportunities, and alsothe strong religious belief that leaving farmland fallow is inauspicious, while the concept ofrenting out land is still new. Under these conditions, migrants’ households in the rural MidHills continue to grow crops, but with increasing negligence.Second, the labour shortage appears to be a decisive aspect. Agriculture in the Mid Hills is
highly labour intensive. Mechanization is restricted by small land holdings and terraced fieldson hilly uplands. Therefore, all activities, from planting to harvesting, are largely done manu-ally. Even without international migration, the majority of the households face labour short-ages during the peak agricultural seasons, specifically at planting and harvesting time. Withmassive out-migration, particularly since the 1990s, the overall labour availability in the vil-lages is reduced, thus making the timely availability of hired labour also difficult to achieve.As the productivity of crops is susceptible to the date of sowing, this depresses the house-holds’ overall crop production. Also, the productivity of the hired labour tends to be lowerthan that of family labour, which implies an additional adverse effect.In addition to migration, other household characteristics have a significant impact on the
variables of interest. Higher land and livestock holdings enhance both male and female fam-ily labour input, while belonging to a lower caste has a negative impact on both, which isexplained by the fact that lower-caste households typically possess smaller land holdings andtherefore are less involved in farming. In rural Nepal, the higher-caste households have thebest access to the most fertile flat ‘‘khet’’ land (suitable for paddy and wheat cultivation),while the lower-caste households have more hilly ‘‘bari’’ land (suitable for maize and milletcultivation) and the steep ‘‘kharbari’’ land (unsuitable for the cultivation of crops, and sowhere fodder trees and grasses are grown). The use of female family labour is moderatelypositively influenced by household indebtedness, as households with standing debts usuallyspend less cash on the hiring of workers, but instead try to rely more on family labour. It isalso positively influenced by the number of household members with higher education. In thestudy area, due to patriarchal society structures, males are more likely to continue withhigher education than females. When they attend school or other educational institutions,they are usually less involved in farming, and thus females take over a larger share of theactivities.Household size, caste status and the age of the household head in general show a negative
influence on the use of hired labour, whereas land and livestock holdings, as well as house-hold wealth and higher education, display positive influences. Caste-based discrimination isdeeply rooted in rural Nepal, although it is legally banned. Lower-caste people generally havesmaller land holdings. But even when they have larger land holdings, it is difficult for them
10 Maharjan, Bauer and Knerr
� 2012 The Authors. International Migration � 2012 IOM
to find the required labour, as working on land belonging to a lower-caste family is not anoption that people belonging to a higher caste would choose. Hence, lower-caste householdsface restrictions when attempting to balance their seasonal labour shortages in cropproduction.The fertilizer expenditures of the households, according to expectations, are positively
influenced by land holding size but negatively by belonging to a lower caste and by thenumber of older dependents. Finally, the households’ overall crop production is stronglypositively influenced by its land and livestock holdings, and weakly positively by its debts.
CONCLUSIONS AND POLICY IMPLICATIONS
Subsistence cereal production is still the mainstay of the crop sector in the Western Mid Hillsof Nepal. Non-cereal crops such as vegetables are generally taken up only at kitchen gardenlevel. The findings of this research suggest that expanding international migration tends toreduce the use of family labour in crop production, although farm households try to replacethe lost family labour by employing external labour. As more female than male labour ishired in, due to its easier availability and lower wages, male international migration has pro-moted the feminization of the farm sector. Against expectations, the increased householdincome due to migrants’ remittances is, however, hardly invested in productivity-enhancingnon-labour inputs such as fertilizer. As a result, the overall impact of international migrationon crop production is negative, as the lost family labour is compensated neither by additionallabour nor by non-labour inputs. This reflects the difficulties faced by the households inreplacing the emigrated labour force quantitatively, qualitatively and in a timely manner. Italso reveals the general neglect of subsistence crop farming by migrant households, due tothe availability of an alternative source of income that can meet the households livelihoodrequirements.Although international migration helps in securing the livelihoods of the farm households
in the short run, the accompanying negative impact in terms of declining crop productionrequires attention by policymakers. Apart from remittance income, growth in productive sec-tors is important for the sustainable economic growth of the country. In the rural areas,farming is the major economic pillar and, therefore, the growth of this sector is vital for arobust rural economy. Moreover, the full potential of farming in rural Nepal is yet to betapped.Given the poor environmental conditions and the lack of irrigation facilities, returns on
the cultivation of cereal crops in Nepal are comparatively low. Nevertheless, households con-tinue to grow them largely for subsistence, due to lack of alternative occupational opportuni-ties at the local level, and on the basis of cultural and religious habits. Under these givenconditions, investments in cereal crop cultivation do not appear to be profitable. In order toenhance productivity, other inputs in addition to fertilizer – such as irrigation facilities orimproved seeds – would be required, but these are not available to individual households.Without such inputs and the appropriate infrastructure, however, investing in fertilizer alonedoes not make cereal production sufficiently attractive for the farmers to prevent the neglectof this sector. The cultivation of high-return market cash crops would be more profitable forthe farmers, if basic infrastructure such as irrigation, roads and various items of equipment,which are beyond the capacity of the individual households, could be made available tothem. Therefore, although migration helps to some extent in overcoming the households’credit and liquidity constraints, other constraints that are not influenced by migration andremittances remain and hinder the farm sector from developing in a positive way. Until they
International migration, remittances and subsistence farming 11
� 2012 The Authors. International Migration � 2012 IOM
are removed and a more favourable environment for market-orientated agriculture is gener-ated, subsistence farming will continue to be neglected whenever another income alternativeis available, and commercial farming will not be taken up.The findings demonstrate the need to focus more on the migration–development linkages
in Nepal and beyond. However, there is a serious lack of consideration by policymakers. Inthe present situation of poor farm households, with limited off-farm employment opportuni-ties, international migration is essential for livelihood security. It also offers the prospect ofenhanced agricultural production and improved living standards in rural areas, as migrants’money transfers remove farm households’ liquidity and credit constraints. On that basis, pol-icy measures that would support the effective use of these remittances could pave the way forpositive rural development. In particular, investment in productivity-enhancing technologiesand basic infrastructure would make cereal production more profitable and stimulate engage-ment with investments in high-return cash crops. The package programmes that the govern-ment has already initiated need to be expanded by targeting more resources on the requiredtechnologies and infrastructure. For that purpose, the private–public partnerships model –which has been applied, for example, in road construction in the Dharan district, and inrunning schools and colleges in various districts – might be replicated.The results of the study also demonstrate that future policies and programmes should take
care of the gender aspect. As shown by the analysis, feminization of the farm sector is on therise and therefore, more female-orientated production technologies and programmes need tobe developed and implemented.
NOTES
1. Nepal is, from south to north, divided into three ecological belts, namely mountains, hills andTerai; and from east to west into five developmental regions, namely the Eastern, Central, Western,Mid-Western and Far-Western regions.
2. The emigration, as well as the development, situation in the hill districts of the Mid- and Far-Wes-tern regions is completely different from those in other hill districts of Nepal. The districts fromthese two regions are the lowest-ranking in the development index. Emigration from these districtsis mostly to India, and the migrants mostly work in low-paying, insecure informal sectors(Bhattarai, 2007).
3. The correlation coefficient between the residuals of the equations for hired male and female labourreaches 0.7452, and that between household male and female labour 0.7261, and the Breusch–Pagan test shows that the error terms of both equations are dependent.
REFERENCES
Azam, J.P., and F. Gubert2002 ‘‘Those in the Kayes; the impact of remittances on the recipients in Africa’’, IDEI Working
Paper 308, University of Toulouse.Bhattarai, R.2007 ‘‘Open borders, closed citizenships: Nepali labour migrants in Delhi’’, Paper presented at the
conference ‘‘International migration, multi-local livelihoods and human security: perspectivesfrom Europe, Asia and Africa’’, 30 and 31 August 2007, Institute of Social Studies, DenHaag, the Netherlands.
CBS (Central Bureau of Statistics)2002 Population Census 2001 – Raw Data, National Planning Commission Secretariat, CBS, Nepal.2007 District Profiles, National Planning Commission Secretariat, CBS, Nepal.
12 Maharjan, Bauer and Knerr
� 2012 The Authors. International Migration � 2012 IOM
2009 Nepal Labour Force Survey, 2008, National Planning Commission Secretariat, CBS, Nepal.de Brauw, A., and S. Rozelle2003 ‘‘Migration and household investment in rural China’’, Department of Agricultural and
Resource Economics, University of California, Davis, Davis, CA.Germenji, E., and J. Swinnen2004 ‘‘Impact of remittances on household-based farms in rural Albania’’, Paper presented at the
conference ‘‘New perspectives on Albanian migration and development’’, Korce, Albania,September.
IOM (International Organization for Migration)2008 World Migration 2008: Managing Labour Mobility in the Evolving Global Economy, Volume
4, World Migration Report Series, IOM, Geneva.Katz, E., and O. Stark1986 ‘‘Labour migration and risk aversion in less developed countries’’, Journal of Labour
Economics, 4: 131–149.Lauby, J., and O. Stark1988 ‘‘Individual migration as a family strategy: young women in the Philippines’’, Population
Studies, 42: 473–486.Lokshin, M., M. Bontch-Osmolovski, and E. Glinskaya2007 ‘‘Work related migration and poverty reduction in Nepal’’, World Bank Policy Research
Working Paper 4231, The World Bank, Washington, DC.Low, A.R.C.1986 Agricultural Development in Southern Africa: Farm-Household Economics and the Food
Crises, James Currey, London.McCarthy, N., G. Carletto, B. Davis, and I. Maltsoglou2006 ‘‘Assessing the impact of massive out-migration on agriculture’’, ESA Working Paper No.
06-14, Agricultural and Development Economics Division, Food and AgricultureOrganization of the United Nations, Rome.
Mendola, M.2008 ‘‘Migration and technological change in rural households: complements or substitutes?’’ Jour-
nal of Development Economics, 85(1–2): 150–175.Miluka, J., G. Carletto, B. Davis, and A. Zezza2007 ‘‘The vanishing farms? The impact of international migration on Albanian family farming’’,
Policy Research Working Paper 4367, Development Research Group, The World Bank,Washington, DC.
MOF (Ministry of Finance)2010 Economic Survey – Fiscal Year 2009 ⁄ 10, Volume I, Ministry of Finance, Government of Nepal.
Ratha, D., S. Mohapatra, and A. Silwal2010 ‘‘Outlook for remittances flow 2010–11: remittance flows to developing countries remained
resilient in 2009, expected to recover during 2010–11’’, Migration and Development Brief 12,Migration and Remittances Team, The World Bank, Washington, DC.
Rozelle, S., J.E. Taylor, and A. de Brauw1999 ‘‘Migration, remittances, and agricultural productivity in China’’, American Economic Review,
89(2): 287–291.Staiger, D., and J. Stock1997 ‘‘Instrumental variable regression with weak instruments’’, Econometrica, 65(3): 557–586.
Stark, O.1991 The Migration of Labor, Blackwell, Oxford.
Stark, O., and D. Levhari1982 ‘‘On migration and risk in LDCs’’, Economic Development and Cultural Change, 31:
191–196.Taylor, J.E.1986 ‘‘Differential migration, network information and risk’’, in O. Stark (Ed.), Research in
Human Capital and Development, Volume 4, Migration, Human Capital, and Development, JIAPress, Greenwich, CT: 147–171.
International migration, remittances and subsistence farming 13
� 2012 The Authors. International Migration � 2012 IOM
Taylor, J.E., and A. Lopez-Feldman2007 ‘‘Does migration make rural households more productive? Evidence from Mexico’’, ESA
Working Paper No. 07-10, Agricultural Development Economics Division, Food and Agricul-ture Organization of the United Nations, Rome.
Taylor, J.E., and T.J. Wyatt1996 ‘‘The shadow value of migrant remittances, income and inequality in a household-
farm economy’’, Journal of Development Studies, 32(6): 899–912.Taylor, J.E., S. Rozelle, and A. de Brauw2003 ‘‘Migration and incomes in source communities: a new economics of migration perspective
from China’’, Economic Development and Cultural Change, 52: 75–101.1996 ‘‘International migration and community development’’, Population Index, 62(3): 397–418.
Wooldridge, J.M.2006 Introductory Econometrics: A Modern Approach, third edition, Thomson, New York.
World Bank2006 Nepal Resilience amidst Conflict: An Assessment of Poverty in Nepal, 1995–96 and 2003–04,
Poverty Reduction and Economic Management Sector Unit, South Asia Region, The WorldBank, Washington, DC.
2009 Migration and Remittances Factbook 2009, The World Bank, Washington, DC.
APPENDIX
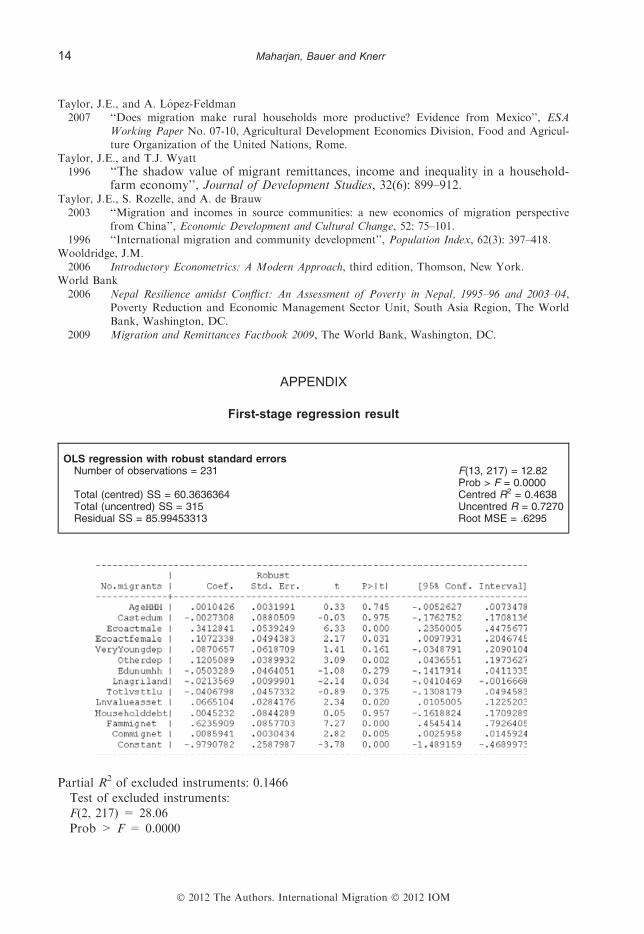
First-stage regression result
OLS regression with robust standard errorsNumber of observations = 231 F(13, 217) = 12.82
Prob > F = 0.0000Total (centred) SS = 60.3636364 Centred R2 = 0.4638Total (uncentred) SS = 315 Uncentred R = 0.7270Residual SS = 85.99453313 Root MSE = .6295
Partial R2 of excluded instruments: 0.1466Test of excluded instruments:F(2, 217) = 28.06Prob > F = 0.0000
14 Maharjan, Bauer and Knerr
� 2012 The Authors. International Migration � 2012 IOM
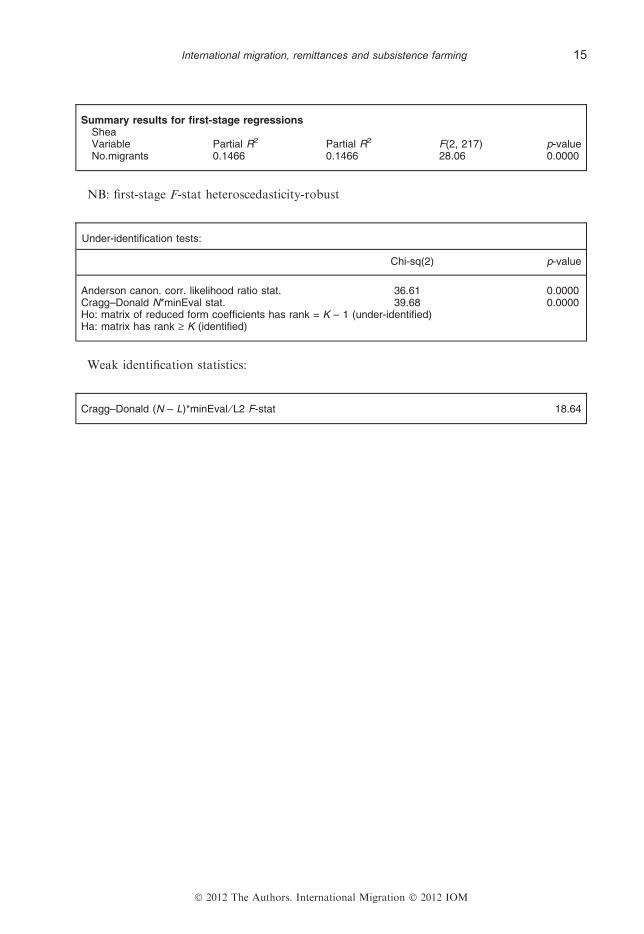
Summary results for first-stage regressionsSheaVariable Partial R2 Partial R2 F(2, 217) p-valueNo.migrants 0.1466 0.1466 28.06 0.0000
NB: first-stage F-stat heteroscedasticity-robust
Under-identification tests:
Chi-sq(2) p-value
Anderson canon. corr. likelihood ratio stat. 36.61 0.0000Cragg–Donald N*minEval stat. 39.68 0.0000Ho: matrix of reduced form coefficients has rank = K – 1 (under-identified)Ha: matrix has rank ‡ K (identified)
Weak identification statistics:
Cragg–Donald (N – L)*minEval ⁄ L2 F-stat 18.64
International migration, remittances and subsistence farming 15
� 2012 The Authors. International Migration � 2012 IOM