Embed Size (px)
Citation preview
U.S. GEOLOGICAL SURVEY CIRCULAR 930-A
International Strategic Minerals Inventory
Summary Report-Manganese
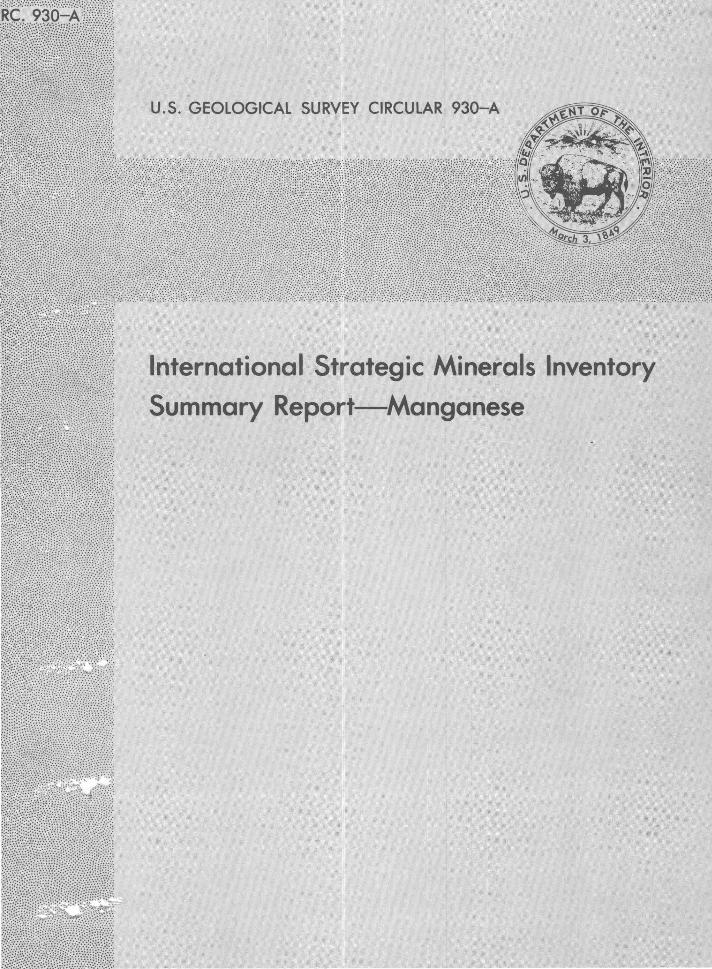
Major geologic age units
Age
Holocene QUATERNARY
Pleistocene
Pliocene
Miocene
Oligocene TERTIARY ~
Eocene -
Paleocene
Late Cretaceous r--- Cretaceous
Early Cretaceous
Jurassic -
u 1---
0 N 1-0 ~ 1-u
I--
u 6 N 1---
0 en w ~ I--
Million years before present
0.1
2
5
24
38
55
63
96
138
205
Triassic
L------------r-T-240
Permian I-- 290
Pennsylvanian Carboniferous
Mississippian I u -
Devonian
Silurian
Ordovician
6 I--
N 0 w 1--....J <( a..
360
410
I-- 435
- 500
L__~ ____ c_a_m __ b_r_ia_n __________ ~~u~--~-570 Late Proterozoic 2 1--
900 0
z <( a: c:c ~ <( u w a: a..
Middle Proterozoic ~ 1- 1600 0
L_ __ ~E~a~r-ly~P_ro_t_e_r __ ozo_i_c ____ -j~~--,_ 25oo z <( w ::J: u a: <(
-
International Strategic Minerals Inventory
Summary Report-Manganese
By John H. DeYoung, Jr., David M. Sutphin,
and William F. Cannon
U. S. G E 0 L 0 G I C A L SURVEY
Prepared as a cooperative effort among earthscience and mineral-resource agencies of Australia, Canada, the Federal Republic of Germany, the Republic of South Africa, and the United States of America
1984
CIRCULAR 930-A
Department of the Interior
WILLIAM P. CLARK, Secretary
U.S. Geological Survey
Dallas L. Peck, Director
Free on application to Distribution Branch, Text Products Section, U. S. Geological Survey, 604 South Pickett Street, Alexandria, VA 22304
FOREWORD
Earth-science and mineral-resource agencies from several countries started the International Strategic Minerals Inventory in order to gather cooperatively information about major sources of strategic mineral raw materials. This circular summarizes inventory information about major deposits of manganese, one of the mineral commodities selected for the prototype phase of the inventory.
The report was prepared by John H. DeYoung, Jr., and David M. Sutphin of the U.S. Geological Survey (USGS). Manganese inventory information was compiled by William F. Cannon (chief compiler), USGS; Ian Goldberg, South African Department of Mineral and Energy Affairs (MEA), Minerals Bureau; Erik C. I. Hammerbeck, MEA, Geological Survey; Silvia M. Heinrich, USGS; Ulrich Krauss, Federal Institute for Geosciences and Natural Resources of the Federal Republic of Germany; and C. Roger Pratt, Australian Bureau of Mineral Resources, Geology and Geophysics. Additional contributions to the report were made by A. B. T. Werner and Jan Zwartendyk, Canadian Department of Energy, Mines and Resources (EMR), Mineral Policy Sector; Ian Goldberg; G. A. Gross, EMR, Geological Survey of Canada; and Aldo F. Barsotti, Joseph S. Coffman, and Thomas S. Jones, U.S. Bureau of Mines.
Director
III

CONTENTS
Page
Foreword ------------------------------------------------------------------- iii Abscract-------------------------------------------------------------------- 1 Part I -Overview------------------------------------------------------------- 1
Introduction ------------------------------------------------------------- 1 Uses and supply aspects---------------------------------------------------- 2 Distribution of manganese deposits and districts --------------------------------- 3 Manganese resources ------------------------------------------------------ 4 Manganese production ----------------------------------------------------- 7 Conclusions -------------------------------------------------------------- 10
Part II-Selected inventory information for manganese deposits and districts------------- 11 References cited -------------------------------------------------------------- 22 Additional references on manganese resources -------------------------------------- 22
ILLUSTRATIONS
Page
FIGURE 1. Diagram showing United Nations resource categories used in this report------------------------------- 3 2-3. Maps showing:
2. Location, deposit type, and estimated resources of major manganese deposits and districts in the world---- 5 3. Economic classification of the World Bank for countries where major manganese deposits and districts
occur ------------------------------------------------------------------------------ 6 4-6. Bar graphs showing:
4. Manganese resources in the world's major deposits and districts according to their date of discovery------ 8 5. Proportions of total world production of manganese ore accounted for by countries with major deposits
and districts in the ISMI manganese inventory; selected years 1940-80 -------------------------- 9 6. Manganese production in countries with major deposits and districts in the ISMI manganese inventory;
selected years 1940-80 ---------------------------------------------------------------- 10 7. Graphs showing concencration ratios for selected nonfuel mineral commodity production in 1913 and 1980 ---- 11 8. Map showing major manganese deposits and districts, their present production status, and their probable
production status in 2020 ----------------------------------------------------------------- 12
TABLES
Page
TABLE 1. Manganese resources in and cumulative production from the world's major deposits and districts, by geologic deposit type and resource category -------------------------------------------------- 7
2. Manganese resources in the world's major deposits and districts, by economic class of country and resource category --------------------------------------------------------------------~--------- 7
3-4. Estimated cumulative and annual production of manganese contained in ore and concentrate: 3. For each country having a major manganese deposit or district------------------------------------ 10 4. By economic class of country -------------------------------------------------------------- 10
5. Manganese resources in the world's major deposits and districts, listed by mining method and economic class ofcountry----------------------------------------------------------------------------- 11
6. Selected geologic and location information from ISMI records for manganese deposits and districts ---------- 14 7. Selected production and mineral-resource information from ISMI records for manganese deposits and
districts ------------------------------------------------------------------------------ 18
v

INTERNATIONAL STRATEGIC MINERALS INVENTORY SUMMARY REPORT
MANGANESE
By John H. DeYoung, Jr., David M. Sutphin, and William F. Cannon
ABSTRACT
Major world resources of manganese, a strategic mineral commodity, are described in this summary report of information in . the International Strategic Minerals Inventory (ISM I). ISMI is a cooperative data-collection effort of earth-science and mineral-resource agencies in Australia, Canada, the Federal Republic of Germany, the Republic of South Africa, and the United States of America. This report, designed to be of benefit to policy analysts, contains two parts. Part I presents an overview of the resources and potential supply of manganese on the basis of inventory information. Part II contains tables of some of the geologic information and mineral-resource and production data that were collected by ISMI participants.
PART I-OVERVIEW
INTRODUCJION
The reliability of future supplies of so-called strategic minerals is of concern to many nations. This widespread concern has led to duplication of effort in the gathering of information on the world's major sources of strategic mineral materials. With the aim of pooling such information, a cooperative program named International Strategic Minerals Inventory (ISMI) was started in 1981 by officials of the governments of the U.S.A., CanB.da, and the Federal Republic of Germany. It was subsequently joined by the Republic of South Africa and Australia. The United Kingdom will participate in future ISMI resource studies.
The objective of ISMI reports is to make publicly available, in convenient form, nonproprietary data and characteristics of major deposits of strategic mineral commodities for policy considerations in regard to short-term, medium-term, and
1
long-term world supply. This report provides a summary statement of the data compiled and an overview of the supply aspects of manganese in a format designed to be of benefit to policy analysts.
The term "strategic minerals" is imprecise. It generally refers to mineral ore and derivative products that come largely or entirely from foreign sources, that are difficult to replace, and that are important to a nation's economy, in particular to its defense industry. Usually, the term implies a nation's perception of vulnerability to supply disruptions, and of a need to safeguard its industries from the repercussions of a loss of supplies.
Because a mineral that is strategic to one country may not be strategic to another, no one list of strategic minerals can be prepared. The ISMI Working Group decided to commence with chromium, manganese, nickel, and phosphate.
The information used was the best at hand in various agencies of the participating countries that contributed to the preparation of this report. These agencies were the Bureau of Mines and the Geological Survey of the U.S. Department of the Interior; the Geological Survey and the Mineral Policy Sector of the Canadian Department of Energy, Mines and Resources; the Federal Institute for Geosciences and Natural Resources of the Federal Republic of Germany; the Geological Survey and the Minerals Bureau of the Department of Mineral and Energy Affairs of South Africa; and the Bureau of Mineral Resources, Geology and Geophysics of the Australian Department of Resources and Energy.
Deposits (or districts) are selected for the inventory on the basis of their present or expected future contribution to world supply. Records for
all deposits compiled by ISMI participants meet this general "major deposit" criterion and are included in the inventory .1
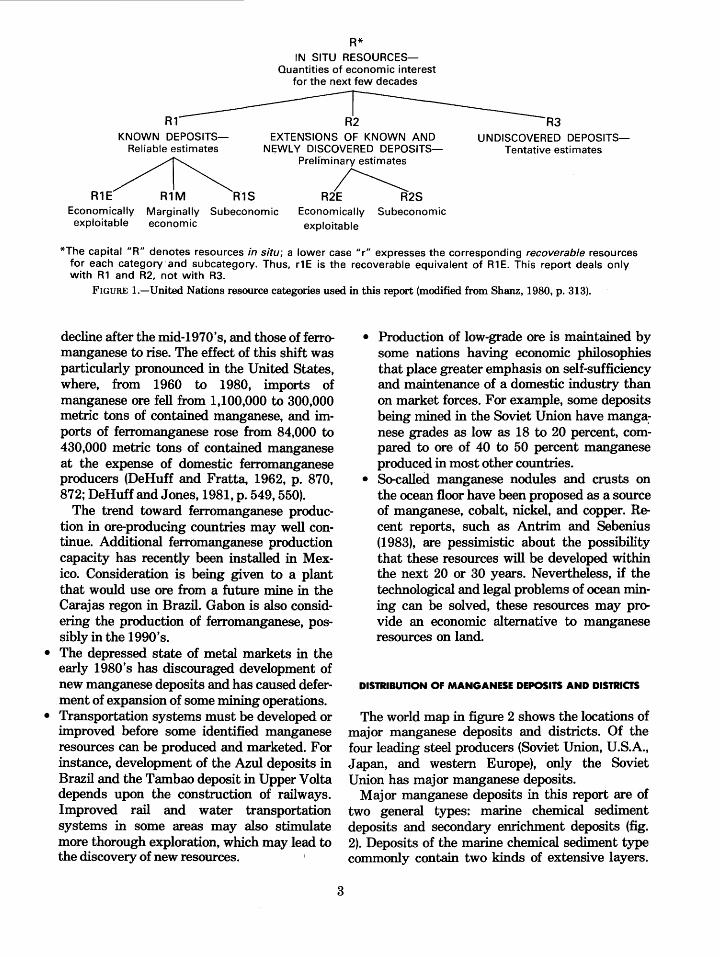
The ISMI record collection and this report on manganese have adopted the international classification system for mineral resources recommended by the United Nations Group of Experts on Definitions and Terminology for Mineral Resources (Schanz, 1980). The terms, definitions, and resource categories of this system were established in 1979 to facilitate international exchange of mineral-resource data; the Group of Experts sought a system that would be compatible with the several systems already in use in several countries. Figure 1 shows the U.N. resource classification used in this report. The term "reserves," which many would consider to be equivalent to rlE or RlE, has been interpreted inconsistently and thus has been deliberately avoided in the U.N. classification. Category R3, undiscovered deposits, is not dealt with in this report.
USES AND SUPPLY ASPECTS
Manganese is essential for the manufacture of steel; about 95 percent of the 8.6 million metric tons of manganese (contained in 24 million metric tons of ore) produced in the world in 1981 was used in steelmaking. Manganese, mostly in the form of ferromanganese or silicomanganese, is used to "scavenge" the unwanted sulfur and oxygen from molten steel in order to reduce the brittleness of the product. Ferromanganese is also added to molten steel to produce manganese alloy steels that are stronger, harder, and more resistant to abrasion than other steels. There are no satisfactory substitutes for manganese in iron and steel production (Jones, 1983a, p. 549). Steel could be made with more expensive alternative materials, but this would increase the cost of steel, reduce the manufacture and use of steel, and would disrupt markets for the alternative materials (National Materials Advisory Board, 1981, p. 65). Other uses, which constitute about 5 percent of manganese consumption, are as an alloying element in several nonferrous metals, as an oxidizer or catalyst in a variety of industrial processes, and
1 No information is provided on deposits that once were significant but whose resources are now considered i:.o have been depleted.
2
as an agent in dry-cell batteries ("battery-grade" ores).
As shown in subsequent sections of this report, manganese resources and production are not uniformly distributed around the world. The geological factors that control the distribution of manganese deposits, coupled with the geographical history of economic development, have required that many industrialized nations import manganese from developing countries. Several aspects of manganese supply are especially noteworthy:
• Direct foreign investment in overseas manganese ore production by several U.S. and western European s~l companies after the late 1940's has had a large influence on trade and on new development of manganese resources (Brooks, 1966, p. 24).
• Programs for research, stockpiling, and production incentives have been established in several nations for strategic reasons.
• Plants to convert manganese ore into ferromanganese, which is used in quantity in steelmaking, were initially sited, for technological and economic reasons, near steelmaking facilities in industrialized countries. According to United Nations statistics (United Nations Conference on Trade and Development, 1981, p. 2 of annex), in 1960 the United States accounted for some 29 percent of world ferromanganese output, the United Kingdom plus West Germany for 16 percent, France for 10 percent, Japan for 5 percent, and South Africa for 4 percent.
The 1970's saw a marked shift in the location of new ferromanganese plants toward countries endowed with both readily available · sources of manganese ore and cheap power supplies. For instance, by 1978, the contribution of the United States to world ferromanganese production had dropped to 6 percent and that of the United Kingdom plus West Germany to 7 percent; France had stayed about the same at 9 percent; Japan's contribution had risen to 11 percent and South Africa's to 12 percent; the output of a combination of previously insignificant producers, Australia, Brazil, and Mexico, had come to account for 8 percent of world output. The location of the new ferromanganese production centers near the sources of the ore caused world . exports of manganese ore to
R* IN SITU RESOURCES
Quantities of economic interest for the next few decades
R1 KNOWN DEPOSITS
Reliable estimates
R1E~R1S EXTENSIONS OF KNOWN AND
NEWLY DISCOVERED DEPOSITSPreliminary estimates
R3 UNDISCOVERED DEPOSITS
Tentative estimates
~ R2E R2S
Economically Marginally Subeconomic Economically Subeconomic exploitable economic exploitable
*The capital "R" denotes resources in situ; a lower case "r" expresses the corresponding recoverable resources for each category and subcategory. Thus, rl E is the recoverable equivalent of Rl E. This report deals only with Rl and R2, not with R3.
FIGURE 1.-United Nations resource categories used in this report (modified from Shanz, 1980, p. 313).
decline after the mid-1970's, and those of ferromanganese to rise. The effect of this shift was particularly pronounced in the United States, where, from 1960 to 1980, imports of manganese ore fell from 1,100,000 to 300,000 metric tons of contained manganese, and imports of ferromanganese rose from 84,000 to 430,000 metric tons of contained manganese at the expense of domestic ferromanganese producers (DeHuff and Fratta, 1962, p. 870, 872; DeHuff and Jones, 1981, p. 549, 550).
The trend toward ferromanganese production in ore-producing countries may well continue. Additional ferromanganese production capacity has recently been installed in Mexico. Consideration is being given to a plant that would use ore from a future mine in the Carajas regon in Brazil. Gabon is also considering the production of ferromanganese, possibly in the 1990's.
• The depressed state of metal markets in the early 1980's has discouraged development of new manganese deposits and has caused deferment of expansion of some mining operations.
• Transportation systems must be developed or improved before some identified manganese resources can be produced and marketed. For instance, development of the Azul deposits in Brazil and the Tambao deposit in Upper Volta depends upon the construction of railways. Improved rail and water transportation systems in some areas may also stimulate more thorough exploration, which may lead to the discovery of new resources.
3
• Production of low-grade ore is maintained by some nations having economic philosophies that place greater emphasis on self-sufficiency and maintenance of a domestic industry than on market forces. For example, some deposits being mined in the Soviet Union have manga~ nese grades as low as 18 to 20 percent, compared to ore of 40 to 50 percent manganese produced in most other countries.
• So-called manganese nodules and crusts on the ocean floor have been proposed as a source of manganese, cobalt, nickel, and copper. Recent reports, such as Antrim and Sebenius (1983), are pessimistic about the possibility that these resources will be developed within the next 20 or 30 years. Nevertheless, if the technological and legal problems of ocean mining can be solved, these resources may provide an economic alternative to manganese resources on land.
DISTRIBUTION OF MANGANESE DEPOSITS AND DISTRICTS
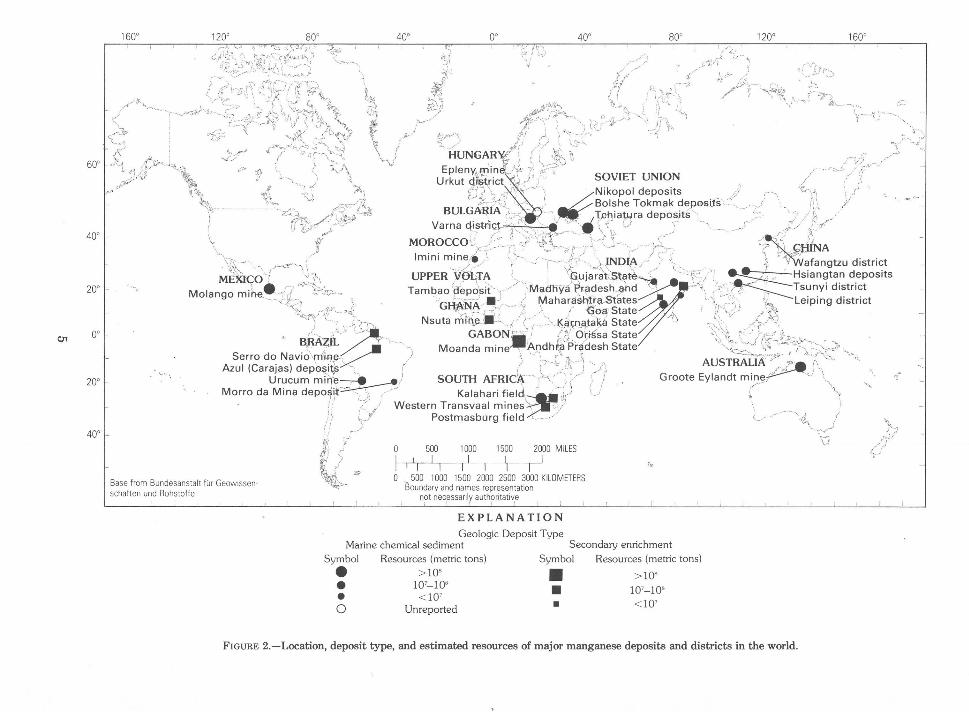
The world map in figure 2 shows the locations of major manganese deposits and districts. Of the four leading steel producers (Soviet Union, U.S.A., Japan, and western Europe), only the Soviet Union has major manganese deposits.
Major manganese deposits in this report are of two general types: marine chemical sediment deposits and secondary enrichment deposits (fig. 2). Deposits of the marine chemical sediment type commonly contain two kinds of extensive layers.
One consists of manganese oxide and the other of manganese carbonate minerals. Both kinds of layers are commonly interbedded with limestone and(or) shale typical of shallow-water depositional environments. Deposits of the secondary enrichment type are composed of manganese oxide and hydroxide minerals. They typically occur in tropical regions where intense weathering has formed manganese-rich surficial accumulations by dissolving other elements from manganiferous protores. For instance, seven of the nine secondary enrichment deposits shown in figure 2 lie between the tropics. Less commonly, the secondary enrichment type of deposit has resulted from the action of hot surface waters; the deposits of !mini, Morocco, and the Postmasburg district of South Africa are examples of this type. There are other manganese deposit types, such as hydrothermal and volcanogenic types on land and deep-sea nodules in the oceans. Deposits of these other types, however, either are not large enough or do not have enough immediate production potential to be included in this inventory.
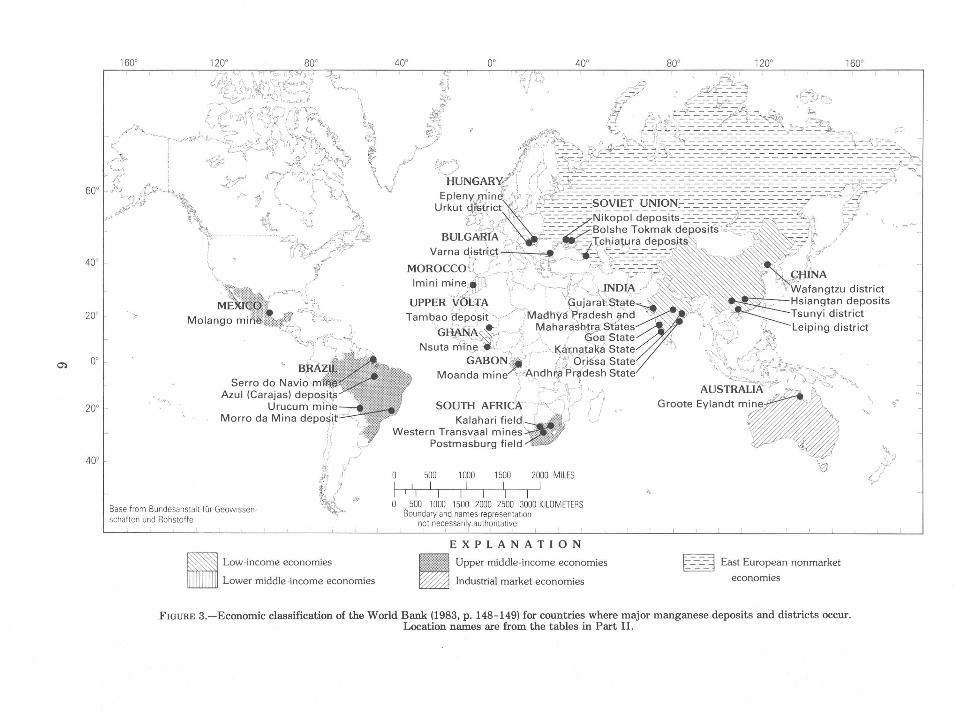
Figure 3 shows the global distribution of major manganese deposits and indicates the economic class (GNP per capita) of countries where deposits are located.
MANGANESE RESOURCES
Marine chemical sediment type deposits account for about 70 percent of the number of deposits and districts shown in figure 2. These deposits account for over 97 percent of the identified, economic resources, R1E, (in terms of contained manganese) and for over 95 percent of resources in other categories for major manganese deposits (table 1); Table 1 also shows cumulative production from these deposits; cumulative production has been small compared to resources.
Table 2 shows the distribution of resources (tons of contained manganese) of major manganese deposits among the World Bank country economic classes from figure 3. Low-income and lower middle-income countries have only a small proportion of the total manganese resources of these deposits in spite of having 13 of the 29 deposits and districts. Upper middle-income countries have nine deposits with about 89 percent of R1E resources and 84 percent of resources in other categories; most of these resources are in the Republic
ZJtesource estimates for the years given in table 7 of Part II are used to calculate these resource totals in Part I.
4
of South Africa, Mexico, and Brazil. Deposits in eastern European nonmarket-economy countries (the Soviet Union, Hungary, and Bulgaria) account for most of the other resources from major deposits (6.5 percent of RlE resources and 11 percent of other resource categories). Only one major manganese deposit (Groote Eylandt, Australia) is in an industrial-market-economy country. Table 2 indicates, as discussed earlier, that the location of manganese resources is not coincident with the regions of consumption (steelmaking centers). It is estimated on the basis of data from Roskill Information Services (1981) and Jones (1983b) that about 30 percent of manganese content of ores produced in 1979 was involved in that year's international trade as ore and ferroalloys; the number rises to over 45 percent when only non-Communist nations are considered.
The addition to world manganese resources in major deposits by discovery of new deposits is shown in figure 4. The discovery of manganese ore in the Kalahari, Republic of South Africa, in 1940 resulted in a large increase of resources. The figure shows that the Kalahari discovery and smaller discoveries since the 1940's have resulted in an impressive quantity of manganese resources compared to pre-1940 amounts. Conclusions drawn from this figure should take account (1) of the uncertainty of discovery date . due to difficulties in defining "discovery"; (2) of the limited validity of assigning all of a deposit's (or district's) resources to the initial discovery date, as done in figure 4; and (3) of the different standards used to report resource data from different deposits. The latest discovery date shown in table 7 of Part II is 1971 (Azul (Caraj as) deposits, Brazil). The absence of subsequent discoveries may reflect reduced exploration rather than a dearth of undiscovered resources. This pattern of discoveries is typical of many mineral commodities.
After the time when a deposit or district is discovered, development and production activities increase the amount of information about the mineral deposit(s), resulting in changes in resource estimates. The Kalahari field provides a good example of the problem of assigning present-day resource estimates for a deposit to the date of its discovery. As noted above, most of the large amount of manganese resources shown in figure 4 as having been "discovered" during the 1940-59 period is accounted for by about 13 billion metric tons of resources (containing about 5 billion metric
en
160' 120' 80' 40' 0' 40' 80' 120' 160'
60'
40'
/''~""~~~}~~~~,~~~~~\ ~ ' ;'";o t;A,I''\/'":;+··~ .. J~, . ~· L---('---·""<' . ,, ' M\. ""' d$ "",/ I d '>· . ~ ' '! '·\- ' J/1:..,.···" ·· (,, 1 . . '-"' ;~,::!~ .. ~;:{ ~ :1 !() f-' ~ '';;:.);"~' \.} ~. ' y ..,;-,'-,, -~'-J 1[ X:····"- "u / .,, \~ ·~, \. J HUNGAR"--/: ~' ;- ~· · .. ,•·-,;"
":!.// '<%,, p · :!) - > ~;\ "\J ' ' "f.:' ! ' .:~\) f, ;> \ > .-,;;·-
1 ~ J1 '· ' '• Epleny.mml l·,-1 ·;-- ,--.-·
1
/ ,J· \,0. '; • ~ "'·• ~;t I, l>' -'
1
'/·c"/ _.. ,t.- ~ '-, / ~ Urkut g~ict ·. / (' SOVIET UNION . , ... ,.f,,.,!, /!/' .
'~~- _\~. ____ ''\.~ /c~·,--1J.. tJ.f-~1,{f }\ :··.;.; Nikopol deposits . ,-, {v, / f "-·• --. ~_.· . _ / _ {'1-,J""'-" BULGJU>LA'' . . -- ~Bo_ l_she Tokmak de __ nosits·.... .: i_. _ .. · j .;;·-,-,, _.,. .• · ',.!~".+' no , . . ,, "(,ch' r · - /'•.·' ·' , ;r 0 'if ·,e ,.. varna r~;st-r'ict ;;;~\ ' . ,! ,,., ,· -' , _, 1a~~ ra deposits > ··· c... -c .1 ;;_' · . "" '1:' ' ) ' ' ' ':1'. .• ' '\, ,.... ' v / \ , •• '; f MOROCCO;. /,. 0 ,·.~,<- /'. \ 'G .-! .... -- · ,-v· " -r \\~., ... ,... . . . ~v::,_' .. ~~-:' ~.!"'-·J~ ?'~_--~,_;. . -"~~. ~-~(~ ~~
. ~~\\- - ..•. ,..~~-·~.' lm1n1 mme,. , :- , . ..,_ f • ..- · :"' , , · . " · OJ:ljNA '•'· 'f ,, ·,:,(,/ , .. _., .. t--1NDJA ·;·,. \·, ;,p;: MEX'K;O r . _ ..,,'. :\ UPPER \!OLTA ; \;fl.! .. __.at' 'Sta ~ .r • /. -. • • ..; ~ Wafangtzu district
Molango mihe~:-;~7 __ >-~,~"'~ . TambaoB~posii'·, /''~ MadnylP~~a~=~h ,~d~f:·.. 'f,~, '_ ,, ~~~Hsian~tan d_eposits ::.1~>1 ' . r- ---· • · M h ' ,Y'' • • n Tsuny1 d1stnct 'rj ··J;~- • .::~ · G~NA· .. .c---· '" , a arash~ra.States L• .--•.• ., ·,• . . . . ~- · .. , '\--, N 'n.: ·-·.--•.' > ·\ · G'~a State 1 >. --,. ~ Lelpmg d1stnct
J ~ <' _~, ,r-r'} suta m1n_e I _!._ ~" / \ v ·:-- at , I s /~ tf ... // i '1'-i ·'. .-~· · -'·' -~ '<., .. ~~!l.·!na;a·l$8 tate , ": ' .r.-:: B~A?,fL or ··, --, _ GABON "'" !/;'_ opS'sa State -~>'~. t'./;:~_; · 1<
Serro do Navio''fll'iAf~ __.... /, Moanda mme~Andh:e _Pr~desh State . ''<t .. ~:..; ·~~ :.,·:;;:-;?: ~- - . ,:;: Azul (Carajas) deposits~
1 / ·-;-·-->: ,~ _ \ ---"-~-., ... ~,... , • ),;J",>-~ "'.-,.,
20' ? •• ,
0'
'·- '" •
-·-
20' ... Urucum mirfe~ : SOUTH } ... _,,,.r·:., .• ,.j AUSTRALIA r?''A f'~ ·- ,
Morro da Mina deposit'~· AFRIC~ J ·· .. } ( Groote Eylandt mine~·,; \ ;; 1} ) Kalahari field.~' . · ;;) ,,..-··· '\
·~ ..
40'
Base from Bundesanstalt fUr Geowissenschaften und Rohstoffe
:! (-,/ Western Transvaal mines". · o/ •, ; ! '·::-!' Postmasburg field ........ / , . , ~i ).)./ ,_.....r .:J., __ J
/.J c' 0 500 1000 1500 2000 MILES , (;' f· r' I I I I I . ,..,;_ ( "' I I I I I I I "' ~- 0 B 500 1000 1500 2000 2500 3000 KILOMETERS
· oundary and names representation n_ot necessarily authpritatlve
EXPLANATION
Geologic Deposit Type Marine chemical sediment Secondary enrichment
Symbol Resources (metric tons) Symbol Resources (metric tons) • > 10' • 10'-10' • <10' 0 Unreported
• > 10'
• • 10'-108
< 10'
FIGURE 2.-Location, deposit type, and estimated resources of major manganese deposits and districts in the world.
.,, t ·-;
i)J /jl t;---
0':>
160° 120° 80° 40° oo 40° 80° 120° 160° -')_~
..1-=~-=~ ,. , .... y .... ~- -
f_; ' .· -~.;:~'-~};>,.:~, . \,.) Eplenv~?ii.net~:_~Lj, ~~:=.======~Nikopol-deposkitsd~~Si~5--::<-:::=;-:--:~-~~~¥==' ;: , ... ~~ '•; ~ d11>tnc , c,•._..,. ___ -=---~-. Tokma r --~- - '~ < .• ?' .· ) fA U cko< :,··. \ •· •C_ ---.- " Bol>he O> " ,~· ~ .-/ \r ~• ; · • \ .. ,. • • c.. - . tura dep .-., -0,'-.~'\) f' • ' \ ' vi.-"''• ..• --- --"'"" ' -- -_, . ""' { 'NA -~•-' .1\J-'•''· ""''% ,. '£> '·-•. ,._, j . ~~ BULGMIIA>,,_ -~ • ,-1-\ <;-::'c:=:-:-:c/ ·~~\iW t u district
; -,!,~ ">. ,(. - --1<. . , < '" ',' ' ; •v·.,.-'·· ~---· ~c;. ~ 1\,Wef'"g ' o>ll> ";;:-~ • ~~t, ~'L. •· .. .. ,_·!_~·:;;_" '.L~ Varna ctf~tJ: L5, f·,-;.,.~1- .:· "\_.r --~-- ,·1•••• • · Hsiangtan dep . ' ' . " . "" ' ; .• ' . . . ""' . '" ~- ~- ·z., /c.,. ceo·· .·. ,. ' "-·· 'j ·' INDIAc '. , " • T'"nyl d'""
· :r !f .-' MORO I[" , ' r •· ~ .:;· ""'' · '""' 'c · "" , .. ct'"''" ".. . . mtne,e V " \lfi ·arat$tat-e , ~'-:: '·. ·, :,<" ,, Leiping "' lmtnl ·e . , UJ . , d • , . . ... •. ;(_ ) """'. < . ; ... ' d"h'"' ' '\, •,·, ''h UPPER YP ~~-- ./">M,.hye ~~''""'""" ' tv ;: .'S.
beo Oepo'" ; ' Mehec"' I:Oe•S<e<e -,• /< .• ; .
60°
40°
20° I
oo
f--
T em 'G.iJ;iii~~j- . :( \ .;_,,,,J;;i S<ete '('i,, C.fcJt -~"f-,I;:;t:::' ~o. · ~ ~ ••• _.. '·• · -~~ tli>' Stete ·J~"'<':,.. • , •
Nsuta m1~BON·&ii_··, k O·p .. ~de. sh State AUSTRAL~I- A 'IJ7J .. % )-, .·· ,,, • . J<;,Andh ~ t dt mm~. Moende m•ne ? J,) ; u ' Gmote Eylen ~~~ ;;,
20°
40°
Base from Bundesanstalt fur Geowrssenschatten und Rohstoffe
•
Low-income economies
Lower middle-income economies
0 500 1 000 1500 2000 MILES I I I I I
' I 1 I I I I 0 500 1000 1500 2000 2500 3000 KILOMETERS
Boundary and names representation not necessarily authoritative
: f '
EXPLANATION
• ~:::~:::~:::;:::::::mies
~.~
.. ' /) 0 i{
f====="=i East European nonmarket economies
';~..-
FIGURE 3.-Economic classification of the World Bank (1983, p. 148-149} for countries where major manganese deposits and districts occur. Location names are from the tables in Part II.
_,_
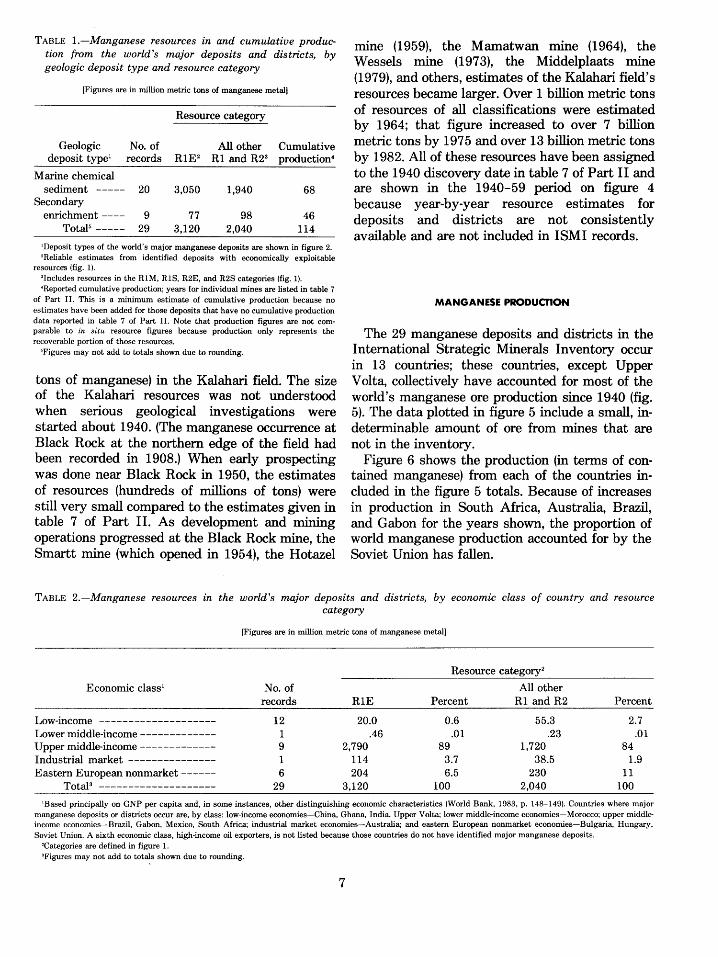
TABLE I.-Manganese resources in and cumulative production from the world's major deposits and districts, by geologic deposit type and resource category
[Figures are in million metric tons of manganese metal)
Resource category
Geologic No. of All other Cumulative deposit type1 records R1E 2 R1 and R23 production4
Marine chemical sediment ----- 20 3,050 1,940 68
Secondary enrichment ---- 9 77 98 46
Total5 ----- 29 3,120 2,040 114
'Deposit types of the world's major manganese deposits are shown in figure 2. 'Reliable estimates from identified deposits with economically exploitable
resources (fig. 1). 'Includes resources in the RIM, RlS, R2E, and R2S categories (fig. 1). 'Reported cumulative production; years for individual mines are listed in table 7
of Part II. This is a minimum estimate of cumulative production because no estimates have been added for those deposits that have no cumulative production data reported in table 7 of Part II. Note that production figures are not comparable to in situ resource figures because production only represents the recoverable portion of those resources.
'Figures may not add to totals shown due to rounding.
tons of manganese) in the Kalahari field. The size of the Kalahari resources was not understood when serious geological investigations were started about 1940. (The manganese occurrence at Black Rock at the northern edge of the field had been recorded in 1908.) When early prospecting was done near Black Rock in 1950, the estimates of resources (hundreds of millions of tons) were still very small compared to the estimates given in table 7 of Part II. As development and mining operations progressed at the Black Rock mine, the Smartt mine (which opened in 1954), the Hotazel
mine (1959), the Mamatwan mine (1964), the Wessels mine (1973), the Middelplaats mine (1979), and others, estimates of the Kalahari field's resources became larger. Over 1 billion metric tons of resources of all classifications were estimated by 1964; that figure increased to over 7 billion metric tons by 197 5 and over 13 billion metric tons by 1982. All of these resources have been assigned to the 1940 discovery date in table 7 of Part II and are shown in the 1940-59 period on figure 4 because year-by-year resource estimates for deposits and districts are not consistently available and are not included in ISMI records.
MANGANESE PRODUCTION
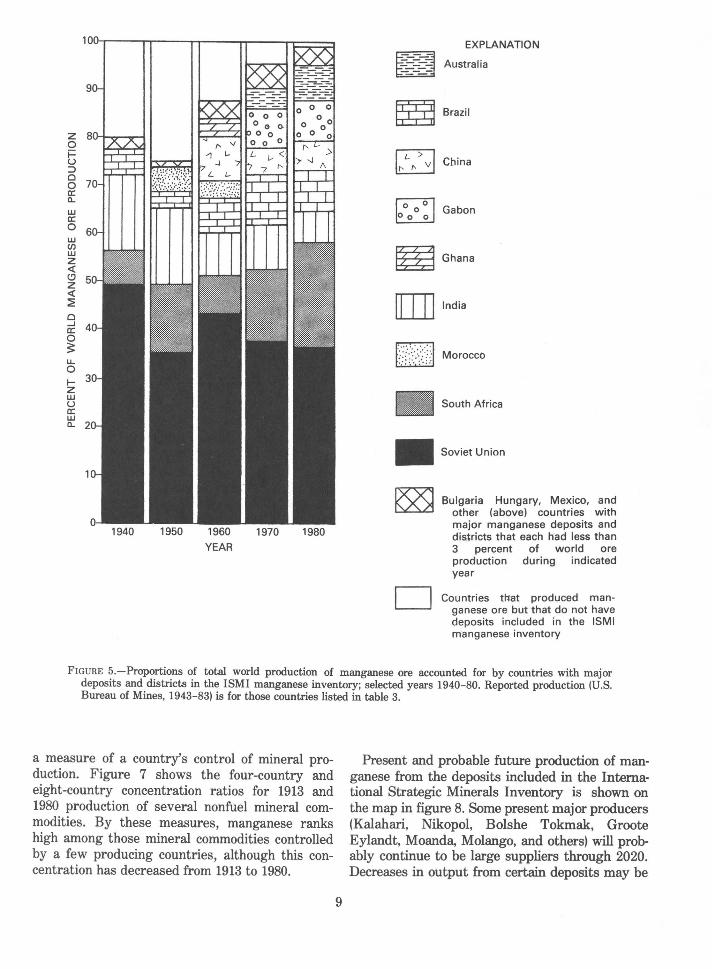
The 29 manganese deposits and districts in the International Strategic Minerals Inventory occur in 13 countries; these countries, except Upper Volta, collectively have accounted for most of the world's manganese ore production since 1940 (fig. 5). The data plotted in figure 5 include a small, indeterminable amount of ore from mines that are not in the inventory.
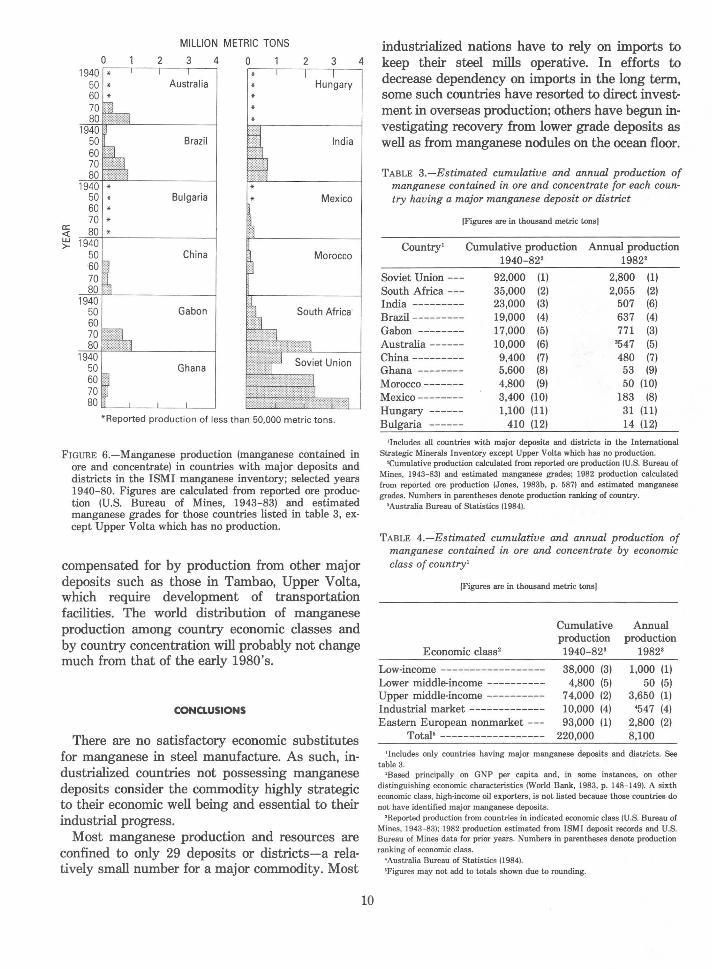
Figure 6 shows the production (in terms of contained manganese) from each of the countries included in the figure 5 totals. Because of increases in production in South Africa, Australia, Brazil, and Gabon for the years shown, the proportion of world manganese production accounted for by the Soviet Union has fallen.
TABLE 2.-Manganese resources in the world's major deposits and districts, by economic class of country and resource category
[Figures are in million metric tons of manganese metal)
Resource category2
Economic class1 No. of All other records R1E Percent R1 and R2 Percent
Low-income -------------------- 12 20.0 0.6 55.3 2.7 Lower middle-income ------------- 1 .46 .01 .23 .01 Upper middle-income ------------- 9 2,790 89 1,720 84 Industrial market --------------- 1 114 3.7 38.5 1.9 Eastern European nonmarket ------ 6 204 6.5 230 11
Total3 -------------------- 29 3,120 100 2,040 100
'Based principally on GNP per capita and, in some instances, other distinguishing economic characteristics (World Bank, 1983, p. 148-149). Countries where major manganese deposits or districts occur are, by class: low-income economies-China, Ghana, India, Upper Volta; lower middle-income economies-Morocco; upper middleincome economies-Brazil, Gabon, Mexico, South Africa; industrial market economies-Australia; and eastern European nonmarket economies-Bulgaria, Hungary, Soviet Union. A sixth economic class, high-income oil exporters, is not listed because those countries do not have identified major manganese deposits.
'Categories are defined in figure 1. 'Figures may not add to totals shown due to rounding.
7
6,-----------------------------------------------------------------------.
w (/) w z <( (.!:J z <(
~ 4
0 w z ~ z 0 u u.. 3 0 (/)
z 0 1-
~ ~ 2 w ~
z 0 ::J ..J
iii
EXPLANATION
• Reported production to 1982 from discoveries made in the time period specified
R1E'
Other resource categories'
D Small tonnages from 2 or 3 of the above classes that cannot be presented at this scale
0~====~======~ 1840-59 1860-79 1880-99 1900-19 1920-39 1940-59 1960-79 Unclassifiable
DATE OF DISCOVERY
'Reliable estimates from identified deposits with economically exploitable resources (fig. 1) ' Includes resources in the R1 M, R1S, R2E, and R2S categories (fig. 1)
FIGURE 4.-Manganese resources in the world's major deposits and districts according to their date of discovery. If the year of discovery was not reported, the year of first production was used instead; if neither the year of discovery nor the year of first production was reported, the deposit's resources were considered "unclassifiable." Years of discovery are listed in table 7 of Part II.
Information on 1982 production and on cumulative production from 1940 through 1982 for countries with deposits in the inventory is shown in table 3. These production data have been grouped according to World Bank country economic class in table 4. About 35 percent of 1982 production and 42 percent of cumulative production since 1940 has been from eastern European nonmarketeconomy countries (largely the Soviet Union). The second-ranking group of countries in cumulative production, the upper middle-income class (South Africa, Gabon, Brazil, and Mexico), accounts for about 45 percent of 1982 production and 34 percent of production since 1940.
8
Manganese is produced from surface and underground mining operations. Table 5 shows the distribution of resources by mining method. The Kalahari field contains both surface and underground mines. It constitutes the major part of resources reported for the largest resource entry in this table, the upper middle-income countries.
In studies of industrial market structure, some approaches used to measure market concentration focus directly on observable dimensions, such as number of suppliers. The market concentration ratio, defined as the percentage of total industry sales or output contributed by the largest few firms (Scherer, 1970, p. 50-51), can be adapted as
z 0 t= (.) :::l 0 0 a: a._
w a: 0 w (/) w z <{ (!) z <{
:!: 0 ...J a: 0 s: u.. 0 1-z w (.) a: w a._
1940 1950 1960 YEAR
1970 1980
m -
~
w v
~ 0
m [J]
LZJ
D
EXPLANATION
Australia
Brazil
China
Gabon
Ghana
India
Morocco
South Africa
Soviet Union
Bulgaria Hungary, Mexico, and other (above) countries with major manganese deposits and districts that each had less than 3 percent of world ore production during indicated year
Countries that produced manganese ore but that do not have deposits included in the ISMI manganese inventory
FIGURE 5.-Proportions of total world production of manganese ore accounted for by countries with major deposits and districts in the ISM! manganese inventory; selected years 1940-80. Reported production (U.S. Bureau of Mines, 1943-83) is for those countries listed in table 3.
a measure of a country's control of mineral production. Figure 7 shows the four-country and eight-country concentration ratios for 1913 and 1980 production of several nonfuel mineral commodities. By these measures, manganese ranks high among those mineral commodities controlled by a few producing countries, although this concentration has decreased from 1913 to 1980.
9
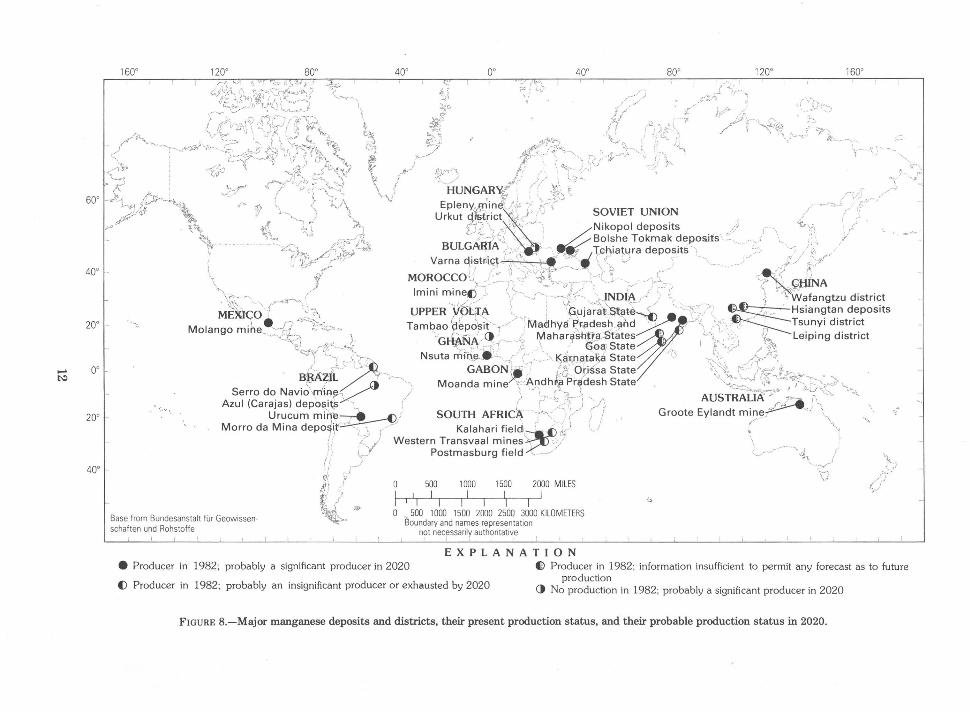
Present and probable future production of manganese from the deposits included in the International Strategic Minerals Inventory is shown on the map in figure 8. Some present major producers (Kalahari, Nikopol, Bolshe Tokmak, Groote Eylandt, Moanda, Molango, and others) will probably continue to be large suppliers through 2020. Decreases in output from certain deposits may be
MILLION METRIC TONS
0 2 3 4 0 2 3 4
* Australia * Hungary
* *
Brazil India
Gabon South Africa
Ghana
*Reported production of less than 50,000 metric tons.
FIGURE G.-Manganese production (manganese contained in ore and concentrate) in countries with major deposits and districts in the ISM! manganese inventory; selected years 1940-80. Figures are calculated from reported ore production (U.S. Bureau of Mines, 1943-83) and estimated manganese grades for those countries listed in table 3, except Upper Volta which has no production.
compensated for by production from other major deposits such as those in Tambao, Upper Volta, which require development of transportation facilities. The world distribution of manganese production among country economic classes and by country concentration will probably not change much from that of the early 1980's.
CONCLUSIONS
There are no satisfactory economic substitutes for manganese in steel manufacture. As such, industrialized countries not possessing manganese deposits consider the commodity highly strategic to their economic well being and essential to their industrial progress.
Most manganese production and resources are confined to only 29 deposits or districts-a relatively small number for a major commodity. Most
10
industrialized nations have to rely on imports to keep their steel mills operative. In efforts to decrease dependency on imports in the long term, some such countries have resorted to direct investment in overseas production; others have begun investigating recovery from lower grade deposits as well as from manganese nodules on the ocean floor.
TABLE 3.-Estimated cumulative and annual production of manganese contained in ore and concentrate for each country having a major manganese deposit or district
!Figures are in thousand metric tons)
Country' Cumulative production Annual production
1940-82' 1982'
Soviet Union --- 92,000 (1) 2,800 (1) South Africa --- 35,000 (2) 2,055 (2) India --------- 23,000 (3) 507 (6) Brazil --------- 19,000 (4) 637 (4) Gabon -------- 17,000 (5) 771 (3) Australia ------ 10,000 (6) 3547 (5) China --------- 9,400 (7) 480 (7) Ghana -------- 5,600 (8) 53 (9) Morocco ------- 4,800 (9) 50 (10) Mexico-------- 3,400 (10) 183 (8) Hungary ------ 1,100 (11) 31 (11) Bulgaria ------ 410 (12) 14 (12)
'Includes all countries with major deposits and districts in the International Strategic Minerals Inventory except Upper Volta which has no production.
'Cumulative production calculated from reported ore production (U.S. Bureau of Mines, 1943-831 and estimated manganese grades; 1982 production calculated from reported ore production (Jones, 1983b, p. 5871 and estimated manganese grades. Numbers in parentheses denote production ranking of country.
'Australia Bureau of Statistics (1984).
TABLE 4.-Estimated cumulative and annual production of manganese contained in ore and concentrate by economic class of country'
!Figures are in thousand metric tons]
Economic class'
Low-income -----------------
Lower middle-income ---------Upper middle-income ---------
Industrial market ------------
Eastern European nonmarket ---Total' ------------------
Cumulative production
1940-823
38,000 (3) 4,800 (5)
74,000 (2) 10,000 (4) 93,000 (1)
220,000
Annual production
19823
1,000 (1) 50 (5)
3,650 (1) '547 (4)
2,800 (2) 8,100
1lncludes only countries having major manganese deposits and districts. See table 3.
'Based principally on GNP per capita and, in some instances, on other distinguishing economic characteristics (World Bank, 1983, p. 148-149). A sixth economic class, high-income oil exporters, is not listed because those countries do not have identified major manganese deposits.
'Reported production from countries in indicated economic class (U.S. Bureau of Mines, 1943-83); 1982 production estimated from ISM! deposit records and U.S. Bureau of Mines data for prior years. Numbers in parentheses denote production ranking of economic class.
'Australia Bureau of Statistics (1984). 'Figures may not add to totals shown due to rounding.
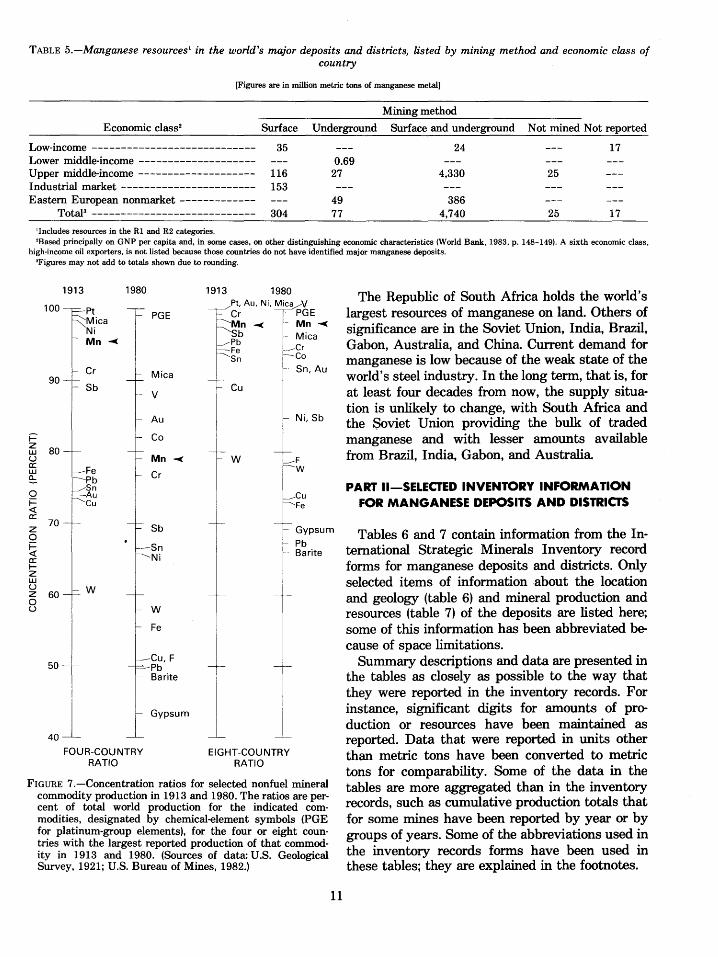
TABLE 5.-Manganese resources 1 in the world's major deposits and districts, listed by mining method and economic class of country
[Figures are in million metric tons of manganese metal]
Mining method
Economic class2 Surface Underground Surface and underground Not mined Not reported
35 24 17 Low-income ---------------------------Lower middle-income -------------------Upper middle-income -------------------Industrial market ----------------------Eastern European nonmarket -------------
0.69 116 27 4,330 25 153
49 386 Total3 ---------------------------- 304 77 4,740 25 17
'Includes resources in the R1 and R2 categories. 'Based principally on GNP per capita and, in some cases, on other distinguishing economic characteristics (World Bank, 1983, p. 148-149). A sixth economic class,
high-income oil exporters, is not listed because those countries do not have identified major manganese deposits. 'Figures may not add to totals shown due to rounding.
i=
1913
100-rpt Mica Ni Mn ....c:
Cr 90 I Sb
~ 80 u a: L.U a...
0 i= <( a:
1980
-,-
I ~
-
-~
PGE
Mica
v
Au
Co
Mn --< Cr
1913 1980
~t;Au, Ni,v~E
Mn --< 1 Mn --< Sb 1
- Mica
F~~ ____ cr Sn Co
f= Cu
w
Sn, Au
Ni, Sb
F w
Cu Fe
z 0 i= <( a: 1-z L.U u z 0 u
70 Sb
-Sn Ni
Gypsum
Pb Barite
60
50
40
w
w Fe
-Cu,F
j_ FOUR-COUNTRY
RATIO
Pb Barite
Gypsum
_I EIGHT-COUNTRY
RATIO
FIGURE 7.-Concentration ratios for selected nonfuel mineral commodity production in 1913 and 1980. The ratios are percent of total world production for the indicated commodities, designated by chemical-element symbols (PGE for platinum-group elements), for the four or eight countries with the largest reported production of that commodity in 1913 and 1980. (Sources of data: U.S. Geological Survey, 1921; U.S. Bureau of Mines, 1982.)
11
The Republic of South Africa holds the world's largest resources of manganese on land. Others of significance are in the Soviet Union, India, Brazil, Gabon, Australia, and China Current demand for manganese is low because of the weak state of the world's steel industry. In the long term, that is, for at least four decades from now, the supply situation is unlikely to change, with South Africa and the Soviet Union providing the bulk of traded manganese and with lesser amounts available from Brazil, India, Gabon, and Australia
PART II-SELECTED INVENTORY INFORMATION FOR MANGANESE DEPOSITS AND DISTRICTS
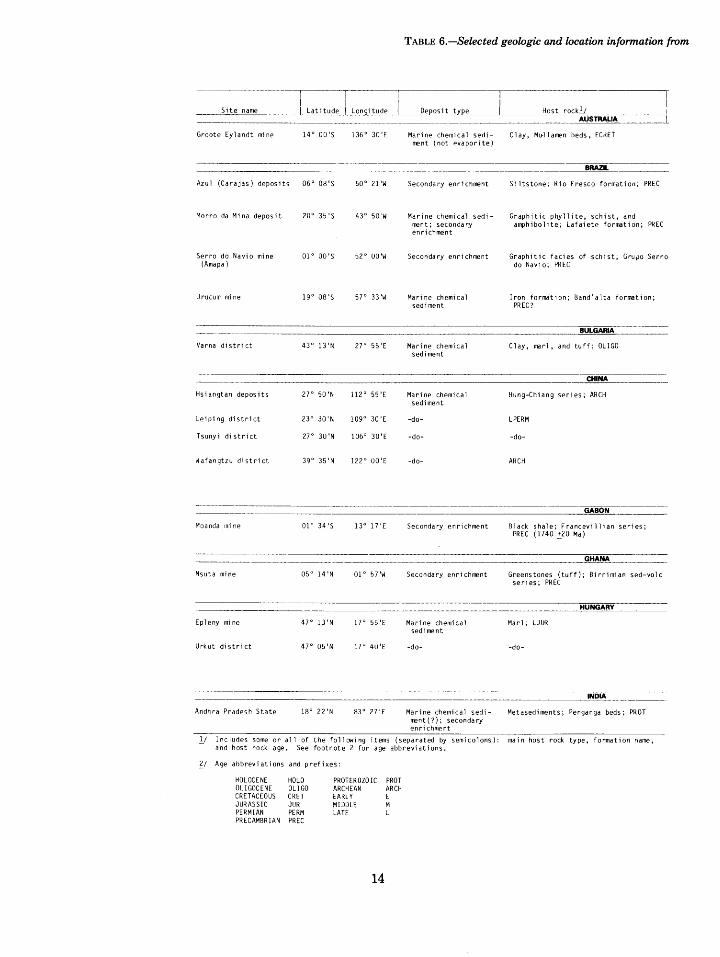
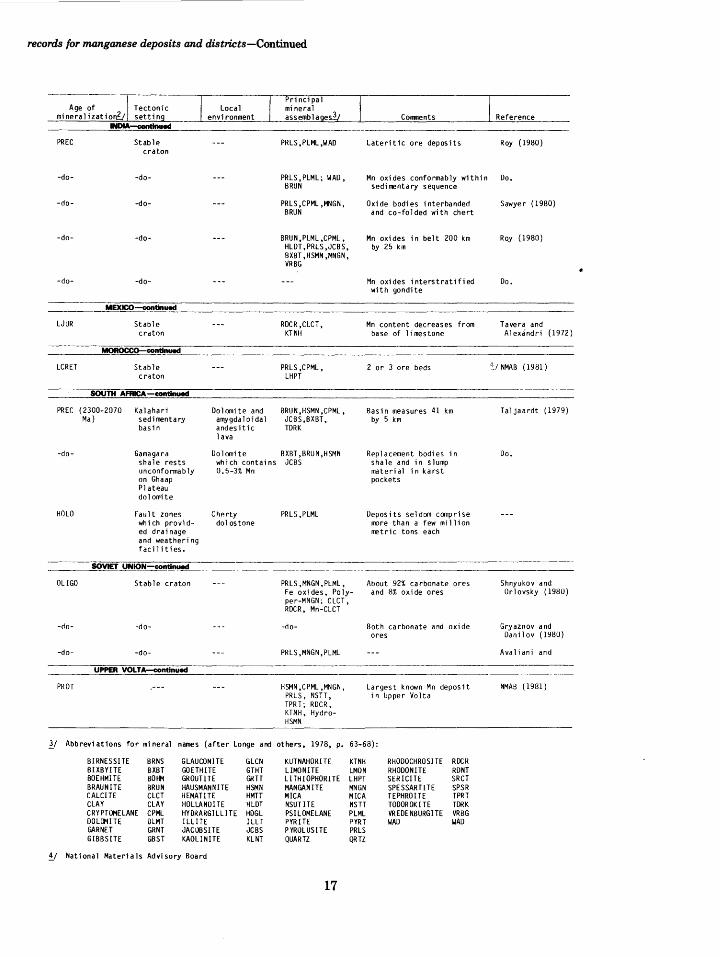
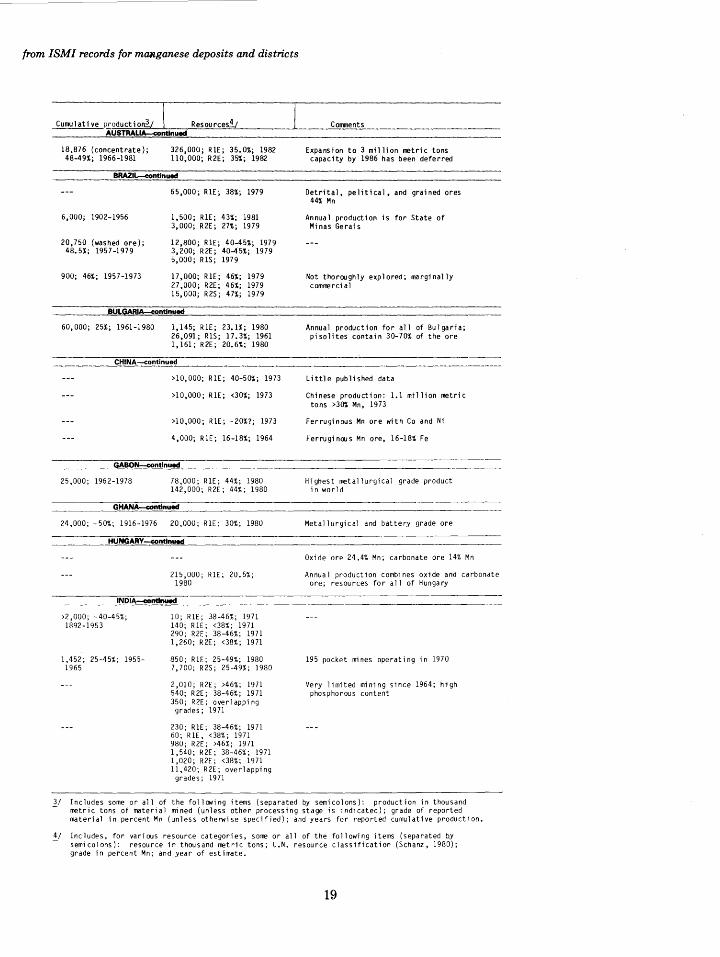
Tables 6 and 7 contain information from the International Strategic Minerals Inventory record forms for manganese deposits and districts. Only selected items of information about the location and geology (table 6) and mineral production and resources (table 7) of the deposits are listed here; some of this information has been abbreviated because of space limitations.
Summary descriptions and data are presented in the tables as closely as possible to the way that they were reported in the inventory records. For instance, significant digits for amounts of production or resources have been maintained as reported. Data that were reported in units other than metric tons have been converted to metric tons for comparability. Some of the data in the tables are more aggregated than in the inventory records, such as cumulative production totals that for some mines have been reported by year or by groups of years. Some of the abbreviations used in the inventory records forms have been used in these tables; they are explained in the footnotes.
~ [',;)
160' 120' 40' 0' 40° 80' 120' 160'
60o t ~\<.
1/<_t;.-, _ _. ·~u / ·. · ( \,. " \,,) HUNGARv/ . • '~J, f. __ ,,.
-'1.-o ?v ... ~~ ·"-"· t ( V\ ""' '· 1:' ~ ~ -.., ... -~:)_\ . ., _.,,... ;/_; '}/<if ~ ' 'f/ h. , Epleny,)llme·J -~ ., ,(--·, ---.. ~-~~ ;·>'
"" \·t "" ~,, >,., ;:c~·;\ _r . .. ·v·. N'k I d . ,_ · ; /" ~ • ''-,, / ~. Urkut qrstrict~·' ,)' ·. ·' SOVIET UNION /, ,/ ::
~- \1 "\~ _ 1--~ t..JL :?_/.: . , ; I opo epOSitS __ r-··-\ v\t\ _ ~" ~- ""'·./·· <?~,·~'f!,.. BULG,(_d;-·A. ··''·· : ··_ ... ,·. ~Bolshe Tokmak dep.osi.fs·.. . , .. :·,\ /
40' ·-
20' 1--
oo
20' l·
40' ..
'•c
·:., .. ,
z., .. , ./·· '• . ..., n<q.tl '" ... ... T h' t d . .. , ' ;r'"1'\: /..: '>!<;;?" . • ''"''::,: , :, <· • fl ,1a4ra epos.1ts ·~ •.·.. ·• •\ . I ~:;r-· I r, Varna ct~strtGl '., ' \ t -~·., 1• ,r ./ \ • ' ·, , ••
~ ' '> ,..' (' ' • :- ~ ~---- '"--- -, \ "•o. " .... '·1'"' / ·~ -:t· ~ f MOROCCO;; : o· ~ < /' \:._1\, i ' .. J· • ,--- -~;,-: .-:
'::..., /)i . . . ,'<.:; '--: (' ""-..>~ if7 : ''\ ....... ~ -~ /.J; I ~I? - rt:tiNA \'·"·...... ; lm1 n1 rrn ne(> .· \ . · ,..._ ,_.- . · • ~ ·· ' • •
. ~~ , .\ f', .... ,.-..~,\ ...• .- ,. • • ··--·~\. •·· -~-~NDI:A .J· -· '. ; \ Wafangtzu district MEXl<;O I . .• ~-J\ UPPER YbttrA ·.... \'fiujara'tt~t~ '· ;:. ' ~Hsiangtan deposits
Molango mihe~:-i£.'· ~>.i.v""'~ , Tambao~-~_?-?_sii ·- /'.'·Malflhy;(~~~~desh)!{,d~~ -"•: -~~-- ~Tsunyi district "'j /""-. ,~· 'GH$'NA' El,, , __ .<, ~aharash~HI..States v .... . .'_ ~ Le1ping district
t"'::f"'" ,~ ·"'<(,. 'r. ·-.·· •., r;. • (ifoai State 1 it -.... ,/ , ·'II'\' ] · .... : ·:·\.,"("; Nsuta mi OJl.-·'·-( :,; . >~~s\'l{laJ~' 1 State · ') "':. / _,..(,_.AJ.
·'· ···~-· GABON ,.,.. -~· 0 · ;:.,,,':, / r BRA'Zil '!'"-,.. ... , .· -~o ;. sa State ';, ,. ~- · /-e:~' f ,_ ,_ s d N . .; L / _....() ·;· Moanda mine~·Afi.dh t.·~ .Pr{ldesh State '··-~·.:,.,~-< -~~-·""'"\'Z,"'::<,..)
erro o_ av1o muH~-y , , ~ .... ; ·\ ~ . ..,. .~ <--...:....,_,-:.o:·"':.~:;. , • J....,J\~·· "''..~\ Azul (CaraJas) deposi,J; \. ( / ,.·-" .. :~· ! 'j\ AUSTRALIA · r.?a (, ·'- ·
Urucum min~~/ SOUTH AFRIC~ r·:· ·:: ;:./ ; I Groote Eylandt min_~~-) '\ Morro da M1na depo~1,P ·., -, , / Kalahari field. · - · U ( \
'(~ ..
/! '·-· ~""' • " , </ Western Transvaal mines' · /' \ : } ~r' Postmasburg field , ___ _.· (, ... .;···---·'.,) J; ; / ~J-· ·~\. __ ~ m ~ ~ il)· ( 0 500 1000 1500 2000 MILES \."
t: ! I I I I I I i.l ,., I I I I I I I '•
~--<;i' /"! 'f-J
Base from Bundesanstalt fur Geowissenschaften und Rohstoffe
·~ _ 0 "500 1000 1500 2000 2500 3000 KILOMETERS ""i" tsoundary and names representation
npt nec~ssarily auth?ritativ,e
EXPLANATION
_,_
e Producer in 1982; probably a significant producer in 2020 C) Producer in 1982; information insufficient to permit any forecast as to future production
() Producer in 1982; probably an insignificant producer or exhausted by 2020 () No production in 1982; probably a significant producer in 2020
FIGURE 8.-Major manganese deposits and districts, their present production status, and their probable production status in 2020.
TABLES 6 AND 7
Site name Latitude Lon9i tude
Groote Eyl andt mine 14° 00 'S 136° 30'E
Azul (Carajas) deposits 06° 08'5 50° 21 'W
Morro da Mina deposit 20° 35'S 43° 50 'W
Serro do Na vi o mine 01°00'S 52° 00 'W (Amapa)
U rucum mine 19° 08 'S 57° 33'W
Varna district 43° 13 'N 27° 55 'E
Hsiangtan deposits 27° 50'N 112° 55'E
Leiping district 23° 30'N 109° 30'E
Tsuny i district 27° 30 'N 106° 30'E
Wafangtzu district 39° 35 'N 122° OO'E
Moanda mine 01 o 34'S 13° 17 'E
Nsut a mine 05° 14 'N 01°57'W
Epleny mine 47o 13 'N 17° 55 'E
Urkut district 47o 05 'N 17° 4U 'E
Andhra Pradesh State 18° 22 'N 83° 27 'E
TABLE 6.-Selected geologic and location information from
De~osit tl~e
Marine chemica 1 sedi-ment (not f'Vaporite)
Secondary enrichment
Marine chemical sedi-ment; secondary enrichment
Secondary enrichment
Marine chemical sediment
Marine chemical sediment
Marine chemical sediment
-do-
-do-
-do-
Secondary en ri chme nt
Secondary enrichment
Marine chemical sediment
-do-
Marine chemical sediment (?); secondary enrichment
Host rockl; AUSTRALIA
Clay, Mu-ll amen beds, ECI<ET
BRAZIL
Siltstone; K i o Fresco formation; PREC
Graphitic phyllite, schist, and amphibolite; Lafai etf' formation; PI\EC
Graphitic facies of schist; GrutJO Serro do Nav1o; PREC
Iron formal ion; Band' alta formation; PREC?
BULGARIA
Clay, marl, and tuff; OLIGO
CHINA
Hung-Chiang series; ARCH
LPERM
-do-
ARCH
GABON
Black shale; Francevillian series; PREC (1740 ~20 Ma)
GHANA
Greens tones (tuff); Birrimian sed-vole series; PREC
HUNGARY
Marl; LJUR
-do-
INDIA
Metasediments; Penganga beds; PROT
_y Includes some or all of the follONing items (separated by semicolons): main host rock type, formation name, and host rock age. See footnote 2 for age abbreviations.
'{! Age abbreviations and prefixes:
HOLOCENE OLIGOCENE CRETACEOUS JURASSIC PERMIAN PRECAMBRIAN
HOLO OLIGO CRET JIJR PERM PREC
PROTEROZOIC PROT ARCHEAN ARCH EARLY E MIJDLE M LATE L
14
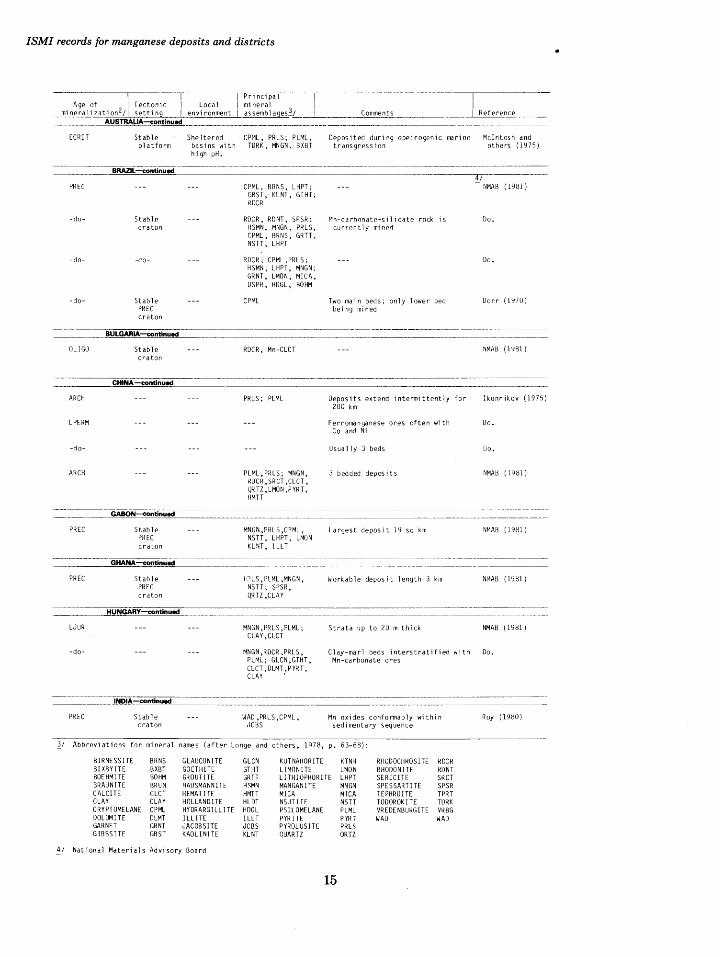
ISM! records for manganese deposits and districts
~·~ Principal ~ mineral I assemblages3/ _l__
Age of I Tectonic I Local mineralizatio~l setting I environment Comments Reference
AUSTRALIA--1:ontinued
ECRET Stab 1 e platform
Sheltered CPr1L, PRLS; PLML, Deposited during epeirogenic marine Mcintosh and
}j
~_/
basins with TDRK, MNGN, BXBT transgression others (1Y75)
PREC
-do-
-do-
-do-
OLIGO
ARCH
LPERM
-do-
ARCH
PREC
PREC
LJUR
-do-
PREC
BRAZIL -continued
Stahle craton
-do-
Stable PREC craton
BULGARIA-continued
Stable craton
CHINA --1:ontinued
GABON-continued
Stable PREC craton
GHANA continued
Stahle PREC craton
HUNGARY-continued
INDIA-continued
Stable craton
high pH.
CPML, BRNS, LHPT; GBST, KLNT, GTHT; RDCR
RDCR, RDNT, SPSR; Mn-ca rbonate-s i 1 i cate rock is HSMN, MNGN, PRLS, currently minE'<:! CPML, BRNS, GRTT, NSTT, LHPT
RDCR; CPML,PRLS; HSMN, LHPT, MNGN; GRNT, LMON, MICA, DSPR, HDGL, BOHM
CPML
RDCR, Mn-CLCT
PRLS; PLML
PLML, PRLS; MNGN, RDCR,SRCT ,CLCT, QRTZ,LMON ,PYRT, HMTT
MNGN ,PRLS ,CPML, NSTT, LHPT, LMON KLNT, ILLT
f-:'LS, PLML ,MNGN, NSTT; SPSR, QRTZ ,CLI\Y
MNGN, PRLS, PLML; CLAY ,CLCT
MNGN,RDCR,PRLS, PLML; GLCN,GTHT, CLCT ,DLMT,,PYRT, CLAY
WAD ,PRLS ,CPML, JC8S
Two main beds; only lower bed being mined
Deposits extend intermittently for 200 km
Ferromanganese ores often with Co and Ni
Usually 3 beds
3 bedded deposits
Largest deposit 19 sq km
Workable deposit length 3 km
Strata 11p to ~0 m thick
Clay-marl beds interstratified with Mn-carbonate ores
Mn oxides conformably within sedimentary sequence
Abbreviations for mineral names (after Longe and others, 1978, p. 63-68):
BIRNESSITE BRNS GLAUCONITE GLCN KUT NAHOR ITE KTNH RHODOCHROSITE RDCR BIX13YITE BXBT GOETHITE GTHT LIMONITE LMON RHODONITE RDNT BOEHMITE BOHM GROUTITE GRTT LITHIOPHORITE LHPT SERICITE SRCT BRAUNITE BRUN HAUSMANN ITE HSMN MANGANITE MNGN SPESSART ITE SPSR CALCITE CLCT HEMATITE HMTT MICA MICA TEPHROITE TPRT CLAY CLAY HOLLANDITE HLDT NSUTI TE NSTT TODOROKI TE TDRK CRYPTOMELANE CPML HYDRARGILLITE HDGL PSI LOME LANE PLML VREDENBURGITE VRBG DOLOMITE DLMT ILLITE ILLT PYRITE PYRT WAD WAD GARNET GRNT JACOB SITE JCBS P YROL US I TE PRLS GIBBSITE GBST KAOLINITE KLNT QUARTZ QRTZ
National Materials Advisory Board
15
4/ - NMAB ( 1981)
Do.
Do.
Dorr (1Y7U)
NMAB ( 1 <J81)
Ikonnikov (1975)
Do.
Do.
NMA8 ( 19<ll)
NMAB ( 1981)
NHAB (19tH)
NMMl ( 1Y81)
Do.
Roy (1980)
------·-T-1
Site name I Latitude
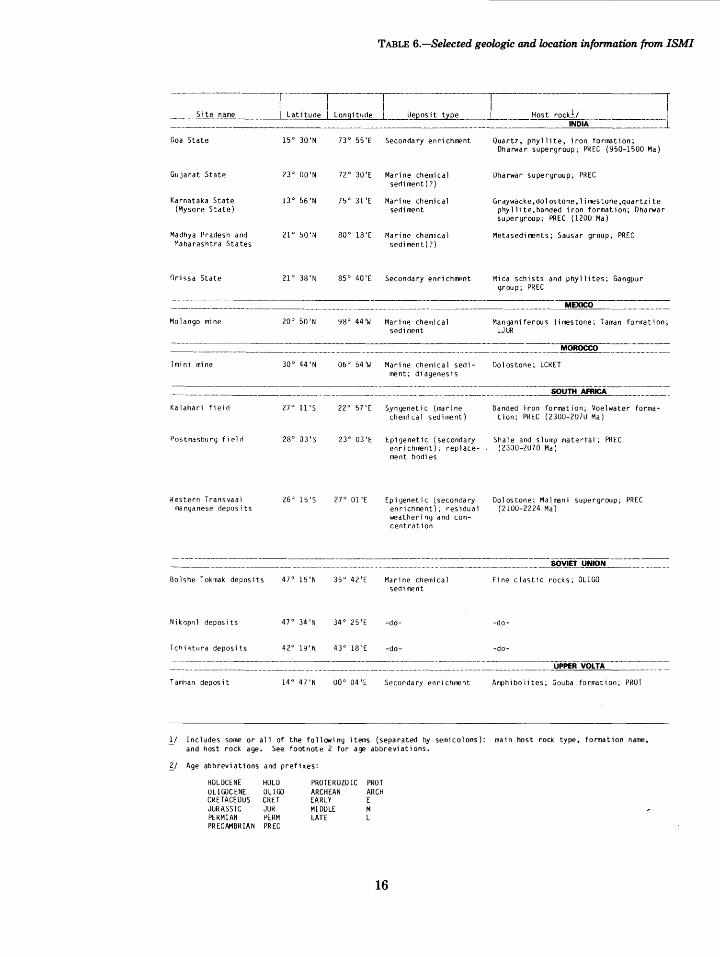
TABLE 6.-Selected geologic and location information from ISM!
~ I
Longitude _l Oepos it type I
_l
I
---- ----·-----·----------------------Host roc~~DIA ·---------1
Goa State
Gujarat State
Karnataka State (Mysore State)
Madhya Pradesh and Maharashtra States
Orissa State
Mo 1 an go mine
!mini mine
Kalahari field
Post,~asburg fielrl
Hestern Transvaal manganese deposits
15 o 30 'N
23° 00 'N
13° 56'N
Zl 0 50'N
21° 38'N
20° 50'N
30" 44 'N
27° 11 'S
28° 03'5
26" 15'5
73° 55'E Secondary enrichment
72° 3U'E Marine chemical sediment (?)
75° 31 'E Marine chemical sediment
80° 18'E Marine chemica 1 sediment (?)
85° 40'E Secondary enrichment
98° 44'W t4arine chemical sediment
06" 54'W Marine chemical sedi-ment; diagenesis
Quartz, phyllite, iron formation; Dharwar supergroup; PREC (950-1500 Ma)
Uharwar supergroup; PREC
Graywacke, do 1 os tone, 1 i mes tone ,quartzite phyllite,banded iron formation; Dharwar supergroup; PREC (1200 Ma)
Metasediments; Sausar group; PREC
t~ica schists and phyllites; Gangpur group; PREC
MEXICO
Manganiferous I i mes tone; Tallldn formation; LJUR
MOROCCO
Do 1 os tone; LCRET
SOUTH AFRICA
22° 57'E Syngenetic (marine Banded iron formation; Voelwater forma-chemical sediment) tion; PREC (2300-2070 Ma)
23° 03'E Epigenetic (secondary Shale and slump ~~ateri·al; PREC enrich1rent); replace- (2300-2070 Ma) ment bodies
27° 01 'E Epigenetic (secondary Dolostone; Mal mani supergroup; PREC enrichment); residual (2100-2224 Ma) weathering and con-cent rat ion
____ --·--·-------__________________________ --------------~'t!_ELJINION _______ _
Bolshe Tokmak deposits 47" 15'N 35° 42'E
Nikopnl deposits 47° 34 'N 34° 25'E
T chi ~tura deposits 42° 19'N 43° 18'E
Marine chemica 1 sediment
-do-
-do-
Fine clastic rocks; OLIGO
-do-
-do-
---------------------------·-----------------u!»PERVOiTA _______ _
Tam han deposit 14" 47 'N 00° 04'E Secondary enri ch1rent Amph i bo 1 ites; Gouba formation; PROT
l.l Includes some or all of the following items (separated by semicolons): main host rock type, fonnation name, and host rock age. See footnote 2 for age abbreviations.
'{! Age abbreviations and prefixes:
HOLOCENE HOLO PROTEROZOIC PROT OLIGOCENE OLIGO ARCHEAN ARCH CRETACEOUS CRU EARLY E JURASSIC JUR Ml DOLE M PERMIAN f'ERM LATE L PRECAMBRIAN PREC
16
records for manganese deposits and districts-Continued
PREC Stable craton
-do- -do-
-do- -do-
-do- -do-
-do- -do-
MEXICO-tinued
LJUR Stab 1 e craton
MOROCCO--conti.!'ued
LCRET Stable craton
SOUTH AFRICA -continued
PREC ( 2300-2070 Ma)
Kalahari sedimentary basin
Dolomite and amygdaloidal andes it i c 1 ava
PRLS,PLML,WAD
PRLS, PLML; WAD, BRUN
PRLS ,CPML ,MNGN, BRUN
BRUN ,PLML ,CPML, HLDT, PRLS ,JCBS, BXBT ,HSMN ,MNGN, VRBG
RDCR ,CLCT, KTNH
PRLS ,CPML, LHPT
BRUN ,HSMN ,CPML, JCBS ,BXBT, TDRK
Colllllents Reference
Lateritic ore deposits Roy (19!!0)
Mn oxides conformably within Do. sedimentary sequence
Oxide bodies interbanded Sawyer (19BO) and co-f{) 1 ded with chert
Mn oxides in belt 200 km Roy (1980) by 25 km
Mn oxides interstratified Do. with gondite
Mn content decreases from base of 1 i mes tone
2 or 3 ore beds
Basin measures 41 km by 5 km
Tavera and Alexandri (1972)
'~I NMAB ( 1981 )
Taljaardt (1979)
-do- Gamagara Dolomite BXBT ,BRUN,HSMN Replacement bodies in shale and in slump material in karst pockets
Do. shale rests unconformably on Ghaap Plateau dolomite
which contains JCBS 0.5-3% Mn
HOLO Fault zones ChPrty which pro vi d- do 1 os tone ed drainage and weathering facilities.
SOVIET UNION-continued
OLIGO Stab 1 e craton
-do- -do-
-do- -do-
UPPER VOLTA-continued
PROT
'}_! Abbreviations for mineral names (after Longe and
BIRNESSITE BRNS GLAUCONITE GLCN BIXBYITE BXBT GOETHITE GTHT BOEHMITE BOHM GROUTITE GRTT BRAUNITE BRUN HAUSMANN ITE HSMN CALCITE CLCT HEMATITE HMTT CLAY CLAY HOLLANDITE HLDT CRYPTOMELANE CPML HYDRARGILLITE HDGL DOL(}!! TE DLMT ILLITE ILLT GARNET GRNT JACOBSITE JCBS GIBBSITE GBST KAOLINITE KLNT
!I National Materials Ad vi so ry Board
PRLS ,PLML Deposits seldom comprise more than a few million lll:'tric tons each
PRLS ,MNGN ,PLML, About 92% carbonate ores Fe oxides, Poly- and 8% oxide ores per-MNGN; CLCT, RDCR, Mn-CLCT
-do- Both carbonate and oxide
PI{LS,MNGN,PLML
HSMN ,CPML ,MNGN, PRLS, NSTT, TPRT; RDCR, KTNH, HydroHSMN
others, 1978, p.
KUTNAHOI{I TE LIMONITE LITHIOPHORITE MANGANITE MICA NSUTITE PSILOMELANE PYRITE PYROLUSITE QUARTZ
17
ores
Largest known Mn deposit in Upper Volta
63-68):
KTNH RHODOCHROSI Tf ROCR LMON RHODONITE RDNT LHPT SER !CITE SRCT MNGN SPESSARTITE SPSR MICA TEPHROITE TPRT NSTT TOOOROKITE TDRK PLML VREDENBURGITE VRBG PYRT WAD WAD PRLS QRTZ
Shnyukov and Orl ovsky ( 1980)
Gryaznov and Danil ov ( 1Y!l0)
Avaliani and
NMAB ( 1981)
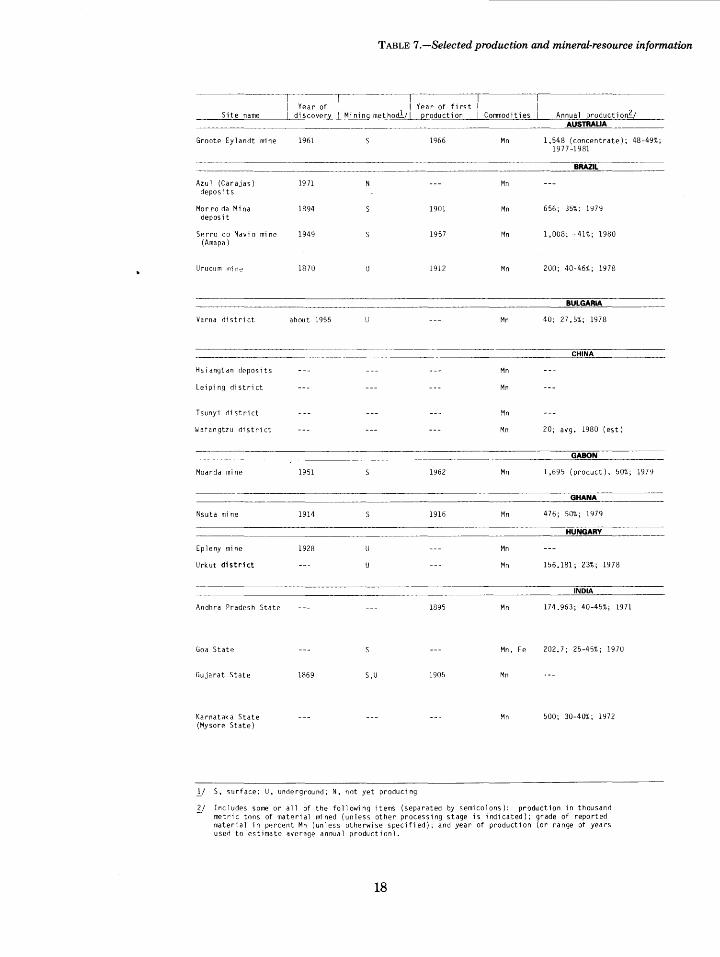
TABLE 1.-Selected production and mineral-resource infonnation
~ Year of Year of first I
Site name discover,)' Mining met hod!./ I (!roduct ion Commodities Annua 1 eroduct i onSt AUSTRAUA
Groote Eylandt mine 1961 1966 Mn 1,548 (concentrate); 1977-1981
BRAZIL
Azu 1 (Carajas) 1971 Mn deposits
Morroda Mina 1894 1901 Mn 656; 3~%; 1979 deposit
Se rro do Navi o mine 1949 1957 t~n 1,008; - 41%; 1980 (Amapa)
Urucum mi n.c 1870 1912 Mn 200; 40-46%; 1978
BULGARIA
Varna district about 1956 Mn 40; 27. 5%; 1978
CHINA
Hs i angtan deposits Mn
Leiping district Mn
Tsunyi district Mn
Wafangtzu district Mn 20; avg. 1980 (est)
GABON
Moanda mine 1951 1%2 Mn 1,695 (product), 50%;
GHANA
Nsuta mine 1914 1916 Mn 476; 50%; 1979
HUNGARY
Epleny mine 1928 Mn
Urkut district Mn 156.181; 23%; 1978
INDIA
Andhra Pradesh State 1895 Mn 174.963; 40-45%; 1971
Goa State Mn, Fe 202.7; 25-45%; 1970
Gujarat State 1869 s ,0 1905 Mn
Karnataka State Mn 500; 30-40%; 1972 (My sore State)
_!/ S, surface; U, underground; N, not yet producing
'{! Includes some or all of the following items (separated by semicolons): production in thousanrl metric tons of material mined (unless other processing stage is indicated); grade of reported material in percent Mn (unless otherwise specified); and year of production (or range of years userl to estimate average annual production).
18
48-49%;
197':!
from ISM! records for mcmganese deposits and districts
Cumulative productiord; Resources!; AUSTRAUA-continued
18,876 (concentrate); 48-49%; 1966-1981
326,000; R1E; 35.0%; 1982 110,000; R2E; 35%; 1982
BRAZIL-continued
6,000; 1902-1956
20,750 (washed ore); 48. 5%; 195 7-1979
900; 46%; 1957-1973
65,000; R1E; 38%; 1979
1,500; R1E; 43%; 1981 3,000; R2E; 27%; 1979
12,800; R1E; 40-45%; 1979 3,200; R2E; 40-45%; 1979 5,000; R1S; 1979
17,000; R1E; 46%; 1979 27,000; R2E; 46%; 1979 15,000; R2S; 47%; 1979
BULGARIA-continued
60,000; 25%; 1961-1980 1,145; R1E; 23.1%; 1980 26,091; R1S; 17.3%; 1961 1,161; R2E; 20.6%; 1980
CHINA-continued
>10,000; R1E; 40-50%; 1973
>10,000; R1E; <30%; 1973
>10,000; RlE; -20%?; 1973
4,000; R1E; 16-18%; 1964
GABON-continued
25,000; 1962-1978 78,000; R1E; 44%; 1980 142,000; R2E; 44%; 1980
GHANA-continued
24,000; -50%; 1916-1976 20,000; R1E; 30%; 1980
215,000; R1E; 20.5%; 1980
INDIA-mlnued
>2 ,000; - 40-45%; 1892-1953
1,452; 25-45%; 1955-1965
10; R1E; 38-46%; 1971 140; R1E; <38%; 1971 290; R2E; 38-46%; 1971 1,260; R2E; <38%; 1971
850; R1E; 25-49%; 1980 7,700; R2S; 25-49%; 1980
2,010; R2E; >46%; 1971 540; R2E; 38-46%; 1971 350; R2E; overlapping grades; 1971
230; R1E; 38-46%; 1971 60; R1E, <38%; 1971 980; R2E; >46%; 1971 1,540; R2E; 38-46%; 1971 1,020; R2E; <38%; 1971 11,420; R2E; overlapping
grades; 1971
Comments
Expansion to 3 million metric tons capacity by 1986 has been deferred
Detrital, pelitical, and grained ores 44% Mn
An nua 1 production is for State of Minas Gerais
Not thoroughly explored; marginally commercial
Annual production for all of Bulgaria; pisolites contain 30-70% of the ore
Little pub 1 i shed data
Chinese production: 1.1 million metric tons >30% Mn, 1973
Ferruginous Mn ore with Co and Ni
Ferruginous Mn ore, 16-18% Fe
Highest metallurgical grade product in world
Metallurgical and battery grade ore
Oxide ore 24.4% Mn; carbonate ore 14% Mn
Annual production combines oxide and carbonate ore; resources for all of Hungary
195 pocket rni nes operating in 1970
Very limited mining since 1964; high phosphorous content
]j Includes some or all of the follcwing items (separated by semicolons): production in thousand metric tons of material mined (unless other processing stage is indicated); grade of reported material in percent Mn (unless otherwise specified); and years for reported cumulative production.
il Includes, for various resource categories, some or all of the following items (separated by semicolons): resource in thousand metric tons; U.N. resource classification (Schanz, 1980); grade in percent Mn; and year of estimate.
19
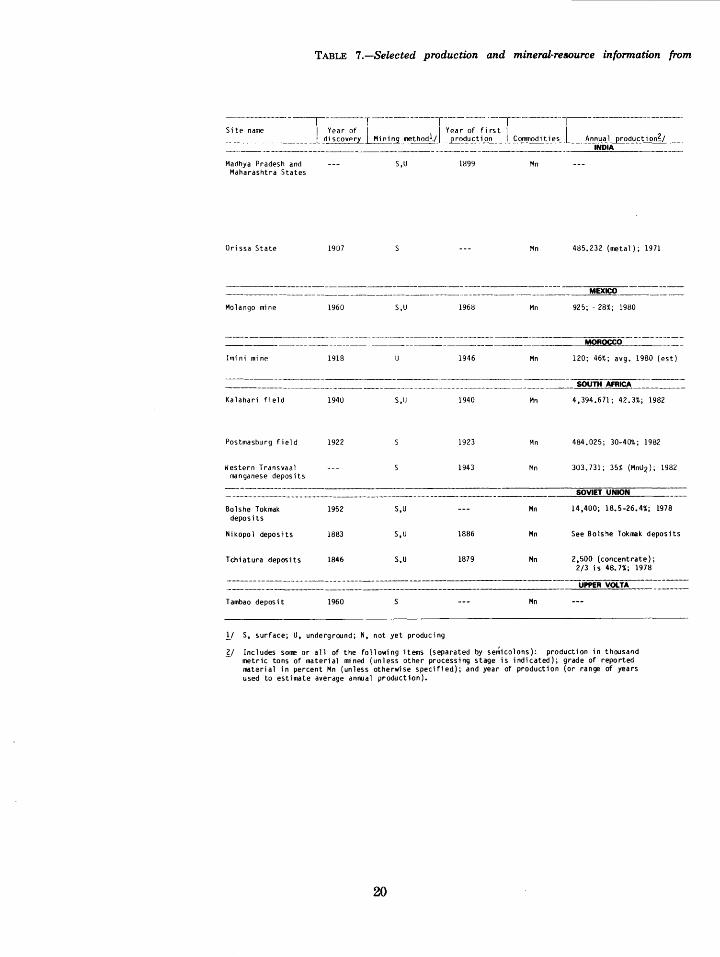
TABLE 7.-Selected production and mineral-resource information from
------------r-----T-----------r------------,---------r---------------Sitp name I Year of I , I Year of first L / ------------ discovPry Mining me~ production Co::::mc::.:m:::o=-dl:_:.t=-:i-=.e.::..s-''------"Ac.:cnc:_:n;:.,ua""l'-"p.:...cro::.::d::o:uc:::c_::_t.:..:io:..:.n!:..l:=2"--------- --------------------------------------------- . __ _,I::..:N:.:Dc=.IA::__ __ _
Madhya Pradesh and Maharashtra States
Orissa State
Molango mine
lrni ni mi nP
Kalahari field
Postmasburg field
Western Transvaal manganese deposits
Bo lshe Tokmak deposits
Ni kopo l deposits
Tchiatura deposits
T ambao deposit
s,u
1907
1960 s,u
1918
1940 s,u
1922
1g52 s,u
1883 s,u
1846 s.u
1960
!/ s. surface; U, underground; N, not yet producing
Hl99 Mn
Mn
1%8 Mn
1946 Mn
1940 Mn
1923 f~n
1943 Mn
Mn
1886 Mn
1879 Mn
Mn
485.232 (metal); 1971
MEXICO
925; - 28%; 1980
MORoccO------------
120; 46%; avg. 1980 (est)
SOUTH AFRICA
4,394,671; 42,3%; 1982
484.025; 30-40%; 1982
303.731; 35% (Mn02); 1982
SOVIET UNION
14,400; 18.5-26.4%; 1978
See Bols'le Tokmak deposits
2,500 (concentrate); 2/3 is 48. 7%; 1978
UPPER VOLTA
~/ Includes some or all of the following items (separated by semicolons): production in thousand metric tons of material mined (unless other processing stage is indicated); grade of reported material in percent Mn (unless otherwise specified); and year of production (or range of years used to estimate average annual product ion).
20
ISM! records for manganese deposits and districts-Continued
----------r-------------~------------------
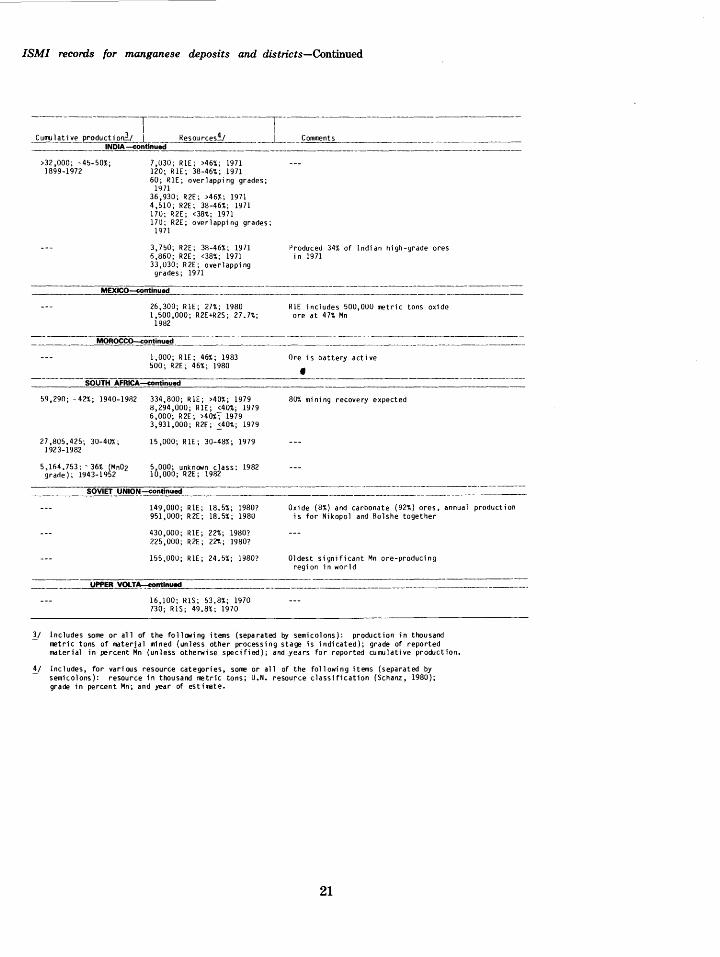
Cumulatlve product1ord/ __L_ Resources4/ _j__ Comments ---------------~DIA-continue_d _________________________________________ _
>32 ,000; -45-50%; 1899-1972
7 ,030; R1E; >46%; 1971 120; R1E; 38-46%; 1971 60; R1E; overlapping grades;
1971 36,930; R2E; >46%; 1971 4,510; R2E; 38-46%; 1971 170; R2E; <38%; 1971 170; R2E; overlapping grades;
1971
3,750; R2E; 38-46%; 1971 6,860; R2E; <38%; 1971 33,030; R2E; overlapping
grades; 1g71
MEXICO-continued
26,300; R1E; 27%; 1980 1,500,000; R2E+R2S; 27.7%;
1982
MOROCCO-continued
1,000; R1E; 46%; 1983 500; R2E; 46%; 1980
SOUTH AFRICA-continued
59,290; -42%; 1940-191l2 334,800; R1E; >40%; 1979 8,294,000; RlE; <40%; 1979 6,000; R2E; >40%T 1979 3,931,000; R2E; 2_401.; 1979
27 ,805. 425; 30-40%; 1923-1982
5,164.753;- 36% (Mn02 grarle); 1943-1952
15,000; R1E; 30-48%; 1979
5,000; unknown class: 1982 10,000; R2E; 191l2
SOVIET UNION-continued
149,000; R1E; 18.5%; 1980? 951,000; R2E; 18.5%; 1980
430,000; R1E; 22%; 1980? 225,000; R2E; 22%; 1980?
155,000; R1E; 24.5%; 1980?
----~~ VOLT~nti,,·n,_,ued='----
16,100; R1S; 53.8%; 1970 730; R1S; 49.8%; 1970
Produced 34% of Indian high-grade ores in 1971
R1E includes 500,000 metric tons oxide ore at 47% Mn
Ore is battery active
• 80% mining recovery expected
Oxide (8%) and carbonate (92%) ores, annual production is for Nikopol and Bolshe together
01 dest s i ynificant Mn ore-producing region in world
!../ Includes some or all of the following items (separated by semicolons): production in thousand metric tons of material mined (unless other processing stage is indicated); grade of reported material in percent Mn (unless otherwise specified); and years for reported cumulative production.
il Includes, for various resource categories, some or all of the following items (separated by semicolons): resource in thousand metric tons; U.N. resource classification (Schanz, 1980); grade in percent Mn; and year of estimate.
21
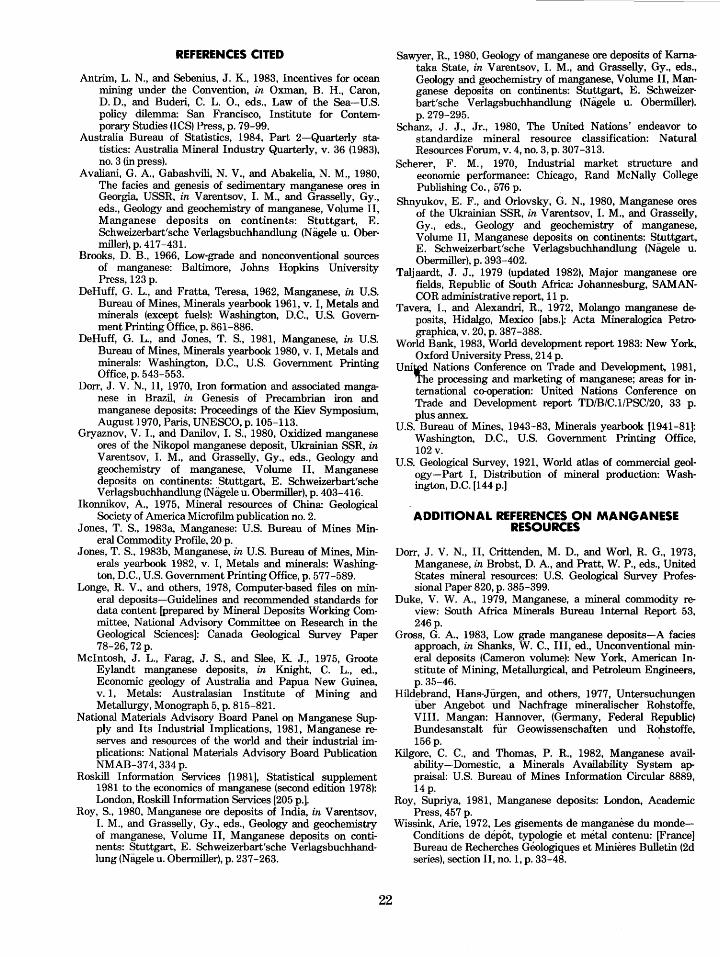
REFERENCES CITED
Antrim, L. N., and Sebenius, J. K., 1983, Incentives for ocean mining under the Convention, in Oxman, B. H., Caron, D. D., and Buderi, C. L. 0., eds., Law of the Sea-U.S. policy dilemma: San Francisco, Institute for Contemporary Studies (ICS) Press, p. 79-99.
Australia Bureau of Statistics, 1984, Part 2-Quarterly statistics: Australia Mineral Industry Quarterly, v. 36 (1983), no. 3 (in press).
Avaliani, G. A., Gabashvili, N. V., and Abakelia, N. M., 1980, The facies and genesis of sedimentary manganese ores in Georgia, USSR, in V arentsov, I. M., and Grasselly, Gy., eds., Geology and geochemistry of manganese, Volume II, Manganese deposits on continents: Stuttgart, E. Schweizerbart'sche Verlagsbuchhandlung (Nagele u. Obermiller), p. 417-431.
Brooks, D. B., 1966, Low-grade and nonconventional sources of manganese: Baltimore, Johns Hopkins University Press, 123 p.
DeHuff, G. L., and Fratta, Teresa, 1962, Manganese, in U.S. Bureau of Mines, Minerals yearbook 1961, v. I, Metals and minerals (except fuels): Washington, D.C., U.S. Government Printing Office, p. 861-886.
DeHuff, G. L., and Jones, T. S., 1981, Manganese, in U.S. Bureau of Mines, Minerals yearbook 1980, v. I, Metals and minerals: Washington, D.C., U.S. Government Printing Office, p. 543-553.
Dorr, J. V. N., II, 1970, Iron formation and associated manganese in Brazil, in Genesis of Precambrian iron and manganese deposits: Proceedings of the Kiev Symposium, August 1970, Paris, UNESCO, p.105-113.
Gryaznov, V. I., and Danilov, I. S., 1980, Oxidized manganese ores of the Nikopol manganese deposit, Ukrainian SSR, in V arentsov, I. M., and Grasselly, Gy., eds., Geology and geochemistry of manganese, Volume II, Manganese deposits on continents: Stuttgart, E. Schweizerbart'sche Verlagsbuchhandlung (Nagele u. Obermiller), p. 403-416.
Ikonnikov, A., 1975, Mineral resources of China: Geological Society of America Microfilm publication no. 2.
Jones, T. S., 1983a, Manganese: U.S. Bureau of Mines Mineral Commodity Profile, 20 p.
Jones, T. S., 1983b, Manganese, in U.S. Bureau of Mines, Minerals yearbook 1982, v. I, Metals and minerals: Washington, D.C., U.S. Government Printing Office, p. 577-589.
Longe, R. V., and others, 1978, Computer-based files on mineral deposits-Guidelines and recommended standards for data content [prepared by Mineral Deposits Working Committee, National Advisory Committee on Research in the Geological Sciences]: Canada Geological Survey Paper 78-26,72 p.
Mcintosh, J. L., Farag, J. S., and Slee, K. J., 1975, Groote Eylandt manganese deposits, in Knight, C. L., ed., Economic geology of Australia and Papua New Guinea, v. 1, Metals: Australasian Institute oi Mining and Metallurgy, Monograph 5, p. 815-821.
National Materials Advisory Board Panel on Manganese Supply and Its Industrial Implications, 1981, Manganese reserves and resources of the world and their industrial implications: National Materials Advisory Board Publication NMAB-37 4, 334 p.
Roskill Information Services [1981], Statistical supplement 1981 to the economics of manganese (second edition 1978): London, Roskill Information Services [205 p.].
Roy, S., 1980, Manganese ore deposits of India, in Varentsov, I. M., and Grasselly, Gy., eds., Geology and geochemistry of manganese, Volume II, Manganese deposits on continents: Stuttgart, E. Schweizerbart'sche Verlagsbuchhandlung (Nagele u. Obermiller), p. 237-263.
22
Sawyer, R., 1980, Geology of manganese ore deposits of Kamataka State, in V arentsov, I. M., and Grasselly, Gy., eds., Geology and geochemistry of manganese, Volume II, Manganese deposits on continents: Stuttgart, E. Schweizerbart'sche Verlagsbuchhandlung (Nagele u. Obermiller). p. 279-295.
Schanz, J. J., Jr., 1980, The United Nations' endeavor to standardize mineral resource classification: Natural Resources Forum, v. 4, no. 3, p. 307-313.
Scherer, F. M., 1970, Industrial market structure and economic performance: Chicago, Rand McNally College Publishing Co., 576 p.
Shnyukov, E. F., and Orlovsky, G. N., 1980, Manganese ores of the Ukrainian SSR, in Varentsov, I. M., and Grasselly, Gy., eds., Geology and geochemistry of manganese, Volume II, Manganese deposits on continents: Stuttgart, E. Schweizerbart'sche Verlagsbuchhandlung (Nagele u. Obermiller), p. 393-402.
Taljaardt, J. J., 1979 (updated 1982), Major manganese ore fields, Republic of South Africa: Johannesburg, SAMANCO R administrative report, 11 p.
Tavera, I., and Alexandri, R., 1972, Molango manganese deposits, Hidalgo, Mexico [abs.]: Acta Mineralogica Petrographica, v. 20, p. 387-388.
World Bank, 1983, World development report 1983: New York, Oxford University Press, 214 p.
Uni~d Nations Conference on Trade and Development, 1981, 'the processing and marketing of manganese; areas for international co-operation: United Nations Conference on Trade and Development report TD/B/C.1/PSC/20, 33 p. plus annex.
U.S. Bureau of Mines, 1943-83, Minerals yearbook [1941-81]: Washington, D.C., U.S. Government Printing Office, 102v.
U.S. Geological Survey, 1921, World atlas of commercial geology-Part I, Distribution of mineral production: Washington, D.C. [144 p.]
ADDITIONAL REFERENCES ON MANGANESE RESOURCES
Dorr, J. V. N., II, Crittenden, M. D., and Worl, R. G., 1973, Manganese, in Brobst, D. A., and Pratt, W. P., eds., United States mineral resources: U.S. Geological Survey Professional Paper 820, p. 385-399.
Duke, V. W. A., 1979, Manganese, a mineral commodity review: South Africa Minerals Bureau Internal Report 53, 246p.
Gross, G. A., 1983, Low grade manganese deposits-A facies approach, in Shanks, W. C., III, ed., Unconventional mineral deposits (Cameron volume): New York, American Institute of Mining, Metallurgical, and Petroleum Engineers, p. 35-46.
Hildebrand, Hans-J\irgen, and others, 1977, Untersuchungen uber Angebot und N achfrage mineralischer Rohstoffe, VIII. Mangan: Hannover, (Germany, Federal Republic) Bundesanstalt fur Geowissenschaften und Rohstoffe, 156p.
Kilgore, C. C., and Thomas, P. R., 1982, Manganese availability-Domestic, a Minerals Availability System appraisal: U.S. Bureau of Mines Information Circular 8889, 14p.
Roy, Supriya, 1981, Manganese deposits: London, Academic Press, 457 p.
Wissink, Arie, 1972, Les gisements de manganese du mondeConditions de depot, typologie et metal contenu: [France] Bureau de Recherches Goologiques et Minieres Bulletin (2d series), section II, no. 1, p. 33-48.
INTERNATIONAL STRATEGIC MINERALS INVENTORY SUMMARY REPORTS
This circular is one of several reports on selected mineral commodities to be published in the U.S. Geological Survey 930 series. The circulars published to date are listed below; year of publication is shown in parentheses. Copies are available free on application to Distribution Branch, Text Products Section, U.S. Geological Survey, 604 South Pickett Street, Alexan-dria, VA 22304 U.S.A. .
930-A. Manganese (1984) 930-8. Chr:omium (1984)
,. . ~ , .....
. '
+ ... ,.
...
,.
~M -~·~· .. ·l·.·
. ~·~~ .. ~ . ~
"'"··~ .: :~t,.~r? ~~· ~~.· ·'
¥ "·· ~
"'
~~~{.·. ·;:·· .... ,: .;~\ .L
"' .:
,J' :,)
''l .. . ,.~
!A·