Embed Size (px)
DESCRIPTION
International Tourism Japan and North-East Asia. Hideki FURUYA TOYO University, Department of Tourism. International Airport KANSAI airport (Osaka Pref.). International Airport KANSAI airport (Osaka Pref.). Domestic Airport(OSAKA). Subway(underground) In Toky Metropolitan Area. - PowerPoint PPT Presentation
Citation preview
1
International Tourism International Tourism Japan and North-East AsiaJapan and North-East Asia
Hideki FURUYA TOYO University, Department of Tourism
2
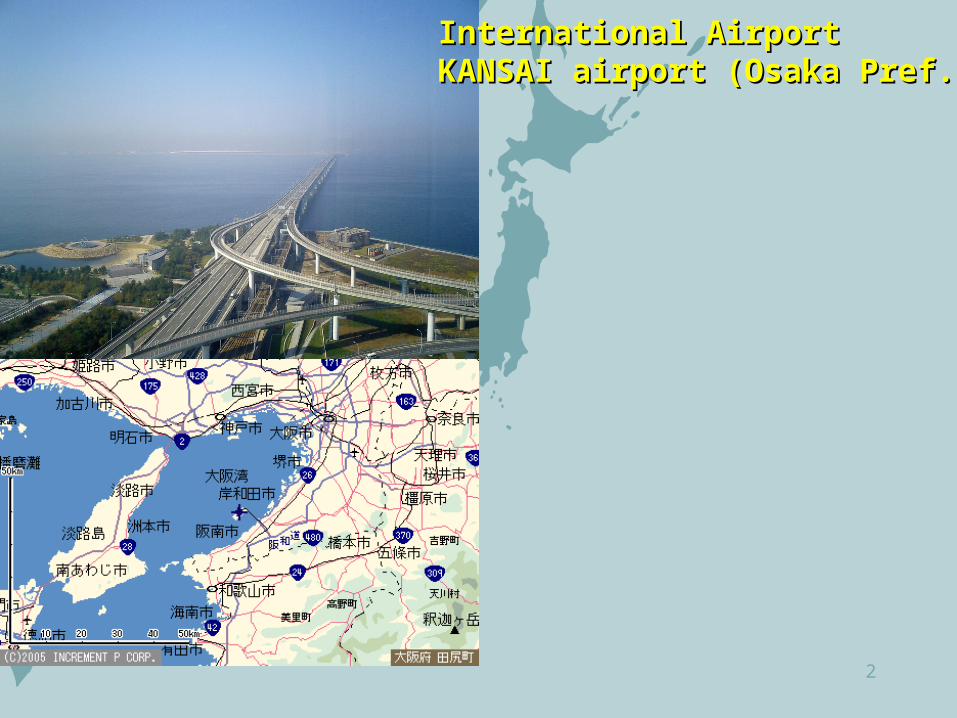
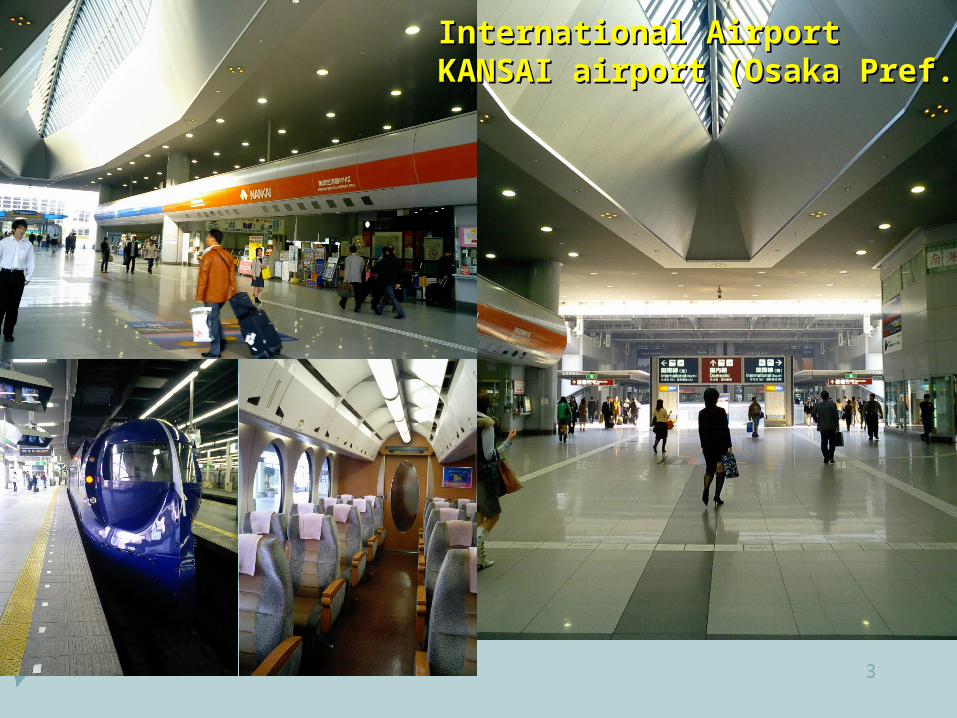
International AirportInternational AirportKANSAI airport (Osaka Pref.)KANSAI airport (Osaka Pref.)
3
International AirportInternational AirportKANSAI airport (Osaka Pref.)KANSAI airport (Osaka Pref.)
4
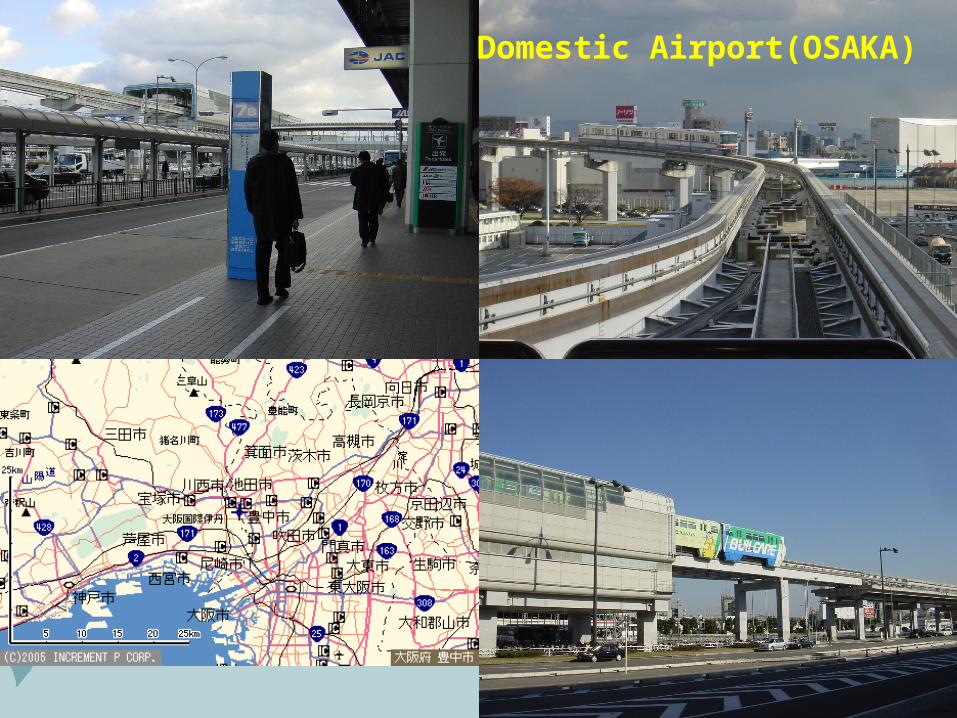
Domestic Airport(OSAKA)

5
Subway(underground) In Toky Metropolitan Area
6
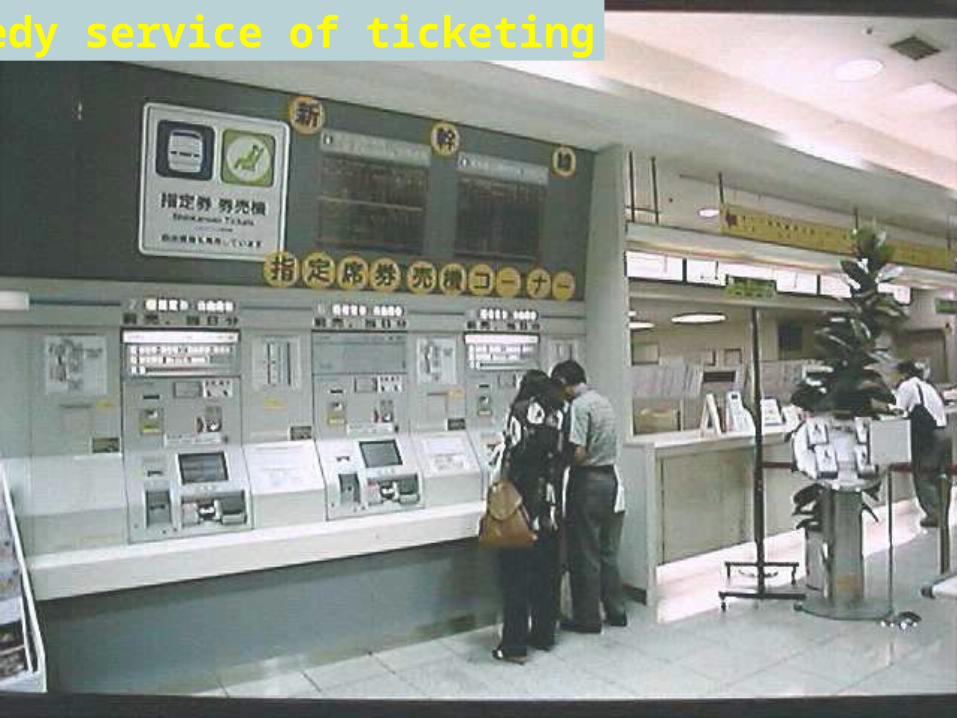
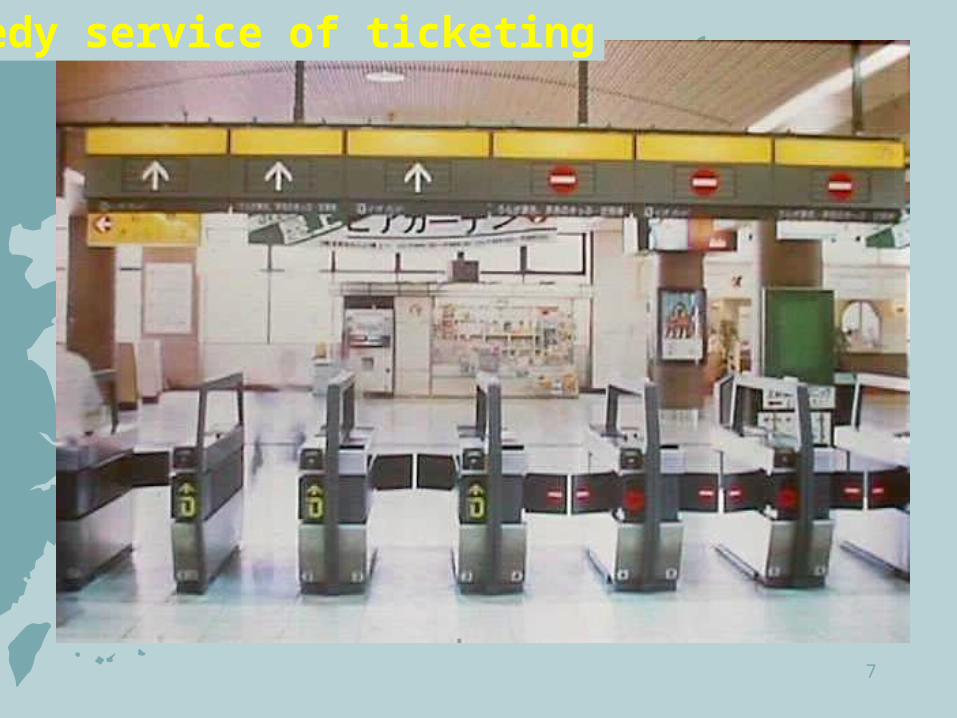
緑の窓口緑の窓口Speedy service of ticketing
7
Speedy service of ticketing
8
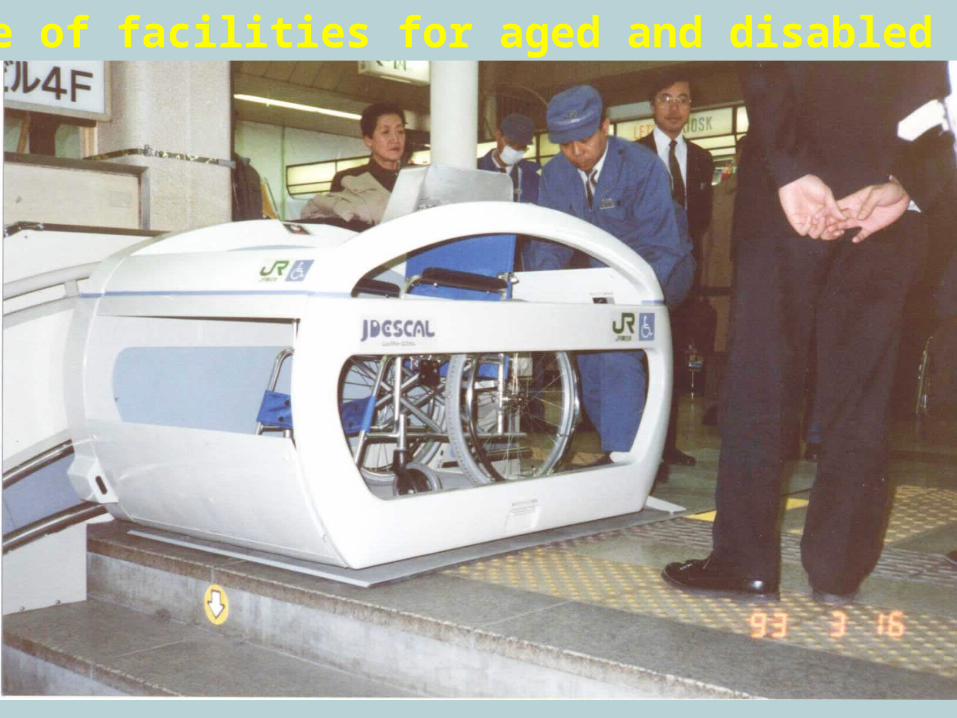
障害者障害者Shortage of facilities for aged and disabled people
9
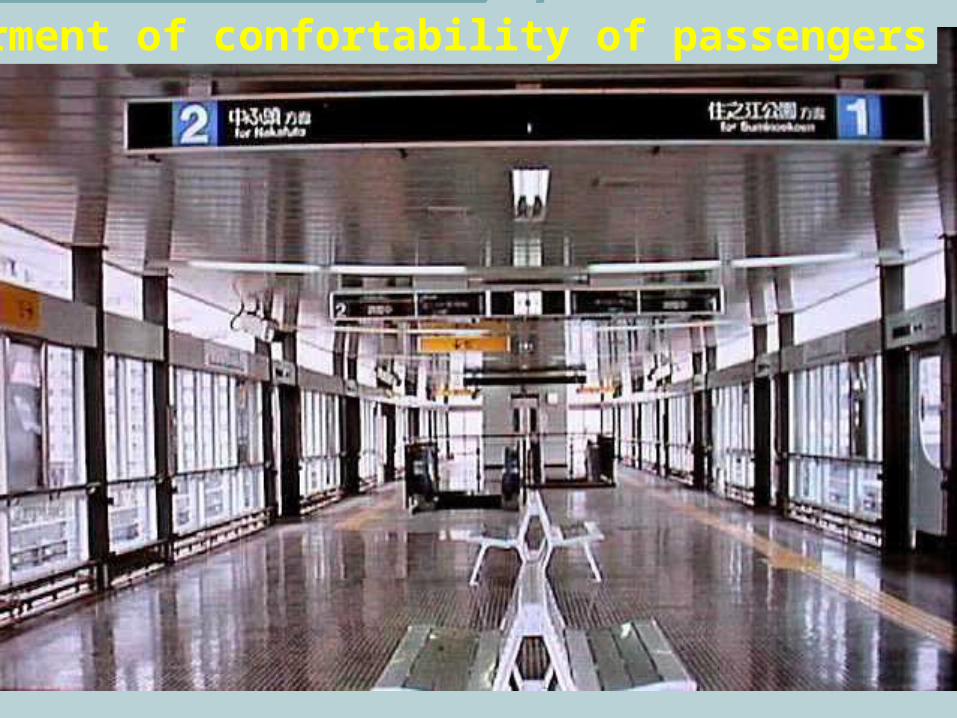
新交通2新交通2Betterment of confortability of passengers
10
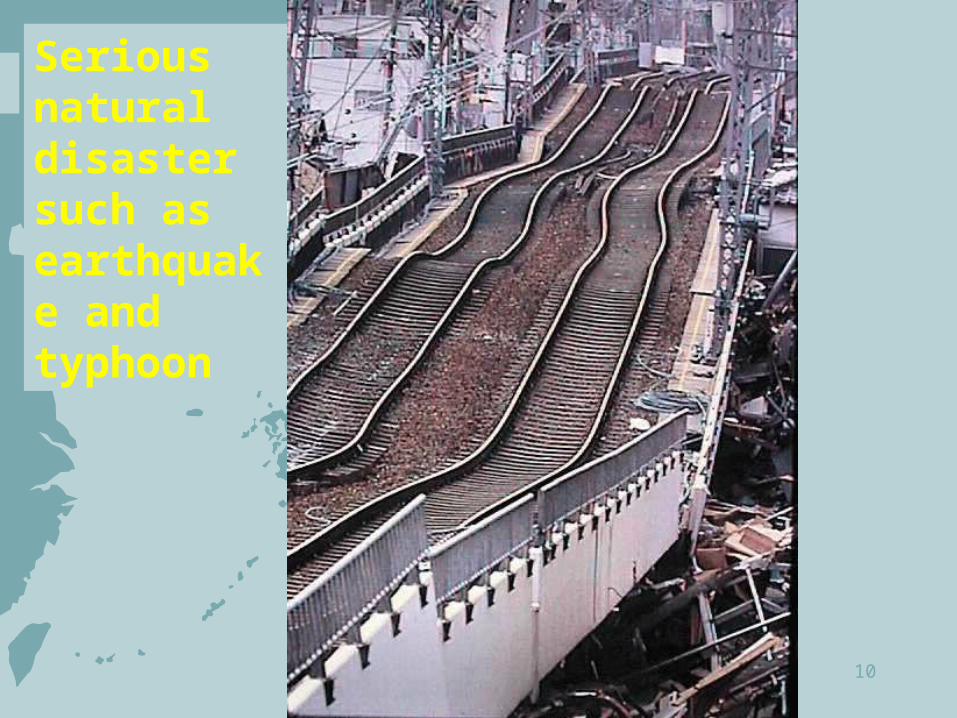
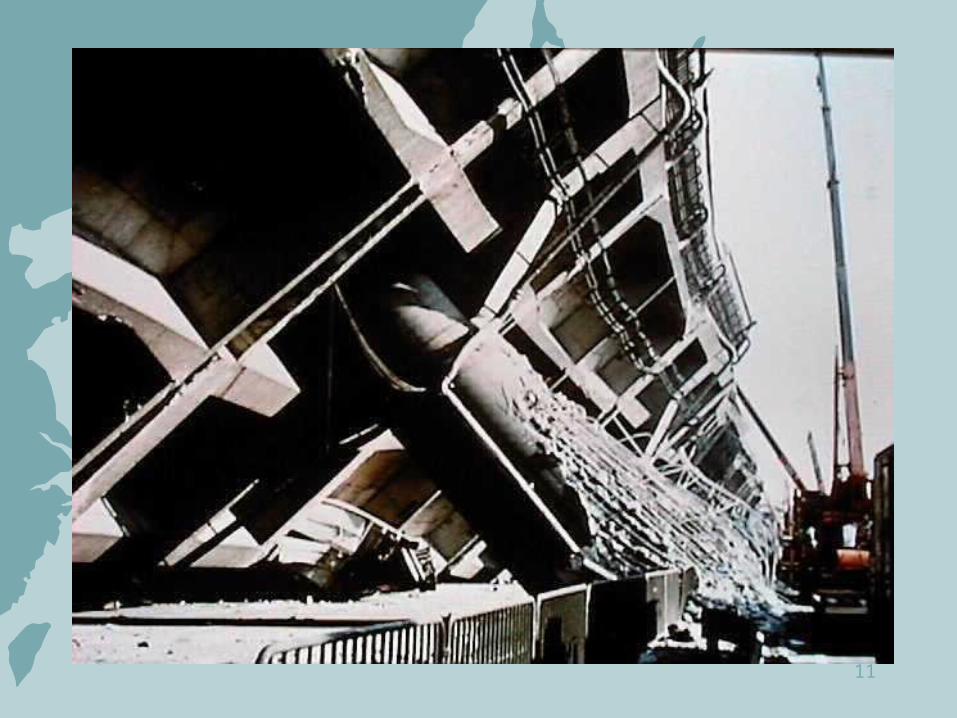
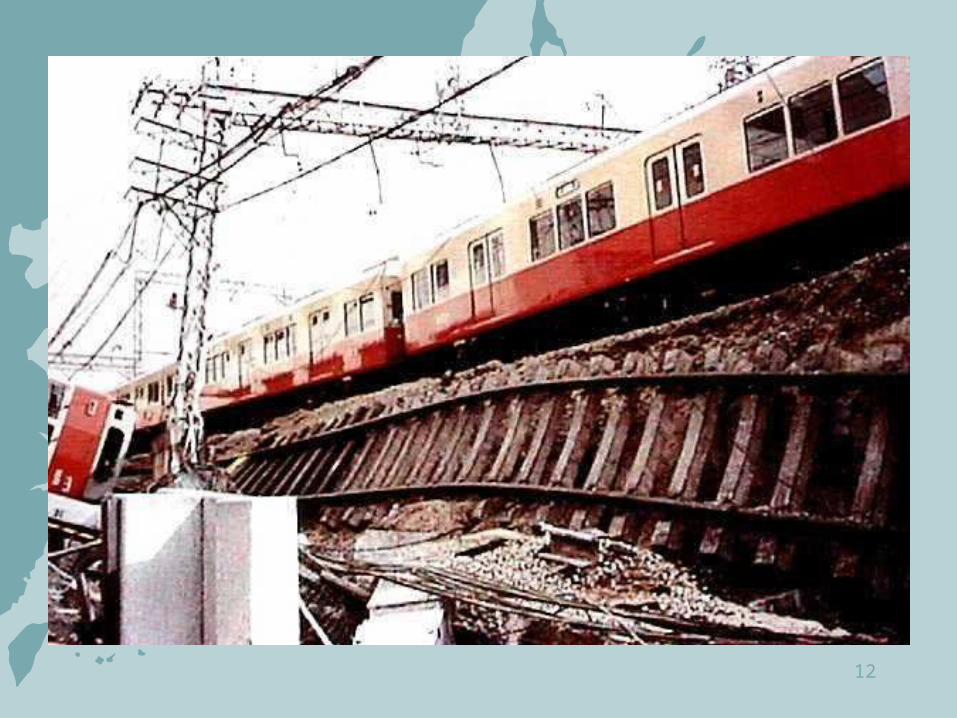
神戸地震神戸地震Serious natural disaster such as earthquake and typhoon
11
12
13
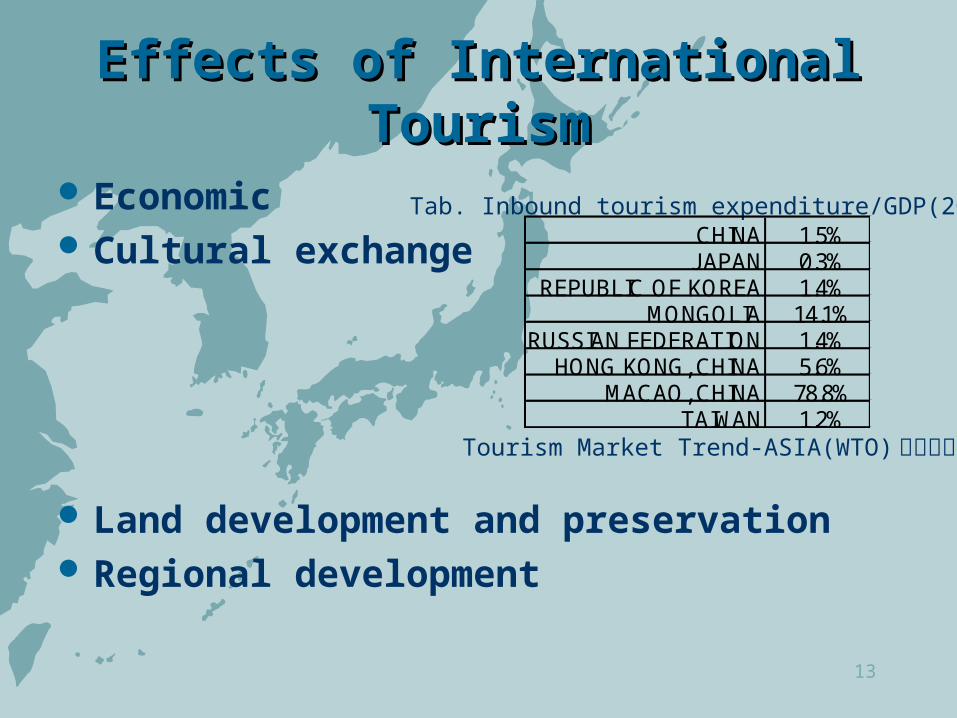
Effects of International TourismEffects of International Tourism
Economic Cultural exchange
Land development and preservation Regional development
Tab. Inbound tourism expenditure/GDP(2002)
Tourism Market Trend-ASIA(WTO)より引用
CHINA 1.5%J APAN 0.3%
REPUBLIC OF KOREA 1.4%MONGOLIA 14.1%
RUSSIAN FEDERATION 1.4%HONG KONG, CHINA 5.6%
MACAO, CHINA 78.8%TAIWAN 1.2%
14
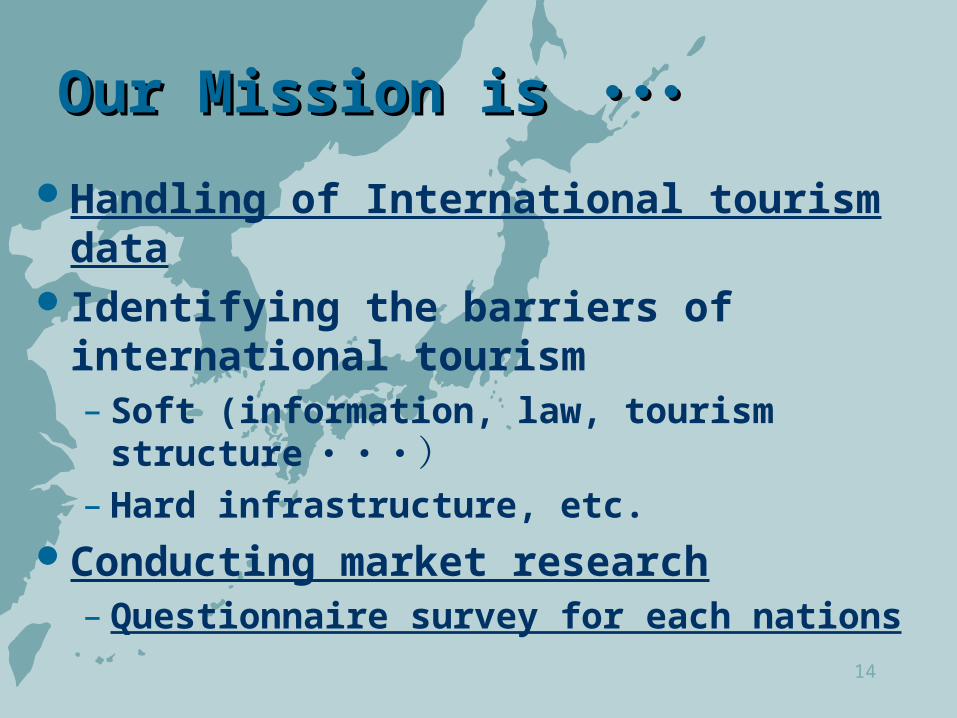
Our Mission is Our Mission is ・・・・・・Handling of International tourism dataIdentifying the barriers of international
tourism– Soft (information, law, tourism structure・・・)
– Hard infrastructure, etc. Conducting market research
– Questionnaire survey for each nations
15
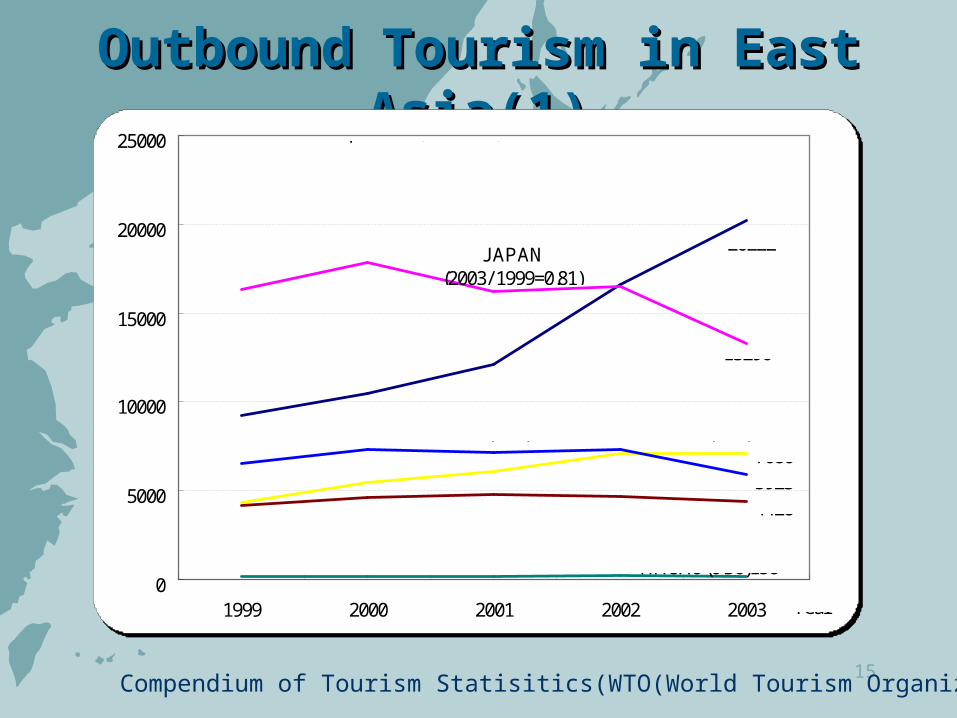
OutboundOutbound Tourism in East Asia(1)Tourism in East Asia(1)
Compendium of Tourism Statisitics(WTO(World Tourism Organization))
0
5000
10000
15000
20000
25000
1999 2000 2001 2002 2003
J APAN(2003/ 1999=0.81)
CHINA(2.19)
TAIWAN(0.90) KOREA(1.63)
HONG KONG(1.06)
Year
International Departures(thousand)
20222
13296
708659234428
MACAO(0.90)156
16
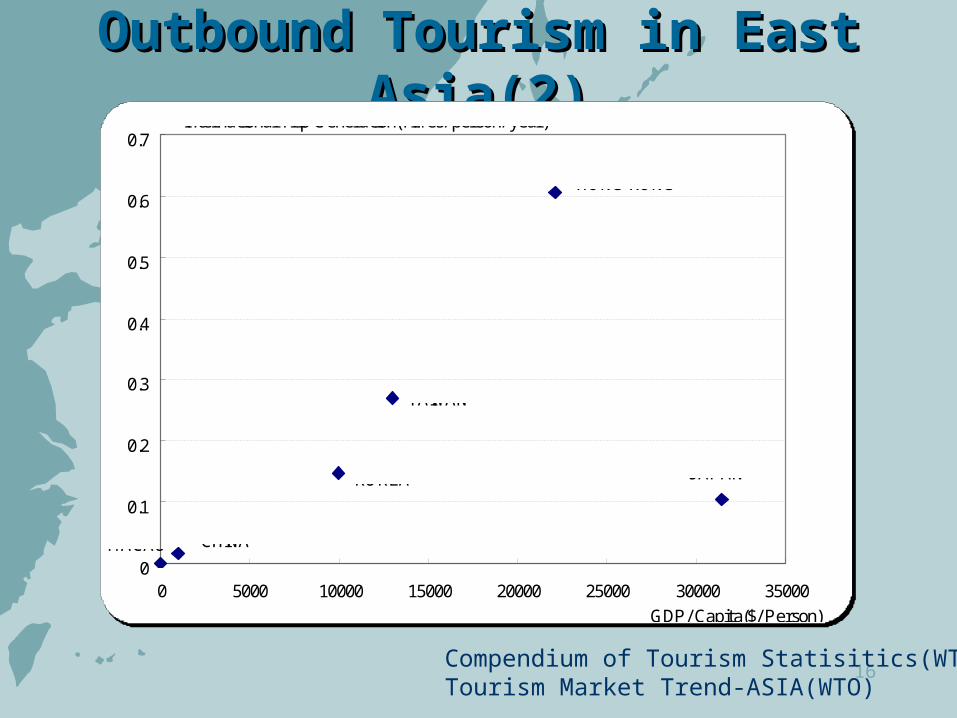
OutboundOutbound Tourism in East Asia(2)Tourism in East Asia(2)
Compendium of Tourism Statisitics(WTO)Tourism Market Trend-ASIA(WTO)
0
0.1
0.2
0.3
0.4
0.5
0.6
0.7
0 5000 10000 15000 20000 25000 30000 35000GDP/ Capita($/ Person)
International Trip Generation(Times/ person/ year)
J APAN
HONG KONG
KOREA
MACAU CHINA
TAIWAN
17
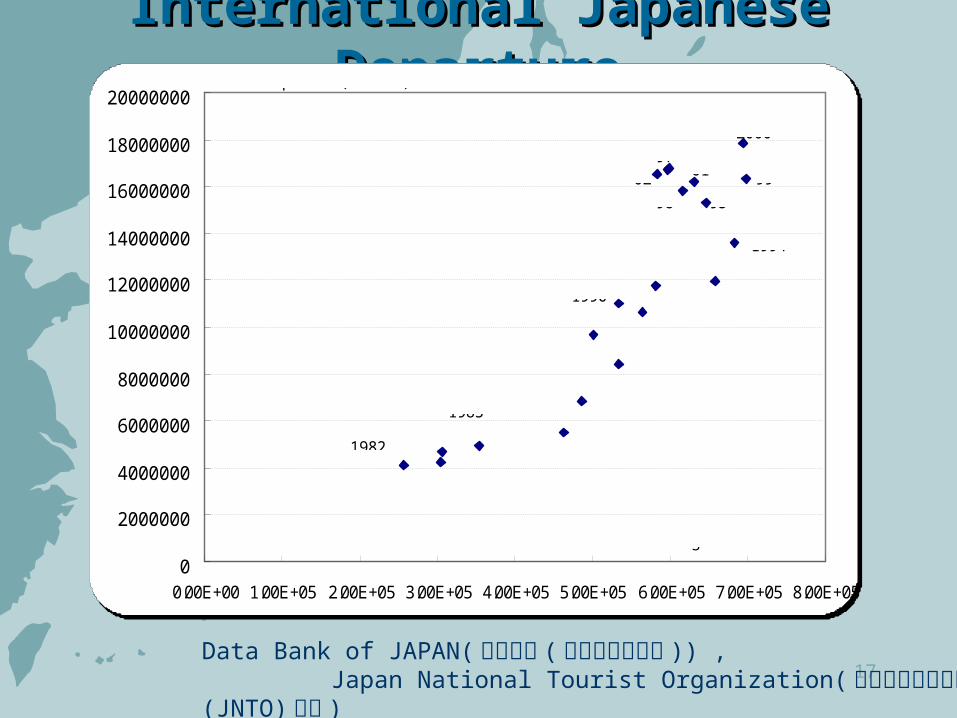
International Japanese DepartureInternational Japanese Departure
0
2000000
4000000
6000000
8000000
10000000
12000000
14000000
16000000
18000000
20000000
0.00E+00 1.00E+05 2.00E+05 3.00E+05 4.00E+05 5.00E+05 6.00E+05 7.00E+05 8.00E+05
1982
1985
1990
No of Departures(Persons)
GDP*actual exchange rate index
1994
959899
2000
010297
Data Bank of JAPAN(日本銀行 (実効為替レート )) , Japan National Tourist Organization(国際観光振興機構 (JNTO)調査 )
18
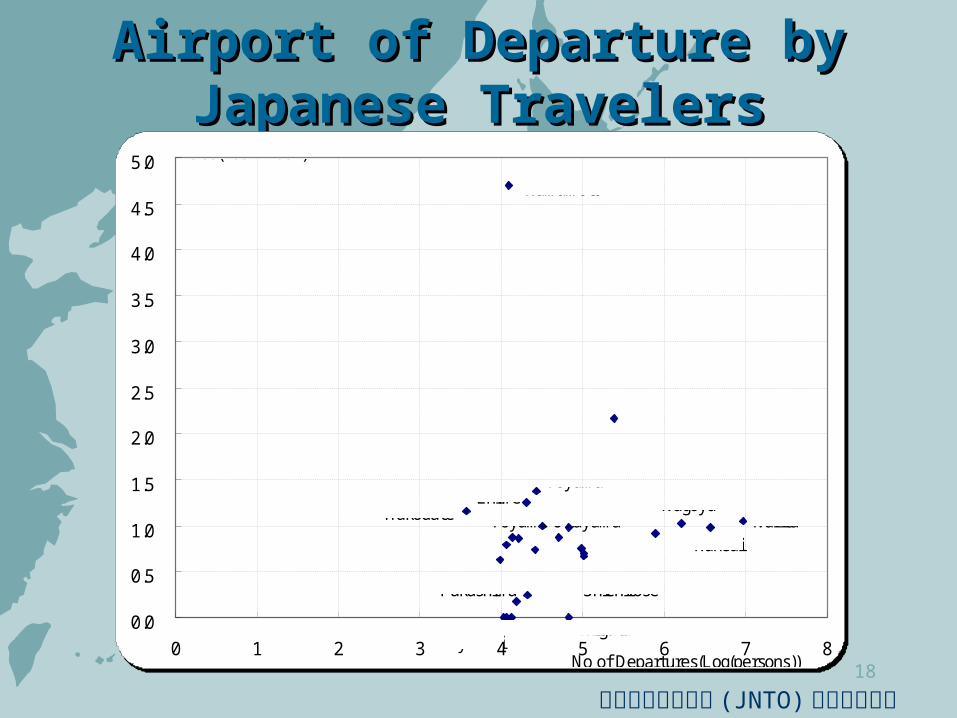
Airport of Departure by Japanese Airport of Departure by Japanese TravelersTravelers
0.0
0.5
1.0
1.5
2.0
2.5
3.0
3.5
4.0
4.5
5.0
0 1 2 3 4 5 6 7 8No of Departures(Log(persons))
Ratio(2004/ 2002)
Narita
Fukuoka
Haneda
Kansai
Nagoya
Kumamoto
ToyamaEhime
Hakodate
SendaiShichitose
Toyama Okayama
AkitaMiyazaki
Niigata
Fukushima
国際観光振興機構 (JNTO)調査より作成
19
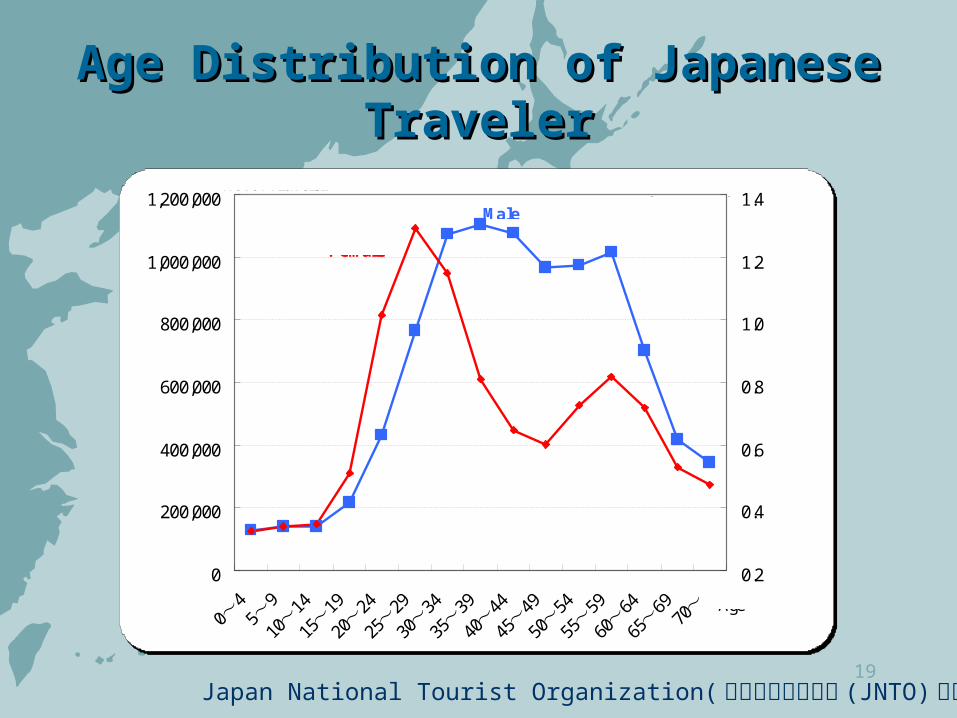
Age Distribution of Japanese TravelerAge Distribution of Japanese Traveler
0
200,000
400,000
600,000
800,000
1,000,000
1,200,000
04
~ 59
~10
14~
1519
~20
24~
2529
~30
34~
3539
~40
44~
4549
~50
54~
5559
~60
64~
6569
~ 70~
0.2
0.4
0.6
0.8
1.0
1.2
1.4Male
Female
No. of Traveler Ratio(2004/ 2002)
Age
Japan National Tourist Organization(国際観光振興機構 (JNTO)調査 )
20
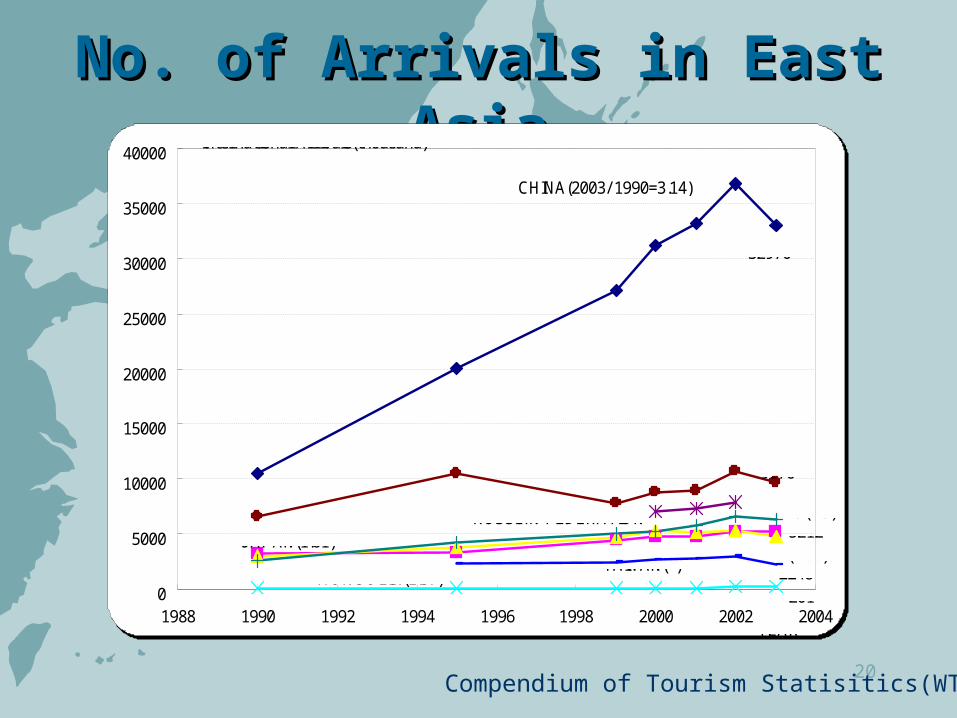
No. of Arrivals in East AsiaNo. of Arrivals in East Asia
Compendium of Tourism Statisitics(WTO)
0
5000
10000
15000
20000
25000
30000
35000
40000
1988 1990 1992 1994 1996 1998 2000 2002 2004
CHINA(2003/ 1990=3.14)
HONG KONG(1.47)
RUSSIAN FEDERATION
KOREA(1.60)
MACAU(2.5)
J APAN(1.61)TAIWAN(- )
MONGOLIA(1.37)
YEAR
International Arrivals(thousand)
32970
9676
2248
5212
201
21
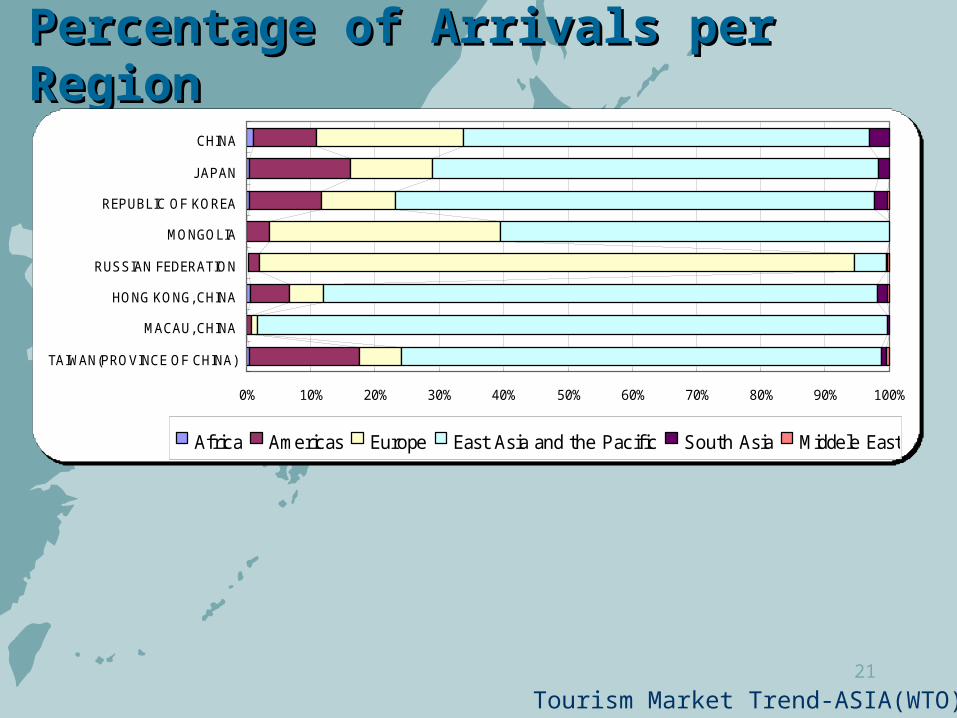
Percentage of Arrivals per Region Percentage of Arrivals per Region
0% 10% 20% 30% 40% 50% 60% 70% 80% 90% 100%
CHINA
J APAN
REPUBLIC OF KOREA
MONGOLIA
RUSSIAN FEDERATION
HONG KONG, CHINA
MACAU, CHINA
TAIWAN(PROVINCE OF CHINA)
Africa Americas Europe East Asia and the Pacific South Asia Middele East
Tourism Market Trend-ASIA(WTO)
22
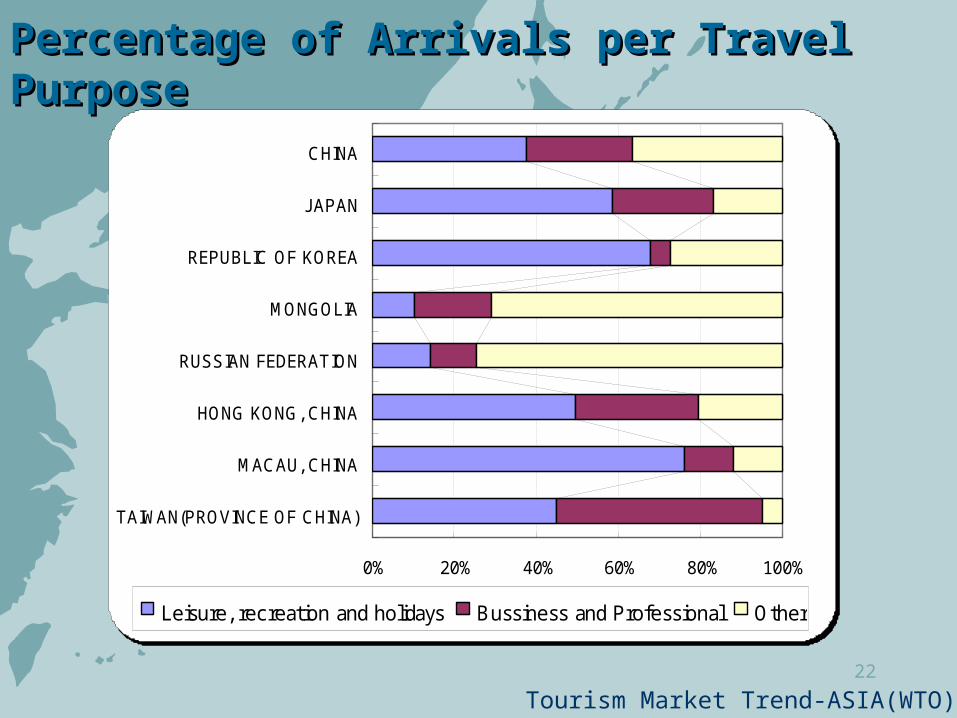
0% 20% 40% 60% 80% 100%
CHINA
J APAN
REPUBLIC OF KOREA
MONGOLIA
RUSSIAN FEDERATION
HONG KONG, CHINA
MACAU, CHINA
TAIWAN(PROVINCE OF CHINA)
Leisure, recreation and holidays Bussiness and Professional Other
Percentage of Arrivals per Travel PurposePercentage of Arrivals per Travel Purpose
Tourism Market Trend-ASIA(WTO)
23
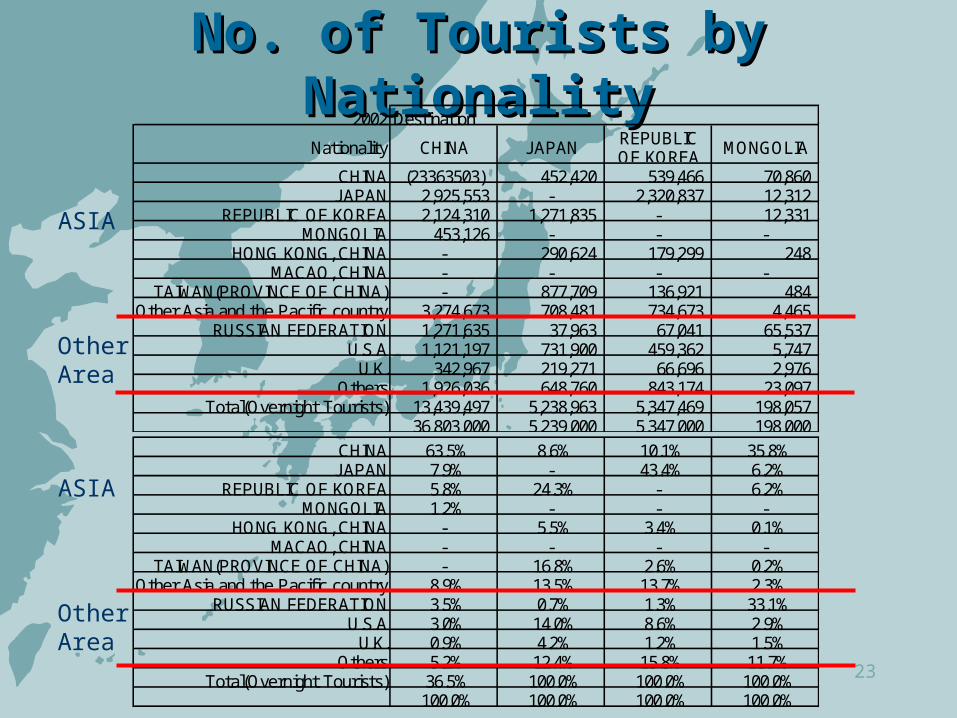
No. of Tourists by NationalityNo. of Tourists by Nationality2002 Destination
Nationality CHINA J APAN REPUBLICOF KOREA MONGOLIA
CHINA (23363503) 452,420 539,466 70,860J APAN 2,925,553 - 2,320,837 12,312
REPUBLIC OF KOREA 2,124,310 1,271,835 - 12,331MONGOLIA 453,126 - - -
HONG KONG, CHINA - 290,624 179,299 248MACAO, CHINA - - - -
TAIWAN(PROVINCE OF CHINA) - 877,709 136,921 484Other Asia and the Pacific country 3,274,673 708,481 734,673 4,465
RUSSIAN FEDERATION 1,271,635 37,963 67,041 65,537U.S.A 1,121,197 731,900 459,362 5,747U.K. 342,967 219,271 66,696 2,976
Others 1,926,036 648,760 843,174 23,097Total(Overnight Tourists) 13,439,497 5,238,963 5,347,469 198,057
36,803,000 5,239,000 5,347,000 198,000CHINA 63.5% 8.6% 10.1% 35.8%J APAN 7.9% - 43.4% 6.2%
REPUBLIC OF KOREA 5.8% 24.3% - 6.2%MONGOLIA 1.2% - - -
HONG KONG, CHINA - 5.5% 3.4% 0.1%MACAO, CHINA - - - -
TAIWAN(PROVINCE OF CHINA) - 16.8% 2.6% 0.2%Other Asia and the Pacific country 8.9% 13.5% 13.7% 2.3%
RUSSIAN FEDERATION 3.5% 0.7% 1.3% 33.1%U.S.A 3.0% 14.0% 8.6% 2.9%U.K. 0.9% 4.2% 1.2% 1.5%
Others 5.2% 12.4% 15.8% 11.7%Total(Overnight Tourists) 36.5% 100.0% 100.0% 100.0%
100.0% 100.0% 100.0% 100.0%
ASIA
OtherArea
ASIA
OtherArea
24
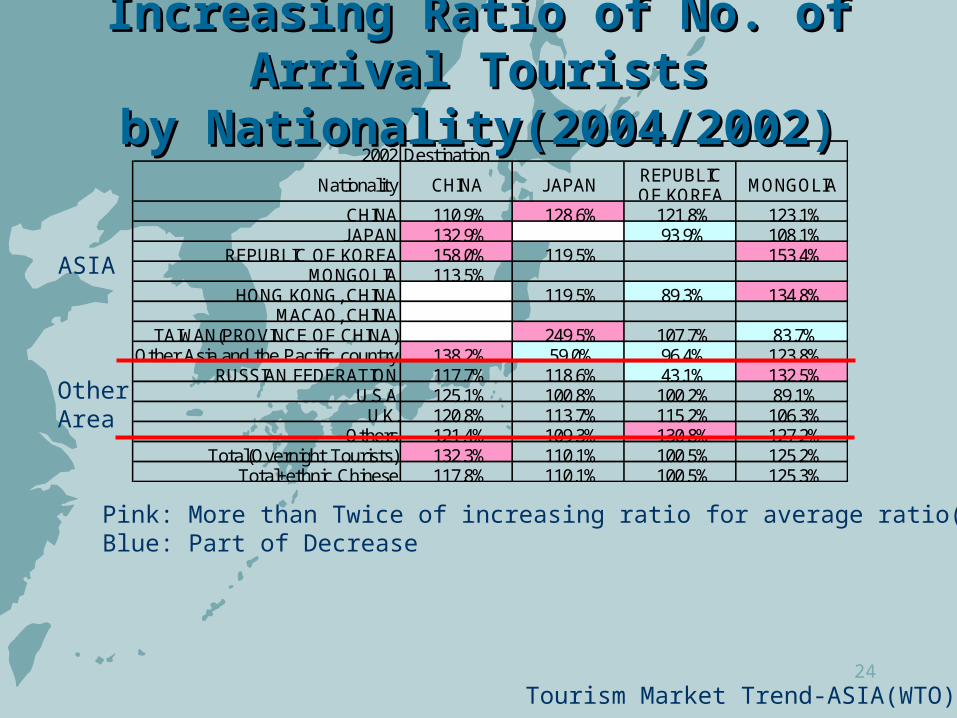
2002 Destination
Nationality CHINA J APAN REPUBLICOF KOREA MONGOLIA
CHINA 110.9% 128.6% 121.8% 123.1%J APAN 132.9% 93.9% 108.1%
REPUBLIC OF KOREA 158.0% 119.5% 153.4%MONGOLIA 113.5%
HONG KONG, CHINA 119.5% 89.3% 134.8%MACAO, CHINA
TAIWAN(PROVINCE OF CHINA) 249.5% 107.7% 83.7%Other Asia and the Pacific country 138.2% 59.0% 96.4% 123.8%
RUSSIAN FEDERATION 117.7% 118.6% 43.1% 132.5%U.S.A 125.1% 100.8% 100.2% 89.1%U.K. 120.8% 113.7% 115.2% 106.3%
Others 121.4% 109.3% 130.8% 127.2%Total(Overnight Tourists) 132.3% 110.1% 100.5% 125.2%
Total+ethnic Chinese 117.8% 110.1% 100.5% 125.3%
Increasing Ratio of No. of Arrival TouristsIncreasing Ratio of No. of Arrival Touristsby Nationality(2004/2002)by Nationality(2004/2002)
ASIA
OtherArea
Pink: More than Twice of increasing ratio for average ratio(14%)Blue: Part of Decrease
Tourism Market Trend-ASIA(WTO)
25
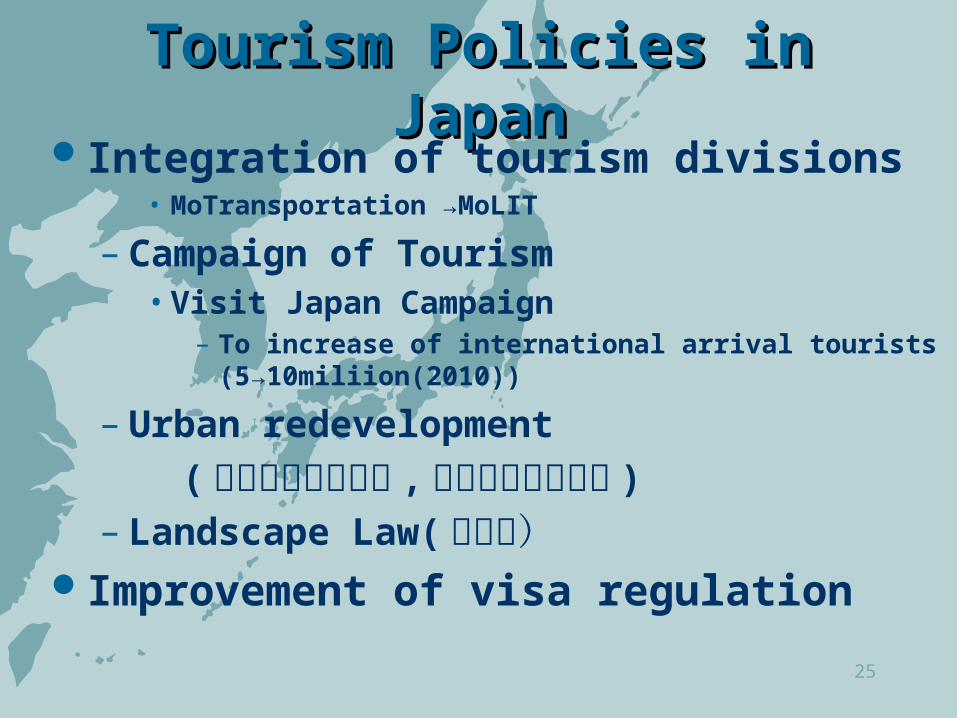
Tourism Policies in JapanTourism Policies in JapanIntegration of tourism divisions
• MoTransportation →MoLIT
– Campaign of Tourism• Visit Japan Campaign
– To increase of international arrival tourists(5→10miliion(2010))
– Urban redevelopment
( 都市再生ビジョン , 都市美空間の創造 )– Landscape Law( 景観法)
Improvement of visa regulation
26
Concept of Attracting Foreign TouristsConcept of Attracting Foreign Tourists
Social Factors– Economic Condition, Visa Regulation,
Company Activity, ・・・Personal Factors
– Image, Information ・・・
27
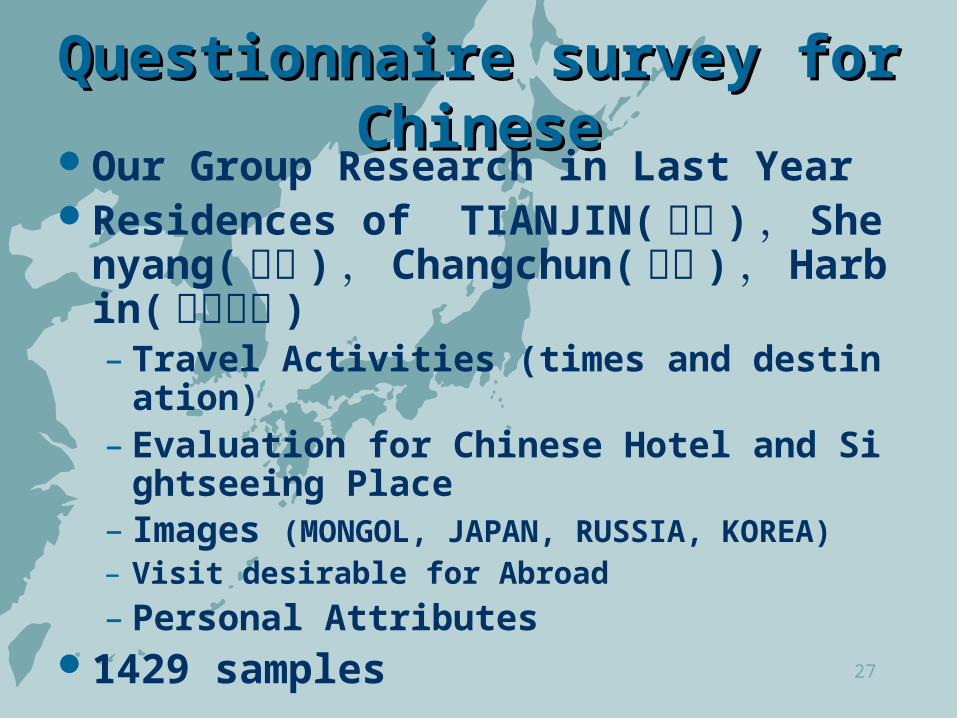
Questionnaire survey for ChineseQuestionnaire survey for ChineseOur Group Research in Last YearResidences of TIANJIN( 天津 ) , Sheny
ang( 瀋陽 ) , Changchun( 長春 ) , Harbin( ハルビン )– Travel Activities (times and destination)– Evaluation for Chinese Hotel and Sightseei
ng Place– Images (MONGOL, JAPAN, RUSSIA, KOREA)– Visit desirable for Abroad
– Personal Attributes1429 samples
28
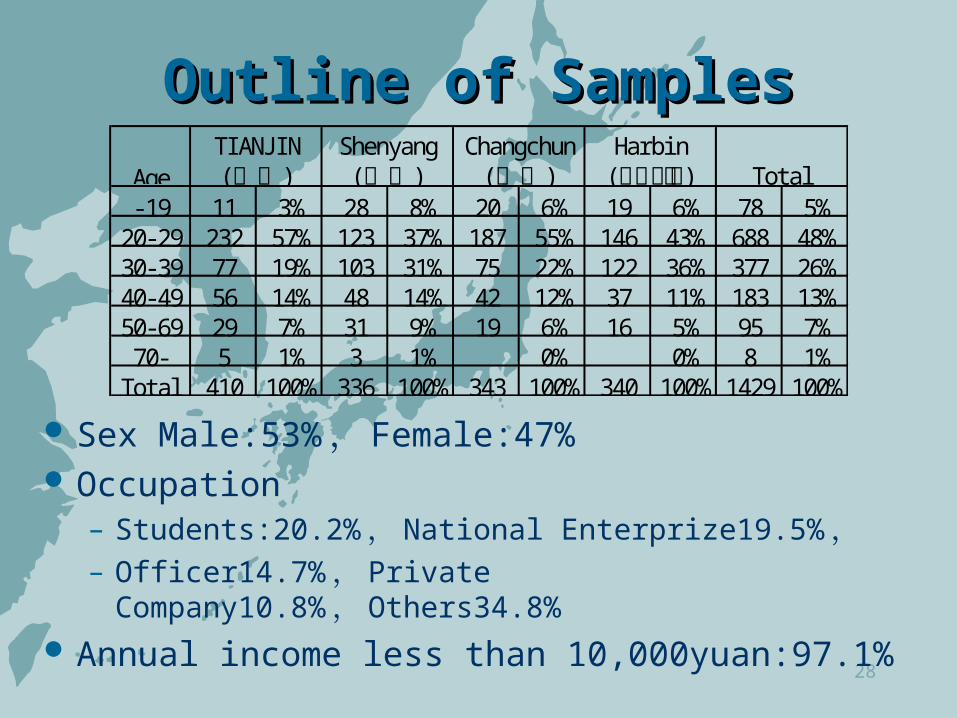
Outline of SamplesOutline of Samples
Sex Male:53%, Female:47% Occupation
– Students:20.2%, National Enterprize19.5%,– Officer14.7%, Private
Company10.8%, Others34.8%
Annual income less than 10,000yuan:97.1%
Age-19 11 3% 28 8% 20 6% 19 6% 78 5%
20-29 232 57% 123 37% 187 55% 146 43% 688 48%30-39 77 19% 103 31% 75 22% 122 36% 377 26%40-49 56 14% 48 14% 42 12% 37 11% 183 13%50-69 29 7% 31 9% 19 6% 16 5% 95 7%70- 5 1% 3 1% 0% 0% 8 1%
Total 410 100% 336 100% 343 100% 340 100% 1429 100%
TotalTI ANJ I N( )天津
Shenyang( )瀋陽
Changchun( )長春
Harbi n(ハル ヒ ン゙)
29
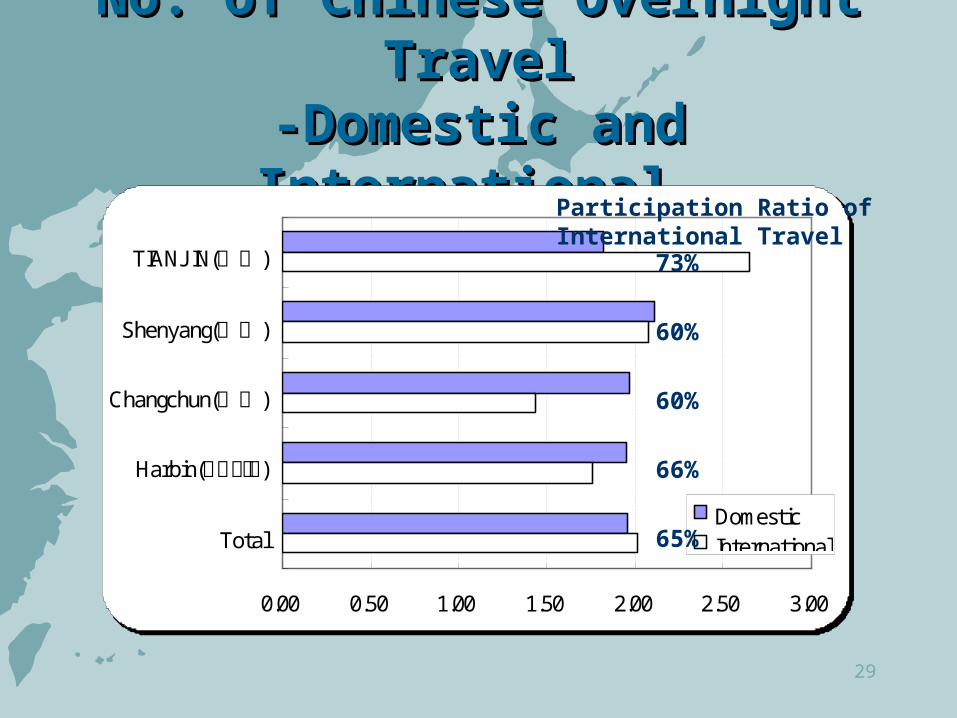
No. of Chinese Overnight TravelNo. of Chinese Overnight Travel-Domestic and International--Domestic and International-
0.00 0.50 1.00 1.50 2.00 2.50 3.00
TIANJ IN( )天津
Shenyang( )瀋陽
Changchun( )長春
Harbin( )ハルヒ ン゙
TotalDomesticInternational
73%
60%
60%
66%
65%
Participation Ratio of International Travel
30
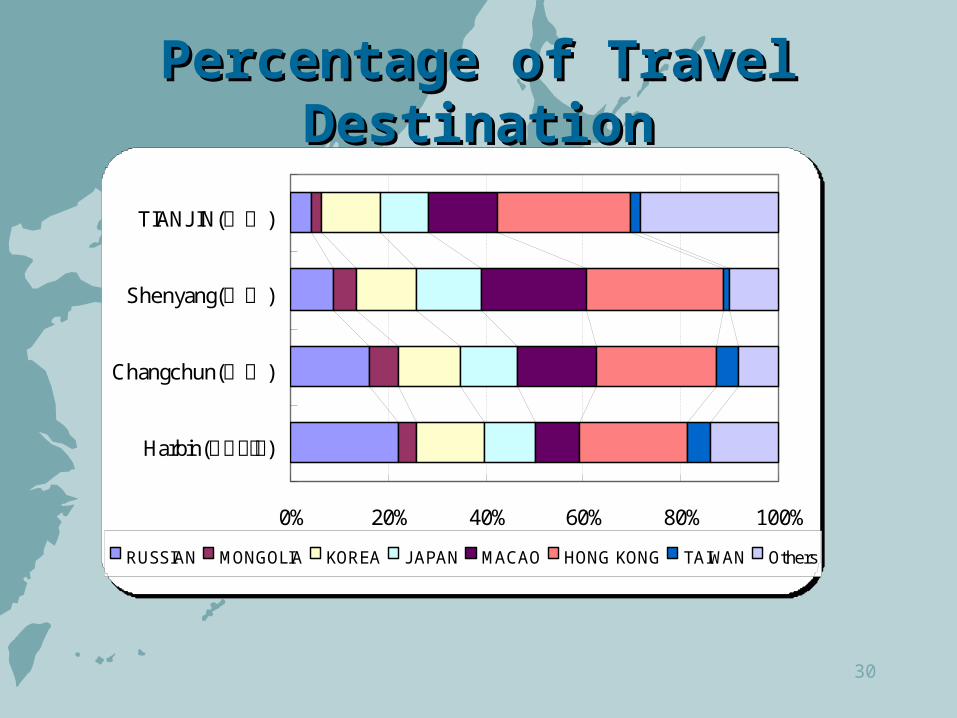
Percentage of Travel DestinationPercentage of Travel Destination
0% 20% 40% 60% 80% 100%
TIANJ IN( )天津
Shenyang( )瀋陽
Changchun( )長春
Harbin( )ハ ル ヒ ン゙
RUSSIAN MONGOLIA KOREA J APAN MACAO HONG KONG TAIWAN Others
31
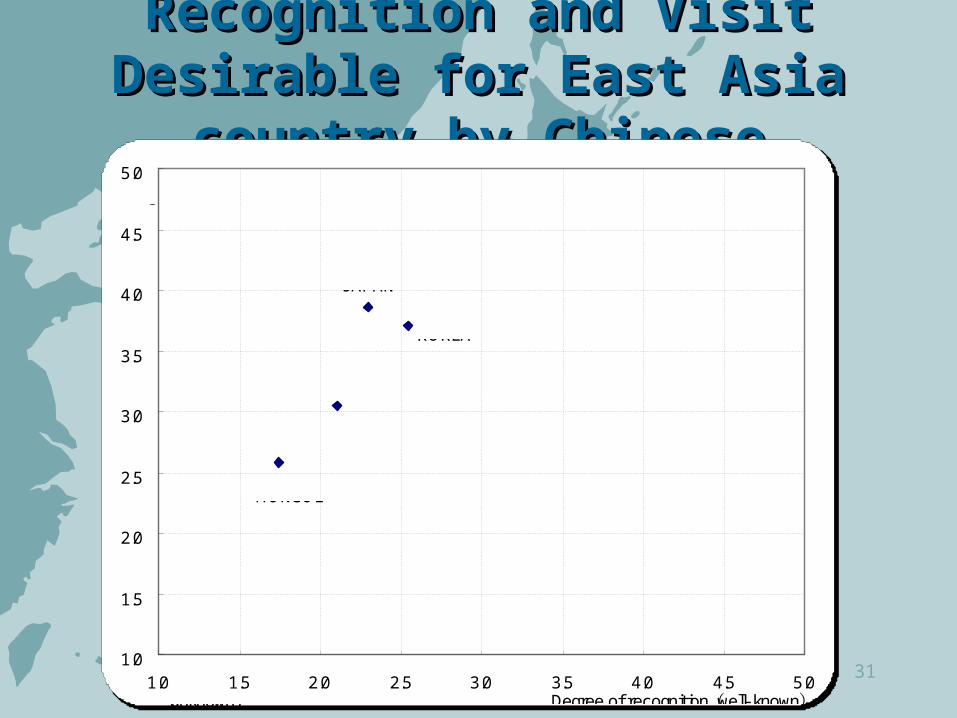
Recognition and Visit Desirable Recognition and Visit Desirable for East Asia country by Chinesefor East Asia country by Chinese
1.0
1.5
2.0
2.5
3.0
3.5
4.0
4.5
5.0
1.0 1.5 2.0 2.5 3.0 3.5 4.0 4.5 5.0Degree of recognition well- known( )unknown)(
Visit desirable
MONGOL
RUSSIA
J APAN
KOREA
Strong desirable
Strongun- desirable
32
ConclusionConclusionInternational tourism
– No. of tourist is increasing in East-Asia– Expectation of economic effect– Effecting Factors: Social & Personal
Conducting market research– Low recognition of Japan– Few amount of information about Japan
Future Issue– How to promote to foreign country?– What kind of information to foreign country?