Embed Size (px)
DESCRIPTION
Overview• USD28.9bn of deals tracked in Q3 2015, a 39.2% decrease from USD47.5bn in Q3 2014.• 925 deals tracked from public sources in Q3 2015, a decrease from 1,133 in Q3 2014.• The average deal value for investments has increased to USD34.6m in Q3 2015, from USD16.4m in Q3 2014.• The average deal value for acquisitions has decreased to USD330.2m in Q3 2015, from USD668.5m in Q3 2014.
Citation preview
Page 1
Third Quarter 2015 Report
Executive Summary Overview
• USD28.9bn of deals tracked in Q3 2015, a 39.2% decrease from USD47.5bn in Q3 2014. • 925 deals tracked from public sources in Q3 2015, a decrease from 1,133 in Q3 2014. • The average deal value for investments has increased to USD34.6m in Q3 2015, from USD16.4m in Q3 2014. • The average deal value for acquisitions has decreased to USD330.2m in Q3 2015, from USD668.5m in Q3 2014.
Deals by region:
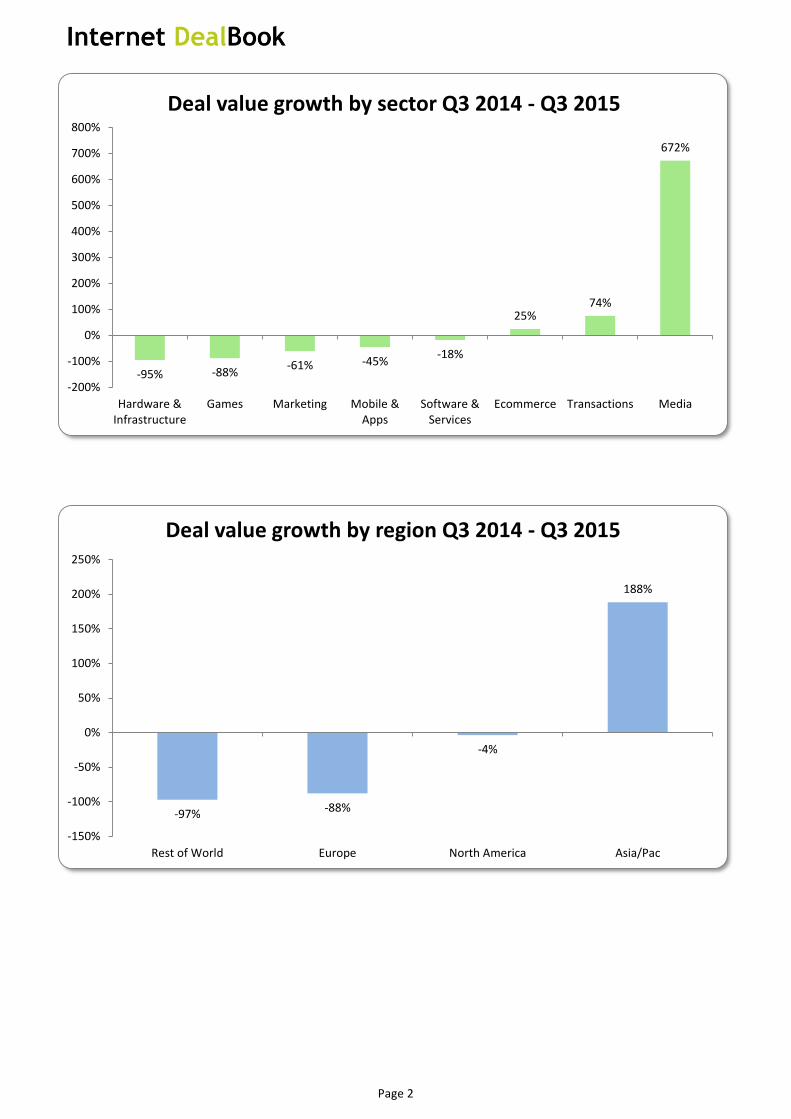
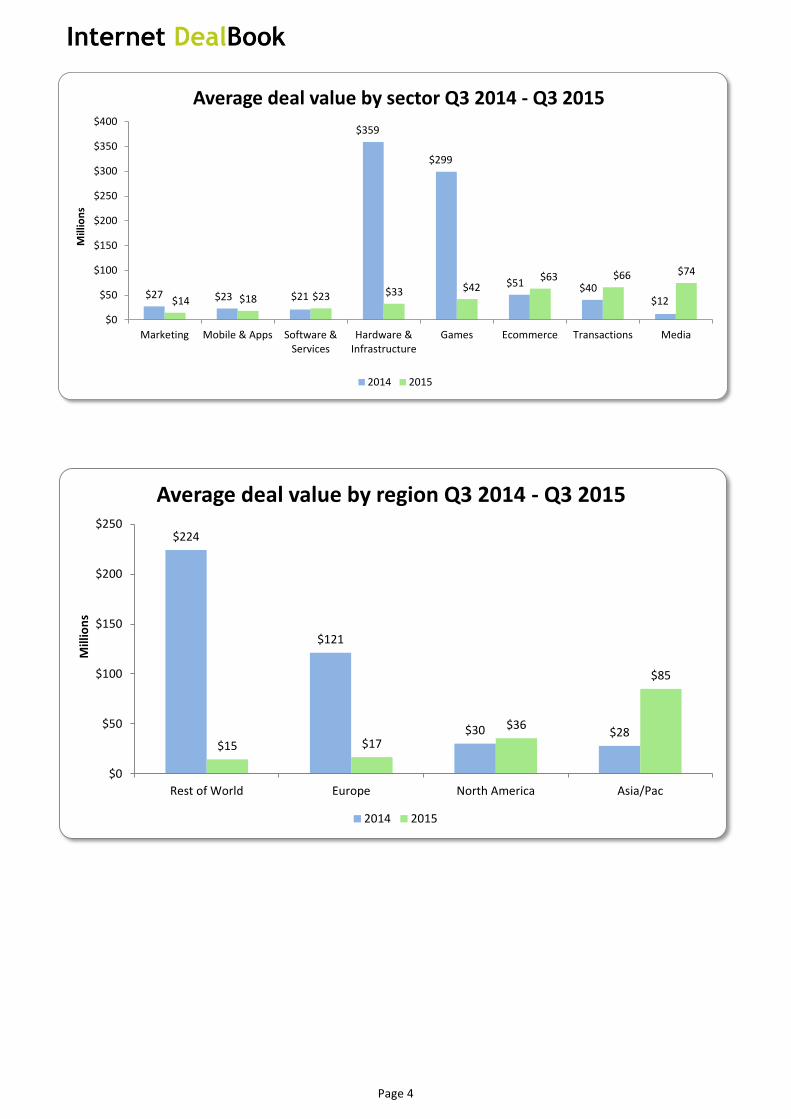
• Asia/Pacific leads all regions with an average deal value of USD85.1m. North America comes second at USD35.7m. • Asia/Pacific leads the world in average deal values for investments at USD87.1m, up from USD23.3m in Q3 2014. • Average deal values have increased in regions of Asia/Pacific, North America, Middle East, and Europe. However, the
average deal values in Rest of World and South America have decreased.
Deals by sector:
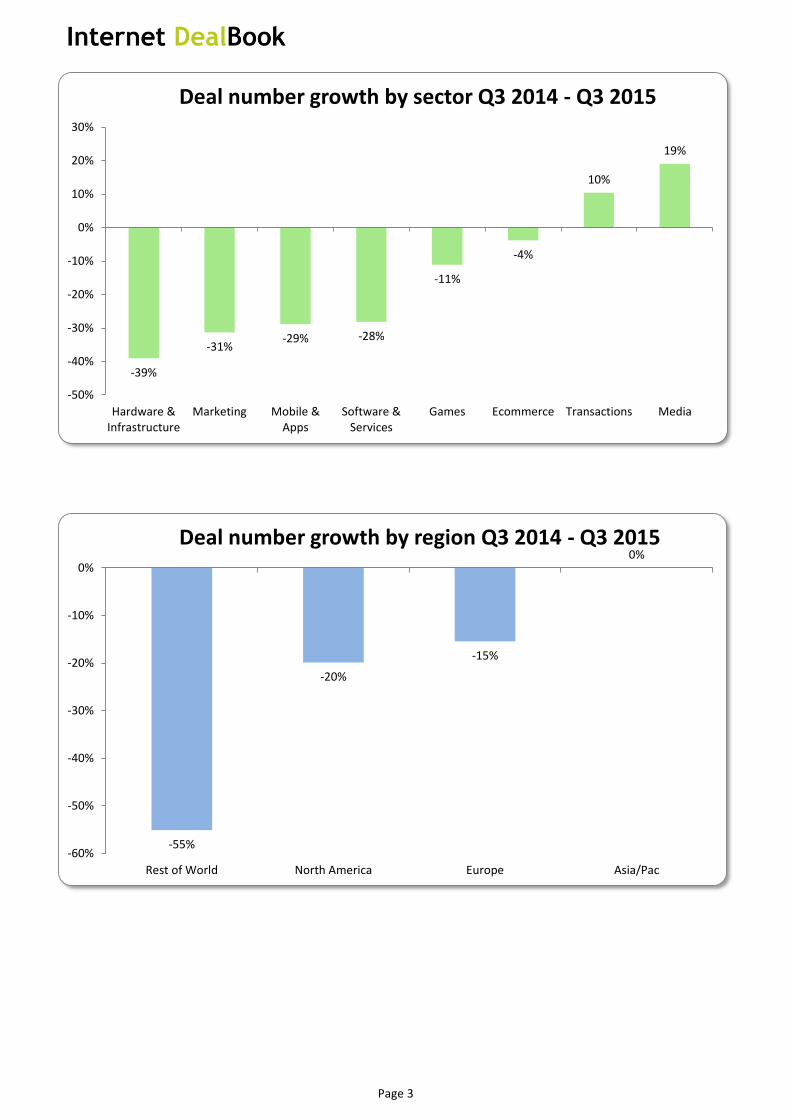
• The number of deals have fallen in all sectors except in Media and Transactions where the number of deals increased by 19.1% and 10.4%, respectively.
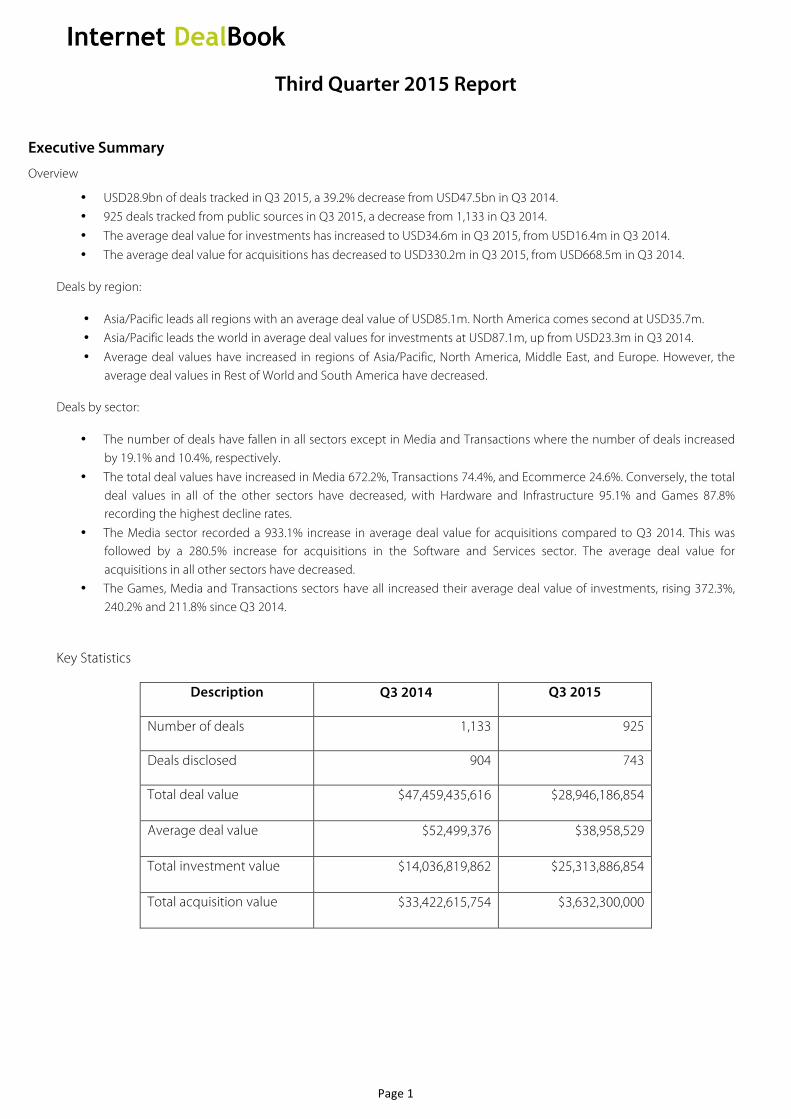
• The total deal values have increased in Media 672.2%, Transactions 74.4%, and Ecommerce 24.6%. Conversely, the total deal values in all of the other sectors have decreased, with Hardware and Infrastructure 95.1% and Games 87.8% recording the highest decline rates.
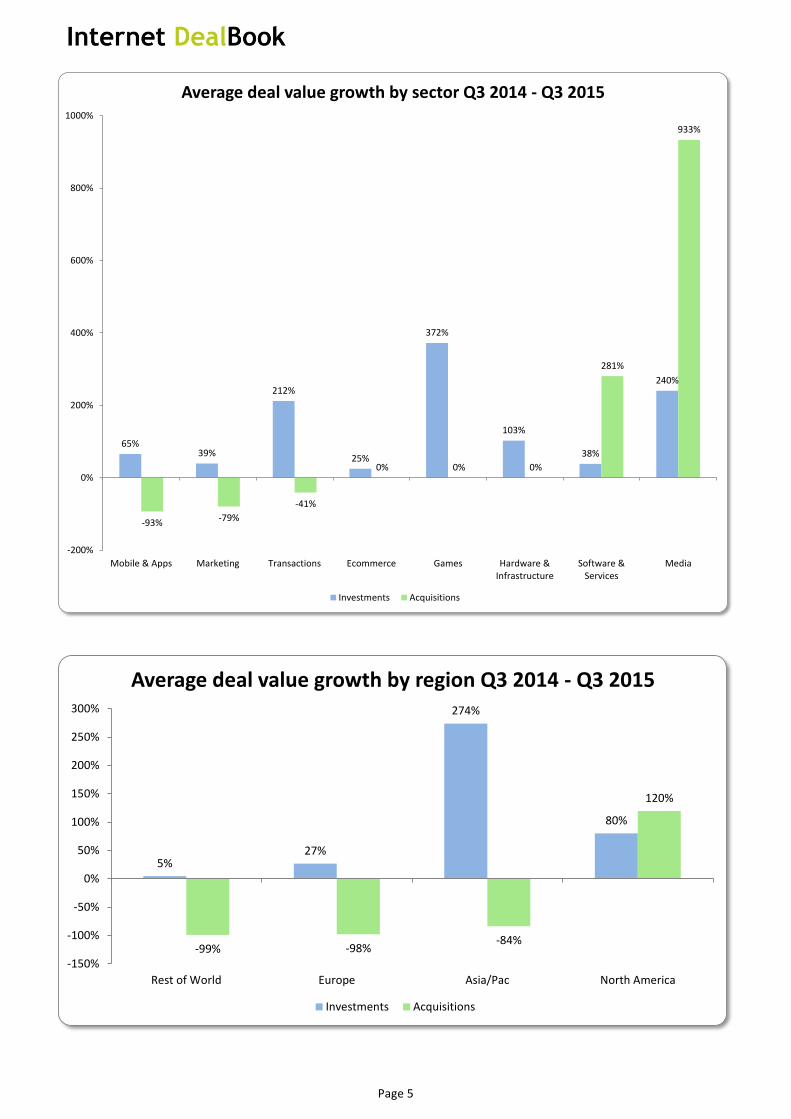
• The Media sector recorded a 933.1% increase in average deal value for acquisitions compared to Q3 2014. This was followed by a 280.5% increase for acquisitions in the Software and Services sector. The average deal value for acquisitions in all other sectors have decreased.
• The Games, Media and Transactions sectors have all increased their average deal value of investments, rising 372.3%, 240.2% and 211.8% since Q3 2014.
Key Statistics
Description Q3 2014 Q3 2015
Number of deals 1,133 925
Deals disclosed 904 743
Total deal value $47,459,435,616
$28,946,186,854
Average deal value $52,499,376
$38,958,529
Total investment value $14,036,819,862
$25,313,886,854
Total acquisition value $33,422,615,754
$3,632,300,000
Page 2
-‐95% -‐88% -‐61% -‐45% -‐18%
25%74%
672%
-‐200%
-‐100%
0%
100%
200%
300%
400%
500%
600%
700%
800%
Hardware &Infrastructure
Games Marketing Mobile &Apps
Software &Services
Ecommerce Transactions Media
Deal value growth by sector Q3 2014 -‐ Q3 2015
-‐97% -‐88%
-‐4%
188%
-‐150%
-‐100%
-‐50%
0%
50%
100%
150%
200%
250%
Rest of World Europe North America Asia/Pac
Deal value growth by region Q3 2014 -‐ Q3 2015
Page 3
-‐39%
-‐31%-‐29% -‐28%
-‐11%
-‐4%
10%
19%
-‐50%
-‐40%
-‐30%
-‐20%
-‐10%
0%
10%
20%
30%
Hardware &Infrastructure
Marketing Mobile &Apps
Software &Services
Games Ecommerce Transactions Media
Deal number growth by sector Q3 2014 -‐ Q3 2015
-‐55%
-‐20%
-‐15%
0%
-‐60%
-‐50%
-‐40%
-‐30%
-‐20%
-‐10%
0%
Rest of World North America Europe Asia/Pac
Deal number growth by region Q3 2014 -‐ Q3 2015
Page 4
$27 $23 $21
$359
$299
$51 $40$12$14 $18 $23 $33 $42
$63 $66 $74
$0
$50
$100
$150
$200
$250
$300
$350
$400
Marketing Mobile & Apps Software &Services
Hardware &Infrastructure
Games Ecommerce Transactions Media
Millions
Average deal value by sector Q3 2014 -‐ Q3 2015
2014 2015
$224
$121
$30 $28$15 $17
$36
$85
$0
$50
$100
$150
$200
$250
Rest of World Europe North America Asia/Pac
Millions
Average deal value by region Q3 2014 -‐ Q3 2015
2014 2015
Page 5
65%39%
212%
25%
372%
103%
38%
240%
-‐93% -‐79%-‐41%
0% 0% 0%
281%
933%
-‐200%
0%
200%
400%
600%
800%
1000%
Mobile & Apps Marketing Transactions Ecommerce Games Hardware &Infrastructure
Software &Services
Media
Average deal value growth by sector Q3 2014 -‐ Q3 2015
Investments Acquisitions
5%27%
274%
80%
-‐99% -‐98%-‐84%
120%
-‐150%
-‐100%
-‐50%
0%
50%
100%
150%
200%
250%
300%
Rest of World Europe Asia/Pac North America
Average deal value growth by region Q3 2014 -‐ Q3 2015
Investments Acquisitions
Page 6
Disclaimer The information contained herein is of a general nature and is not intended to address the circumstances of any particular individual or entity. Although we endeavour to provide accurate and timely information, there can be no guarantee that such information is accurate as of the date it is received or that it will continue to be accurate in the future. No one should act on such information without appropriate professional advice after a thorough examination of the particular situation. Accordingly Internet DealBook and all its related entities hereby excludes any liability to any person in consequence of his purported reliance upon information contained herein or omitted here from (whether express or implied) or otherwise furnished in connection herewith. Any requests for information in connection with this document should be addressed directly to Internet DealBook and to no other party.
Information Sources
Internet DealBook collects and compiles all its data from publicly available sources. Visit Internet DealBook for more information on the methodology used for tracking and collating deals.
Copyright Notice
This report is compiled and published by Internet DealBook and is covered by copyright. All rights reserved. No part of the publication may be published, reproduced (see exception below), stored in a retrieval system, translated, or transmitted in any form or by any means now or hereafter known, electronic or mechanical, without permission in writing from the publisher, Internet Dealbook.com.
The copyright owner consents that copies of articles may be made for personal or internal use, or for the personal or internal use of the company, individual or organisation who requested the creation of this document from Internet DealBook. For those kinds of purposes, permission must be sought from the publisher using the following guidelines. If you have any questions regarding our rights and permissions policies, or if you have a special request not covered by these guidelines, please contact Internet DealBook.