Embed Size (px)
Citation preview
Internet Voting and Canadian e-Democracy in Practice
The Delvinia Report on the Internet Voting Survey for the 2003 Town of Markham Municipal Election
January 2004
Prepared by:
Adam Froman, P.Eng MBA President, Managing Director Applied Research
Delvinia Interactive Inc. 44 Victoria Street, Suite 1910
Toronto, Ontario Canada M5C 1Y2 www.delvinia.com

© Delvinia Interactive Inc. 2003 Page i
Executive Summary This is the first of two reports of a major applied research study conducted in partnership between the Town of Markham and Delvinia Interactive to assess the effectiveness of using broadband technologies for the communication of government services. This report provides insights and conclusions about the success of Internet voting, which was introduced for the first time in the Town of Markham during the 2003 municipal election. Analysis and conclusions were drawn from 4,649 surveys, which were administered to both online voters and those that voted in-person at an advance poll location or on Election Day.
The Town of Markham, Canada’s high-tech capital became the first major municipality in Canada to pilot the implementation of Internet voting for the 2003 municipal election. This pilot was intended to evaluate the potential for voter participation by improving accessibility and efficiency of the voting process and to prompt exploration of issues raised by the alternative voting technology.
In order to obtain a complete picture of the success of Internet voting in the Town of Markham from the voter’s perspective, Delvinia captured information from not only those who voted online, but also from those who cast their ballot in-person at the polling stations. To capture both types of voter feedback the methodology required the development and administration of two types of surveys, one for those who voted online and one for those who voted in-person.
In general, the survey findings revealed an optimistic and enthusiastic attitude toward Internet voting.
In-Person Survey Findings
• Eight in ten respondents voted in the previous municipal election
• Media, posters and community newspapers were the most common sources of voter information for the 2003 municipal election
• 83% of in-person respondents were aware of the Internet voting option
• Missing the registration deadline was the most common reason given for not voting online
• 69% of in-person respondents indicated they are likely to vote online in the next municipal election if the option is available

© Delvinia Interactive Inc. 2003 Page ii
• Those in-person respondents that indicated that they would not vote online in the future indicated that the primary reasons was ‘not being computer literate’ and they ‘preferred to vote in-person’
• 69% of in-person respondents were aware of the “Markham Votes” web site as a source of voter information
• 23% of in-person respondents used the Interactive Guide on the “Markham Votes” web site to obtain information about the municipal election
• In-person respondents used the “Markham Votes” web site primarily to find out ‘how to register to vote’ (70%), ‘when to vote’ (68%), ‘where to vote’ (65%)
• 83% of in-person respondents own a home computer
• 79% of respondents have a home computer that is three years old or less
• 80% of respondents have access to a computer with an Internet connection
• 72% of respondents have a high speed Internet connection
• 86% of in-person respondents use the Internet at least weekly
Online Survey Findings
• 25% of respondents who voted online did not vote in the 2000 municipal election
• 86% of respondents voting online cited convenience was the primary reason for choosing the Internet voting option
• Most online voters found out about the 2003 municipal election from direct mail information or community newspaper
• 99% of online voters were satisfied overall with the online voting process
• 93% of online respondents are very likely to vote online in future elections
• 79% of online respondents voted online from their home computer
• 28% of online respondents used the Interactive Guide on the “Markham Votes” web site
• 70% of online respondents used the Interactive Guide to find out how to register to vote
• 96% found the information on the “Markham Votes” web site to be useful
• 99% of online respondents would find the “Markham Votes” web site to be helpful for future elections
• Only 8% of online respondents used the town of Markham voter telephone information line
Comparison of In-Person and Online Survey Respondents:
• Internet voting attracted more of those who did not vote in the previous municipal election

© Delvinia Interactive Inc. 2003 Page iii
• Online and in-person voters tended to use different sources of information to learn about the 2003 municipal election
• A significant proportion of online and in-person respondents indicated they are likely to vote online in future election if the option is available
• The Interactive Guide on the “Markham Votes” web site was used consistently between the two voting groups surveyed
• Both in-person and online voters used the Interactive Guide did so to find out how to register to vote
• Both in-person and online voters found the information on the “Markham Votes” web site to be useful
• The type of Internet connection was relatively consistent among in-person and online voters
• Eight in ten respondents voted in the previous municipal election
• Overall, the gender breakdown was consistent for both voting methods
• Ages of the online voters skews slightly younger
• Overall, marital status was consistent for both voting methods
• Those who voted online tended to be more highly educated
Based upon the survey findings and the examination of the success of Internet voting, the following conclusions can be drawn:
• Internet voting can be an effective solution for those who did not previously vote in a municipal election
• Internet voting is an alternative voting method for changing lifestyles and for those facing accessibility issues
• Voter authenticity and security are not significant concerns
• Town of Markham introduced Internet voting at the appropriate time
• As municipalities are prepared to adequately invest in voter outreach and education, an increase in voter turnout will be seen
• Internet voting should be viewed as part of a multi-channel voting solution
While the pioneering efforts of the Town of Markham did not contribute to an overall increase in voter turnout, the Internet cannot be overlooked as a legitimate and effective channel for future municipal elections. It can be concluded from this study that Internet voting has significant potential to increase voter participation and add value to the electoral process. The Town of Markham should be applauded for its leadership, vision and for its contribution to the advancement of e-democracy.
© Delvinia Interactive Inc. 2003 Page iv
Table of Contents
Introduction .........................................................................................................................1
Acknowledgements...........................................................................................................3
Background.........................................................................................................................5
Methodology........................................................................................................................7 In-Person Survey.............................................................................................................................7 Online Survey ..................................................................................................................................8
Summary of Findings........................................................................................................9 In-Person Survey Findings.............................................................................................................9 Online Survey Findings................................................................................................................ 14 Comparison of In-Person and Online Surveys......................................................................... 18 Examining the Success of Internet Voting................................................................................. 22
Final Conclusions ............................................................................................................24
Appendix A – Detailed Findings: In-Person Survey.................................................25 Findings Related to the Markham Municipal Election.............................................................. 25
Table 1: Voted in 2000 Municipal Election by Gender and Age ................................... 25 Table 2: Voted in 2000 Municipal Election by Type of Internet Connection................ 25 Table 3: Sources for Finding Out About the 2003 Municipal Election by Gender
and Age ................................................................................................................ 26 Table 4: Sources for Finding Out About the 2003 Municipal Election by Type of
Internet Connection............................................................................................. 27 Table 5: Awareness of Online Voting Option for 2003 Municipal Election by
Gender and Age.................................................................................................. 28 Table 6: Awareness of Online Voting Option for 2003 Municipal Election by
Type of Internet Connection............................................................................... 28 Table 7: Reasons for Not Voting Online by Gender and Age....................................... 29 Table 8: Likelihood of Voting Online in Next Municipal Election by Gender and
Age........................................................................................................................ 30 Table 9: Likelihood of Voting Online in Next Municipal Election by Type of
Internet Connection............................................................................................. 30 Table 10: Reasons for Not Wanting to Vote Online in Next Election by Gender
and Age ................................................................................................................ 31 Table 11: Reasons for Not Wanting to Vote Online in Next Election by Type of
Internet Connection............................................................................................. 32
© Delvinia Interactive Inc. 2003 Page v
Findings Related to the “Markham Votes” Web Site................................................................ 32 Table 12: Awareness of “Markham Votes” Web site by Gender and Age .................... 32 Table 13: Awareness of “Markham Votes” Web site by Type of Internet
Connection........................................................................................................... 33 Table 14: Use of Interactive Guide on www.Markhamvotes.ca by Gender and
Age........................................................................................................................ 33 Table 15: Use of Interactive Guide on www.Markhamvotes.ca by Type of
Internet Connection............................................................................................. 34 Table 16: Primary Uses of the “Markham Votes” Web site by Gender and Age.......... 35 Table 17: Primary Uses of the “Markham Votes” Web site by Type of Internet
Connection........................................................................................................... 36 Table 18: Usefulness of Information on the “Markham Votes” Web site by
Gender and Age.................................................................................................. 37 Table 19: Usefulness of Information on the “Markham Votes” Web site by Type
of Internet Connection......................................................................................... 37 Findings Related to the Home Computer and Internet Use.................................................... 38
Table 20: Home Computer Ownership by Gender and Age........................................... 38 Table 21: Age of Home Computer by Gender and Age .................................................. 38 Table 22: Age of Home Computer by Type of Internet Connection............................... 39 Table 23: Have Access to a Computer with Internet Connection by Gender and
Age........................................................................................................................ 39 Table 24: Type of Internet Connection by Gender and Age............................................ 40 Table 25: Frequency of Using the Internet by Gender and Age ..................................... 40 Table 26: Frequency of Using the Internet by Type of Internet Connection.................. 41
Respondent Profile: In-Person Survey ..................................................................................... 42 Table 27: Gender Breakdown............................................................................................. 42 Table 28: Gender by Type of Internet Connection ........................................................... 42 Table 29: Age Breakdown................................................................................................... 43 Table 30: Age by Type of Internet Connection.................................................................. 43 Table 31: Marital Status by Gender and Age.................................................................... 44 Table 32: Marital Status by Type of Internet Connection................................................. 44 Table 33: Educational Background by Gender and Age ................................................. 45 Table 34: Educational Background by Type of Internet Connection.............................. 45 Table 35: Household Income by Gender and Age........................................................... 46 Table 36: Household Income by Type of Internet Connection........................................ 47 Table 37: Location of Interviews segmented by Gender and Age.................................. 48 Table 38: Location of Interview by Type of Internet Connection..................................... 49
Appendix B – Detailed Findings: Online Survey.......................................................50 Findings Related to the Markham Municipal Election.............................................................. 50
Table 39: Voted in 2000 Municipal Election by Gender and Age ................................... 50
© Delvinia Interactive Inc. 2003 Page vi
Table 40: Voted in 2000 Municipal Election by Type of Internet Connection and Frequency of Internet Use.................................................................................. 50
Table 41: Reasons for Choosing to Vote Online by Gender and Age ........................... 51 Table 42: Reasons for Choosing to Vote Online by Type of Internet Connection
and Frequency of Internet Use .......................................................................... 52 Table 43: Sources for Finding out About the 2003 Municipal Election by Gender
and Age ................................................................................................................ 53 Table 44: Sources for Finding out About the 2003 Municipal Election by Type of
Internet Connection and Frequency of Internet Use....................................... 54 Table 45: Level of Satisfaction with the Online Voting Process by Gender and
Age........................................................................................................................ 55 Table 46: Level of Satisfaction with the Online Voting Process by Type of
Internet Connection and Frequency of Internet Use....................................... 55 Table 47: Likelihood of Voting Online in a Future Election by Gender and Age........... 56 Table 48: Likelihood of Voting Online in a Future Election by Type of Internet
Connection and Frequency of Internet Use ..................................................... 56 Table 49: Location of Voting by Gender and Age............................................................. 57 Table 50: Location of Voting by Type of Internet Connection and Frequency of
Internet Use.......................................................................................................... 57 Findings Related to the “Markham Votes” Web site ................................................................ 58
Table 51: Use of the Interactive Guide by Gender and Age............................................ 58 Table 52: Use of the Interactive Guide by Type of Internet Connection and
Frequency of Internet Use.................................................................................. 58 Table 53: Use of the Interactive Guide for Specific Information by Gender and
Age........................................................................................................................ 59 Table 54: Use of the Interactive Guide for Specific Information by Type of
Internet Connection and Frequency of Internet Use....................................... 59 Table 55: Usefulness of Information on “Markham Votes” Web site / Interactive
Guide by Gender and Age ................................................................................. 60 Table 56: Usefulness of Information on “Markham Votes” Web site / Interactive
Guide by Type of Internet Connection and Frequency of Internet Use ........ 60 Table 57: Helpfulness of “Markham Votes” Web site / Interactive Guide for
Future Elections by Gender and Age................................................................ 61 Table 58: Helpfulness of “Markham Votes” Web site / Interactive Guide for
Future Elections by Type of Internet Connection and Frequency of Internet Use.......................................................................................................... 61
Findings Related to the Town of Markham Voter Information Line........................................ 62 Table 59: Use of the Town of Markham Voter Info Line by Gender and Age............... 62 Table 60: Use of the Town of Markham Voter Info Line by Type of Internet
Connection and Frequency of Internet Use ..................................................... 62 Table 61: Satisfaction with Service Provided by Voter Info Line by Gender and
Age........................................................................................................................ 63
© Delvinia Interactive Inc. 2003 Page vii
Table 62: Satisfaction with Service Provided by Voter Info Line by Type of Internet Connection and Frequency of Internet Use....................................... 64
Respondent Profile: Online Survey........................................................................................... 65 Table 63: Type of Internet Connection by Gender and Age............................................ 65 Table 64: Type of Internet Connection by Frequency of Internet Use............................ 65 Table 65: Frequency of Internet Use by Gender and Age............................................... 66 Table 66: Frequency of Internet Use by Type of Internet Connection ........................... 66 Table 67: Gender Breakdown............................................................................................. 67 Table 68: Gender Breakdown by Type of Internet Connection and Frequency of
Use........................................................................................................................ 67 Table 69: Age Breakdown................................................................................................... 68 Table 70: Age Breakdown by Type of Internet Connection and Frequency of
Use........................................................................................................................ 68 Table 71: Marital Status by Gender and Age.................................................................... 69 Table 72: Marital Status by Type of Internet Connection and Frequency of Use ......... 69 Table 73: Education Level by Gender and Age................................................................ 70 Table 74: Education Level by Type of Internet Connection and Frequency of
Use........................................................................................................................ 71 Table 75: Household Income by Type of Internet Connection and Frequency of
Use........................................................................................................................ 72 Table 76: Household Income by Type of Internet Connection and Frequency of
Use........................................................................................................................ 73
Appendix C – Comparison of In-Person and Online Surveys.................................74 Findings Related to the Markham Municipal Election.............................................................. 74
Table 77: Voted in 2000 Municipal Election ...................................................................... 74 Table 78: Sources for Finding out About the 2003 Municipal Election........................... 75 Table 79: Likelihood of Voting Online in a Future Election .............................................. 75
Findings Related to the “Markham Votes” Web site ................................................................ 76 Table 80: Use of the Interactive Guide............................................................................... 76 Table 81: Use of the Interactive Guide for Specific Information...................................... 76 Table 82: Usefulness of Information on “Markham Votes” Web Site / Interactive
Guide .................................................................................................................... 77 Comparison of In-Person and Online Survey Respondents................................................... 78
Table 83: Type of Internet Connection............................................................................... 78 Table 84: Frequency of Internet Use.................................................................................. 78 Table 85: Gender.................................................................................................................. 79 Table 86: Age........................................................................................................................ 79 Table 87: Marital Status ....................................................................................................... 80 Table 88: Education Level ................................................................................................... 80
© Delvinia Interactive Inc. 2003 Page viii
Table 89: Household Income.............................................................................................. 81
Appendix D – About the In-Person Survey Locations..............................................82
Appendix E –Voter Turnout in Major Ontario Municipalities...................................83
Appendix F – About the Municipalities on Demand Project....................................84 Overview........................................................................................................................................ 84 Project Objectives......................................................................................................................... 85 Project Highlights.......................................................................................................................... 86 Project Outcomes......................................................................................................................... 91
Appendix G – About Delvinia Interactive Inc..............................................................92
Appendix H – About the Town of Markham................................................................93
Appendix I – About CANARIE Inc.................................................................................94 About the Canarie Advance Research in Interactive Media Program................................... 94

© Delvinia Interactive Inc. 2003 Page 1
Introduction This is the first of two reports of a major applied research study conducted in partnership between the Town of Markham and Delvinia Interactive to assess the effectiveness of using broadband technologies for the communication of government services. This report provides insights and conclusions about the success of Internet voting, which was introduced for the first time in the Town of Markham during the 2003 municipal election. Analysis and conclusions were drawn from 4,649 surveys, which were administered to both online voters and those that voted in-person at an advance poll location or on election day. The second report, slated for release in March 2004, will address whether broadband technology was an effective tool to communicate information about the election to the voting population.
Some scholars and experts predict that as part of e-democracy, Internet voting will have a broad impact on the political process in the near future, influencing voter turnout and empowering voters. While issues of voter authenticity, service delivery, efficiency, security and accessibility crowd legislators’ agendas, there has been some effort made to move toward practicing e-democracy. This research provides valuable insights into the voter experience as it relates to e-democracy in an applied setting. The following survey findings will be presented and discussed in this report:
• Internet voting improving accessibility to cast ballots
• Effectiveness of Internet voting in increasing voter turnout
• Efficiency of Internet voting as an alternative voting method
• Consequences of the mixed media used to communicate the election process
• Issues raised by Internet voting, such as security and voter authenticity
• Profiles of voters and the influencing factors for voting either online or in-person
For the purposes of this report, the term “Internet voting” was used to describe a voting process that enabled voters to cast a secure and secret ballot over the Internet. The findings of this report were intended to provide The Town of Markham with insight in order to decide on the value of implementing Internet voting for future municipal elections as well as helping the Town identify the best way to allocate resources for building voter awareness and implementing election communications campaigns.

© Delvinia Interactive Inc. 2003 Page 2
Delvinia Interactive Inc., a Digital Marketing and Applied Research Agency in Toronto, was responsible for conducting this study and compiling this report. Delvinia engaged Millward Brown Goldfarb to assist in the collection of field data for the in-person surveys as well as the analysis of the survey data for both the in-person and online surveys.
This report begins by outlining the background and methodology of the research initiative. The survey findings are summarized and organized into three sections. The first section addresses the in-person survey results, the second section presents the online survey results and the third section provides a comparison of the findings from in-person and online surveys as well as the respective respondent profiles. As part of the analysis, a section has been dedicated to examining the success of Internet voting.
The final section of the report provides conclusions that have been drawn from the survey findings and additional analysis and evaluates the overall success of Internet voting for the Town of Markham.

© Delvinia Interactive Inc. 2003 Page 3
Acknowledgements A number of people contributed their time and expertise to this research project and I wish to personally thank everyone involved for their generous support at various steps of the process.
I would first like to thank the Town of Markham, for accepting the invitation to take part in this research initiative and for providing their invaluable investment of time and expertise. Specifically, I would like to acknowledge:
Sheila Birrell, Town Clerk
Frank Edwards, Manager of Administration, Clerk’s Department
Andy Taylor, Commissioner of Corporate Services
James Allen, Chief Information Officer
Stephen Chait, Director of Economic Development
Biju Misra, Manager, Application Development & Support
Freda Lee, Web Administrator
John Swan, Client Advisor
Marjorie Rebane, Manager, Corporate Communications
Ken Gunn, Elections & Special Projects Coordinator
Blair Labelle, Election Support
Vincent Lai, Manager, Application Support
Francis Poon, Manager, Information Technology
I also appreciated the invaluable support from Canarie for recognizing the merit of our proposed research study and helping us overcome all of the operational and financial challenges during our project. In particular, I would like to thank:
Susan Baldwin, Senior Director, Operations

© Delvinia Interactive Inc. 2003 Page 4
Ern Bieman, Project Analyst, E-content & E-health Programs
Nancy Carter, Manager, Finance
I am grateful for the valuable research consulting and the energy spent in analyzing the data from the Millward Brown Goldfarb team. In particular, I would like to thank:
Dr. Stephen Popiel, Senior Vice President, Research & Development
Ted Doering, Senior Research Executive
The Election Systems & Software team’s support and assistance was important in the development of the Town of Markham Interactive Guide broadband web Site and providing feedback on our Voter Outreach Campaign. Specifically, I wish to thank:
Guy Duncan, Vice President, Voter Registration Services & Systems
John Groh, President ES&S International
Jonathan Hollins, Canadian Sales Manager
Finally, I wish to thank members of the Delvinia Interactive team for the important contribution of ideas and the energy spent in the development, execution, monitoring and evaluation of this applied research initiative. In particular thanks are due to Rachel Bandura, Steve Mast, Craig Tothill, Sean Howard, Pete O’Neill and Susan Megson.
Their interest and willingness to participate in this important research initiative has enabled Delvinia to deliver an insightful report into the success of Internet of voting as an alternative voting method and effectiveness of various online and off line tactics for communicating the election process.
Adam Froman, P. Eng MBA President, Managing Director Applied Research Delvinia Interactive Inc.

© Delvinia Interactive Inc. 2003 Page 5
Background
Canada is considered to be a technologically advanced country whose electoral process is regarded as one of the most efficient and respected in the world. Since reducing costs and improving service to residents are at the top of every government agenda, combined with the high penetration of Internet access in Canada, it seemed only logical to explore the potential for Internet voting to both reduce costs while improving the quality of government service to Canadians.
Canada is not the first country to explore Internet voting as part of a multi-channel voting experience in order to offer convenience, increase voter turnout and reduce costs. As recently as May 2003, Electoral Software & Systems (ES&S), the largest voting technology company in the world, implemented a multi-channel voting pilot for the election in Scotland with much success.
When ES&S presented the opportunity of Internet voting for the 2003 Municipal Election in Ontario, they spoke to a number of municipalities and generated a great deal of interest. Despite the extensive interest surrounding Internet voting, few municipalities actually demonstrated much initiative to implement this new voting technology. It was no surprise that The Town of Markham, Canada’s high-tech capital, stood out amongst other municipalities to be the first major municipality in Canada willing to test Internet voting in a way that would satisfy the requirements of the electoral guidelines in Canada. Specifically, the Internet Voting option was limited to the advanced poll. Their interest was not only to demonstrate their commitment to residents about implementing technology, but also to evaluate the potential for improving accessibility, voter participation and efficiency of the voting process while having the opportunity to address the perceived issues of offering a new voting channel.
At the same time as they were considering offering Internet voting, the Town of Markham entered into a partnership with Delvinia Interactive to assess the effectiveness of using broadband technologies for the communication of government services. The research project that the Town of Markham and Delvinia developed was called “Municipalities on Demand” and was funded in-part by the Applied Research in Interactive Media (ARIM) Program. This is a joint program between CANARIE Inc. and the Department of Canadian Heritage to support projects that research and develop broadband technologies and tools that facilitate the creation and use of broadband content (for more information refer to Appendices G and J).
© Delvinia Interactive Inc. 2003 Page 6
Internet voting presented a number of challenging communications objectives, including building awareness about the opportunity to vote online, educating voters on a new registration process and addressing concerns regarding security and voter authenticity. In addition to leading the research, Delvinia Interactive was awarded The Town of Markham’s 2003 Voter Outreach Campaign. In order to evoke a positive public interest in Markham’s election process and to encourage citizens to participate more actively in their local government, Delvinia developed and executed an integrated communications plan that blended offline and online marketing tactics.
Although the marketing tactics were successful in creating awareness about the election, mass media could not effectively communicate the details about Internet voting. The strategy involved driving people to a dedicated web site to effectively deliver information about the election process. Delvinia used broadband technology to develop an Interactive Guide in order to facilitate the voter education process. As part of the “Municipalities on Demand” project, the effectiveness of the various integrated communications tactics were also analyzed to enable the Town of Markham to evaluate which tactics influenced voters most. These findings will be discussed in the second report.
In a municipality of more than 150,000 registered voters, over 11,700 citizens registered to vote online for the 2003 Municipal election in the Town of Markham. Of them, 7,211 cast their ballot online during the advance polls. This accounted for approximately 17% of the overall voter turnout of 42,199 in Markham and an increase of over 300% in advanced poll voting.
© Delvinia Interactive Inc. 2003 Page 7
Methodology In order to obtain a complete picture of the success of Internet voting in the Town of Markham from the voter’s perspective, Delvinia captured information from not only those who voted online, but also from those who cast their ballot at the polling stations. To capture both types of voter feedback, the methodology required the development and administration of two types of questionnaires, one for those who voted online and one for those who voted in-person.
In order to develop the survey questions and implementation plan, Delvinia engaged their research partner, Millward Brown Goldfarb, and also consulted with the Town of Markham to identify key research metrics. These metrics formed the basis for both surveys, which were crafted in a similar fashion, but were somewhat tailored to the means of implementation.
In keeping with the objectives of this portion of the research, Delvinia’s first task was to identify the factors that influenced citizens to vote online and gain insight into their attitudes, opinions, expectations and interest in Internet voting. The second task was to examine whether Internet voting presented an opportunity to increase voter participation at a municipal level. Therefore, the survey questions focused on addressing accessibility issues that may affect Internet voting participation and captured demographics of those surveyed both online and in-person.
To ensure a reliable sample of data was collected, a target number of completed surveys for each research technique was established. Based on the research expertise of Millward Brown Goldfarb, a minimum target of 300 completed surveys for each survey instrument (online and in-person) would provide a representative sample.
In-Person Survey
In order to ensure that an adequate survey sample was collected from voters at Polling Stations, Delvinia, the Town of Markham and Millward Brown Goldfarb identified key polling stations throughout the municipality and mapped out dates and times best suited to achieve the targeted completed surveys. Millward Brown Goldfarb placed experienced and fully briefed interviewers at nine voting sites throughout the Town of Markham during the advanced voting period and on Election Day. For more information about the in-person survey locations (see Appendix D).
© Delvinia Interactive Inc. 2003 Page 8
Online Survey
Since Internet voting was available only during Advance Polls, the online survey was administered only during that period (November 3rd to November 7th, 2003). Online voters were invited to take the survey after they had cast their ballot, upon exiting the ES&S Internet voting application. A pop-up window appeared in the voters’ Internet browser with a link to the online survey. The survey could be completed within approximately 5 to 7 minutes, well within the tolerance threshold of online surveys.
Once the advance voting period was over, the survey data was forwarded to Millward Brown Goldfarb for coding and analysis. Only completed surveys were included in the sample.
© Delvinia Interactive Inc. 2003 Page 9
Summary of Findings In general, the survey findings revealed an optimistic and enthusiastic attitude toward Internet voting. Of 7,211 online voters, an astonishing 50% participated in the survey. In total, 3,655 online surveys and 994 in-person surveys were completed. The survey completion rate for both voting methods far exceeded targets and expectations, resulting in a reliable sample of data and demonstrated that voters were open to sharing opinions. Furthermore, based on the responses from both voting groups, the majority of voters were positive about Internet voting, even if they did not vote online in this election, therefore suggesting that future uptake of Internet voting will likely be significant.
The findings from in-person and online surveys are listed in the sections to follow. Detailed findings with tables for both the in-person and online surveys can be found in Appendix A and B. A comparison of in-person and online surveys can be found in Appendix C.
In-Person Survey Findings
Overall, 83% of voters surveyed In-person at Polling Stations confirmed they were aware of Internet voting. Of those that said that they would have voted online, missing the online voting deadlines was the primary reason that they did not vote online. This suggests that the concept of online voting itself appears to not be a deterrent for using the option.
Another interesting finding was that nearly 70% of respondents voting in-person indicated they are likely to vote online in the next election. Although 80% of respondents had access to a computer with and an Internet connection, the most common reason given by those who are unlikely to vote online in the next election is a lack of computer knowledge or Internet access. The in-person survey findings were:

© Delvinia Interactive Inc. 2003 Page 10
Findings Related to the Town of Markham Municipal Election:
Eight in ten respondents voted in the previous municipal election
Exactly eight in ten in-person respondents said that they voted in the 2000 Municipal election. This proportion is higher among those aged 35 and over. Just over half (51%) of those between the ages of 18 and 34 said that they voted in the 2000 Municipal election. This suggests that there were many new voters in the 2003 municipal election. In terms of gender, slightly more females than males said that they voted in the last municipal election.
Refer to Table: 1 and 2
Media, posters and community newspapers were the most common sources of voter information for the 2003 municipal election
Over four in ten (44%) said that they heard about the 2003 Municipal election through the ‘media’, specifically television or the radio. Exactly four in ten in-person respondents said that they heard about the Municipal election through posters, while 38% heard about the election by reading their community newspaper.
Refer to Table: 3 and 4
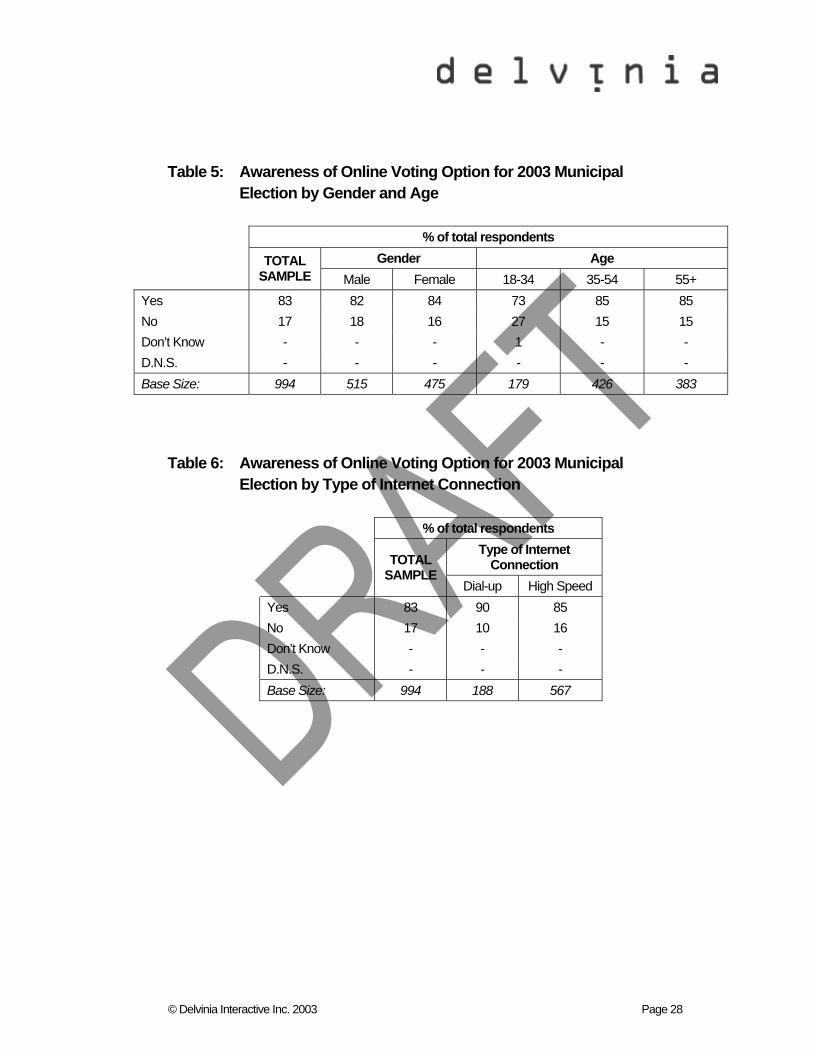
83% of in-person respondents were aware of the Internet voting option
Overall, 83% of in-person respondents were aware that they could vote online in the 2003 Municipal election. This proportion is relatively consistent among both males and females. Awareness was higher among respondents over 35 years of age.
Refer to Table: 5 and 6
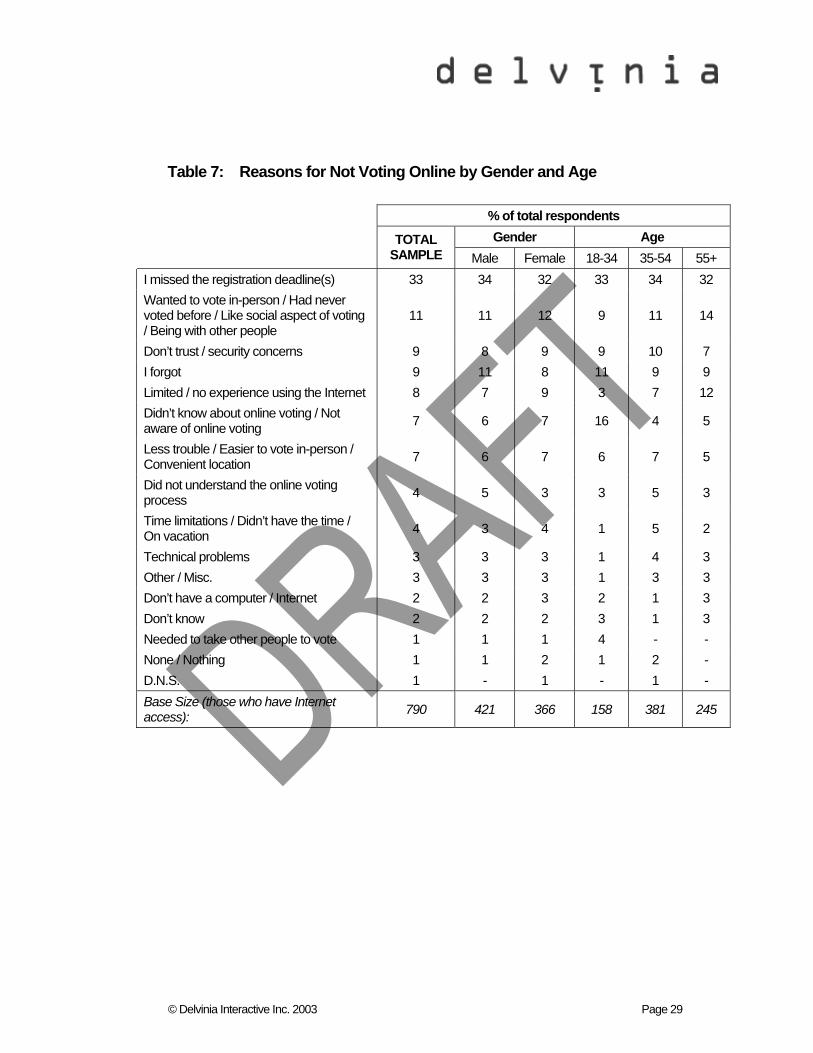
Missing the registration deadline was the most common reason given for not voting online
One-third (33%) of in-person respondents who were aware that they could vote online said that the reason they did not vote online was that they missed the registration deadline. This proportion is relatively consistent across gender and age breaks. Other reasons given by respondents for not voting online were:
• Wanted to vote in-person / had never voted before / like the social aspect of voting (11%)

© Delvinia Interactive Inc. 2003 Page 11
• Don’t trust / security concerns (9%)
• Forgot (9%)
• Limited / no experience using the Internet (8%)
Refer to Table: 7
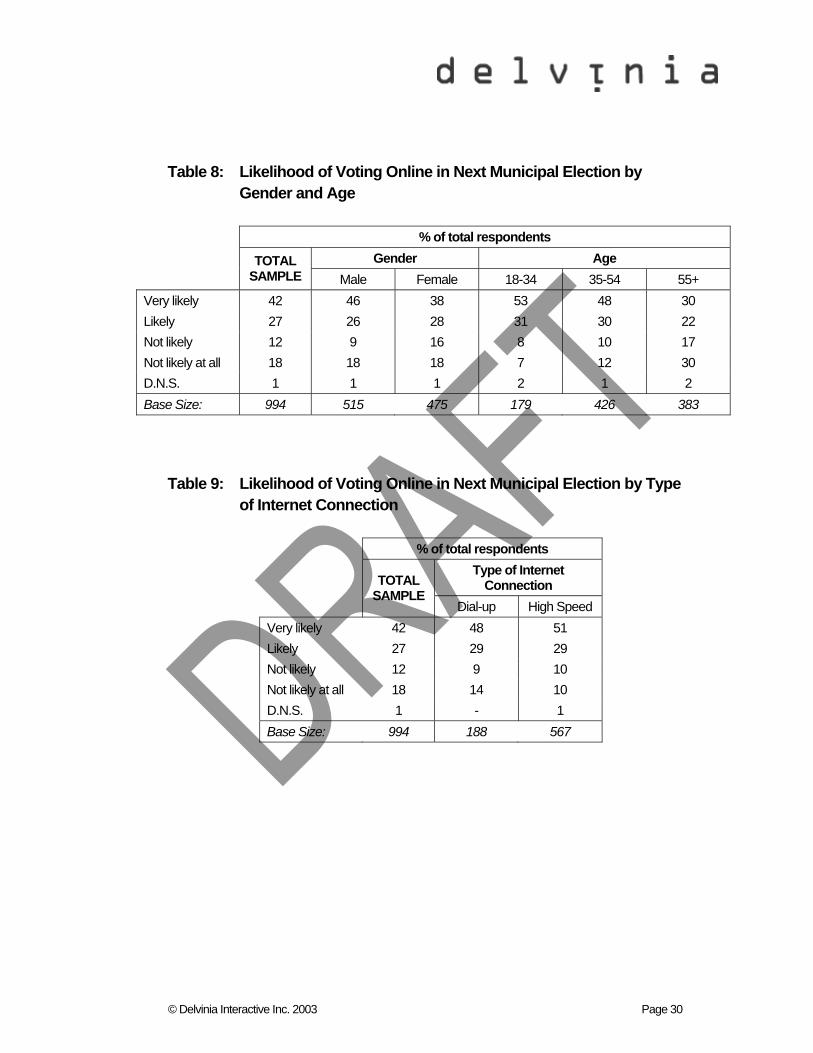
69% of in-person respondents indicated they are likely to vote online in the next municipal election if the option is available
Close to seven in ten (69%) would be at least ‘likely’ to vote online in the next Municipal election. Over four in ten (42%) said that they would be ‘very likely’ to vote online in the next municipal election.
In terms of differences by gender, more males than females would be ‘very likely’ to vote online in the next Municipal election. In terms of age, more under the age of 55 would be ‘very likely’ to vote online for the next Municipal election. Conversely, those 55 and older have a greater propensity to say that they are ‘not likely at all’ to vote online for the next Municipal election.
Refer to Table: 8 and 9
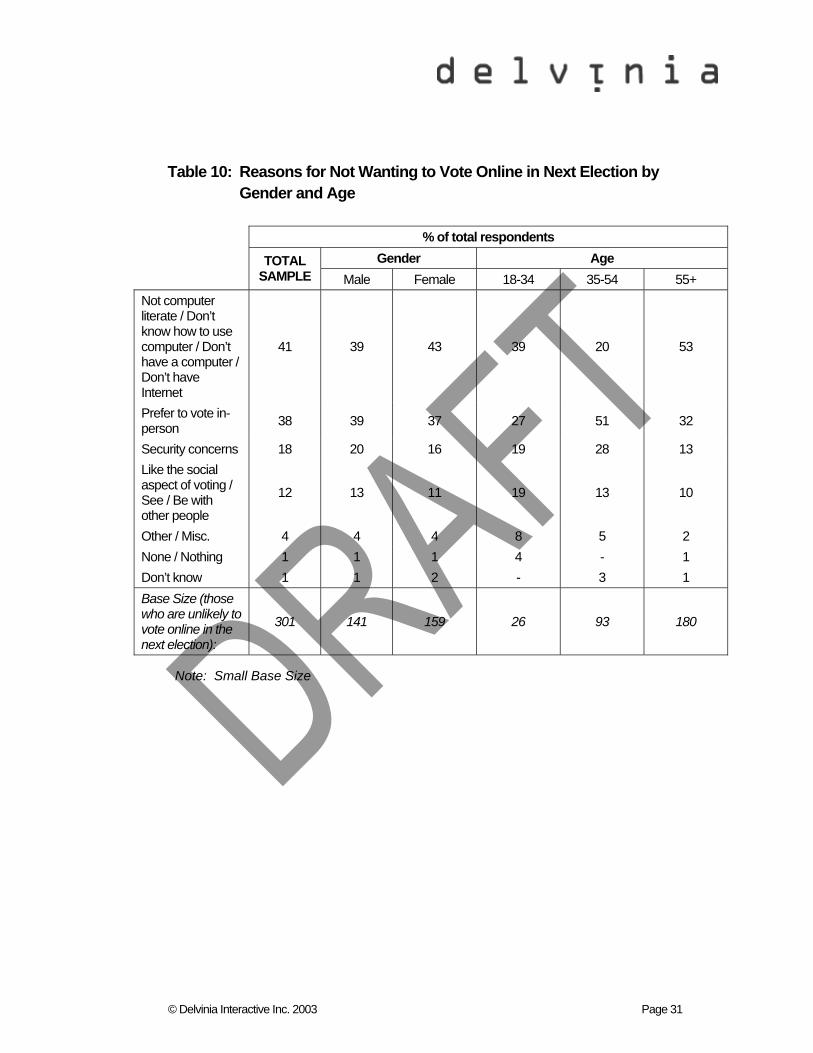
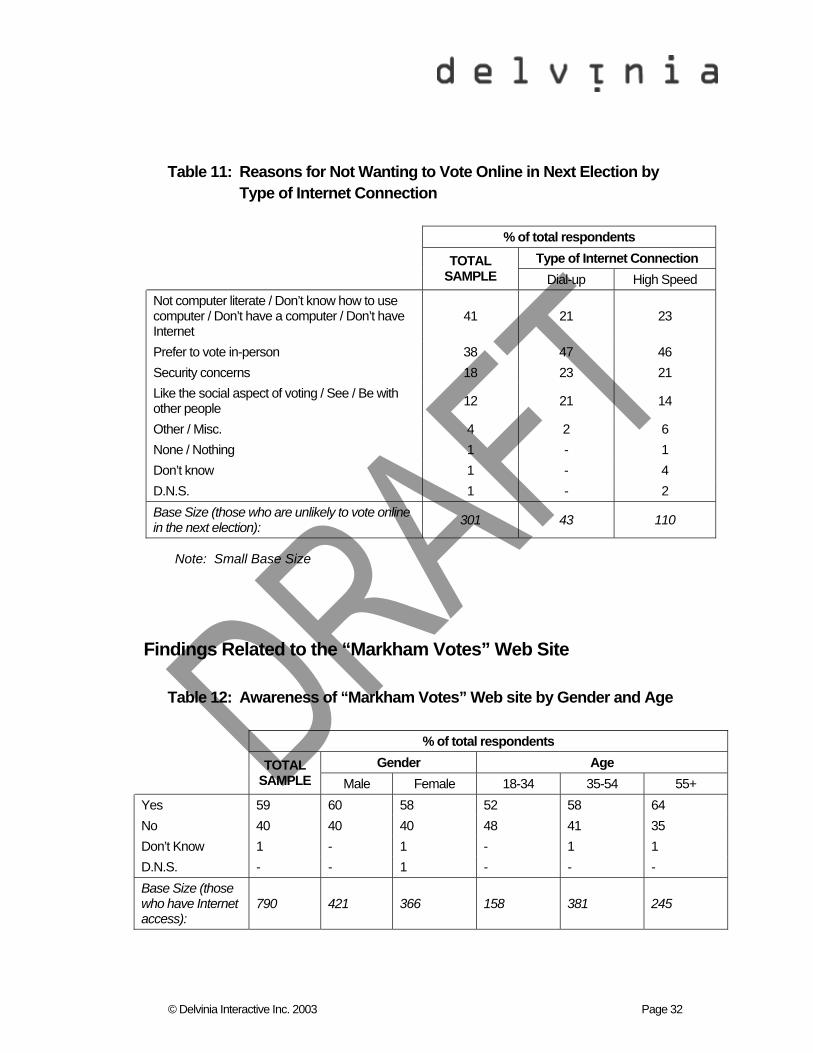
Those in-person respondents that indicated that they would not vote online in the future indicated that the primary reasons was ‘not being computer literate’ and they ‘preferred to vote in-person’
Just over four in ten (41%) who are ‘not likely’ to vote online in the next election say that it is because they are not ‘computer literate’ or do not have a computer / Internet available to them. A relatively equal proportion (38%) said that they prefer to voting in-person. This suggests that although the online option is appealing to respondents, there remains a proportion who prefer to vote in-person.
Other reasons given by respondents who are ‘not likely’ to vote online in the next Municipal election include security concerns (18%) and the social aspect of voting (12%).
Refer to Table: 10 and 11
© Delvinia Interactive Inc. 2003 Page 12
Findings Related to the “Markham Votes” Web Site:
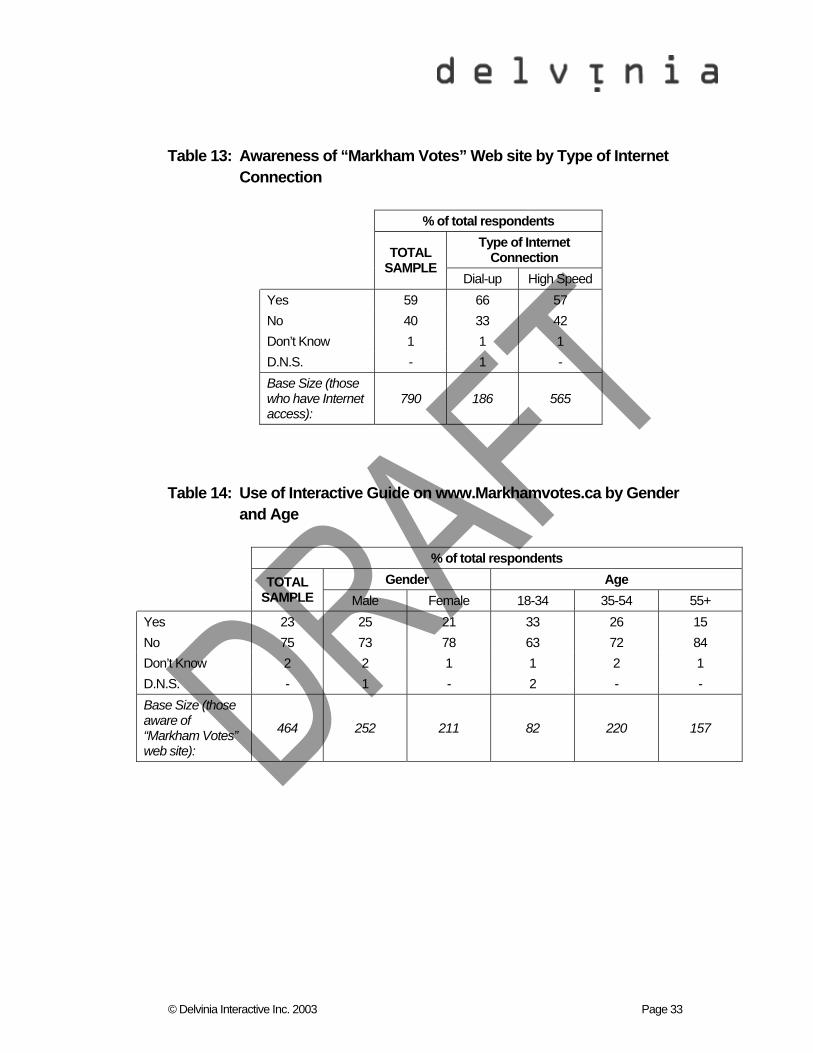
69% of in-person respondents were aware of the “Markham Votes” web site as a source of voter information
Almost six in ten respondents (59%) said that they were aware of the “Markham Votes” web site (www.Markhamvotes.ca). This proportion is consistent among both males and females.
In terms of age differences, those over the age of 35 appeared to have a higher awareness of the “Markham Votes” site than do those under the age of 35. This may tie-in with overall awareness of the online voting option, as it is higher among older respondents in the sample.
Refer to Table: 12 and 13
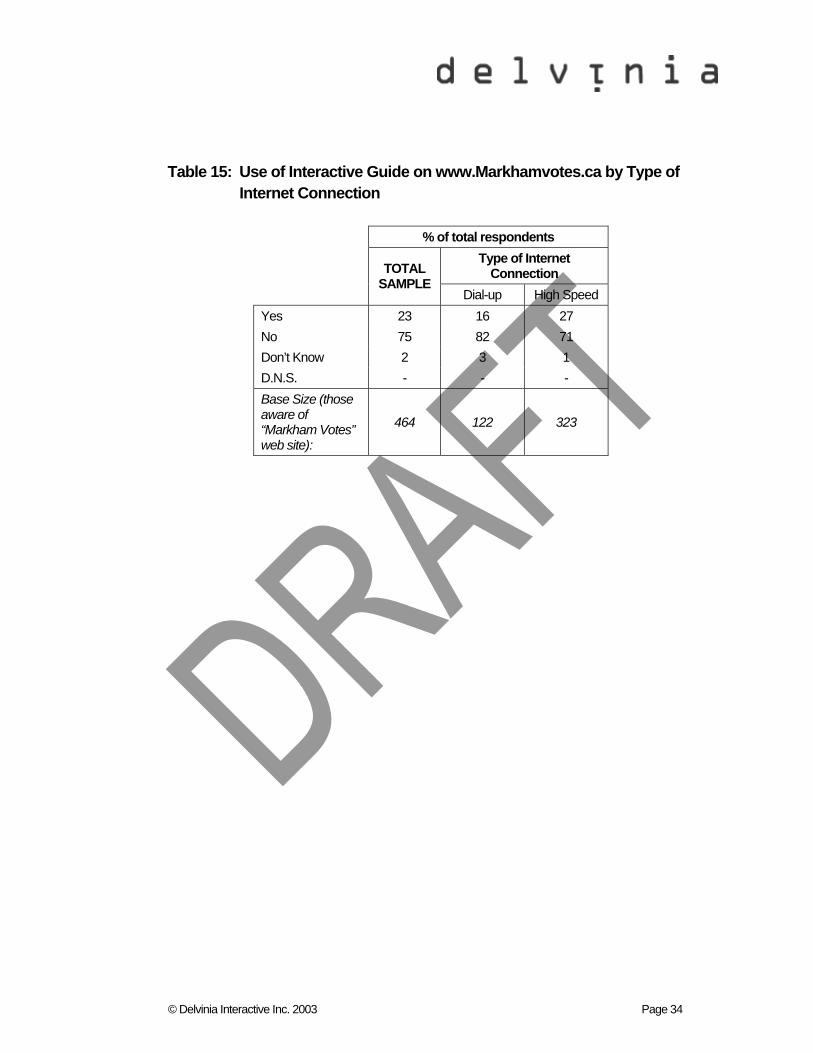
23% of in-person respondents used the Interactive Guide on the “Markham Votes” web site to obtain information about the municipal election
Among those who were aware of the “Markham Votes” web site, 23% said that they used the Interactive Guide while they were on the site. This proportion is slightly higher among males and those between ages 18 to 34.
Refer to Table: 13 and 15
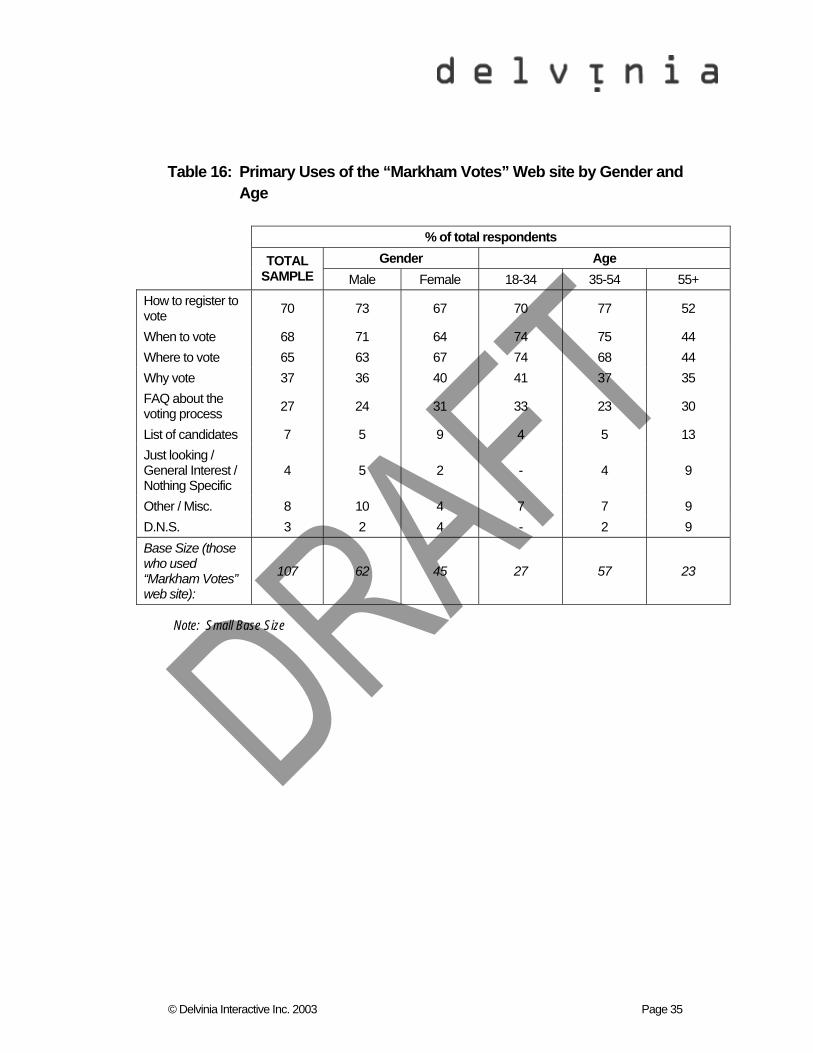
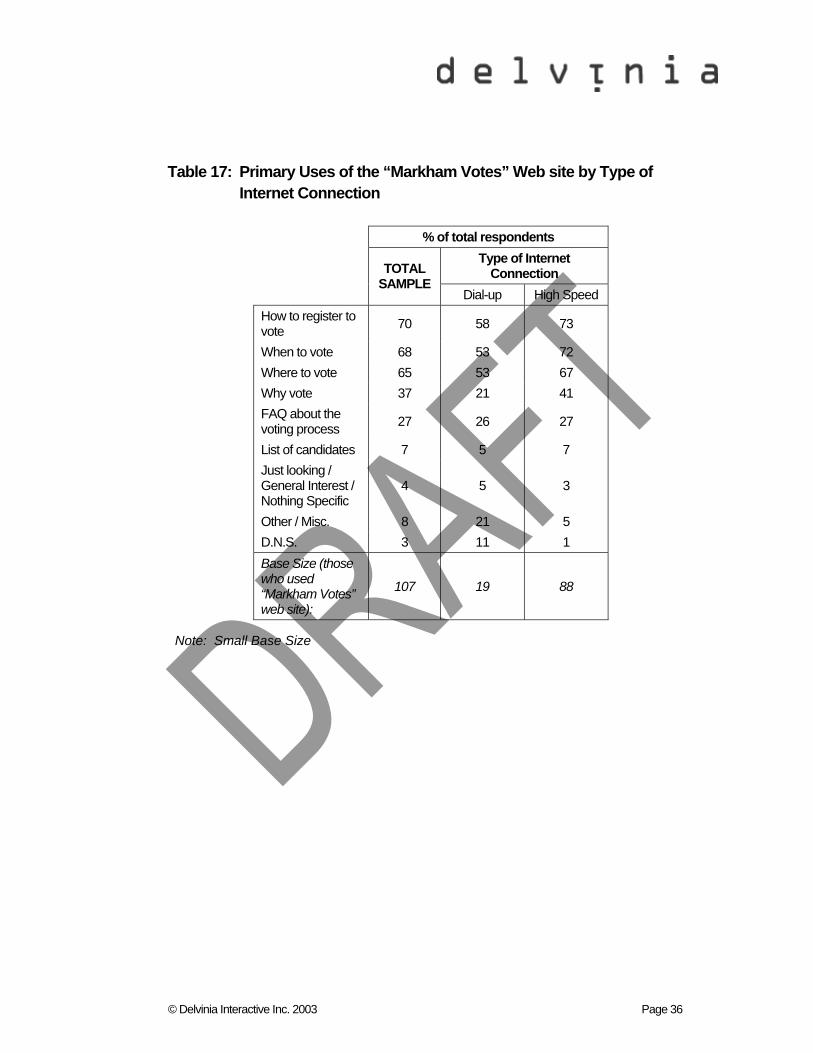
In-person respondents used the “Markham Votes” web site primarily to find out ‘how to register to vote’ (70%), ‘when to vote’ (68%), ‘where to vote’ (65%)
Respondents were also likely to use the site for the ‘Why Vote’ feature (37%) and for Frequently Asked Questions (FAQ) about the voting process (27%).
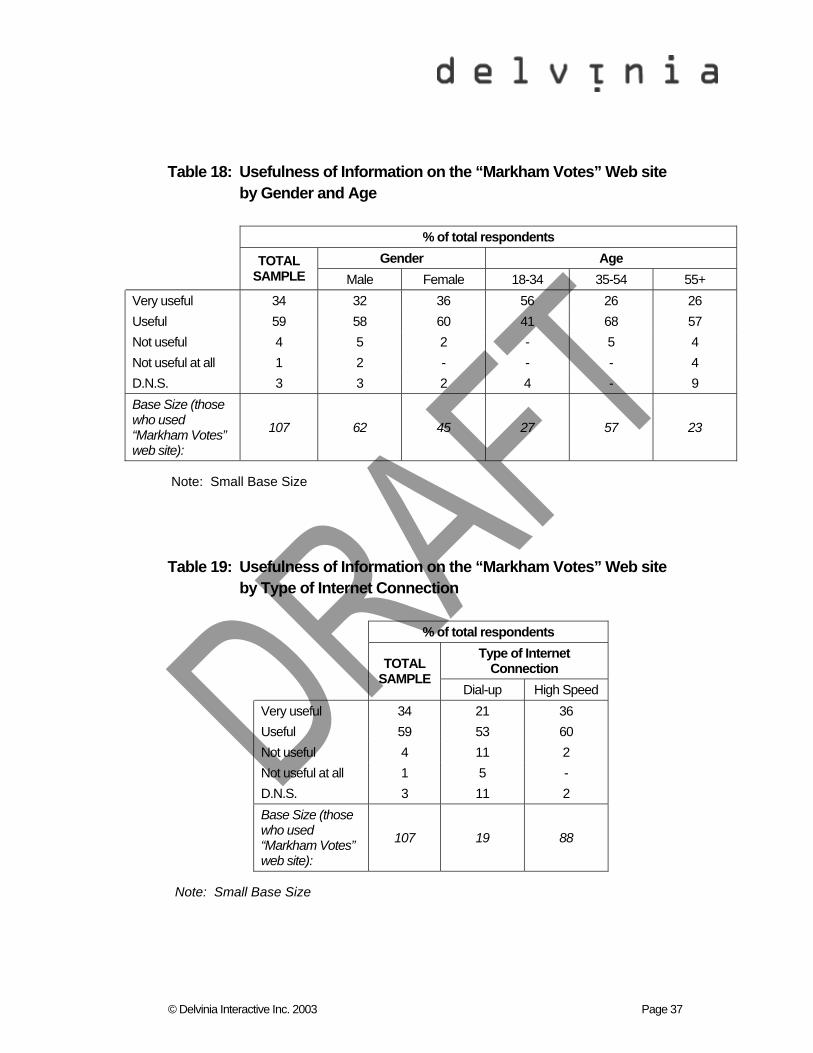
Most respondents who used the “Markham Votes” web site found the information to be ‘useful’. Specifically, 34% found the information to be ‘very useful’, while an additional 59% found the information on the “Markham Votes” web site to be ‘useful’. While there are no significant gender differences, directionally, those aged 18 to 34 are more likely than older respondents to find the information on the site to be ‘very useful’.
Refer to Table: 16, 17, 18, and 19
© Delvinia Interactive Inc. 2003 Page 13
Findings Related to the Home Computer and Internet Use:
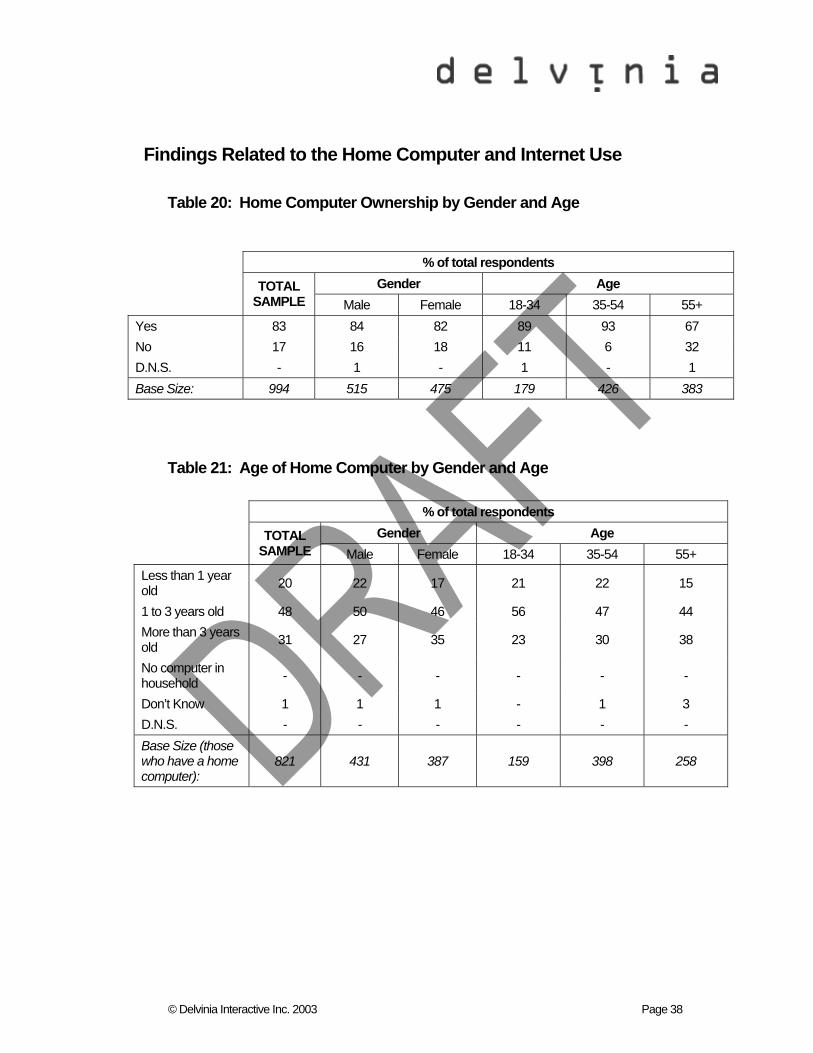
83% of in-person respondents own a home computer
Over eight in ten in-person respondents (83%) say that they have a home computer. This proportion is consistent among both males and females. In terms of age differences, those 55 and older are less likely than younger respondents to have a home computer.
Refer to Table: 20
79% of respondents have a home computer that is three years old or less
Close to eight in ten respondents (79%) have a home computer that is more than 1 year old. Almost half (48%) have a home computer that is between 1 and 3 years old, while 31% have a home computer that is 3 or more years old. Exactly 20% have a home computer that is less than 1 year old.
There are some interesting differences when looking at gender. Specifically, slightly more males than females have a home computer that is less than 1 year old, while females are more likely than males to own a home computer that is 3 or more years old. In terms of age, those 55 and older are more likely than younger respondents in the sample to own a home computer that is 3 or more years old. Conversely, those respondents between the ages of 18 and 34 are more likely to own a home computer that is 3 years old or less.
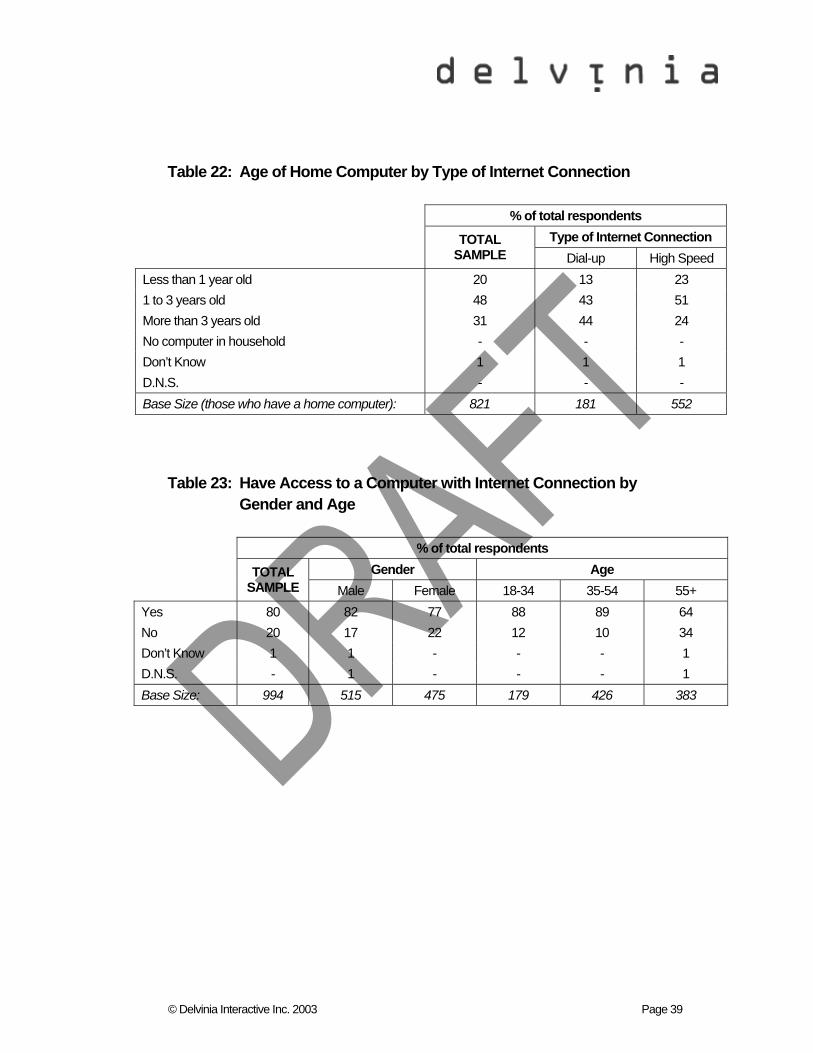
Refer to Table: 21 and 22
80% of respondents have access to a computer with an Internet connection
Exactly eight in ten respondents said that they have access to a computer with an Internet connection. Slightly more males than females said that they have Internet access, while this proportion is higher among those under 55 years of age.
Refer to Table: 23
72% of respondents have a high speed Internet connection
Close to three quarters (72%) of in-person respondents have access to a computer with a high speed Internet connection. In terms of age differences, this proportion is slightly
© Delvinia Interactive Inc. 2003 Page 14
higher among those 18 to 34, which may coincide with this group’s likelihood of owning newer home computers.
Refer to Table: 24
86% of in-person respondents use the Internet at least weekly
Over eight in ten in-person respondents (86%) use the Internet at least weekly. However, 68% said that they use the Internet daily. In terms of gender differences, males are more likely than females to say that they use the Internet daily. Moreover, those between the ages of 18 to 34 are more likely than older respondents to say that they use the Internet daily. Those over 55 years of age are likely to say that they ‘never’ use the Internet.
Refer to Table: 25 and 26
Online Survey Findings
Voters’ reactions to Internet voting was very positive overall, and the vast majority of online respondents indicated they will likely vote online in a future election if the option exists. Respondents that voted online suggested information received in the mail and through their community newspaper increased their awareness about the election. The “Markham Votes” web site received a few mentions as well. The online survey findings were:
Findings Relating to the Town of Markham Municipal Election:
25% of respondents who voted online did not vote in the 2000 municipal election
Exactly one-quarter of those who voted online in the 2003 municipal election said that they did not vote in the 2000 municipal election. This suggests that the Internet voting was effective in attracting new voters. This proportion is relatively consistent across both gender groups; however, 47% of those aged 18 to 34 make up the one-quarter of respondents who did not vote in the previous municipal election.
Refer to Table: 39 and 40

© Delvinia Interactive Inc. 2003 Page 15
86% of respondents voting online cited convenience was the primary reason for choosing the Internet voting option
Convenience appears to be the primary reason that respondents chose the online voting option. More specifically, over eight in ten (86%) said that they voted online because of the convenience of the method. Exactly three in ten said that they ‘wanted to try something new’ and this is why they decided to vote online.
In terms of age differences, those between the ages of 18 to 34 are slightly more likely than those 55 and older to say that they voted online because of the convenience of the method.
Refer to Table: 41 and 42
Most online voters found out about the 2003 municipal election from direct mail information or community newspaper
Most online voters found out about this year’s election through information received in the mail or their community newspaper. Posters and the candidates themselves were also used as sources of information on the election.
Some online voters found out about this year’s election through the “Markham Votes” web site.
In terms of age differences, those between the ages of 18 and 34 were less likely to find out about the election through a community newspaper or the candidates themselves compared to those 35 and older.
Refer to Table: 43 and 44
99% of online voters were satisfied overall with the online voting process
Overall, online voters were very satisfied with the online voting process. Specifically, over three-quarters (78%) were ‘very satisfied’ with the process, while an additional 21% were ‘satisfied’ with the online voting process. Only 1% of the sample reported ‘not being satisfied’. This suggests that the online voting process was a good experience for respondents, validated their primary reason for choosing to vote online – convenience.
Refer to Table: 45 and 46
© Delvinia Interactive Inc. 2003 Page 16
100% of online respondents are likely to vote online in future elections
All respondents are ‘likely’ to vote online in a future election, with over nine in ten (93%) saying that they would be ‘very likely’ to vote online in a future election. This proportion is consistent across both gender and age breaks.
Refer to Table: 47 and 48
79% of online respondents voted online from their home computer
Most respondents who voted online in this year’s election voted online from home. Specifically, close to eight in ten (79%) voted from home, while 13% voted from the office. These results are relatively consistent across gender and age groups, although those who are 18 to 34 are more likely to have voted online while they were out-of-town or on vacation.
Refer to Table: 49 and 50
Findings Related to the “Markham Votes” Web Site:
28% of respondents used the Interactive Guide on the “Markham Votes” web site
Just over one-quarter (28%) used the Interactive Guide on the “Markham Votes” web site before or during the election period. In terms of gender differences, slightly more males than females said that they used the Interactive Guide. There are no significant differences by age group.
Refer to Table: 51 and 52
70% of online respondents used the Interactive Guide to find out how to register to vote
Among those who visited the “Markham Votes” web site and used the Interactive Guide, the primary uses were to obtain information on ‘How to register to vote’ and ‘When to vote’. Specifically, seven in ten respondents used the Interactive Guide to find out how to register to vote and 53% used it to find out when to vote.
Refer to Table: 53 and 54

© Delvinia Interactive Inc. 2003 Page 17
96% found the information on the “Markham Votes” web site to be useful
Among those who used the Interactive Guide on the “Markham Votes” web site, most found the information on the site and in the Guide to be ‘useful’. Specifically, 52% found the information to be ‘very useful’, while 44% found it to be ‘useful’. Only 4% of respondents found the information to be not useful to them.
There are no significant differences by gender. In terms of age, older respondents in the sample (55 and older) are more likely to consider the information on the “Markham Votes” web site to be ‘very useful’.
Refer to Table: 55 and 56
99% of online respondents would find the “Markham Votes” web site to be helpful for future elections
Most respondents who visited the “Markham Votes” web site and used the Interactive Guide would find the site to be ‘helpful’ for future elections. Specifically, over six in ten (63%) said it would be ‘very helpful’ and 36% said they it would be ‘helpful’.
There are no significant differences by gender. In terms of age, older respondents (55 and older) are more likely than those under 55 to find the site to be ‘very helpful’ for future elections.
Refer to Table: 57 and 58
Findings Related to the Town of Markham Telephone Voter Information Line:
Only 8% of online respondents used the town of Markham voter telephone information line
Fewer than one in ten respondents (8%) used the voter information line offered by the Town of Markham. There are no significant differences by gender or age group.
Over nine in ten who used the voter information line offered by the Town of Markham were ‘satisfied’ with the service provided. In terms of age differences, older respondents (those 55 and older) are more likely than those under 54 years of age to be ‘very satisfied’ with the service provided by the voter information line.
Refer to Tables 61, 62
© Delvinia Interactive Inc. 2003 Page 18
Comparison of In-Person and Online Surveys
Of 3,455 online voters and nearly 1,000 in-person voters surveyed, the vast majority of respondents indicated they will likely vote online in a future election if the option is available. The findings indicated that online voters tended to be younger, had a stronger educational background and a higher household income.
In order to obtain a detailed picture of the factors influencing or deterring voters from voting online, comparative data was analyzed from four perspectives; the municipal election, the “Markham Votes” web site, home computer and Internet use and demographic profile. The comparative findings of in-person and online surveys were:
Findings Related to the Town of Markham Municipal Election:
Internet voting attracted more of those who did not vote in the previous municipal election
More who voted online in 2003 election indicated they did not vote in the 2000 election. As the online voting method was the first voting method 25% of online respondents were exposed to since the previous election and the overall reaction was positive, which bodes well for continued future use of the method. The results also suggest that the online voting method may have acted as a ‘driver’ for people to vote.
Refer to Table: 77
Online and in-person voters tended to use different sources of information to learn about the 2003 municipal election
Most online voters found out about this year’s election through information received in the mail or their community newspaper. In-person voters, on the other hand, were more likely to find out about this year’s election through information received from the ‘media’ (encompassing television and radio). In-person voters also found out about this year’s election through information received in their community newspaper, albeit to a slightly lesser degree than online voters. However, posters and the candidates’ canvassing were equally effective methods of building awareness about the 2003 municipal election for both voting groups.
Refer to Table: 78

© Delvinia Interactive Inc. 2003 Page 19
A significant proportion of online and in-person respondents indicated they are likely to vote online in future election if the option is available
All online respondents are ‘likely’ to vote online in a future election, with over nine in ten (93%) saying that they would be ‘very likely’ to vote online in a future election. Almost seven in ten (69%) of in-person respondents said that they would be ‘likely’ to vote online in a future election, with over four in ten (42%) saying that they would be ‘very likely’ to do so.
These results are very promising for the future of online voting, as all who used the method are all likely to do so again, as well, a significant proportion of voters who used the ‘traditional’ method are likely to try it out in a future election. This suggests that future uptake of the method will be significant.
Refer to Table: 79
Findings Related to the “Markham Votes” Web site:
The Interactive Guide on the “Markham Votes” web site was used consistently between the two voting groups surveyed
A relatively equal proportion of in-person and online voters (23% and 28%, respectively) used the Interactive Guide on the “Markham Votes” web site before or during the election period.
Refer to Table: 80
Both in-person and online voters used the Interactive Guide did so to find out how to register to vote
Among both in-person and online voters who visited the “Markham Votes” web site and used the Interactive Guide, the primary uses were to obtain information on ‘How to register to vote’ and ‘When to vote’. Interestingly, in-person voters who used the Interactive Guide tended to use it to find out more election information than those who voted online. For instance, more in-person voters used the site to find out where they could vote and why they should vote.
Refer to Table: 81
© Delvinia Interactive Inc. 2003 Page 20
Both in-person and online voters found the information on the “Markham Votes” web site to be useful
Among both in-person and online voters who used the Interactive Guide on the “Markham Votes” web site, most found the information on the site and in the Guide to be ‘useful’ overall. Online voters were slightly more likely to find the information contained on the site and in the Guide to be ‘very useful’ (52% vs. 34% of in-person voters), however, usefulness scores overall are consistent.
This indicates that the information on the site and in the Guide was what voters expected and it helped them during the election period.
Refer to Table: 82
Comparison of In-Person and Online Survey Respondents:
The type of Internet connection was relatively consistent among in-person and online voters
In-person voters are slightly more likely than online voters to have a dial-up Internet connection; however, the majority of both in-person and online voters have a high speed or broadband connection.
Refer to Table: 83
Frequency of Internet use differs among in-person and online voters
Those who voted online are more likely than those who voted in-person to use the Internet on a daily basis. In-person voters are more likely to say that they use the Internet on a weekly or monthly basis.
Refer to Table: 84
Overall, the gender breakdown was consistent for both voting methods
The gender breakdown is consistent for both voting methods, with males slightly more likely to have voted in the 2003 Markham Municipal election.
Refer to Table: 85

© Delvinia Interactive Inc. 2003 Page 21
Ages of the online voters skews slightly younger
When comparing the age ranges of both in-person and online voters, those who voted online tend to skew slightly younger. However, it is interesting to note that 27% of those who voted online were 55 years of age or older.
Refer to Table: 86
Overall, marital status was consistent for both voting methods
Marital status is consistent for both voting methods, with no significant differences to report.
Refer to Table: 87
Those who voted online tended to be more highly educated
In terms of education levels achieved, those who voted online tend to have a slightly higher level of education than those who voted in-person.
Refer to Table: 88
Those who voted online tend to have higher income levels
Those who voted online in the 2003 Markham Municipal election tend to have higher education levels than those who voted in-person.
Refer to Table: 89
© Delvinia Interactive Inc. 2003 Page 22
Examining the Success of Internet Voting
As the survey findings suggest, reaction to Internet voting was extremely positive from both those who voted online and those who voted in-person. While Internet voting accounted for an impressive 17% of the overall voter turnout, it did not contribute to increasing voter turnout in the Town of Markham. Given the overwhelmingly positive survey findings, it was worthwhile to examine the factors specifically relating to all major municipalities across Ontario (populations exceeding 100,000) and the Town of Markham’s implementation of Internet voting, prior to making any final conclusions.
Municipal elections, unlike their provincial and federal counterparts, experience historically low voter turnout, ranging from 28 to 32%. Although municipal elections are held consistently every three years in Ontario, it is interesting to note that there was an average decline of 2.57% in voter turnout across major Ontario municipalities since the last election (see Appendix E). This decline may be attributed to the “voter burnout” caused by the municipal and provincial elections running only 4 weeks apart in 2003.
On a municipal level, other factors which can negatively impact voter turnout include, the unpredictability of the weather on election day (although weather was not a factor in either the 2000 or 2003 municipal elections in Ontario) and the lack of a mayoral race. In fact, across Ontario, where an incumbent mayor won the election, there was an average decline of 3.84% in voter turnout. More specifically, when the incumbent mayor won by more than 50% of the vote, over their nearest competitor, the average decline increased to 5.72% (see Appendix E). In the Town of Markham, long-standing Mayor, Don Cousens, won with 80% of the overall vote and a spread of 65% over his nearest competitor.
The Town of Markham experienced only a 1.5% decline in overall voter turnout, which is well above the average decline for major Ontario municipalities where an incumbent mayor won the election without competition. This points to the conclusion that without the success of Internet voting during advanced polls, the Town of Markham’s voter turnout may have been significantly less.
While this may address how Internet voting helped to reduce the decline in overall voter turnout, it does not answer why more people did not register and that approximately 40% of those who had registered for Internet voting did not vote online.

© Delvinia Interactive Inc. 2003 Page 23
A new and necessary two-step voter registration process was introduced for the Internet voting method in order to ensure voter authenticity and security. Although the authentication process was well-communicated, the in-person survey findings indicated that meeting the various deadlines associated with Internet voting was the major reason for not voting online. This offers a possible explanation why the total number of online voters fell short of expectations.

© Delvinia Interactive Inc. 2003 Page 24
Final Conclusions Based upon the survey findings and the examination of the success of Internet voting, the following conclusions can be drawn.
• It is reasonable to conclude that Internet voting can be an effective solution for attracting people who did not previously vote in a municipal election
• The convenience of Internet voting as an alternative voting method makes it easier to cast ballots and allow the electoral process to better fit in with changing lifestyles and for those facing accessibility issues
• Voter authenticity and security are not significant concerns among survey respondents indicating the voters are ready to participate in e-democracy driven primarily by convenience
• Given the high penetration of Internet access from home, combined with the fact that 100% of online respondents would use Internet voting in the future, the Town of Markham introduced Internet voting at the appropriate time
• As people become more familiar with Internet voting and municipalities are prepared to adequately invest in voter outreach and education, an increase in voter turnout will be seen and potential cost savings can then be realized
• Internet voting should not be expected to be a cure to voter apathy or a replacement to traditional voting methods, rather should be viewed as part of a multi-channel voting solution
While the pioneering efforts of the Town of Markham did not contribute to an overall increase in voter turnout, the Internet cannot be overlooked as a legitimate and effective channel for future municipal elections. It can be concluded from this study that Internet voting has significant potential to increase voter participation and add value to the electoral process. The Town of Markham should be applauded for its leadership, vision and for its contribution to the advancement of e-democracy.
© Delvinia Interactive Inc. 2003 Page 25
Appendix A – Detailed Findings: In-Person Survey
Of nearly 1,000 in-person voters surveyed, the vast majority of respondents indicated they will likely vote online in a future election.
In order to gain better insight into factors influencing or deterring voters from voting online, data was analyzed from various motivating factors as they relate to; the Markham municipal election, the “Markham Votes” web site and home computer and Internet use.
Findings Related to the Markham Municipal Election
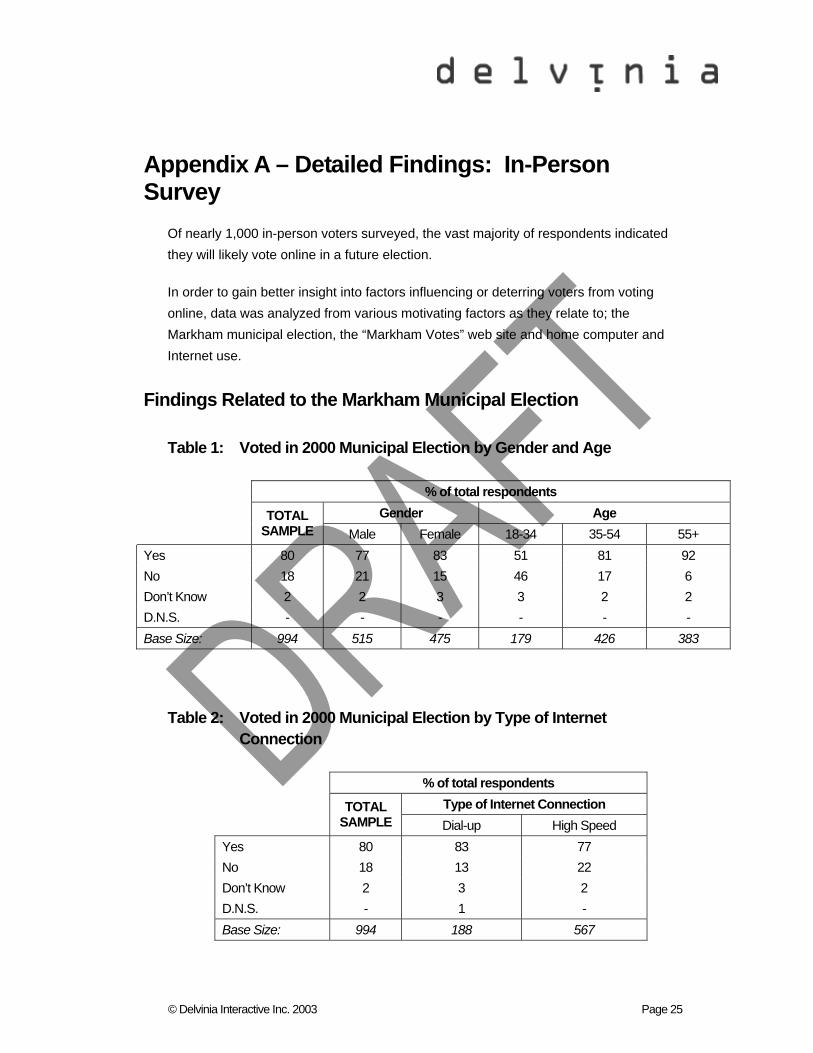
Table 1: Voted in 2000 Municipal Election by Gender and Age
% of total respondents Gender Age
TOTAL
SAMPLE Male Female 18-34 35-54 55+ Yes 80 77 83 51 81 92 No 18 21 15 46 17 6 Don’t Know 2 2 3 3 2 2 D.N.S. - - - - - - Base Size: 994 515 475 179 426 383
Table 2: Voted in 2000 Municipal Election by Type of Internet Connection
% of total respondents Type of Internet Connection
TOTAL SAMPLE Dial-up High Speed
Yes 80 83 77 No 18 13 22 Don’t Know 2 3 2 D.N.S. - 1 - Base Size: 994 188 567
© Delvinia Interactive Inc. 2003 Page 26
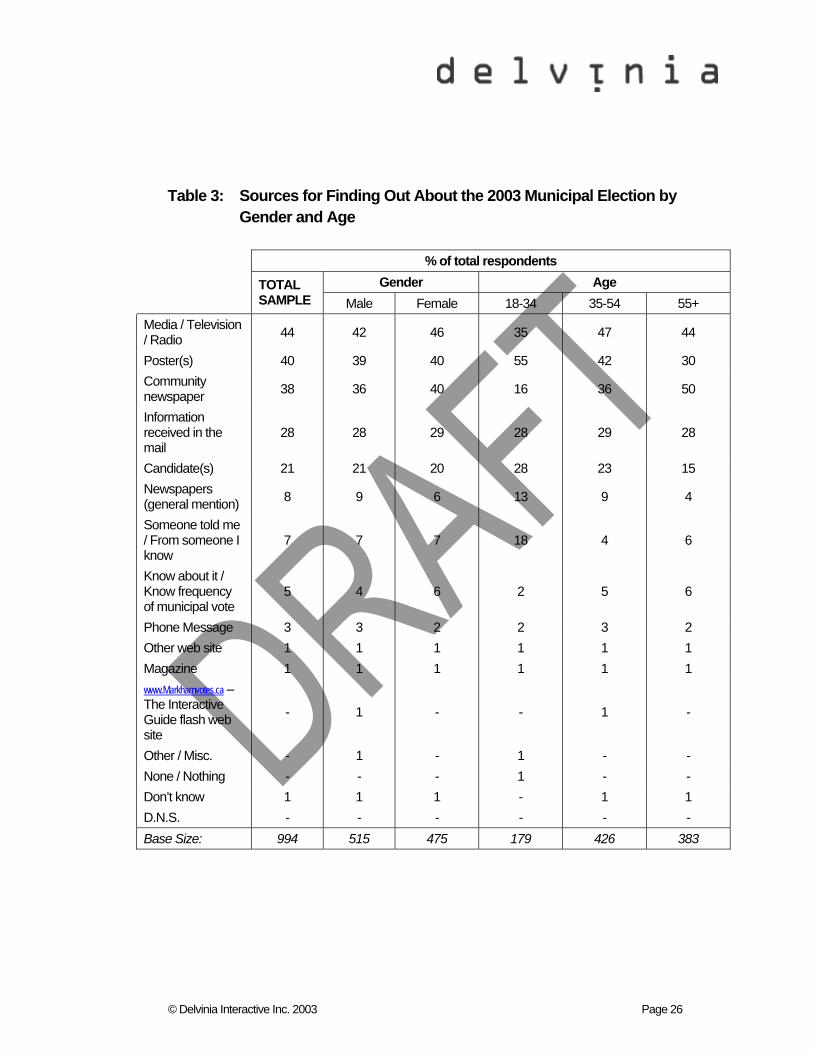
Table 3: Sources for Finding Out About the 2003 Municipal Election by Gender and Age
% of total respondents Gender Age
TOTAL SAMPLE Male Female 18-34 35-54 55+
Media / Television / Radio 44 42 46 35 47 44
Poster(s) 40 39 40 55 42 30 Community newspaper 38 36 40 16 36 50
Information received in the mail
28 28 29 28 29 28
Candidate(s) 21 21 20 28 23 15 Newspapers (general mention) 8 9 6 13 9 4
Someone told me / From someone I know
7 7 7 18 4 6
Know about it / Know frequency of municipal vote
5 4 6 2 5 6
Phone Message 3 3 2 2 3 2 Other web site 1 1 1 1 1 1 Magazine 1 1 1 1 1 1 www.Markhamvotes.ca – The Interactive Guide flash web site
- 1 - - 1 -
Other / Misc. - 1 - 1 - - None / Nothing - - - 1 - - Don’t know 1 1 1 - 1 1 D.N.S. - - - - - - Base Size: 994 515 475 179 426 383
© Delvinia Interactive Inc. 2003 Page 27
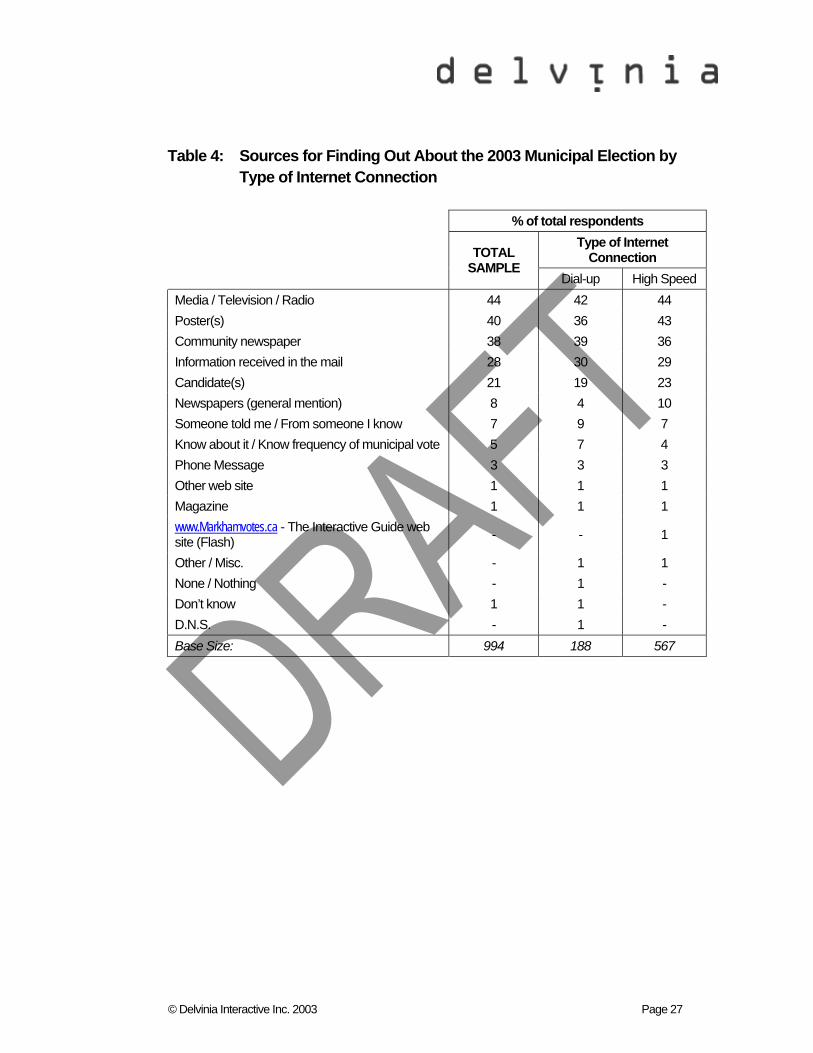
Table 4: Sources for Finding Out About the 2003 Municipal Election by Type of Internet Connection
% of total respondents Type of Internet
Connection
TOTAL SAMPLE
Dial-up High Speed Media / Television / Radio 44 42 44 Poster(s) 40 36 43 Community newspaper 38 39 36 Information received in the mail 28 30 29 Candidate(s) 21 19 23 Newspapers (general mention) 8 4 10 Someone told me / From someone I know 7 9 7 Know about it / Know frequency of municipal vote 5 7 4 Phone Message 3 3 3 Other web site 1 1 1 Magazine 1 1 1 www.Markhamvotes.ca - The Interactive Guide web site (Flash) - - 1
Other / Misc. - 1 1 None / Nothing - 1 - Don’t know 1 1 - D.N.S. - 1 - Base Size: 994 188 567
© Delvinia Interactive Inc. 2003 Page 28
Table 5: Awareness of Online Voting Option for 2003 Municipal Election by Gender and Age
% of total respondents Gender Age
TOTAL SAMPLE Male Female 18-34 35-54 55+
Yes 83 82 84 73 85 85 No 17 18 16 27 15 15 Don’t Know - - - 1 - - D.N.S. - - - - - - Base Size: 994 515 475 179 426 383
Table 6: Awareness of Online Voting Option for 2003 Municipal Election by Type of Internet Connection
% of total respondents Type of Internet
Connection
TOTAL SAMPLE
Dial-up High Speed Yes 83 90 85 No 17 10 16 Don’t Know - - - D.N.S. - - - Base Size: 994 188 567
© Delvinia Interactive Inc. 2003 Page 29
Table 7: Reasons for Not Voting Online by Gender and Age
% of total respondents Gender Age
TOTAL SAMPLE Male Female 18-34 35-54 55+
I missed the registration deadline(s) 33 34 32 33 34 32 Wanted to vote in-person / Had never voted before / Like social aspect of voting / Being with other people
11 11 12 9 11 14
Don’t trust / security concerns 9 8 9 9 10 7 I forgot 9 11 8 11 9 9 Limited / no experience using the Internet 8 7 9 3 7 12 Didn’t know about online voting / Not aware of online voting 7 6 7 16 4 5
Less trouble / Easier to vote in-person / Convenient location 7 6 7 6 7 5
Did not understand the online voting process 4 5 3 3 5 3
Time limitations / Didn’t have the time / On vacation 4 3 4 1 5 2
Technical problems 3 3 3 1 4 3 Other / Misc. 3 3 3 1 3 3 Don’t have a computer / Internet 2 2 3 2 1 3 Don’t know 2 2 2 3 1 3 Needed to take other people to vote 1 1 1 4 - - None / Nothing 1 1 2 1 2 - D.N.S. 1 - 1 - 1 - Base Size (those who have Internet access): 790 421 366 158 381 245
© Delvinia Interactive Inc. 2003 Page 30
Table 8: Likelihood of Voting Online in Next Municipal Election by Gender and Age
% of total respondents Gender Age
TOTAL SAMPLE Male Female 18-34 35-54 55+
Very likely 42 46 38 53 48 30 Likely 27 26 28 31 30 22 Not likely 12 9 16 8 10 17 Not likely at all 18 18 18 7 12 30 D.N.S. 1 1 1 2 1 2 Base Size: 994 515 475 179 426 383
Table 9: Likelihood of Voting Online in Next Municipal Election by Type of Internet Connection
% of total respondents Type of Internet
Connection
TOTAL SAMPLE
Dial-up High Speed Very likely 42 48 51 Likely 27 29 29 Not likely 12 9 10 Not likely at all 18 14 10 D.N.S. 1 - 1 Base Size: 994 188 567
© Delvinia Interactive Inc. 2003 Page 31
Table 10: Reasons for Not Wanting to Vote Online in Next Election by Gender and Age
% of total respondents Gender Age
TOTAL SAMPLE Male Female 18-34 35-54 55+
Not computer literate / Don’t know how to use computer / Don’t have a computer / Don’t have Internet
41 39 43 39 20 53
Prefer to vote in-person 38 39 37 27 51 32
Security concerns 18 20 16 19 28 13 Like the social aspect of voting / See / Be with other people
12 13 11 19 13 10
Other / Misc. 4 4 4 8 5 2 None / Nothing 1 1 1 4 - 1 Don’t know 1 1 2 - 3 1 Base Size (those who are unlikely to vote online in the next election):
301 141 159 26 93 180
Note: Small Base Size
© Delvinia Interactive Inc. 2003 Page 32
Table 11: Reasons for Not Wanting to Vote Online in Next Election by Type of Internet Connection
% of total respondents Type of Internet Connection
TOTAL SAMPLE Dial-up High Speed
Not computer literate / Don’t know how to use computer / Don’t have a computer / Don’t have Internet
41 21 23
Prefer to vote in-person 38 47 46 Security concerns 18 23 21 Like the social aspect of voting / See / Be with other people 12 21 14
Other / Misc. 4 2 6 None / Nothing 1 - 1 Don’t know 1 - 4 D.N.S. 1 - 2 Base Size (those who are unlikely to vote online in the next election): 301 43 110
Note: Small Base Size
Findings Related to the “Markham Votes” Web Site
Table 12: Awareness of “Markham Votes” Web site by Gender and Age
% of total respondents Gender Age
TOTAL SAMPLE Male Female 18-34 35-54 55+
Yes 59 60 58 52 58 64 No 40 40 40 48 41 35 Don’t Know 1 - 1 - 1 1 D.N.S. - - 1 - - - Base Size (those who have Internet access):
790 421 366 158 381 245
© Delvinia Interactive Inc. 2003 Page 33
Table 13: Awareness of “Markham Votes” Web site by Type of Internet Connection
% of total respondents Type of Internet
Connection
TOTAL SAMPLE
Dial-up High Speed Yes 59 66 57 No 40 33 42 Don’t Know 1 1 1 D.N.S. - 1 - Base Size (those who have Internet access):
790 186 565
Table 14: Use of Interactive Guide on www.Markhamvotes.ca by Gender and Age
% of total respondents Gender Age
TOTAL SAMPLE Male Female 18-34 35-54 55+
Yes 23 25 21 33 26 15 No 75 73 78 63 72 84 Don’t Know 2 2 1 1 2 1 D.N.S. - 1 - 2 - - Base Size (those aware of “Markham Votes” web site):
464 252 211 82 220 157
© Delvinia Interactive Inc. 2003 Page 34
Table 15: Use of Interactive Guide on www.Markhamvotes.ca by Type of Internet Connection
% of total respondents Type of Internet
Connection
TOTAL SAMPLE
Dial-up High Speed Yes 23 16 27 No 75 82 71 Don’t Know 2 3 1 D.N.S. - - - Base Size (those aware of “Markham Votes” web site):
464 122 323
© Delvinia Interactive Inc. 2003 Page 35
Table 16: Primary Uses of the “Markham Votes” Web site by Gender and Age
% of total respondents Gender Age
TOTAL SAMPLE Male Female 18-34 35-54 55+
How to register to vote 70 73 67 70 77 52
When to vote 68 71 64 74 75 44 Where to vote 65 63 67 74 68 44 Why vote 37 36 40 41 37 35 FAQ about the voting process 27 24 31 33 23 30
List of candidates 7 5 9 4 5 13 Just looking / General Interest / Nothing Specific
4 5 2 - 4 9
Other / Misc. 8 10 4 7 7 9 D.N.S. 3 2 4 - 2 9 Base Size (those who used “Markham Votes” web site):
107 62 45 27 57 23
Note: Small Base Size
© Delvinia Interactive Inc. 2003 Page 36
Table 17: Primary Uses of the “Markham Votes” Web site by Type of Internet Connection
% of total respondents Type of Internet
Connection
TOTAL SAMPLE
Dial-up High Speed How to register to vote 70 58 73
When to vote 68 53 72 Where to vote 65 53 67 Why vote 37 21 41 FAQ about the voting process 27 26 27
List of candidates 7 5 7 Just looking / General Interest / Nothing Specific
4 5 3
Other / Misc. 8 21 5 D.N.S. 3 11 1 Base Size (those who used “Markham Votes” web site):
107 19 88
Note: Small Base Size
© Delvinia Interactive Inc. 2003 Page 37
Table 18: Usefulness of Information on the “Markham Votes” Web site by Gender and Age
% of total respondents Gender Age
TOTAL SAMPLE Male Female 18-34 35-54 55+
Very useful 34 32 36 56 26 26 Useful 59 58 60 41 68 57 Not useful 4 5 2 - 5 4 Not useful at all 1 2 - - - 4 D.N.S. 3 3 2 4 - 9 Base Size (those who used “Markham Votes” web site):
107 62 45 27 57 23
Note: Small Base Size
Table 19: Usefulness of Information on the “Markham Votes” Web site by Type of Internet Connection
% of total respondents Type of Internet
Connection
TOTAL SAMPLE
Dial-up High Speed Very useful 34 21 36 Useful 59 53 60 Not useful 4 11 2 Not useful at all 1 5 - D.N.S. 3 11 2 Base Size (those who used “Markham Votes” web site):
107 19 88
Note: Small Base Size
© Delvinia Interactive Inc. 2003 Page 38
Findings Related to the Home Computer and Internet Use
Table 20: Home Computer Ownership by Gender and Age
% of total respondents Gender Age
TOTAL SAMPLE Male Female 18-34 35-54 55+
Yes 83 84 82 89 93 67 No 17 16 18 11 6 32 D.N.S. - 1 - 1 - 1 Base Size: 994 515 475 179 426 383
Table 21: Age of Home Computer by Gender and Age
% of total respondents Gender Age
TOTAL SAMPLE Male Female 18-34 35-54 55+
Less than 1 year old 20 22 17 21 22 15
1 to 3 years old 48 50 46 56 47 44 More than 3 years old 31 27 35 23 30 38
No computer in household - - - - - -
Don’t Know 1 1 1 - 1 3 D.N.S. - - - - - - Base Size (those who have a home computer):
821 431 387 159 398 258
© Delvinia Interactive Inc. 2003 Page 39
Table 22: Age of Home Computer by Type of Internet Connection
% of total respondents Type of Internet Connection
TOTAL SAMPLE Dial-up High Speed
Less than 1 year old 20 13 23 1 to 3 years old 48 43 51 More than 3 years old 31 44 24 No computer in household - - - Don’t Know 1 1 1 D.N.S. - - - Base Size (those who have a home computer): 821 181 552
Table 23: Have Access to a Computer with Internet Connection by Gender and Age
% of total respondents Gender Age
TOTAL SAMPLE Male Female 18-34 35-54 55+
Yes 80 82 77 88 89 64 No 20 17 22 12 10 34 Don’t Know 1 1 - - - 1 D.N.S. - 1 - - - 1 Base Size: 994 515 475 179 426 383
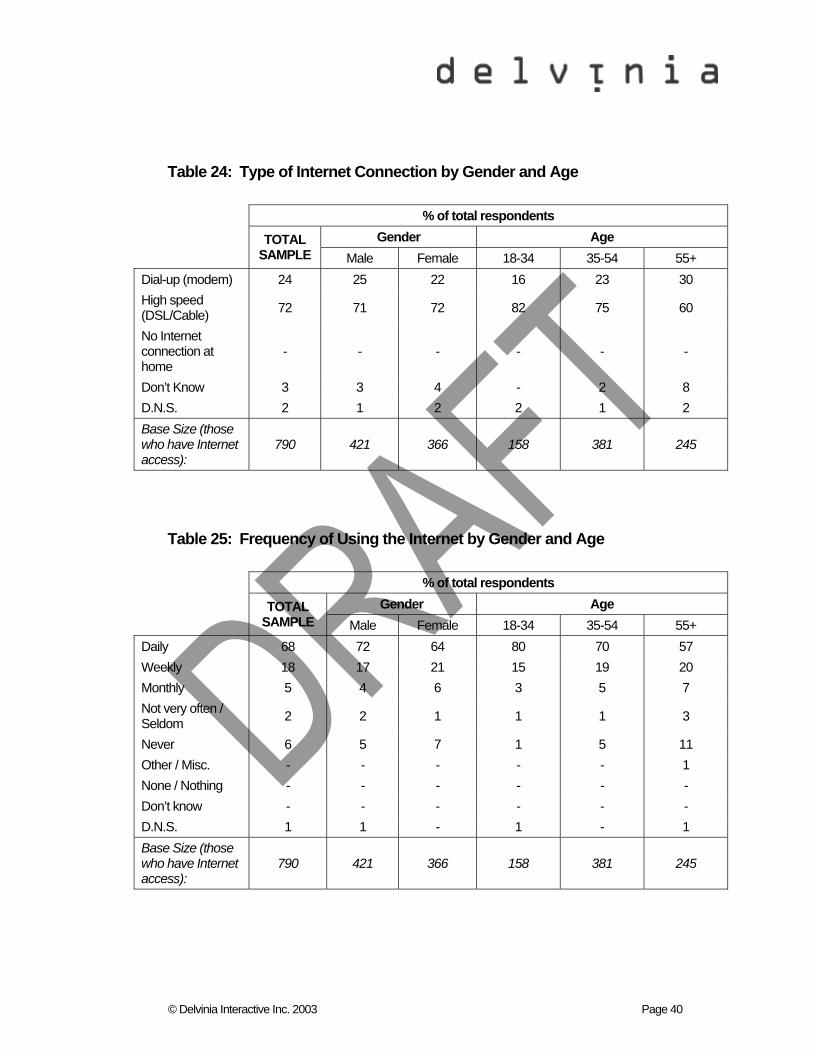
© Delvinia Interactive Inc. 2003 Page 40
Table 24: Type of Internet Connection by Gender and Age
% of total respondents Gender Age
TOTAL SAMPLE Male Female 18-34 35-54 55+
Dial-up (modem) 24 25 22 16 23 30 High speed (DSL/Cable) 72 71 72 82 75 60
No Internet connection at home
- - - - - -
Don’t Know 3 3 4 - 2 8 D.N.S. 2 1 2 2 1 2 Base Size (those who have Internet access):
790 421 366 158 381 245
Table 25: Frequency of Using the Internet by Gender and Age
% of total respondents Gender Age
TOTAL SAMPLE Male Female 18-34 35-54 55+
Daily 68 72 64 80 70 57 Weekly 18 17 21 15 19 20 Monthly 5 4 6 3 5 7 Not very often / Seldom 2 2 1 1 1 3
Never 6 5 7 1 5 11 Other / Misc. - - - - - 1 None / Nothing - - - - - - Don’t know - - - - - - D.N.S. 1 1 - 1 - 1 Base Size (those who have Internet access):
790 421 366 158 381 245
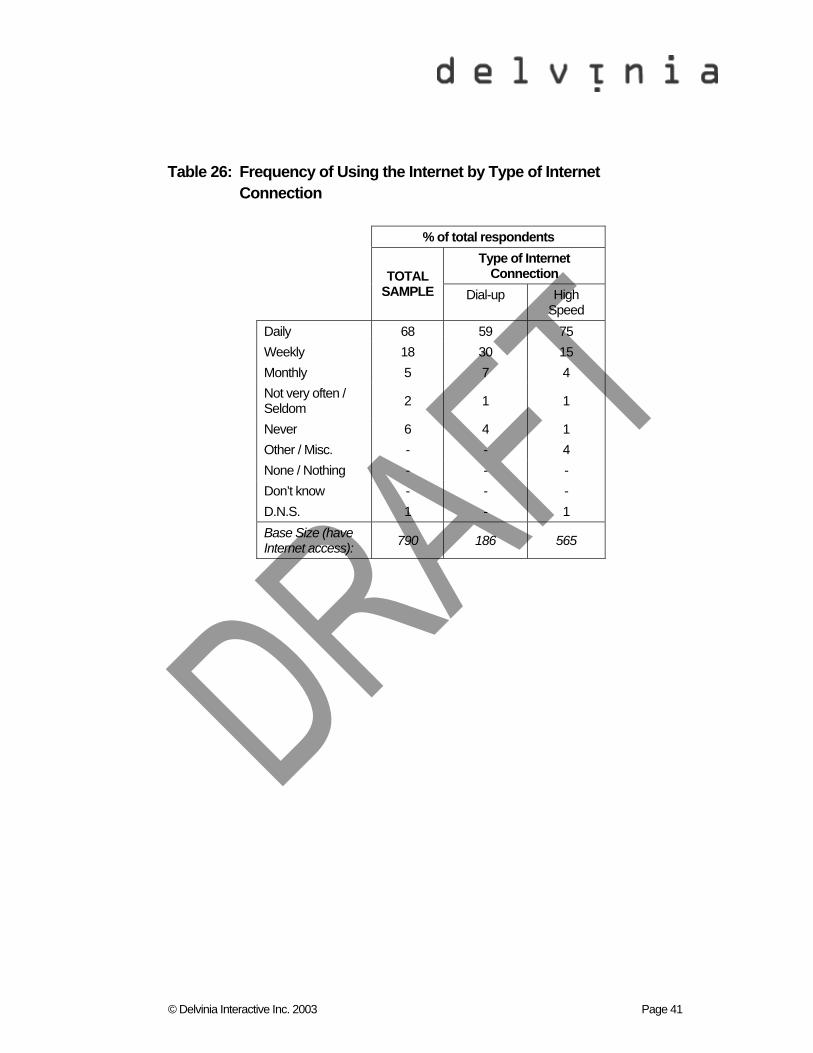
© Delvinia Interactive Inc. 2003 Page 41
Table 26: Frequency of Using the Internet by Type of Internet Connection
% of total respondents Type of Internet
Connection
TOTAL SAMPLE Dial-up High
Speed Daily 68 59 75 Weekly 18 30 15 Monthly 5 7 4 Not very often / Seldom 2 1 1
Never 6 4 1 Other / Misc. - - 4 None / Nothing - - - Don’t know - - - D.N.S. 1 - 1 Base Size (have Internet access): 790 186 565
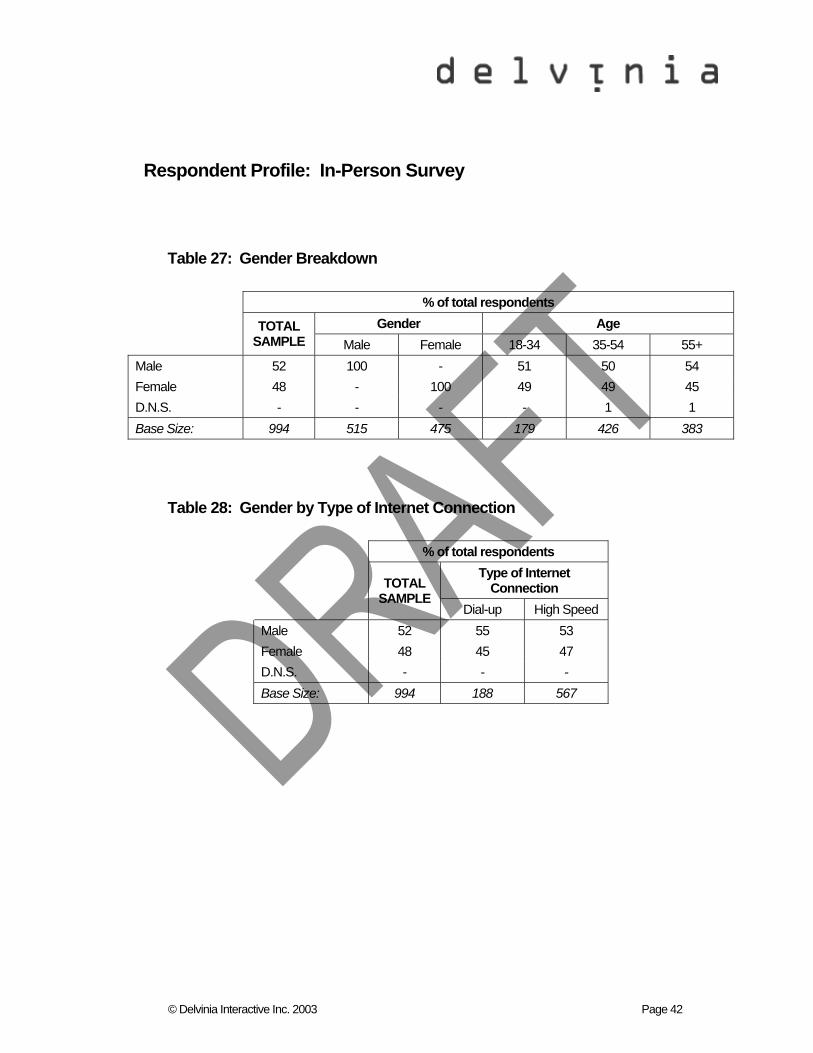
© Delvinia Interactive Inc. 2003 Page 42
Respondent Profile: In-Person Survey
Table 27: Gender Breakdown
% of total respondents Gender Age
TOTAL SAMPLE Male Female 18-34 35-54 55+
Male 52 100 - 51 50 54 Female 48 - 100 49 49 45 D.N.S. - - - - 1 1 Base Size: 994 515 475 179 426 383
Table 28: Gender by Type of Internet Connection
% of total respondents Type of Internet
Connection
TOTAL SAMPLE
Dial-up High Speed Male 52 55 53 Female 48 45 47 D.N.S. - - - Base Size: 994 188 567
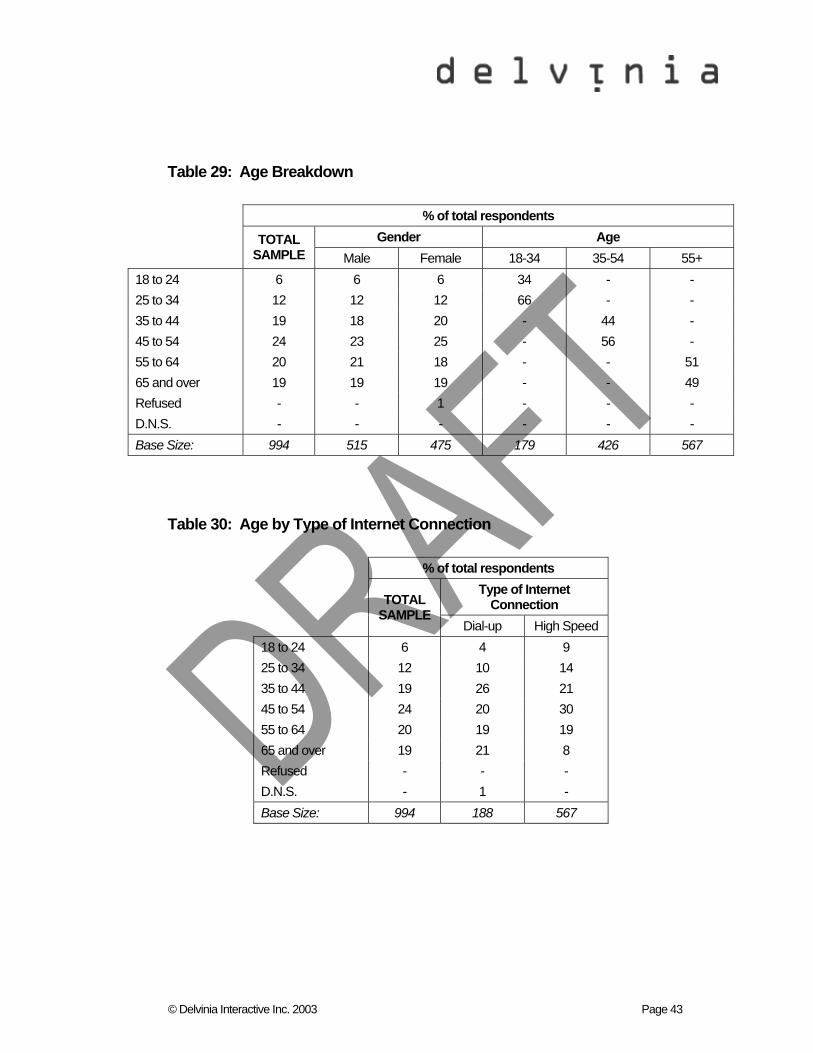
© Delvinia Interactive Inc. 2003 Page 43
Table 29: Age Breakdown
% of total respondents Gender Age
TOTAL SAMPLE Male Female 18-34 35-54 55+
18 to 24 6 6 6 34 - - 25 to 34 12 12 12 66 - - 35 to 44 19 18 20 - 44 - 45 to 54 24 23 25 - 56 - 55 to 64 20 21 18 - - 51 65 and over 19 19 19 - - 49 Refused - - 1 - - - D.N.S. - - - - - - Base Size: 994 515 475 179 426 567
Table 30: Age by Type of Internet Connection
% of total respondents Type of Internet
Connection
TOTAL SAMPLE
Dial-up High Speed 18 to 24 6 4 9 25 to 34 12 10 14 35 to 44 19 26 21 45 to 54 24 20 30 55 to 64 20 19 19 65 and over 19 21 8 Refused - - - D.N.S. - 1 - Base Size: 994 188 567
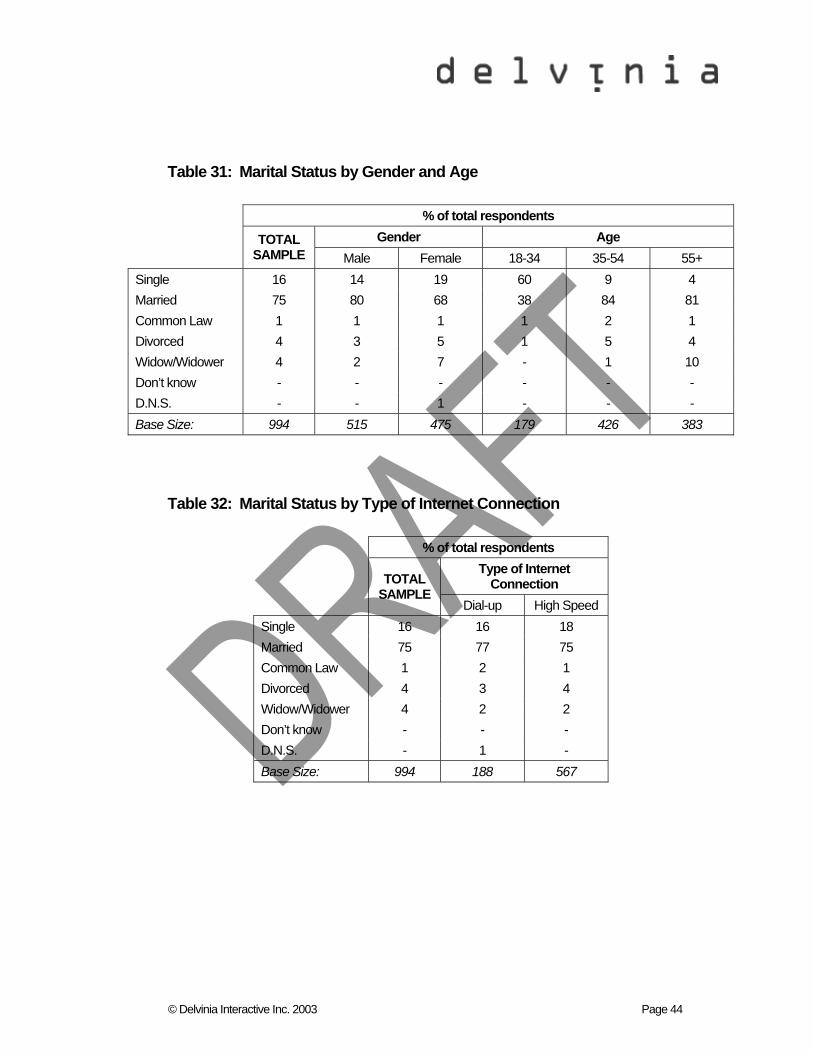
© Delvinia Interactive Inc. 2003 Page 44
Table 31: Marital Status by Gender and Age
% of total respondents Gender Age
TOTAL SAMPLE Male Female 18-34 35-54 55+
Single 16 14 19 60 9 4 Married 75 80 68 38 84 81 Common Law 1 1 1 1 2 1 Divorced 4 3 5 1 5 4 Widow/Widower 4 2 7 - 1 10 Don’t know - - - - - - D.N.S. - - 1 - - - Base Size: 994 515 475 179 426 383
Table 32: Marital Status by Type of Internet Connection
% of total respondents Type of Internet
Connection
TOTAL SAMPLE
Dial-up High Speed Single 16 16 18 Married 75 77 75 Common Law 1 2 1 Divorced 4 3 4 Widow/Widower 4 2 2 Don’t know - - - D.N.S. - 1 - Base Size: 994 188 567
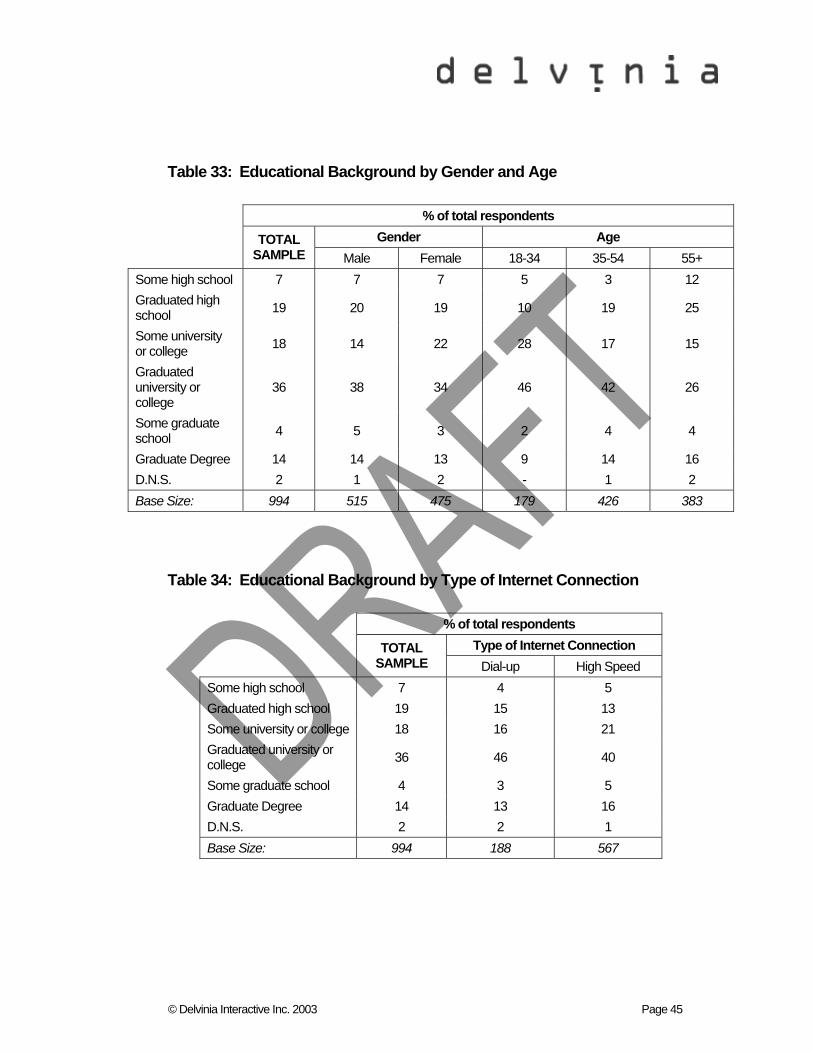
© Delvinia Interactive Inc. 2003 Page 45
Table 33: Educational Background by Gender and Age
% of total respondents Gender Age
TOTAL SAMPLE Male Female 18-34 35-54 55+
Some high school 7 7 7 5 3 12 Graduated high school 19 20 19 10 19 25
Some university or college 18 14 22 28 17 15
Graduated university or college
36 38 34 46 42 26
Some graduate school 4 5 3 2 4 4
Graduate Degree 14 14 13 9 14 16 D.N.S. 2 1 2 - 1 2 Base Size: 994 515 475 179 426 383
Table 34: Educational Background by Type of Internet Connection
% of total respondents Type of Internet Connection
TOTAL SAMPLE Dial-up High Speed
Some high school 7 4 5 Graduated high school 19 15 13 Some university or college 18 16 21 Graduated university or college 36 46 40
Some graduate school 4 3 5 Graduate Degree 14 13 16 D.N.S. 2 2 1 Base Size: 994 188 567
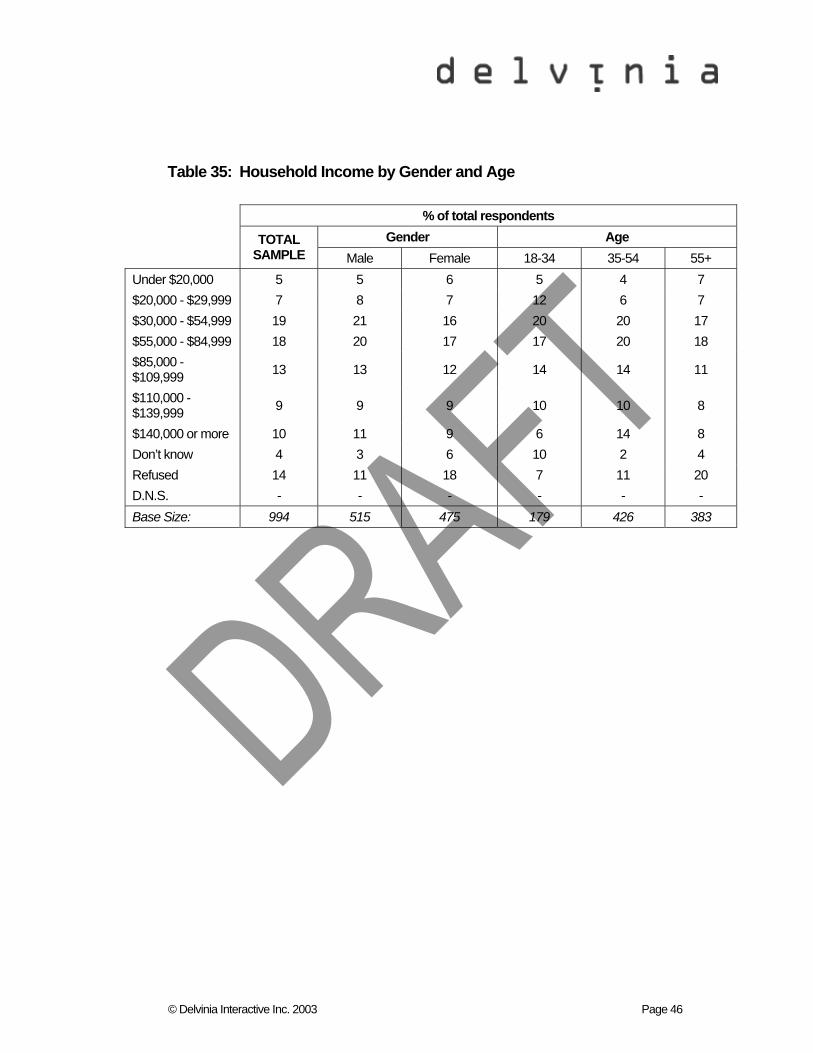
© Delvinia Interactive Inc. 2003 Page 46
Table 35: Household Income by Gender and Age
% of total respondents Gender Age
TOTAL SAMPLE Male Female 18-34 35-54 55+
Under $20,000 5 5 6 5 4 7 $20,000 - $29,999 7 8 7 12 6 7 $30,000 - $54,999 19 21 16 20 20 17 $55,000 - $84,999 18 20 17 17 20 18 $85,000 - $109,999 13 13 12 14 14 11
$110,000 - $139,999 9 9 9 10 10 8
$140,000 or more 10 11 9 6 14 8 Don’t know 4 3 6 10 2 4 Refused 14 11 18 7 11 20 D.N.S. - - - - - - Base Size: 994 515 475 179 426 383
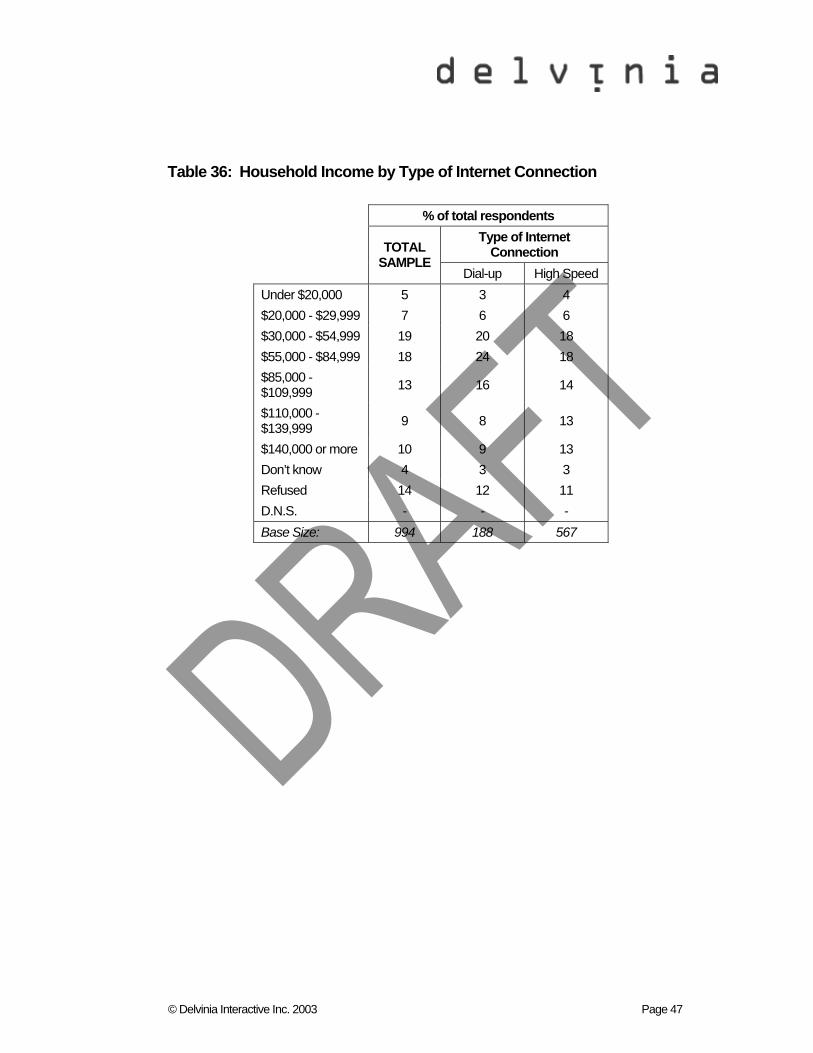
© Delvinia Interactive Inc. 2003 Page 47
Table 36: Household Income by Type of Internet Connection
% of total respondents Type of Internet
Connection
TOTAL SAMPLE
Dial-up High Speed Under $20,000 5 3 4 $20,000 - $29,999 7 6 6 $30,000 - $54,999 19 20 18 $55,000 - $84,999 18 24 18 $85,000 - $109,999 13 16 14
$110,000 - $139,999 9 8 13
$140,000 or more 10 9 13 Don’t know 4 3 3 Refused 14 12 11 D.N.S. - - - Base Size: 994 188 567
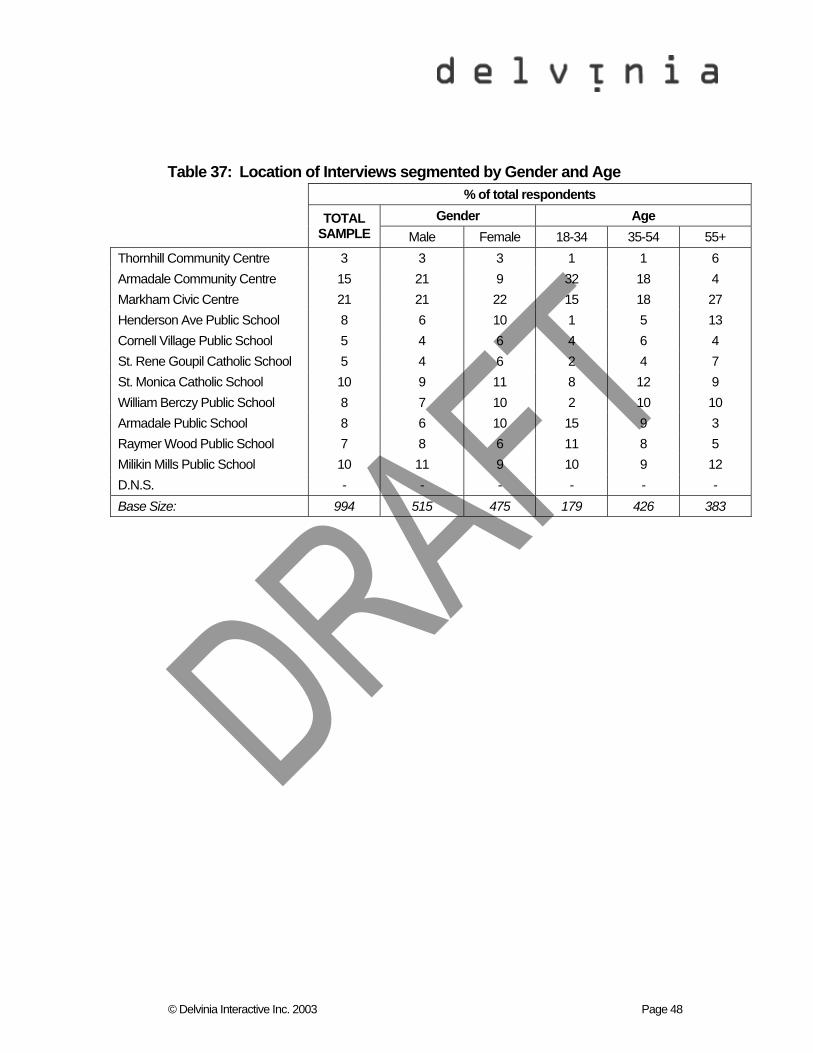
© Delvinia Interactive Inc. 2003 Page 48
Table 37: Location of Interviews segmented by Gender and Age % of total respondents
Gender Age
TOTAL SAMPLE Male Female 18-34 35-54 55+
Thornhill Community Centre 3 3 3 1 1 6 Armadale Community Centre 15 21 9 32 18 4 Markham Civic Centre 21 21 22 15 18 27 Henderson Ave Public School 8 6 10 1 5 13 Cornell Village Public School 5 4 6 4 6 4 St. Rene Goupil Catholic School 5 4 6 2 4 7 St. Monica Catholic School 10 9 11 8 12 9 William Berczy Public School 8 7 10 2 10 10 Armadale Public School 8 6 10 15 9 3 Raymer Wood Public School 7 8 6 11 8 5 Milikin Mills Public School 10 11 9 10 9 12 D.N.S. - - - - - - Base Size: 994 515 475 179 426 383
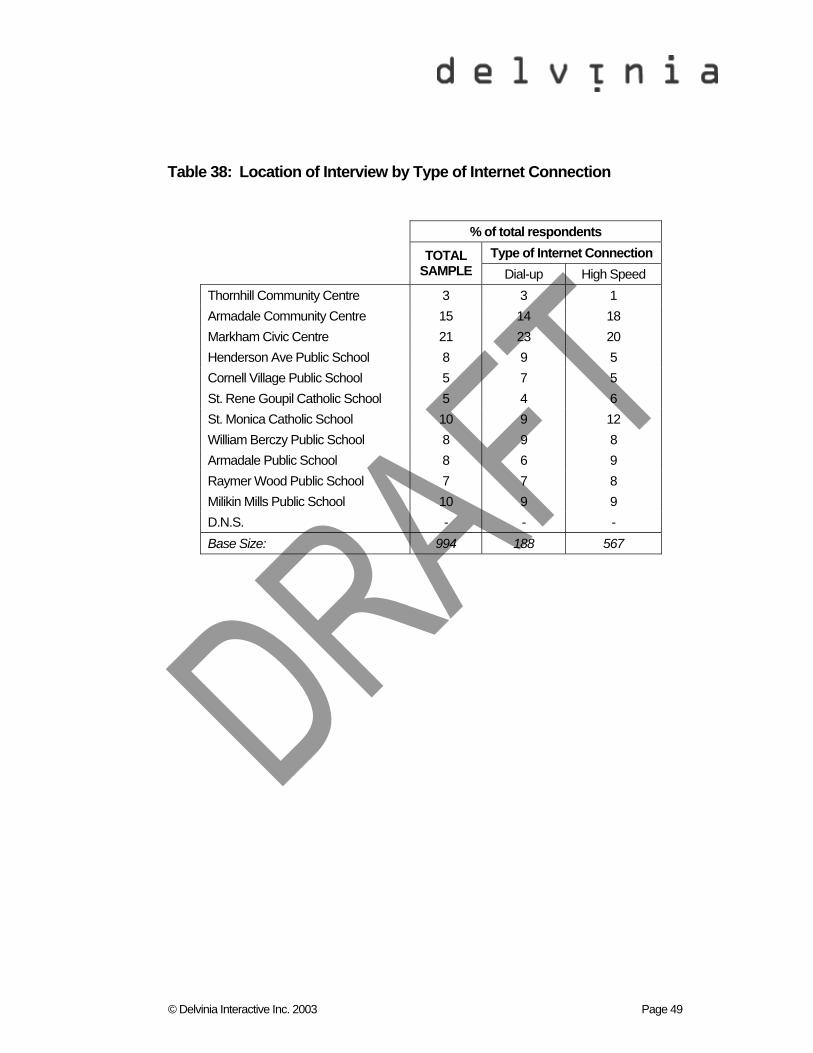
© Delvinia Interactive Inc. 2003 Page 49
Table 38: Location of Interview by Type of Internet Connection
% of total respondents Type of Internet Connection
TOTAL SAMPLE Dial-up High Speed
Thornhill Community Centre 3 3 1 Armadale Community Centre 15 14 18 Markham Civic Centre 21 23 20 Henderson Ave Public School 8 9 5 Cornell Village Public School 5 7 5 St. Rene Goupil Catholic School 5 4 6 St. Monica Catholic School 10 9 12 William Berczy Public School 8 9 8 Armadale Public School 8 6 9 Raymer Wood Public School 7 7 8 Milikin Mills Public School 10 9 9 D.N.S. - - - Base Size: 994 188 567
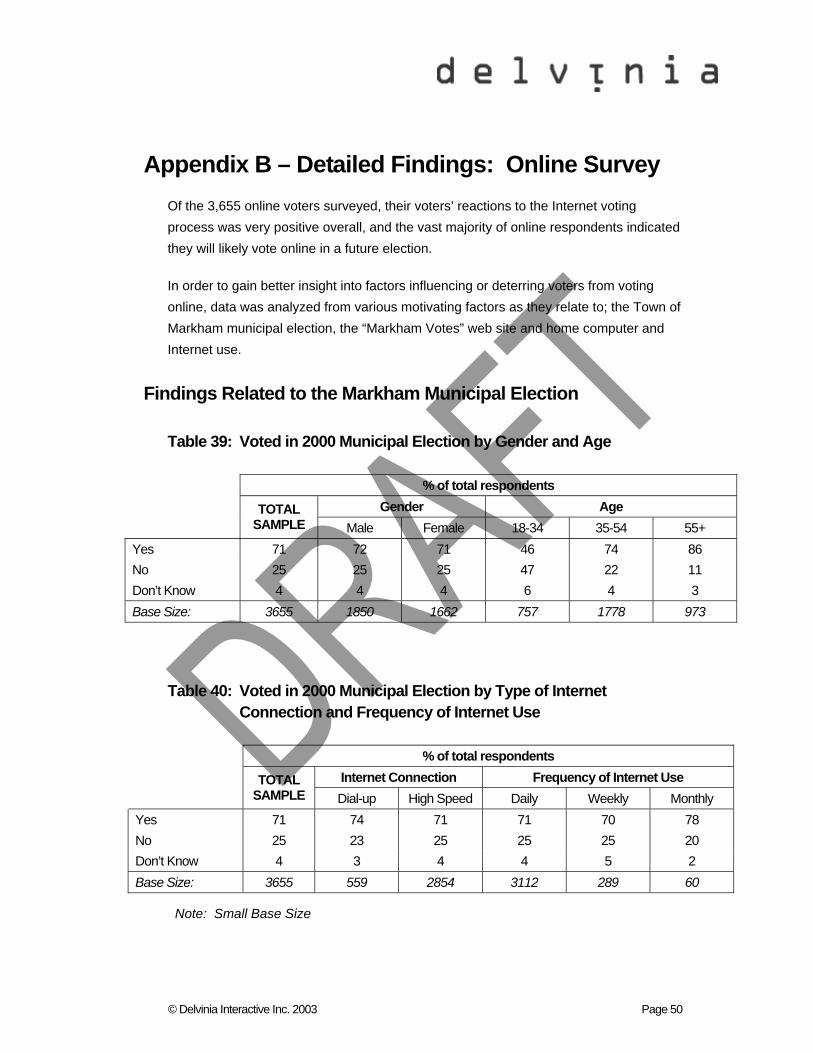
© Delvinia Interactive Inc. 2003 Page 50
Appendix B – Detailed Findings: Online Survey Of the 3,655 online voters surveyed, their voters’ reactions to the Internet voting process was very positive overall, and the vast majority of online respondents indicated they will likely vote online in a future election.
In order to gain better insight into factors influencing or deterring voters from voting online, data was analyzed from various motivating factors as they relate to; the Town of Markham municipal election, the “Markham Votes” web site and home computer and Internet use.
Findings Related to the Markham Municipal Election
Table 39: Voted in 2000 Municipal Election by Gender and Age
% of total respondents Gender Age
TOTAL SAMPLE Male Female 18-34 35-54 55+
Yes 71 72 71 46 74 86 No 25 25 25 47 22 11 Don’t Know 4 4 4 6 4 3 Base Size: 3655 1850 1662 757 1778 973
Table 40: Voted in 2000 Municipal Election by Type of Internet Connection and Frequency of Internet Use
% of total respondents Internet Connection Frequency of Internet Use
TOTAL SAMPLE Dial-up High Speed Daily Weekly Monthly
Yes 71 74 71 71 70 78 No 25 23 25 25 25 20 Don’t Know 4 3 4 4 5 2 Base Size: 3655 559 2854 3112 289 60
Note: Small Base Size
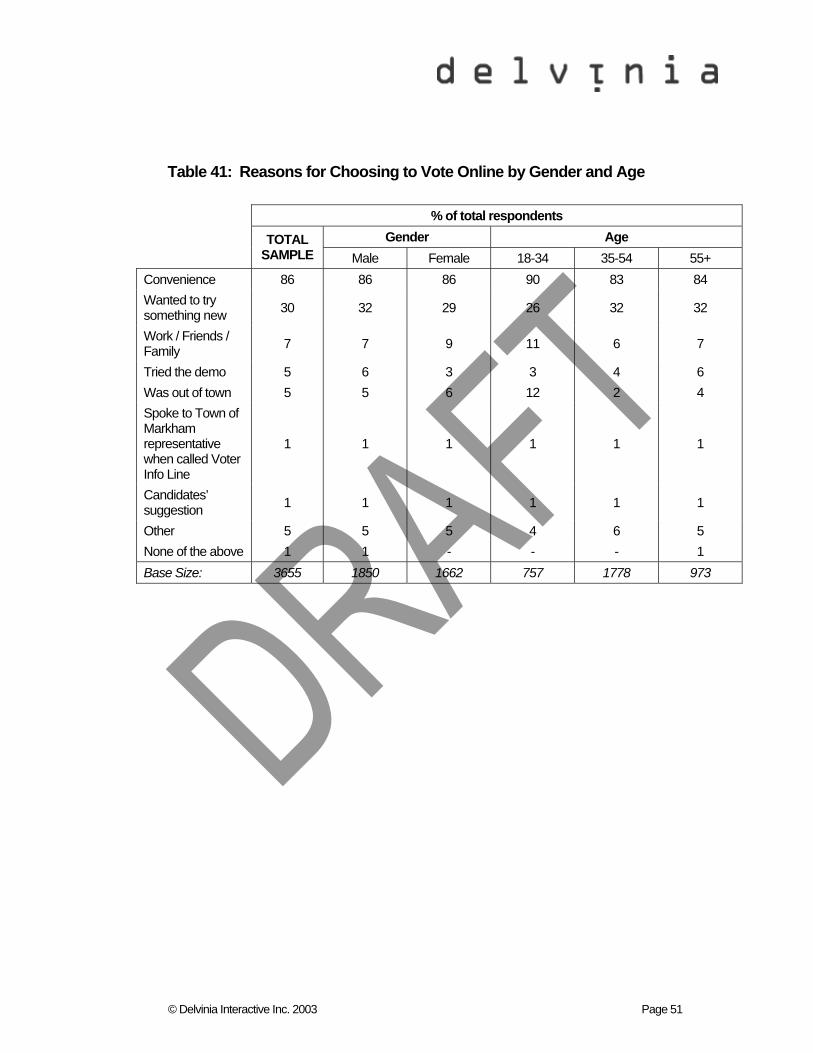
© Delvinia Interactive Inc. 2003 Page 51
Table 41: Reasons for Choosing to Vote Online by Gender and Age
% of total respondents Gender Age
TOTAL SAMPLE Male Female 18-34 35-54 55+
Convenience 86 86 86 90 83 84 Wanted to try something new 30 32 29 26 32 32
Work / Friends / Family 7 7 9 11 6 7
Tried the demo 5 6 3 3 4 6 Was out of town 5 5 6 12 2 4 Spoke to Town of Markham representative when called Voter Info Line
1 1 1 1 1 1
Candidates’ suggestion 1 1 1 1 1 1
Other 5 5 5 4 6 5 None of the above 1 1 - - - 1 Base Size: 3655 1850 1662 757 1778 973
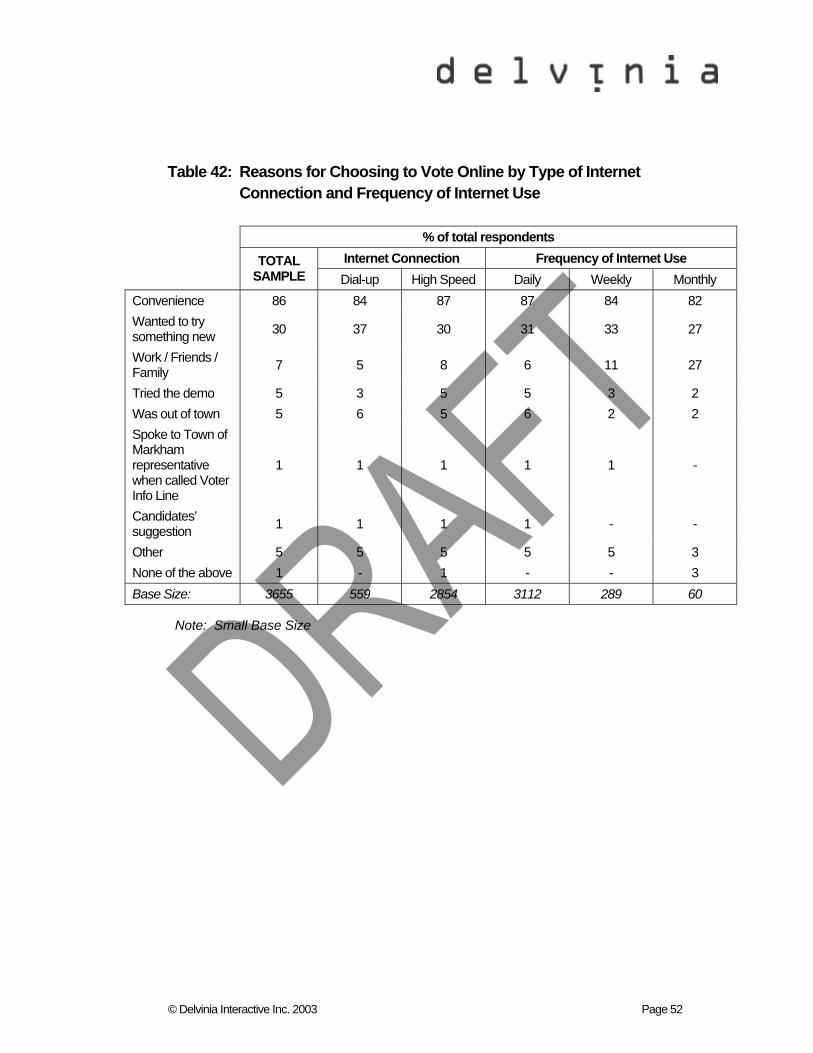
© Delvinia Interactive Inc. 2003 Page 52
Table 42: Reasons for Choosing to Vote Online by Type of Internet Connection and Frequency of Internet Use
% of total respondents Internet Connection Frequency of Internet Use
TOTAL SAMPLE Dial-up High Speed Daily Weekly Monthly
Convenience 86 84 87 87 84 82 Wanted to try something new 30 37 30 31 33 27
Work / Friends / Family 7 5 8 6 11 27
Tried the demo 5 3 5 5 3 2 Was out of town 5 6 5 6 2 2 Spoke to Town of Markham representative when called Voter Info Line
1 1 1 1 1 -
Candidates’ suggestion 1 1 1 1 - -
Other 5 5 5 5 5 3 None of the above 1 - 1 - - 3 Base Size: 3655 559 2854 3112 289 60
Note: Small Base Size
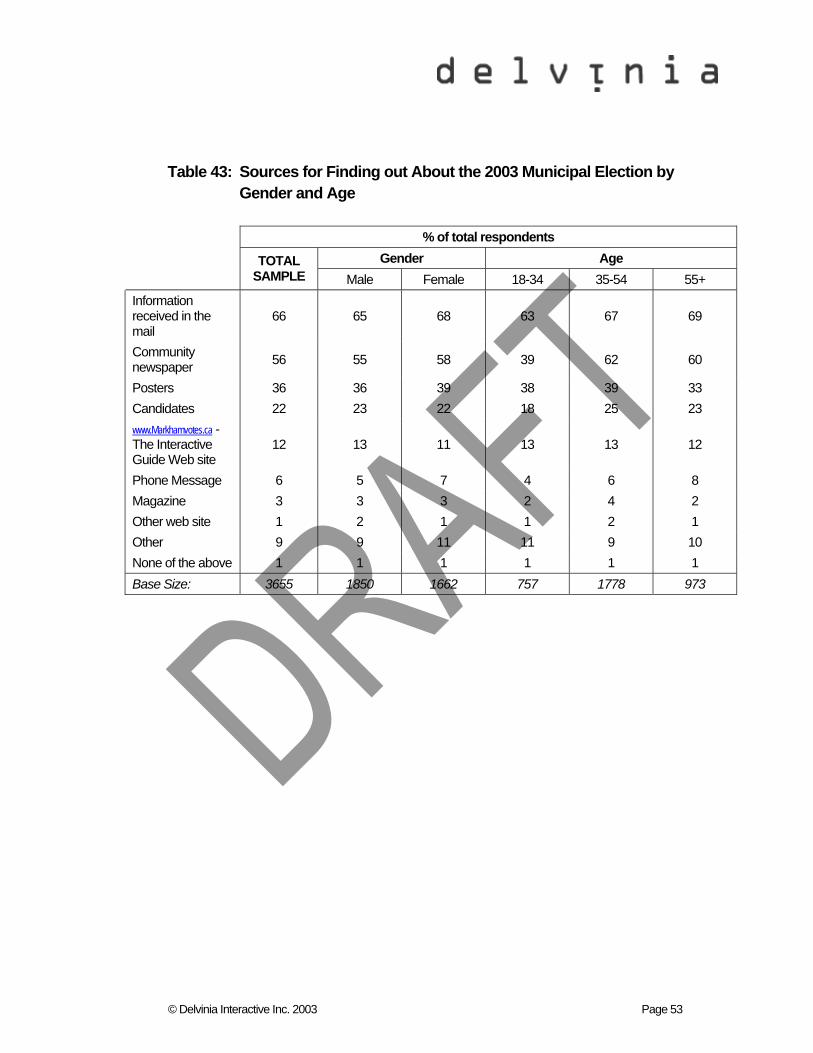
© Delvinia Interactive Inc. 2003 Page 53
Table 43: Sources for Finding out About the 2003 Municipal Election by Gender and Age
% of total respondents Gender Age
TOTAL SAMPLE Male Female 18-34 35-54 55+
Information received in the mail
66 65 68 63 67 69
Community newspaper 56 55 58 39 62 60
Posters 36 36 39 38 39 33 Candidates 22 23 22 18 25 23 www.Markhamvotes.ca - The Interactive Guide Web site
12 13 11 13 13 12
Phone Message 6 5 7 4 6 8 Magazine 3 3 3 2 4 2 Other web site 1 2 1 1 2 1 Other 9 9 11 11 9 10 None of the above 1 1 1 1 1 1 Base Size: 3655 1850 1662 757 1778 973
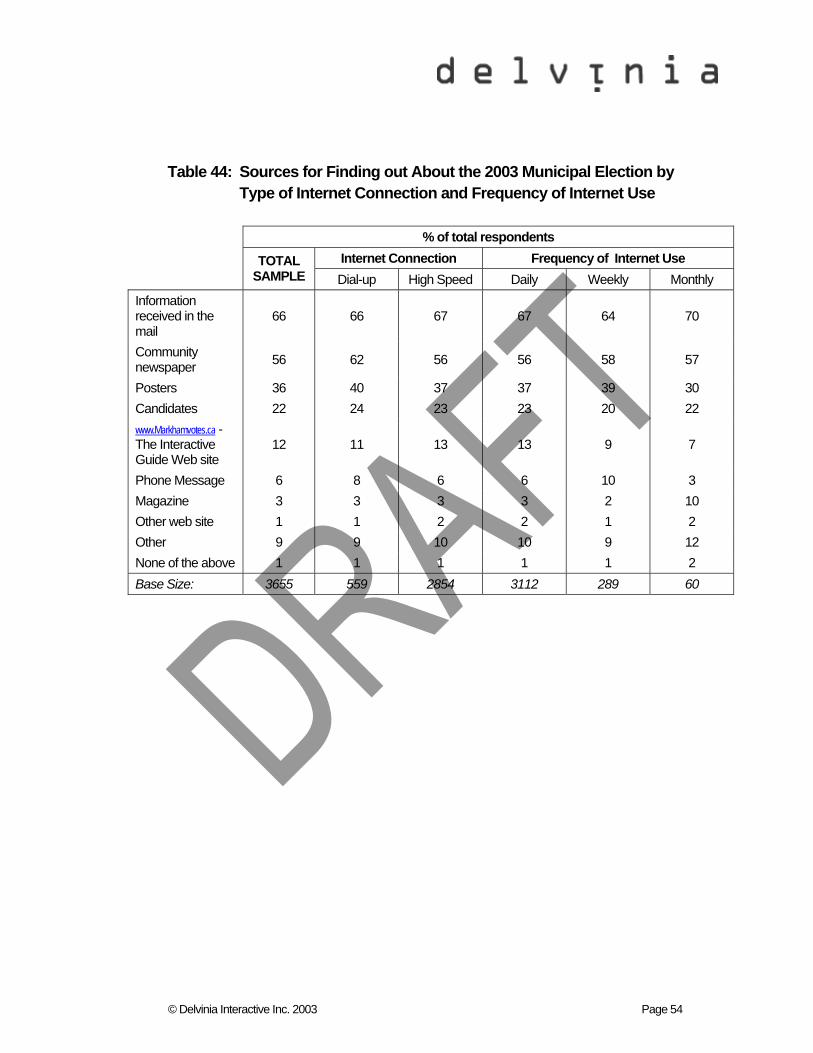
© Delvinia Interactive Inc. 2003 Page 54
Table 44: Sources for Finding out About the 2003 Municipal Election by Type of Internet Connection and Frequency of Internet Use
% of total respondents Internet Connection Frequency of Internet Use
TOTAL SAMPLE Dial-up High Speed Daily Weekly Monthly
Information received in the mail
66 66 67 67 64 70
Community newspaper 56 62 56 56 58 57
Posters 36 40 37 37 39 30 Candidates 22 24 23 23 20 22 www.Markhamvotes.ca - The Interactive Guide Web site
12 11 13 13 9 7
Phone Message 6 8 6 6 10 3 Magazine 3 3 3 3 2 10 Other web site 1 1 2 2 1 2 Other 9 9 10 10 9 12 None of the above 1 1 1 1 1 2 Base Size: 3655 559 2854 3112 289 60
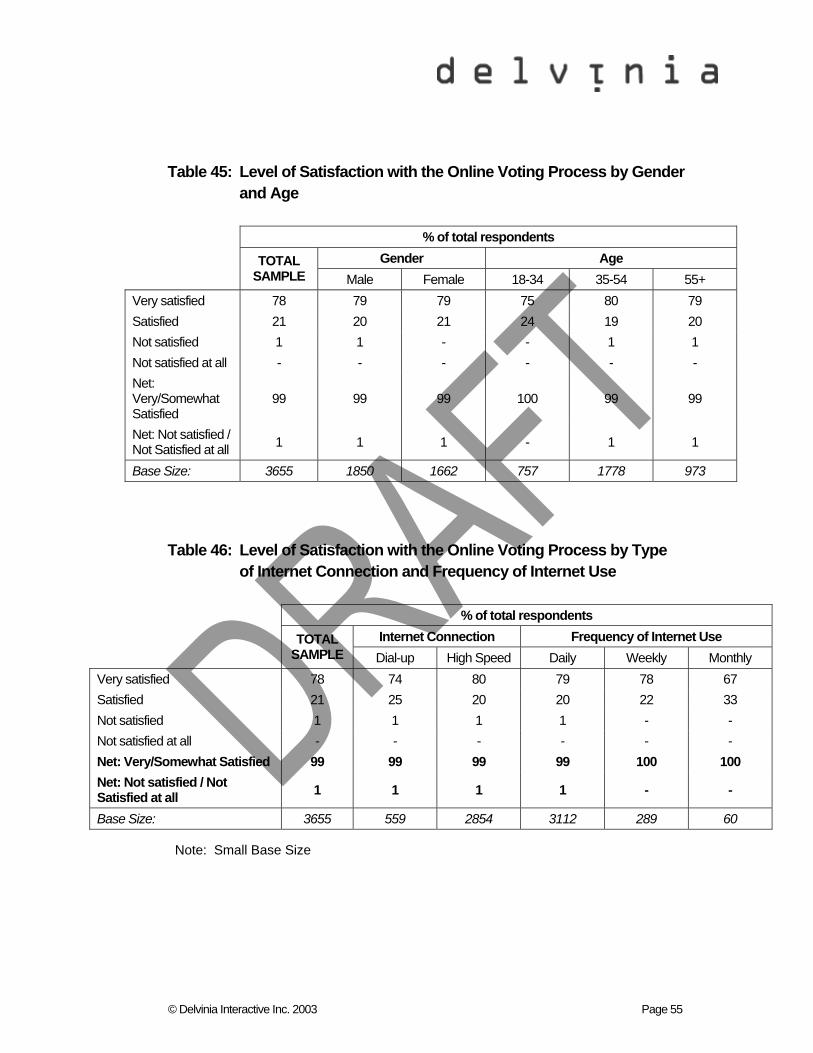
© Delvinia Interactive Inc. 2003 Page 55
Table 45: Level of Satisfaction with the Online Voting Process by Gender and Age
% of total respondents Gender Age
TOTAL SAMPLE Male Female 18-34 35-54 55+
Very satisfied 78 79 79 75 80 79 Satisfied 21 20 21 24 19 20 Not satisfied 1 1 - - 1 1 Not satisfied at all - - - - - - Net: Very/Somewhat Satisfied
99 99 99 100 99 99
Net: Not satisfied / Not Satisfied at all 1 1 1 - 1 1
Base Size: 3655 1850 1662 757 1778 973
Table 46: Level of Satisfaction with the Online Voting Process by Type of Internet Connection and Frequency of Internet Use
% of total respondents Internet Connection Frequency of Internet Use
TOTAL SAMPLE Dial-up High Speed Daily Weekly Monthly
Very satisfied 78 74 80 79 78 67 Satisfied 21 25 20 20 22 33 Not satisfied 1 1 1 1 - - Not satisfied at all - - - - - - Net: Very/Somewhat Satisfied 99 99 99 99 100 100 Net: Not satisfied / Not Satisfied at all 1 1 1 1 - -
Base Size: 3655 559 2854 3112 289 60
Note: Small Base Size
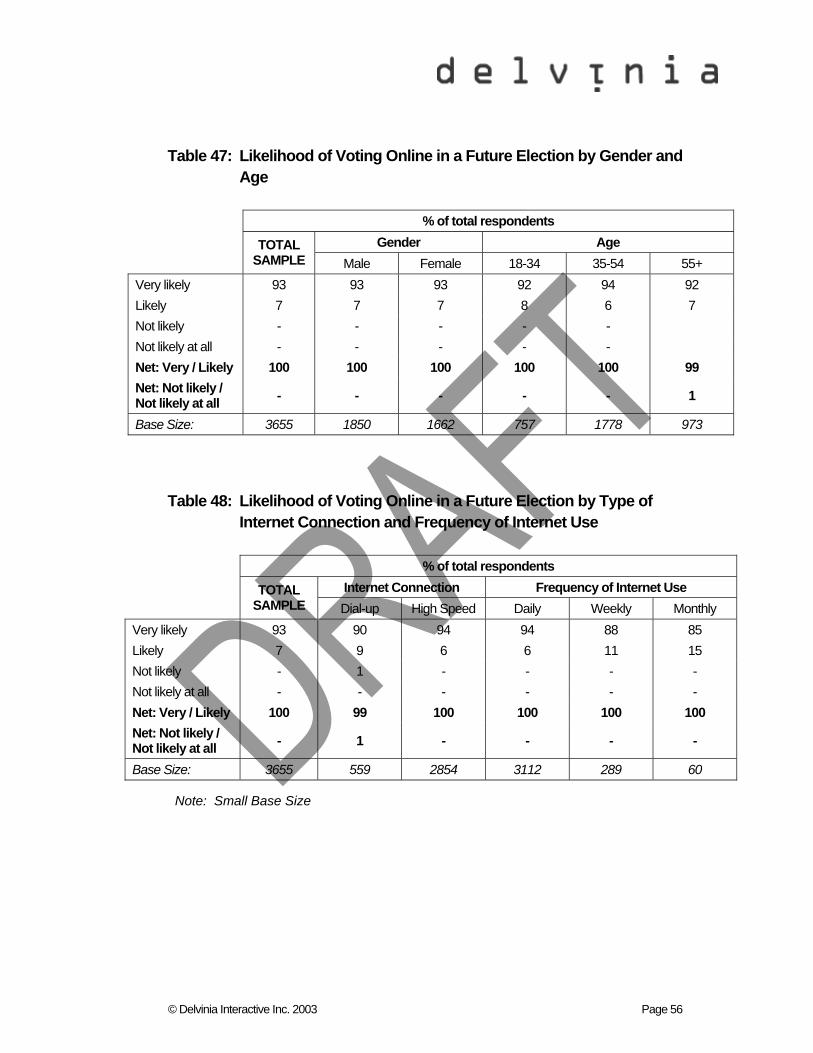
© Delvinia Interactive Inc. 2003 Page 56
Table 47: Likelihood of Voting Online in a Future Election by Gender and Age
% of total respondents Gender Age
TOTAL SAMPLE Male Female 18-34 35-54 55+
Very likely 93 93 93 92 94 92 Likely 7 7 7 8 6 7 Not likely - - - - - Not likely at all - - - - - Net: Very / Likely 100 100 100 100 100 99 Net: Not likely / Not likely at all - - - - - 1
Base Size: 3655 1850 1662 757 1778 973
Table 48: Likelihood of Voting Online in a Future Election by Type of Internet Connection and Frequency of Internet Use
% of total respondents Internet Connection Frequency of Internet Use
TOTAL SAMPLE Dial-up High Speed Daily Weekly Monthly
Very likely 93 90 94 94 88 85 Likely 7 9 6 6 11 15 Not likely - 1 - - - - Not likely at all - - - - - - Net: Very / Likely 100 99 100 100 100 100 Net: Not likely / Not likely at all - 1 - - - -
Base Size: 3655 559 2854 3112 289 60
Note: Small Base Size
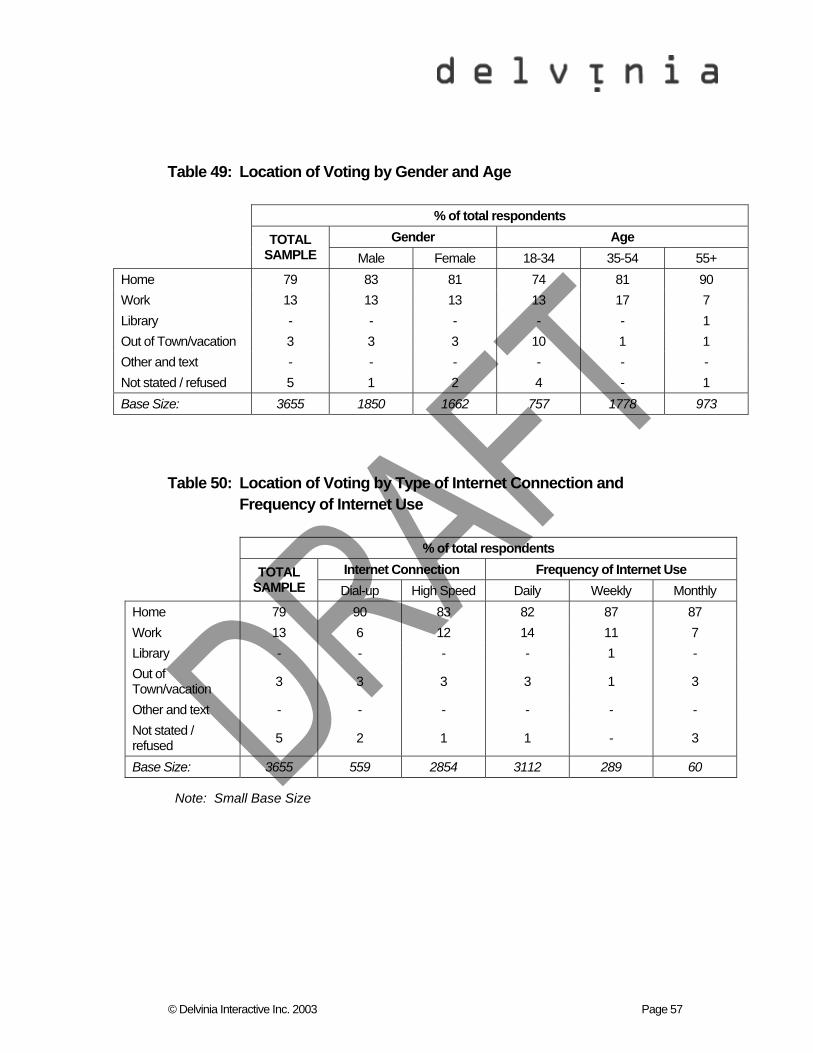
© Delvinia Interactive Inc. 2003 Page 57
Table 49: Location of Voting by Gender and Age
% of total respondents Gender Age
TOTAL SAMPLE Male Female 18-34 35-54 55+
Home 79 83 81 74 81 90 Work 13 13 13 13 17 7 Library - - - - - 1 Out of Town/vacation 3 3 3 10 1 1 Other and text - - - - - - Not stated / refused 5 1 2 4 - 1 Base Size: 3655 1850 1662 757 1778 973
Table 50: Location of Voting by Type of Internet Connection and Frequency of Internet Use
% of total respondents Internet Connection Frequency of Internet Use
TOTAL SAMPLE Dial-up High Speed Daily Weekly Monthly
Home 79 90 83 82 87 87 Work 13 6 12 14 11 7 Library - - - - 1 - Out of Town/vacation 3 3 3 3 1 3
Other and text - - - - - - Not stated / refused 5 2 1 1 - 3
Base Size: 3655 559 2854 3112 289 60
Note: Small Base Size
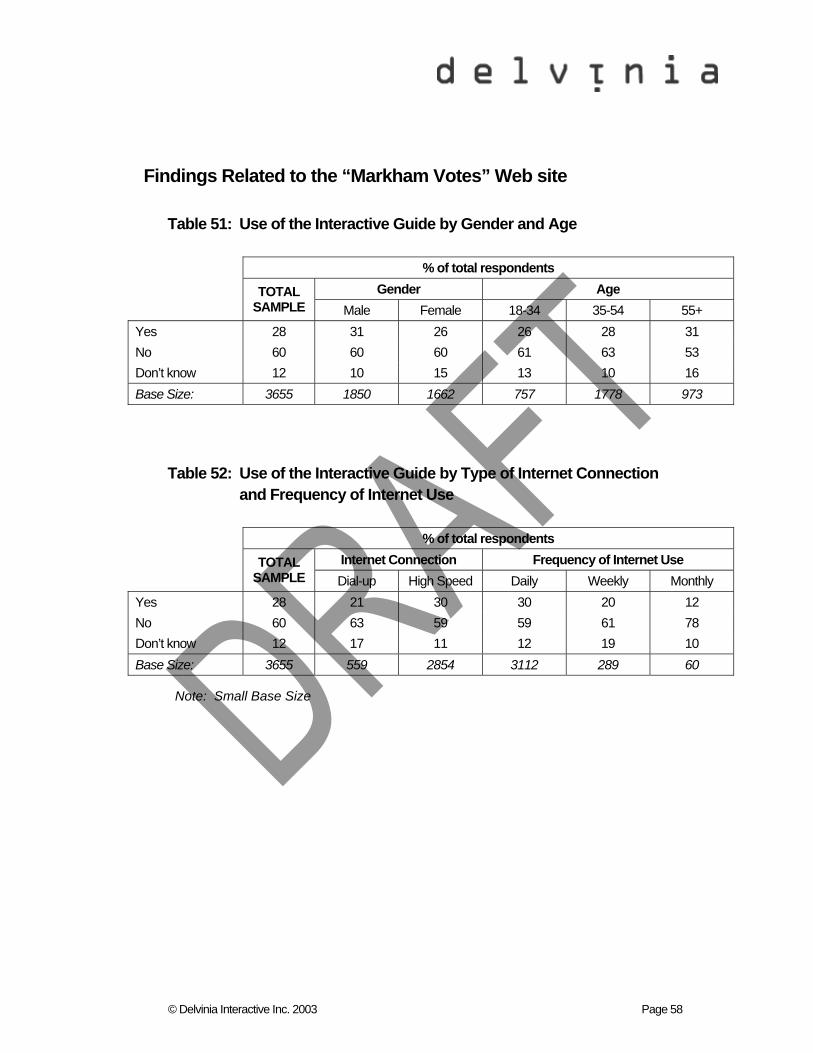
© Delvinia Interactive Inc. 2003 Page 58
Findings Related to the “Markham Votes” Web site
Table 51: Use of the Interactive Guide by Gender and Age
% of total respondents Gender Age
TOTAL SAMPLE Male Female 18-34 35-54 55+
Yes 28 31 26 26 28 31 No 60 60 60 61 63 53 Don’t know 12 10 15 13 10 16 Base Size: 3655 1850 1662 757 1778 973
Table 52: Use of the Interactive Guide by Type of Internet Connection and Frequency of Internet Use
% of total respondents Internet Connection Frequency of Internet Use
TOTAL SAMPLE Dial-up High Speed Daily Weekly Monthly
Yes 28 21 30 30 20 12 No 60 63 59 59 61 78 Don’t know 12 17 11 12 19 10 Base Size: 3655 559 2854 3112 289 60
Note: Small Base Size
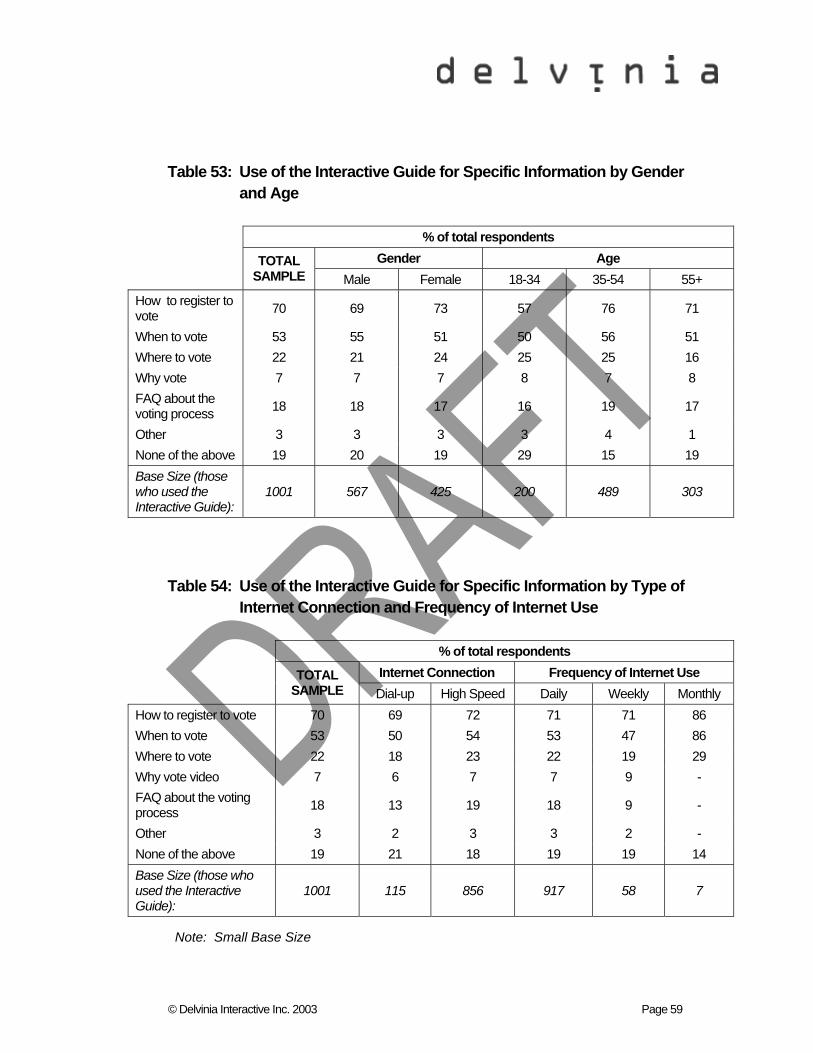
© Delvinia Interactive Inc. 2003 Page 59
Table 53: Use of the Interactive Guide for Specific Information by Gender and Age
% of total respondents Gender Age
TOTAL SAMPLE Male Female 18-34 35-54 55+
How to register to vote 70 69 73 57 76 71
When to vote 53 55 51 50 56 51 Where to vote 22 21 24 25 25 16 Why vote 7 7 7 8 7 8 FAQ about the voting process 18 18 17 16 19 17
Other 3 3 3 3 4 1 None of the above 19 20 19 29 15 19 Base Size (those who used the Interactive Guide):
1001 567 425 200 489 303
Table 54: Use of the Interactive Guide for Specific Information by Type of Internet Connection and Frequency of Internet Use
% of total respondents Internet Connection Frequency of Internet Use
TOTAL SAMPLE Dial-up High Speed Daily Weekly Monthly
How to register to vote 70 69 72 71 71 86 When to vote 53 50 54 53 47 86 Where to vote 22 18 23 22 19 29 Why vote video 7 6 7 7 9 - FAQ about the voting process 18 13 19 18 9 -
Other 3 2 3 3 2 - None of the above 19 21 18 19 19 14 Base Size (those who used the Interactive Guide):
1001 115 856 917 58 7
Note: Small Base Size
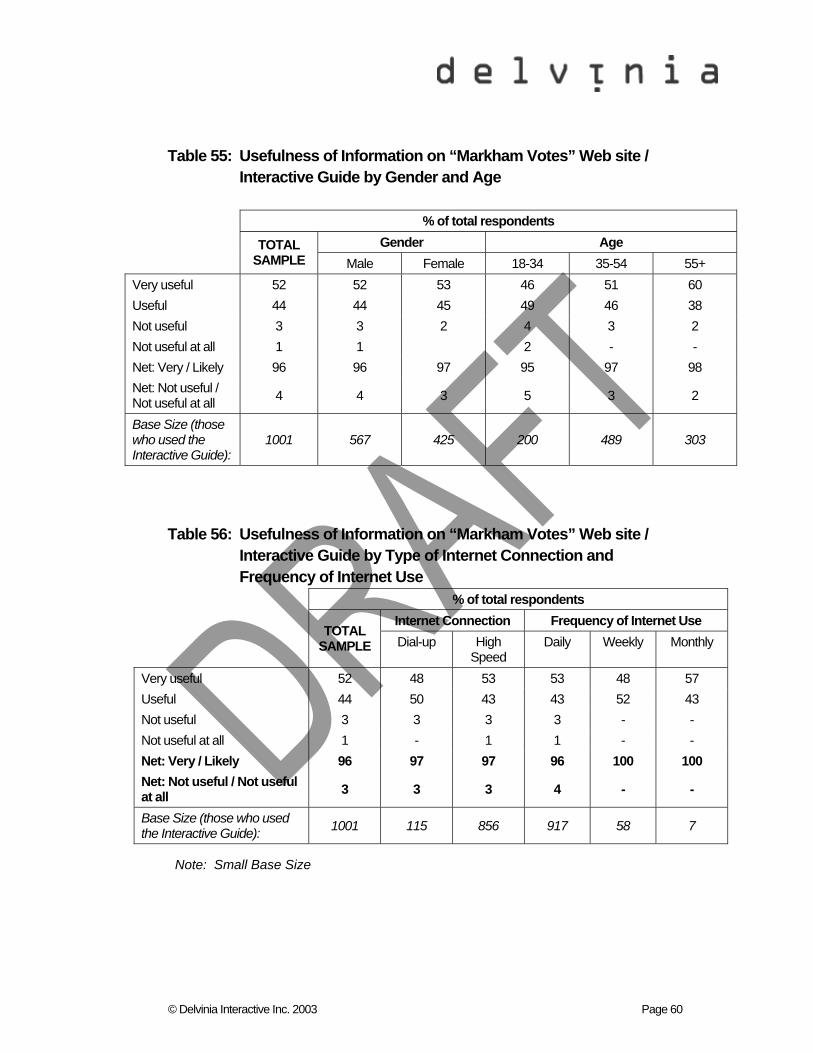
© Delvinia Interactive Inc. 2003 Page 60
Table 55: Usefulness of Information on “Markham Votes” Web site / Interactive Guide by Gender and Age
% of total respondents Gender Age
TOTAL SAMPLE Male Female 18-34 35-54 55+
Very useful 52 52 53 46 51 60 Useful 44 44 45 49 46 38 Not useful 3 3 2 4 3 2 Not useful at all 1 1 2 - - Net: Very / Likely 96 96 97 95 97 98 Net: Not useful / Not useful at all 4 4 3 5 3 2
Base Size (those who used the Interactive Guide):
1001 567 425 200 489 303
Table 56: Usefulness of Information on “Markham Votes” Web site / Interactive Guide by Type of Internet Connection and Frequency of Internet Use
% of total respondents Internet Connection Frequency of Internet Use
TOTAL SAMPLE Dial-up High
Speed Daily Weekly Monthly
Very useful 52 48 53 53 48 57 Useful 44 50 43 43 52 43 Not useful 3 3 3 3 - - Not useful at all 1 - 1 1 - - Net: Very / Likely 96 97 97 96 100 100 Net: Not useful / Not useful at all 3 3 3 4 - -
Base Size (those who used the Interactive Guide): 1001 115 856 917 58 7
Note: Small Base Size
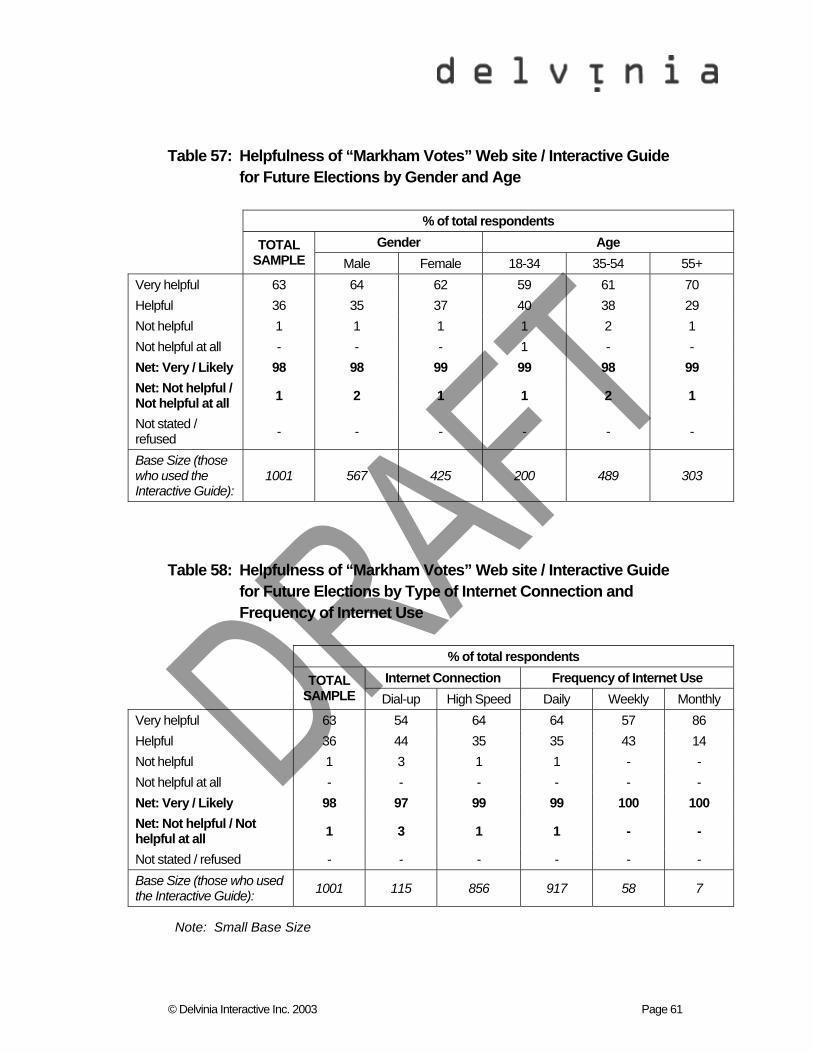
© Delvinia Interactive Inc. 2003 Page 61
Table 57: Helpfulness of “Markham Votes” Web site / Interactive Guide for Future Elections by Gender and Age
% of total respondents Gender Age
TOTAL SAMPLE Male Female 18-34 35-54 55+
Very helpful 63 64 62 59 61 70 Helpful 36 35 37 40 38 29 Not helpful 1 1 1 1 2 1 Not helpful at all - - - 1 - - Net: Very / Likely 98 98 99 99 98 99 Net: Not helpful / Not helpful at all 1 2 1 1 2 1
Not stated / refused - - - - - -
Base Size (those who used the Interactive Guide):
1001 567 425 200 489 303
Table 58: Helpfulness of “Markham Votes” Web site / Interactive Guide for Future Elections by Type of Internet Connection and Frequency of Internet Use
% of total respondents Internet Connection Frequency of Internet Use
TOTAL SAMPLE Dial-up High Speed Daily Weekly Monthly
Very helpful 63 54 64 64 57 86 Helpful 36 44 35 35 43 14 Not helpful 1 3 1 1 - - Not helpful at all - - - - - - Net: Very / Likely 98 97 99 99 100 100 Net: Not helpful / Not helpful at all 1 3 1 1 - -
Not stated / refused - - - - - - Base Size (those who used the Interactive Guide): 1001 115 856 917 58 7
Note: Small Base Size
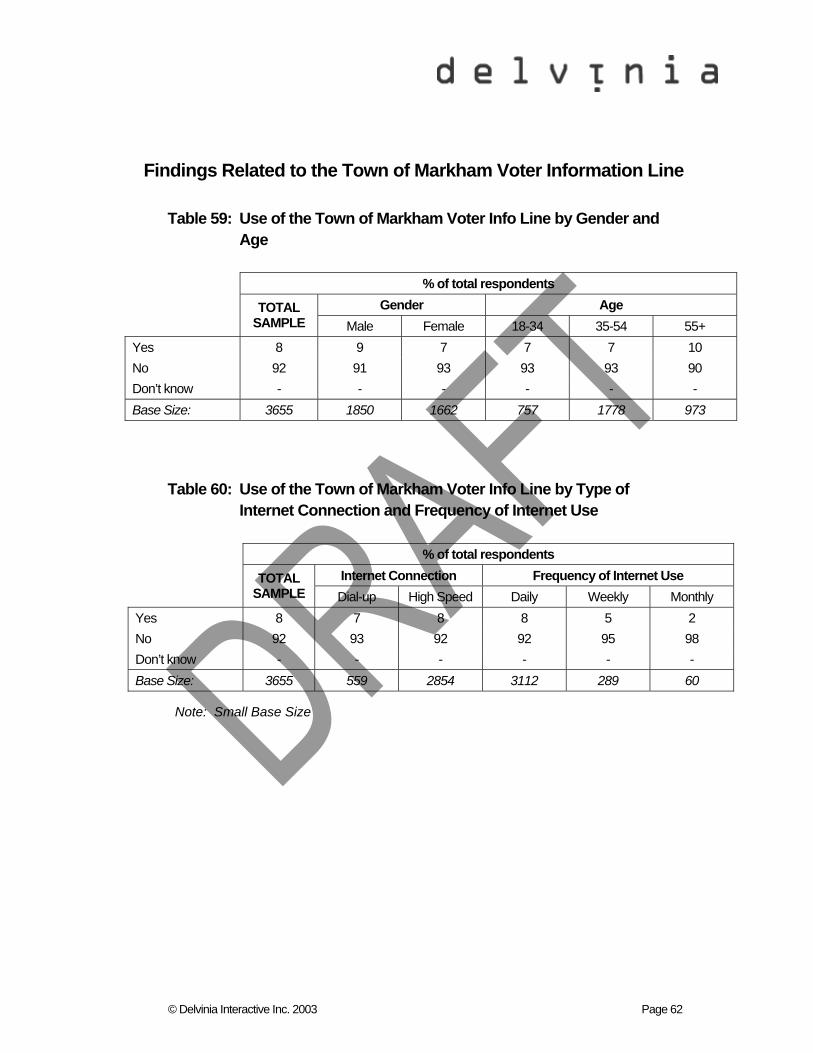
© Delvinia Interactive Inc. 2003 Page 62
Findings Related to the Town of Markham Voter Information Line
Table 59: Use of the Town of Markham Voter Info Line by Gender and Age
% of total respondents Gender Age
TOTAL SAMPLE Male Female 18-34 35-54 55+
Yes 8 9 7 7 7 10 No 92 91 93 93 93 90 Don’t know - - - - - - Base Size: 3655 1850 1662 757 1778 973
Table 60: Use of the Town of Markham Voter Info Line by Type of Internet Connection and Frequency of Internet Use
% of total respondents Internet Connection Frequency of Internet Use
TOTAL SAMPLE Dial-up High Speed Daily Weekly Monthly
Yes 8 7 8 8 5 2 No 92 93 92 92 95 98 Don’t know - - - - - - Base Size: 3655 559 2854 3112 289 60
Note: Small Base Size
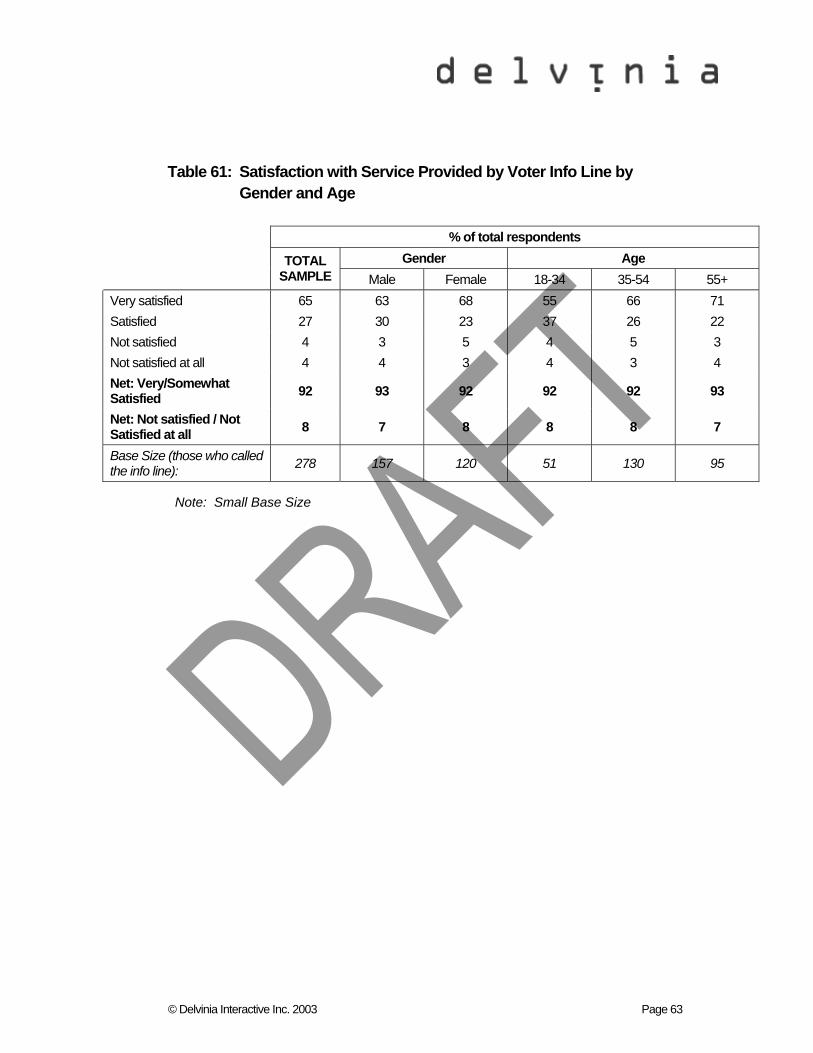
© Delvinia Interactive Inc. 2003 Page 63
Table 61: Satisfaction with Service Provided by Voter Info Line by Gender and Age
% of total respondents Gender Age
TOTAL SAMPLE Male Female 18-34 35-54 55+
Very satisfied 65 63 68 55 66 71 Satisfied 27 30 23 37 26 22 Not satisfied 4 3 5 4 5 3 Not satisfied at all 4 4 3 4 3 4 Net: Very/Somewhat Satisfied 92 93 92 92 92 93
Net: Not satisfied / Not Satisfied at all 8 7 8 8 8 7
Base Size (those who called the info line): 278 157 120 51 130 95
Note: Small Base Size
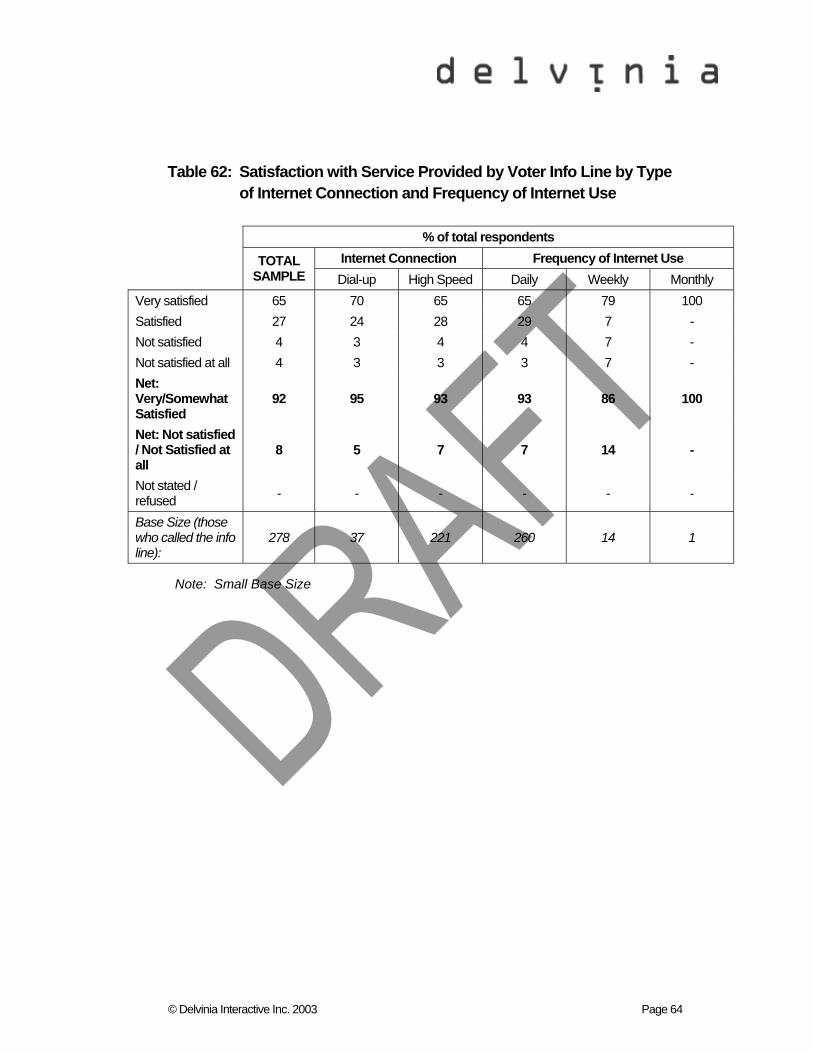
© Delvinia Interactive Inc. 2003 Page 64
Table 62: Satisfaction with Service Provided by Voter Info Line by Type of Internet Connection and Frequency of Internet Use
% of total respondents Internet Connection Frequency of Internet Use
TOTAL SAMPLE Dial-up High Speed Daily Weekly Monthly
Very satisfied 65 70 65 65 79 100 Satisfied 27 24 28 29 7 - Not satisfied 4 3 4 4 7 - Not satisfied at all 4 3 3 3 7 - Net: Very/Somewhat Satisfied
92 95 93 93 86 100
Net: Not satisfied / Not Satisfied at all
8 5 7 7 14 -
Not stated / refused - - - - - -
Base Size (those who called the info line):
278 37 221 260 14 1
Note: Small Base Size
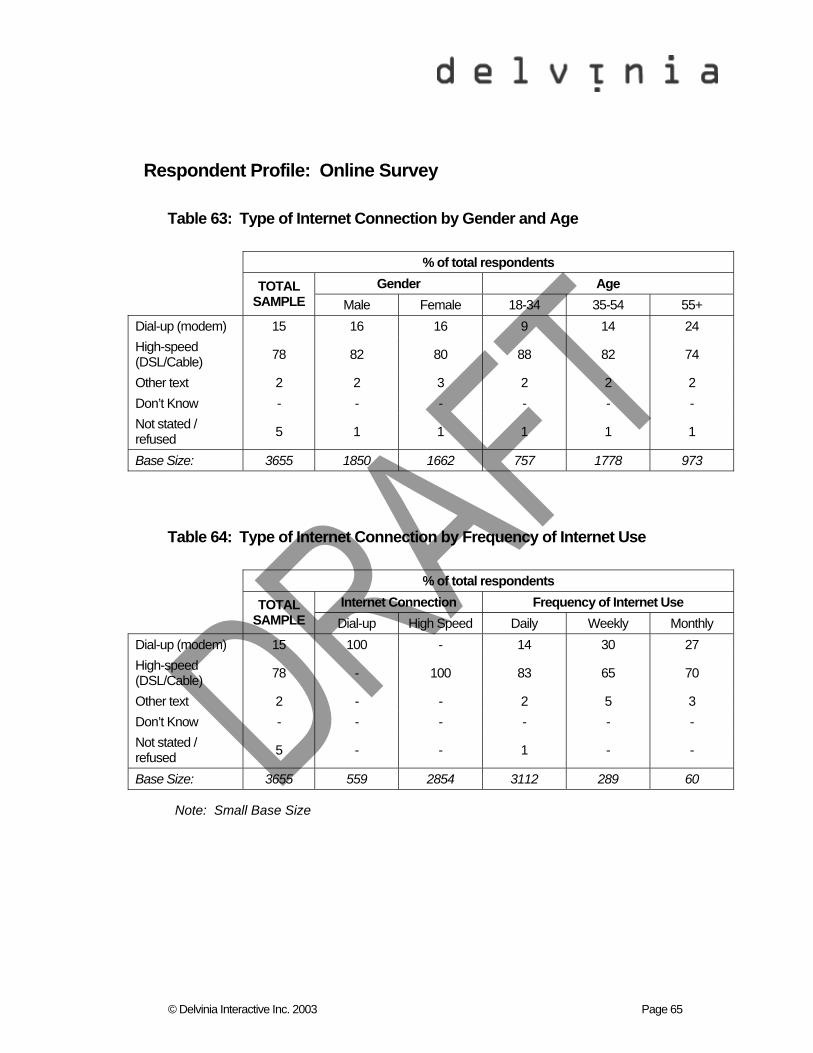
© Delvinia Interactive Inc. 2003 Page 65
Respondent Profile: Online Survey
Table 63: Type of Internet Connection by Gender and Age
% of total respondents Gender Age
TOTAL SAMPLE Male Female 18-34 35-54 55+
Dial-up (modem) 15 16 16 9 14 24 High-speed (DSL/Cable) 78 82 80 88 82 74
Other text 2 2 3 2 2 2 Don’t Know - - - - - - Not stated / refused 5 1 1 1 1 1
Base Size: 3655 1850 1662 757 1778 973
Table 64: Type of Internet Connection by Frequency of Internet Use
% of total respondents Internet Connection Frequency of Internet Use
TOTAL SAMPLE Dial-up High Speed Daily Weekly Monthly
Dial-up (modem) 15 100 - 14 30 27 High-speed (DSL/Cable) 78 - 100 83 65 70
Other text 2 - - 2 5 3 Don’t Know - - - - - - Not stated / refused 5 - - 1 - -
Base Size: 3655 559 2854 3112 289 60
Note: Small Base Size
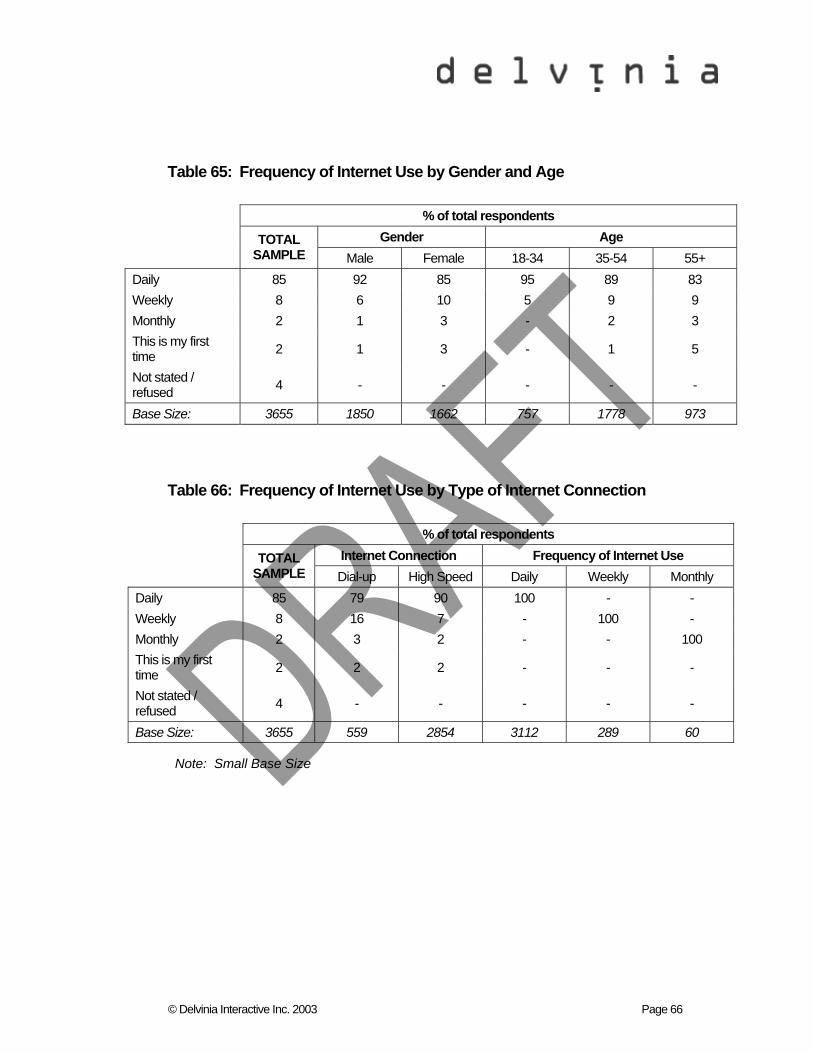
© Delvinia Interactive Inc. 2003 Page 66
Table 65: Frequency of Internet Use by Gender and Age
% of total respondents Gender Age
TOTAL SAMPLE Male Female 18-34 35-54 55+
Daily 85 92 85 95 89 83 Weekly 8 6 10 5 9 9 Monthly 2 1 3 - 2 3 This is my first time 2 1 3 - 1 5
Not stated / refused 4 - - - - -
Base Size: 3655 1850 1662 757 1778 973
Table 66: Frequency of Internet Use by Type of Internet Connection
% of total respondents Internet Connection Frequency of Internet Use
TOTAL SAMPLE Dial-up High Speed Daily Weekly Monthly
Daily 85 79 90 100 - - Weekly 8 16 7 - 100 - Monthly 2 3 2 - - 100 This is my first time 2 2 2 - - -
Not stated / refused 4 - - - - -
Base Size: 3655 559 2854 3112 289 60
Note: Small Base Size
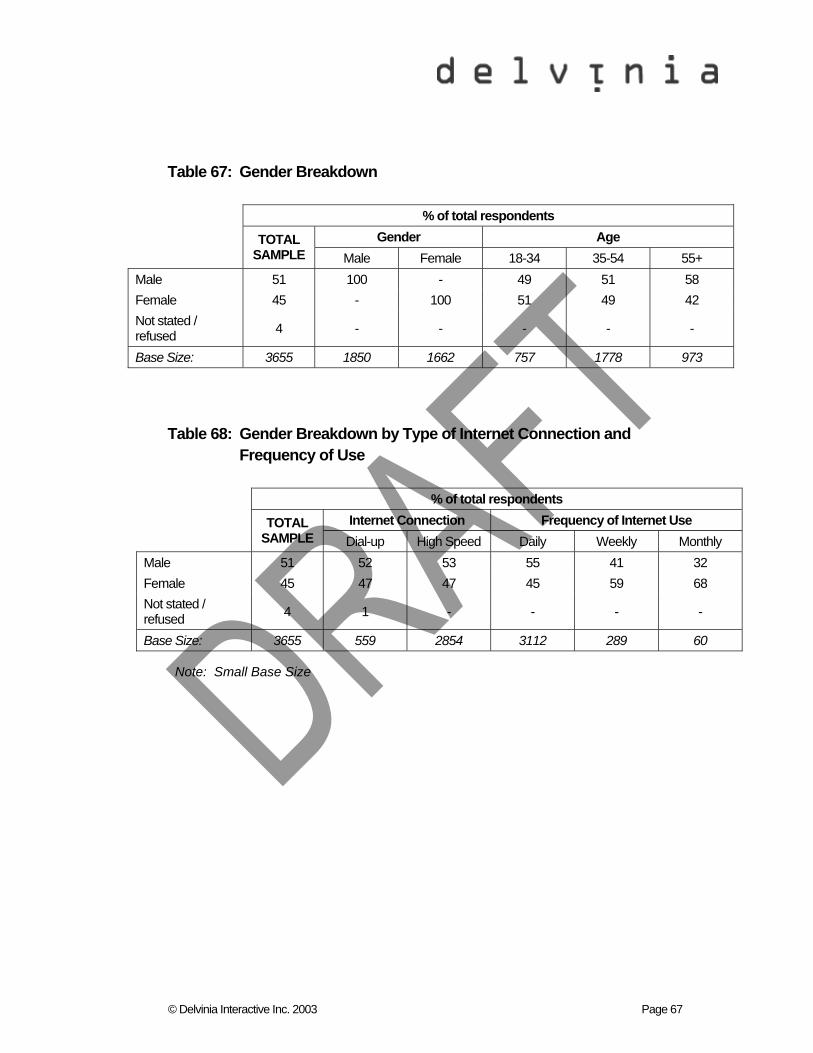
© Delvinia Interactive Inc. 2003 Page 67
Table 67: Gender Breakdown
% of total respondents Gender Age
TOTAL SAMPLE Male Female 18-34 35-54 55+
Male 51 100 - 49 51 58 Female 45 - 100 51 49 42 Not stated / refused 4 - - - - -
Base Size: 3655 1850 1662 757 1778 973
Table 68: Gender Breakdown by Type of Internet Connection and Frequency of Use
% of total respondents Internet Connection Frequency of Internet Use
TOTAL SAMPLE Dial-up High Speed Daily Weekly Monthly
Male 51 52 53 55 41 32 Female 45 47 47 45 59 68 Not stated / refused 4 1 - - - -
Base Size: 3655 559 2854 3112 289 60
Note: Small Base Size
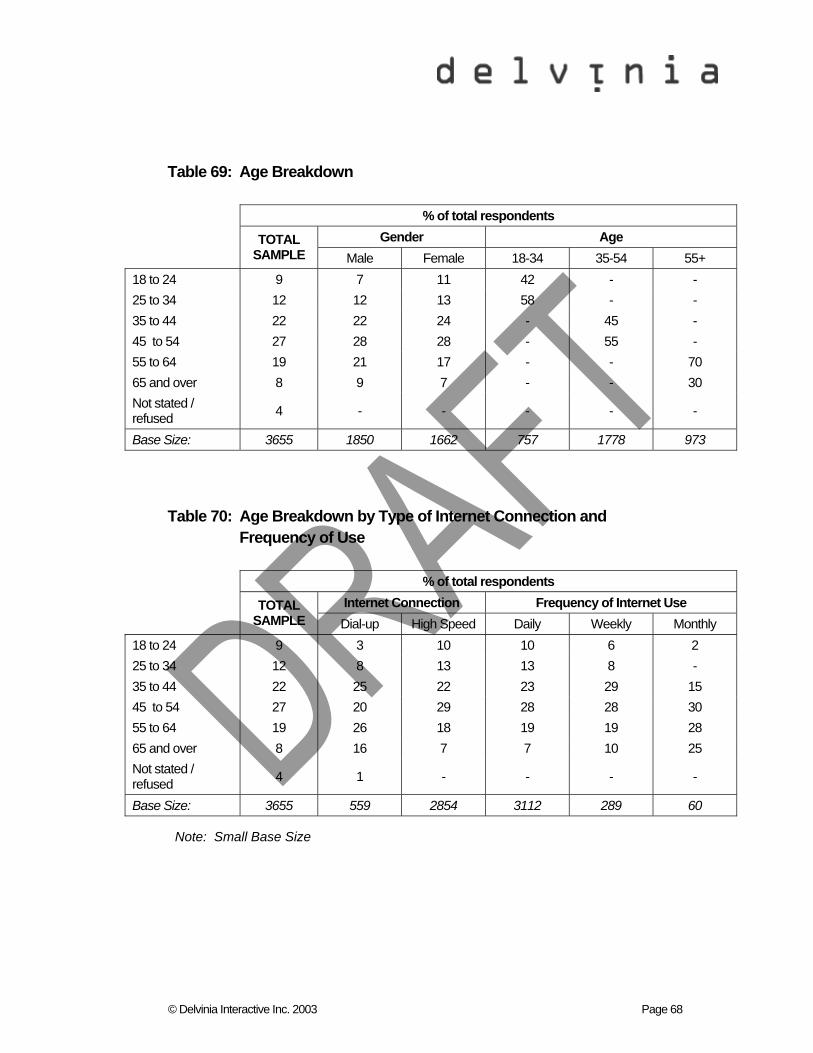
© Delvinia Interactive Inc. 2003 Page 68
Table 69: Age Breakdown
% of total respondents Gender Age
TOTAL SAMPLE Male Female 18-34 35-54 55+
18 to 24 9 7 11 42 - - 25 to 34 12 12 13 58 - - 35 to 44 22 22 24 - 45 - 45 to 54 27 28 28 - 55 - 55 to 64 19 21 17 - - 70 65 and over 8 9 7 - - 30 Not stated / refused 4 - - - - -
Base Size: 3655 1850 1662 757 1778 973
Table 70: Age Breakdown by Type of Internet Connection and Frequency of Use
% of total respondents Internet Connection Frequency of Internet Use
TOTAL SAMPLE Dial-up High Speed Daily Weekly Monthly
18 to 24 9 3 10 10 6 2 25 to 34 12 8 13 13 8 - 35 to 44 22 25 22 23 29 15 45 to 54 27 20 29 28 28 30 55 to 64 19 26 18 19 19 28 65 and over 8 16 7 7 10 25 Not stated / refused 4 1 - - - -
Base Size: 3655 559 2854 3112 289 60
Note: Small Base Size
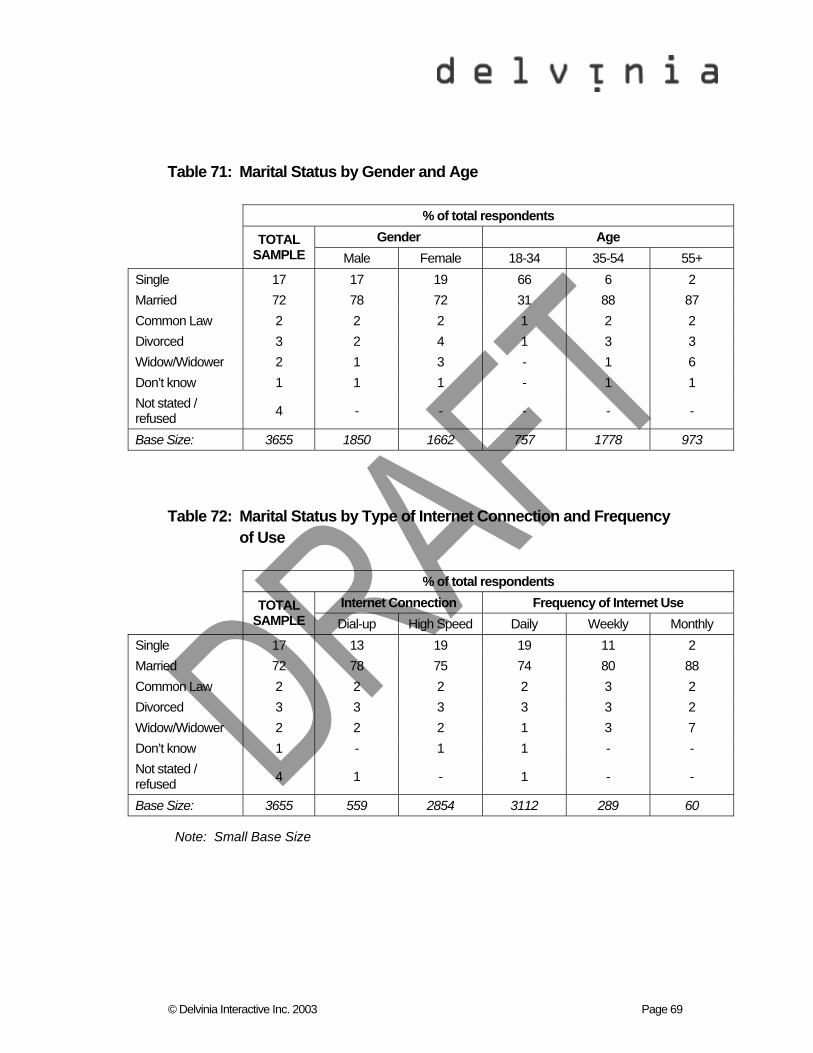
© Delvinia Interactive Inc. 2003 Page 69
Table 71: Marital Status by Gender and Age
% of total respondents Gender Age
TOTAL SAMPLE Male Female 18-34 35-54 55+
Single 17 17 19 66 6 2 Married 72 78 72 31 88 87 Common Law 2 2 2 1 2 2 Divorced 3 2 4 1 3 3 Widow/Widower 2 1 3 - 1 6 Don’t know 1 1 1 - 1 1 Not stated / refused 4 - - - - -
Base Size: 3655 1850 1662 757 1778 973
Table 72: Marital Status by Type of Internet Connection and Frequency of Use
% of total respondents Internet Connection Frequency of Internet Use
TOTAL SAMPLE Dial-up High Speed Daily Weekly Monthly
Single 17 13 19 19 11 2 Married 72 78 75 74 80 88 Common Law 2 2 2 2 3 2 Divorced 3 3 3 3 3 2 Widow/Widower 2 2 2 1 3 7 Don’t know 1 - 1 1 - - Not stated / refused 4 1 - 1 - -
Base Size: 3655 559 2854 3112 289 60
Note: Small Base Size
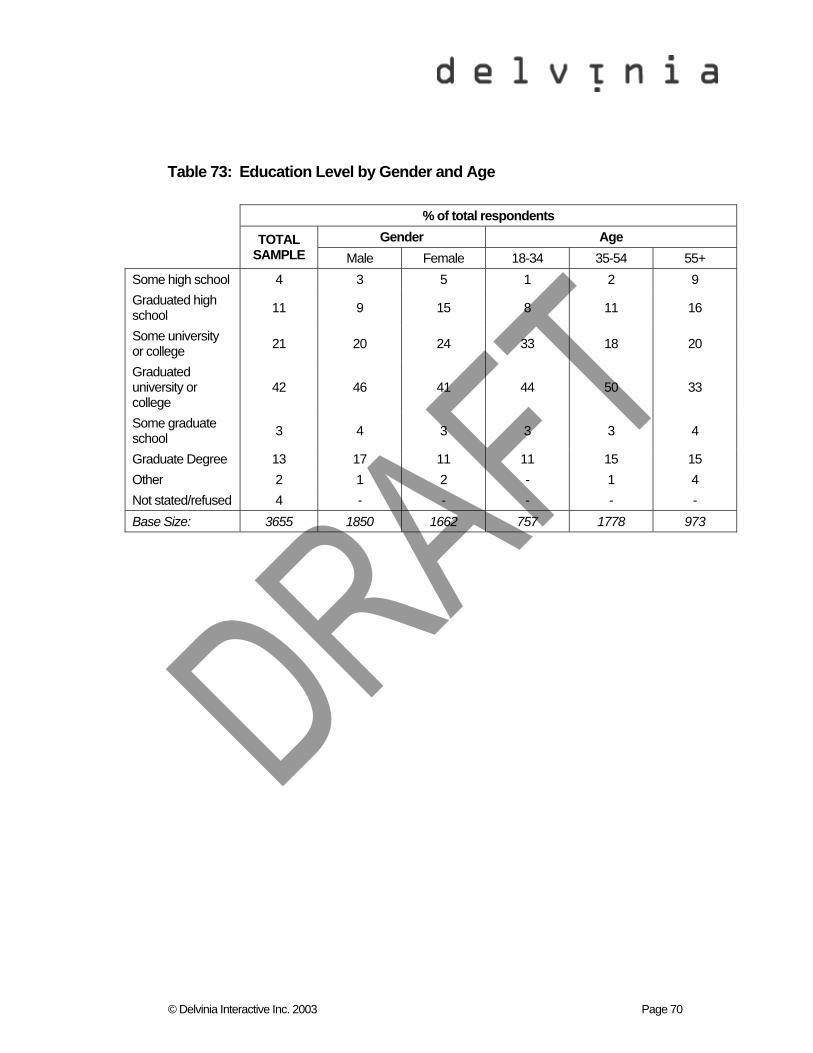
© Delvinia Interactive Inc. 2003 Page 70
Table 73: Education Level by Gender and Age
% of total respondents Gender Age
TOTAL SAMPLE Male Female 18-34 35-54 55+
Some high school 4 3 5 1 2 9 Graduated high school 11 9 15 8 11 16
Some university or college 21 20 24 33 18 20
Graduated university or college
42 46 41 44 50 33
Some graduate school 3 4 3 3 3 4
Graduate Degree 13 17 11 11 15 15 Other 2 1 2 - 1 4 Not stated/refused 4 - - - - - Base Size: 3655 1850 1662 757 1778 973
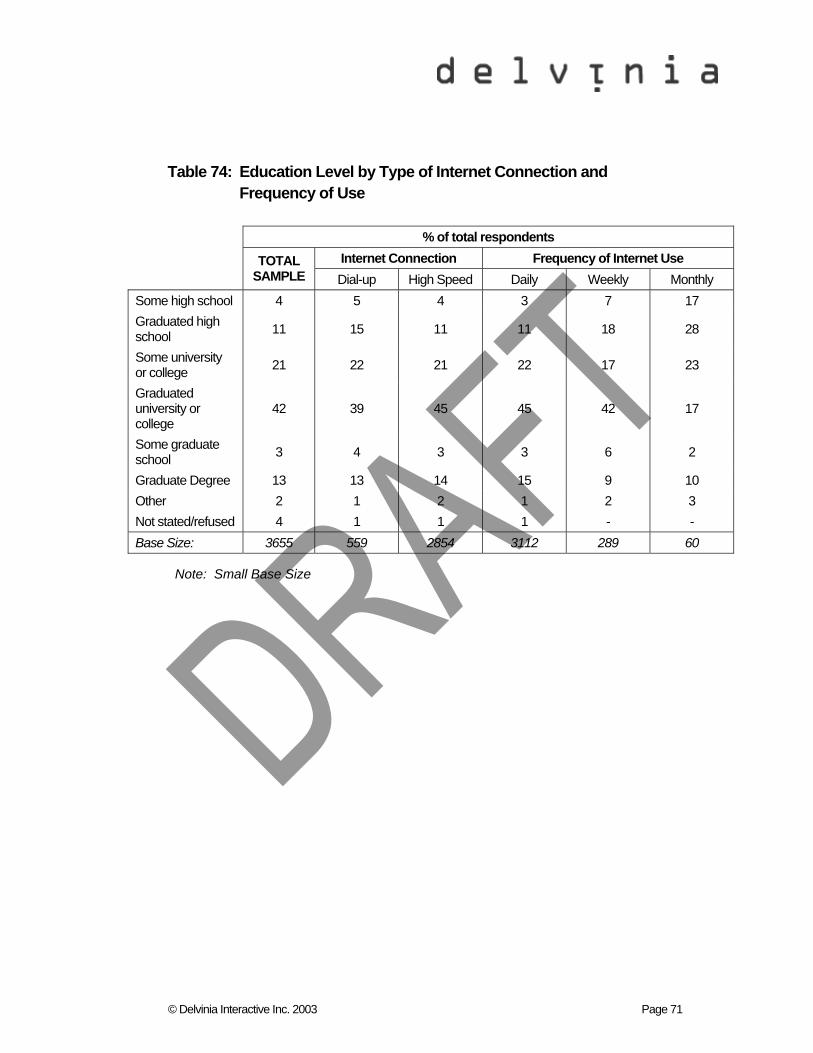
© Delvinia Interactive Inc. 2003 Page 71
Table 74: Education Level by Type of Internet Connection and Frequency of Use
% of total respondents Internet Connection Frequency of Internet Use
TOTAL SAMPLE Dial-up High Speed Daily Weekly Monthly
Some high school 4 5 4 3 7 17 Graduated high school 11 15 11 11 18 28
Some university or college 21 22 21 22 17 23
Graduated university or college
42 39 45 45 42 17
Some graduate school 3 4 3 3 6 2
Graduate Degree 13 13 14 15 9 10 Other 2 1 2 1 2 3 Not stated/refused 4 1 1 1 - - Base Size: 3655 559 2854 3112 289 60
Note: Small Base Size
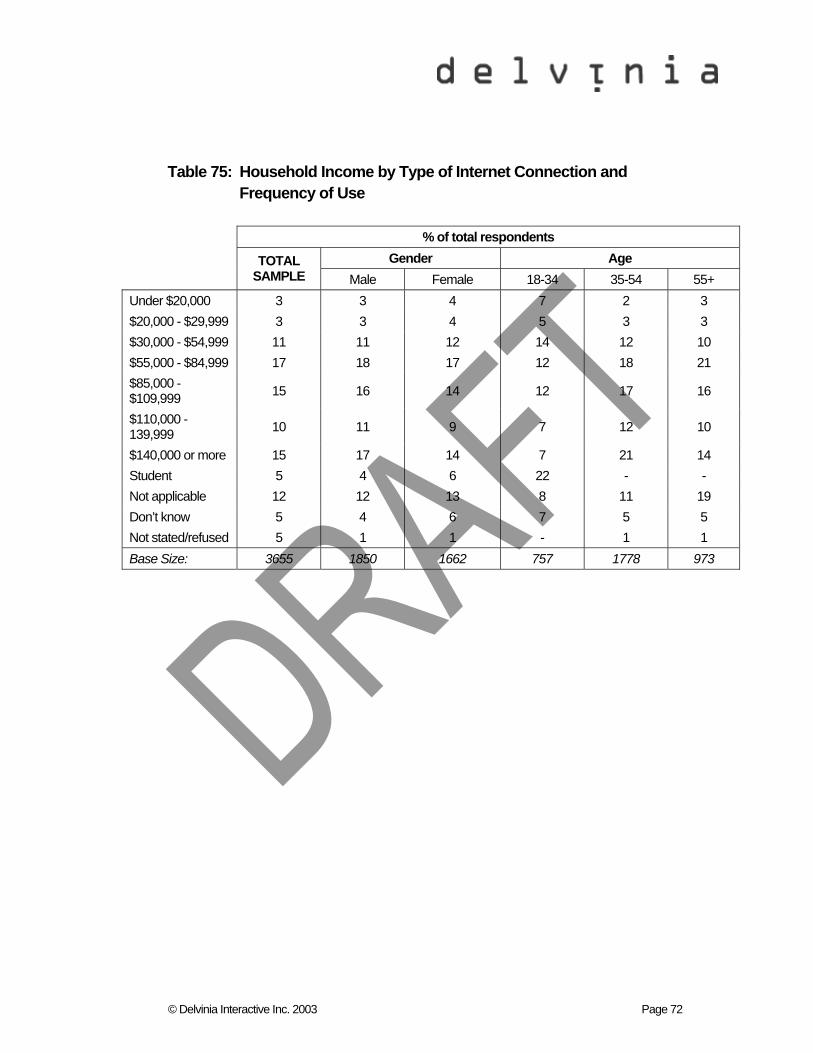
© Delvinia Interactive Inc. 2003 Page 72
Table 75: Household Income by Type of Internet Connection and Frequency of Use
% of total respondents Gender Age
TOTAL SAMPLE Male Female 18-34 35-54 55+
Under $20,000 3 3 4 7 2 3 $20,000 - $29,999 3 3 4 5 3 3 $30,000 - $54,999 11 11 12 14 12 10 $55,000 - $84,999 17 18 17 12 18 21 $85,000 - $109,999 15 16 14 12 17 16
$110,000 - 139,999 10 11 9 7 12 10
$140,000 or more 15 17 14 7 21 14 Student 5 4 6 22 - - Not applicable 12 12 13 8 11 19 Don’t know 5 4 6 7 5 5 Not stated/refused 5 1 1 - 1 1 Base Size: 3655 1850 1662 757 1778 973
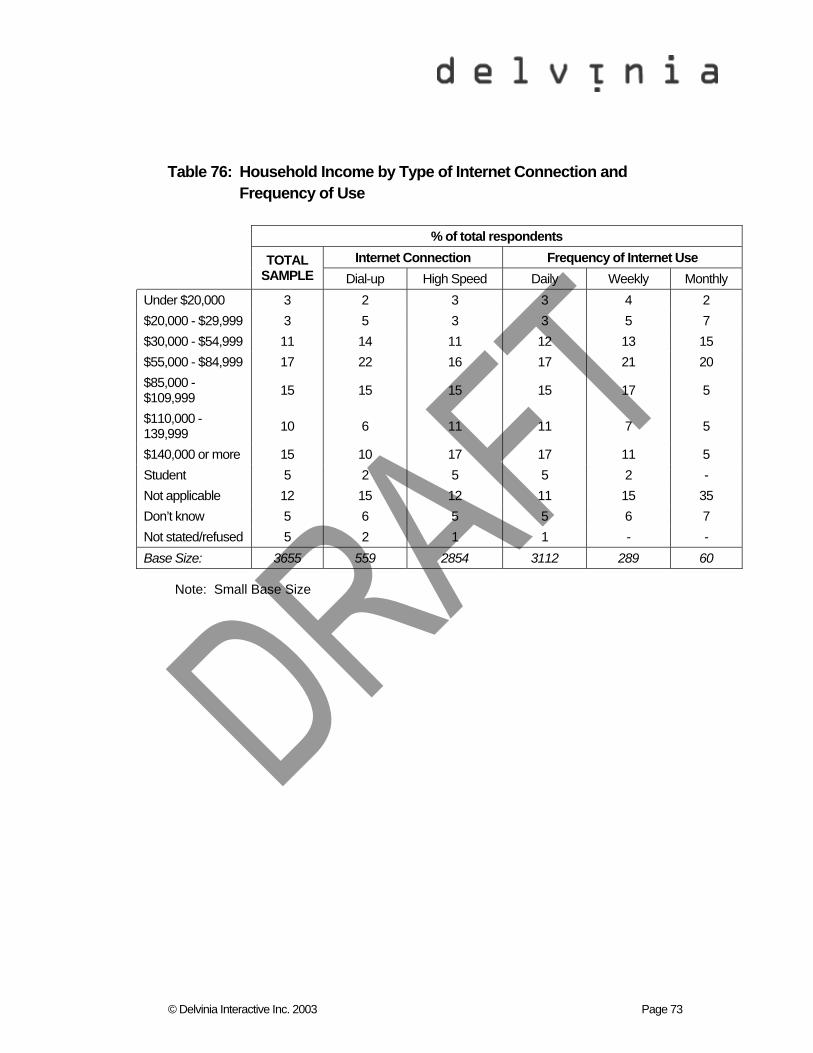
© Delvinia Interactive Inc. 2003 Page 73
Table 76: Household Income by Type of Internet Connection and Frequency of Use
% of total respondents
Internet Connection Frequency of Internet Use
TOTAL SAMPLE Dial-up High Speed Daily Weekly Monthly
Under $20,000 3 2 3 3 4 2 $20,000 - $29,999 3 5 3 3 5 7 $30,000 - $54,999 11 14 11 12 13 15 $55,000 - $84,999 17 22 16 17 21 20 $85,000 - $109,999 15 15 15 15 17 5
$110,000 - 139,999 10 6 11 11 7 5
$140,000 or more 15 10 17 17 11 5 Student 5 2 5 5 2 - Not applicable 12 15 12 11 15 35 Don’t know 5 6 5 5 6 7 Not stated/refused 5 2 1 1 - - Base Size: 3655 559 2854 3112 289 60
Note: Small Base Size
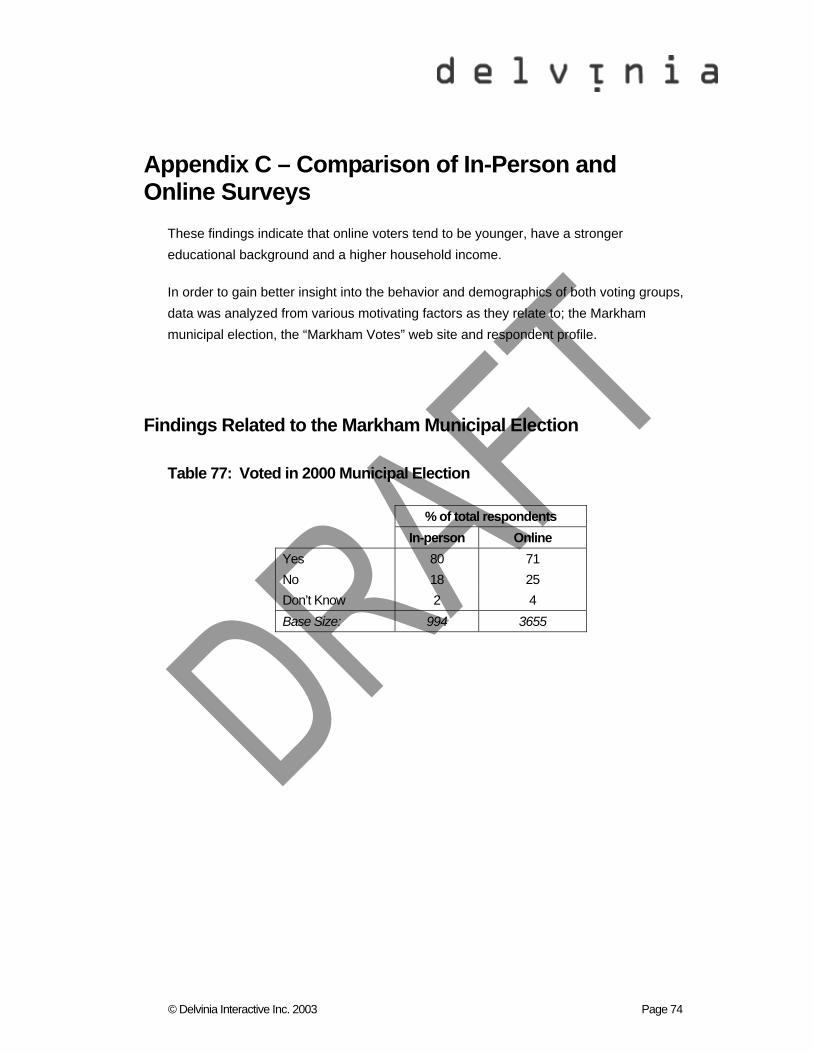
© Delvinia Interactive Inc. 2003 Page 74
Appendix C – Comparison of In-Person and Online Surveys
These findings indicate that online voters tend to be younger, have a stronger educational background and a higher household income.
In order to gain better insight into the behavior and demographics of both voting groups, data was analyzed from various motivating factors as they relate to; the Markham municipal election, the “Markham Votes” web site and respondent profile.
Findings Related to the Markham Municipal Election
Table 77: Voted in 2000 Municipal Election
% of total respondents In-person Online
Yes 80 71 No 18 25 Don’t Know 2 4 Base Size: 994 3655
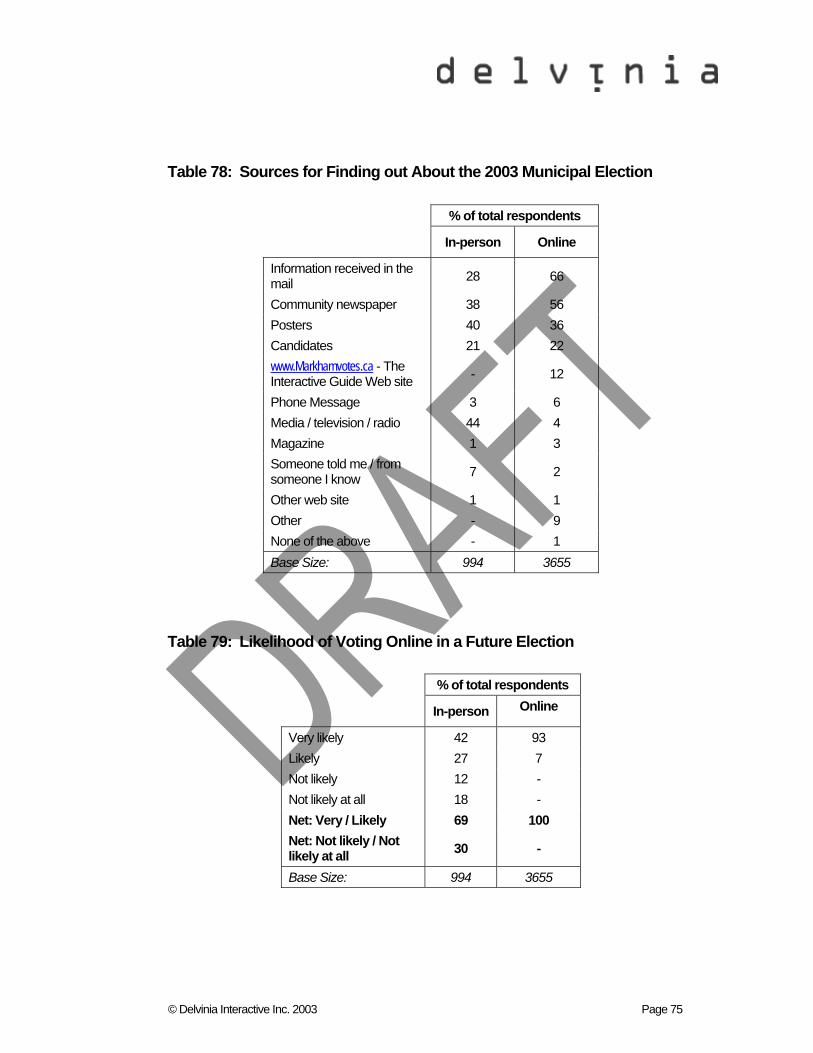
© Delvinia Interactive Inc. 2003 Page 75
Table 78: Sources for Finding out About the 2003 Municipal Election
% of total respondents
In-person Online
Information received in the mail 28 66
Community newspaper 38 56 Posters 40 36 Candidates 21 22 www.Markhamvotes.ca - The Interactive Guide Web site - 12
Phone Message 3 6 Media / television / radio 44 4 Magazine 1 3 Someone told me / from someone I know 7 2
Other web site 1 1 Other - 9 None of the above - 1 Base Size: 994 3655
Table 79: Likelihood of Voting Online in a Future Election
% of total respondents
In-person Online
Very likely 42 93 Likely 27 7 Not likely 12 - Not likely at all 18 - Net: Very / Likely 69 100 Net: Not likely / Not likely at all 30 -
Base Size: 994 3655
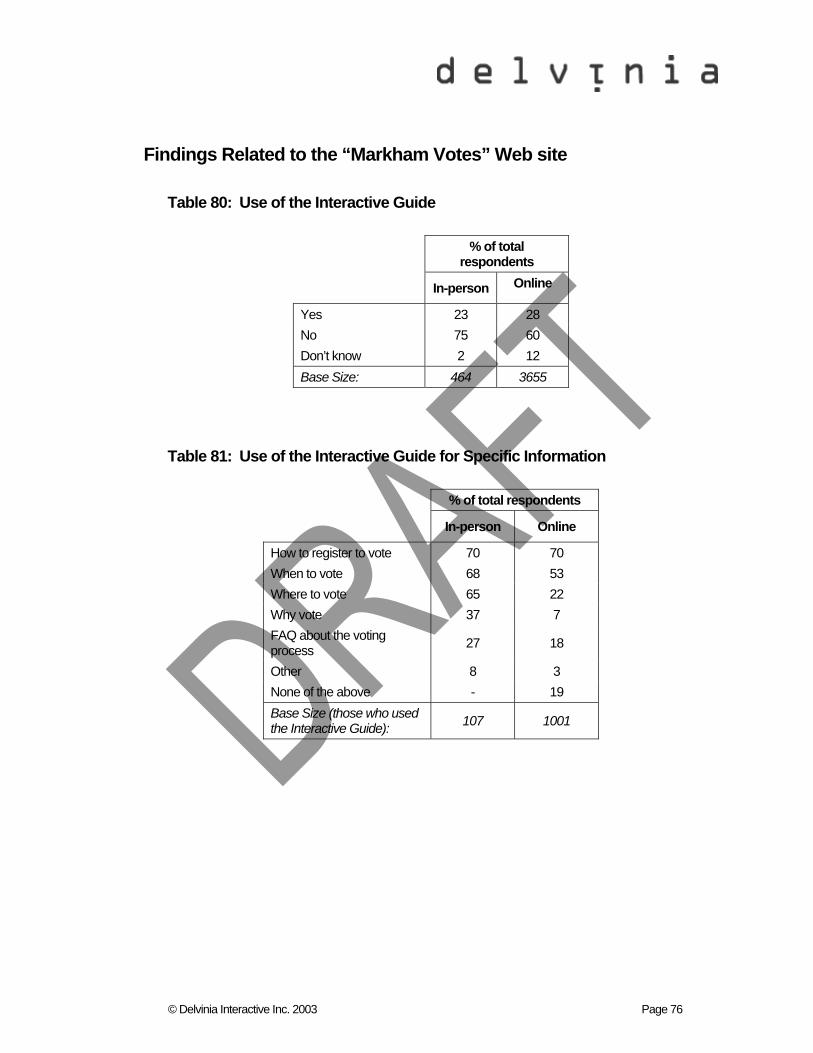
© Delvinia Interactive Inc. 2003 Page 76
Findings Related to the “Markham Votes” Web site
Table 80: Use of the Interactive Guide
% of total respondents
In-person Online
Yes 23 28 No 75 60 Don’t know 2 12 Base Size: 464 3655
Table 81: Use of the Interactive Guide for Specific Information
% of total respondents
In-person Online
How to register to vote 70 70 When to vote 68 53 Where to vote 65 22 Why vote 37 7 FAQ about the voting process 27 18
Other 8 3 None of the above - 19 Base Size (those who used the Interactive Guide): 107 1001
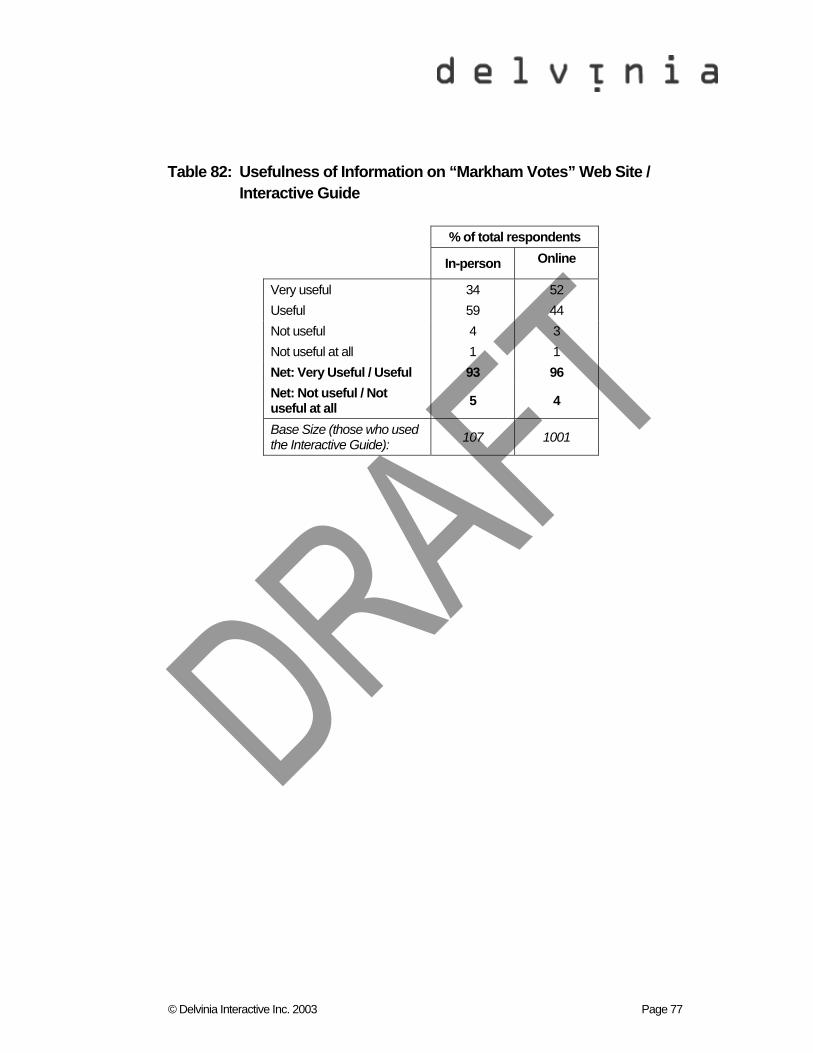
© Delvinia Interactive Inc. 2003 Page 77
Table 82: Usefulness of Information on “Markham Votes” Web Site / Interactive Guide
% of total respondents
In-person Online
Very useful 34 52 Useful 59 44 Not useful 4 3 Not useful at all 1 1 Net: Very Useful / Useful 93 96 Net: Not useful / Not useful at all 5 4
Base Size (those who used the Interactive Guide): 107 1001
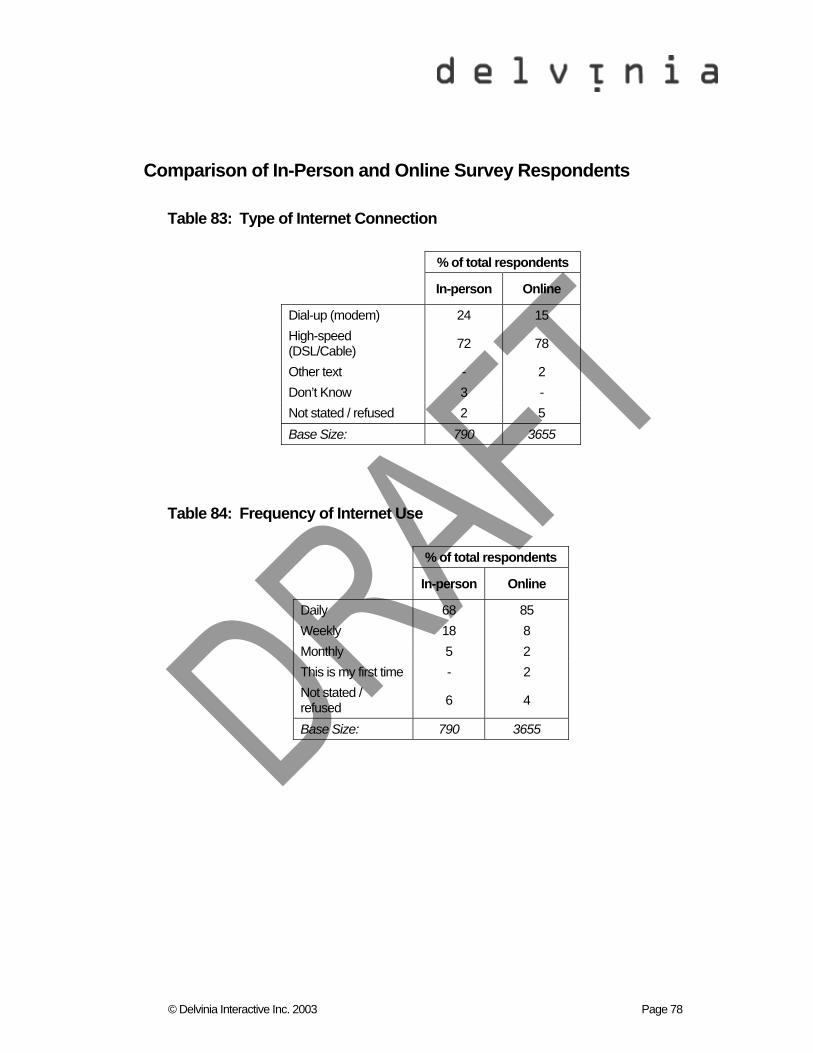
© Delvinia Interactive Inc. 2003 Page 78
Comparison of In-Person and Online Survey Respondents
Table 83: Type of Internet Connection
% of total respondents
In-person Online
Dial-up (modem) 24 15 High-speed (DSL/Cable) 72 78
Other text - 2 Don’t Know 3 - Not stated / refused 2 5 Base Size: 790 3655
Table 84: Frequency of Internet Use
% of total respondents
In-person Online
Daily 68 85 Weekly 18 8 Monthly 5 2 This is my first time - 2 Not stated / refused 6 4
Base Size: 790 3655
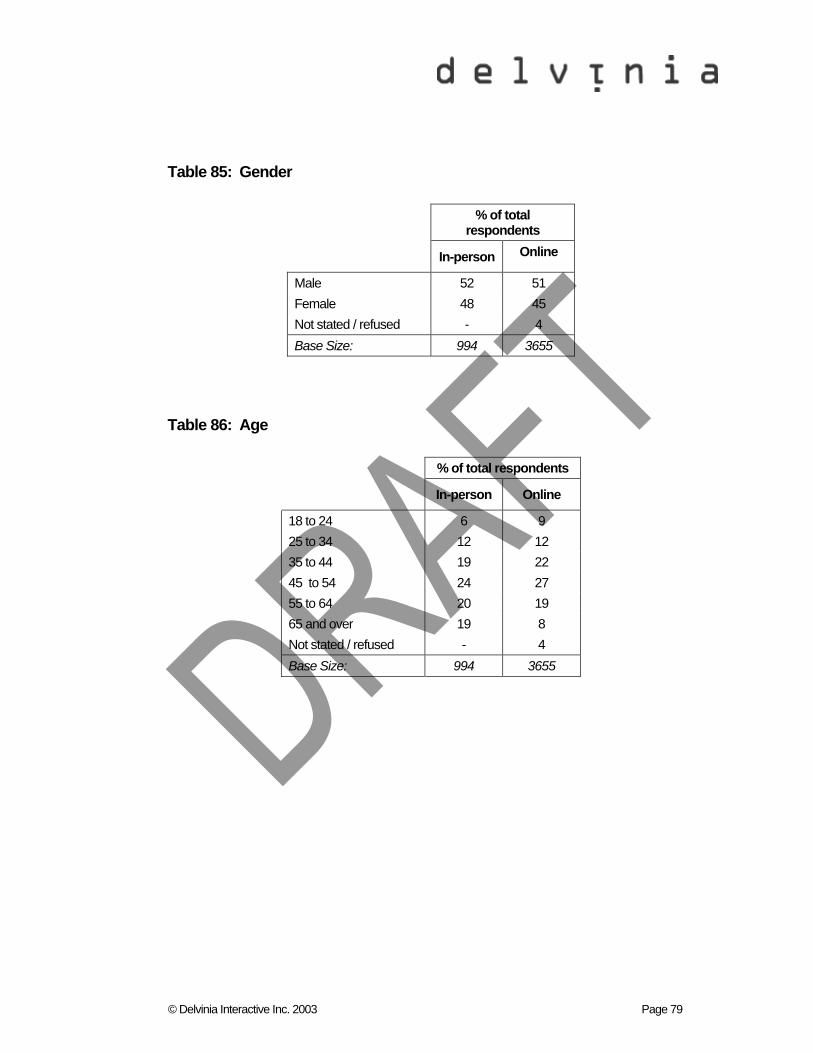
© Delvinia Interactive Inc. 2003 Page 79
Table 85: Gender
% of total respondents
In-person Online
Male 52 51 Female 48 45 Not stated / refused - 4 Base Size: 994 3655
Table 86: Age
% of total respondents
In-person Online
18 to 24 6 9 25 to 34 12 12 35 to 44 19 22 45 to 54 24 27 55 to 64 20 19 65 and over 19 8 Not stated / refused - 4 Base Size: 994 3655
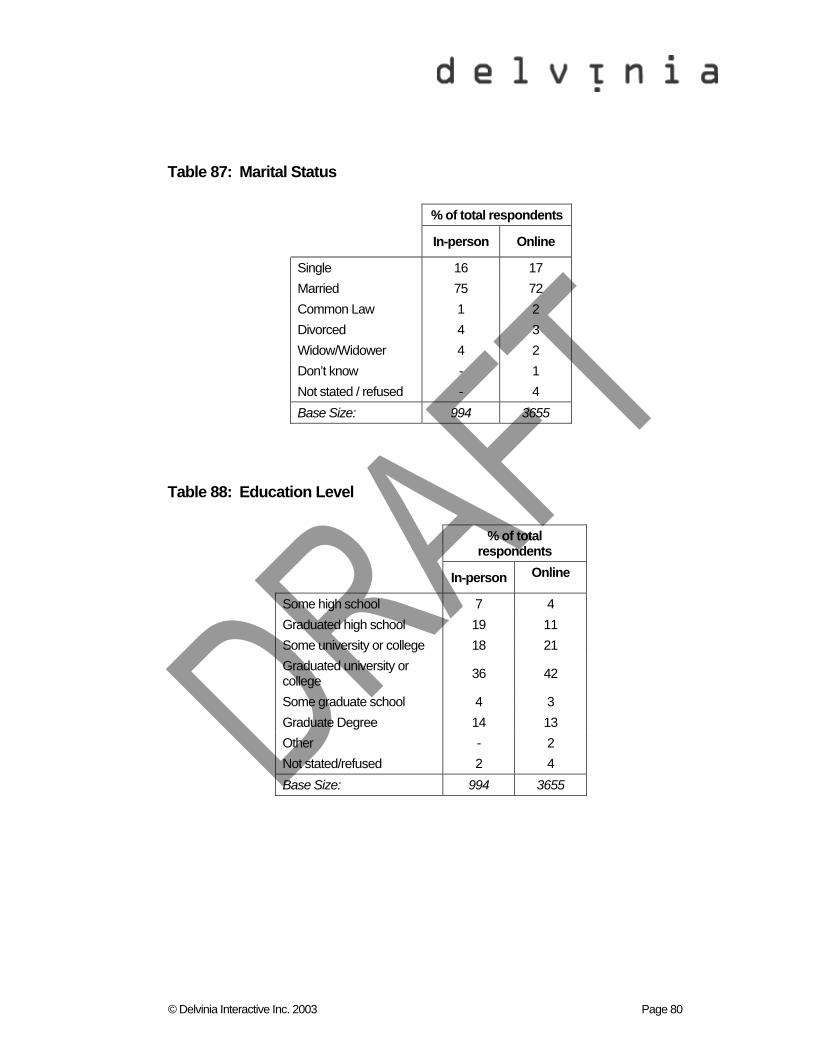
© Delvinia Interactive Inc. 2003 Page 80
Table 87: Marital Status
% of total respondents
In-person Online
Single 16 17 Married 75 72 Common Law 1 2 Divorced 4 3 Widow/Widower 4 2 Don’t know - 1 Not stated / refused - 4 Base Size: 994 3655
Table 88: Education Level
% of total respondents
In-person Online
Some high school 7 4 Graduated high school 19 11 Some university or college 18 21 Graduated university or college 36 42
Some graduate school 4 3 Graduate Degree 14 13 Other - 2 Not stated/refused 2 4 Base Size: 994 3655

© Delvinia Interactive Inc. 2003 Page 81
Table 89: Household Income
% of total respondents
In-person Online
Under $20,000 5 3 $20,000 - $29,999 7 3 $30,000 - $54,999 19 11 $55,000 - $84,999 18 17 $85,000 - $109,999 13 15 $110,000 - 139,999 9 10 $140,000 or more 10 15 Student - 5 Not applicable - 12 Don’t know 4 5 Not stated/refused 14 5 Base Size: 994 3655

© Delvinia Interactive Inc. 2003 Page 82
Appendix D – About the In-Person Survey Locations
Interviewers were placed at the following locations on Saturday, November 1st and Sunday, November 2nd, 2003 from 10am to 6pm:
Saturday, November 1st
Armadale Community Centre
Sunday, November 2nd
Armadale Community Centre
Thornhill Community Centre
One interviewer was placed at the Markham Civic Centre from November 3rd to 7th in order to intercept in-person advanced voters. The interviewer’s shift was 10am to 8pm.
One interviewer was placed at the following Markham locations on Monday, November 10th, 10am to 8pm:
Hendersen Avenue Public School
St Rene Goupil Catholic School
William Berezy Public School
Raymer Wood Public School
Cornell Village Public School
St. Monica Catholic School
Armadale Public School
Milliken Mills Public School
Interviewers approached potential respondents after they had voted and administered a 5 to 7 minute questionnaire. The completed surveys were then sent to Millward Brown Goldfarb for validation, key punching and data processing. If a survey was found to be incomplete, it was not counted in the final sample size.
To review the gender and age breakdown of the in-person respondents, please refer to the Respondent Profiles or Table 74, where the location of respondents was segmented by respondent age and gender.
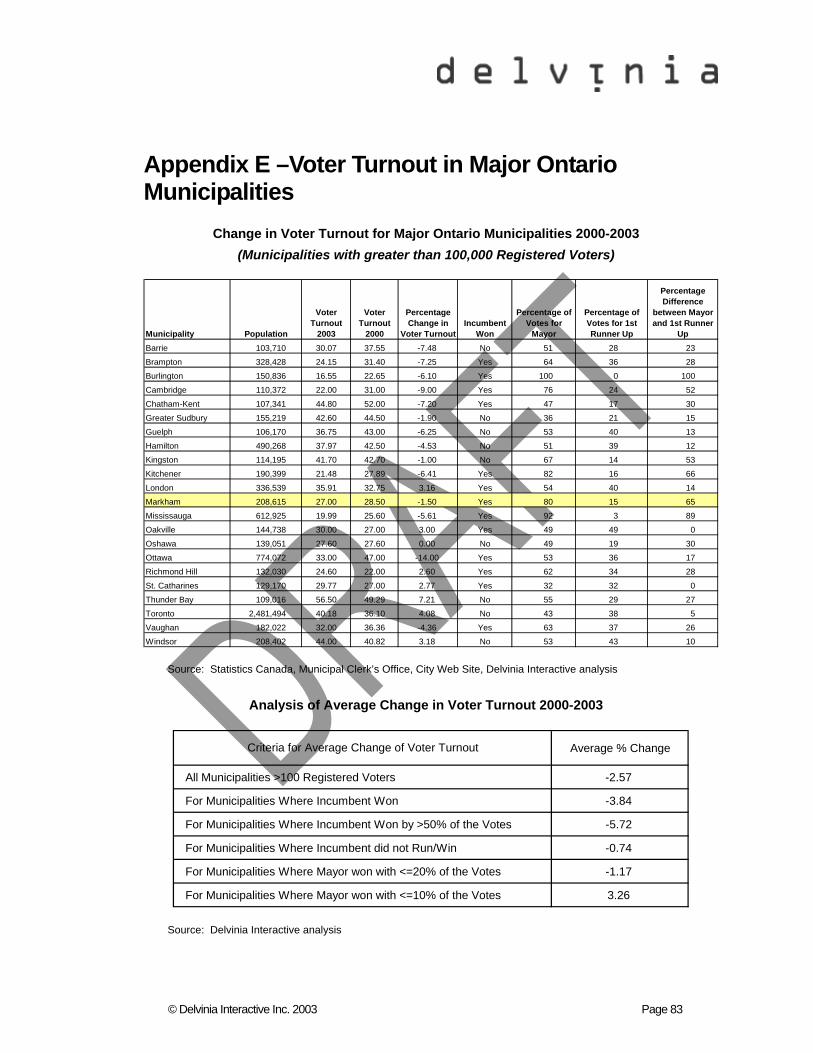
© Delvinia Interactive Inc. 2003 Page 83
Average % Change
All Municipalities >100 Registered Voters -2.57
For Municipalities Where Incumbent Won -3.84
For Municipalities Where Incumbent Won by >50% of the Votes -5.72
For Municipalities Where Incumbent did not Run/Win -0.74
For Municipalities Where Mayor won with <=20% of the Votes -1.17
For Municipalities Where Mayor won with <=10% of the Votes 3.26
Criteria for Average Change of Voter Turnout
Appendix E –Voter Turnout in Major Ontario Municipalities
Change in Voter Turnout for Major Ontario Municipalities 2000-2003 (Municipalities with greater than 100,000 Registered Voters)
Source: Statistics Canada, Municipal Clerk’s Office, City Web Site, Delvinia Interactive analysis
Analysis of Average Change in Voter Turnout 2000-2003
Source: Delvinia Interactive analysis
Municipality Population
Voter Turnout
2003
Voter Turnout
2000
Percentage Change in
Voter TurnoutIncumbent
Won
Percentage of Votes for
Mayor
Percentage of Votes for 1st Runner Up
Percentage Difference
between Mayor and 1st Runner
UpBarrie 103,710 30.07 37.55 -7.48 No 51 28 23
Brampton 328,428 24.15 31.40 -7.25 Yes 64 36 28
Burlington 150,836 16.55 22.65 -6.10 Yes 100 0 100
Cambridge 110,372 22.00 31.00 -9.00 Yes 76 24 52
Chatham-Kent 107,341 44.80 52.00 -7.20 Yes 47 17 30
Greater Sudbury 155,219 42.60 44.50 -1.90 No 36 21 15
Guelph 106,170 36.75 43.00 -6.25 No 53 40 13
Hamilton 490,268 37.97 42.50 -4.53 No 51 39 12
Kingston 114,195 41.70 42.70 -1.00 No 67 14 53
Kitchener 190,399 21.48 27.89 -6.41 Yes 82 16 66
London 336,539 35.91 32.75 3.16 Yes 54 40 14
Markham 208,615 27.00 28.50 -1.50 Yes 80 15 65
Mississauga 612,925 19.99 25.60 -5.61 Yes 92 3 89
Oakville 144,738 30.00 27.00 3.00 Yes 49 49 0
Oshawa 139,051 27.60 27.60 0.00 No 49 19 30
Ottawa 774,072 33.00 47.00 -14.00 Yes 53 36 17
Richmond Hill 132,030 24.60 22.00 2.60 Yes 62 34 28
St. Catharines 129,170 29.77 27.00 2.77 Yes 32 32 0
Thunder Bay 109,016 56.50 49.29 7.21 No 55 29 27
Toronto 2,481,494 40.18 36.10 4.08 No 43 38 5
Vaughan 182,022 32.00 36.36 -4.36 Yes 63 37 26
Windsor 208,402 44.00 40.82 3.18 No 53 43 10

© Delvinia Interactive Inc. 2003 Page 84
Appendix F – About the Municipalities on Demand Project
Overview
To execute this research study, Delvinia Interactive Inc. partnered with the Town of Markham and developed a broadband-based interactive web site which featured a full motion video and dynamically presented information about the registration process, voting methods as well as key dates and Polling Station locations. The web site was called the Interactive Guide and was accessed through the “Markham Votes” web site. After the Interactive Guide was launched on September 8, 2003, through a user survey, Delvinia accumulated data to assess the effectiveness of this web site in communicating the electoral process to the public.
In addition to leading the research, Delvinia Interactive was awarded The Town of Markham’s 2003 Voter Outreach Campaign. The campaign’s objectives were to evoke a positive public interest in Markham’s election process and to encourage citizens to participate more in their local government. Delvinia developed and executed an integrated communications campaign blending offline tactics with the online presence of the Interactive Guide, in order to build voter awareness about the election and Internet voting. As part of the research, the effectiveness of the various communications tactics were also analyzed to enable the Town of Markham to evaluate which tactics influenced voters most.
The scope of the Voter Outreach Campaign required Delvinia to develop a theme, creative concepts, manage production of materials and execute media tactics. Delvinia worked closely with the Town of Markham to insure the communications campaign had a ‘single-minded’ focus and consistency across the entire media mix.

© Delvinia Interactive Inc. 2003 Page 85
Project Objectives
• Communication Elements
• Develop a positive public interest and awareness in the Town of Markham election process by educating citizens about “how to vote”
• Encourage citizens to participate more in their local government
• Drive people to vote and try online voting
• Increase voter turnout
• Performance Tracking
• Measure effectiveness of various online and off line tactics for communicating the election process
• Gain a better understanding of voters’ profile and needs for future elections
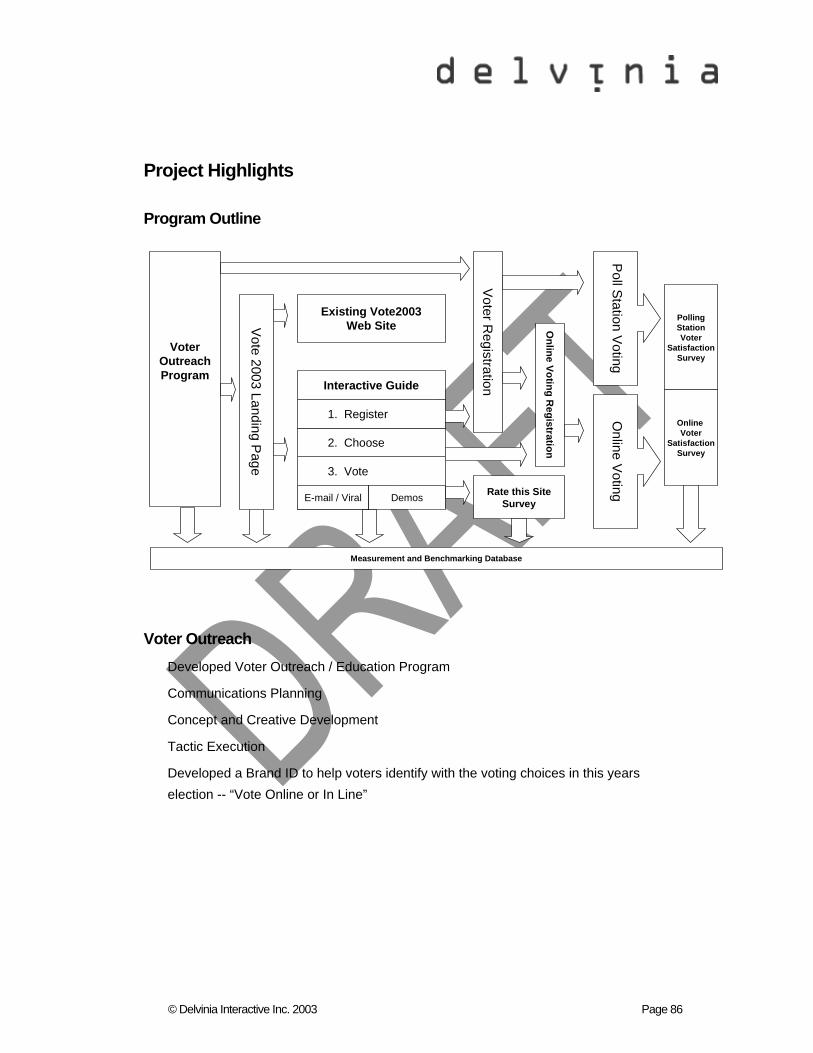
© Delvinia Interactive Inc. 2003 Page 86
Project Highlights
Program Outline
Voter Outreach Developed Voter Outreach / Education Program
Communications Planning
Concept and Creative Development
Tactic Execution
Developed a Brand ID to help voters identify with the voting choices in this years election -- “Vote Online or In Line”
Voter Outreach Program
Vote 2003 Landing P
age 3. Vote
Existing Vote2003Web Site
2. Choose
Poll S
tation Voting
Voter R
egistration
Online Voting R
egistration
1. Register
Interactive Guide
PollingStationVoter
SatisfactionSurvey
OnlineVoter
SatisfactionSurvey
Rate this SiteSurvey
Measurement and Benchmarking Database
E-mail AlertE-mail / Viral Demos
Online V
oting
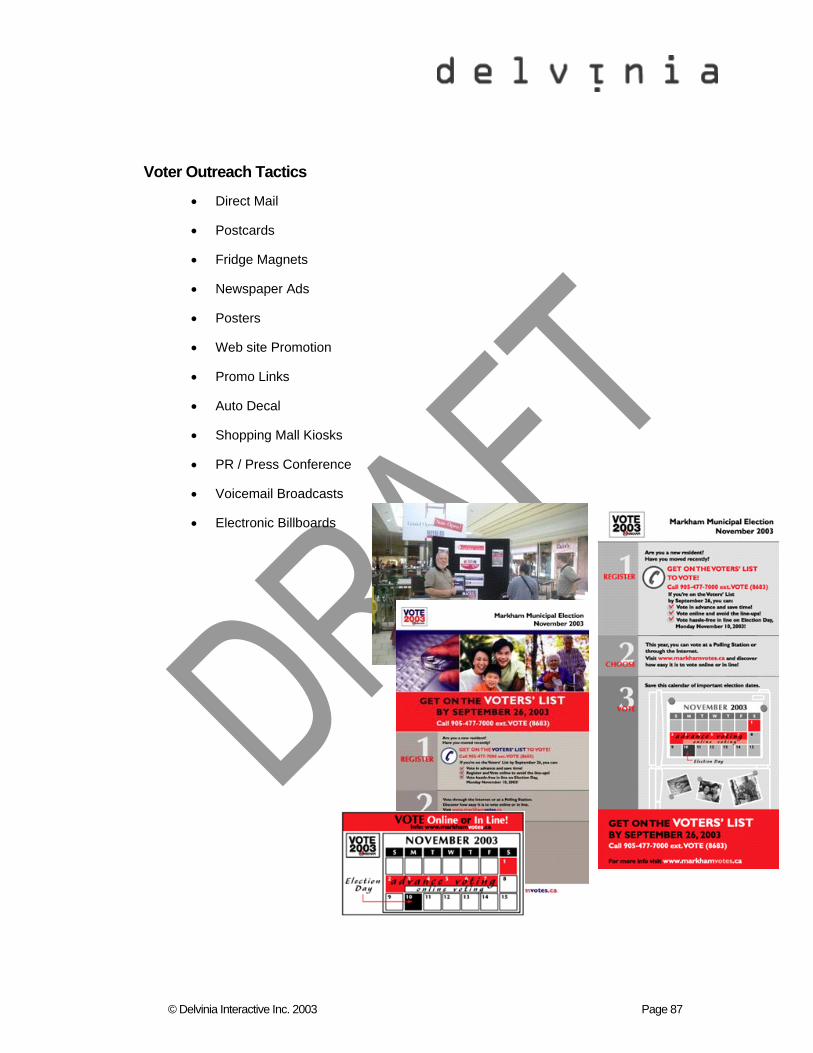
© Delvinia Interactive Inc. 2003 Page 87
Voter Outreach Tactics
• Direct Mail
• Postcards
• Fridge Magnets
• Newspaper Ads
• Posters
• Web site Promotion
• Promo Links
• Auto Decal
• Shopping Mall Kiosks
• PR / Press Conference
• Voicemail Broadcasts
• Electronic Billboards
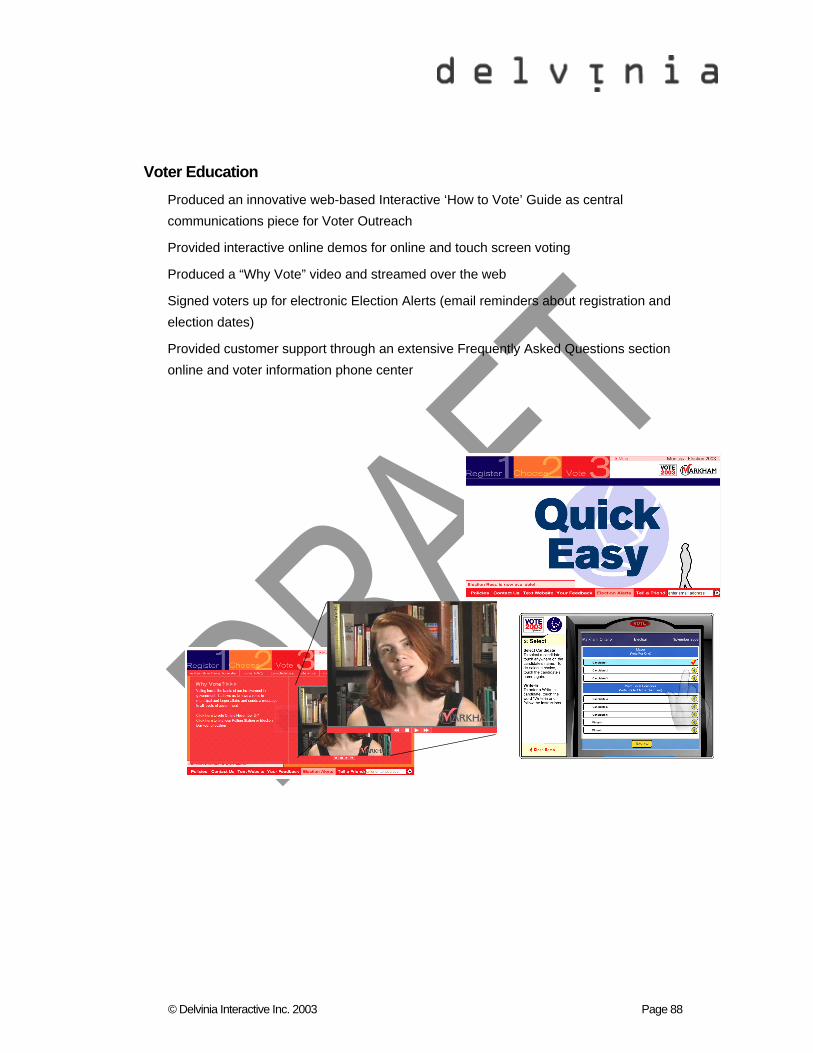
© Delvinia Interactive Inc. 2003 Page 88
Voter Education Produced an innovative web-based Interactive ‘How to Vote’ Guide as central communications piece for Voter Outreach
Provided interactive online demos for online and touch screen voting
Produced a “Why Vote” video and streamed over the web
Signed voters up for electronic Election Alerts (email reminders about registration and election dates)
Provided customer support through an extensive Frequently Asked Questions section online and voter information phone center
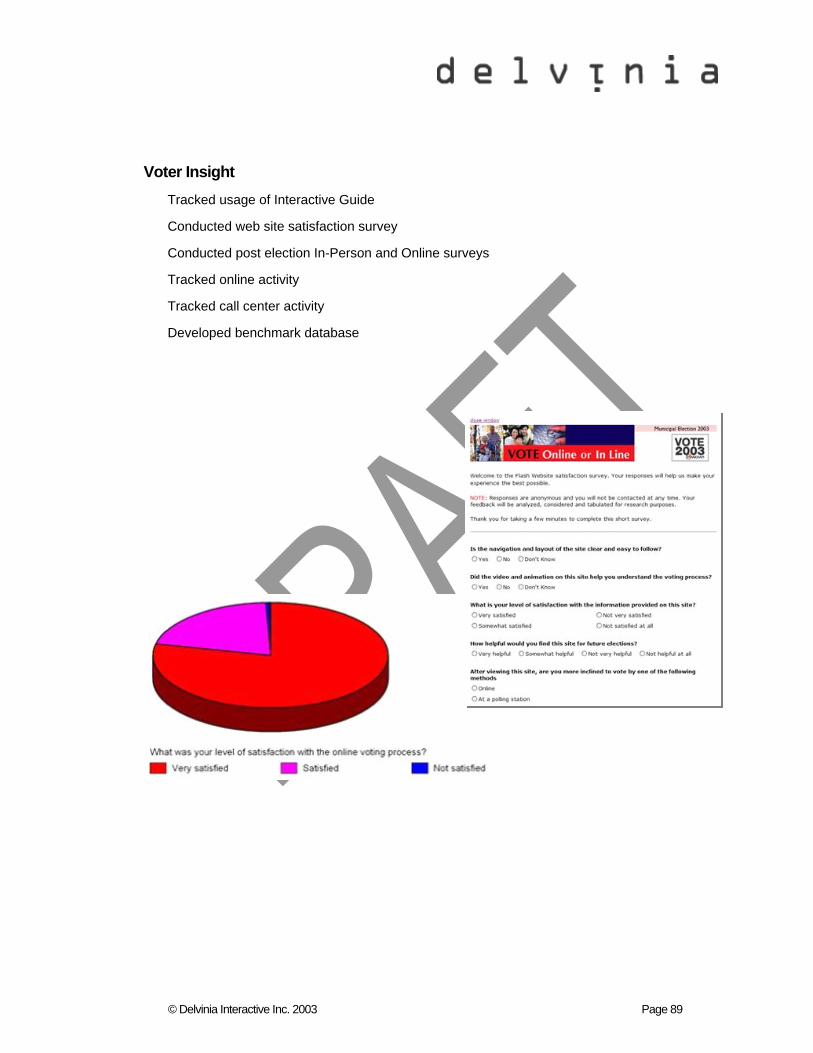
© Delvinia Interactive Inc. 2003 Page 89
Voter Insight Tracked usage of Interactive Guide
Conducted web site satisfaction survey
Conducted post election In-Person and Online surveys
Tracked online activity
Tracked call center activity
Developed benchmark database
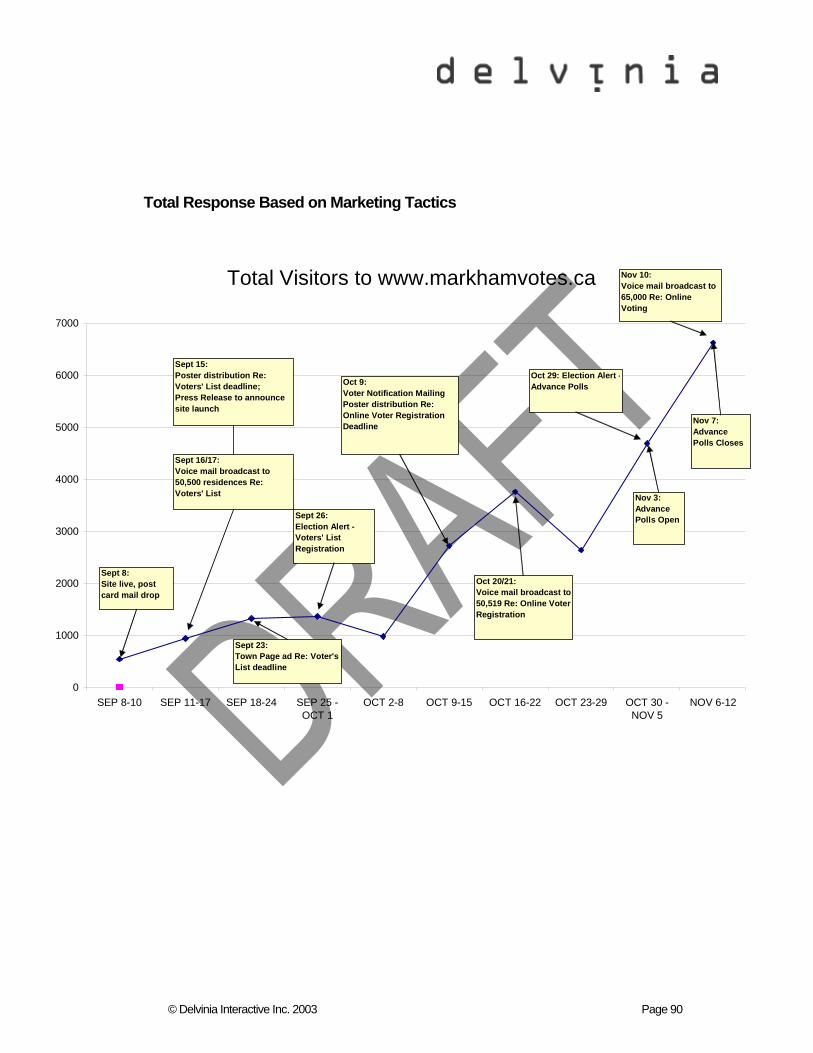
© Delvinia Interactive Inc. 2003 Page 90
Total Response Based on Marketing Tactics
Total Visitors to www.markhamvotes.ca
0
1000
2000
3000
4000
5000
6000
7000
SEP 8-10 SEP 11-17 SEP 18-24 SEP 25 -OCT 1
OCT 2-8 OCT 9-15 OCT 16-22 OCT 23-29 OCT 30 -NOV 5
NOV 6-12
Sept 8: Site live, post card mail drop
Sept 15: Poster distribution Re: Voters' List deadline;Press Release to announce site launch
Sept 16/17: Voice mail broadcast to 50,500 residences Re: Voters' List
Sept 23: Town Page ad Re: Voter's List deadline
Sept 26: Election Alert - Voters' List Registration
Oct 9: Voter Notification MailingPoster distribution Re: Online Voter Registration Deadline
Oct 20/21: Voice mail broadcast to 50,519 Re: Online Voter Registration
Oct 29: Election Alert -Advance Polls
Nov 10: Voice mail broadcast to 65,000 Re: Online Voting
Nov 3:Advance Polls Open
Nov 7:Advance Polls Closes

© Delvinia Interactive Inc. 2003 Page 91
Project Outcomes
• Over 19,000 unique visitors to www.Markhamvotes.ca
• Over 12,000 people visited Interactive Guide “How to Vote” web site
• Over 11,700 registered for online voting
• 7,211 people voted online (17% of overall voter turnout)
• Advance Polls up by 300% due to online voting
• Over 300 completed “Rate this Site” online surveys
• Over 3,600 Online Voter Satisfaction Surveys completed
• Almost 1,000 In-Person Polling Station Voter Satisfaction Surveys completed

© Delvinia Interactive Inc. 2003 Page 92
Appendix G – About Delvinia Interactive Inc. Delvinia is an award-winning digital marketing and applied research firm dedicated to helping corporations and government clients acquire, retain and better understand their customers through the use of interactive and digital marketing channels.
Located in Toronto, Ontario, Delvinia’s eclectic team is known for combining the best practices of business communications with the creativity of new media designers to develop interactive communications tools for companies across all vertical markets; from corporate, to not-for-profit or government. Featured clients span the range from provincial, national to international and include RBC Royal Bank, CBC, Harlequin Enterprises, Pfizer Canada, City of Toronto and Canadian Heritage.
Delvinia Interactive is considered to be one of the area’s most long-standing and unique agencies in the media industry. Since 1996, Delvinia has demonstrated a commitment to the ongoing growth of the digital marketing industry. Having conducted studies into the health and needs of the new media industry, Delvinia has drafted policy recommendations for every level of government, and has participated in HR initiatives to ensure that the industry has the skills necessary to meet evolving customer demands. Delvinia functions on the core promise to develop innovative and dynamic ideas and demonstrate an unbridled commitment to translate clients’ business goals into engaging and profitable user experiences.
For more information, please visit www.delvinia.com or call (416) 364-1455.

© Delvinia Interactive Inc. 2003 Page 93
Appendix H – About the Town of Markham Well known as "Canada's HIGH-TECH Capital", the Town of Markham is the largest of nine communities in York Region with a population of approximately 220 000, and a land area 211.53 square kilometers. Markham is also
The Town of Markham is a blend of four communities - Markham Village, Unionville, Milliken and Thornhill. This municipality is located just north of Toronto in Ontario, Canada. The Town of Markham is a growing community with new housing developments and businesses, quality schools, parks and recreational areas. Markham is a mixture of small town, with some farms in the area and large town because it hosts corporate head offices for companies such as IBM and American Express.
For more information, please visit www.Markham.ca

© Delvinia Interactive Inc. 2003 Page 94
Appendix I – About CANARIE Inc. Canarie Inc. is Canada's advanced Internet development organization, a not-for-profit corporation supported by its members, project partners and the Federal Government.
Canarie's mission is to accelerate Canada's advanced Internet development and use by facilitating the widespread adoption of faster, more efficient networks and by enabling the next generation of advanced products, applications and services to run on them.
Headquartered in Ottawa, Ontario, Canarie employs 31 full-time staff dedicated to the research and implementation of advanced networks and applications that will stimulate economic growth and increase Canada's international competitiveness.
Canarie has already succeeded in enhancing Canadian R&D Internet speeds by a factor of almost one million since its inception in 1993. The organization has also funded numerous advanced Internet applications projects, providing some 500 companies with the opportunity to achieve business success through innovation.
Canarie also intends to act as a catalyst and partner with governments, industry and the research community to increase overall IT awareness, ensure continuing promotion of Canadian technological excellence and ultimately, foster long-term productivity and improvement of living standards.
About the Canarie Advance Research in Interactive Media Program
In order to encourage the delivery of Canadian Content and Culture in a Broadband environment, Canarie and the Department of Canadian Heritage have jointly launched the Applied Research in Interactive Media (ARIM) Program. Funding from this program will support projects consisting of research and development of broadband technologies and tools that facilitate the creation and use of broadband content, or projects that perform research to address existing barriers to accessing broadband content. This six million dollar fund is composed of equal contributions from both Canadian Heritage and Canarie.
For more information, please visit www.canarie.ca