Embed Size (px)
Citation preview
Preprint submitted to Design Studies 1 November 16, 2015
Interventions for Teaching Sketching Skills and
Reducing Inhibition for Novice Engineering Designers
Joran W. Booth1, Elkin A. Taborda
2, Karthik Ramani, and Tahira Reid, The C-Design
Lab and the REID Lab, Department of Mechanical Engineering, Purdue University 585
Purdue Mall West Lafayette, IN, 47906, USA
Abstract
This paper explores improving sketching skills and reducing the inhibition to
sketch for student designers. In the first study, students were taught sketching
skills through an in-class workshop. The effect was evaluated using a pre-mid-
post test (n=40). In the second study, students were led through art activities to
reduce their inhibition to sketch. The effect was tested using another pre-mid-
post test (n=26). The first study found sketching skills increased, but declined
with disuse. The second study found reduced inhibition immediately after the
workshop, an increase after the sketch skills workshop, and a decrease over the
semester. This suggests that sketch training and inhibition-reducing exercises
are effective in the short term, but must be emphasized over time for a
permanent change.
Keywords:
Drawing, Design tools, Design education, Creativity, Sketch Inhibition
1Corresponding Author: Joran W. Booth, [email protected], 1-765-494-7209
2Present Address: La Escuela de Ingeniería Mecanica, Universidad Pontifica
Bolivariana, Medellin, Colombia
Accepted for Design Studies
Visual representations are an integral part of the design process (Buxton, 2007;
McKim, 1980; Goldschmidt, 1991). Expert designers create visualizations and
rapidly shift between design tasks, particularly during the problem generation
stage (Cross, 2004; Atman et al., 2007). During ideation, freehand sketching
Preprint submitted to Design Studies 2 November 16, 2015
helps designers handle different levels of abstraction (Goldschmidt, 1991; Cross,
1999), think through problems (Cross, 1999; Buxton, 2007), understand ill-
defined problems (Cross, 1989), extend short-term memory for problem-solving
(Ullman, 2003; Schutze et al., 2003), and aid communication and team building
(Goldschmidt, 2007). Sketches, as opposed to drawings or illustrations (Pei et
al., 2011), have the characteristics of being disposable, rapid, vague, subject to
reinterpretation, and include only enough information to communicate an idea,
but not more (Buxton, 2007; Tovey et al., 2003; Rodgers et al., 2000). Because
of these elements, sketches are often unintelligible outside the original context in
which they were drawn (Buxton, 2007).
While researchers know that visualization is important in design, few
engineering design curricula teach ambiguous, freehand sketching as a tool for
design thinking (Ullman et al., 1990; Ferguson, 1992; Linsey et al., 2011). Many
institutions treat freehand sketching as unnecessary and only teach it to
emphasize the principles of engineering drawing and CAD (Duff & Ross, 1995;
Mohler, 2008). Perhaps due to the lack of sketch training, CAD is being used
earlier in the design process. However, the early use of CAD leads to
circumscribed thinking, premature fixation, and bounded ideation (Robertson &
Radcliffe, 2009; Lawson, 2002; Yang, 2005; Walther et al., 2007). Therefore,
there is a need to reintroduce freehand sketching in design education (Ullman et
al., 1990). A few efforts in engineering have already been made in this area, and
we propose two interventions that build on these. In this paper, we describe past
efforts and motivations for sketch training, and propose and test a pedagogical
approach to encourage design thinking through the use of sketching, prior to the
use of CAD in detailed design. We also describe and test a set of art-based
interventions designed to reduce student inhibition to sketch. We test these
techniques in a toy design course, and report our preliminary outcomes.
1. Background
Sketching has been frequently studied in design (Dinar et al., 2014). Freehand
sketching improves the quality and novelty of ideas (McKoy et al., 2001) and
Preprint submitted to Design Studies 3 November 16, 2015
the quantity of ideas (Hernandez et al., 2012). It is not certain if sketching
correlates with the quality of the final design (Song & Agogino, 2004), or not
(Yang & Cham, 2007; Yang, 2009). Ideas communicated with high-quality
sketches are much more likely to be perceived as creative compared with the
same ideas shown with low-quality sketches (Kudrowitz et al., 2012). This gives
a good sketcher an advantage over other designers. It has also been found that
sketching is most effective when paired with other forms of communication,
such as annotations, verbal communication, or hand gestures (Song & Agogino,
2004; Yang, 2009; Adler & Davis, 2007; Purcell & Gero, 1998). While each of
these media is important, sketching is suggested to be the most important for
ideation (McKoy et al., 2001; Linsey et al., 2011). As a result, some proposed
ideation techniques are built solely on the principle of sketching (e.g.
“brainsketching” (van der Lugt, 2002)). While many studies have explored the
effect of sketching, virtually none of these have trained their participants in
freehand sketching prior to the study. At first glance, it may seem trivial to train
students to sketch, especially since it is so informal (Buxton, 2007). However,
when we look at the history of art, we find that the skills for sketching have
taken a long time to develop. For example, perspective drawing was so non-
intuitive that our modern version was only re-discovered after 1000 years, and
then only by unusual means. Spatial depth was known in Grecian and Roman art
(e.g. in Pompeii (Curran, 1988)), but these techniques were lost. When realism
came back into fashion in the Renaissance, artists struggled for centuries to
identify a viable system for perspective. Giotto proposed a systematic method
based on algebra; however it was not fully convincing (Payne, 2012). Only in
1413 was it rediscovered. Brunelleschi painted a scene on a mirror and
discovered after that the lines of the painting converged to a similar point on the
horizon (Payne, 2012). In hindsight, it seems obvious that vanishing points on a
horizon would lead to perspective, but the history only serves to underscore the
non-intuitive nature of it. Similarly, mastery of other sketching skills requires
training and practice.
1.1. Factors that Inhibit Sketching
Preprint submitted to Design Studies 4 November 16, 2015
While sketching is important, many studies have noted that design students are
reluctant to sketch. We define this reluctance as “inhibition”. We gathered
various studies that describe a reluctance to sketch and categorized them into
different sources of inhibition. We also defined one type based on our own in-
class experiences. The effect of these factors is that they tend to cause high
cognitive load, which load is correlated with lower creative output (Martindale,
1999). This effect is undesirable when generating concepts.
Personal inhibition - trying to make the sketch too perfect on the first try,
or become preoccupied with the mechanics of sketching or drawing
(Pable, 2008).
Intellectual inhibition - the belief that sketching is not relevant to
engineering or design, or ignorance of its importance (Schmidt et al.,
2012).
Skill-set inhibition - a perceived or real deficiency in skill that can be
addressed by training or practice (Richards, 2013; Yang and Cham, 2007).
Social inhibition - the fear of being unfavorably judged by others
(Farzaneh et al., 2012), as related to the fear of public speaking (Rattine
Flaherty, 2014).
Social loafing and matching - when group participants try to minimize
their contribution to the group (Farzaneh et al., 2012), and therefore
do not sketch.
Situational inhibition - when a sketcher is not in a proper state of mind to
allow the “flow of consciousness” or “feeling” of the sketch (Garner,
1990).
Technological inhibition - a greater interest in digital visualizations,
especially 3-D ones, than analog 2-D ones (Oehlberg et al., 2009)
(Based on in-class observations) Comparative inhibition - caused by the
presence of a superior sketcher or recent exposure to a high-quality sketch
or drawing.
1.2. Interventions for Teaching Sketching Skills and Reducing Inhibition
Preprint submitted to Design Studies 5 November 16, 2015
Sketching skills interventions have varying emphases, such as product
sketching (van Passel & Eggink, 2013), free-hand technical drawing (Jacobs &
Brown, 2004), and visual thinking (Lane et al., 2010). Architecture and
industrial design, teach freehand sketching as a means for problem solving, idea
generation and concept generation (Bilda et al., 2006; Eissen & Steur, 2011).
While prior researchers have proposed interventions for teaching sketching,
few have explored interventions to reduce inhibition to it. Prior efforts include
requiring students to sketch as a part of homework assignments (Schmidt et al.,
2012; Grenier, 2008; Ruocco et al., 2009). Others encouraged sketching through
the use of analog-to-digital technology (Leake & Weightman, 2011) or
electronic interfaces (Chandrasegaran et al., 2014). To the best of our
knowledge, only one engineering study has used a method to reduce inhibition,
where they required participants to draw a dream house prior to a concept
generation activity (Worinkeng et al., 2013). An interior design study also
attempted to reduce inhibition by using art techniques (Pable, 2008).
Some studies have used indirect methods to encourage sketching. One study
required assignments to be sketched, and found that this increased the rate at
which students reported sketching to be important (Schmidt et al., 2012).
Another study used a supportive educational atmosphere and found that
fostering the confidence of students tended to help them acquire sketching skills
more quickly (van Passel & Eggink, 2013).
While sketch inhibition does not seem to be addressed in engineering design,
art education seems to be well aware of it and has many interventions to
overcome it. Some of the most cited activities include copying drawings upside
down and restricting verbal or written communication while sketching
(Edwards, 1970). Design oriented texts build on these interventions with
activities specific to design thinking (McKim, 1980). Many of the exercises
proposed by Edwards and McKim emphasize hemisphere reversal, or activities
specifically designed to induce brain activity on the right side of the brain.
Preprint submitted to Design Studies 6 November 16, 2015
Activities that induce right-brained activity are known to improve creativity
(Martindale, 1999).
2. Sketching Skills and Sketch Inhibition Modules
We embedded two modules in a university-level toy design class, building on
our earlier efforts to improve creativity in the class. The first was to teach
sketching skills. After evaluating this module, we found that there was still some
inhibition in the students. While the first module addresses inhibition related to a
lack of skills (skill-set), other types of inhibition were still being reported by
students. Consequently, we developed a second module to address personal,
intellectual, social, situational, and comparative inhibition.
2.1. Freehand Sketching Module
To develop specific interventions for teaching freehand sketching, we worked
with Jason Tennenhouse, an industrial designer, entrepreneur, and toy designer.
With his help, we identified the most important skills for ideation sketching and
formed them into a two-lecture workshop.
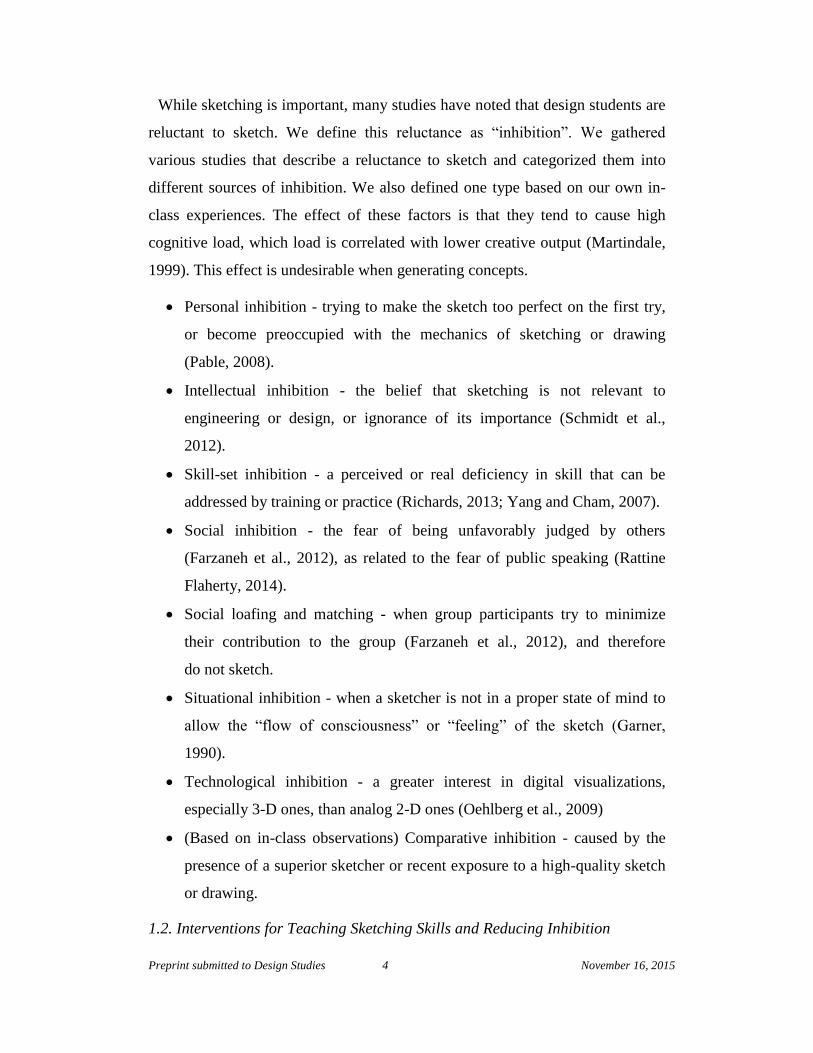
The workshop focuses on six overall concepts: tools, lines and weights,
perspective, Boolean construction, context, and motion (see Figure 1). For tools,
we provide each student with a blue watercolor pencil and an ultrafine/fine,
dual-tip marker pen. We instruct students on how to draw straight lines in one
stroke, and how to make different line weights with their tools. These colors are
used because the mind tends to ignore blue when drawn over with black marker
(Tennenhouse, 2012). Following this, we demonstrate simple primitives in 1, 2,
and 3 point perspective, and indicate how to use construction lines to orient the
primitives. This is followed by showing how complex shapes could be made by
combining simple primitives, using Boolean operations. Next, we demonstrate
Preprint submitted to Design Studies 7 November 16, 2015
Figure 1: Concepts taught in the sketching skills lecture: 1) tools, posture, lines; 2)
perspective; 3) Boolean construction of primitives into complex shapes; 4) an example of a
complex shape made from primitives and line width; 5) context and tips; and 6) showing
motion and stages
how to make simple contextual cues to indicate abstract ideas such as relative
size or interaction with a user. Finally, we show how to draw unambiguous
motion arrows, different strategies for showing stages or motion, and how to
annotate a sketch. Examples are given to the students and they are asked to use
these skills in a homework assignment. Students are also asked to use these
skills in their course projects.
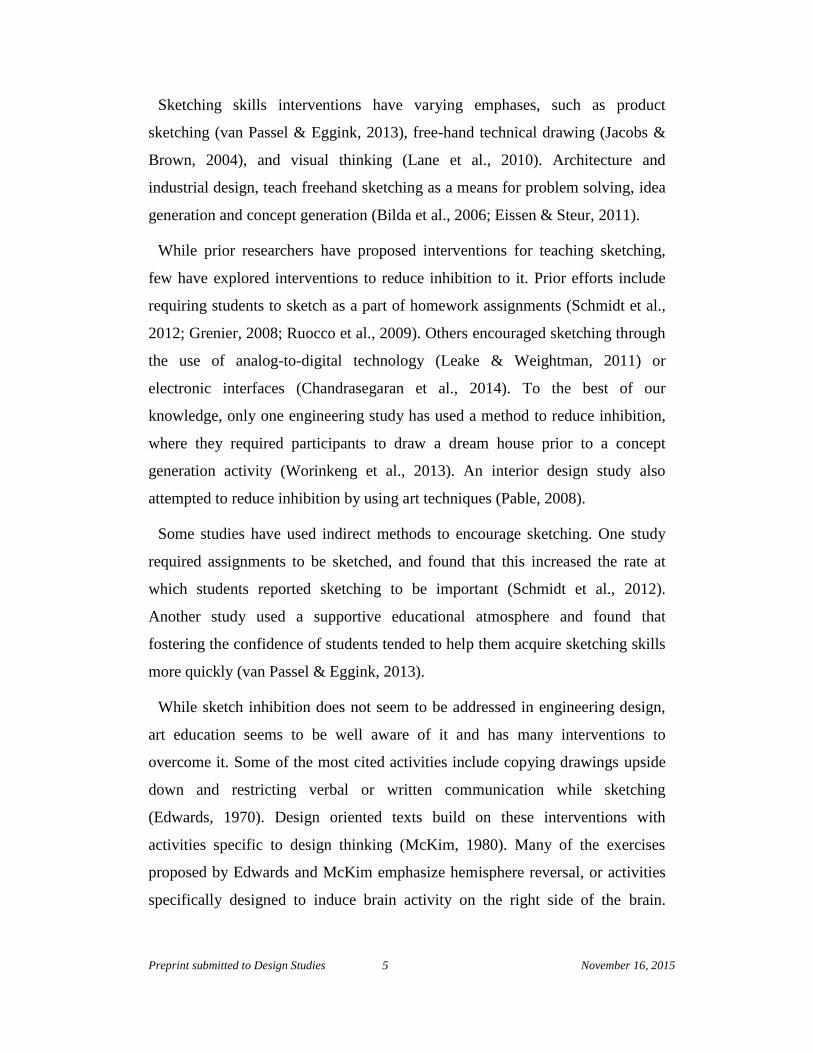
2.2. Sketch Inhibition Module
When we observed that students were still reluctant to sketch, we recruited
Scott Frankenberger, a local artist and faculty member in the art department at
our university. Scott helped us identify 14 relevant techniques, commonly used
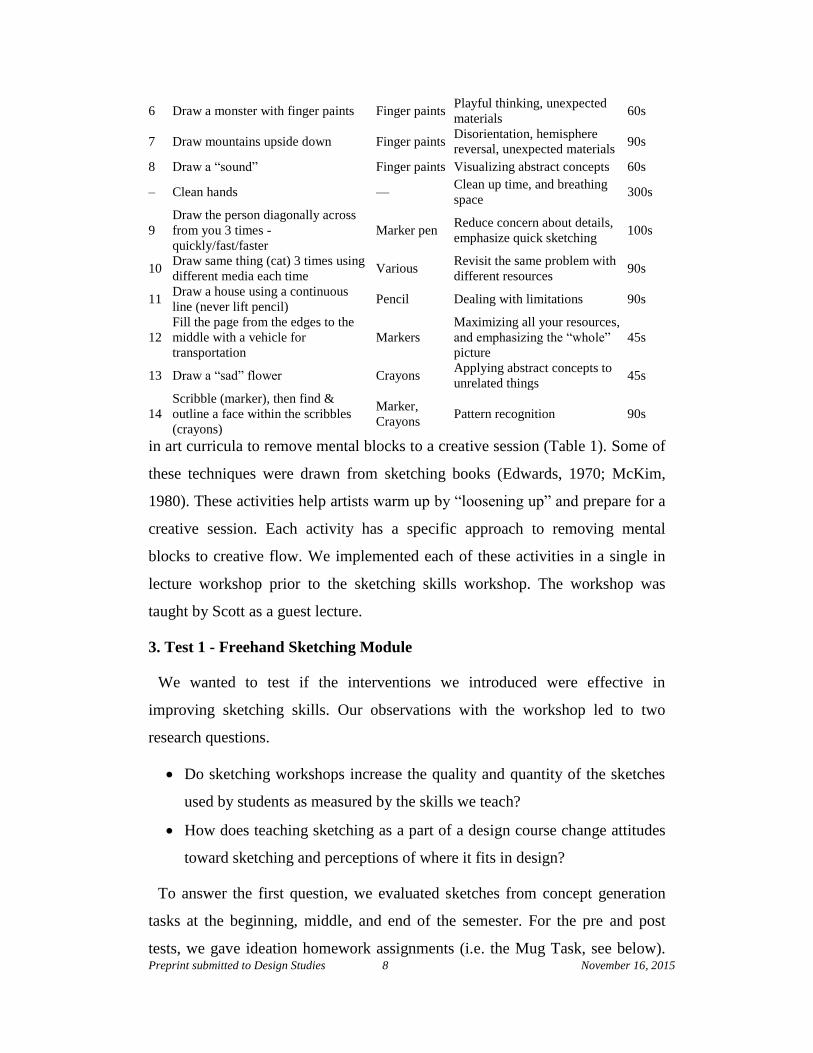
Table 1: Exercises used in the sketching inhibition-reducing activity, all times approximate
Exercise Media Purpose Time
1 Draw an animal with eyes closed Marker Pen Introduce an uncomfortable
task 60s
2 Draw a flower with opposite hand Pencils Brain hemisphere reversal 60s
3 Draw a self-portrait holding
partner’s hand Pencils
Break social inhibition, foster
self-awareness 150s
4
In groups of 4, each member draws
part of a house and passes to left
without talking
Markers Sharing ideas with others 200s
5 Draw a bicycle Crayons Introduce non-technical,
imprecise tools 45s
Preprint submitted to Design Studies 8 November 16, 2015
6 Draw a monster with finger paints Finger paints Playful thinking, unexpected
materials 60s
7 Draw mountains upside down Finger paints Disorientation, hemisphere
reversal, unexpected materials 90s
8 Draw a “sound” Finger paints Visualizing abstract concepts 60s
– Clean hands — Clean up time, and breathing
space 300s
9
Draw the person diagonally across
from you 3 times -
quickly/fast/faster
Marker pen Reduce concern about details,
emphasize quick sketching 100s
10 Draw same thing (cat) 3 times using
different media each time Various
Revisit the same problem with
different resources 90s
11 Draw a house using a continuous
line (never lift pencil) Pencil Dealing with limitations 90s
12
Fill the page from the edges to the
middle with a vehicle for
transportation
Markers
Maximizing all your resources,
and emphasizing the “whole”
picture
45s
13 Draw a “sad” flower Crayons Applying abstract concepts to
unrelated things 45s
14
Scribble (marker), then find &
outline a face within the scribbles
(crayons)
Marker,
Crayons Pattern recognition 90s
in art curricula to remove mental blocks to a creative session (Table 1). Some of
these techniques were drawn from sketching books (Edwards, 1970; McKim,
1980). These activities help artists warm up by “loosening up” and prepare for a
creative session. Each activity has a specific approach to removing mental
blocks to creative flow. We implemented each of these activities in a single in
lecture workshop prior to the sketching skills workshop. The workshop was
taught by Scott as a guest lecture.
3. Test 1 - Freehand Sketching Module
We wanted to test if the interventions we introduced were effective in
improving sketching skills. Our observations with the workshop led to two
research questions.
Do sketching workshops increase the quality and quantity of the sketches
used by students as measured by the skills we teach?
How does teaching sketching as a part of a design course change attitudes
toward sketching and perceptions of where it fits in design?
To answer the first question, we evaluated sketches from concept generation
tasks at the beginning, middle, and end of the semester. For the pre and post
tests, we gave ideation homework assignments (i.e. the Mug Task, see below).
Preprint submitted to Design Studies 9 November 16, 2015
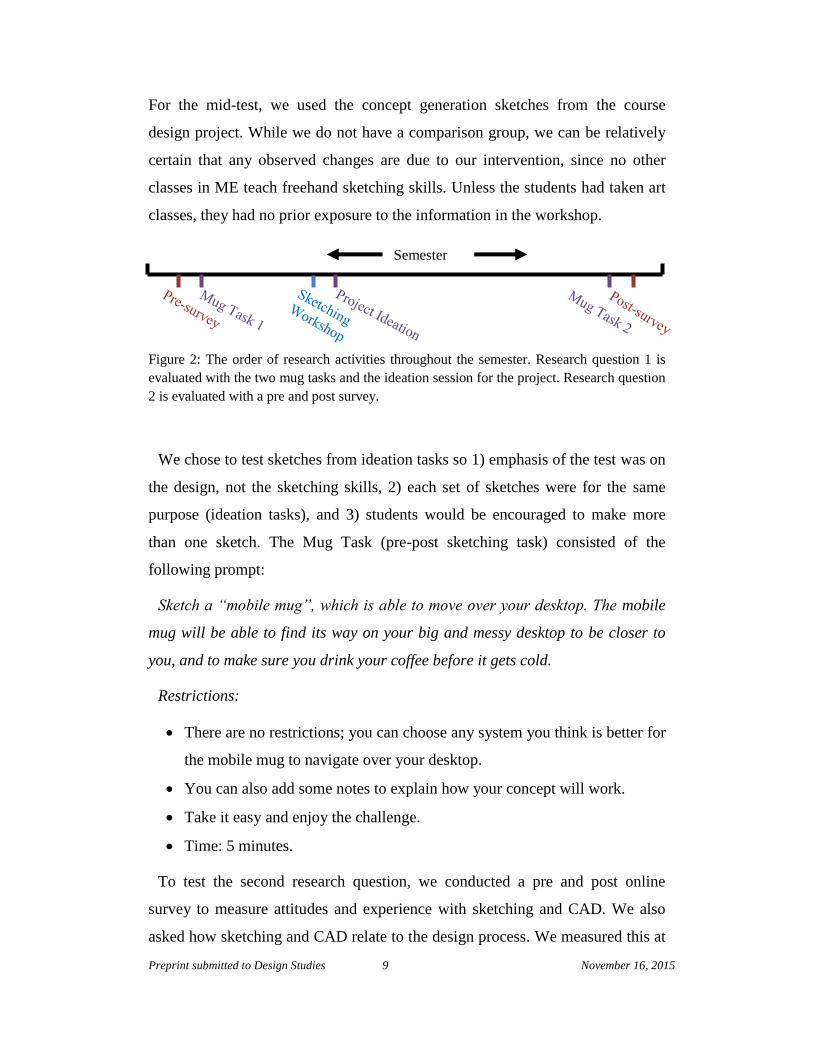
For the mid-test, we used the concept generation sketches from the course
design project. While we do not have a comparison group, we can be relatively
certain that any observed changes are due to our intervention, since no other
classes in ME teach freehand sketching skills. Unless the students had taken art
classes, they had no prior exposure to the information in the workshop.
Figure 2: The order of research activities throughout the semester. Research question 1 is
evaluated with the two mug tasks and the ideation session for the project. Research question
2 is evaluated with a pre and post survey.
We chose to test sketches from ideation tasks so 1) emphasis of the test was on
the design, not the sketching skills, 2) each set of sketches were for the same
purpose (ideation tasks), and 3) students would be encouraged to make more
than one sketch. The Mug Task (pre-post sketching task) consisted of the
following prompt:
Sketch a “mobile mug”, which is able to move over your desktop. The mobile
mug will be able to find its way on your big and messy desktop to be closer to
you, and to make sure you drink your coffee before it gets cold.
Restrictions:
There are no restrictions; you can choose any system you think is better for
the mobile mug to navigate over your desktop.
You can also add some notes to explain how your concept will work.
Take it easy and enjoy the challenge.
Time: 5 minutes.
To test the second research question, we conducted a pre and post online
survey to measure attitudes and experience with sketching and CAD. We also
asked how sketching and CAD relate to the design process. We measured this at
Semester

Preprint submitted to Design Studies 10 November 16, 2015
the beginning and end of the semester to see how the sum of the workshop and
class affected attitudes toward sketching. We timed the surveys to be before and
after the other assessments used to answer the first question (Figure 2).
Preprint submitted to Design Studies 11 November 16, 2015
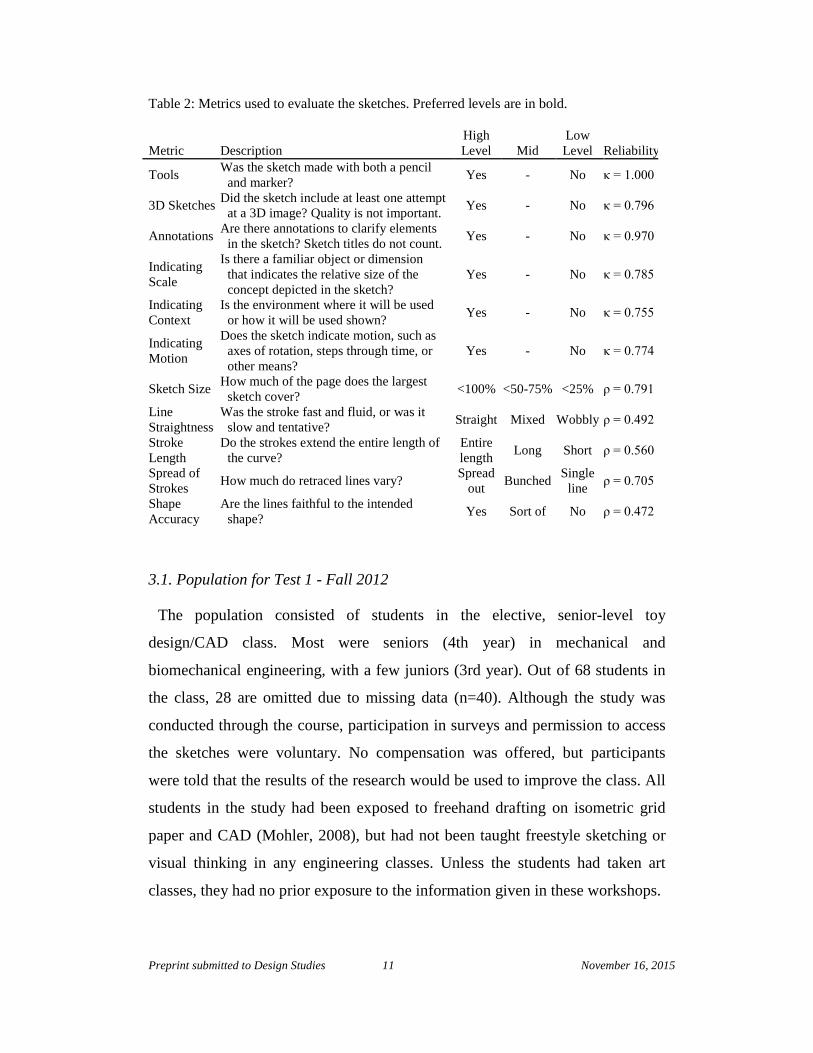
Table 2: Metrics used to evaluate the sketches. Preferred levels are in bold.
Metric Description
High
Level Mid
Low
Level Reliability
Tools Was the sketch made with both a pencil
and marker? Yes - No κ = 1.000
3D Sketches Did the sketch include at least one attempt
at a 3D image? Quality is not important. Yes - No κ = 0.796
Annotations Are there annotations to clarify elements
in the sketch? Sketch titles do not count. Yes - No κ = 0.970
Indicating
Scale
Is there a familiar object or dimension
that indicates the relative size of the
concept depicted in the sketch?
Yes - No κ = 0.785
Indicating
Context
Is the environment where it will be used
or how it will be used shown? Yes - No κ = 0.755
Indicating
Motion
Does the sketch indicate motion, such as
axes of rotation, steps through time, or
other means?
Yes - No κ = 0.774
Sketch Size How much of the page does the largest
sketch cover? <100% <50-75% <25% ρ = 0.791
Line
Straightness
Was the stroke fast and fluid, or was it
slow and tentative? Straight Mixed Wobbly ρ = 0.492
Stroke
Length
Do the strokes extend the entire length of
the curve?
Entire
length Long Short ρ = 0.560
Spread of
Strokes How much do retraced lines vary?
Spread
out Bunched
Single
line ρ = 0.705
Shape
Accuracy
Are the lines faithful to the intended
shape? Yes Sort of No ρ = 0.472
3.1. Population for Test 1 - Fall 2012
The population consisted of students in the elective, senior-level toy
design/CAD class. Most were seniors (4th year) in mechanical and
biomechanical engineering, with a few juniors (3rd year). Out of 68 students in
the class, 28 are omitted due to missing data (n=40). Although the study was
conducted through the course, participation in surveys and permission to access
the sketches were voluntary. No compensation was offered, but participants
were told that the results of the research would be used to improve the class. All
students in the study had been exposed to freehand drafting on isometric grid
paper and CAD (Mohler, 2008), but had not been taught freestyle sketching or
visual thinking in any engineering classes. Unless the students had taken art
classes, they had no prior exposure to the information given in these workshops.
Preprint submitted to Design Studies 12 November 16, 2015
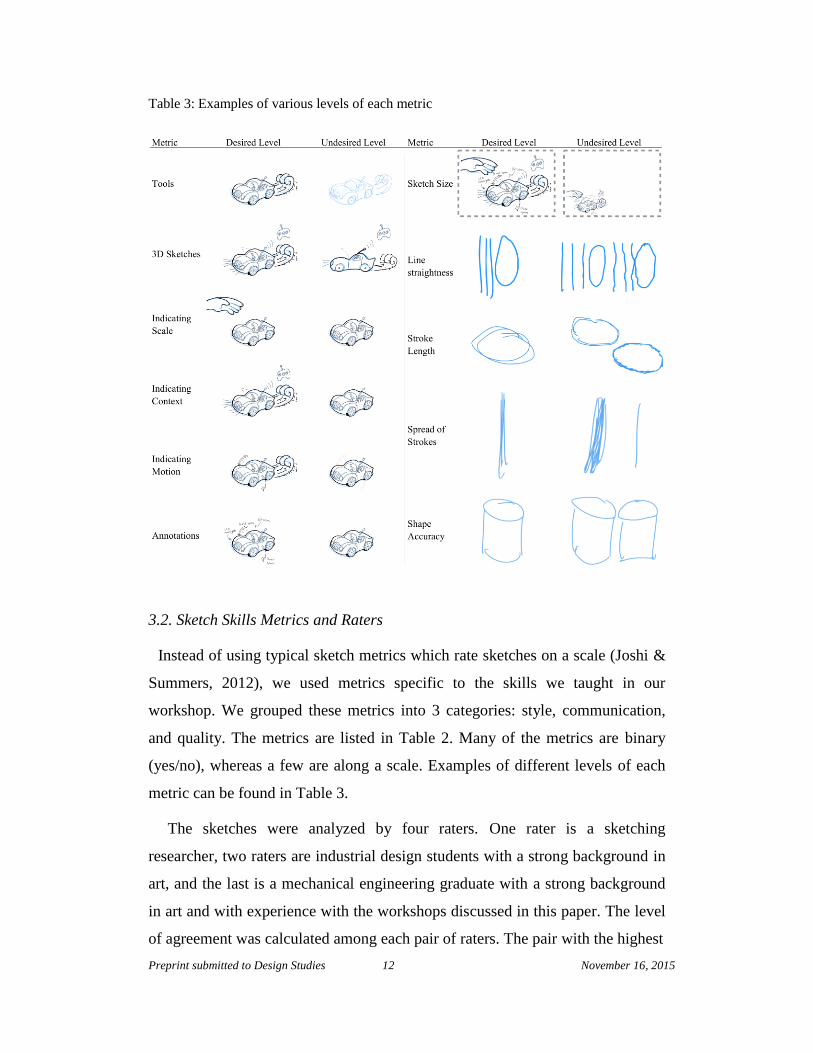
Table 3: Examples of various levels of each metric
3.2. Sketch Skills Metrics and Raters
Instead of using typical sketch metrics which rate sketches on a scale (Joshi &
Summers, 2012), we used metrics specific to the skills we taught in our
workshop. We grouped these metrics into 3 categories: style, communication,
and quality. The metrics are listed in Table 2. Many of the metrics are binary
(yes/no), whereas a few are along a scale. Examples of different levels of each
metric can be found in Table 3.
The sketches were analyzed by four raters. One rater is a sketching
researcher, two raters are industrial design students with a strong background in
art, and the last is a mechanical engineering graduate with a strong background
in art and with experience with the workshops discussed in this paper. The level
of agreement was calculated among each pair of raters. The pair with the highest
Preprint submitted to Design Studies 13 November 16, 2015
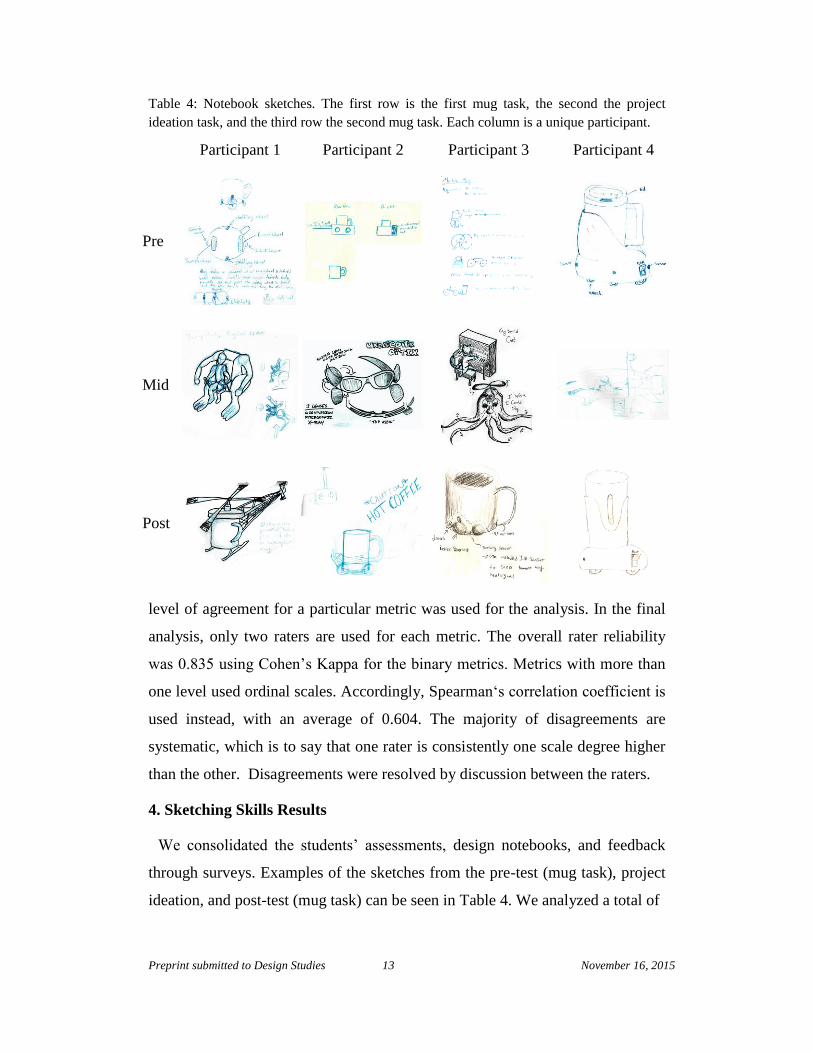
Table 4: Notebook sketches. The first row is the first mug task, the second the project
ideation task, and the third row the second mug task. Each column is a unique participant.
Participant 1 Participant 2 Participant 3 Participant 4
Pre
Mid
Post
level of agreement for a particular metric was used for the analysis. In the final
analysis, only two raters are used for each metric. The overall rater reliability
was 0.835 using Cohen’s Kappa for the binary metrics. Metrics with more than
one level used ordinal scales. Accordingly, Spearman‘s correlation coefficient is
used instead, with an average of 0.604. The majority of disagreements are
systematic, which is to say that one rater is consistently one scale degree higher
than the other. Disagreements were resolved by discussion between the raters.
4. Sketching Skills Results
We consolidated the students’ assessments, design notebooks, and feedback
through surveys. Examples of the sketches from the pre-test (mug task), project
ideation, and post-test (mug task) can be seen in Table 4. We analyzed a total of
Preprint submitted to Design Studies 14 November 16, 2015
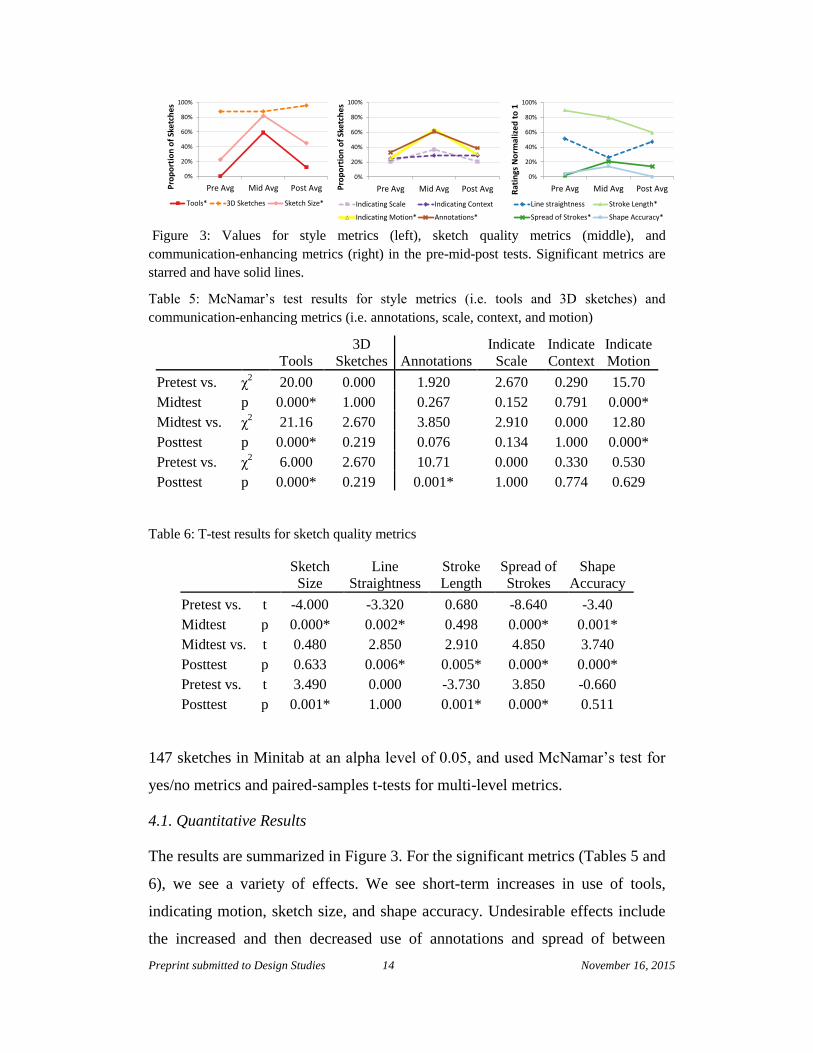
Figure 3: Values for style metrics (left), sketch quality metrics (middle), and
communication-enhancing metrics (right) in the pre-mid-post tests. Significant metrics are
starred and have solid lines.
Table 5: McNamar’s test results for style metrics (i.e. tools and 3D sketches) and
communication-enhancing metrics (i.e. annotations, scale, context, and motion)
Tools
3D
Sketches Annotations
Indicate
Scale
Indicate
Context
Indicate
Motion
Pretest vs. χ2
20.00 0.000 1.920 2.670 0.290 15.70
Midtest p 0.000* 1.000 0.267 0.152 0.791 0.000*
Midtest vs. χ2 21.16 2.670 3.850 2.910 0.000 12.80
Posttest p 0.000* 0.219 0.076 0.134 1.000 0.000*
Pretest vs. χ2 6.000 2.670 10.71 0.000 0.330 0.530
Posttest p 0.000* 0.219 0.001* 1.000 0.774 0.629
Table 6: T-test results for sketch quality metrics
Sketch
Size
Line
Straightness
Stroke
Length
Spread of
Strokes
Shape
Accuracy
Pretest vs. t -4.000 -3.320 0.680 -8.640 -3.40
Midtest p 0.000* 0.002* 0.498 0.000* 0.001*
Midtest vs. t 0.480 2.850 2.910 4.850 3.740
Posttest p 0.633 0.006* 0.005* 0.000* 0.000*
Pretest vs. t 3.490 0.000 -3.730 3.850 -0.660
Posttest p 0.001* 1.000 0.001* 0.000* 0.511
147 sketches in Minitab at an alpha level of 0.05, and used McNamar’s test for
yes/no metrics and paired-samples t-tests for multi-level metrics.
4.1. Quantitative Results
The results are summarized in Figure 3. For the significant metrics (Tables 5 and
6), we see a variety of effects. We see short-term increases in use of tools,
indicating motion, sketch size, and shape accuracy. Undesirable effects include
the increased and then decreased use of annotations and spread of between
0%
20%
40%
60%
80%
100%
Pre Avg Mid Avg Post AvgRat
ings
No
rma
lize
d t
o 1
Line straightness Stroke Length*
Spread of Strokes* Shape Accuracy*
0%
20%
40%
60%
80%
100%
Pre Avg Mid Avg Post AvgPro
po
rtio
n o
f Sk
etc
he
s
Indicating Scale Indicating Context
Indicating Motion* Annotations*
0%
20%
40%
60%
80%
100%
Pre Avg Mid Avg Post AvgPro
po
rtio
n o
f Sk
etc
he
s
Tools* 3D Sketches Sketch Size*
Preprint submitted to Design Studies 15 November 16, 2015
repeated stroke. We also observed a decrease in stroke length and line
straightness, indicating trepidation. This is probably due to new skills being
taught. Another undesired effect is that many of the gains from the workshop
were lost at the end of the semester. Other changes we observe are not large
enough to be statistically significant.
Overall, these data seem to demonstrate the need for continual encouragement
and practice in order for certain habits to stay. With regard to tool use, some
students commented in their final survey that they forgot to bring their tools,
which may have affected results for this metric. Certain skills, such as showing
scale, showing context, and using annotations were probably not emphasized
enough. The emphasis on a particular sketching style may explain this decrease,
as the style we taught may be considered more of an illustrative style than a
technical one. Additionally, we saw an increase in the number of construction
lines used in the sketches after the workshop (t=-2.45, p=0.018). This indicates
that the way we taught perspective drawing transferred into the sketches. Since
accurate perspective is an advanced skill, this probably consumed much of the
attention of the students.
4.2. Pre-Post Sketching/CAD Survey
Overall, we observed a few changes over the semester in student perception
toward sketching. We saw 65% of students reported changing their attitude
toward sketching as an engineering tool. Also, 62.5% said they would not have
used the style we taught them had they not attended the lecture. Finally, 87.5%
reported that they learned new ways to use sketching. Qualitatively, students
seemed to be more willing to use sketching earlier in the design process, prior to
CAD (Robertson & Radcliffe, 2009). They also seemed to recognize how
sketches can be used to aid problem solving. “Before the workshop, I felt
freehand sketching was just another way to show ideas and concepts, not as
important as having sketches in computers. Now, I feel that it should be
incorporated in every design class because of its flexibility, ease and
usefulness.” Another student reported, “I will now begin the design process with
Preprint submitted to Design Studies 16 November 16, 2015
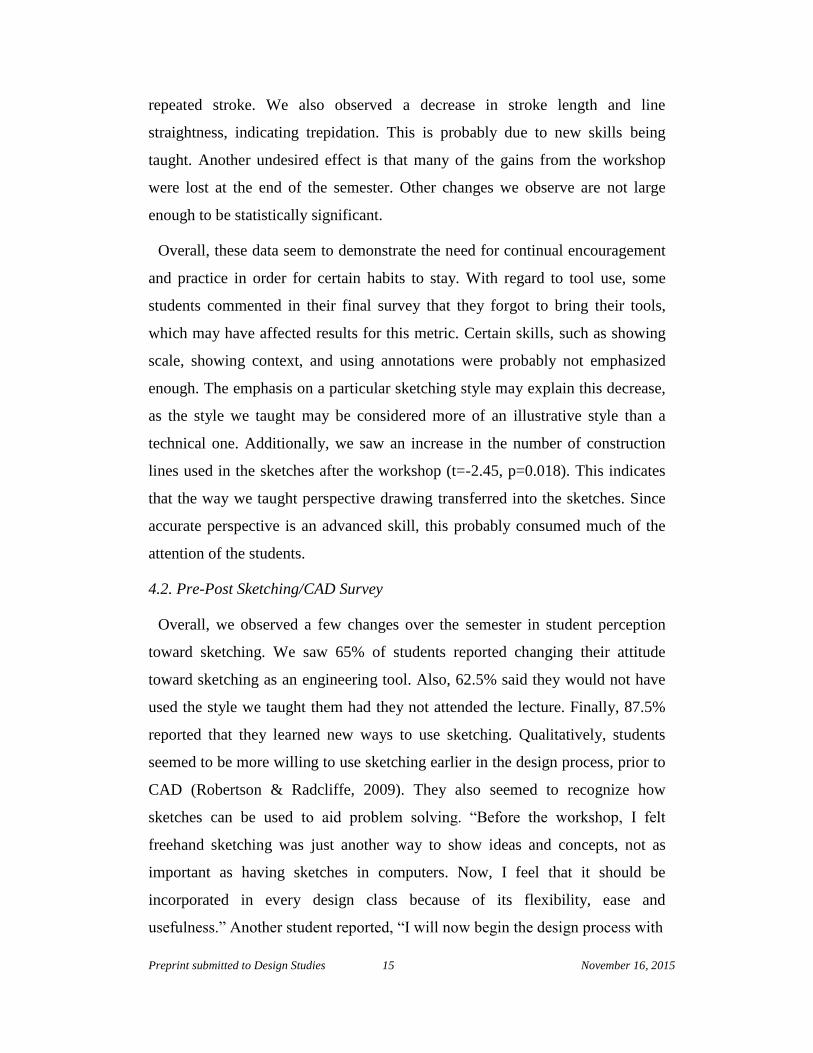
Figure 4: Examples of sketches from various students. From left to right: Top - A bicycle
drawn in crayon (activity 5), mountains painted upside-down (activity 7), a house drawn by
a team (activity 4); Bottom - a self-portrait drawn with a partners hand (activity 3), a
monster using finger-paints (activity 6), and a sad flower (activity 14).
freehand sketching. Also, I will now produce multiple sketches instead of trying
to get the design perfect on the very first sketch.” The number of students who
reported being comfortable with sketching did not change over the semester,
however the number of students who reported being frustrated with sketching
dropped from 4 to 0.
5. Test 2 - Sketch Inhibition Module
We introduced the art-based interventions for reducing inhibition in a
subsequent semester of the ME 444 class described above. The goal of the
interventions was to remove the mental blocks to fast and effective sketching,
including a belief that sketching must be high-quality to be effective. The
workshop in this semester was taught by Author 1 in a single, in-class lecture.
Following the inhibition-reducing workshop, we repeated the sketching skills
workshop from the previous year.
A few examples of sketches from various students are shown in Figure 4. In
pilot studies, 89% of the students reported liking the workshop. Many reported
feeling more at ease, or feeling freer. We took this to mean the workshop was
successful. However, we wanted to see the effect of the workshop over the
length of the semester.
Preprint submitted to Design Studies 17 November 16, 2015
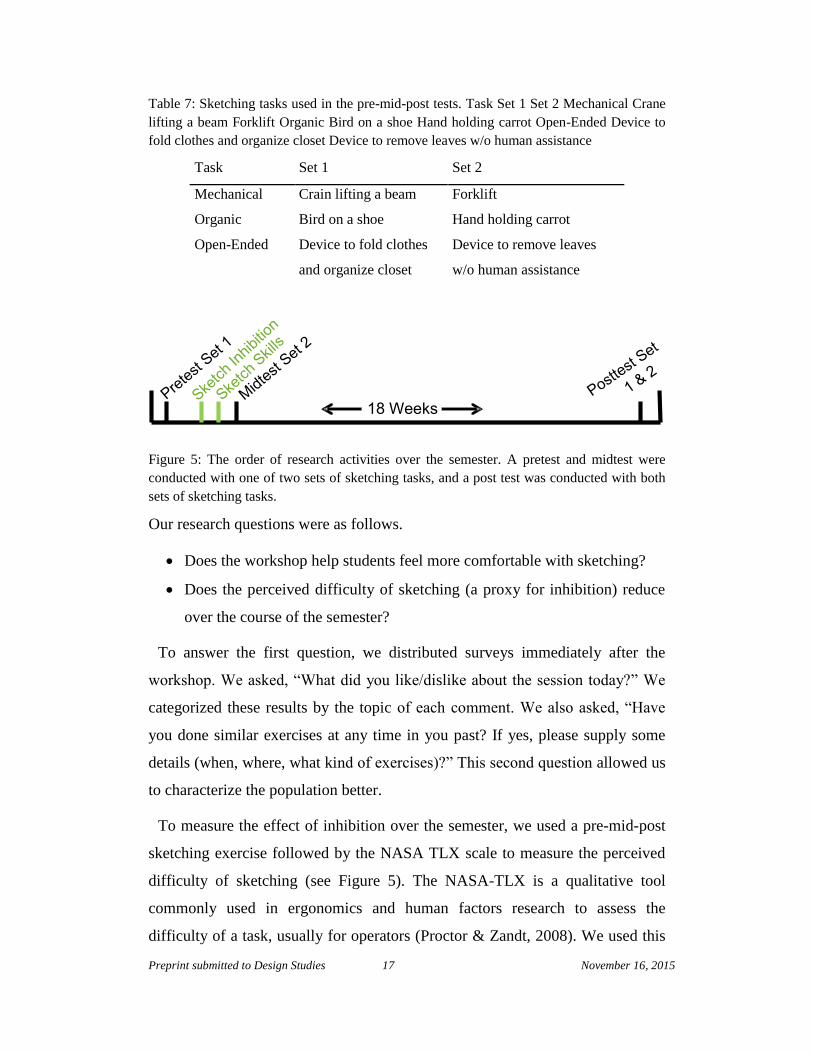
Table 7: Sketching tasks used in the pre-mid-post tests. Task Set 1 Set 2 Mechanical Crane
lifting a beam Forklift Organic Bird on a shoe Hand holding carrot Open-Ended Device to
fold clothes and organize closet Device to remove leaves w/o human assistance
Task Set 1 Set 2
Mechanical Crain lifting a beam Forklift
Organic Bird on a shoe Hand holding carrot
Open-Ended Device to fold clothes
and organize closet
Device to remove leaves
w/o human assistance
Figure 5: The order of research activities over the semester. A pretest and midtest were
conducted with one of two sets of sketching tasks, and a post test was conducted with both
sets of sketching tasks.
Our research questions were as follows.
Does the workshop help students feel more comfortable with sketching?
Does the perceived difficulty of sketching (a proxy for inhibition) reduce
over the course of the semester?
To answer the first question, we distributed surveys immediately after the
workshop. We asked, “What did you like/dislike about the session today?” We
categorized these results by the topic of each comment. We also asked, “Have
you done similar exercises at any time in you past? If yes, please supply some
details (when, where, what kind of exercises)?” This second question allowed us
to characterize the population better.
To measure the effect of inhibition over the semester, we used a pre-mid-post
sketching exercise followed by the NASA TLX scale to measure the perceived
difficulty of sketching (see Figure 5). The NASA-TLX is a qualitative tool
commonly used in ergonomics and human factors research to assess the
difficulty of a task, usually for operators (Proctor & Zandt, 2008). We used this
18 Weeks
Preprint submitted to Design Studies 18 November 16, 2015
tool instead of creating one due to its simplicity and long-standing acceptance in
the human-factors field. While the temporal and physical demand indices are not
very relevant to our experiment, the mental demand, performance, effort, and
frustration indices are. Since the pre and midtests were fewer than three weeks
apart, we used different sets of sketching tasks to reduce a possible testing bias.
We then asked students to repeat both sets at the end of the semester. To account
for different types and styles of sketching (Yang & Cham, 2007), we constructed
each test to require 3 sketches: a mechanical sketch, an organic sketch, and an
open-ended sketch of something they would have to imagine. Table 7 provides
more details on these tasks. The prompts for each set were chosen for similar
levels of complexity and familiarity.
5.1. Test Procedure for Question 2
For each set of sketching tasks, we instructed students to spend no more
than five minutes on each sketch. This was to ensure that the results were
sketches and not drawings (Buxton, 2007). Following each sketch, students
were instructed to fill out the TLX survey before moving on to the next
sketch. The sketching tasks and TLX surveys were completed outside of
class time. Students were informed that the sketching tasks were required as
practice for the class, but the surveys were voluntary.
5.2. Population for Test 2 - Fall 2013
The population consisted of students in the elective, senior-level toy
design/CAD class. Most were seniors (4th year) in mechanical engineering, with
a few juniors (3rd year). Out of 55 students in the class, 29 are omitted due to
non-participation in the post-survey. Our total sample size is (n=26). Similar to
the first test, participation in surveys and permission to access the sketches were
voluntary. No compensation was offered, but participants were told that the
results of the research would be used to improve the class. In order to
characterize the population better, we asked students after the workshop if they
had experience with similar activities. If they had, we requested they provide
Preprint submitted to Design Studies 19 November 16, 2015
details of what and when. Of the 44 who responded, 28 (63%) reported they had
never seen these activities before and 16 responded that they had. Only 4 gave
additional details. Two said they had prior experience with these kinds of
activities in high school, and the other two said they had done these activities in
kindergarten.
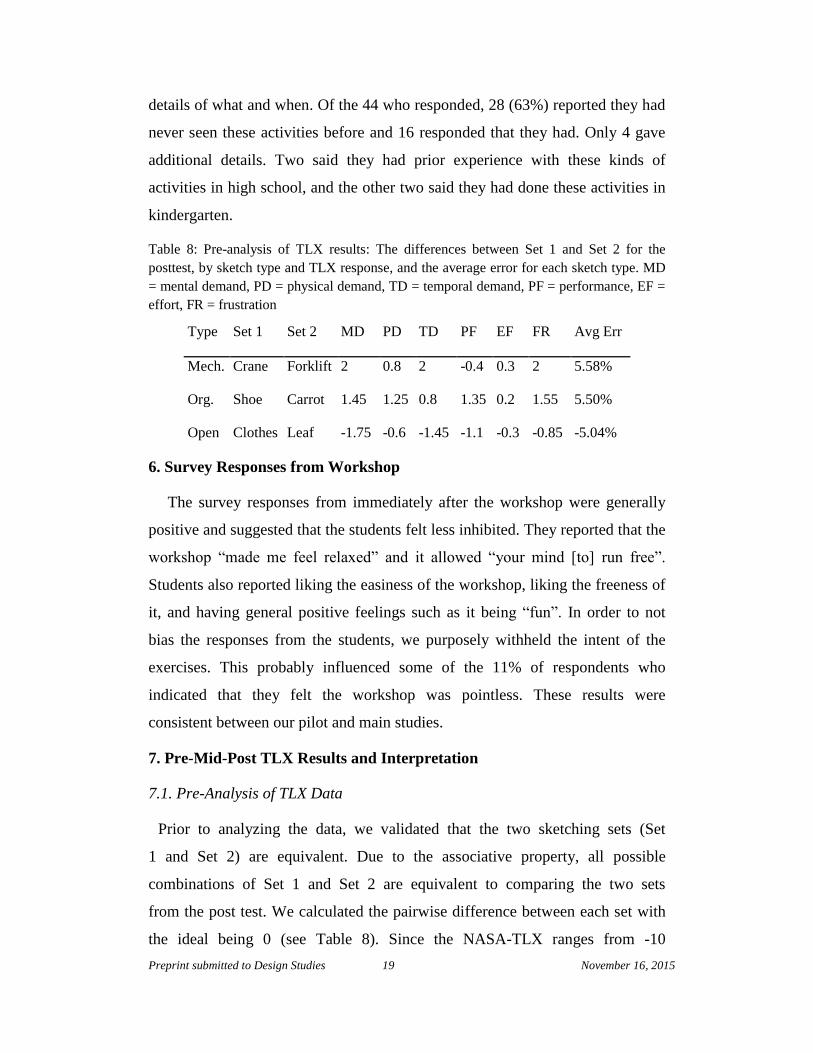
Table 8: Pre-analysis of TLX results: The differences between Set 1 and Set 2 for the
posttest, by sketch type and TLX response, and the average error for each sketch type. MD
= mental demand, PD = physical demand, TD = temporal demand, PF = performance, EF =
effort, FR = frustration
Type Set 1 Set 2 MD PD TD PF EF FR Avg Err
Mech. Crane Forklift 2 0.8 2 -0.4 0.3 2 5.58%
Org. Shoe Carrot 1.45 1.25 0.8 1.35 0.2 1.55 5.50%
Open Clothes Leaf -1.75 -0.6 -1.45 -1.1 -0.3 -0.85 -5.04%
6. Survey Responses from Workshop
The survey responses from immediately after the workshop were generally
positive and suggested that the students felt less inhibited. They reported that the
workshop “made me feel relaxed” and it allowed “your mind [to] run free”.
Students also reported liking the easiness of the workshop, liking the freeness of
it, and having general positive feelings such as it being “fun”. In order to not
bias the responses from the students, we purposely withheld the intent of the
exercises. This probably influenced some of the 11% of respondents who
indicated that they felt the workshop was pointless. These results were
consistent between our pilot and main studies.
7. Pre-Mid-Post TLX Results and Interpretation
7.1. Pre-Analysis of TLX Data
Prior to analyzing the data, we validated that the two sketching sets (Set
1 and Set 2) are equivalent. Due to the associative property, all possible
combinations of Set 1 and Set 2 are equivalent to comparing the two sets
from the post test. We calculated the pairwise difference between each set with
the ideal being 0 (see Table 8). Since the NASA-TLX ranges from -10
Preprint submitted to Design Studies 20 November 16, 2015
to +10, we calculate the error by dividing the pairwise difference by 20. The
largest error for any one metric is less than 10%, and the average error by
task is around 5%. This indicates that the two sets of sketching tasks are
reasonably equivalent.
7.2. Analysis of TLX Data
We used a main effects general linear model in MiniTab to determine if the
differences between the pre, mid, and post tests are statistically significant. We
omitted participants who did not complete all portions of the sketching
task (n = 26, 29 submissions ignored). The student and the type of task
(mechanical, organic, design) were used as blocking factors, and the six TLX
metrics are run as separate response variables. All necessary assumptions were
met for all response variables, including homogeneity of variance and normality.
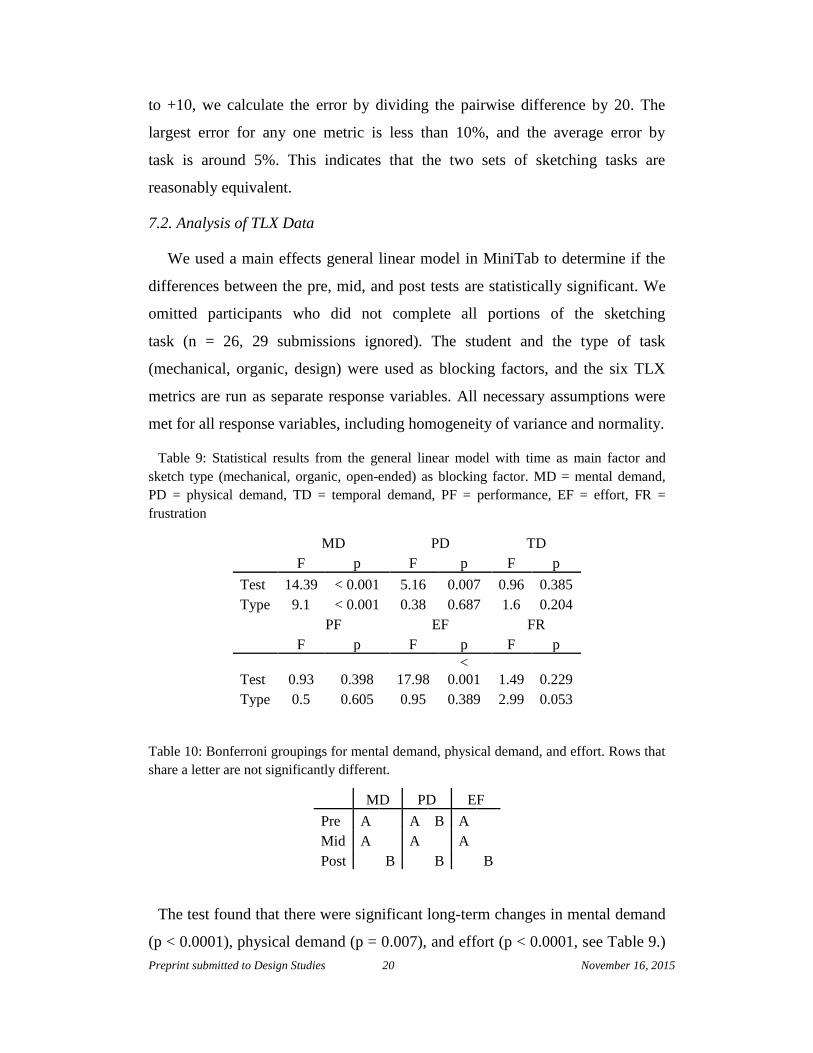
Table 9: Statistical results from the general linear model with time as main factor and
sketch type (mechanical, organic, open-ended) as blocking factor. MD = mental demand,
PD = physical demand, TD = temporal demand, PF = performance, EF = effort, FR =
frustration
MD PD TD
F p F p F p
Test 14.39 < 0.001 5.16 0.007 0.96 0.385
Type 9.1 < 0.001 0.38 0.687 1.6 0.204
PF EF FR
F p F p F p
Test 0.93 0.398 17.98
<
0.001 1.49 0.229
Type 0.5 0.605 0.95 0.389 2.99 0.053
Table 10: Bonferroni groupings for mental demand, physical demand, and effort. Rows that
share a letter are not significantly different.
MD PD EF
Pre A
A B A
Mid A
A
A
Post
B
B
B
The test found that there were significant long-term changes in mental demand
(p < 0.0001), physical demand (p = 0.007), and effort (p < 0.0001, see Table 9.)
Preprint submitted to Design Studies 21 November 16, 2015
There was also a statistical difference for the mental demand between tasks (p <
0.0001). To determine how the tests differed, we performed a post-hoc
Bonferroni analysis. These results are summarized in Table 10. For mental
demand, physical demand, and effort; there was a significant change between
the mid-test and post-test. For mental demand and effort, the pre-test was also
different from the post-test. The average values show a non-significant increase
from the pre-test to the mid-test and a significant decrease by the end of the
semester (Figure 6).
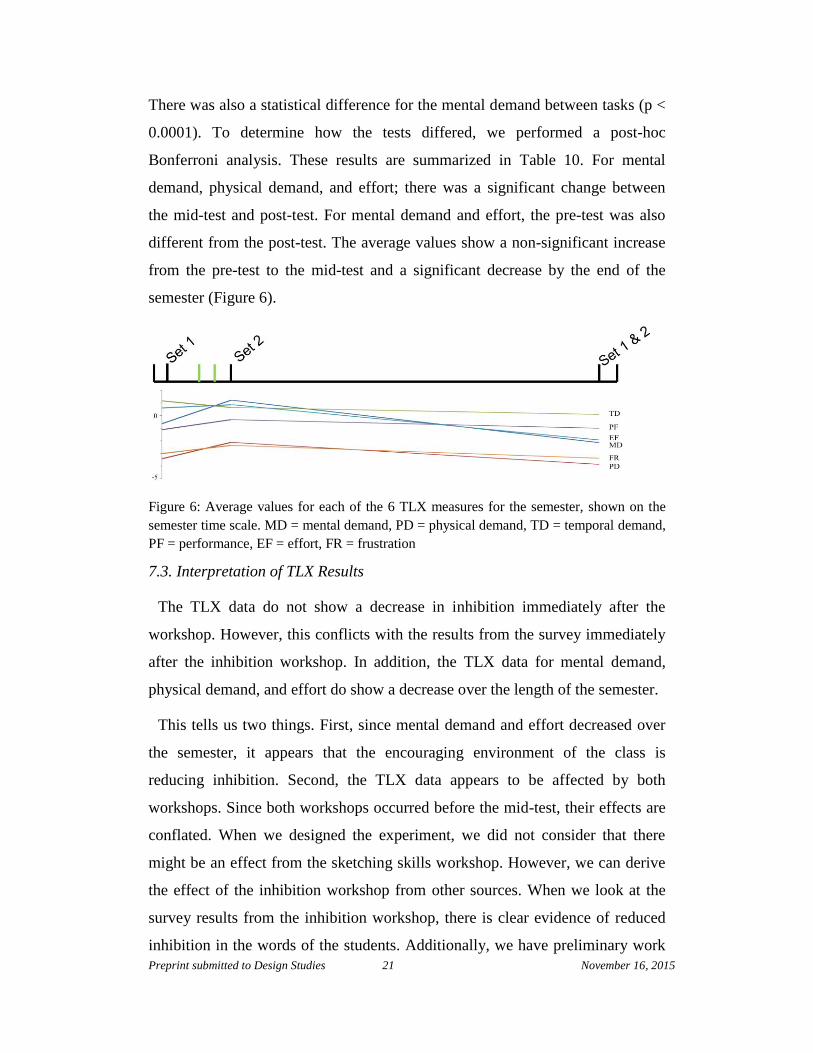
Figure 6: Average values for each of the 6 TLX measures for the semester, shown on the
semester time scale. MD = mental demand, PD = physical demand, TD = temporal demand,
PF = performance, EF = effort, FR = frustration
7.3. Interpretation of TLX Results
The TLX data do not show a decrease in inhibition immediately after the
workshop. However, this conflicts with the results from the survey immediately
after the inhibition workshop. In addition, the TLX data for mental demand,
physical demand, and effort do show a decrease over the length of the semester.
This tells us two things. First, since mental demand and effort decreased over
the semester, it appears that the encouraging environment of the class is
reducing inhibition. Second, the TLX data appears to be affected by both
workshops. Since both workshops occurred before the mid-test, their effects are
conflated. When we designed the experiment, we did not consider that there
might be an effect from the sketching skills workshop. However, we can derive
the effect of the inhibition workshop from other sources. When we look at the
survey results from the inhibition workshop, there is clear evidence of reduced
inhibition in the words of the students. Additionally, we have preliminary work
Preprint submitted to Design Studies 22 November 16, 2015
using brain waves as a more precise measure of mental load when performing
these activities. In these preliminary studies, we found that participants who did
the inhibition-reducing activities prior to concept generation had a lower
cognitive workload than those that did not do a warm-up activity (Hu, 2015).
Since other sources show that the inhibition-reducing activities reduce mental
workload, the TLX data tells us important details about the sketching skills
workshop. The increase in mental load from the sketching skills workshop was
enough to negate any short-term benefit from the inhibition workshop.
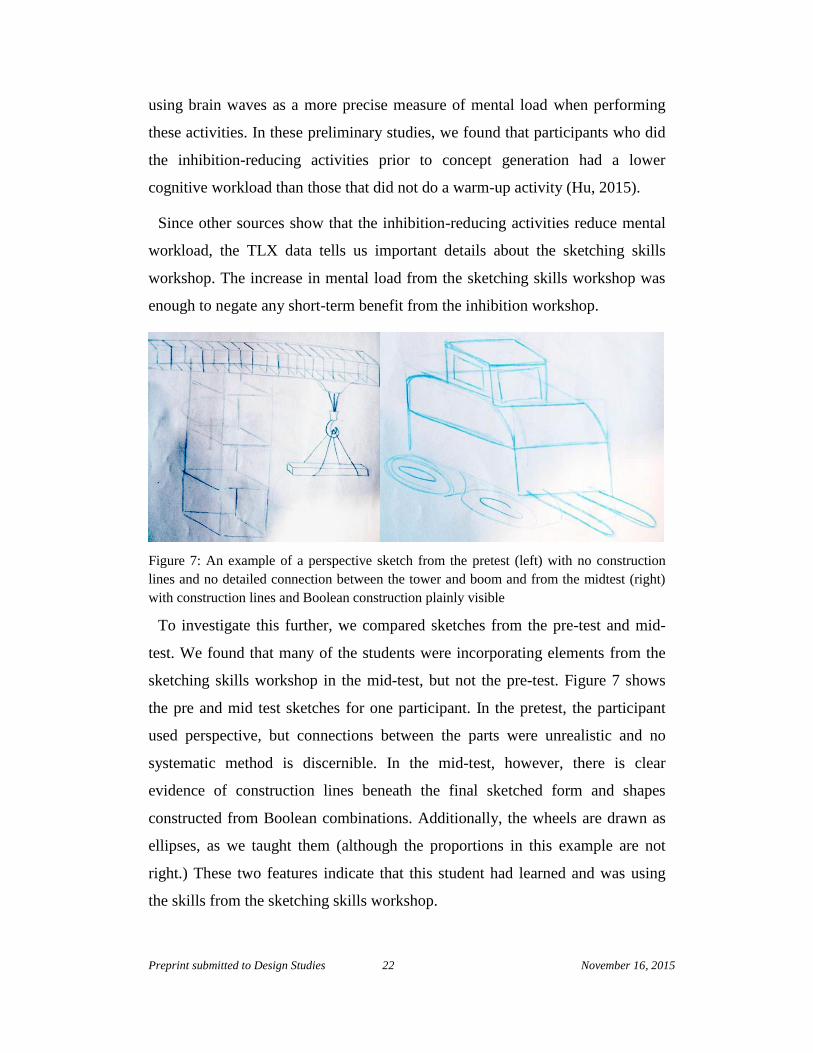
Figure 7: An example of a perspective sketch from the pretest (left) with no construction
lines and no detailed connection between the tower and boom and from the midtest (right)
with construction lines and Boolean construction plainly visible
To investigate this further, we compared sketches from the pre-test and mid-
test. We found that many of the students were incorporating elements from the
sketching skills workshop in the mid-test, but not the pre-test. Figure 7 shows
the pre and mid test sketches for one participant. In the pretest, the participant
used perspective, but connections between the parts were unrealistic and no
systematic method is discernible. In the mid-test, however, there is clear
evidence of construction lines beneath the final sketched form and shapes
constructed from Boolean combinations. Additionally, the wheels are drawn as
ellipses, as we taught them (although the proportions in this example are not
right.) These two features indicate that this student had learned and was using
the skills from the sketching skills workshop.
Preprint submitted to Design Studies 23 November 16, 2015
These results are consistent with prior literature on cognitive load. Learning
new skills increases the difficulty of a task (Lawson & Dorst, 2009) and
cognitive load (Hollender et al., 2010). The skills we taught, particularly
perspective were reflected in the mental demand and effort metrics.
8. Implications and Conclusions
In the first portion of the study, we tested with a pre-mid-post test with
the sketching intervention between the pre and mid test. Over the semester, our
tests showed that the use of tools, indicating motion, the sketch size and, shape
accuracy improved after the workshop. However, for many metrics
this effect did not last for the length of the semester. Other undesirable
effects included a semester-long decrease in the number of annotations and
stroke length. The decrease in stroke length is an indicator of sketch inhibition
(Pable, 2008), and probably is due to feeling overwhelmed with the new content.
The survey results confirmed that students felt more confident in their skills and
began to view sketching in as an essential design skill. Students also reported an
increased level of comfort with sketching. Overall, our results show that the
students adopted many of the skills in the workshop, but they also reinforce the
need for continual practice over a long period of time.
In the second portion of the study, we tested the effect of exercises for
reducing inhibition to sketch using a pre-mid-post test. We found that these
exercises help students feel more comfortable with sketching and more willing
to use it during design. TLX data confirmed that the mental workload and
perceived effort associated with sketching decreased over the semester.
The TLX data also revealed that the sketching skills workshop affects the
perceived difficulty of sketching. Although students reported being less
inhibited, the perceived difficulty of sketching did not decrease after the
workshops. We observed that students were making use of the sketching skills
workshop. From literature, we know that when students learn a new skill,
cognitive load is high (Lawson & Dorst, 2009; Hollender et al., 2010). This
effect negated any decrease in cognitive load from the inhibition workshop. It
Preprint submitted to Design Studies 24 November 16, 2015
seems from the sketches that the use of perspective may be a difficult skill for
students to master, which has been historically true for artists as well.
8.1. Recommendations
Those who use these workshops should provide practice time and heavily
emphasize context, motion, ambiguity and speed in sketching. Similarly, they
should deemphasize sketch rendering and delay perspective drawing until a later
date, since this increases the cognitive load. We also recommend describing how
sketching affects design communication, such as talking, writing, or gestures
(Linsey et al., 2011). For the sketch inhibition workshop, we recommend
spreading the activities over several lectures and use them prior to concept
generation. We also recommend explaining the purpose of each exercise.
8.2. Limitations and Future Work
This study has a few limitations. While the study has high ecological validity,
more samples would provide a clearer picture of the effects that these workshops
have. We had a high attrition rate on responses, probably due to low motivation
at the end of the semester. Additionally, we took the TLX data in a way that
conflated the effects of the two workshops. While this provided some insight on
the effect of the skills workshop, it made it more difficult to determine the effect
of the inhibition workshop. Future research on interventions for sketch training
should explore how to gage the correct level of ambiguity for the correct phase
of design, how to improve the transition between concept generation and CAD
using sketches, and better methods to move from 2D to 3D sketches with
minimal training. Research on sketching cognition should continue to explore
inhibition. Future works should focus on better metrics for inhibition and closely
examine what exercises or environments best reduce inhibition. One way to
study this is using electroencephalograms (EEG) and galvanic skin responses
(GSR) to measure mental load, distraction, attention, and stress directly, without
relying on surveys alone.
Preprint submitted to Design Studies 25 November 16, 2015
References
Adler, A., & Davis, R. (2007). Speech and sketching for multimodal design. In
ACM SIGGRAPH 2007 Courses SIGGRAPH ’07. New York, NY, USA:
ACM.
Atman, C. J., Adams, R. S., Cardella, M. E., Turns, J., Mosborg, S., & Saleem,
J. (2007). Engineering design processes: A comparison of students and expert
practitioners. J Eng Edu, October, 359–379.
Bilda, Z., Gero, J. S., & Purcell, T. (2006). To sketch or not to sketch? That is
the question. Des. Stud., 27, 587 – 613.
Buxton, B. (2007). Sketching User Experiences: Getting the design right and the
right design. Focal Press.
Chandrasegaran, S. K., Badam, S. K., Zhao, Z., Elmqvist, N., Kisselburgh, L.
G., & Ramani, K. (2014). Collaborative sketching with skWiki: A case study.
In Proceedings of the ASME IDETC 35159.
Cross, N. (1989). Engineering design methods. Chapter 1: The Nature of
Design. John Wiley & Sons.
Cross, N. (1999). Natural intelligence in design. Des. Stud., 20, 25 – 39.
Cross, N. (2004). Expertise in design: An overview. Des. Stud., 25, 427–441.
Curran, L. C. (1988). Fauces and priapus. Retrieved Mar. 3, 2015.
Dinar, M., Shah, J. J., Cagan, J., Leifer, L., Linsey, J., Smith, S. M., &
Hernandez, N. V. (2014). Empirical studies of designer thinking: Past, present,
and future. ASME J Mech Design, 137, 021101.
Duff, J., & Ross, W. (1995). Freehand sketching for engineering design. General
Engineering Series. PWS Pub. Co.
Edwards, B. (1970). Drawing on the Right Side of the Brain. J. P. Tharcher.
Eissen, K., & Steur, R. (2011). Sketching: The Basics. BIS, Amsterdam, NL.
Farzaneh, H. H., Kaiser, M. K., & Lindemann, U. (2012). Creative processes in
groups - relating communication, cognitive processes, and solution ideas. In
Proceedings of the 2nd International Conference on Design Creativity.
Glasgow, UK.
Preprint submitted to Design Studies 26 November 16, 2015
Ferguson, E. S. (1992). Engineering and the Mind’s Eye volume 28. The MIT
Press, Boston, MA.
Garner, S. W. (1990). Drawing and designing: the case for reappraisal. Journal
of Art & Design Education, 9, 39–55.
Goldschmidt, G. (1991). The dialectics of sketching. Creativity Research
Journal, 4, 123–143.
Goldschmidt, G. (2007). To see eye to eye: the role of visual representations in
building shared mental models in design teams. CoDesign, 3, 43–50.
Grenier, A. (2008). Conceptual understanding and the use of hand-sketching in
mechanical engineering design. Master’s thesis University of Maryland,
College Park.
Hernandez, N. V., Schmidt, L. C., Kremer, G. O., & Lin, C.-Y. (2012). An
empirical study of the effectiveness of selected cognitive aids on multiple
design tasks. In Proceedings of Design Computing and Cognition.
Hollender, N., Hofmann, C., Deneke, M., & Schmitz, B. (2010). Integrating
cognitive load theory and concepts of human computer interaction. Computers
in Human Behavior, 26, 1278 – 1288.
Hu, W. L., Booth, J. W., Reid, T. (2015). Reducing Sketch Inhibition During
Concept Generation: Psychophysiological Evidence of the Effect of
Interventions. In Proceedings of ASME IDETC.
Jacobs, B. J., & Brown, T. A. (2004). Addressing inequities in engineering
sketching skills. In Proceedings of 15th AaeE Annual Convention and
Conference. Toowoomba, Australia.
Joshi, S., & Summers, J. D. (2012). Representation: Metrics for analyzing
sketches: A critical survey. In Proceedings of ASME IDETC.
Kudrowitz, B., Te, P., & Wallace, D. (2012). The influence of sketch quality
on perception on product-idea creativity. AIEDAM , 26, 267–279.
Lane, D., Seery, N., & Gordon, S. (2010). A paradigm for promoting visual
synthesis through freehand sketching. Design and Technology Education, 15,
68–90.
Preprint submitted to Design Studies 27 November 16, 2015
Lawson, B. (2002). CAD and creativity: Does the computer really help?
Leonardo, 35.
Lawson, B., & Dorst, K. (2009). Design expertise. Chapter 2: Understanding
Design. (pp. 23–50). New York: Elsevier.
Leake, J., & Weightman, D. (2011). Engineering and industrial design education
collaboration. In ASEE Annual Conf. Exposition, AC 2011-882. Vancouver.
Linsey, J. S., Clauss, E. F., Kurtoglu, T., Murphy, J. T., Wood, K. L., &
Markman, A. B. (2011). An experimental study of group idea generation
techniques: Understanding the roles of idea representation and viewing
methods. ASME J Mech Design, 133, 031008.
van der Lugt, R. (2002). Brainsketching and how it differs from brainstorming.
Creativity and Innovation Management, 11, 43–54.
Martindale, C. (1999). Handbook of creativity. Chapter: Biological Bases of
Creativity. (pp. 140–148). Cambridge University Press.
McKim, R. (1980). Experiences in visual thinking. General Engineering
Series. PWS, Boston, MA.
McKoy, F. L., Vargas-Hernandez, N., Summers, J. D., & Shah, J. J. (2001).
Influence of design representation on effectiveness of idea generation. In
Proceedings of ASME IDETC.
Mohler, C., J.L. Miller (2008). Improving spatial ability with mentored
sketching. Engineering Design Graphics Journal, 72, 19–27.
Oehlberg, L., Lau, K., & Agogino, A. (2009). Tangible interactions in a digital
age: medium and graphic visualizations in design journals. AIEDAM, 23,
227249.
Pable, J. (2008). In search of speed, accuracy, and student confidence: Results
from two perspective sketching exercise methods. In South Regional IDETC
Conference (pp. 18–24). Auburn, Alabama.
van Passel, P., & Eggink, W. (2013). Exploring the influence of self-confidence
in product sketching. In 15th International Conference on Engineering and
Product Design Education: Design Education - Growing our Future. Dublin,
Ireland.
Preprint submitted to Design Studies 28 November 16, 2015
Payne, O. (2012). Op art history part i: A history of perspective in art.
Pei, E., Campbell, I., & Evans, M. (2011). A taxonomic classification of visual
design representations used by industrial designers and engineering designers.
Design J, 14, 64–91.
Proctor, R. W., & Zandt, T. V. (2008). Human Factors in Simple and Complex
Systems. (2nd Ed.). New York: CRC Press.
Purcell, A., & Gero, J. (1998). Drawings and the design process: A review of
protocol studies in design and other disciplines and related research in
cognitive psychology. Des. Stud., 19, 389–430.
Rattine-Flaherty, E. (2014). Participatory sketching as a tool to address students’
public speaking anxiety. Communication Teacher, 28, 26–31.
Richards, J. (2013). Freehand Drawing & Discovery: Urban Sketching and
Concept Drawing for Designers. Hoboken, New Jersey: John Wiley & Sons.
Robertson, B., & Radcliffe, D. (2009). Impact of CAD tools on creative problem
solving in engineering design. Computer Aided Design, 41, 136–146.
Computer Support for Conceptual Design. Rodgers, P. A., Green, G., &
McGown, A. (2000). Using concept sketches to track design progress. Des.
Stud., 21, 451–464.
Ruocco, A., Westmoreland, S., & Schmidt, L. C. (2009). Sketching in design:
Easily influencing behavior. In Proceedings of ASME IDETC (pp. 1249–
1256).
Schmidt, L. C., Hernandez, N. V., & Ruocco, A. L. (2012). Research on
encouraging sketching in engineering design. AIEDAM, 26, 303–315.
Schutze, M., Sachse, P., & Romer, A. (2003). Support value of sketching in the
design process. Res. Eng. Design, 14, 89–97. 10.1007/s00163-002-0028-7.
Song, S., & Agogino, A. (2004). Insights on designers’ sketching activities in
product design teams. In Proceedings of ASME IDETC.
Tennenhouse, J. (2012). Personal Interview
Tovey, M., Porter, S., & Newman, R. (2003). Sketching, concept development
and automotive design. Des. Stud., 24, 135 – 153.
Preprint submitted to Design Studies 29 November 16, 2015
Ullman, D. G. (2003). The mechanical design process. Chapter 3: Designers
and Design Teams. (pp. 178–189). New York: McGraw-Hill. (4th Ed.).
Ullman, D. G., Wood, S., & Craig, D. (1990). The importance of drawing in the
mechanical design process. Computers & Graphics, 14, 263 – 274.
Walther, J., Robertson, B., & Radcliffe, D. (2007). Avoiding the potential
negative influence of CAD tools on the formation of students’ creativity. In
Proceedings of the AAEE Conference.
Worinkeng, E., Summers, J. D., & Joshi, S. (2013). Can a pre-sketching activity
improve idea generation? Smart Product Engineering, (pp. 583–592).
Yang, M. C. & Cham J. G. (2007). An Analysis of Sketching Skill and Its Role
in Early Stage Engineering Design. ASME J. Mech. Design, 129 (5), 476-482.
Yang, M. C. (2009). Observations on concept generation and sketching in
engineering design. Res. Eng. Design, 20, 1–11.
Yang, M. C. (2005). A study of prototypes, design activity, and design outcome.
Des. Stud., 26, 649 – 669.