Embed Size (px)
Citation preview
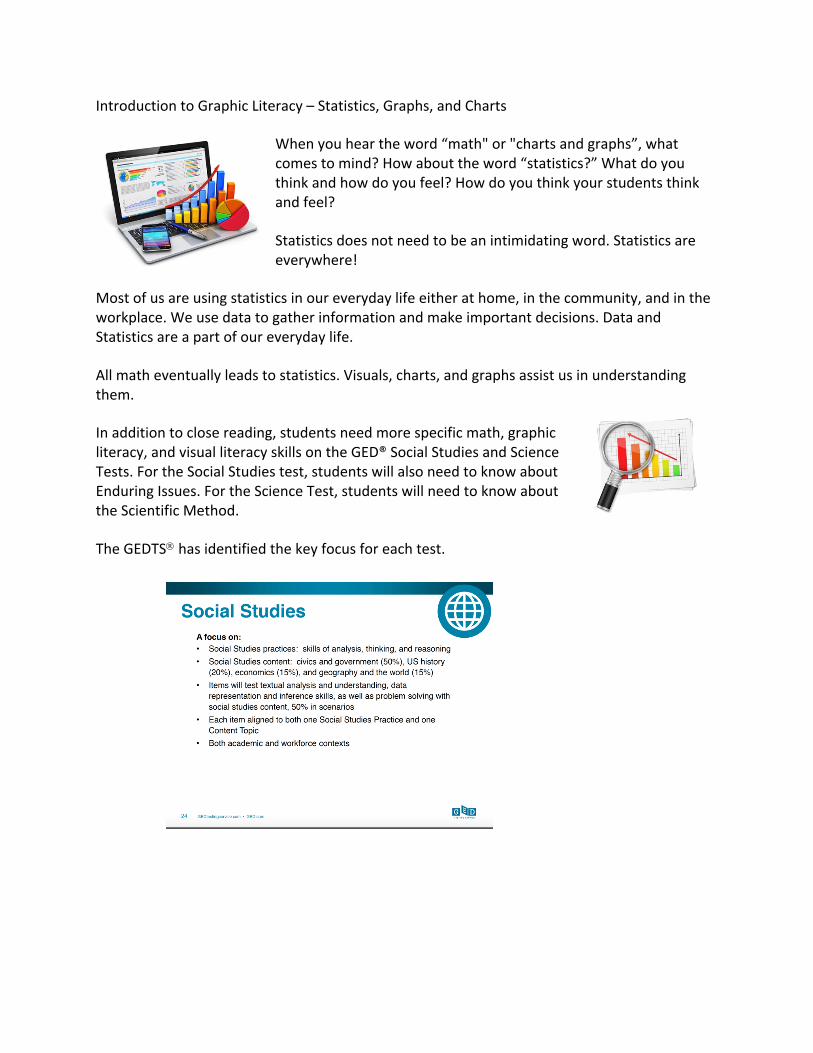
IntroductiontoGraphicLiteracy–Statistics,Graphs,andCharts
Whenyouheartheword“math"or"chartsandgraphs”,whatcomestomind?Howabouttheword“statistics?”Whatdoyouthinkandhowdoyoufeel?Howdoyouthinkyourstudentsthinkandfeel?
Statisticsdoesnotneedtobeanintimidatingword.Statisticsareeverywhere!
Mostofusareusingstatisticsinoureverydaylifeeitherathome,inthecommunity,andintheworkplace.Weusedatatogatherinformationandmakeimportantdecisions.DataandStatisticsareapartofoureverydaylife.
Allmatheventuallyleadstostatistics.Visuals,charts,andgraphsassistusinunderstandingthem.
Inadditiontoclosereading,studentsneedmorespecificmath,graphicliteracy,andvisualliteracyskillsontheGED®SocialStudiesandScienceTests.FortheSocialStudiestest,studentswillalsoneedtoknowaboutEnduringIssues.FortheScienceTest,studentswillneedtoknowabouttheScientificMethod.
TheGEDTSÒhasidentifiedthekeyfocusforeachtest.
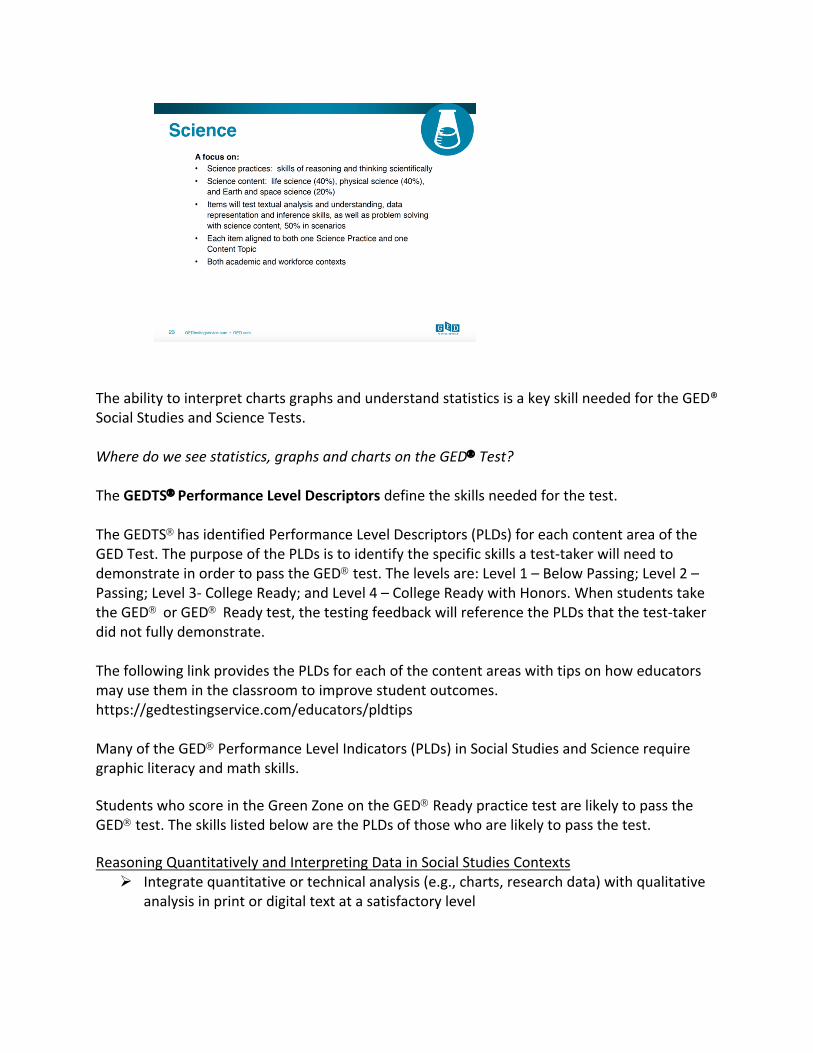
TheabilitytointerpretchartsgraphsandunderstandstatisticsisakeyskillneededfortheGED®SocialStudiesandScienceTests.Wheredoweseestatistics,graphsandchartsontheGEDÒTest?TheGEDTSÒPerformanceLevelDescriptorsdefinetheskillsneededforthetest.TheGEDTSÒhasidentifiedPerformanceLevelDescriptors(PLDs)foreachcontentareaoftheGEDTest.ThepurposeofthePLDsistoidentifythespecificskillsatest-takerwillneedtodemonstrateinordertopasstheGEDÒtest.Thelevelsare:Level1–BelowPassing;Level2–Passing;Level3-CollegeReady;andLevel4–CollegeReadywithHonors.WhenstudentstaketheGEDÒorGEDÒReadytest,thetestingfeedbackwillreferencethePLDsthatthetest-takerdidnotfullydemonstrate.ThefollowinglinkprovidesthePLDsforeachofthecontentareaswithtipsonhoweducatorsmayusethemintheclassroomtoimprovestudentoutcomes.https://gedtestingservice.com/educators/pldtipsManyoftheGEDÒPerformanceLevelIndicators(PLDs)inSocialStudiesandSciencerequiregraphicliteracyandmathskills.StudentswhoscoreintheGreenZoneontheGEDÒReadypracticetestarelikelytopasstheGEDÒtest.TheskillslistedbelowarethePLDsofthosewhoarelikelytopassthetest.ReasoningQuantitativelyandInterpretingDatainSocialStudiesContexts
Ø Integratequantitativeortechnicalanalysis(e.g.,charts,researchdata)withqualitativeanalysisinprintordigitaltextatasatisfactorylevel
Ø Analyzeinformationpresentedinavarietyofmaps,graphicorganizers,tables,andcharts;andinavarietyofvisualsourcessuchasartifacts,photographs,politicalcartoonsatasatisfactorylevel
Ø Translatequantitativeinformationexpressedinwordsinatextintovisualform(e.g.,tableorchart);translateinformationexpressedvisuallyormathematicallyintowordsatasatisfactorylevel
Ø Interpret,use,andcreategraphsincludingproperlabelingatasatisfactorylevel.Predicttrendswithinareasonablelimit,basedonthedata
Ø Representdataontwovariables(dependentandindependent)onagraph;analyzeandcommunicatehowthevariablesarerelatedatasatisfactorylevel
Ø DistinguishbetweencorrelationandcausationatasatisfactorylevelØ Calculatethemean,median,mode,andrangeofadatasetatasatisfactorylevel
AstudentwhoscoresintheGreenZoneontheGEDÒReadyTestislikelytopasstheGEDÒtestandhavedemonstratedtheseskills:ReasoningQuantitativelyandInterpretingDatainScientificContexts
Ø Understandandexplainnon-textualscientificpresentationsatasatisfactorylevelØ ApplyformulasfromscientifictheoriesatasatisfactorylevelØ DeterminetheprobabilityofeventsatasatisfactorylevelØ Usecountingandpermutationstosolvescientificproblemsatasatisfactorylevel
"InGod,wetrust.Allothersmustbringdata!"-W.EdwardsDeming
BeginwiththeBasics
Whatisstatisticsanddataanyway?
Doyourstudentsknowapurposeforlearningaboutstatisticsanddata?
HelpingyourstudentstoseetheneedforlearningstatisticsbeyondtheGED®willassisttheminunderstandingthecontentandlearningquicker.
Wemaybeginbyshowingthemhowtheyarealreadyusingmathandstatistics,withoutbeingaware,tomakedecisionsintheireverydaylife.Forexample,theymaydecidetogotoamoviebecause7oftheir10friendsthoughtitwasgreat.Theymaynothaveconductedascientificexperiment;but,chancesaretheyhaveuseddataandstatisticstomakeadecision.
Lastweek,weexploredmanydifferentwaystoengagestudents.Whenintroducingyourstudentstostatisticsanddata,youmaywanttobeginwithaquote,suchastheoneaboveandaskthemwhattheymayinferfromthequote.
Doyourstudentsknowhowdataisorganized?
Startwithagraphorchartandaskthemwhattheythinkitmeans?
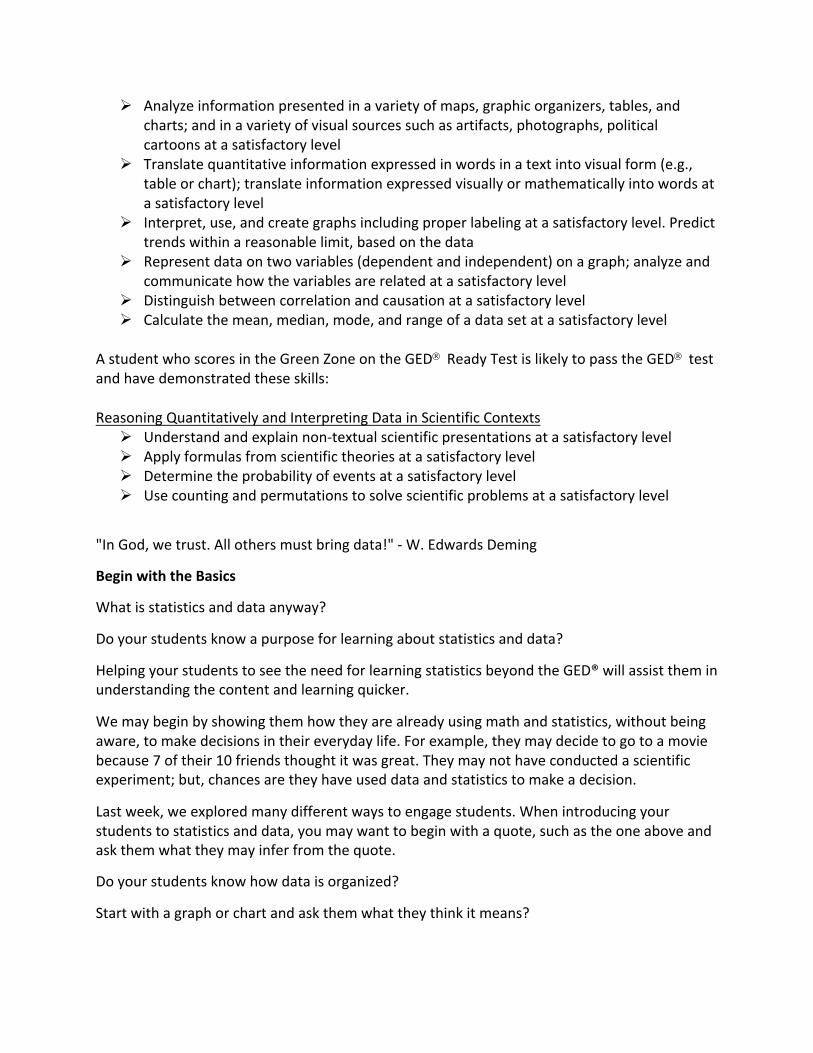
1. Youmaybeginwithagraphicsimilartotheonebelow.Askstudentsatext-basedquestiontogetthemthinkingaboutthegraph.Iftheystruggle,youmaywanttomodelafewquestionsthatyouwouldusetointerpretthegraphandthinkaloudyourthinkingwhenyoureadthegraph.
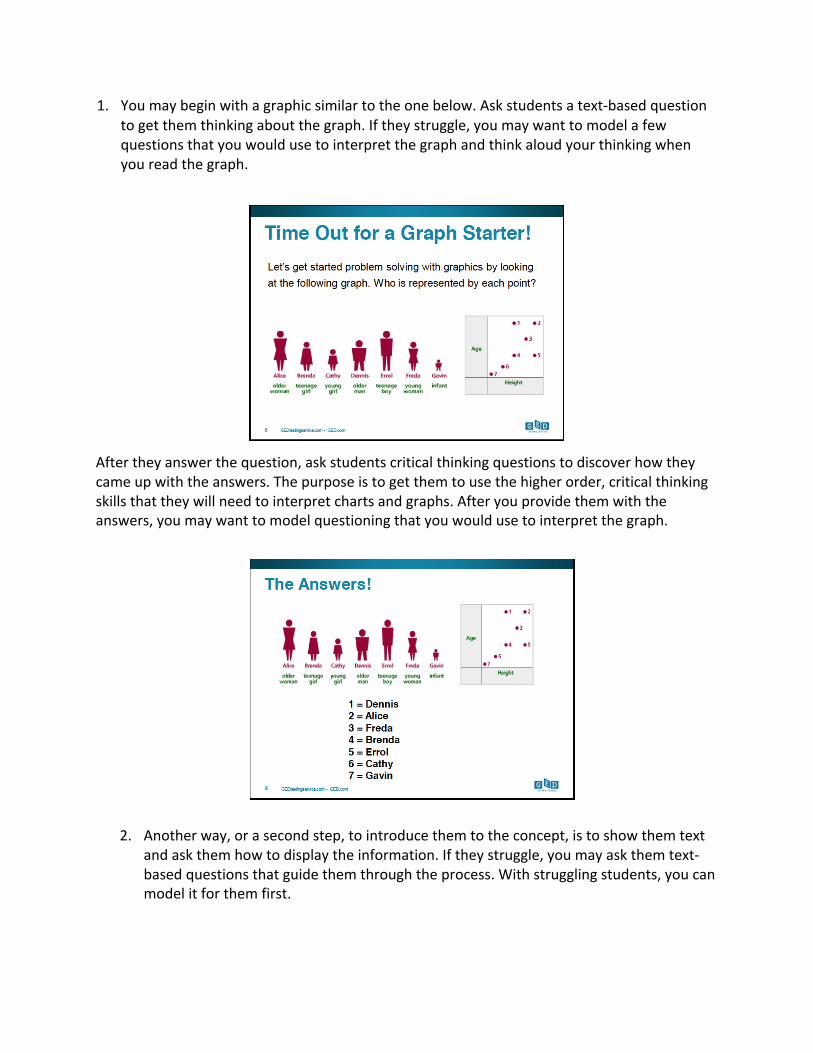
Aftertheyanswerthequestion,askstudentscriticalthinkingquestionstodiscoverhowtheycameupwiththeanswers.Thepurposeistogetthemtousethehigherorder,criticalthinkingskillsthattheywillneedtointerpretchartsandgraphs.Afteryouprovidethemwiththeanswers,youmaywanttomodelquestioningthatyouwouldusetointerpretthegraph.
2. Anotherway,orasecondstep,tointroducethemtotheconcept,istoshowthemtextandaskthemhowtodisplaytheinformation.Iftheystruggle,youmayaskthemtext-basedquestionsthatguidethemthroughtheprocess.Withstrugglingstudents,youcanmodelitforthemfirst.
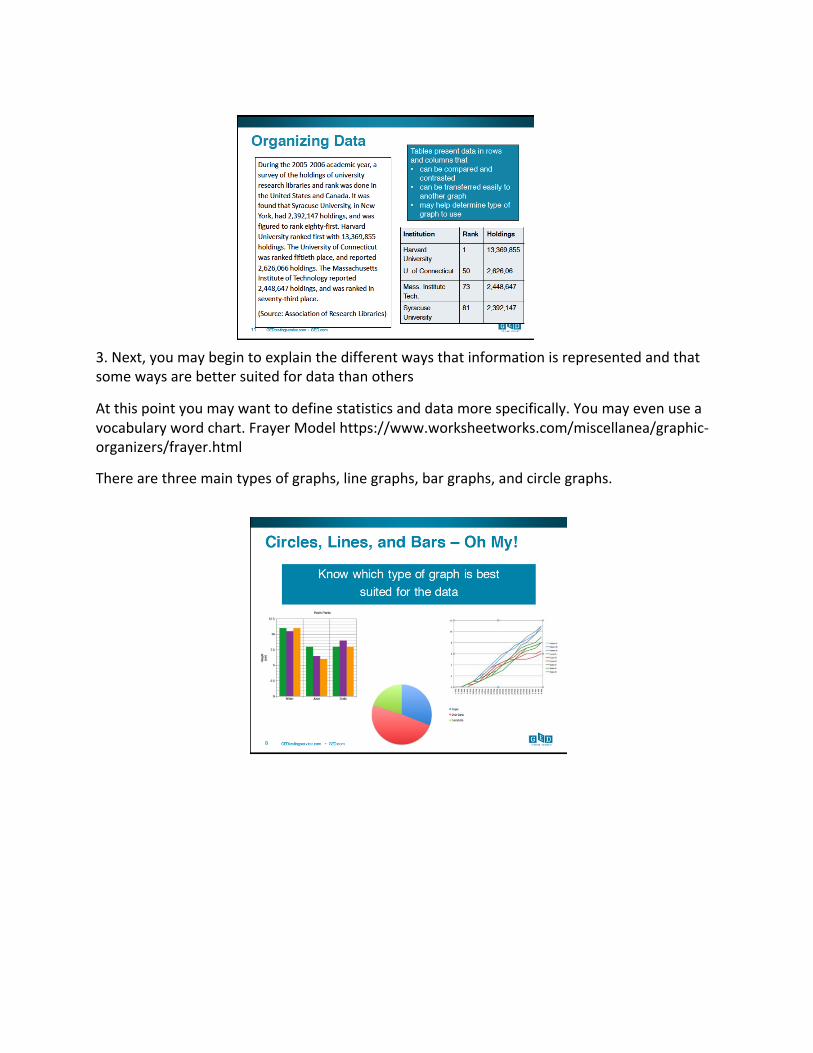
3.Next,youmaybegintoexplainthedifferentwaysthatinformationisrepresentedandthatsomewaysarebettersuitedfordatathanothers
Atthispointyoumaywanttodefinestatisticsanddatamorespecifically.Youmayevenuseavocabularywordchart.FrayerModelhttps://www.worksheetworks.com/miscellanea/graphic-organizers/frayer.html
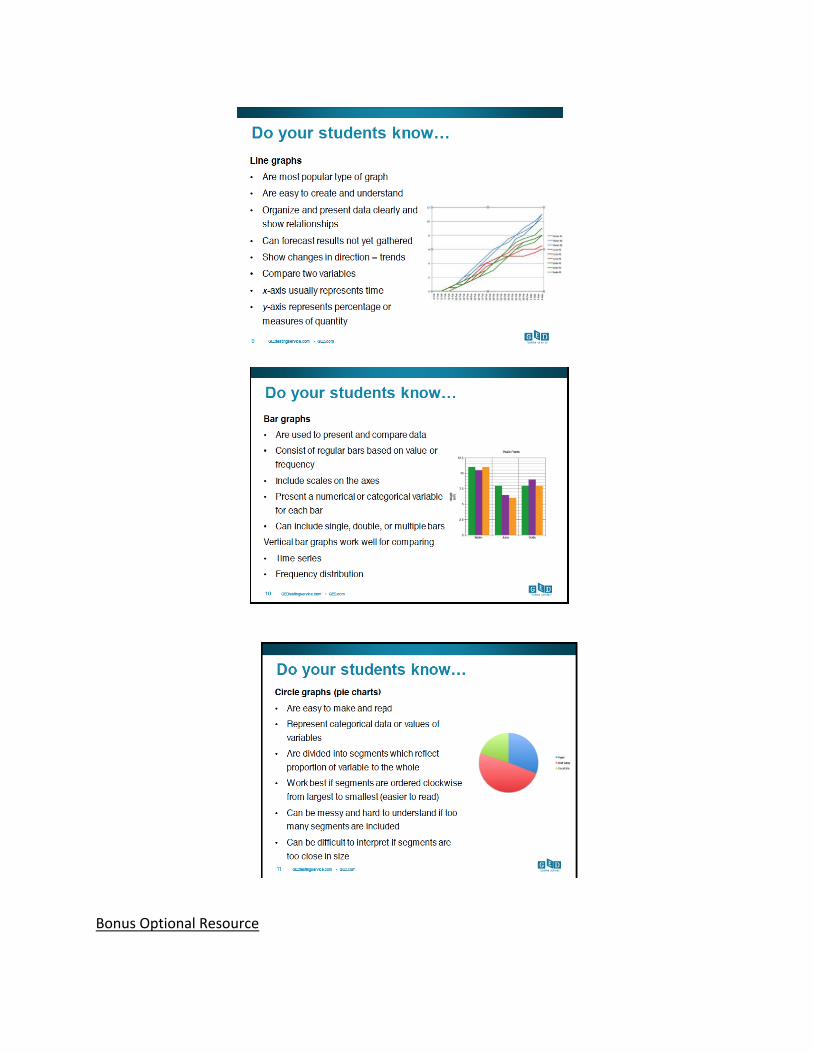
Therearethreemaintypesofgraphs,linegraphs,bargraphs,andcirclegraphs.
BonusOptionalResource
https://nces.ed.gov/nceskids/createagraph/
Ifyourstudentscanoverlookthe“kids”theme,thisisagreattoolforadultstudentstopracticecreatingchartsandgraphs.
ActivityforStudents
Allowingyourstudentstakealookatdataandrepresentitinmultiplewaysusinggraphsandchartsisoneofthemosteffectivemeansofassistingyourstudentsinlearningaboutstatistics.
Havestudentsreadandinterpretthegraphsandchartsinthefollowingwebsitedocument“TheRisingCostofNotGoingtoCollege.”http://www.pewsocialtrends.org/2014/02/11/the-rising-cost-of-not-going-to-college/
HigherLevelstudents:Hidethegraphandaskthemtocreateone.
MiddleLevelstudents:Askthemtorepresentthedatainanotherformatthantheoneshown.
LowerLevelstudents:Askthemtocompareandcontrastthegraphsandcharts.
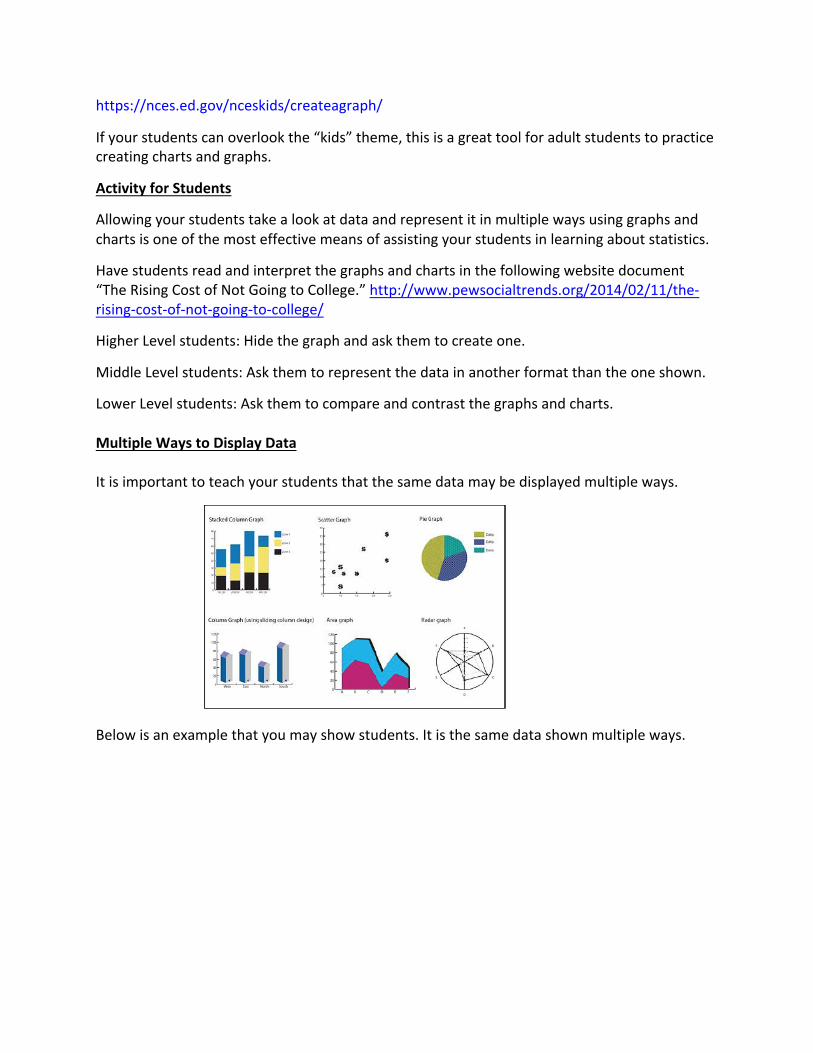
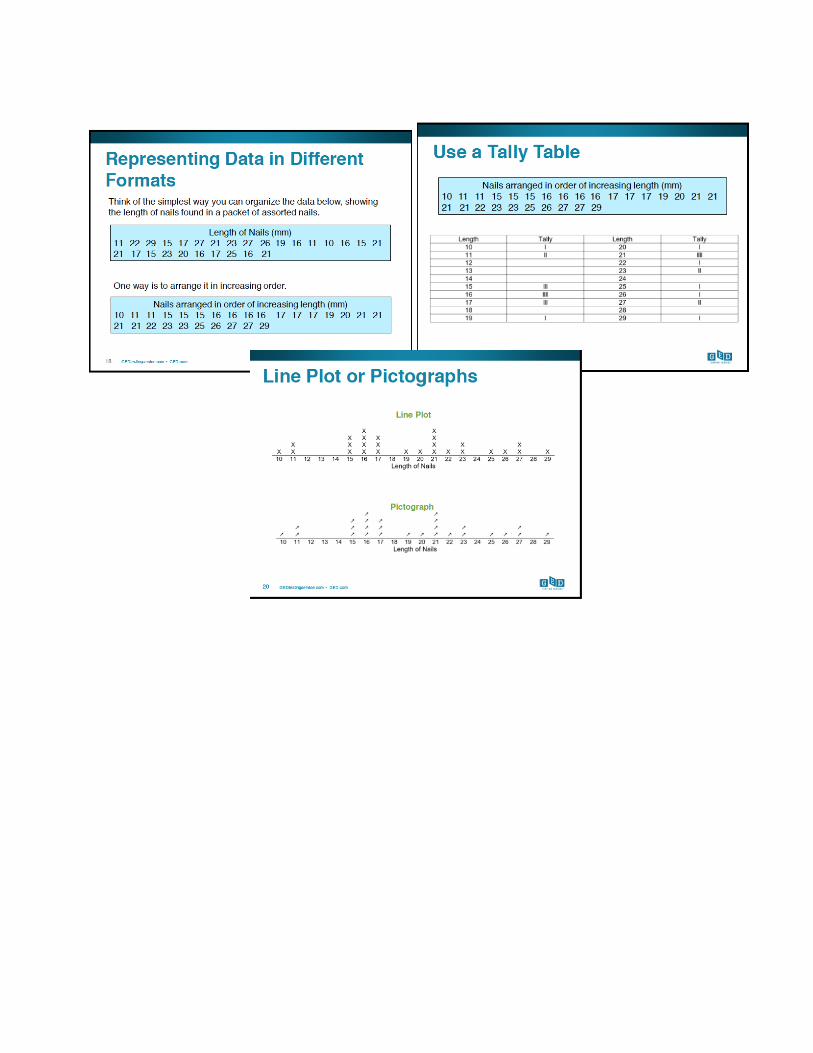
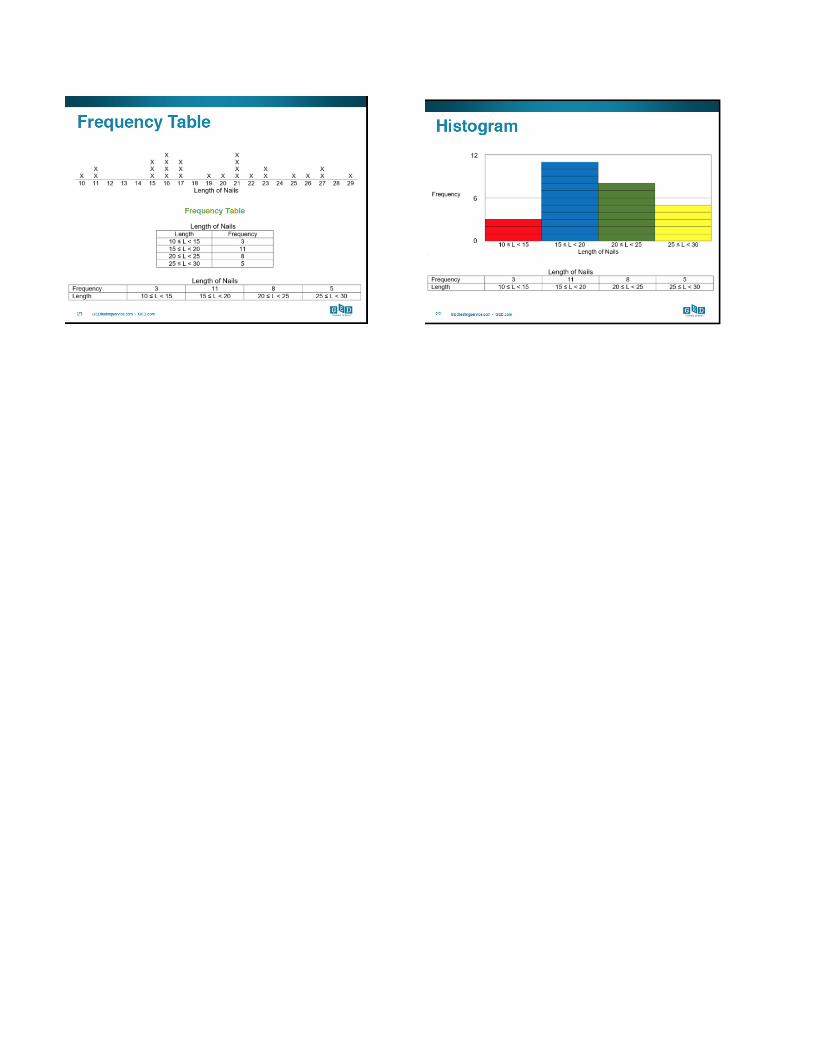
MultipleWaystoDisplayDataItisimportanttoteachyourstudentsthatthesamedatamaybedisplayedmultipleways.Belowisanexamplethatyoumayshowstudents.Itisthesamedatashownmultipleways.


![Welcome! [kyae.ky.gov]kyae.ky.gov/educators/pd18/1718pdhandbook.pdf · Welcome! Welcome to the 2017-18 Kentucky Adult Education (KYAE) Skills U Professional Development (PD) Handbook!](https://img.pdfslide.net/doc/110x75/5a9db09c7f8b9a96438b6db1/welcome-kyaekygovkyaekygoveducatorspd18-welcome-to-the-2017-18-kentucky.jpg)